Embed Size (px)
Citation preview

Albemarle Corporation
Investor Presentation and
Non-GAAP Reconciliations
September 2018

2
Forward-Looking Statements
Some of the information presented in this presentation, the webcast and discussions that follow, including, without limitation, statements with
respect to product development, changes in productivity, market trends, price, expected growth and earnings, input costs, surcharges, tax rates,
stock repurchases, dividends, cash flow generation, costs and cost synergies, our portfolio, economic trends, supply and demand outlook,
guidance and all other information relating to matters that are not historical facts may constitute forward-looking statements within the meaning of
the Private Securities Litigation Reform Act of 1995. Actual results could differ materially from the views expressed.
Factors that could cause actual results to differ materially from the outlook expressed or implied in any forward-looking statement include, without
limitation: changes in economic and business conditions; changes in financial and operating performance of our major customers and industries
and markets served by us; the timing of orders received from customers; the gain or loss of significant customers; competition from other
manufacturers; changes in the demand for our products or the end-user markets in which our products are sold; limitations or prohibitions on the
manufacture and sale of our products; availability of raw materials; increases in the cost of raw materials and energy, and our ability to pass
through such increases to our customers; changes in our markets in general; fluctuations in foreign currencies; changes in laws and government
regulation impacting our operations or our products; the occurrence of regulatory proceedings, claims or litigation; the occurrence of cyber-security
breaches, terrorist attacks, industrial accidents, natural disasters or climate change; hazards associated with chemicals manufacturing; the inability
to maintain current levels of product or premises liability insurance or the denial of such coverage; political unrest affecting the global economy,
including adverse effects from terrorism or hostilities; political instability affecting our manufacturing operations or joint ventures; changes in
accounting standards; the inability to achieve results from our global manufacturing cost reduction initiatives as well as our ongoing continuous
improvement and rationalization programs; changes in the jurisdictional mix of our earnings and changes in tax laws and rates; changes in
monetary policies, inflation or interest rates that may impact our ability to raise capital or increase our cost of funds, impact the performance of our
pension fund investments and increase our pension expense and funding obligations; volatility and uncertainties in the debt and equity markets;
technology or intellectual property infringement, including cyber-security breaches, and other innovation risks; decisions we may make in the
future; the ability to successfully execute, operate and integrate acquisitions and divestitures; and the other factors detailed from time to time in the
reports we file with the SEC, including those described under “Risk Factors” in our Annual Report on Form 10-K and our Quarterly Reports on
Form 10-Q. These forward-looking statements speak only as of the date of this presentation. We assume no obligation to provide any revisions to
any forward-looking statements should circumstances change, except as otherwise required by securities and other applicable laws.

3
Non-GAAP Financial Measures
It should be noted that Adjusted net income attributable to Albemarle Corporation (“Adjusted earnings”), Adjusted net income from continuing
operations, Adjusted diluted earnings per share attributable to Albemarle Corporation, Adjusted diluted earnings per share from continuing
operations, Adjusted effective income tax rates, segment operating profit, segment income, pro-forma net sales, net sales excluding the impact of
foreign exchange translation ("ex FX"), EBITDA, Adj. EBITDA, Adj. EBITDA by operating segment, EBITDA margin, Adj. EBITDA margin, pro-
forma Adj. EBITDA, pro-forma Adj. EBITDA margin, Adj. EBITDA excluding the impact of foreign exchange translation ("ex FX"), Adj. EBITDA
margin excluding the impact of foreign exchange translation ("ex FX"), net debt to Adj. EBITDA, gross debt to Adj. EBITDA, free cash flow, and
Adjusted free cash flow are financial measures that are not required by, or presented in accordance with, accounting principles generally accepted
in the United States, or GAAP. These measures are presented here to provide additional useful measurements to review our operations, provide
transparency to investors and enable period-to-period comparability of financial performance. The Company’s chief operating decision maker
uses these measures to assess the ongoing performance of the Company and its segments, as well as for business and enterprise planning
purposes.
A description of these and other non-GAAP financial measures that we use to evaluate our operations and financial performance, and
reconciliation of these non-GAAP financial measures to the most directly comparable financial measures calculated and reported in accordance
with GAAP, can be found in the Appendix to this presentation, which is posted in the Investors section of our website at www.albemarle.com,
under “Non-GAAP Reconciliations” under “Financials.” The Company does not provide a reconciliation of forward looking non-GAAP financial
measures to the most directly comparable financial measures calculated and reported in accordance with GAAP, as the Company is unable to
estimate significant non-recurring or unusual items without unreasonable effort. The amounts and timing of these items are uncertain and could be
material to the Company's results calculated in accordance with GAAP.

Founded 1887
Global Employees ~5,400
Countries1 ~100
Dividend Yield2 1.4%
Market Cap3 $10.6B
37%
27%
34%
Lithium
Bromine Specialties
Catalysts
All Other
Financial Highlights4
Trailing Twelve Months Ended June 30, 2018
Net Sales $3.3B
Net Income5 $335M
Adj. EBITDA6,7 $962M
Adj. EBITDA Margin7,8 29%
4
Albemarle Snapshot
Net Sales by Segment4
Trailing Twelve Months Ended June 30, 2018
1Based on destinations of FY2017 product sales.
2$96.00 closing price as of August 24, 2018; annualized dividend of $1.34 per share announced July 26, 2018.
3$96.00 closing price as of August 24, 2018; 110,659 million diluted shares outstanding as of June 30, 2018.
4Includes financial contribution from Polyolefin Catalysts & components business divested April 3, 2018.
5Attributable to Albemarle Corporation.
6Non-GAAP measure. See Appendix for definition and Non-GAAP reconciliations.
7Continuing operations only. 8Non-GAAP measure. Adjusted EBITDA margin calculated by dividing net sales by Adjusted EBITDA.
Providing innovative solutions to power
the potential of energy efficiency
5
Albemarle Path to Achieve Growth
2016
Diversified
specialty
chemical
company with
strong free cash
flow1 to fund
growth
2021
Lithium Wave III: Explore new resources
Bromine Specialties: Strong cash flow
Catalysts: Strengthen R&D and technology
Lithium Wave I & II: Expand current
resources and BG conversion capacity
Supported by Productivity and
Operational Excellence CORPORATE GOALS
Sales Growth: 7 – 10% annualized
Adj. EBITDA Margins1: 32 – 35%
• 165,000 MT LCE annual capacity
• New Lithium resources in
development with goal of 265,000
MT LCE capacity mid-2020s
• Strong free cash flow1 to reinvest
in growth businesses
• Ability to sustain margins in
mature businesses
• Stronger overall product portfolio
offering in refinery catalyst
Every Part of the Portfolio Contributes to the Strategy 1 Non-GAAP measure. See Appendix for definition and Non-GAAP reconciliations of historical measures.
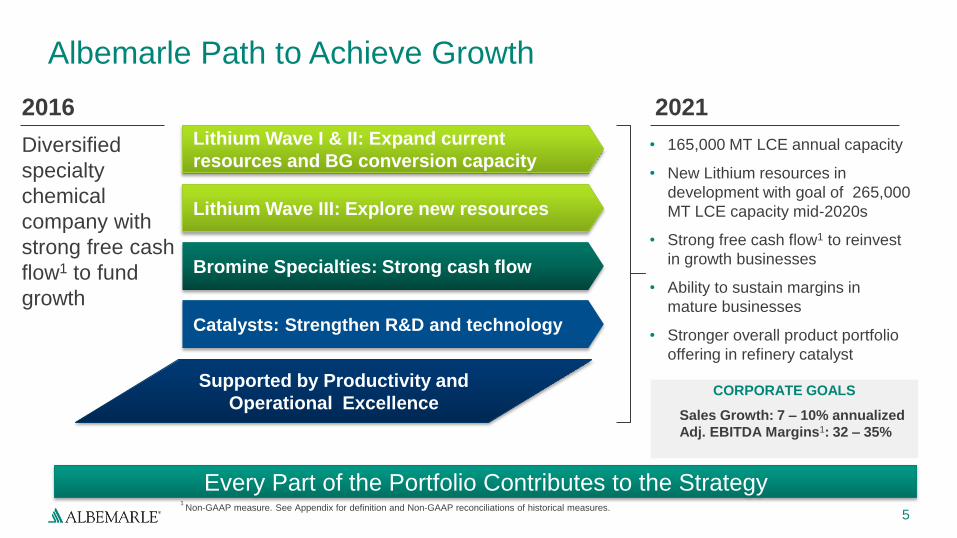
$2,250
$2,500
$2,750
$3,000
$3,250
2Q17 3Q17 4Q17 1Q18 2Q18
TTM1 Pro-forma Net Sales2
25%
26%
27%
28%
29%
30%
$600
$700
$800
$900
$1,000
2Q17 3Q17 4Q17 1Q18 2Q18
TTM1 Pro-forma Adj. EBITDA2,3 and Adj. EBITDA Margin2,3
Pro-forma Adjusted EBITDA Pro-forma Adjusted EBITDA Margin
6
Segment Quarterly Highlights
Core Business Performance - Second Quarter 2018
Lithium – $142M Adj. EBITDA3, up 23% YoY; 45% Adj. EBITDA3 margin
Bromine Specialties – $69M Adj. EBITDA3,up 12%; 31% Adj. EBITDA3 margin
Catalysts – $75M Adj. EBITDA3, up 30%2; 26% Adj. EBITDA3 margin
1Trailing Twelve Months. 2Excludes net impact of Polyolefin Catalysts & Components business divested April 3, 2018. See Appendix for pro-forma reconciliations. 3Non-GAAP measure. See Non-GAAP reconciliations in Appendix.
($ in millions) ($ in millions)
2,3 2,3

7
Leadership Across Businesses Is Driven By Core Strengths
Lithium Bromine Specialties Catalysts2
Global Ranking #1 #2 #2
TTM Adj. EBITDA1 $504M $268M $290M
TTM Adj. EBITDA
Margin1
43% 30% 26%
Key Competitors
Advantages
Globally Diversified, Low
Cost Resources; Leading
Processing and Application
Expertise;
Customer Relationships
Globally Diversified, Low
Cost Resources; Integrated
Product Portfolio
Leading Technology and
Application Expertise;
Product Stewardship;
Customer Relationships
1Non-GAAP measure for trailing twelve months Ended June 30, 2018. See Appendix for definition and Non-GAAP reconciliations.
2Includes financial contribution from Polyolefin Catalysts & components business divested April 3, 2018.

Business Environment Applications
8
Bromine Specialties Snapshot
Characteristics
• Mineral extraction and processing
• Low-cost position on global cost curve
• Vertically integrated
• Stable and sustainable cash flow
• Stable flame retardants demand across
electronics, construction and automotive
• Current completion fluid weakness due to oil
prices, with a favorable and long-term outlook
• Excess bromine capacity is limited to few
suppliers
• Flame retardants for electronics
and construction materials
• Completion fluids for oilfield
• Industrial water treatment
• Plastic and synthetic rubber
• Ag and pharma synthesis
Advantaged Position. Stable End Markets. Strong Sustainable Cash Flow.
1 Non-GAAP measure. See Appendix for definition and Non-GAAP reconciliations of historical measures.
TTM Financials
Net Sales $878M
Adj. EBITDA1 $268M
Adj. EBITDA Margin1 30%
Twelve Months Ended June 30, 2018

9
Catalysts Snapshot
Characteristics
• Leading positions in FCC and HPC catalysts
• Technology and applications knowledge
• Focused on value creation for refiners
• Long-term, collaborative customer relationships
• High barriers-to-entry
• Strong free cash flow1 generation with growth
• Safety, scale and technical service
FCC Catalyst • Cracks oil feedstock
• Makes gasoline
• Makes propylene
Fluid Cracking Catalysts (FCC) Clean Fuels Technology (CFT)
Leadership in FCC and HPC catalysts with High Margin Business with High Barriers-to-Entry
HPC Catalyst • Removes sulfur and contaminants
• Makes clean diesel
• Makes clean oil-feedstock
Alkylation & Isomerization Catalyst • Makes clean high-octane gasoline
Polymer Catalyst Solutions (PCS)
PCS • Polymers
• Pharma Synthesis
• AG Chem Synthesis
• Coatings
1 Non-GAAP measure and includes financial contribution from Polyolefin Catalysts & components business divested April 3, 2018.
See Appendix for definition and Non-GAAP reconciliations of historical measures.
TTM Financials
Net Sales $1,101M
Adj. EBITDA1 $290M
Adj. EBITDA Margin1 26%
Twelve Months Ended June 30, 2018

10
Lithium Snapshot
Characteristics
• Mining and specialty chemicals capability
• Vertically integrated from natural resource to
specialty performance products
• Low cost position globally
• Volume growth driven by energy storage
• Public policy accelerating e-mobility / renewables
• Battery cost declining / performance improving
• Long-term supply agreements becoming industry
standard
• Energy storage (Batteries)
• Glasses and Ceramics
• Greases and Lubricants
• Pharmaceutical Synthesis
• Polyolefins and Elastomers
Applications Business Environment
Best-In-Class Resources Coupled with Derivatives Expertise Are Differentiators
1 Non-GAAP measure. See Appendix for definition and Non-GAAP reconciliations of historical measures.
TTM Financials
Net Sales $1,174M
Adj. EBITDA1 $504M
Adj. EBITDA Margin1 43%
Twelve Months Ended June 30, 2018

11
Battery Markets Continue to Accelerate Lithium Demand
0%
5%
10%
15%
20%
400 600 800 1,000
EV
Pe
netr
ati
on
Total Lithium Demand (kT LCE)
ALB Outlook
2025 EV and Lithium Outlook1 Demand Buildup by Application
1Includes estimates from Roskill, BMO Capital Markets, Citi Investment Research, Deutsche Bank, Goldman Sachs, Instinet|Nomura, Morgan Stanley, UBS,
Oppenheimer, SQM, and FMC. Estimates are same data points that were presented in March 2018 investor presentation. 2Includes 20 kT LCE in grid storage (ESS) volume
Applications 2017
Demand
’17 – ’25
CAGR
2025
Demand
Transportation 50 35% 550
Consumer Electronics2 60 8% 110
All Other/Industrial 110 3 – 4% 140
Total 220 ~18% 800
2025 Transportation
Demand Buildup
% of Light
Vehicles
Sold
Vehicle
Count
(million)
Battery Size
(KWh per
Vehicle)
Lithium
Demand
(kT LCE)
BEV 6.7% 7.4 51 360
PHEV 5.6% 6.2 13 80
HEV 45% 50 0.6 30
e-buses, e-trucks, & other N/A <1 96 80
Total Transportation 550
• Lithium Content: 0.85 kg LCE/kWh for cathode; 0.10 kg LCE/kWh electrolyte
• Penetration figures based on 110 million light vehicles sold in 2025
12
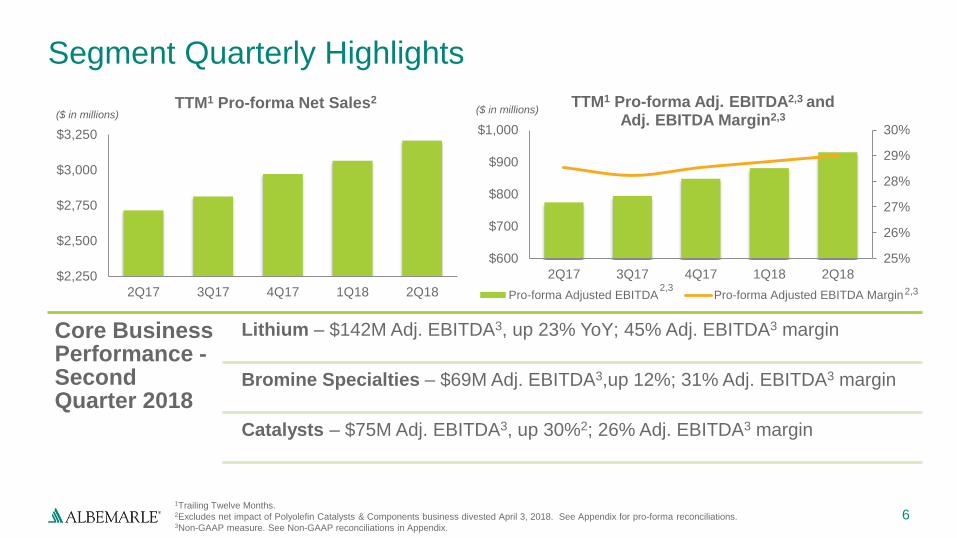
Long-term Relationships Required for EV Growth
Lithium Producer Battery Manufacture Auto Manufacture
Volume 140 kT LCE 150 GWh 3 Million EVs
Expansion
Investment $2 – $3 billion $9 – $12 billion $20 – $25 billion
Standard Customer
Commitment
3 – 5 year contracts with
cathode manufactures; up to 10
year agreements being
discussed
3 – 5 year contracts with auto
manufacture 7 – 10 year battery warranty
with end consumer
All figures are Albemarle Estimates based on
industry announcements and internal data
Investment decisions being made across EV supply chain today for consumer commitments in 2030s
• Recent announcement from Volkswagen for 2 - 3 million EVs by 2025 illustrates need for significant
investment in value chain
• The desire to base load and secure future lithium requirements with limited number of suppliers
incentivizes buyers to partner with capable and proven companies
Recent VW
Announcement

13
Albemarle the Partner of Choice in EV Battery Markets
Deep relationships
• Leading cathode/battery producers largely based in Asia
• Average ALB supply relationship of 10+ years
• Baseload volume, but not sole supplier
Long-term Contracts
• Minimum volumes that escalate each year
• Pricing floor with pricing upside opportunities
• Fully committed capacity through 2021
• Contracts provides attractive return on capital for Wave 1 expansion investments
Value-added Sale
• Chemical, physical and purity characteristics requiring specialized operating know-how
• Customer specific specifications
• Development of innovative new lithium materials with customers

14
Expanding Lithium Conversion Capacity in High Quality Resources
165
265
20
40
40
40
60
2017 NameplateCapacity (Base)
Xinyu II(2019)
La Negra III / IV(2020)
Kemerton I / II(2021)
Wave INameplate
Capacity (2021)
Chile V / VI(Atacama Yield
Project)
KemertonIII / IV / V
Wave IINameplateCapacity
1
NOTE: This slide contains the same data that was presented in March 2018 investor presentation with updated project nomenclature as capacity additions are in 20 kT LCE increments. 1Conversion capacity does not include approximately 10 kt LCE of technical grade spodumene to non-battery applications. 2Conversion site for Atacama Yield Project volume will be in Chile but specific city/location not yet determined.
Hydroxide
Carbonate
Hydroxide
Hydroxide
Carbonate
Year indicates planned commissioning start period
65
All figures in kt LCE and represent only lithium nameplate conversion capacity
Ramping as needed to meet demand of existing customers with ability to reduce spend rate based on 5-year outlook
2

0.9x 1.0x 0.9x 0.9x 0.8x
2.0x
2.5x
2Q17 3Q17 4Q17 1Q18 2Q18
Dividends Paid: $72
Dividend Growth (Y/Y)3: 5%
Cash Balance: $908
Gross Debt4: $1,615
Net Debt to Adj. EBITDA5: 0.8x
2018 2017
Net Cash from Operations $224 ($54)
Less: Capital Expenditures (281) (98)
Add Back: Pension Contributions1 7 11
Free Cash Flow2 ($50) ($141)
Non-recurring and other unusual cash items 40 59
Cash taxes on repatriation/Chemetall® sale 40 255
Adjusted Free Cash Flow2 $30 $173
15
(as of 06/30/2018)
12017 amount includes $5 million related to company employees in the German
multiemployer plan and $6 million related to U.S. defined benefit and other
postretirement plans. 2Non-GAAP measure. See Non-GAAP reconciliations in Appendix.
($ in millions)
Six Months Ended June 30 Selected Financial Metrics
($ in millions)
Net Debt to Adj. EBITDA5
Target long-
term leverage
range
Cash Flow and Net Debt
Initiated second $250 million accelerated share repurchase program on August 9, 2018 ($500 million total in 2018), to be completed by year end
Expect Net Debt to Adj. EBITDA5 to end year at ~1.2x
3Represents annual increase in dividend per share. 4Excludes JV debt not guaranteed by Company. 5Gross Debt to Adj. EBITDA and Net Debt to Adj. EBITDA ratios are based on the bank
covenant definition. See appendix for reconciliations.

16
Disciplined Capital Allocation Strategy – Our Priorities
Invest for
Growth in
High Return
Projects
Maintain
Investment
Grade Rating
Fund
Dividend
Growth
• Strategically grow
Lithium
• Long-term Net
Debt to Adjusted
EBITDA1,2 Target:
2.0x – 2.5x
• Short-term target
lower to stay
flexible for
investment
• Increase dividend
annually: 24
consecutive years
since going
public in 1994
Invest for
Growth,
Maintain
Flexibility
and Deliver
Shareholder
Value
Disciplined
M&A Strategy • Must support or
accelerate our
strategy
1 Non-GAAP measure. See Appendix for definition and Non-GAAP reconciliations of historical measures.
2 Based on the bank covenant definition.
Repurchase
Shares • When excess
balance sheet
capability
available

17
Continued Portfolio Assessment to Drive Value
Acquired Rockwood (‘15)
Entered high growth
lithium market
Acquired Jiangxi Jiangli New Materials (‘16) Chinese lithium conversion capacity
2014 2018
Divested Polyolefin Catalysts & Components (‘18) Non-core assets
Committed to evaluating the portfolio
Divested AOX (‘14) and exited Phosphorus (‘12) business Non-core assets
Divested Minerals, Metal Sulfides and Chemetall® Surface Treatment (‘16) Used proceeds to reduce debt and strengthen balance sheet

18
Albemarle Is Well Positioned to Maximize Long-Term
Shareholder Value Creation
Multi-year journey has resulted in a more focused and growth-oriented portfolio underpinned by energy efficiency macro drivers
Clear strategy with the people, cash generation and resources necessary to ….execute the strategy
Experienced and focused management team with clear deliverables
Actively managing our portfolio in a disciplined and focused manner to drive shareholder value
Strong balance sheet and disciplined approach to capital allocation with focus on highest returns (reinvestment, strategic acquisitions and returns to shareholders)
1
2
3
4
5

www.albemarle.com
19

Appendix A Guidance as per Q2 2018 Earnings Released
August 7th, 2018

21
Full Year 2018 Business Guidance vs 2017
Business
Unit
Prior
Outlook
Updated
Outlook Business Environment
Lithium
• FY 2018 Adj. EBITDA1 expected to increase low-to-mid 20’s on % basis vs prior year
• Expect 1H 2018 to be similar to 2H 2018; Q3 similar to Q1 and Q4 similar to Q2
• Favorable outlook driven by strong volume and price improvements, primarily in
battery grade product portfolio
Bromine
Specialties
• FY 2018 Adj. EBITDA1 expected to be up high single-digit vs prior year
• Improved outlook driven by solid demand for flame retardants and higher pricing in
some derivatives, partially offset by higher raw material and freight costs
Catalysts2
• FY 2018 Adj. EBITDA1 expected to increase high single-digit vs prior year on pro-
forma2 basis driven by higher volume, favorable product mix and higher pricing in FCC
• Q4 2018 expected to be stronger than Q3 2018
• Now expect ~$5 million (vs $10 million previously) unfavorable impact to Adj. EBITDA1
in FY2018 due to raw material shortage in Curatives product line
• Anticipate favorable benefit of $5 million from Hurricane Harvey insurance settlements
with $2 million already received in Q2 2018
Better than 2017
1Non-GAAP measure. 2Catalysts 2017 pro-forma adjusted EBITDA1 is $253 million and excludes financial contribution of Polyolefin Catalysts & Components business the final nine months of 2017, which closed April 3, 2018.
Better than 2017 and Prior Outlook
22
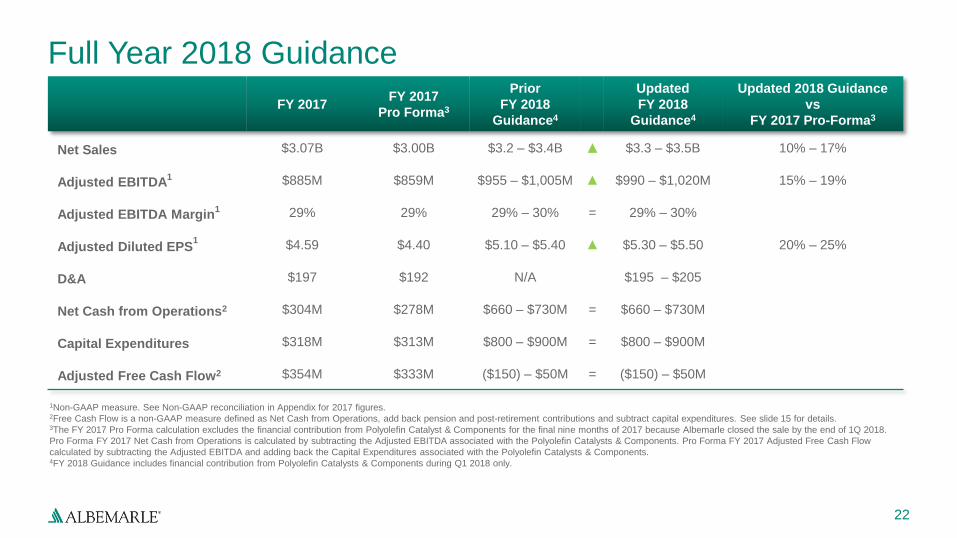
Full Year 2018 Guidance
FY 2017 FY 2017
Pro Forma3
Prior
FY 2018
Guidance4
Updated
FY 2018
Guidance4
Updated 2018 Guidance
vs
FY 2017 Pro-Forma3
Net Sales $3.07B $3.00B $3.2 – $3.4B ▲ $3.3 – $3.5B 10% – 17%
Adjusted EBITDA1 $885M $859M $955 – $1,005M ▲ $990 – $1,020M 15% – 19%
Adjusted EBITDA Margin1 29% 29% 29% – 30% = 29% – 30%
Adjusted Diluted EPS1 $4.59 $4.40 $5.10 – $5.40 ▲ $5.30 – $5.50 20% – 25%
D&A $197 $192 N/A $195 – $205
Net Cash from Operations2 $304M $278M $660 – $730M = $660 – $730M
Capital Expenditures $318M $313M $800 – $900M = $800 – $900M
Adjusted Free Cash Flow2 $354M $333M ($150) – $50M = ($150) – $50M
1Non-GAAP measure. See Non-GAAP reconciliation in Appendix for 2017 figures. 2Free Cash Flow is a non-GAAP measure defined as Net Cash from Operations, add back pension and post-retirement contributions and subtract capital expenditures. See slide 15 for details. 3The FY 2017 Pro Forma calculation excludes the financial contribution from Polyolefin Catalyst & Components for the final nine months of 2017 because Albemarle closed the sale by the end of 1Q 2018.
Pro Forma FY 2017 Net Cash from Operations is calculated by subtracting the Adjusted EBITDA associated with the Polyolefin Catalysts & Components. Pro Forma FY 2017 Adjusted Free Cash Flow
calculated by subtracting the Adjusted EBITDA and adding back the Capital Expenditures associated with the Polyolefin Catalysts & Components. 4FY 2018 Guidance includes financial contribution from Polyolefin Catalysts & Components during Q1 2018 only.

Appendix B Non-GAAP Reconciliations and
Supplemental Information
24
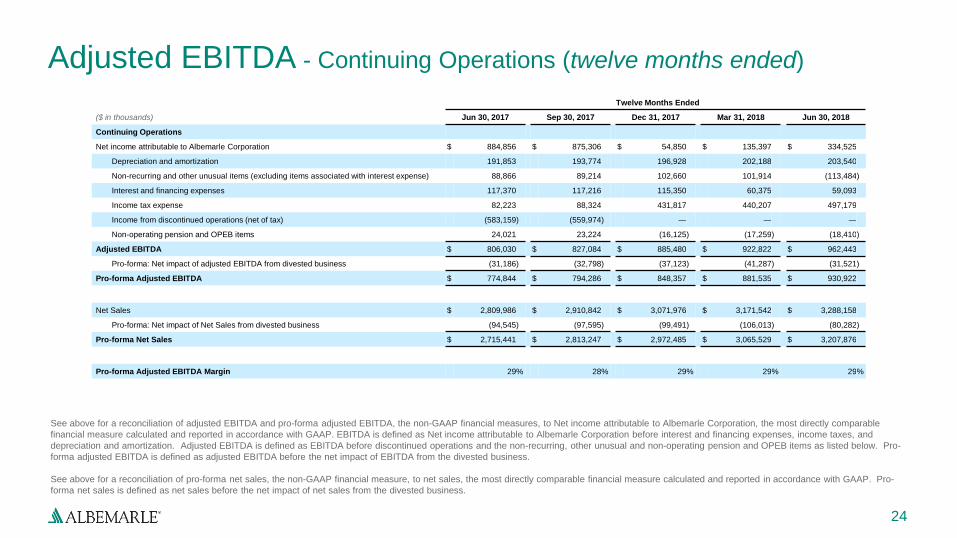
Adjusted EBITDA - Continuing Operations (twelve months ended)
Twelve Months Ended
($ in thousands) Jun 30, 2017 Sep 30, 2017 Dec 31, 2017 Mar 31, 2018 Jun 30, 2018
Continuing Operations
Net income attributable to Albemarle Corporation $ 884,856 $ 875,306 $ 54,850 $ 135,397 $ 334,525
Depreciation and amortization 191,853 193,774 196,928 202,188 203,540
Non-recurring and other unusual items (excluding items associated with interest expense) 88,866 89,214 102,660 101,914 (113,484 )
Interest and financing expenses 117,370 117,216 115,350 60,375 59,093
Income tax expense 82,223 88,324 431,817 440,207 497,179
Income from discontinued operations (net of tax) (583,159 ) (559,974 ) — — —
Non-operating pension and OPEB items 24,021 23,224 (16,125 ) (17,259 ) (18,410 )
Adjusted EBITDA $ 806,030 $ 827,084 $ 885,480 $ 922,822 $ 962,443
Pro-forma: Net impact of adjusted EBITDA from divested business (31,186 ) (32,798 ) (37,123 ) (41,287 ) (31,521 )
Pro-forma Adjusted EBITDA $ 774,844 $ 794,286 $ 848,357 $ 881,535 $ 930,922
Net Sales $ 2,809,986 $ 2,910,842 $ 3,071,976 $ 3,171,542 $ 3,288,158
Pro-forma: Net impact of Net Sales from divested business (94,545 ) (97,595 ) (99,491 ) (106,013 ) (80,282 )
Pro-forma Net Sales $ 2,715,441 $ 2,813,247 $ 2,972,485 $ 3,065,529 $ 3,207,876
Pro-forma Adjusted EBITDA Margin 29 % 28 % 29 % 29 % 29 %
See above for a reconciliation of adjusted EBITDA and pro-forma adjusted EBITDA, the non-GAAP financial measures, to Net income attributable to Albemarle Corporation, the most directly comparable
financial measure calculated and reported in accordance with GAAP. EBITDA is defined as Net income attributable to Albemarle Corporation before interest and financing expenses, income taxes, and
depreciation and amortization. Adjusted EBITDA is defined as EBITDA before discontinued operations and the non-recurring, other unusual and non-operating pension and OPEB items as listed below. Pro-
forma adjusted EBITDA is defined as adjusted EBITDA before the net impact of EBITDA from the divested business.
See above for a reconciliation of pro-forma net sales, the non-GAAP financial measure, to net sales, the most directly comparable financial measure calculated and reported in accordance with GAAP. Pro-
forma net sales is defined as net sales before the net impact of net sales from the divested business.

25
($ in thousands) Lithium Bromine Specialties Catalysts Reportable
Segments Total All Other Corporate Consolidated Total
Three months ended June 30, 2018:
Net income (loss) attributable to Albemarle Corporation $ 117,292 $ 59,673 $ 280,887 $ 457,852 $ (2,079 ) $ (153,312 ) $ 302,461
Depreciation and amortization 24,325 9,694 12,920 46,939 1,978 1,557 50,474
Non-recurring and other unusual items — — (218,705 ) (218,705 ) — 33,126 (185,579 )
Interest and financing expenses — — — — — 13,308 13,308
Income tax expense — — — — — 80,102 80,102
Non-operating pension and OPEB items — — — — — (2,204 ) (2,204 )
Adjusted EBITDA $ 141,617 $ 69,367 $ 75,102 $ 286,086 $ (101 ) $ (27,423 ) $ 258,562
Three months ended June 30, 2017:
Net income (loss) attributable to Albemarle Corporation $ 81,819 $ 51,739 $ 53,994 $ 187,552 $ 152 $ (84,371 ) $ 103,333
Depreciation and amortization 21,460 10,336 13,433 45,229 2,292 1,601 49,122
Non-recurring and other unusual items 11,921 — — 11,921 — 17,898 29,819
Interest and financing expenses — — — — — 14,590 14,590
Income tax expense — — — — — 23,130 23,130
Non-operating pension and OPEB items — — — — — (1,053 ) (1,053 )
Adjusted EBITDA $ 115,200 $ 62,075 $ 67,427 $ 244,702 $ 2,444 $ (28,205 ) $ 218,941
Pro-forma: Net impact of adjusted EBITDA from divested
business — — (9,766 ) (9,766 ) — — (9,766 )
Pro-forma adjusted EBITDA $ 115,200 $ 62,075 $ 57,661 $ 234,936 $ 2,444 $ (28,205 ) $ 209,175
Adjusted EBITDA - by Segment (three months ended June 30)
See above for a reconciliation of adjusted EBITDA on a segment basis, the non-GAAP financial measure, to Net income attributable to Albemarle Corporation (“earnings”), the most directly comparable
financial measure calculated and reporting in accordance with GAAP. EBITDA is defined as earnings before interest and financing expenses, income taxes, and depreciation and amortization. Adjusted
EBITDA is defined as EBITDA before the non-recurring, other unusual and non-operating pension and OPEB items as listed above.

26
Adjusted EBITDA - by Segment (twelve months ended) Twelve Months Ended
($ in thousands) Jun 30, 2017 Sep 30, 2017 Dec 31, 2017 Mar 31, 2018 Jun 30, 2018
Lithium
Net income attributable to Albemarle Corporation $ 271,810 $ 314,707 $ 342,992 $ 373,712 $ 409,185
Depreciation and amortization 85,882 86,409 87,879 92,879 95,744
Non-recurring and other unusual items 15,094 15,977 15,781 11,223 (698 )
Adjusted EBITDA 372,786 417,093 446,652 477,814 504,231
Net Sales 834,629 937,461 1,018,885 1,100,688 1,174,430
Adjusted EBITDA Margin 45 % 44 % 44 % 43 % 43 %
Bromine Specialties
Net income attributable to Albemarle Corporation $ 189,197 $ 201,336 $ 218,839 $ 219,681 $ 227,615
Depreciation and amortization 40,122 40,112 40,062 40,701 40,059
Adjusted EBITDA 229,319 241,448 258,901 260,382 267,674
Net Sales 812,145 830,572 855,143 861,591 878,160
Adjusted EBITDA Margin 28 % 29 % 30 % 30 % 30 %
Catalysts
Net income attributable to Albemarle Corporation $ 243,858 $ 216,405 $ 230,665 $ 229,359 $ 456,252
Depreciation and amortization 52,105 53,160 54,468 53,855 53,342
Non-recurring and other unusual items — (1,250 ) (1,250 ) (1,250 ) (219,955 )
Adjusted EBITDA 295,963 268,315 283,883 281,964 289,639
Pro-forma: Net impact of adjusted EBITDA from divested business (30,425 ) (33,323 ) (37,123 ) (41,287 ) (31,521 )
Pro-forma Adjusted EBITDA 265,538 234,992 246,760 240,677 258,118
Net Sales 1,039,470 1,019,593 1,067,572 1,074,731 1,101,442
Pro-forma: Net impact of net sales from divested business (95,015 ) (97,595 ) (99,491 ) (106,013 ) (80,282 )
Pro-forma Net Sales 944,455 921,998 968,081 968,718 1,021,160
Pro-forma Adjusted EBITDA Margin 28 % 25 % 25 % 25 % 25 %
See above for a reconciliation of adjusted EBITDA and pro-forma adjusted EBITDA on a segment basis, the non-GAAP financial measures, to Net income attributable to Albemarle Corporation (“earnings”), the most
directly comparable financial measure calculated and reporting in accordance with GAAP. EBITDA is defined as earnings before interest and financing expenses, income taxes, and depreciation and amortization.
Adjusted EBITDA is defined as EBITDA before the non-recurring, other unusual and non-operating pension and OPEB items as listed above. Pro-forma adjusted EBITDA is defined as adjusted EBITDA before the
net impact of EBITDA from the divested business.
See above for a reconciliation of pro-forma net sales on a segment basis, the non-GAAP financial measure, to net sales, the most directly comparable financial measure calculated and reported in accordance with
GAAP. Pro-forma net sales is defined as net sales before the net impact of net sales from the divested business.

27
Adjusted EBITDA supplemental1
1 This supplemental is for net-debt-to-adjusted EBITDA ratio based on the bank covenant definition.
Twelve Months Ended ($ in thousands) Three Months Ended
Jun 30, 2018 Jun 30, 2018 Mar 31, 2018 Dec 31, 2017 Sep 30, 2017
Adjusted EBITDA $ 962,443 $ 258,562 $ 248,718 $ 245,780 $ 209,383
Net income attributable to noncontrolling interests 38,208 8,225 7,165 11,295 11,523
Equity in net income of unconsolidated investments (net of tax) (87,914 ) (18,969 ) (20,677 ) (29,224 ) (19,044 )
Dividends received from unconsolidated investments 60,977 4,583 25,462 27,486 3,446
Consolidated EBITDA $ 973,714 $ 252,401 $ 260,668 $ 255,337 $ 205,308
Total Long Term Debt (as reported) $ 1,615,405
Off balance sheet obligations and other 61,800
Consolidated Funded Debt $ 1,677,205
Less Cash 908,144
Consolidated Funded Net Debt $ 769,061
Consolidated Funded Debt to Consolidated EBITDA Ratio 1.7
Consolidated Funded Net Debt to Consolidated EBITDA Ratio 0.8