Embed Size (px)
Citation preview

DA Davidson 19th Annual FIG Summit and Financial Institutions Conference
May 10, 2017
SLM CORPORATION
INVESTOR PRESENTATION

2
Forward-Looking Statements and Disclaimer
Cautionary Note Regarding Forward-Looking Statements
The following information is current as of April 19, 2017 (unless otherwise noted) and should be read in connection with the press release of SLM Corporation
(the “Company”) announcing its financial results for the quarter ended March 31, 2017, the Form 10-Q for the quarter ended March 31, 2017 (filed with the
Securities and Exchange Commission (“SEC”) on April 19, 2017), and subsequent reports filed with the SEC.
This Presentation contains “forward-looking” statements and information based on management’s current expectations as of the date of this Presentation.
Statements that are not historical facts, including statements about the Company’s beliefs, opinions or expectations and statements that assume or are
dependent upon future events, are forward-looking statements. Forward-looking statements are subject to risks, uncertainties, assumptions and other factors
that may cause actual results to be materially different from those reflected in such forward-looking statements. These factors include, among others, the risks
and uncertainties set forth in Item 1A “Risk Factors” and elsewhere in the Company’s Annual Report on Form 10-K for the year ended Dec. 31, 2016 (filed with
the SEC on Feb. 24, 2017) and subsequent filings with the SEC; increases in financing costs; limits on liquidity; increases in costs associated with compliance
with laws and regulations; failure to comply with consumer protection, banking and other laws; changes in accounting standards and the impact of related
changes in significant accounting estimates; any adverse outcomes in any significant litigation to which the Company or any subsidiary is a party; credit risk
associated with the Company’s (or any subsidiary's) exposure to third parties, including counterparties to the Company’s (or any subsidiary's) derivative
transactions; and changes in the terms of education loans and the educational credit marketplace (including changes resulting from new laws and the
implementation of existing laws). The Company could also be affected by, among other things: changes in its funding costs and availability; reductions to its
credit ratings; failures or breaches of its operating systems or infrastructure, including those of third-party vendors; damage to its reputation; risks associated
with restructuring initiatives, including failures to successfully implement cost-cutting programs and the adverse effects of such initiatives on the Company’s
business; changes in the demand for educational financing or in financing preferences of lenders, educational institutions, students and their families; changes
in law and regulations with respect to the student lending business and financial institutions generally; changes in banking rules and regulations, including
increased capital requirements; increased competition from banks and other consumer lenders; the creditworthiness of customers; changes in the general
interest rate environment, including the rate relationships among relevant money-market instruments and those of earning assets versus funding arrangements;
rates of prepayments on the loans made by the Company and its subsidiaries; changes in general economic conditions and the Company’s ability to
successfully effectuate any acquisitions; and other strategic initiatives. The preparation of the Company’s consolidated financial statements also requires
management to make certain estimates and assumptions, including estimates and assumptions about future events. These estimates or assumptions may
prove to be incorrect. All forward-looking statements contained in this Presentation are qualified by these cautionary statements and are made only as of the
date of this Presentation. The Company does not undertake any obligation to update or revise these forward-looking statements to conform such statements to
actual results or changes in its expectations.
The Company reports financial results on a GAAP basis and also provides certain “Core Earnings” performance measures. The dif ference between the
Company’s “Core Earnings” and GAAP results for the periods presented were the unrealized, mark-to-market gains/losses on derivative contracts. These are
recognized in GAAP, but not in “Core Earnings” results. The Company provides “Core Earnings” measures because this is what management uses when
making management decisions regarding the Company’s performance and the allocation of corporate resources. The Company’s “Core Earnings” are not
defined terms within GAAP and may not be comparable to similarly titled measures reported by other companies.
For additional information, see “Management’s Discussion and Analysis of Financial Condition and Results of Operations – GAAP Consolidated Earnings
Summary-’Core Earnings’” in the Company’s Quarterly Report on Form 10-Q for the quarter ended March 31, 2017 for a further discussion and the “’Core
Earnings’ to GAAP Reconciliation” table in this Presentation for a complete reconciliation between GAAP net income and “Core Earnings”.
3
Sallie Mae Brand • #1 saving, planning and paying for
education company with 40 years of
leadership in the education lending
market
• Top ranked brand: 6 out of 10
consumers of education finance
recognize the Sallie Mae brand
• Industry leading market share in
private education lending: 54% market
share(1)
• Over 2,400 actively managed
university relationships across the U.S.
• Complementary consumer product
offerings
• Over one million long-term engaged
customers across the Sallie Mae
brands

4
($B as of 3/31/17)
Assets 19.2 -FFELP Loans 1.0 -
Private Loans 15.5 -Deposits 13.4 -
Preferred Equity 0.6 -Common Equity 1.9 -
Private Education Loan -Originator and Servicer
Deposits -Upromise Rewards -
Credit Card -
- National sales and marketing
- Largest salesforce in the industry
- Specialized underwritingcapability
- Capital markets expertise
Sallie Mae Summary
- Leading private education loan franchise
- Conservative credit andfunding
- Expanding consumer finance product suite Strategic
OverviewKey
Businesses
BalanceSheet
CompetitiveAdvantage

5
Sallie Mae Overview
Sallie Mae Key Statistics for Q1 2017
− $0.21 “Core Earnings” Diluted Earnings Per Common Share 2,3
− Portfolio of $15.5 billion of high quality Private Education Loans
− 90% of Private Education Loans disbursed in Q1 are cosigned
− Average Q1 Private Education Loan originations FICO of 748
− 79% of Private Education Loans outstanding have origination FICO ≥ 700
− $1.1 billion in cash
− Net interest income= $268 million
− Net interest margin= 5.96%
− Private Education Loan yield= 8.26%
A diversified approach to funding which includes:
− $13.4 billion in deposits
−$6.7 billion brokered deposits
−$6.7 billion in retail and other deposits
− $750 million multi-year asset-backed commercial paper funding facility
− $2.8 billion of Private Education Loan term securitizations outstanding
− Raised $200 million in 5.125% Senior Unsecured notes on April 5, 2017 with proceeds to be used to redeem the 6.97 percent Cumulative Redeemable Preferred Stock, Series A on May 5, 2017

6
$17 $17 $27 $27
$105
$34
$154
$53
Full-TimePrivate School
Full-TimePublic School
Full-TimePrivate School
Full-TimePublic School
Stafford Loan Limit Cost of Attendance Gap
Favorable Student Loan Market Trends
12.9 13.3 13.4 13.5 13.4 13.5
09/10 10/11 11/12 12/13 13/14 14/15
(millions)
Academic Year Enrollment at Four-Year Degree Granting Institutions(4) Annual Cost of Education(5)
$15 $16 $17 $18 $18 $19 $20 $20
$35 $36 $38 $39 $41 $42 $44 $45
09/10 10/11 11/12 12/13 13/14 14/15 15/16 16/17
Public Private(thousands)
Federal Loans$96
Family Contributions
$166
Grants$126
Private Education Loans$10
Ed. Tax Benefit /Work Study
$19
($ in billions)
Total Estimated Cost: $417
Estimated Total Cost of Education – 2015 / 2016 AY(6) Cost of College (Based on a Four-Year Term)(7)
(billions) (thousands)
$122
$51
$181
$80
AY 06/07 AY 16/17

7
Relationship Between Higher Education, Income and Employment(8)
0%
1%
2%
3%
4%
5%
6%
7%
8%
9%
0
200
400
600
800
1,000
1,200
1,400
1,600
1,800
2,000
Less than H.S. High school Some college Associate Bachelor's Master's Doctorate Professional
Unemployment
Average weekly income
Higher Education Value Proposition
$ 7,499
$ 9,690
$ 14,245
$ 15,780
$ 17,500
Silents in 1965 Early Boomers in1979
Late Boomers in1986
Gen Xers in 1995 Millenials in 2013
Key Statistics
• The unemployment rate for individuals 25 to 34 years-old with four-year college degrees was 2.7%, compared to
7.6% for high school graduates(10)
• 64% of students graduate with student loans in AY 2014-2015(11)
• 67% of student loan borrowers have debt balances less than $25,000 and 4% have balances above $100,000 (average borrowings of $26,700) (11)
Incremental Earnings From a College Degree Have Increased For Generations(9)

8
Product Features
• Offers three repayment options while in school, which include Interest Only, $25
Fixed Payment and Deferred Repayment
• Variable and Fixed Interest Rate Options
• All loans are certified by the school’s financial aid office to ensure all proceeds are
for educational expenses
Distribution Channels
• Nationally recognized brand
• Largest national sales force in industry actively manages over 2,400 college
relationships
• Represented on vast majority of college directed preferred lender lists
• Significant marketing experience to prospective customers through paid search,
affiliates, display, direct mail and email
• Leverage low cost customer channels to contribute to significant serialization in
following years
• Marketing and distribution through partnerships with banks, credit unions,
resellers and membership organizations
Smart Option Overview

9
Analytical Approach to Credit
Borrower/Cosigner
Initial Screen
• $1,000 minimum loan
• Minimum FICO of 640
• No existing SLM 30+ day past dues
• No student loans 90+ day past dues
• No recent bankruptcy
• 2+ trades for cosigners and 4+ trades for
non-cosigner
• Asset expertise and rigorous
underwriting driven by large
volume of historical data
• ~1.3mm annual applications
• ~40% approval rate
Custom Scorecard• Multi-scenario approach that predicts
percentage of borrowers likely to reach
90+ days past due
• Built in coordination with Experian
Decision Analytics
• Applies 15 – 18 application and credit
bureau attributes
Manual Review• ~8% of applications
• Pass risk scores, but require further
review due to credit concerns
− Thorough review of bankruptcies,
collection accounts, etc.
− Higher levels of existing student
debt
− High credit utilization

10
High Quality Private Education Loan Growth
8%
7%
5%
6%
2%
$3,795
$4,076$4,330
$4,666
$1,847
$0
$500
$1,000
$1,500
$2,000
$2,500
$3,000
$3,500
$4,000
$4,500
$5,000
2013 2014 2015 2016 2017
Dis
bu
rse
me
nts
($
MM
)
Private Education Loan Disbursements
$4,900
$1,804
Disbursement Statistics ($) 2013 2014 2015 2016 Q1 2017
% Cosigned 89% 90% 90% 89% 90%
% In School Payment 58% 57% 56% 55% 55%
Average FICO at Approval 746 748 749 748 748

11
Customer Satisfaction Overview
Call Volume
Customer Satisfaction Survey Results
CFPB Complaint Portal Results (12)
Servicing Channel Distribution
As of 3/31/17
Q1 2016 Q1 2017
0
10
20
30
40
50
60
70
80
90
100
Sept. 2014 - Aug. 2015 Sept. 2015 - Aug. 2016
Complaints Per 100,000 Customers
-24%
12%
8%
63%
17%
4Q15
Call Center IVR Web Mobile
0%
10%
20%
30%
40%
50%
60%
70%
80%
Jun-
15
Jul-
15
Au
g-1
5
Sep
-15
Oct
-15
No
v-1
5
Dec
-15
Jan-
16
Feb
-16
Mar
-16
Ap
r-16
Ma
y-1
6
Jun-
16
Jul-
16
Au
g-16
Sep
-16
Oct
-16
No
v-1
6
Dec
-16
Jan-
17
Feb
-17
Mar
-17
Overall Satisfaction Overall Dissatisfaction
9%
9%
63%
18%
1Q16
Call Center IVR Web Mobile
8%
9%
62%
21%
1Q17
Call Center IVR Web Mobile
0.0
0.1
0.2
0.3
0.4
0.5
0.6
0.7
0.8
0.9
1Q16 1Q17
Ca
lls
per
Ap
pli
cati
on
Sales
-24%
0.00
0.05
0.10
0.15
0.20
0.25
0.30
1Q16 1Q17
Ca
lls
per
Bo
rro
wer
Servicing
-23%

12Celebrating Sallie Mae
2017 awards and recognition
2017
BESTBANKS

13
High Quality Private Education Portfolio
Customer FICO at Original Approval Smart Option Payment Type
Portfolio Interest Rate Type
Variable81%
Fixed19%
780+30%
740 - 78023%
700 - 74026%
<70021%
Weighted Average FICO: 746
Portfolio by Originations Vintage
Interest Only22%
Fixed Pay31%
Deferred47%
Smart Option Loans: $15.0 billion
Pre 20124%2012
7%
201312%
201419%
201526%
201628%
20174%
Weighted Average Age of Loan: ~2.1 years
As of 3/31/17
14
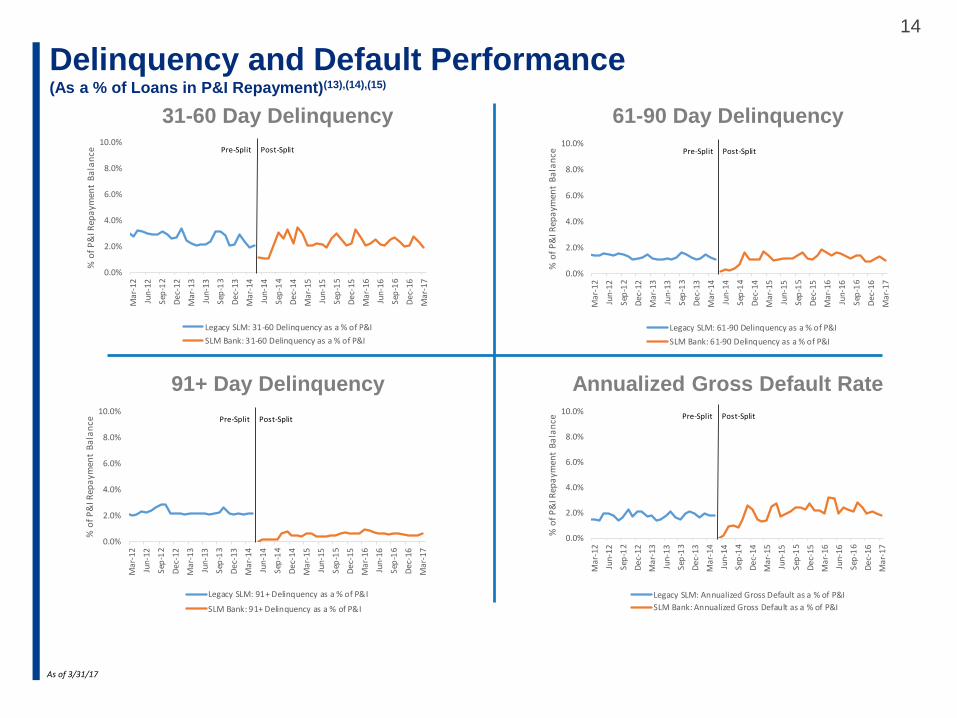
Delinquency and Default Performance (As a % of Loans in P&I Repayment)(13),(14),(15)
31-60 Day Delinquency
91+ Day Delinquency
61-90 Day Delinquency
Annualized Gross Default Rate
As of 3/31/17
0.0%
2.0%
4.0%
6.0%
8.0%
10.0%M
ar-1
2
Jun
-12
Sep
-12
De
c-1
2
Mar
-13
Jun
-13
Sep
-13
De
c-1
3
Mar
-14
Jun
-14
Sep
-14
De
c-1
4
Mar
-15
Jun
-15
Sep
-15
De
c-1
5
Mar
-16
Jun-
16
Sep
-16
De
c-1
6
Mar
-17
% o
f P
&I R
epa
ymen
t B
ala
nce
Legacy SLM: 31-60 Delinquency as a % of P&I
SLM Bank: 31-60 Delinquency as a % of P&I
0.0%
2.0%
4.0%
6.0%
8.0%
10.0%
Mar
-12
Jun
-12
Sep
-12
Dec
-12
Mar
-13
Jun-
13
Sep
-13
Dec
-13
Mar
-14
Jun
-14
Sep
-14
Dec
-14
Mar
-15
Jun
-15
Sep
-15
Dec
-15
Mar
-16
Jun-
16
Sep
-16
Dec
-16
Mar
-17
% o
f P
&I R
epa
ymen
t B
ala
nce
Legacy SLM: 61-90 Delinquency as a % of P&I
SLM Bank: 61-90 Delinquency as a % of P&I
Pre-Split Post-Split Pre-Split Post-Split
0.0%
2.0%
4.0%
6.0%
8.0%
10.0%
Mar
-12
Jun
-12
Sep
-12
Dec
-12
Mar
-13
Jun
-13
Sep
-13
Dec
-13
Mar
-14
Jun
-14
Sep
-14
Dec
-14
Mar
-15
Jun
-15
Sep
-15
Dec
-15
Mar
-16
Jun-
16
Sep
-16
Dec
-16
Mar
-17
% o
f P
&I R
epa
ymen
t B
ala
nce
Legacy SLM: 91+ Delinquency as a % of P&I
SLM Bank: 91+ Delinquency as a % of P&I
0.0%
2.0%
4.0%
6.0%
8.0%
10.0%
Mar
-12
Jun-
12
Sep
-12
De
c-1
2
Mar
-13
Jun
-13
Sep
-13
De
c-1
3
Mar
-14
Jun-
14
Sep
-14
De
c-1
4
Mar
-15
Jun
-15
Sep
-15
De
c-1
5
Mar
-16
Jun
-16
Sep
-16
De
c-1
6
Mar
-17
% o
f P
&I R
epa
ymen
t B
ala
nce
Legacy SLM: Annualized Gross Default as a % of P&I
SLM Bank: Annualized Gross Default as a % of P&I
Pre-Split Post-Split Pre-Split Post-Split

15
Cumulative Defaults by P&I Repayment Vintage(13),(16),(17)
Smart Option Cumulative Gross Defaults by P&I Repayment Vintage and Years Since First P&I Repayment Period
As of 3/31/17
6.7%
5.9%
4.7%
4.0%3.6%
2.3%
0.3%0%
1%
2%
3%
4%
5%
6%
7%
8%
9%
10%
0 1 2 3 4 5 6 7
Cu
mu
lati
ve D
efa
ult
s a
s a
% o
fD
isb
urs
ed
Pri
ncip
al
En
teri
ng
P &
I R
ep
aym
en
t
Years Since First P&I Repayment Period
2010 2011 2012 2013 2014 2015 2016

16
Stable deposit base with no branch overhead
— Diversified mix of retail and other core savings, MMDA
and CDs
— Brokered deposits used as alternative funding source
Term funding / securitizations will augment deposit
funding for future growth
— Experienced capital markets team
— Capacity to securitize $2 – $3billion of private education
loans
Multi-year revolving conduit facility
— Provides seasonal loan funding and backup liquidity
— Multi-year $750 million conduit provided by consortium
of banks
Substantial liquidity portfolio
— $1.1 billion of on-balance sheet cash as of 3/31/17
80%
20%
41%
41%
18%
Conservative Funding Approach
1Q 2017 Target
Retail deposits
Brokered deposits
Secured debt

17
Financial Review
• Private Education Loan portfolio
growth of 29% in Q1 2017 vs. Q1 2016
• Conservatively funded with 13.3% risk
based capital at the end of Q1 2017
• Growing deposit base coupled with
term funding from securitizations
• Return on Common Equity (Core) and
Return on Assets (Core) in Q1 2017
was 20.7% and 2.1%, respectively
• Core EPS of $0.21 in Q1 2017 vs.
$0.14 in Q1 2016
(in millions) Q1 2017 Q1 2016 Variance
PSL 15,702$ 12,144$ 3,558$
PSL Reserve (185) (123) (62)
FFELP 992 1,091 (99)
FFELP Reserve (2) (4) 2
PLOAN / Other 56 - 56
PLOAN / Other Reserve (0) (0) (0)
Total Loans 16,563 13,108 3,455
Cash 1,078 938 140
All Other Assets 1,596 1,279 317
Total Assets 19,237 15,325 3,912
Brokered Deposits 6,667 6,781 (114)
Retail and Other Deposits 6,721 4,734 1,987
Other Liabilities 3,414 1,666 1,748
Equity 2,435 2,144 291
Total Liabilities & Equity 19,237$ 15,325$ 3,912$
PSL Reserve % of Balance (Gross) 1.18% 1.01% 0.17 %
Interest Income 329$ 249$ 80$
Interest Expense (61) 39 (22)
Net Interest Income before Provision 268 210 58
Provision (25) (33) 7
NII After Provision 243 177 66
Other Income 11 21 (10)
Gain(Loss) on Hedging Activities, net (5) (0) (5)
Total Non-Interest Expenses (103) (93) (10)
GAAP Pre-Tax Income 146$ 105$ 41$
Core Earnings Pre-Tax Income 151$ 106$ 46$
GAAP Net Income 95$ 66$ 29$
Core Earnings Adjustments 3$ 1$ 3$
Core Earnings 98$ 67$ 32$
Preferred Dividends (6)$ (5)$ (0)$
GAAP Earnings Attributable to Common Stock 89$ 61$ 29$
Core Earnings Attributable to Common Stock 93$ 61$ 31$
Return on Assets (Core) 2.1% 1.7% 0.4%
Return on Common Equity (Core) 20.7% 15.9% 4.8%
Total Risk Based Capital Ratio (Bank Only) 13.3% 14.4% (1.0%)
CSEs 439 431 8
Core EPS $0.21 $0.14 $0.07
Metr
ics
Bala
nce S
heet
Inco
me S
tate
men
t

18
• Market share leader in private student loan industry
• High quality assets and conservatively funded balance sheet
• Predictable balance sheet growth
• Strong capital position and funding capabilities
• A financial services company with high growth trajectory and excellent return on equity
Sallie Mae Bank

19
Appendix

20
1) Source: MeasureOne CBA Report as of December 2016
2) The difference between “Core Earnings” and GAAP net income is driven by mark-to-market unrealized gains and losses on derivative contracts recognized in GAAP, but not
in “Core Earnings” results. See page 26 for a reconciliation of GAAP and “Core Earnings” .
3) Derivative Accounting: “Core Earnings” exclude periodic unrealized gains and losses caused by the mark-to-market valuations on derivatives that do not qualify for hedge
accounting treatment under GAAP, as well as the periodic unrealized gains and losses that are a result of ineffectiveness recognized related to effective hedges under
GAAP. Under GAAP, for our derivatives held to maturity, the cumulative net unrealized gain or loss over the life of the contract will equal $0.
4) Source: U.S. Department of Education, National Center for Education Statistics, Projections of Education Statistics to 2022 (NCES, February 2014), Enrollment in
Postsecondary Institutions
5) Source: Trends in College Pricing.© 2016 The College Board, www.collegeboard.org, Note: Academic years, average published tuition, fees, room and board charges at
four-year institutions; enrollment-weighted
6) Source: Total post-secondary education spend is estimated by Sallie Mae determining the full-time equivalents for both graduates and undergraduates and multiplying by
the estimated total per person cost of attendance for each school type. In doing so, we utilize information from the US Department of Education, National Center for
Education Statistics, Projections of Education Statistics to 2022 (NCES 2014, February 2014), The Integrated Postsecondary Education Data System (IPEDS), College
Board -Trends in Student Aid 2016. © 2016 The College Board, www.collegeboard.org, College Board -Trends in Student Pricing 2016. © 2016 The College Board,
www.collegeboard.org, National Student Clearinghouse - Term Enrollment Estimates and Company Analysis. Other sources for these data points also exist publicly and may
vary from our computed estimates. NCES, IPEDS, and College Board restate their data annually, which may cause previously reported results to vary. We have also
restated figures in our Company Analysis to standardize all costs of attendance to dollars not adjusted for inflation. This has a minimal impact on historically-stated numbers.
7) Source: Trends in College Pricing.© 2016 The College Board, www.collegeboard.org, U.S. Department of Education 2016
8) Source: U.S. Bureau of Labor Statistics- “Earnings and Unemployment Rates by Education Attainment” as of March 15, 2016
9) Source: PEW Research Center- The Rising Cost of Not Going to College-February 2014
10) Source: U.S. Bureau of Labor Statistics- Current Population Survey As of December 2016
11) Source: Trends in Student Aid.© 2015 The College Board, www.collegeboard.org, U.S. Department of Education 2015
12) Source: Annual Report of the CFPB Student Loan Ombudsman Report October 2016
13) For important information regarding historical performance data and an explanation of the data and calculations underlying this chart, see pages 22-24.
14) ‘Loans in P&I Repayment’ include only those loans for which scheduled principal and interest payments were due at the end of the applicable monthly reporting period.
15) Delinquency and Default rates are calculated as a percentage of loans in principal and interest (P&I) repayment.
16) Legacy SLM and Navient portfolio serviced pursuant to a 212 day charge-off policy. Sallie Mae Bank portfolio serviced pursuant to a 120 day charge-off policy. Historical
trends may not be indicative of future performance.
17) Certain data used in the chart above was provided by Navient under a data sharing agreement. Sallie Mae Bank has not independently verified, and is not able to verify, the
accuracy or completeness of the data provided under the agreement.
18) Derivative Accounting: “Core Earnings” exclude periodic unrealized gains and losses caused by the mark-to-market valuations on derivatives that do not qualify for hedge
accounting treatment under GAAP, as well as the periodic unrealized gains and losses that are a result of ineffectiveness recognized related to effective hedges under
GAAP. Under GAAP, for our derivatives held to maturity, the cumulative net unrealized gain or loss over the life of the contract will equal $0.
19) “Core Earnings” tax rate is based on the effective tax rate at the Bank where the derivative instruments are held.
Footnotes
21
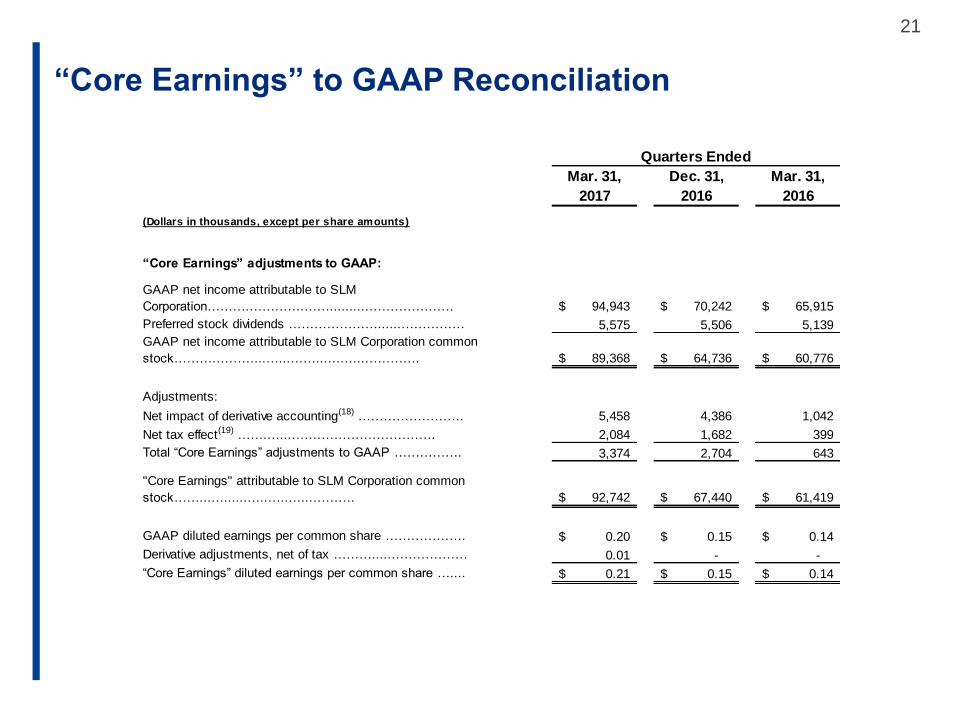
“Core Earnings” to GAAP Reconciliation
Mar. 31, Dec. 31, Mar. 31,
2017 2016 2016
(Dollars in thousands, except per share amounts)
“Core Earnings” adjustments to GAAP:
GAAP net income attributable to SLM
Corporation……….………….…….........………………… 94,943$ 70,242$ 65,915$
Preferred stock dividends …………………......…………… 5,575 5,506 5,139
GAAP net income attributable to SLM Corporation common
stock……….………...…...……...….…..…………. 89,368$ 64,736$ 60,776$
Adjustments:
Net impact of derivative accounting(18) ……………………. 5,458 4,386 1,042
Net tax effect(19) …….…...……………………………. 2,084 1,682 399
Total “Core Earnings” adjustments to GAAP ……………. 3,374 2,704 643
"Core Earnings" attributable to SLM Corporation common
stock……...…......…..…..…...………. 92,742$ 67,440$ 61,419$
GAAP diluted earnings per common share ………………. 0.20$ 0.15$ 0.14$
Derivative adjustments, net of tax ……….....……………… 0.01 - -
“Core Earnings” diluted earnings per common share ….... 0.21$ 0.15$ 0.14$
Quarters Ended

22
Important Information Regarding Historical Loan Performance Data
On April 30, 2014 (the “Spin-Off Date”), the former SLM Corporation legally separated (the “Spin-Off”) into two distinct publicly traded entities: an education loan management, servicing and asset recovery business called Navient
Corporation (“Navient”), and a consumer banking business called SLM Corporation. SLM Corporation’s primary operating subsidiary is Sallie Mae Bank. We sometimes refer to SLM Corporation, together with its subsidiaries and its
affiliates, during the period prior to the Spin-Off as “legacy SLM.”
In connection with the Spin-Off, all private education loans owned by legacy SLM, other than those owned by its Sallie Mae Bank subsidiary as of the date of the Spin-Off, and all private education loan asset-backed securities (“ABS”)
trusts previously sponsored and administered by legacy SLM were transferred to Navient. As of the Spin-Off Date, Navient and its sponsored ABS trusts owned $30.8 billion of legacy SLM’s private education loan portfolio originated both
prior to and since 2009. As of the Spin-Off Date, Sallie Mae Bank owned $7.2 billion of private education loans, the vast majority of which were unencumbered Smart Option Student Loans originated since 2009.
Legacy SLM’s Private Education Loan and ABS Programs Prior to the Spin-Off
In 1989, legacy SLM began making private education loans to graduate students. In 1996, legacy SLM expanded its private education loan offerings to undergraduate students. Between 2002 and 2007, legacy SLM issued $18.6 billion of
private education loan-backed ABS in 12 separate transactions.
In 2008, in response to the financial downturn, legacy SLM revised its private education loan underwriting criteria, tightened its forbearance and collections policies, ended direct-to-consumer disbursements, and ceased lending to
students attending certain for-profit schools. Legacy SLM issued no private education loan ABS in 2008.
In 2009, legacy SLM introduced its Smart Option Student Loan product and began underwriting private education loans with a proprietary custom credit score. The custom credit score included income-based factors, which led to a
significant increase in the percentage of loans requiring a co-signer, typically a parent. The initial loans originated under the Smart Option Student Loan program (the “Interest Only SOSLs”) were variable rate loans and required interest
payments by borrowers while in school, which reduced the amounts payable over the loans’ lives and helped establish repaymen t habits among borrowers. In 2010, legacy SLM introduced a second option for its Smart Option Student
Loan customers, which required a $25 fixed monthly payment while borrowers were in school (the “Fixed Pay SOSLs”). In 2011, legacy SLM introduced another option for its Smart Option Student Loan customers, which allowed
borrowers to defer interest and principal payments until after a student graduates or separates from school (the “Deferred SOSLs”). In 2012, legacy SLM introduced a fixed rate loan option for its Interest Only, Fixed Pay and Deferred
SOSLs. Borrowers must select which of these options they prefer at the time of loan origination and are not permitted to change those options once selected.
In 2011, legacy SLM included private education loans originated under the Smart Option Student Loan program in its ABS pools for the first time. Between 2011 and 2014, the mix of Smart Option Student Loans included in legacy SLM’s
private education loan ABS steadily increased as a percentage of the collateral pools, from 10% initially to 64% in later transactions.
Sallie Mae Bank’s Private Education Loan and ABS Programs Post-Spin Off
Originations. Following the Spin-Off, Sallie Mae Bank continued to originate loans under the Smart Option Student Loan program. As of December 31, 2016, it owned $14.1 billion of private education loans, the vast majority of which were
Smart Option Student Loans originated since 2009, and over 85% of which were originated between 2013 and 2016. Navient ceased originating private education loans following the Spin-Off.
Servicing. Immediately prior to the Spin-Off, Sallie Mae Bank assumed responsibility for collections of delinquent loans on the vast majority of its Smart Option Student Loan portfolio. Following the Spin-Off Date, Navient continued to
service all private education loans owned by the two companies on its servicing platform until October 2014, when servicing for the vast majority of Sallie Mae Bank’s private education loan portfolio was transitioned to Sallie Mae Bank.
Sallie Mae Bank now services and is responsible for collecting the vast majority of the Smart Option Student Loans it owns.
Securitization and Sales. In August 2014, Sallie Mae Bank sponsored its first private education loan ABS, SMB Private Education Loan Trust 2014-A (the “SMB 2014-A transaction”). Because this transaction occurred prior to the transfer
of loan servicing from Navient to Sallie Mae Bank, Sallie Mae Bank acted as master servicer for the transaction and Navient as subservicer, and the loan pool is serviced pursuant to Navient servicing policies. In April 2015, Sallie Mae
Bank sponsored a second securitization and residual sale, SMB Private Education Loan Trust 2015-A. In July 2015, Sallie Mae Bank sponsored its first on-balance sheet term securitization, SMB Private Education Loan Trust 2015-B. In
October 2015, Sallie Mae Bank sponsored another securitization and residual sale, SMB Private Education Loan Trust 2015-C. In May 2016, Sallie Mae Bank sponsored another on-balance sheet term securitization, SMB Private
Education Loan Trust 2016-A. In July 2016, Sallie Mae Bank sponsored another on-balance sheet term securitization, SMB Private Education Loan Trust 2016-B. In October 2016, Sallie Mae Bank sponsored another on-balance sheet
term securitization, SMB Private Education Loan Trust 2016-C. In February 2017, Sallie Mae Bank sponsored another on-balance sheet term securitization, SMB Private Education Loan Trust 2017-A.Sallie Mae Bank services the loans in
all of the securitizations it has sponsored following the SMB 2014-A transaction.
Additional Information. Prior to the Spin-Off, all Smart Option Student Loans were originated and initially held by Sallie Mae Bank, as a subsidiary of legacy SLM. Sallie Mae Bank typically then sold certain of the performing Smart Option
Student Loans to an affiliate of legacy SLM for securitization. Additionally, on a monthly basis Sallie Mae Bank sold all loans that were over 90 days past due, in forbearance, restructured or involved in a bankruptcy to an affiliate of legacy
SLM. As a result of this second practice, prior to the occurrence of the Spin-Off, historical performance data for Sallie Mae Bank’s Smart Option Student Loan portfolio reflected minimal later stage delinquencies, forbearance or charge-offs.
Legacy SLM collected Smart Option Student Loans pursuant to policies that required loans be charged off after 212 days of del inquency. In April 2014, Sallie Mae Bank began collecting the vast majority of its Smart Option Student Loans
pursuant to policies that required loans be charged off after 120 days of delinquency, in accordance with bank regulatory guidance. As a result of the various policies described above, it was not until recently that (a) a meaningful amount
of Smart Option Student Loan charge-offs occurred in Sallie Mae Bank’s portfolio, and (b) performance data on Sallie Mae Bank’s owned Smart Option Student Loan portfolio became useful as a basis for evaluating historical trends for
Smart Option Student Loans. For the reasons described above, much of Sallie Mae Bank’s historical performance data does not reflect current collections and charge off practices and may not be indicative of the future performance of the
Bank’s Smart Option Student Loans.
23
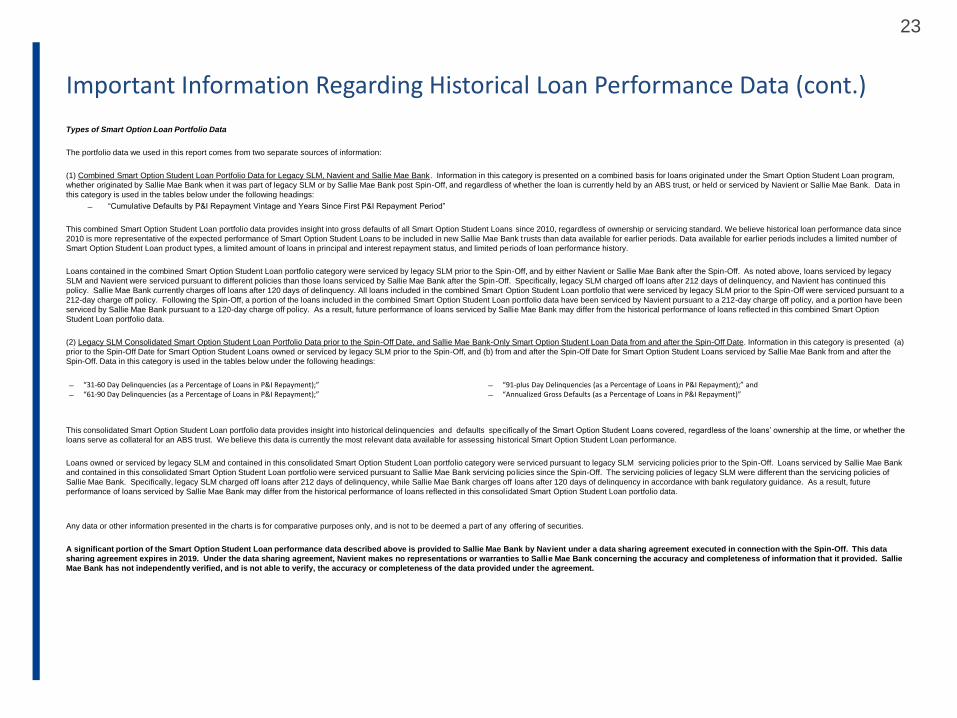
Important Information Regarding Historical Loan Performance Data (cont.)
Types of Smart Option Loan Portfolio Data
The portfolio data we used in this report comes from two separate sources of information:
(1) Combined Smart Option Student Loan Portfolio Data for Legacy SLM, Navient and Sallie Mae Bank. Information in this category is presented on a combined basis for loans originated under the Smart Option Student Loan program,
whether originated by Sallie Mae Bank when it was part of legacy SLM or by Sallie Mae Bank post Spin-Off, and regardless of whether the loan is currently held by an ABS trust, or held or serviced by Navient or Sallie Mae Bank. Data in
this category is used in the tables below under the following headings:
“Cumulative Defaults by P&I Repayment Vintage and Years Since First P&I Repayment Period”
This combined Smart Option Student Loan portfolio data provides insight into gross defaults of all Smart Option Student Loans since 2010, regardless of ownership or servicing standard. We believe historical loan performance data since
2010 is more representative of the expected performance of Smart Option Student Loans to be included in new Sallie Mae Bank trusts than data available for earlier periods. Data available for earlier periods includes a limited number of
Smart Option Student Loan product types, a limited amount of loans in principal and interest repayment status, and limited periods of loan performance history.
Loans contained in the combined Smart Option Student Loan portfolio category were serviced by legacy SLM prior to the Spin-Off, and by either Navient or Sallie Mae Bank after the Spin-Off. As noted above, loans serviced by legacy
SLM and Navient were serviced pursuant to different policies than those loans serviced by Sallie Mae Bank after the Spin-Off. Specifically, legacy SLM charged off loans after 212 days of delinquency, and Navient has continued this
policy. Sallie Mae Bank currently charges off loans after 120 days of delinquency. All loans included in the combined Smart Option Student Loan portfolio that were serviced by legacy SLM prior to the Spin-Off were serviced pursuant to a
212-day charge off policy. Following the Spin-Off, a portion of the loans included in the combined Smart Option Student Loan portfolio data have been serviced by Navient pursuant to a 212-day charge off policy, and a portion have been
serviced by Sallie Mae Bank pursuant to a 120-day charge off policy. As a result, future performance of loans serviced by Sallie Mae Bank may differ from the historical performance of loans reflected in this combined Smart Option
Student Loan portfolio data.
(2) Legacy SLM Consolidated Smart Option Student Loan Portfolio Data prior to the Spin-Off Date, and Sallie Mae Bank-Only Smart Option Student Loan Data from and after the Spin-Off Date. Information in this category is presented (a)
prior to the Spin-Off Date for Smart Option Student Loans owned or serviced by legacy SLM prior to the Spin-Off, and (b) from and after the Spin-Off Date for Smart Option Student Loans serviced by Sallie Mae Bank from and after the
Spin-Off. Data in this category is used in the tables below under the following headings:
This consolidated Smart Option Student Loan portfolio data provides insight into historical delinquencies and defaults specifically of the Smart Option Student Loans covered, regardless of the loans’ ownership at the time, or whether the
loans serve as collateral for an ABS trust. We believe this data is currently the most relevant data available for assessing historical Smart Option Student Loan performance.
Loans owned or serviced by legacy SLM and contained in this consolidated Smart Option Student Loan portfolio category were serviced pursuant to legacy SLM servicing policies prior to the Spin-Off. Loans serviced by Sallie Mae Bank
and contained in this consolidated Smart Option Student Loan portfolio were serviced pursuant to Sallie Mae Bank servicing policies since the Spin-Off. The servicing policies of legacy SLM were different than the servicing policies of
Sallie Mae Bank. Specifically, legacy SLM charged off loans after 212 days of delinquency, while Sallie Mae Bank charges off loans after 120 days of delinquency in accordance with bank regulatory guidance. As a result, future
performance of loans serviced by Sallie Mae Bank may differ from the historical performance of loans reflected in this consol idated Smart Option Student Loan portfolio data.
Any data or other information presented in the charts is for comparative purposes only, and is not to be deemed a part of any offering of securities.
A significant portion of the Smart Option Student Loan performance data described above is provided to Sallie Mae Bank by Navient under a data sharing agreement executed in connection with the Spin-Off. This data
sharing agreement expires in 2019. Under the data sharing agreement, Navient makes no representations or warranties to Sallie Mae Bank concerning the accuracy and completeness of information that it provided. Sallie
Mae Bank has not independently verified, and is not able to verify, the accuracy or completeness of the data provided under the agreement.
“31-60 Day Delinquencies (as a Percentage of Loans in P&I Repayment);” “61-90 Day Delinquencies (as a Percentage of Loans in P&I Repayment);”
“91-plus Day Delinquencies (as a Percentage of Loans in P&I Repayment);” and “Annualized Gross Defaults (as a Percentage of Loans in P&I Repayment)”

24
Terms and calculations used in the cohort default curves are defined below:
First P&I Repayment Period – The month during which a borrower is first required to make a full principal and interest payment on a loan.
P&I Repayment Vintage – The calendar year of a loan’s First P&I Repayment Period.
Disbursed Principal Entering P&I Repayment – The total amount of disbursed loan principal in a P&I Repayment Vintage, excluding any interest
capitalization.
Reported Default Data -
o For loans that default prior to their First P&I Repayment Period: Loans defaulting prior to their First P&I Repayment Period are included in the P&I
Repayment Vintage corresponding to the calendar year in which the default occurs, and are aggregated and reported in Year 0 of that P&I Repayment
Vintage in the relevant charts and tables. For example: (a) if a loan’s First P&I Repayment Period was scheduled for 2015, but the loan defaulted in
2014, the default amount is reflected in Year 0 of the 2014 P&I Repayment Vintage; and (b) if a loan’s First P&I Repayment Period occurred in 2015, but
the loan defaulted in 2015 before that First P&I Repayment Period, the default amount is reflected in Year 0 of the 2015 P&I Repayment Vintage.
o For loans that default after their First P&I Repayment Period: Loans enter a particular annual P&I Repayment Vintage at different times during the
P&I Repayment Vintage year. Default data is not reported for loans in a particular annual P&I Repayment Vintage until the First P&I Repayment Period
has occurred for all loans in that annual P&I Repayment Vintage. Once reporting starts, data reflects defaults that occurred in a particular period through
the number of months since December 31 of that annual P&I Repayment Vintage year. For example, in the relevant charts and tables included in this
presentation as of March 31, 2017: (i) default data reported for loans in the 2016 P&I Repayment Vintage represents defaults occurring during the first 3
months after a loan’s First P&I Repayment Period regardless of the month in 2016 during which the first full principal and interest payment for that loan
became due; and (ii) default data for loans in the 2015 P&I Repayment Vintage represents defaults occurring during the first 15 months after a loan’s
First P&I Repayment Period regardless of the month in 2015 during which the first full principal and interest payment for that loan became due.
Periodic Defaults – For any loan in a particular P&I Repayment Vintage, the defaulted principal and interest is reflected in the year corresponding to the
number of years since the First P&I Repayment Period for that loan.
Cumulative Defaults – At any time for a particular P&I Repayment Vintage, the cumulative sum of Periodic Defaults for that vintage.
o Defaulted principal includes any interest capitalization that occurred prior to default
o Defaulted principal is not reduced by any amounts recovered after the loan defaulted
o Because the numerator includes capitalized interest while the denominator (i.e., Disbursed Principal Entering P&I Repayment) does not, default rates
are higher than they would be if the numerator and denominator both included capitalized interest
Note: Historical trends suggested by the cohort default triangles may not be indicative of future performance. Legacy SLM and Navient serviced loans were serviced pursuant to a 212 day charge off policy. Sallie
Mae Bank serviced loans were serviced pursuant to a 120 day charge off policy.
Smart Option Loan Program Cohort Default Curves