Embed Size (px)
Citation preview
1
Albemarle Corporation
Third Quarter 2020 Earnings
Conference Call/Webcast
Thursday, November 5, 2020
9:00am ET
Forward-Looking Statements
Some of the information presented in this presentation, the conference call and discussions that follow, including, without limitation, statements with respect
to product development, market trends, price, expected growth and earnings, demand for our products, capital projects, tax rates, stock repurchases,
dividends, cash flow generation, economic trends, outlook and all other information relating to matters that are not historical facts may constitute forward-
looking statements within the meaning of the Private Securities Litigation Reform Act of 1995. Actual results could differ materially from the views
expressed.
Factors that could cause actual results to differ materially from the outlook expressed or implied in any forward-looking statement include, without limitation:
changes in economic and business conditions; changes in financial and operating performance of our major customers and industries and markets served
by us; the timing of orders received from customers; the gain or loss of significant customers; competition from other manufacturers; changes in the
demand for our products or the end-user markets in which our products are sold; limitations or prohibitions on the manufacture and sale of our products;
availability of raw materials; increases in the cost of raw materials and energy, and our ability to pass through such increases to our customers; changes in
our markets in general; fluctuations in foreign currencies; changes in laws and government regulation impacting our operations or our products; the
occurrence of regulatory proceedings, claims or litigation; the occurrence of cyber-security breaches, terrorist attacks, industrial accidents, natural disasters
or climate change; hazards associated with chemicals manufacturing; the inability to maintain current levels of product or premises liability insurance or the
denial of such coverage; political unrest affecting the global economy, including adverse effects from terrorism or hostilities; political instability affecting our
manufacturing operations or joint ventures; changes in accounting standards; the inability to achieve results from our global manufacturing cost reduction
initiatives as well as our ongoing continuous improvement and rationalization programs; changes in the jurisdictional mix of our earnings and changes in tax
laws and rates; changes in monetary policies, inflation or interest rates that may impact our ability to raise capital or increase our cost of funds, impact the
performance of our pension fund investments and increase our pension expense and funding obligations; volatility and uncertainties in the debt and equity
markets; technology or intellectual property infringement, including cyber-security breaches, and other innovation risks; decisions we may make in the
future; the ability to successfully execute, operate and integrate acquisitions and divestitures; uncertainties as to the duration and impact of the coronavirus
(COVID-19) pandemic; and the other factors detailed from time to time in the reports we file with the SEC, including those described under “Risk Factors” in
our Annual Report on Form 10-K and our Quarterly Reports on Form 10-Q. These forward-looking statements speak only as of the date of this
presentation. We assume no obligation to provide any revisions to any forward-looking statements should circumstances change, except as otherwise
required by securities and other applicable laws.
2
Non-GAAP Financial Measures
It should be noted that Adjusted net income attributable to Albemarle Corporation (“Adjusted earnings”), Adjusted diluted earnings per share attributable to
Albemarle Corporation, Adjusted effective income tax rates, segment operating profit, segment income, pro-forma net sales, net sales excluding the impact
of foreign exchange translation ("ex FX"), EBITDA, Adj. EBITDA, Adj. EBITDA by operating segment, EBITDA margin, Adj. EBITDA margin, pro-forma Adj.
EBITDA, pro-forma Adj. EBITDA margin, Adj. EBITDA excluding the impact of foreign exchange translation ("ex FX"), Adj. EBITDA margin excluding the
impact of foreign exchange translation ("ex FX"), net debt to Adj. EBITDA, gross debt to Adj. EBITDA, free cash flow, and Adjusted free cash flow are
financial measures that are not required by, or presented in accordance with, accounting principles generally accepted in the United States, or GAAP.
These measures are presented here to provide additional useful measurements to review our operations, provide transparency to investors and enable
period-to-period comparability of financial performance. The Company’s chief operating decision maker uses these measures to assess the ongoing
performance of the Company and its segments, as well as for business and enterprise planning purposes.
A description of these and other non-GAAP financial measures that we use to evaluate our operations and financial performance, and reconciliation of
these non-GAAP financial measures to the most directly comparable financial measures calculated and reported in accordance with GAAP, can be found in
the Appendix to this presentation. The Company does not provide a reconciliation of forward-looking non-GAAP financial measures to the most directly
comparable financial measures calculated and reported in accordance with GAAP, as the Company is unable to estimate significant non-recurring or
unusual items without unreasonable effort. The amounts and timing of these items are uncertain and could be material to the Company's results calculated
in accordance with GAAP.
3
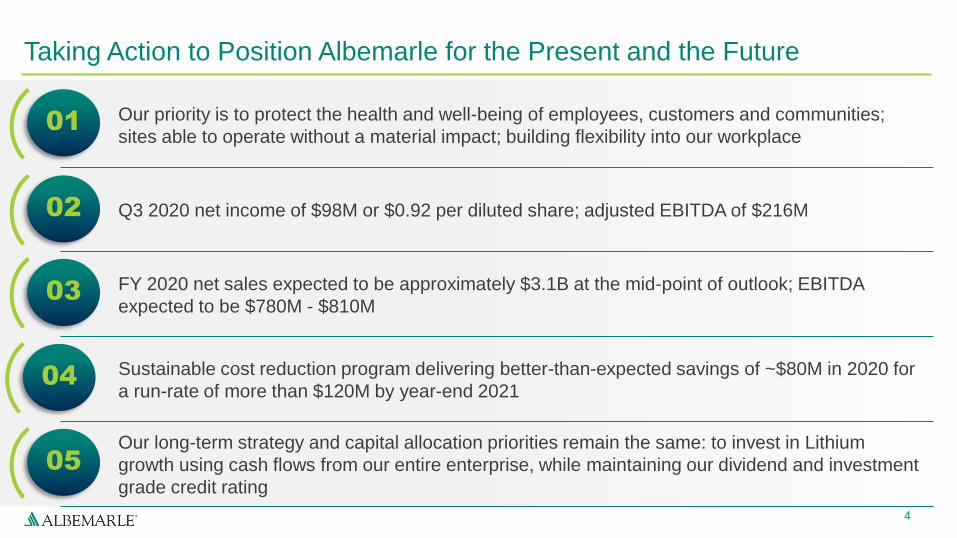
Our priority is to protect the health and well-being of employees, customers and communities;
sites able to operate without a material impact; building flexibility into our workplace
Q3 2020 net income of $98M or $0.92 per diluted share; adjusted EBITDA of $216M
FY 2020 net sales expected to be approximately $3.1B at the mid-point of outlook; EBITDA
expected to be $780M - $810M
Sustainable cost reduction program delivering better-than-expected savings of ~$80M in 2020 for
a run-rate of more than $120M by year-end 2021
Our long-term strategy and capital allocation priorities remain the same: to invest in Lithium
growth using cash flows from our entire enterprise, while maintaining our dividend and investment
grade credit rating
Taking Action to Position Albemarle for the Present and the Future
4
03
01
02
04
05
5
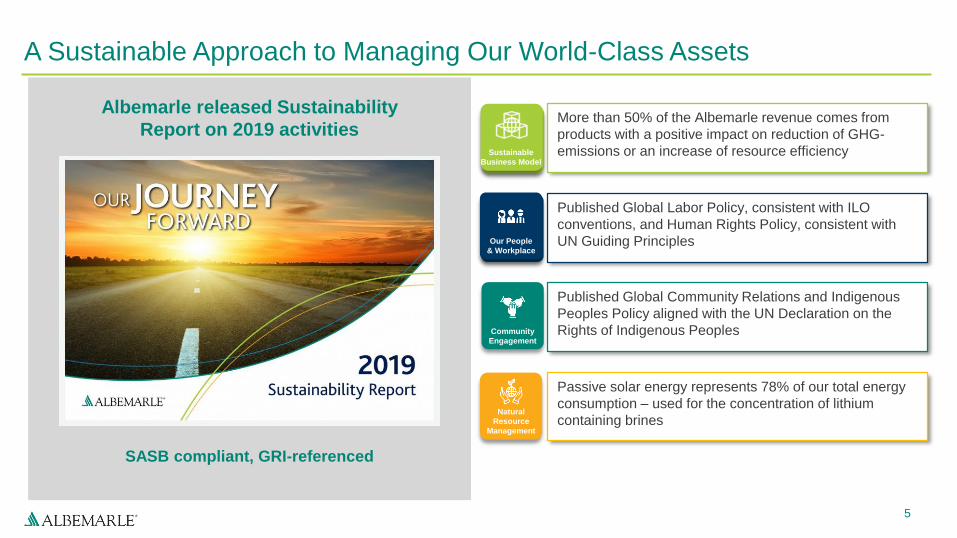
A Sustainable Approach to Managing Our World-Class Assets
Albemarle released Sustainability
Report on 2019 activitiesSustainable
Business Model
Our People
& Workplace
Community
Engagement
Natural
Resource
Management
SASB compliant, GRI-referenced
Published Global Community Relations and Indigenous
Peoples Policy aligned with the UN Declaration on the
Rights of Indigenous Peoples
Passive solar energy represents 78% of our total energy
consumption – used for the concentration of lithium
containing brines
More than 50% of the Albemarle revenue comes from
products with a positive impact on reduction of GHG-
emissions or an increase of resource efficiencySustainable
Business Model
Our People
& Workplace
Published Global Labor Policy, consistent with ILO
conventions, and Human Rights Policy, consistent with
UN Guiding Principles
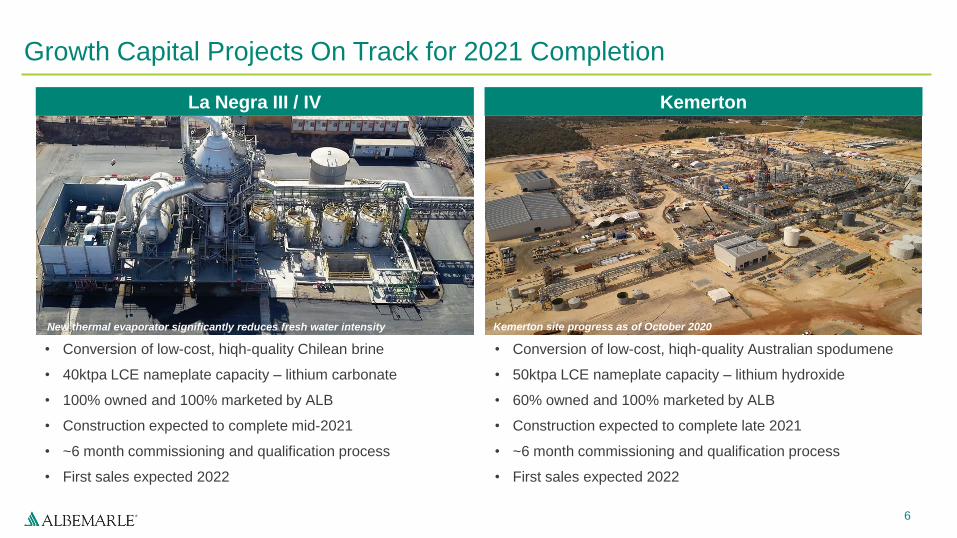
Growth Capital Projects On Track for 2021 Completion
6
La Negra III / IV
New thermal evaporator significantly reduces fresh water intensity
• Conversion of low-cost, hiqh-quality Chilean brine
• 40ktpa LCE nameplate capacity – lithium carbonate
• 100% owned and 100% marketed by ALB
• Construction expected to complete mid-2021
• ~6 month commissioning and qualification process
• First sales expected 2022
Kemerton
Kemerton site progress as of October 2020
• Conversion of low-cost, hiqh-quality Australian spodumene
• 50ktpa LCE nameplate capacity – lithium hydroxide
• 60% owned and 100% marketed by ALB
• Construction expected to complete late 2021
• ~6 month commissioning and qualification process
• First sales expected 2022
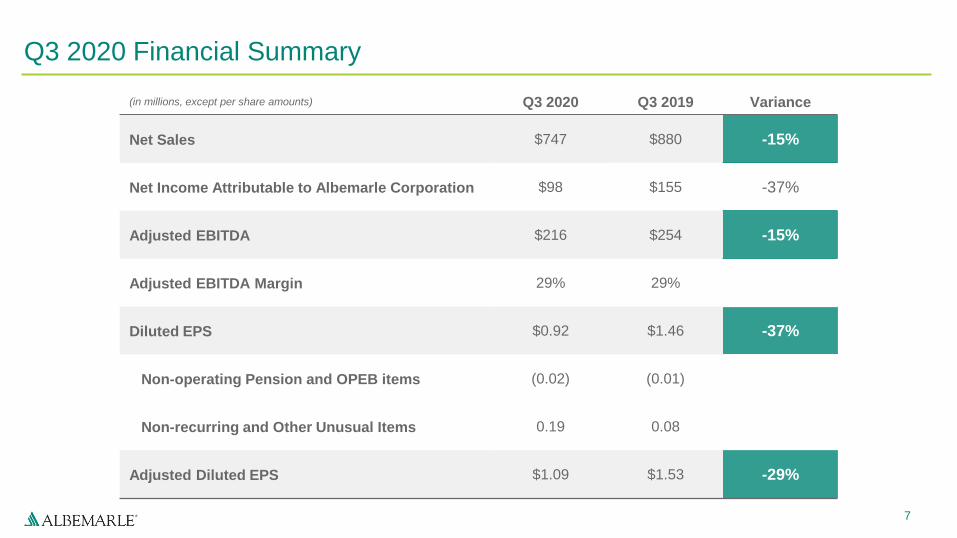
Q3 2020 Financial Summary
7
(in millions, except per share amounts) Q3 2020 Q3 2019 Variance
Net Sales $747 $880 -15%
Net Income Attributable to Albemarle Corporation $98 $155 -37%
Adjusted EBITDA $216 $254 -15%
Adjusted EBITDA Margin 29% 29%
Diluted EPS $0.92 $1.46 -37%
Non-operating Pension and OPEB items (0.02) (0.01)
Non-recurring and Other Unusual Items 0.19 0.08
Adjusted Diluted EPS $1.09 $1.53 -29%
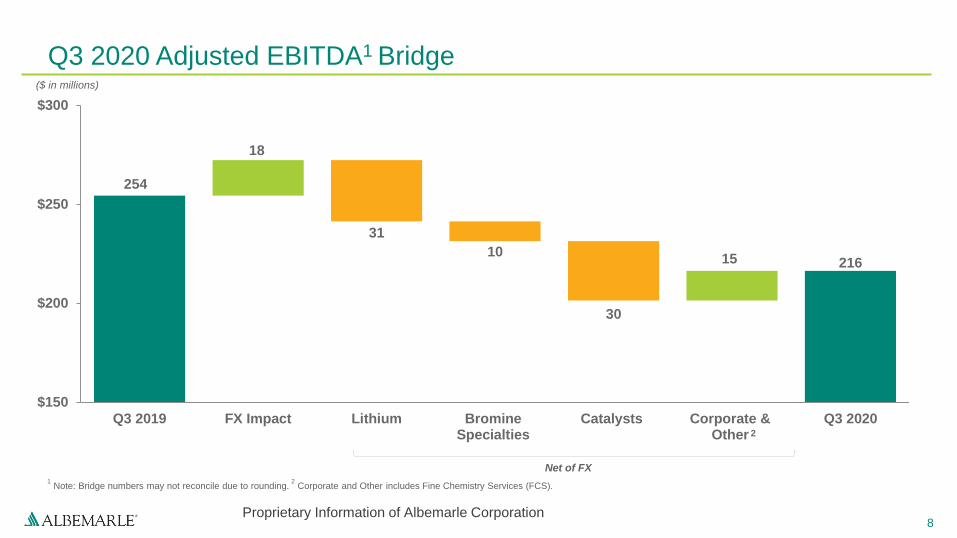
254
216
31
10
30
18
15
$150
$200
$250
$300
Q3 2019 FX Impact Lithium BromineSpecialties
Catalysts Corporate &Other
Q3 2020
($ in millions)
Q3 2020 Adjusted EBITDA1 Bridge
8Proprietary Information of Albemarle Corporation
1Note: Bridge numbers may not reconcile due to rounding.
2Corporate and Other includes Fine Chemistry Services (FCS).
Net of FX
2
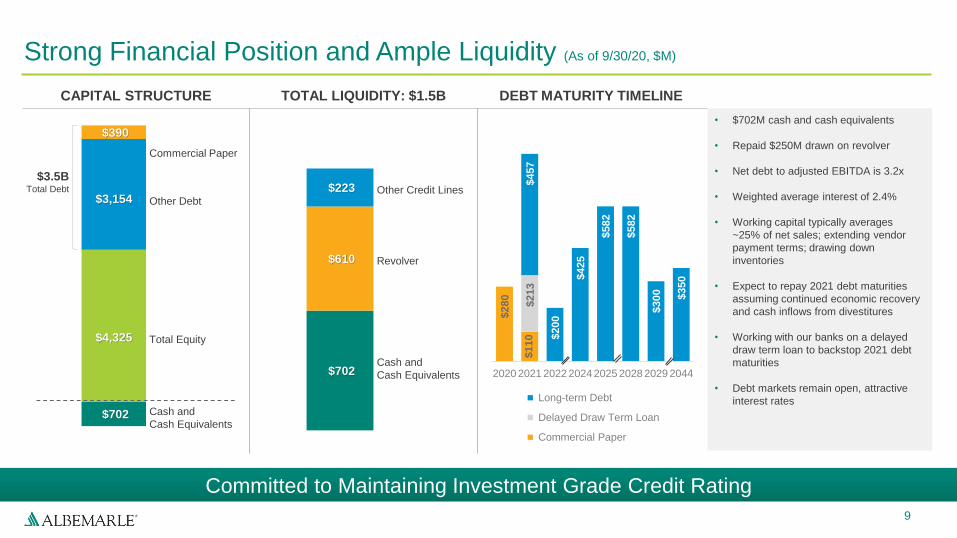
CAPITAL STRUCTURE TOTAL LIQUIDITY: $1.5B DEBT MATURITY TIMELINE
• $702M cash and cash equivalents
• Repaid $250M drawn on revolver
• Net debt to adjusted EBITDA is 3.2x
• Weighted average interest of 2.4%
• Working capital typically averages
~25% of net sales; extending vendor
payment terms; drawing down
inventories
• Expect to repay 2021 debt maturities
assuming continued economic recovery
and cash inflows from divestitures
• Working with our banks on a delayed
draw term loan to backstop 2021 debt
maturities
• Debt markets remain open, attractive
interest rates
$280
$110
$213
$457
$200
$425
$582
$582
$300
$350
2020 2021 2022 2024 2025 2028 2029 2044
Long-term Debt
Delayed Draw Term Loan
Commercial Paper
Strong Financial Position and Ample Liquidity (As of 9/30/20, $M)
9
Committed to Maintaining Investment Grade Credit Rating
$702
$390
$702
$610
$223
Revolver
Other Credit Lines
Cash and
Cash Equivalents
Cash and
Cash Equivalents
Commercial Paper
Other Debt
Total Equity
$3.5BTotal Debt
$4,325
$3,154
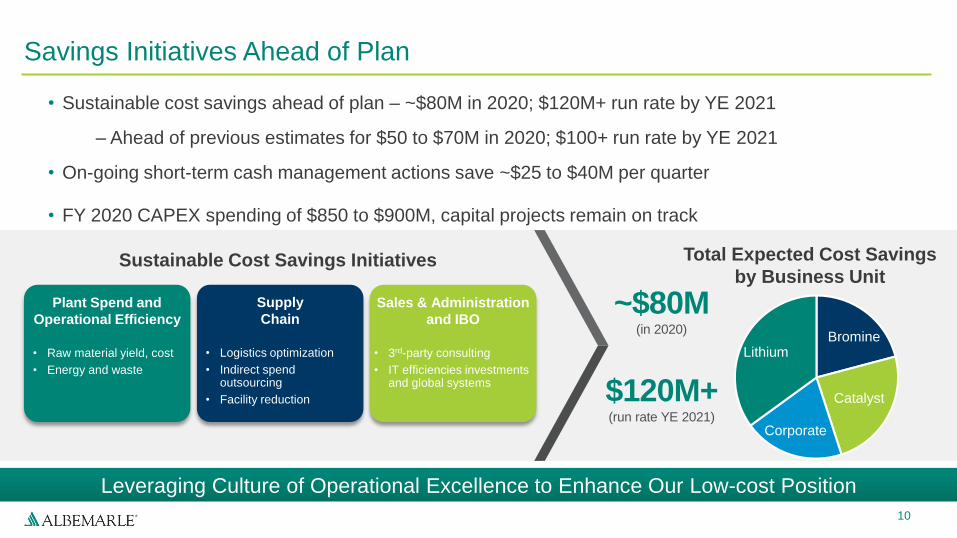
Savings Initiatives Ahead of Plan
• Sustainable cost savings ahead of plan – ~$80M in 2020; $120M+ run rate by YE 2021
– Ahead of previous estimates for $50 to $70M in 2020; $100+ run rate by YE 2021
• On-going short-term cash management actions save ~$25 to $40M per quarter
• FY 2020 CAPEX spending of $850 to $900M, capital projects remain on track
10
Leveraging Culture of Operational Excellence to Enhance Our Low-cost Position
Sustainable Cost Savings Initiatives
Plant Spend and
Operational Efficiency
• Raw material yield, cost
• Energy and waste
Supply
Chain
• Logistics optimization
• Indirect spend outsourcing
• Facility reduction
Sales & Administration
and IBO
• 3rd-party consulting
• IT efficiencies investments and global systems
Bromine
Catalyst
Corporate
Lithium
Total Expected Cost Savings
by Business Unit
~$80M(in 2020)
$120M+(run rate YE 2021)
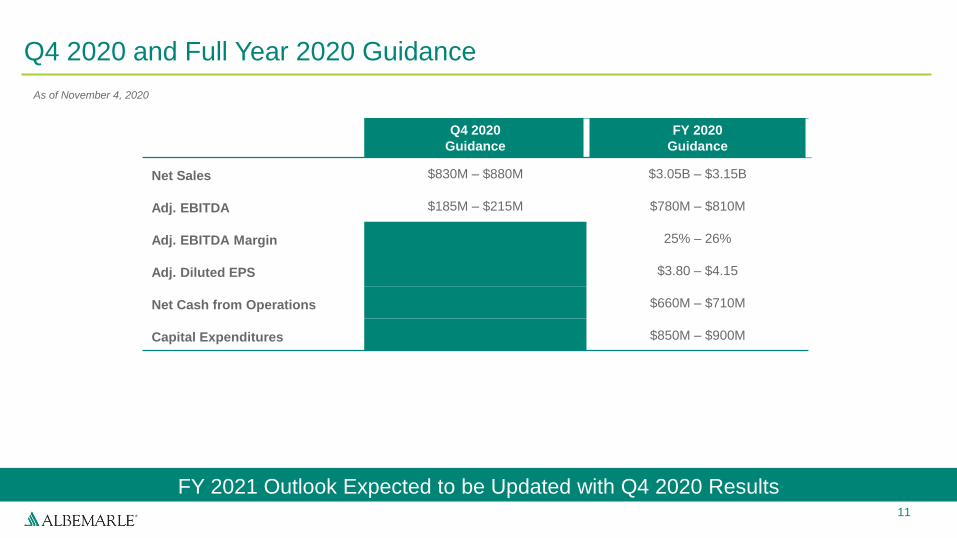
Q4 2020 and Full Year 2020 Guidance
Q4 2020
Guidance
FY 2020
Guidance
Net Sales $830M – $880M $3.05B – $3.15B
Adj. EBITDA $185M – $215M $780M – $810M
Adj. EBITDA Margin 25% – 26%
Adj. Diluted EPS $3.80 – $4.15
Net Cash from Operations $660M – $710M
Capital Expenditures $850M – $900M
As of November 4, 2020
FY 2021 Outlook Expected to be Updated with Q4 2020 Results11
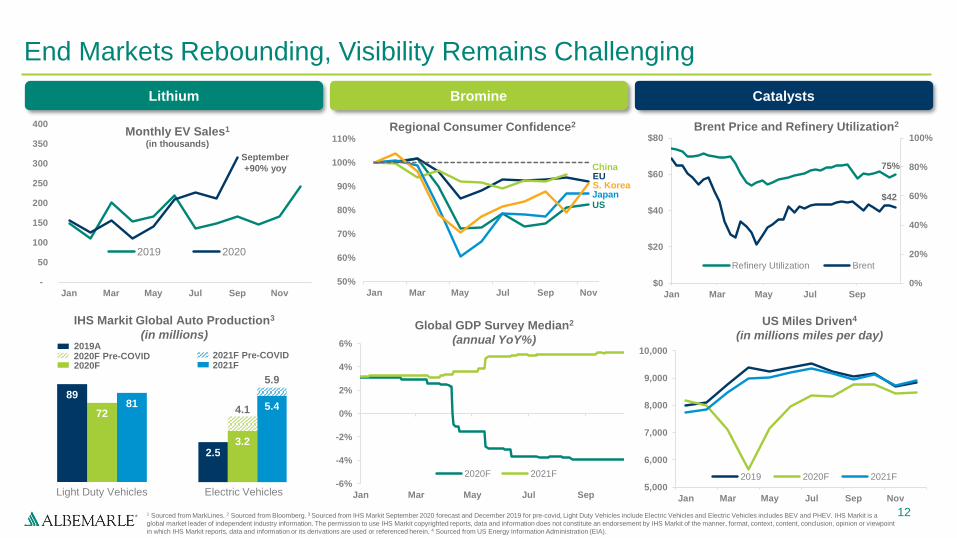
89
7281
Light Duty Vehicles
2.53.2
5.44.1
5.9
Electric Vehicles
50%
60%
70%
80%
90%
100%
110%
Jan Mar May Jul Sep Nov
Regional Consumer Confidence2
EUChina
US
S. KoreaJapan
IHS Markit Global Auto Production3
(in millions)
2020F2020F Pre-COVID2019A
2021F2021F Pre-COVID
-
50
100
150
200
250
300
350
400
Jan Mar May Jul Sep Nov
Monthly EV Sales1
(in thousands)
2019 2020
5,000
6,000
7,000
8,000
9,000
10,000
Jan Mar May Jul Sep Nov
2019 2020F 2021F
End Markets Rebounding, Visibility Remains Challenging
121 Sourced from MarkLines. 2 Sourced from Bloomberg. 3 Sourced from IHS Markit September 2020 forecast and December 2019 for pre-covid, Light Duty Vehicles include Electric Vehicles and Electric Vehicles includes BEV and PHEV. IHS Markit is a
global market leader of independent industry information. The permission to use IHS Markit copyrighted reports, data and information does not constitute an endorsement by IHS Markit of the manner, format, context, content, conclusion, opinion or viewpoint
in which IHS Markit reports, data and information or its derivations are used or referenced herein. 4 Sourced from US Energy Information Administration (EIA).
-6%
-4%
-2%
0%
2%
4%
6%
Jan Mar May Jul Sep
2020F 2021F
Global GDP Survey Median2
(annual YoY%)
75%
$42
$0
$20
$40
$60
$80
Jan Mar May Jul Sep
0%
20%
40%
60%
80%
100%
Refinery Utilization Brent
Brent Price and Refinery Utilization2
US Miles Driven4
(in millions miles per day)
September
+90% yoy
Bromine CatalystsLithium
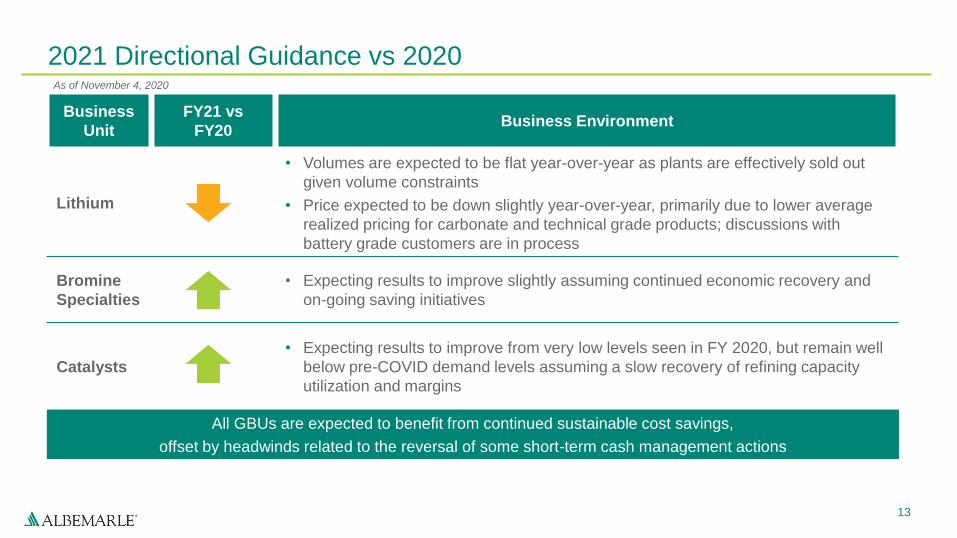
2021 Directional Guidance vs 2020
Business
Unit
FY21 vs
FY20Business Environment
Lithium
• Volumes are expected to be flat year-over-year as plants are effectively sold out
given volume constraints
• Price expected to be down slightly year-over-year, primarily due to lower average
realized pricing for carbonate and technical grade products; discussions with
battery grade customers are in process
Bromine
Specialties
• Expecting results to improve slightly assuming continued economic recovery and
on-going saving initiatives
Catalysts
• Expecting results to improve from very low levels seen in FY 2020, but remain well
below pre-COVID demand levels assuming a slow recovery of refining capacity
utilization and margins
All GBUs are expected to benefit from continued sustainable cost savings,
offset by headwinds related to the reversal of some short-term cash management actions
As of November 4, 2020
13
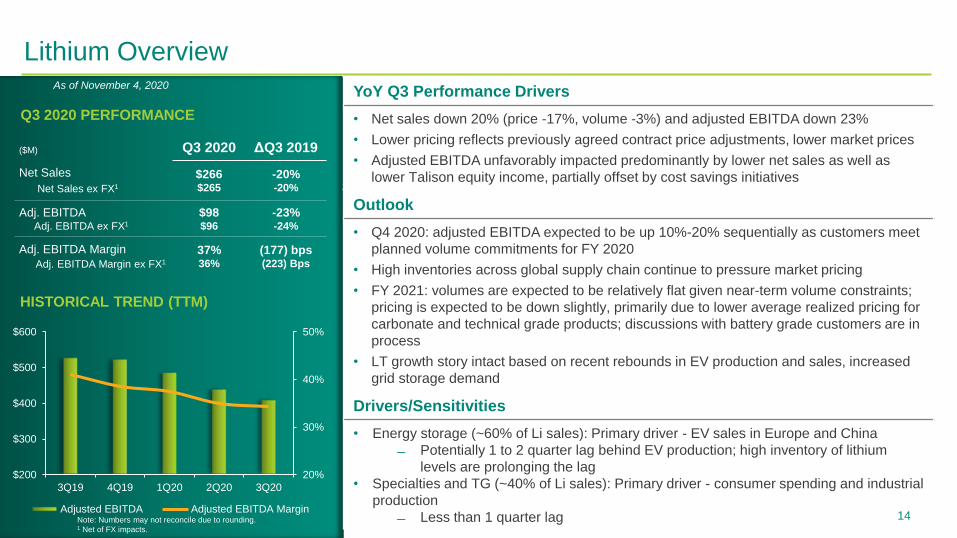
Lithium Overview
YoY Q3 Performance Drivers
• Net sales down 20% (price -17%, volume -3%) and adjusted EBITDA down 23%
• Lower pricing reflects previously agreed contract price adjustments, lower market prices
• Adjusted EBITDA unfavorably impacted predominantly by lower net sales as well as
lower Talison equity income, partially offset by cost savings initiatives
Outlook
• Q4 2020: adjusted EBITDA expected to be up 10%-20% sequentially as customers meet
planned volume commitments for FY 2020
• High inventories across global supply chain continue to pressure market pricing
• FY 2021: volumes are expected to be relatively flat given near-term volume constraints;
pricing is expected to be down slightly, primarily due to lower average realized pricing for
carbonate and technical grade products; discussions with battery grade customers are in
process
• LT growth story intact based on recent rebounds in EV production and sales, increased
grid storage demand
Drivers/Sensitivities
• Energy storage (~60% of Li sales): Primary driver - EV sales in Europe and China
Potentially 1 to 2 quarter lag behind EV production; high inventory of lithium
levels are prolonging the lag
• Specialties and TG (~40% of Li sales): Primary driver - consumer spending and industrial
production
Less than 1 quarter lag
Q3 2020 PERFORMANCE
HISTORICAL TREND (TTM)
20%
30%
40%
50%
$200
$300
$400
$500
$600
3Q19 4Q19 1Q20 2Q20 3Q20
Adjusted EBITDA Adjusted EBITDA Margin
($M) Q3 2020 ΔQ3 2019
Net Sales
Net Sales ex FX1
$266$265
-20%-20%
Adj. EBITDAAdj. EBITDA ex FX1
$98$96
-23%-24%
Adj. EBITDA Margin
Adj. EBITDA Margin ex FX1
37%36%
(177) bps(223) Bps
14Note: Numbers may not reconcile due to rounding. 1 Net of FX impacts.
As of November 4, 2020
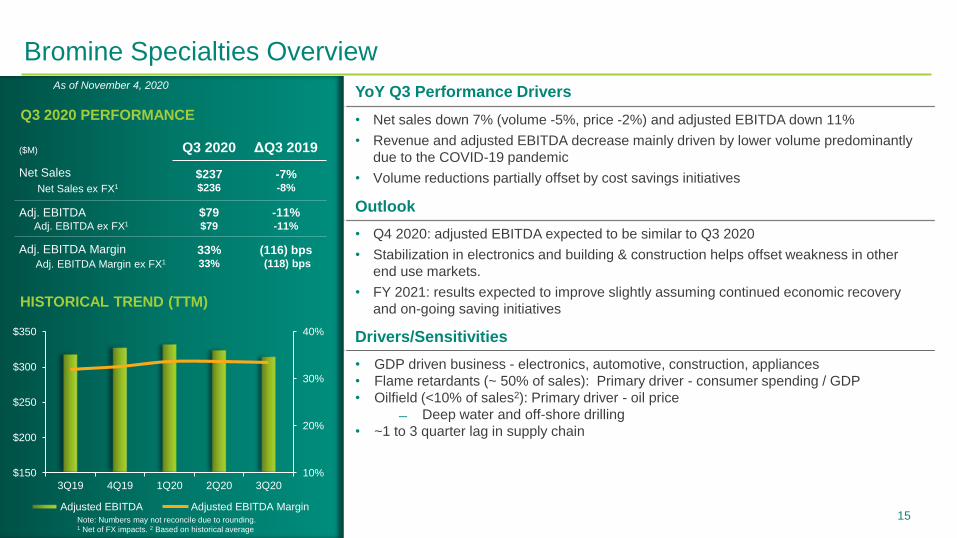
Bromine Specialties Overview
15
($M) Q3 2020 ΔQ3 2019
Net Sales
Net Sales ex FX1
$237$236
-7%-8%
Adj. EBITDAAdj. EBITDA ex FX1
$79$79
-11%-11%
Adj. EBITDA Margin
Adj. EBITDA Margin ex FX1
33%33%
(116) bps(118) bps
Q3 2020 PERFORMANCE
HISTORICAL TREND (TTM)
YoY Q3 Performance Drivers
• Net sales down 7% (volume -5%, price -2%) and adjusted EBITDA down 11%
• Revenue and adjusted EBITDA decrease mainly driven by lower volume predominantly
due to the COVID-19 pandemic
• Volume reductions partially offset by cost savings initiatives
Outlook
• Q4 2020: adjusted EBITDA expected to be similar to Q3 2020
• Stabilization in electronics and building & construction helps offset weakness in other
end use markets.
• FY 2021: results expected to improve slightly assuming continued economic recovery
and on-going saving initiatives
Drivers/Sensitivities
• GDP driven business - electronics, automotive, construction, appliances
• Flame retardants (~ 50% of sales): Primary driver - consumer spending / GDP
• Oilfield (<10% of sales2): Primary driver - oil price
Deep water and off-shore drilling
• ~1 to 3 quarter lag in supply chain
10%
20%
30%
40%
$150
$200
$250
$300
$350
3Q19 4Q19 1Q20 2Q20 3Q20
Adjusted EBITDA Adjusted EBITDA MarginNote: Numbers may not reconcile due to rounding. 1 Net of FX impacts. 2 Based on historical average
As of November 4, 2020
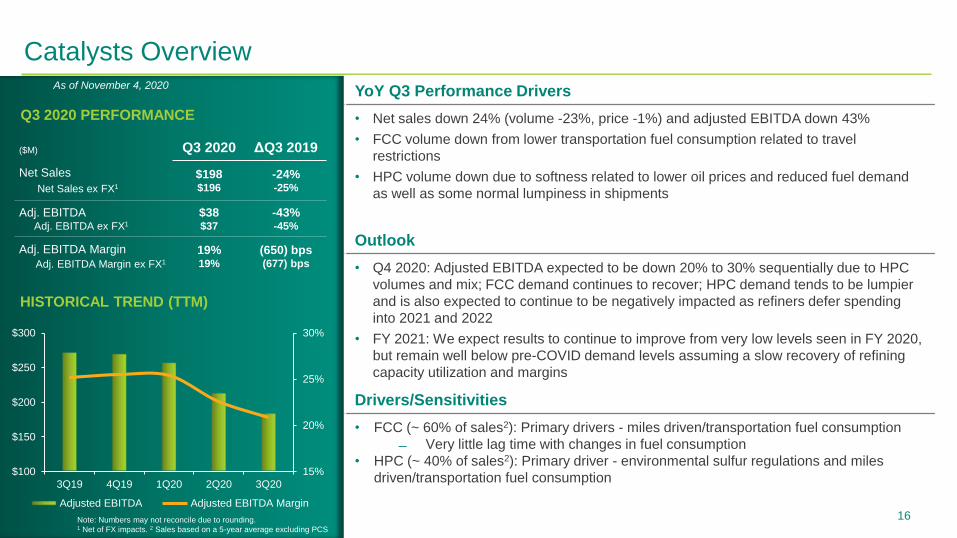
Catalysts Overview
YoY Q3 Performance Drivers
• Net sales down 24% (volume -23%, price -1%) and adjusted EBITDA down 43%
• FCC volume down from lower transportation fuel consumption related to travel
restrictions
• HPC volume down due to softness related to lower oil prices and reduced fuel demand
as well as some normal lumpiness in shipments
Outlook
• Q4 2020: Adjusted EBITDA expected to be down 20% to 30% sequentially due to HPC
volumes and mix; FCC demand continues to recover; HPC demand tends to be lumpier
and is also expected to continue to be negatively impacted as refiners defer spending
into 2021 and 2022
• FY 2021: We expect results to continue to improve from very low levels seen in FY 2020,
but remain well below pre-COVID demand levels assuming a slow recovery of refining
capacity utilization and margins
Drivers/Sensitivities
• FCC (~ 60% of sales2): Primary drivers - miles driven/transportation fuel consumption
Very little lag time with changes in fuel consumption
• HPC (~ 40% of sales2): Primary driver - environmental sulfur regulations and miles
driven/transportation fuel consumption
Q3 2020 PERFORMANCE
HISTORICAL TREND (TTM)
($M) Q3 2020 ΔQ3 2019
Net Sales
Net Sales ex FX1
$198$196
-24%-25%
Adj. EBITDAAdj. EBITDA ex FX1
$38$37
-43%-45%
Adj. EBITDA Margin
Adj. EBITDA Margin ex FX1
19%19%
(650) bps(677) bps
15%
20%
25%
30%
$100
$150
$200
$250
$300
3Q19 4Q19 1Q20 2Q20 3Q20
Adjusted EBITDA Adjusted EBITDA Margin
Note: Numbers may not reconcile due to rounding. 1 Net of FX impacts. 2 Sales based on a 5-year average excluding PCS
16
As of November 4, 2020
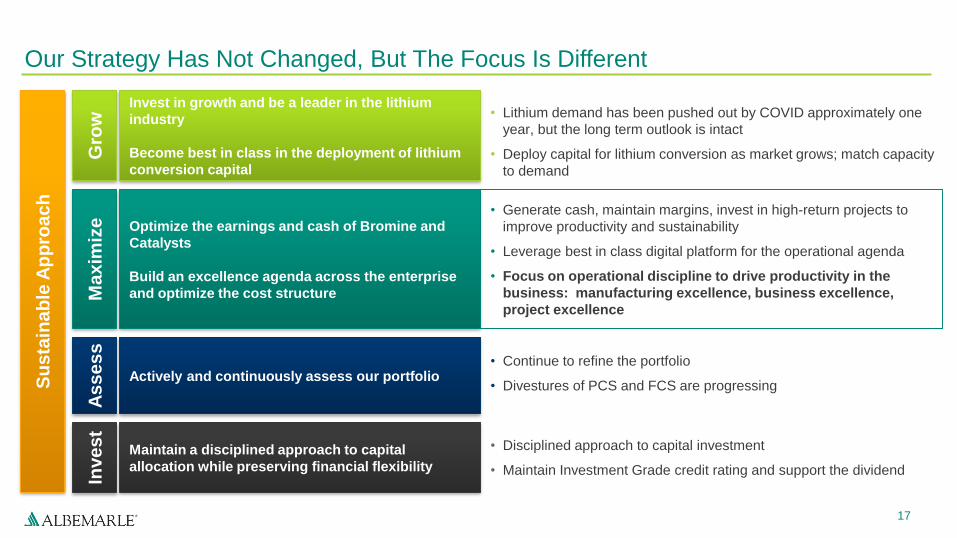
Our Strategy Has Not Changed, But The Focus Is Different
17
Maintain a disciplined approach to capital
allocation while preserving financial flexibility
Gro
wM
ax
imiz
eIn
ve
st
Invest in growth and be a leader in the lithium
industry
Become best in class in the deployment of lithium
conversion capital
• Lithium demand has been pushed out by COVID approximately one
year, but the long term outlook is intact
• Deploy capital for lithium conversion as market grows; match capacity
to demand
Optimize the earnings and cash of Bromine and
Catalysts
Build an excellence agenda across the enterprise
and optimize the cost structure
As
se
ss
Actively and continuously assess our portfolio
• Generate cash, maintain margins, invest in high-return projects to
improve productivity and sustainability
• Leverage best in class digital platform for the operational agenda
• Focus on operational discipline to drive productivity in the
business: manufacturing excellence, business excellence,
project excellence
• Continue to refine the portfolio
• Divestures of PCS and FCS are progressing
• Disciplined approach to capital investment
• Maintain Investment Grade credit rating and support the dividend
Su
sta
ina
ble
Ap
pro
ac
h
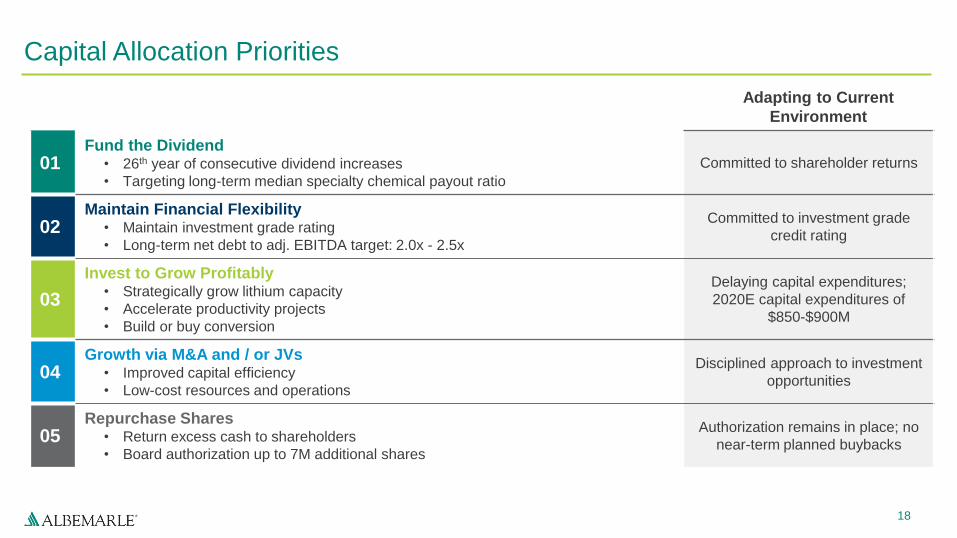
Capital Allocation Priorities
18
Adapting to Current
Environment
01Fund the Dividend
• 26th year of consecutive dividend increases
• Targeting long-term median specialty chemical payout ratio
Committed to shareholder returns
02Maintain Financial Flexibility
• Maintain investment grade rating
• Long-term net debt to adj. EBITDA target: 2.0x - 2.5x
Committed to investment grade
credit rating
03
Invest to Grow Profitably• Strategically grow lithium capacity
• Accelerate productivity projects
• Build or buy conversion
Delaying capital expenditures;
2020E capital expenditures of
$850-$900M
04Growth via M&A and / or JVs
• Improved capital efficiency
• Low-cost resources and operations
Disciplined approach to investment
opportunities
05Repurchase Shares
• Return excess cash to shareholders
• Board authorization up to 7M additional shares
Authorization remains in place; no
near-term planned buybacks
19
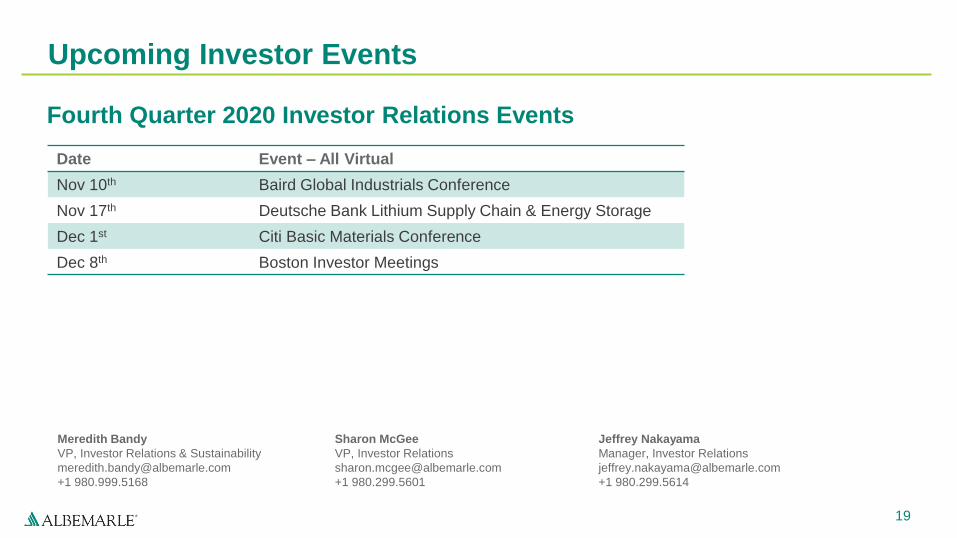
Upcoming Investor Events
Fourth Quarter 2020 Investor Relations Events
Meredith Bandy
VP, Investor Relations & Sustainability
+1 980.999.5168
Sharon McGee
VP, Investor Relations
+1 980.299.5601
Jeffrey Nakayama
Manager, Investor Relations
+1 980.299.5614
Date Event – All Virtual
Nov 10th Baird Global Industrials Conference
Nov 17th Deutsche Bank Lithium Supply Chain & Energy Storage
Dec 1st Citi Basic Materials Conference
Dec 8th Boston Investor Meetings

AppendixNon-GAAP Reconciliations
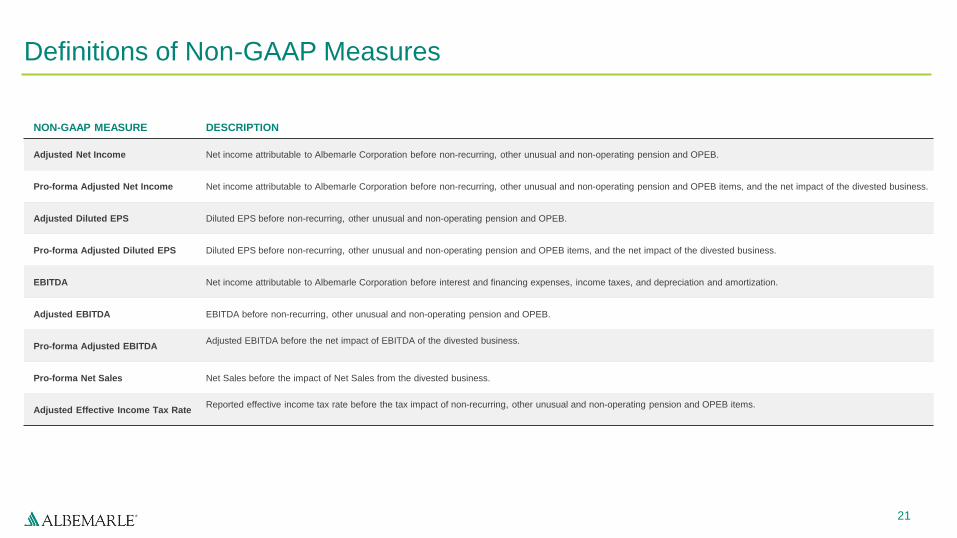
Definitions of Non-GAAP Measures
21
NON-GAAP MEASURE DESCRIPTION
Adjusted Net Income Net income attributable to Albemarle Corporation before non-recurring, other unusual and non-operating pension and OPEB.
Pro-forma Adjusted Net Income Net income attributable to Albemarle Corporation before non-recurring, other unusual and non-operating pension and OPEB items, and the net impact of the divested business.
Adjusted Diluted EPS Diluted EPS before non-recurring, other unusual and non-operating pension and OPEB.
Pro-forma Adjusted Diluted EPS Diluted EPS before non-recurring, other unusual and non-operating pension and OPEB items, and the net impact of the divested business.
EBITDA Net income attributable to Albemarle Corporation before interest and financing expenses, income taxes, and depreciation and amortization.
Adjusted EBITDA EBITDA before non-recurring, other unusual and non-operating pension and OPEB.
Pro-forma Adjusted EBITDA Adjusted EBITDA before the net impact of EBITDA of the divested business.
Pro-forma Net Sales Net Sales before the impact of Net Sales from the divested business.
Adjusted Effective Income Tax RateReported effective income tax rate before the tax impact of non-recurring, other unusual and non-operating pension and OPEB items.
22
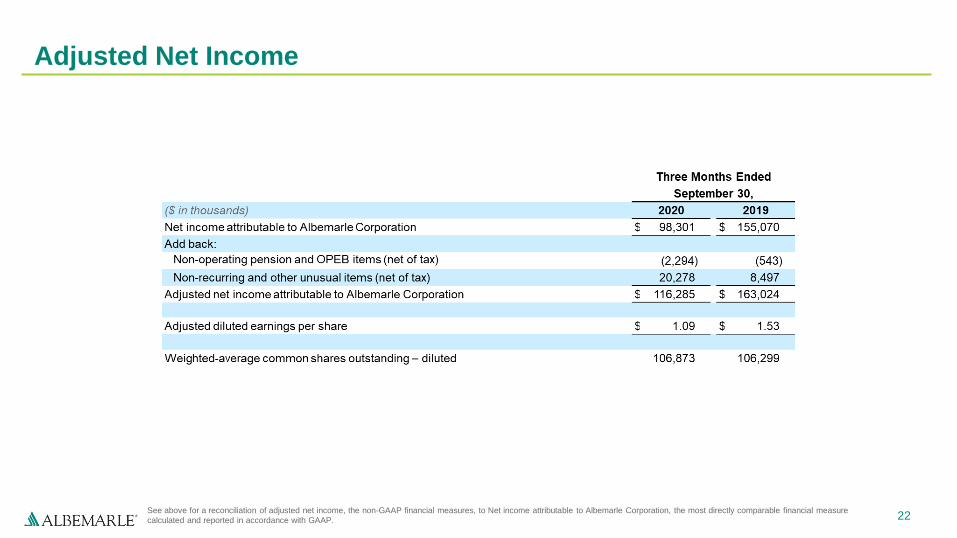
Adjusted Net Income
See above for a reconciliation of adjusted net income, the non-GAAP financial measures, to Net income attributable to Albemarle Corporation, the most directly comparable financial measure
calculated and reported in accordance with GAAP.
23
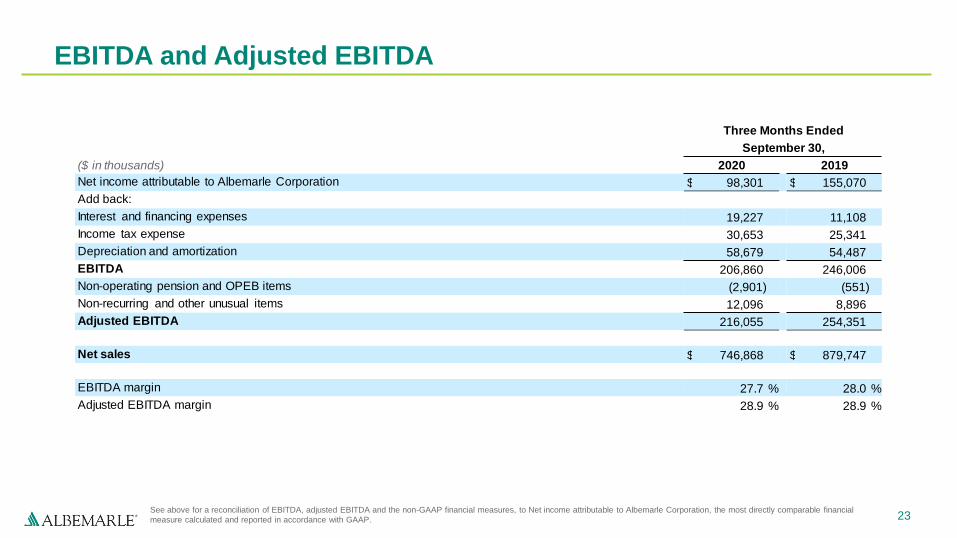
EBITDA and Adjusted EBITDA
See above for a reconciliation of EBITDA, adjusted EBITDA and the non-GAAP financial measures, to Net income attributable to Albemarle Corporation, the most directly comparable financial
measure calculated and reported in accordance with GAAP.
Three Months Ended
September 30,
($ in thousands) 2020 2019
Net income attributable to Albemarle Corporation $ 98,301 $ 155,070
Add back:
Interest and financing expenses 19,227 11,108
Income tax expense 30,653 25,341
Depreciation and amortization 58,679 54,487
EBITDA 206,860 246,006
Non-operating pension and OPEB items (2,901) (551)
Non-recurring and other unusual items 12,096 8,896
Adjusted EBITDA 216,055 254,351
Net sales $ 746,868 $ 879,747
EBITDA margin 27.7 % 28.0 %
Adjusted EBITDA margin 28.9 % 28.9 %
24
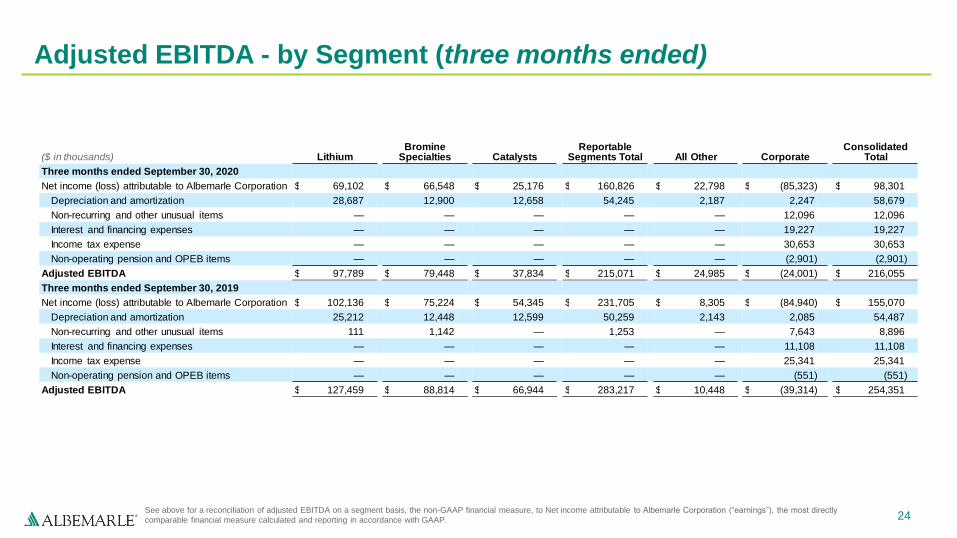
Adjusted EBITDA - by Segment (three months ended)
See above for a reconciliation of adjusted EBITDA on a segment basis, the non-GAAP financial measure, to Net income attributable to Albemarle Corporation (“earnings”), the most directly
comparable financial measure calculated and reporting in accordance with GAAP.
($ in thousands) LithiumBromine
Specialties CatalystsReportable
Segments Total All Other CorporateConsolidated
Total
Three months ended September 30, 2020
Net income (loss) attributable to Albemarle Corporation $ 69,102 $ 66,548 $ 25,176 $ 160,826 $ 22,798 $ (85,323) $ 98,301
Depreciation and amortization 28,687 12,900 12,658 54,245 2,187 2,247 58,679
Non-recurring and other unusual items — — — — — 12,096 12,096
Interest and financing expenses — — — — — 19,227 19,227
Income tax expense — — — — — 30,653 30,653
Non-operating pension and OPEB items — — — — — (2,901) (2,901)
Adjusted EBITDA $ 97,789 $ 79,448 $ 37,834 $ 215,071 $ 24,985 $ (24,001) $ 216,055
Three months ended September 30, 2019
Net income (loss) attributable to Albemarle Corporation $ 102,136 $ 75,224 $ 54,345 $ 231,705 $ 8,305 $ (84,940) $ 155,070
Depreciation and amortization 25,212 12,448 12,599 50,259 2,143 2,085 54,487
Non-recurring and other unusual items 111 1,142 — 1,253 — 7,643 8,896
Interest and financing expenses — — — — — 11,108 11,108
Income tax expense — — — — — 25,341 25,341
Non-operating pension and OPEB items — — — — — (551) (551)
Adjusted EBITDA $ 127,459 $ 88,814 $ 66,944 $ 283,217 $ 10,448 $ (39,314) $ 254,351
25
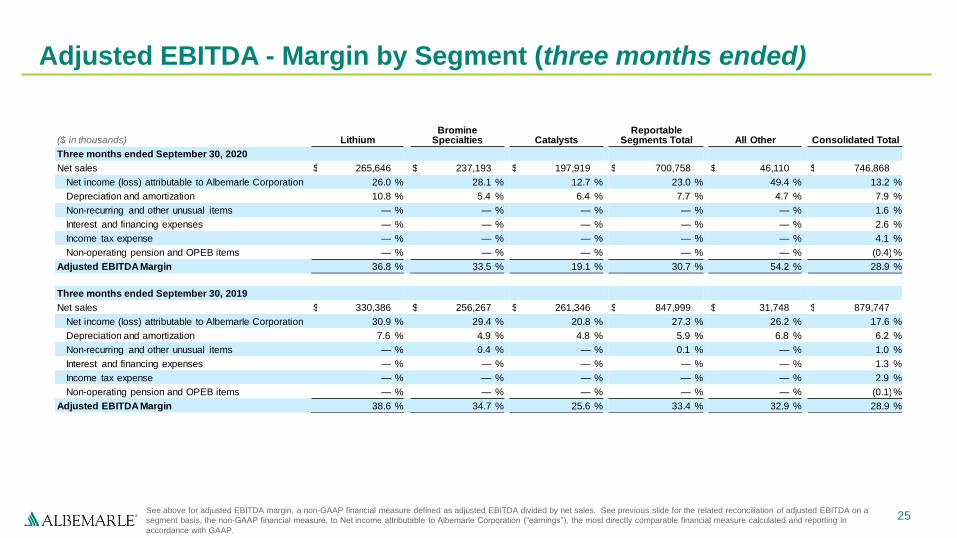
Adjusted EBITDA - Margin by Segment (three months ended)
See above for adjusted EBITDA margin, a non-GAAP financial measure defined as adjusted EBITDA divided by net sales. See previous slide for the related reconciliation of adjusted EBITDA on a
segment basis, the non-GAAP financial measure, to Net income attributable to Albemarle Corporation (“earnings”), the most directly comparable financial measure calculated and reporting in
accordance with GAAP.
($ in thousands) LithiumBromine
Specialties CatalystsReportable
Segments Total All Other Consolidated Total
Three months ended September 30, 2020
Net sales $ 265,646 $ 237,193 $ 197,919 $ 700,758 $ 46,110 $ 746,868
Net income (loss) attributable to Albemarle Corporation 26.0 % 28.1 % 12.7 % 23.0 % 49.4 % 13.2 %
Depreciation and amortization 10.8 % 5.4 % 6.4 % 7.7 % 4.7 % 7.9 %
Non-recurring and other unusual items — % — % — % — % — % 1.6 %
Interest and financing expenses — % — % — % — % — % 2.6 %
Income tax expense — % — % — % — % — % 4.1 %
Non-operating pension and OPEB items — % — % — % — % — % (0.4)%
Adjusted EBITDA Margin 36.8 % 33.5 % 19.1 % 30.7 % 54.2 % 28.9 %
Three months ended September 30, 2019
Net sales $ 330,386 $ 256,267 $ 261,346 $ 847,999 $ 31,748 $ 879,747
Net income (loss) attributable to Albemarle Corporation 30.9 % 29.4 % 20.8 % 27.3 % 26.2 % 17.6 %
Depreciation and amortization 7.6 % 4.9 % 4.8 % 5.9 % 6.8 % 6.2 %
Non-recurring and other unusual items — % 0.4 % — % 0.1 % — % 1.0 %
Interest and financing expenses — % — % — % — % — % 1.3 %
Income tax expense — % — % — % — % — % 2.9 %
Non-operating pension and OPEB items — % — % — % — % — % (0.1)%
Adjusted EBITDA Margin 38.6 % 34.7 % 25.6 % 33.4 % 32.9 % 28.9 %
26
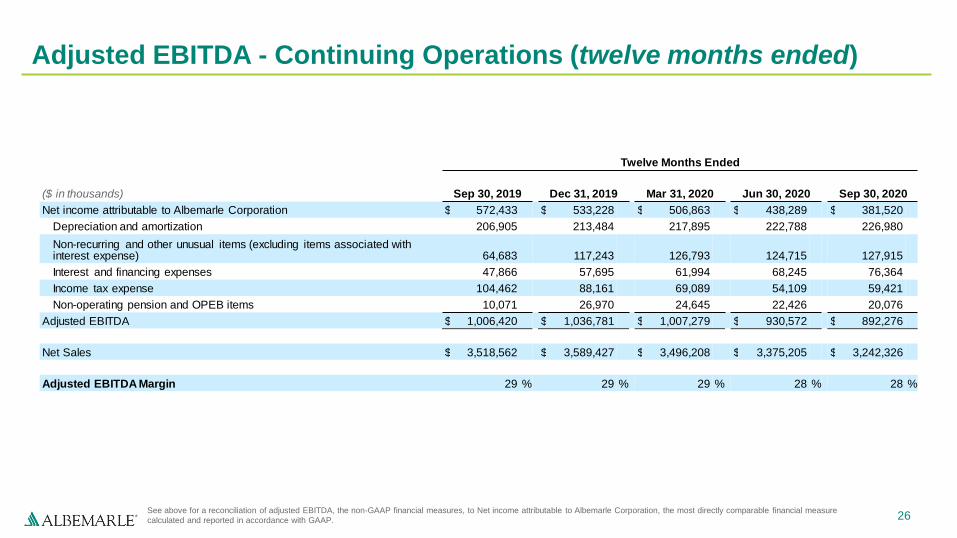
Adjusted EBITDA - Continuing Operations (twelve months ended)
See above for a reconciliation of adjusted EBITDA, the non-GAAP financial measures, to Net income attributable to Albemarle Corporation, the most directly comparable financial measure
calculated and reported in accordance with GAAP.
Twelve Months Ended
($ in thousands) Sep 30, 2019 Dec 31, 2019 Mar 31, 2020 Jun 30, 2020 Sep 30, 2020
Net income attributable to Albemarle Corporation $ 572,433 $ 533,228 $ 506,863 $ 438,289 $ 381,520
Depreciation and amortization 206,905 213,484 217,895 222,788 226,980
Non-recurring and other unusual items (excluding items associated with interest expense) 64,683 117,243 126,793 124,715 127,915
Interest and financing expenses 47,866 57,695 61,994 68,245 76,364
Income tax expense 104,462 88,161 69,089 54,109 59,421
Non-operating pension and OPEB items 10,071 26,970 24,645 22,426 20,076
Adjusted EBITDA $ 1,006,420 $ 1,036,781 $ 1,007,279 $ 930,572 $ 892,276
Net Sales $ 3,518,562 $ 3,589,427 $ 3,496,208 $ 3,375,205 $ 3,242,326
Adjusted EBITDA Margin 29 % 29 % 29 % 28 % 28 %
27
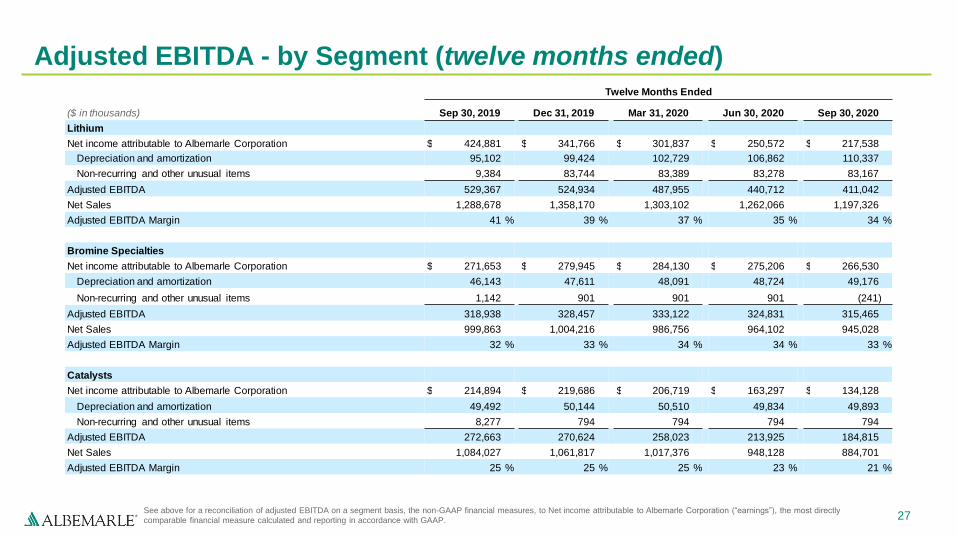
Adjusted EBITDA - by Segment (twelve months ended)
See above for a reconciliation of adjusted EBITDA on a segment basis, the non-GAAP financial measures, to Net income attributable to Albemarle Corporation (“earnings”), the most directly
comparable financial measure calculated and reporting in accordance with GAAP.
Twelve Months Ended
($ in thousands) Sep 30, 2019 Dec 31, 2019 Mar 31, 2020 Jun 30, 2020 Sep 30, 2020
Lithium
Net income attributable to Albemarle Corporation $ 424,881 $ 341,766 $ 301,837 $ 250,572 $ 217,538
Depreciation and amortization 95,102 99,424 102,729 106,862 110,337
Non-recurring and other unusual items 9,384 83,744 83,389 83,278 83,167
Adjusted EBITDA 529,367 524,934 487,955 440,712 411,042
Net Sales 1,288,678 1,358,170 1,303,102 1,262,066 1,197,326
Adjusted EBITDA Margin 41 % 39 % 37 % 35 % 34 %
Bromine Specialties
Net income attributable to Albemarle Corporation $ 271,653 $ 279,945 $ 284,130 $ 275,206 $ 266,530
Depreciation and amortization 46,143 47,611 48,091 48,724 49,176
Non-recurring and other unusual items 1,142 901 901 901 (241)
Adjusted EBITDA 318,938 328,457 333,122 324,831 315,465
Net Sales 999,863 1,004,216 986,756 964,102 945,028
Adjusted EBITDA Margin 32 % 33 % 34 % 34 % 33 %
Catalysts
Net income attributable to Albemarle Corporation $ 214,894 $ 219,686 $ 206,719 $ 163,297 $ 134,128
Depreciation and amortization 49,492 50,144 50,510 49,834 49,893
Non-recurring and other unusual items 8,277 794 794 794 794
Adjusted EBITDA 272,663 270,624 258,023 213,925 184,815
Net Sales 1,084,027 1,061,817 1,017,376 948,128 884,701
Adjusted EBITDA Margin 25 % 25 % 25 % 23 % 21 %
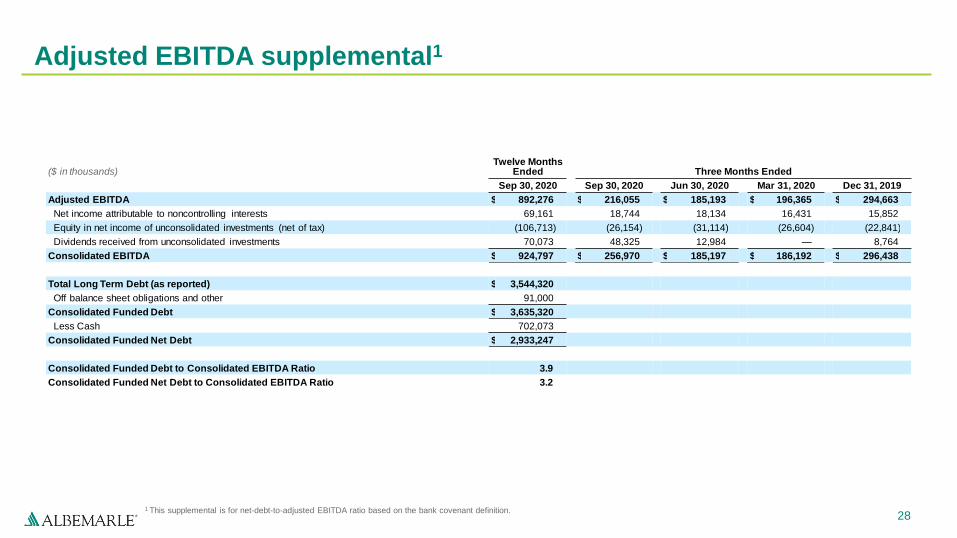
28
Adjusted EBITDA supplemental1
1 This supplemental is for net-debt-to-adjusted EBITDA ratio based on the bank covenant definition.
Twelve Months Ended($ in thousands) Three Months Ended
Sep 30, 2020 Sep 30, 2020 Jun 30, 2020 Mar 31, 2020 Dec 31, 2019
Adjusted EBITDA $ 892,276 $ 216,055 $ 185,193 $ 196,365 $ 294,663
Net income attributable to noncontrolling interests 69,161 18,744 18,134 16,431 15,852
Equity in net income of unconsolidated investments (net of tax) (106,713) (26,154) (31,114) (26,604) (22,841)
Dividends received from unconsolidated investments 70,073 48,325 12,984 — 8,764
Consolidated EBITDA $ 924,797 $ 256,970 $ 185,197 $ 186,192 $ 296,438
Total Long Term Debt (as reported) $ 3,544,320
Off balance sheet obligations and other 91,000
Consolidated Funded Debt $ 3,635,320
Less Cash 702,073
Consolidated Funded Net Debt $ 2,933,247
Consolidated Funded Debt to Consolidated EBITDA Ratio 3.9
Consolidated Funded Net Debt to Consolidated EBITDA Ratio 3.2
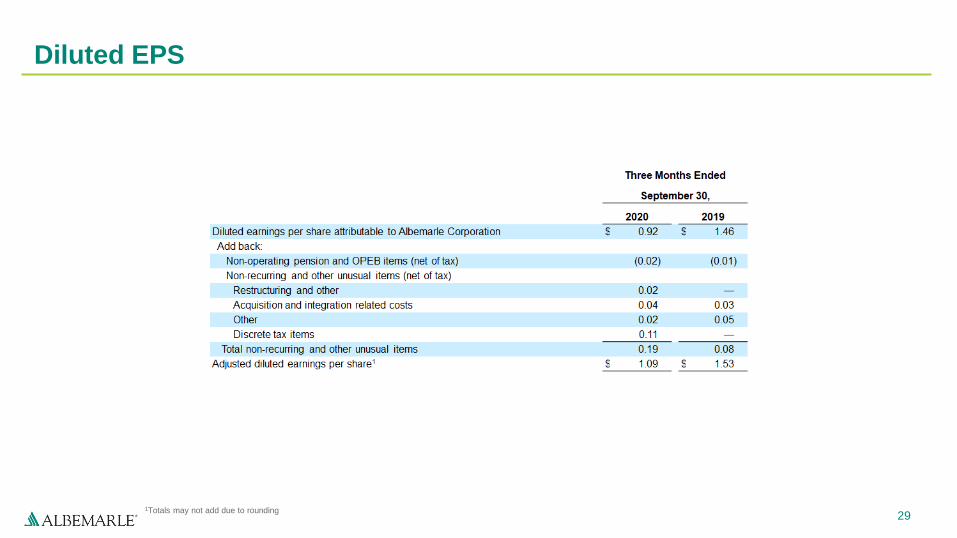
29
Diluted EPS
1Totals may not add due to rounding
30
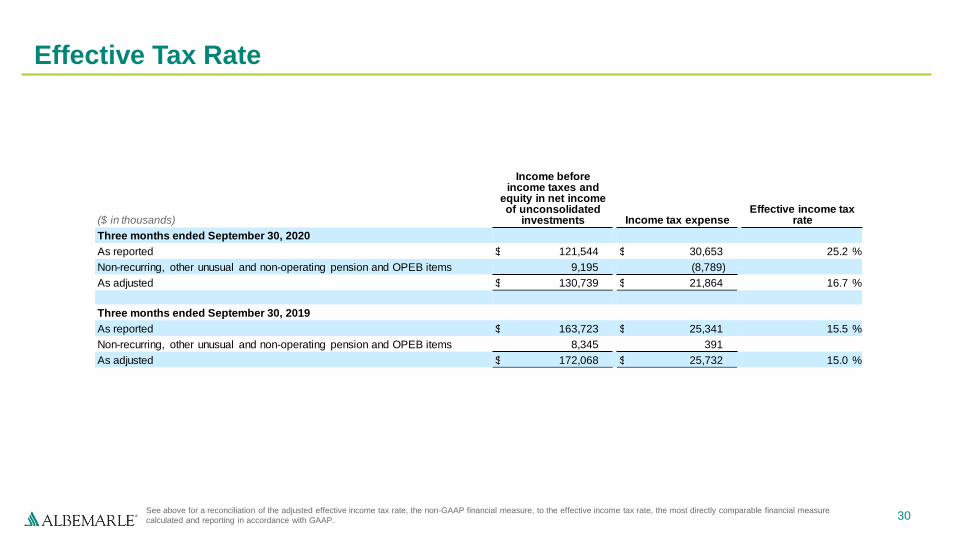
Effective Tax Rate
See above for a reconciliation of the adjusted effective income tax rate, the non-GAAP financial measure, to the effective income tax rate, the most directly comparable financial measure
calculated and reporting in accordance with GAAP.
($ in thousands)
Income before income taxes and
equity in net income of unconsolidated
investments Income tax expense Effective income tax
rate
Three months ended September 30, 2020
As reported $ 121,544 $ 30,653 25.2 %
Non-recurring, other unusual and non-operating pension and OPEB items 9,195 (8,789)
As adjusted $ 130,739 $ 21,864 16.7 %
Three months ended September 30, 2019
As reported $ 163,723 $ 25,341 15.5 %
Non-recurring, other unusual and non-operating pension and OPEB items 8,345 391
As adjusted $ 172,068 $ 25,732 15.0 %
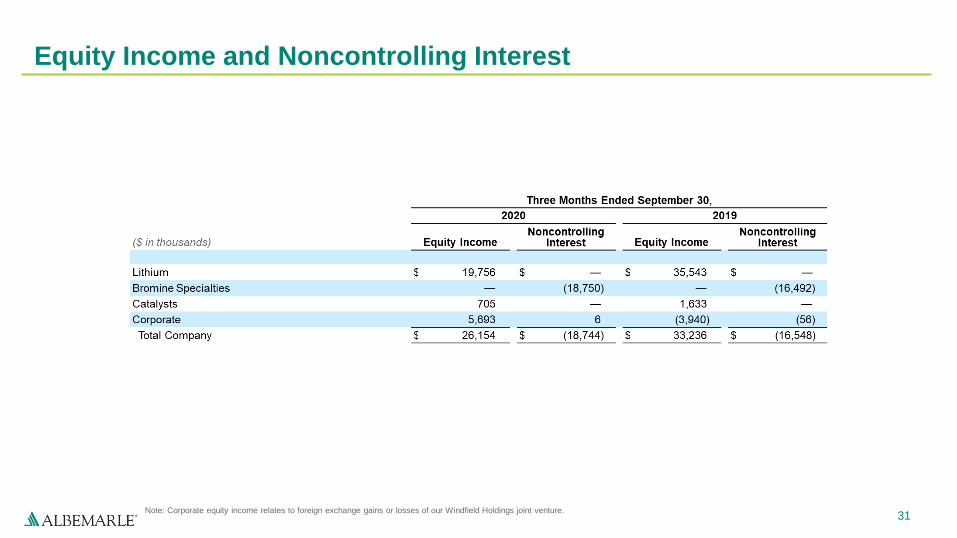
31
Equity Income and Noncontrolling Interest
Note: Corporate equity income relates to foreign exchange gains or losses of our Windfield Holdings joint venture.

32
www.albemarle.com