Embed Size (px)
Citation preview
1
ALBA SE
Mid-year Financial Report ofALBA SE and its Affiliated
Subsidiaries (Group)
for the period January 1, 2016, through June 30, 2016
ALBA SE AG – Stollwerckstraße 9a – 51149 Cologne – Phone: +49 2203 9147-0 – Fax: +49 2203 9147-1394E-Mail: [email protected] – Internet: www.alba-se.com
2
Table of Contents
The Share .................................................................................................................................... 3
Interim Group Management Report
A. Basis of the Group ............................................................................................................ 4B. Economic Report .............................................................................................................. 5B.1. Sector-Related Framework Conditions.............................................................................. 5B.2. Changes in the Legal Framework Conditions.................................................................... 6B.3. Course of Business........................................................................................................... 6B.3.1. Steel and Metals Recycling............................................................................................... 6B.3.2. Services............................................................................................................................ 7C. Situation............................................................................................................................ 8C.1. Earnings Situation............................................................................................................. 8C.2. Assets Situation ................................................................................................................ 9C.3. Financial Situation........................................................................................................... 10D. Events after the Balance Sheet Date .............................................................................. 11E. Risks and Opportunities Report ...................................................................................... 11E.1. Opportunities .................................................................................................................. 11E.2. Risks............................................................................................................................... 12F. Additional Disclosures..................................................................................................... 12F.1. Administrative Board....................................................................................................... 12F.2 Employees ...................................................................................................................... 12F.3 Environment and Sustainability ....................................................................................... 13G. Outlook ........................................................................................................................... 13G.1. Segment Development.................................................................................................... 13G.2. Group Development........................................................................................................ 15
Consolidated Interim Financial Statements
Consolidated Balance Sheet ...................................................................................................... 16Consolidated Income Statement................................................................................................. 18Exhibit of Income and Expense Recorded in Group Equity......................................................... 19Consolidated Statement of Changes in Equity............................................................................ 20Consolidated Cash Flow Statement............................................................................................ 22Condensed Notes to the Consolidated Interim Financial Statements.......................................... 23
Contacts..................................................................................................................................... 39
3
The share
ALBA Group plc & Co. KG, as parent of ALBA SE, and its affiliated
subsidiaries comprise the ALBA Group. The ALBA Group belongs to one of
the ten largest environmental services, recycling and secondary resource
trading companies worldwide. The Group’s business activities prevent the
release of 6.6 million tonnes of environmentally harmful carbon emissions
every year.
ALBA Group plc & Co. KG is the largest shareholder of ALBA SE. Voting
rights of ALBA Group plc & Co. KG, Berlin, are to be attributed to Dr. Axel
Schweitzer and Dr. Eric Schweitzer in accordance with Section 22,
paragraph 1, clause 1 (1) of the German Securities Trading Act via ALBA
Finance plc & Co. KGaA, ALBA Finance Holding plc, ALBA Group Europe
plc, Alpsee Ltd. and Eibsee Ltd., each with statutory headquarters in
London, UK, and administrative headquarters in Berlin. As of December 31,
2015, these voting rights were composed of 9,135,777 shares (92.843 %).
The remainder 7.157% are in free float, no holdings exceed the threshold of
3% or more.
The markets started 2016 unexpectedly weak and leading indices suffered
severe losses in the first weeks of trading. Worries about weakness in the
Chinese economy were a problem for stock markets around the world and
created the weakest start for Germany's DAX index since 1988. After the
markets reached a low point in early February, the central banks took steps
to calm the markets. They then experienced a broad recovery. Improved
economic data from China and higher oil prices helped further improve
sentiment. The leading indices expanded significantly on gains in the
second quarter. Investor uncertainty gradually increased as the vote on a
possible UK exit from the European Union loomed on June 23rd, generating
increased fluctuations in share prices. The British vote to leave the EU
shocked global equity markets and they reacted to the news with massive
price drops. Though financial markets were able to recover from their low
points during the final days of trading, the semi-annual results were still
disappointing. The leading German index, the DAX, fell by 9.89%, while the
MDAX dropped 4.48% and the SDAX was 3.48% lower. The German
technology index TecDAX was one of the biggest losers, falling 12.55% in
the first half of 2016.
The ALBA SE shares remained relatively unfazed by the general market
trends. At the start of XETRA trading on January 4, 2016, ALBA SE shares
were valued at EUR 51.98. The highest price in the first half was EUR 53.22
euros; the lowest price was EUR 47.39. At the end of the reporting period
on June 30, 2016, the share ALBA SE share was selling for EUR 48.20.
4
Interim Group Management Report
A. Basis of the Group
ALBA SE and the affiliated subsidiary companies are included in the
consolidated interim financial statement for ALBA Group plc & Co (ALBA
Group KG). At the ALBA Group KG level and those of the affiliated
subsidiary companies (ALBA Group) is the home for treasury, taxes and
corporate communications departments. Their duties and services extend
to ALBA SE and the affiliated subsidiaries.
ALBA SE and ALBA Group KG have a control and profit-and-loss transfer
agreement. Under the agreement ALBA Group KG any external shareholder
of ALBA SE bearer shares with a notional share in capital stock of EUR 2.60
per share for cash compensation of EUR 46.38 for each ALBA SE share
(cash compensation offer) upon said shareholder's request.
Those external ALBA SE shareholders preferring not to accept the cash
compensation are entitled to receive a recurring payment for the duration of
the agreement (equalisation payment). The equalisation payment amounts
to EUR 3.94 gross per ALBA SE share for each full fiscal year minus
corporate taxes plus a solidarity surcharge according to the rate applicable
to these taxes for the relevant fiscal year.
A legal challenge under the German Award Proceedings Act for cash
compensation and equalisation payment is pending at the District Court in
Cologne. On April 20, 2012, the District Court in Cologne heard the plea
from the claimant and the respondent (ALBA Group KG) and on June 15,
2012 decided to order a new expert opinion, which included an independent
calculation of the company capitalization taking into account the
"appropriate consideration of the relevant clarifications provided" by no later
than the middle of 2014. After objections of bias on the part of a claimant
and subsequent dismissal by the court, the expert appointed by the District
Court in Cologne went to work in late 2013. The expert submitted an
assessment to determine the company value of the ALBA SE. The claimant
and respondent raised objections to the assessment. The District Court in
Cologne requested said expert provide a supplemental assessment, which
was submitted in May 2016. The expert came to the conclusion that the
claimant and respondent objections were irrelevant and thus upheld the
original findings of the assessment. The Expert's statement makes it
possible that a first instance decision shall be made in the current fiscal year.
5
Effective as of 1 January 2016 ALBA SE sold all shares in INTERSEROH
Management GmbH to ALBA Group KG. The disposal of the company had
no material impact on the asset, financial and earnings status of the ALBA
SE Group.
B. Economic Report
B.1. Sector-Related Framework Conditions
Steel and Metals Recycling Segment
Global raw steel production fell compared to production in the previous year
by 1.9%. Production in the EU fell by 6.1% and 1.2% in Germany. While
German steel production with iron ore declined by 0.1%, electric furnace
steel production - which primarily uses scrap steel - dropped by 3.1%. China
failed to throttle steel production despite declines in domestic demand in the
first half of 2016. Chinese steel production actually rose to an all-time high
in April of the reporting period according to information the People's
Republic National Statistics Office issued in May. The country then placed
the excess production on the world market. In the first half year, China
shipped more steel than ever. According to the German Steel Federation,
China supports their steel industry with state subsidized raw materials and
energy.
Turkey - the world's largest consumer of steel scrap - generated additional
demand from March to early May causing a price increase in those months
to 96.50 a tonne, German imports of scrap then dropped to zero in the
second week of May and the price for leading scrap type 2 fell to EUR 62.30
a tonne in June.
According to the Bundesvereinigung Deutscher Stahlrecycling- und
Entsorgungsunternehmen e.V. (Federation of German Steel Recycling and
Disposal Companies: BDSV), the average sales price of lead scrap type 2
was EUR 166.60 a tonne in the first six months of the year and was thus 50
euros less than the average for the same period in the previous year of EUR
216.60 a tonne.
The economic situation in the German metal recycling industry and the
German metal trading industry was dominated by huge uncertainty in the
first half of the year according to the Verband Deutscher Metallhändler e.V.
(German Metal Traders Association: VDM).
The prices for non-ferrous metals also fell in the same period. The average
price for aluminium sank by 13% to USD 1,544 per tonne, while the average
price for copper tonne fell 20.7% to USD 4,701 and 36.6% for a tonne of
nickel to USD 8,662.
6
Services segment
Private consumption in the first two quarters of 2016 drove growth.
The transport packaging business remained highly competitive with
enormous pressure on profit margins.
The seventh revision to the German packaging ordinance also had an
impact in the first six months of the current fiscal year. The elimination of the
self-take-back requirement and the significant increase in requirements
placed on industrial solutions helped stabilise licensed volumes in 2015.
The prices for recycles paper in the reporting period increased by 14.5% to
44.7% on average compared to the average prices for the first half of 2015,
while the price for foils fell by 11.3% to 46.4% compared to the median value
for the same period in the previous year. The average price for transparent
PET fell by 45% compared to the same period in the previous year, coloured
PET by 77.8%.
In addition, the service segment saw an impact from increased prices for
thermal processing.
B.2. Changes in the Legal Framework Conditions
No changes in the legal framework were made in the reporting period.
B.3. Course of BusinessB.3.1. Steel and Metals Recycling
The extremely difficult economic conditions presented in B.1 will have an
impact on the steel and metals recycling segment.
Both ferrous and non-ferrous sales volumes in the first two quarters in 2016
were below those for same period for the previous year. 695 thousand
tonnes (previous year: 1,118 thousand tonnes) of ferrous metals were sold,
non-ferrous metals had 123 thousand tonnes changing hands (previous
year: 183 thousand tonnes). When the previous year figures are adjusted
for portfolio changes the ferrous metal sales volume was 935 thousand
tonnes and 177 thousand tonnes for non-ferrous metals.
The price collapse and weak demand caused sales revenues to fall by EUR
304.3 million to EUR 317.1 million (-49.0%).
7
Despite the difficult market situation, we made minimal improvements to the
margins. The fall in sales volumes led to a significant reduction in the gross
margin. In addition, revenue generated from disposals to improve the
portfolio increased over the first half year 2015. The extraordinary costs
were compensated with savings for outgoing freight and transport costs and
storage costs of EUR 7.5 million and personnel costs of EUR 3.9 million.
Overall, EBITDA fell EUR 10.7 million to EUR 2.5 million.
EBT recorded a 7.2 million decline to negative EUR -2.0 million compared
to the same period in the previous year. The effects described above
contrast with lower depreciation and interest expenses compared to the
same period in the previous year.
Investments of EUR 1.6 million were lower than the investments for the first
six months of 2015 (EUR 3.1 million). Investment was particularly modest
for technical equipment and machines and fleet due to the uncertainty
starting in the second half of 2015.
B.3.2. Services
Sales revenue from transport packaging sank only moderately in the first
half of 2016 compared to the same period in the previous year. Due to
severe competitive pressures, the price reductions provided to customers
contrast with new contract and positive developments in the order book.
Income reductions from reduced foil prices were compensated with higher
sale prices in the cardboard/paper segment.
The sales packaging business remained stable in the first half of 2016
compared to the period in the previous year. The market share from the
Interseroh dual system increased slightly.
The income from the Recycling Solution Interseroh (RSI) increased
marginally, which resulted from the higher order volumes from existing
customers.
Overall, sales revenue from the services segment increased in the first two
quarters of 2016 by EUR 174.4 million compared to the turnover for the
same period in the previous year (previous year: EUR 172.1 million).
EBITDA was EUR 13.5 million, EBT was EUR 13.8 million and thus greater
than for the previous year (11.5 million and EUR 10.8 million). The cause
was primarily non-business model based extraordinary income from
operations, which contrast with the somewhat higher commission expenses.
The investment volume in the first half of 2016 was EUR 1.2 million and thus
higher than the same period in the previous year (EUR 0.9 million).
8
C. Situation
In January 2016 ALBA SE was informed that the ALBA Group KG - as the
parent company of ALBA SE - intends issue statements on the companies
in the services segment along with the two companies in the steel and
metals recycling segment exclusive of ALBA SE to the ALBA Group KG or
another company within the ALBA Group. The impact of the steps on the
asset, financial and earnings situation at ALBA SE Group can be found in
the supplementary report in the 2015 annual report. No instructions have
been issued thus far. At the time of issuance, the disposal income and time
remain uncertain. Therefore, the financial impact on the consolidated interim
financial statement cannot be reliably estimated.
C.1. Earnings Situation
In keeping with expectations, sales declined significantly in the first half year
compared to the same period in the previous year by EUR 301.5 million (-
38.0%) to EUR 491.1 million. In the services segment, sales revenue
increased by EUR 2.3 million (+1.4%) to EUR 174.4 million and was thus
higher than in the previous year while the steel and metals recycling
segment suffered a significant drop in revenue. In this segment the sales
revenue fell by EUR 304.3 million (-49.0%) to EUR 317.1 million, specifically
due to the low prices and low quantities compared to the first six months of
2015.
Material expenses sank 41.9% compared to the first half of 2015 in keeping
with sales trends.
Other operating income was down correspondingly by EUR 8.4 million
(32.7%) to EUR 17.4 million. The earnings from the disposal of assets as
part of portfolio improvements, the earnings from IT services for third parties
as well as the earnings from foreign exchange gains fell by a total of EUR
13.8 million. By contrast, earnings increased by EUR 6.5 million from the
settlement of liabilities, which were associated with operational systems and
other factors.
Personnel costs fell by EUR 4.4 million (-10.2%) and thus reflects the 11.0%
fall in the average staffing level.
The other operational expenses fell by EUR 13.1 million (17.2%) to EUR
63.3 million. The primary contribution here came from EUR 7.5 million in
lower outgoing freight, transport and storage costs and EUR 4.6 million in
lower operating expenses. In addition, the foreign exchange losses and IT
service expenses were reduced by a total of EUR 4.6 million. By contrast,
the expenses from the implementation of provisions for accounts receivable
and sales commissions increased by a total of EUR 3.0 million.
9
The EBITDA reduction of EUR 8.7 million (35.2%) to EUR 16.0 million had
EUR 10.7 million from the steel and metals recycling segment. The services
segment saw an EBITDA increase of EUR 2.0 million.
The EBT fell compared to the previous year by EUR 4.3 million (26.6%) to
EUR 11.7 million. A positive impact stemmed from the improved financial
result of EUR 2.7 million and the reduction of depreciation by EUR 1.7
million.
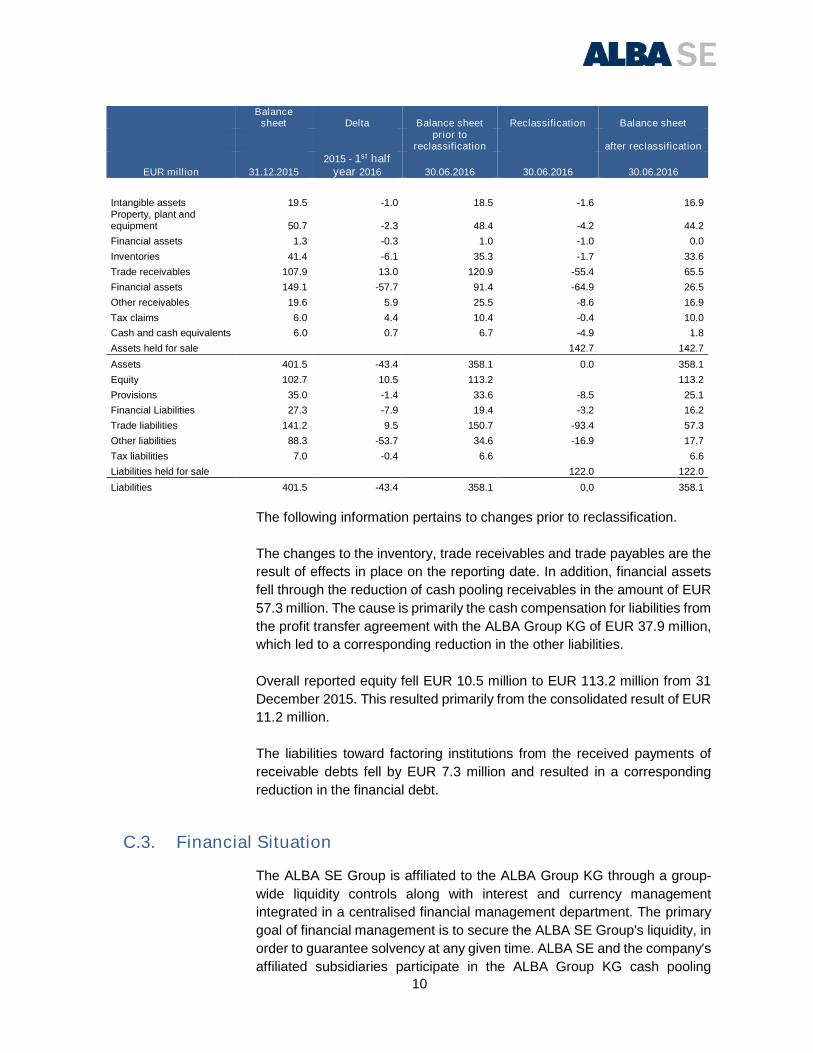
C.2. Assets Situation
Compared to December 31, 2015, total assets had fallen by EUR 43.4
million (-10.8%) to EUR 401.5 million. In tandem with the consolidated
results the equity ratio improved from 25.6% to 31.6%.
EUR 142.7 million in assets from the long-term and short-term assets were
reclassified as "Assets belonging to an assigned disposal group".
Corresponding to the assets, the liabilities saw EUR 122.0 million classified
as "Debt assigned to the disposal group". The assets and debt in this case
are those of the companies in the services segment (ex ALBA SE).
10
Balancesheet Delta Balance sheet Reclassification Balance sheet
prior toreclassification after reclassification
EUR million 31.12.2015
2015 - 1st halfyear 2016 30.06.2016 30.06.2016 30.06.2016
Intangible assets 19.5 -1.0 18.5 -1.6 16.9Property, plant andequipment 50.7 -2.3 48.4 -4.2 44.2
Financial assets 1.3 -0.3 1.0 -1.0 0.0
Inventories 41.4 -6.1 35.3 -1.7 33.6
Trade receivables 107.9 13.0 120.9 -55.4 65.5
Financial assets 149.1 -57.7 91.4 -64.9 26.5
Other receivables 19.6 5.9 25.5 -8.6 16.9
Tax claims 6.0 4.4 10.4 -0.4 10.0
Cash and cash equivalents 6.0 0.7 6.7 -4.9 1.8
Assets held for sale 142.7 142.7
Assets 401.5 -43.4 358.1 0.0 358.1
Equity 102.7 10.5 113.2 113.2
Provisions 35.0 -1.4 33.6 -8.5 25.1
Financial Liabilities 27.3 -7.9 19.4 -3.2 16.2
Trade liabilities 141.2 9.5 150.7 -93.4 57.3
Other liabilities 88.3 -53.7 34.6 -16.9 17.7
Tax liabilities 7.0 -0.4 6.6 6.6
Liabilities held for sale 122.0 122.0
Liabilities 401.5 -43.4 358.1 0,0 358.1
The following information pertains to changes prior to reclassification.
The changes to the inventory, trade receivables and trade payables are the
result of effects in place on the reporting date. In addition, financial assets
fell through the reduction of cash pooling receivables in the amount of EUR
57.3 million. The cause is primarily the cash compensation for liabilities from
the profit transfer agreement with the ALBA Group KG of EUR 37.9 million,
which led to a corresponding reduction in the other liabilities.
Overall reported equity fell EUR 10.5 million to EUR 113.2 million from 31
December 2015. This resulted primarily from the consolidated result of EUR
11.2 million.
The liabilities toward factoring institutions from the received payments of
receivable debts fell by EUR 7.3 million and resulted in a corresponding
reduction in the financial debt.
C.3. Financial Situation
The ALBA SE Group is affiliated to the ALBA Group KG through a group-
wide liquidity controls along with interest and currency management
integrated in a centralised financial management department. The primary
goal of financial management is to secure the ALBA SE Group's liquidity, in
order to guarantee solvency at any given time. ALBA SE and the company's
affiliated subsidiaries participate in the ALBA Group KG cash pooling
11
process. Cash and cash equivalents are compiled, monitored and invested
according to uniform principles throughout the group.
Cash and cash equivalents in the cash flow statement include liquidity in the
amount of EUR 1.8 million (previous year: EUR 6.0 million) along with the
net cash pool balance for the ALBA Group KG of EUR 20.8 million (previous
year: EUR 141.3 million) as well as the net cash and cash equivalent
receivables along with cash pooling receivables for the disposal group of
EUR 68.2 million, making the inventory of cash and cash equivalents at the
end of the reporting period EUR 90.8 million (previous year: EUR 147.3
million). The balances included in the level of cash and cash equivalents are
only subject to minimal fluctuation risks.
Cash flow performance is presented in item 5 of the consolidated notes.
D. Events after the Balance Sheet Date
No material events have occurred since the end of the intermediate
reporting period.
E. Risks and Opportunities Report
Please refer to the information on pages 75 to 88 of the 2015 annual report
for the strategic and operational opportunities and risks which are still
applicable. Under assumption of compliance with the covenants and
assurances in the loan agreement, the risks identified as of June 30, 2016
do not represent a threat to solvency both severally and as a whole. Since
compilation of the consolidated annual report on April 25, 2016, the following
opportunities and risks have arisen or altered.
E.1. Opportunities
Services
The packaging law changes currently under debate and set for passage in
this legislative period may help further stabilise the market for sales
packaging. Such an outcome is dependent on the content of the packaging
law.
12
E.2. RisksSegments
Steel and Metals Recycling
The markets for ferrous and non-ferrous metals are subject to economic
risks arising in the numerous geopolitical problem areas. The recent political
developments in Turkey could have an impact on scrap demand.
Another risk is the scope of steel production in China. Should China receive
the status of a market economy this December, fail to slow steel production
and should a reform of the European anti-dumping law not be passed in
time, attaching tariffs to the steel exported to Europe at dumping prices
could prove difficult. This may have negative consequences for ferrous
scrap prices and demand.
Services
The management sees risks in the market for sales packaging stemming
from the content of included in the drafting the packaging law but generally
sees the potential opportunities having the upper hand.
F. Additional DisclosuresF.1. Administrative Board
The court decision of January 14, 2016 appointed Mr. Dirk Beuth as
Administrative Board member. The term ended at the end of the orderly
General Shareholders’ Meeting on June 7, 2016. The ALBA SE General
Shareholders’ Meeting appointed Dr. Axel Schweitzer, Dirk Beuth and
Robert Nansink once again to the Administrative Board. The appointment
of the Administrative Board members was performed in compliance with §
8 (2) of the company statutes for the period up to the end of the General
Shareholders' Meeting, which passed a resolution regarding approval for
the five fiscal year term in office, but no more than six years. The fiscal year
in which the appointment has been made is not included in such
calculations.
F.2 Employees
In the first half of 2016 the ALBA SE Group employed an average of 1,380
individuals, not including trainees and students (previous year: 1,550). Their
number was thus 11.0% below the level for the previous year.
The steel and metals recycling segment employed an average 814
individuals in the first half (previous year: 986), of which 334 (previous year:
13
409) were clerical employees and 480 (previous year: 577) were
commercial employees.
In the services segment the average number of employees was 566
(previous year: 564). The number of clerical workers was 434 (previous
year: 435), and 132 commercial employees (previous year: 129).
F.3 Environment and Sustainability
On June 14, 2016 Interseroh brought out their new annual sustainability
magazine and thus expanded on their classic sustainability reporting. In the
first edition titled "Solutions with a future", Interseroh presented current best
practices for sustainability - both within the company and for customers. As
part of the sustainability strategy, Interseroh defined quantifiable goals for
sustainable development. In detail, the goals include closing recycling
loops, conserving resources, reducing the company's ecological footprint,
improving attractiveness as an employer and acting as intermediary for
sustainable development. The magazine covers both the services segment
at Interseroh and the sorting of light packing and facility management at the
ALBA Group.
The integrated management system (DIN EN ISO 9001:2008, DIN EN ISO
14001:2009, BS OHSAS 18001:2007) and INTERSEROH Dienstleistungs
GmbH and the company's subsidiaries was confirmed in June 2016 as part
of a monitoring audit on the part of the certifier without any deviation. The
companies were also recertified as a waste disposal operator.
G. OutlookG.1. Segment Development
The estimate of segment development at ALBA SE is based on performance
in the first half of 2016 as well as the current expectations and assumptions
regarding the impact of future events and economic conditions on
operational companies in the second half of the current fiscal year.
Steel and Metals Recycling segment
According to the German Steel Federation prospects for the second half of
2016 remain uncertain in the face of developments in both the global
economy and the global steel market. In 2016 Chinese steel capacity shall
be reduced by 45 million tonnes and by 150 million tonnes by 2020.
According to the Chinese supervisory authority SASAC, provincial
governments failing to make the planned capacity reductions or failing to
meet their targets will be punished. Nevertheless, experts assume China
will still attempt to get rid of 120 million tonnes of steel at fire sale prices, 8%
more than in 2015.
14
Simultaneously the EU Commission is planning to reform European anti-
dumping legislation to protect the domestic industry from state-subsidised
and low-price imports from China. The reform is needed because China will
have discrimination-free access to the European domestic market as of
December 16, 2016. The previous differentiation between market economy
and non-market economy shall no longer apply. Anti-dumping tariffs may no
longer be directed against a government but against a state-subsidised
industry such as the Chinese steel industry.
According to the German metal traders' association, expectations for the
second half of the year are fairly reserved.
As forecast at the start of the reporting year, ALBA SE management expects
strong drops in the demand for ferrous metals in the current fiscal year due
to the difficult situation on the steel market as well as the planned portfolio
adjustments. Due to the unexpectedly difficult situation on the metal
markets, demand for non-ferrous metals is also expected to decline
significantly. Sales volumes and prices will lead to the significant reduction
in sales revenues predicted at the start of the year.
The EBITDA is still expected to improve significantly in 2016. The steps
taken to increase vertical value creation and cut structural costs are the
primary sources of the improvements. The effects and the lack of
extraordinary write downs on intangible assets as in fiscal 2015 have had a
positive impact on the EBT, which is expected to increase extraordinary.
By the end of the year, the necessary replacement investments in the fleet
and holding facilities will be made. In addition, some sites will be renovated
or renewed. Due to the continued volatility on steel and metals markets, little
investment is expected, meaning the 2016 budget will most likely not be
completely deployed.
Services Segment
In deviation from the forecast at the start of fiscal 2016, which assumed
slightly lower sales revenues, the management now expects a marginal
increase is sales revenues through customer loyalty and promotional
campaigns.
Significant declines for the EBITDA and EBT were predicted at the start of
fiscal 2016. Contrary to expectations, income improved in the first half of
2016 due to positive non-periodic business model effects. Nevertheless,
management continues to expect the EBITDA and EBT for fiscal 2016
forecast at the start of the year, which will still be improved when adjusted
for the non-periodic effects. EBITDA and EBT are still expected to be
significantly reduced compared to 2015.
15
The planned investments will be fully implemented by the end of the year.
G.2. Group Development
Management continues to expect significant revenue reductions for fiscal
2016 compared to fiscal 2015. The revenue development in the steel and
metals segment will be dominated by weak demand for steel scrap and low
prices.
In contrast to the predictions at the start of the year, which assumed a
significant decline in EBITDA, the EBITDA compared to 2015 will only be
moderately lower. The supplemental earnings improvements result primarily
from positive non-periodic business model effects from the first half from the
services segment.
When compared to the forecast at the start of the year assuming significant
EBT improvements would continue causing an increase in EBITDA, though
not to the same extent as in the year 2015 due to the extraordinary write
downs offset with an extraordinary increase.
Investments were lower than expected.
The ALBA SE Group is still bound in the financing of the ALBA Group. Doing
so guarantees that ALBA SE Group has sufficient liquidity available.
16
Consolidated Interim Financial Statementsfor the period from January 1 to June 30, 2016
ALBA SE, Cologne
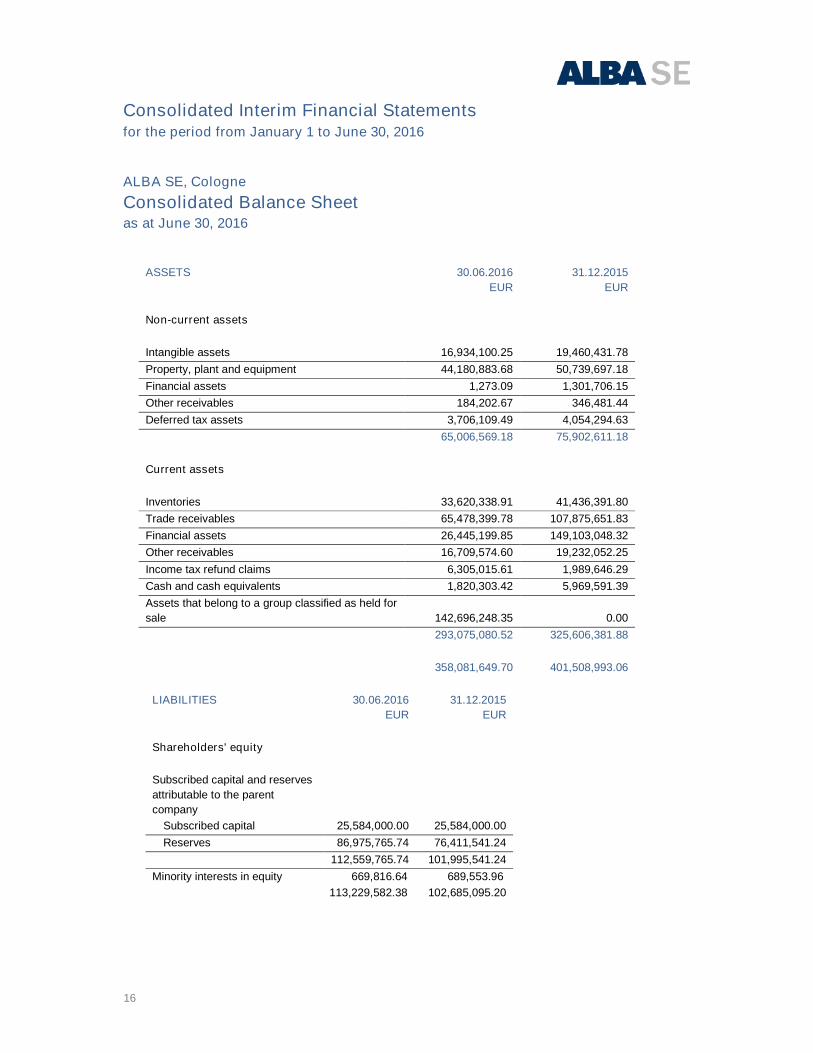
Consolidated Balance Sheetas at June 30, 2016
ASSETS 30.06.2016
EUR
31.12.2015
EUR
Non-current assets
Intangible assets 16,934,100.25 19,460,431.78
Property, plant and equipment 44,180,883.68 50,739,697.18
Financial assets 1,273.09 1,301,706.15
Other receivables 184,202.67 346,481.44
Deferred tax assets 3,706,109.49 4,054,294.63
65,006,569.18 75,902,611.18
Current assets
Inventories 33,620,338.91 41,436,391.80
Trade receivables 65,478,399.78 107,875,651.83
Financial assets 26,445,199.85 149,103,048.32
Other receivables 16,709,574.60 19,232,052.25
Income tax refund claims 6,305,015.61 1,989,646.29
Cash and cash equivalents 1,820,303.42 5,969,591.39
Assets that belong to a group classified as held for
sale 142,696,248.35 0.00
293,075,080.52 325,606,381.88
358,081,649.70 401,508,993.06
LIABILITIES 30.06.2016
EUR
31.12.2015
EUR
Shareholders' equity
Subscribed capital and reserves
attributable to the parent
company
Subscribed capital 25,584,000.00 25,584,000.00
Reserves 86,975,765.74 76,411,541.24
112,559,765.74 101,995,541.24
Minority interests in equity 669,816.64 689,553.96
113,229,582.38 102,685,095.20
17
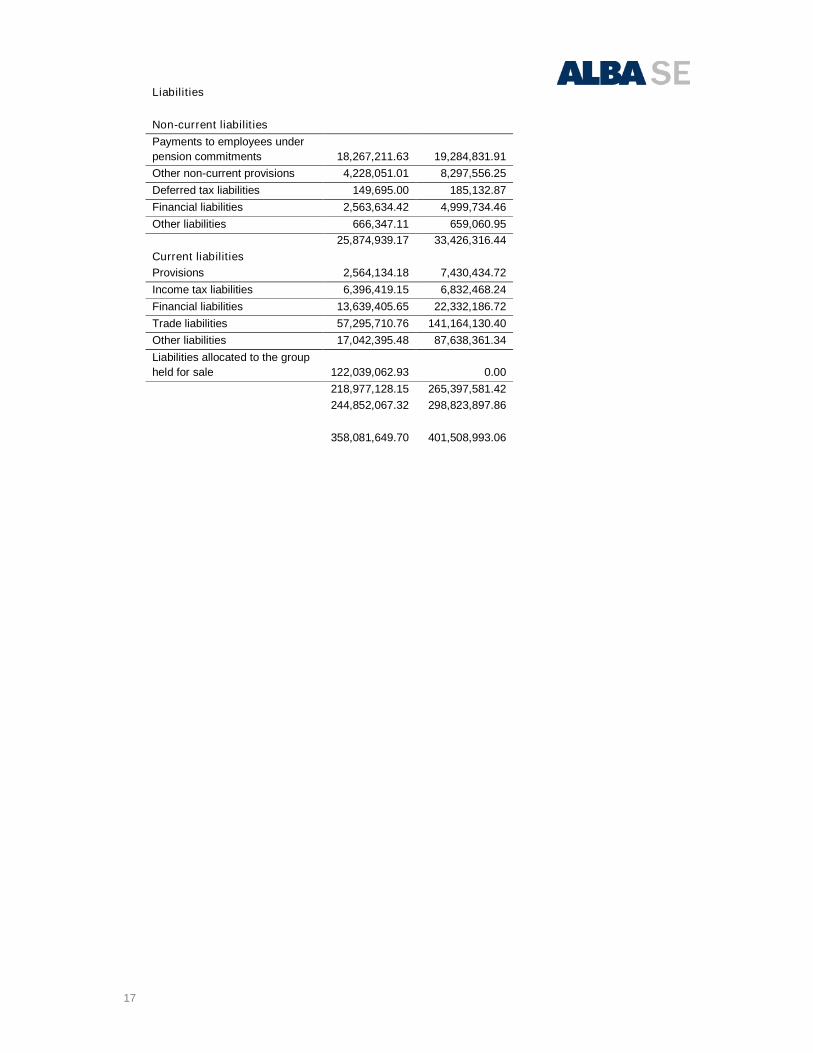
Liabilities
Non-current liabilities
Payments to employees under
pension commitments 18,267,211.63 19,284,831.91
Other non-current provisions 4,228,051.01 8,297,556.25
Deferred tax liabilities 149,695.00 185,132.87
Financial liabilities 2,563,634.42 4,999,734.46
Other liabilities 666,347.11 659,060.95
25,874,939.17 33,426,316.44
Current liabilities
Provisions 2,564,134.18 7,430,434.72
Income tax liabilities 6,396,419.15 6,832,468.24
Financial liabilities 13,639,405.65 22,332,186.72
Trade liabilities 57,295,710.76 141,164,130.40
Other liabilities 17,042,395.48 87,638,361.34
Liabilities allocated to the group
held for sale 122,039,062.93 0.00
218,977,128.15 265,397,581.42
244,852,067.32 298,823,897.86
358,081,649.70 401,508,993.06
18
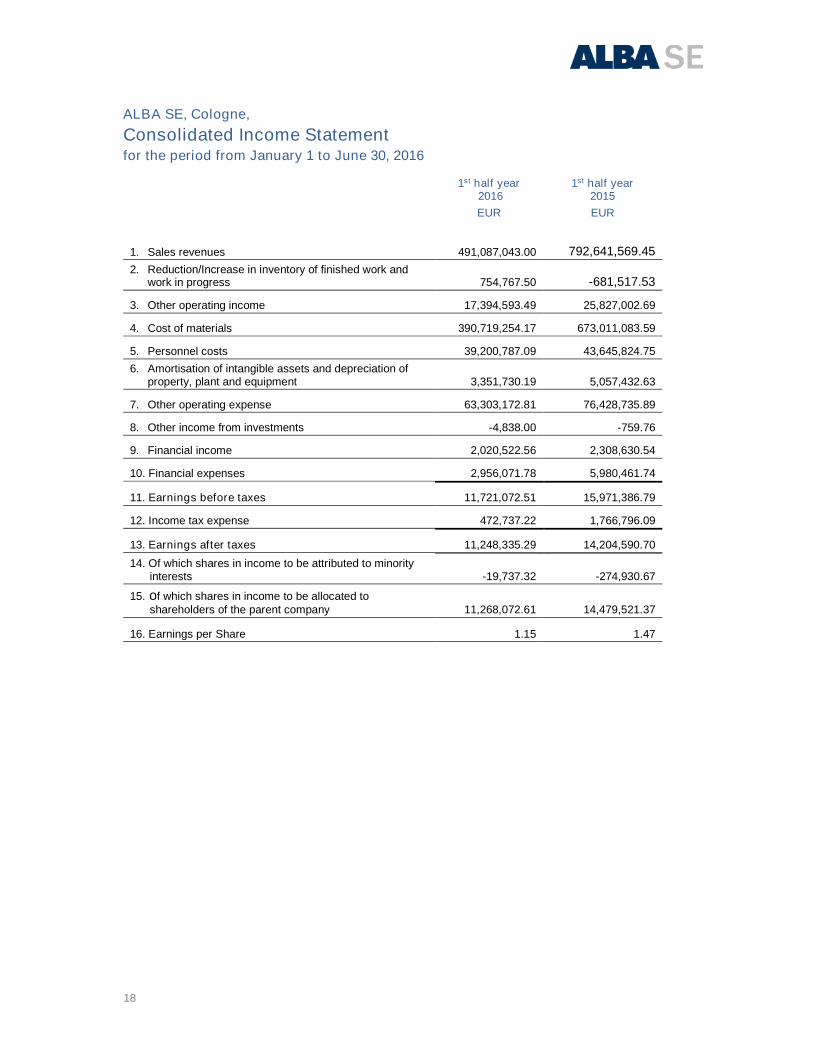
ALBA SE, Cologne,
Consolidated Income Statementfor the period from January 1 to June 30, 2016
1st half year2016
1st half year2015
EUR EUR
1. Sales revenues 491,087,043.00 792,641,569.45
2. Reduction/Increase in inventory of finished work andwork in progress 754,767.50 -681,517.53
3. Other operating income 17,394,593.49 25,827,002.69
4. Cost of materials 390,719,254.17 673,011,083.59
5. Personnel costs 39,200,787.09 43,645,824.75
6. Amortisation of intangible assets and depreciation ofproperty, plant and equipment 3,351,730.19 5,057,432.63
7. Other operating expense 63,303,172.81 76,428,735.89
8. Other income from investments -4,838.00 -759.76
9. Financial income 2,020,522.56 2,308,630.54
10. Financial expenses 2,956,071.78 5,980,461.74
11. Earnings before taxes 11,721,072.51 15,971,386.79
12. Income tax expense 472,737.22 1,766,796.09
13. Earnings after taxes 11,248,335.29 14,204,590.70
14. Of which shares in income to be attributed to minorityinterests -19,737.32 -274,930.67
15. of which shares in income to be allocated toshareholders of the parent company 11,268,072.61 14,479,521.37
16. Earnings per Share 1.15 1.47
19
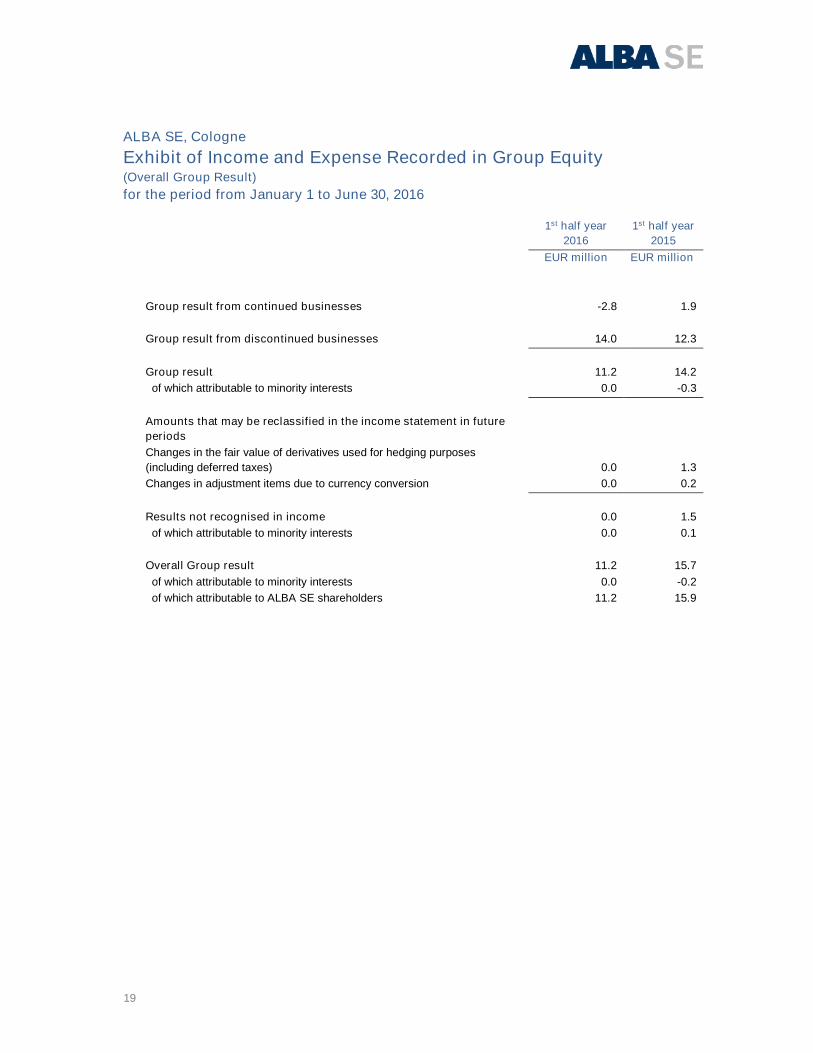
ALBA SE, Cologne
Exhibit of Income and Expense Recorded in Group Equity(Overall Group Result)
for the period from January 1 to June 30, 2016
1st half year
2016
1st half year
2015
EUR million EUR million
Group result from continued businesses -2.8 1.9
Group result from discontinued businesses 14.0 12.3
Group result 11.2 14.2
of which attributable to minority interests 0.0 -0.3
Amounts that may be reclassified in the income statement in future
periods
Changes in the fair value of derivatives used for hedging purposes
(including deferred taxes) 0.0 1.3
Changes in adjustment items due to currency conversion 0.0 0.2
Results not recognised in income 0.0 1.5
of which attributable to minority interests 0.0 0.1
Overall Group result 11.2 15.7
of which attributable to minority interests 0.0 -0.2
of which attributable to ALBA SE shareholders 11.2 15.9
20
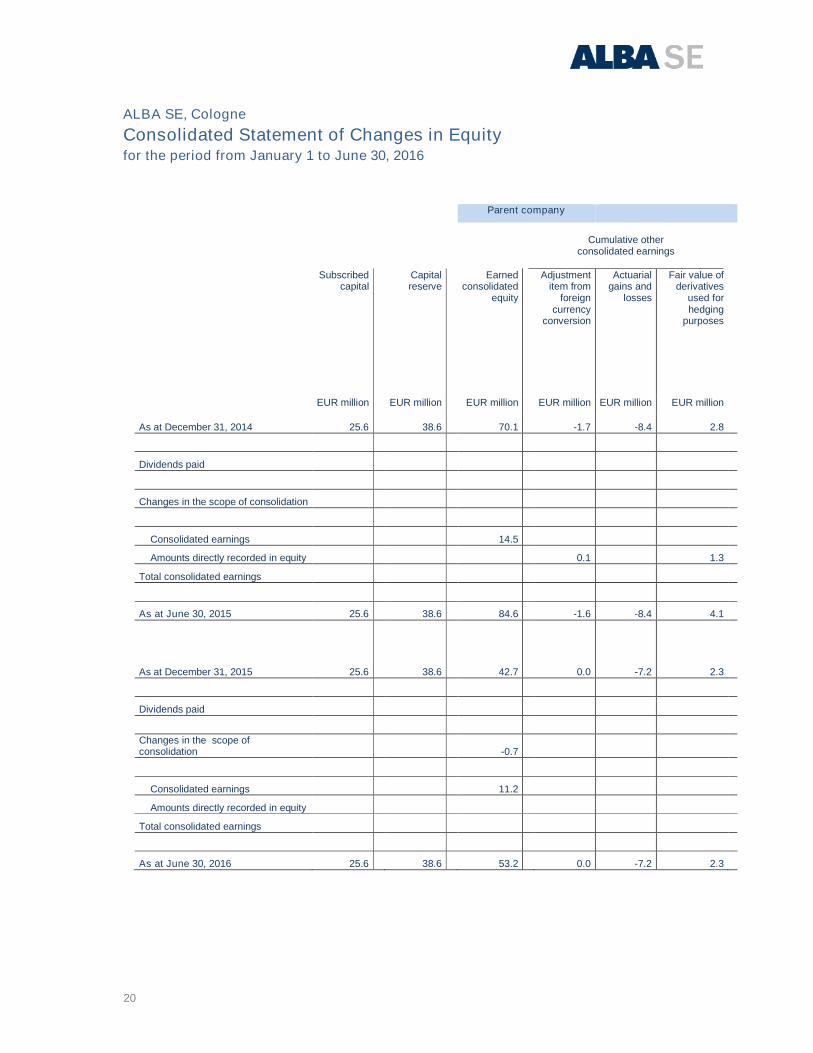
ALBA SE, Cologne
Consolidated Statement of Changes in Equityfor the period from January 1 to June 30, 2016
Parent company
Cumulative otherconsolidated earnings
Subscribedcapital
Capitalreserve
Earnedconsolidated
equity
Adjustmentitem from
foreigncurrency
conversion
Actuarialgains and
losses
Fair value ofderivatives
used forhedging
purposes
EUR million EUR million EUR million EUR million EUR million EUR million
As at December 31, 2014 25.6 38.6 70.1 -1.7 -8.4 2.8
Dividends paid
Changes in the scope of consolidation
Consolidated earnings 14.5
Amounts directly recorded in equity 0.1 1.3
Total consolidated earnings
As at June 30, 2015 25.6 38.6 84.6 -1.6 -8.4 4.1
As at December 31, 2015 25.6 38.6 42.7 0.0 -7.2 2.3
Dividends paid
Changes in the scope ofconsolidation -0.7
Consolidated earnings 11.2
Amounts directly recorded in equity
Total consolidated earnings
As at June 30, 2016 25.6 38.6 53.2 0.0 -7.2 2.3
21
Parent company Minority shareholders Consolidated equity
Equity Minority capital Consolidated equity
EUR million EUR million EUR million
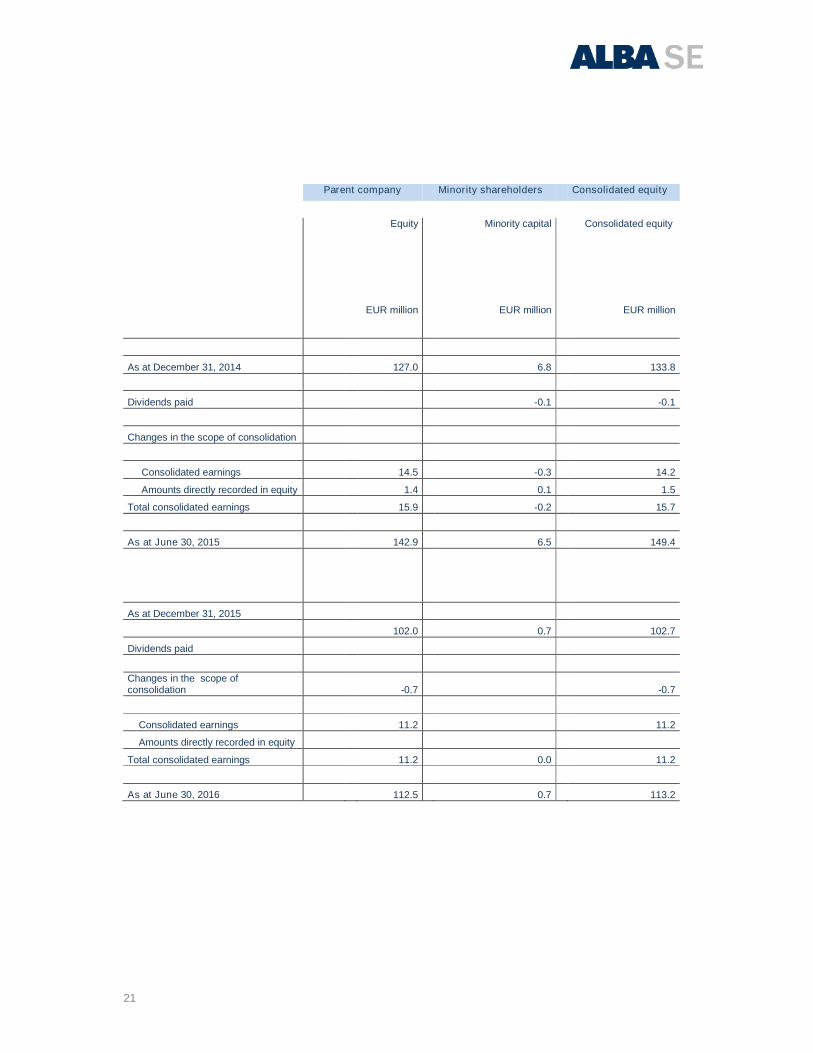
As at December 31, 2014 127.0 6.8 133.8
Dividends paid -0.1 -0.1
Changes in the scope of consolidation
Consolidated earnings 14.5 -0.3 14.2
Amounts directly recorded in equity 1.4 0.1 1.5
Total consolidated earnings 15.9 -0.2 15.7
As at June 30, 2015 142.9 6.5 149.4
As at December 31, 2015
102.0 0.7 102.7
Dividends paid
Changes in the scope ofconsolidation -0.7 -0.7
Consolidated earnings 11.2 11.2
Amounts directly recorded in equity
Total consolidated earnings 11.2 0.0 11.2
As at June 30, 2016 112.5 0.7 113.2
22
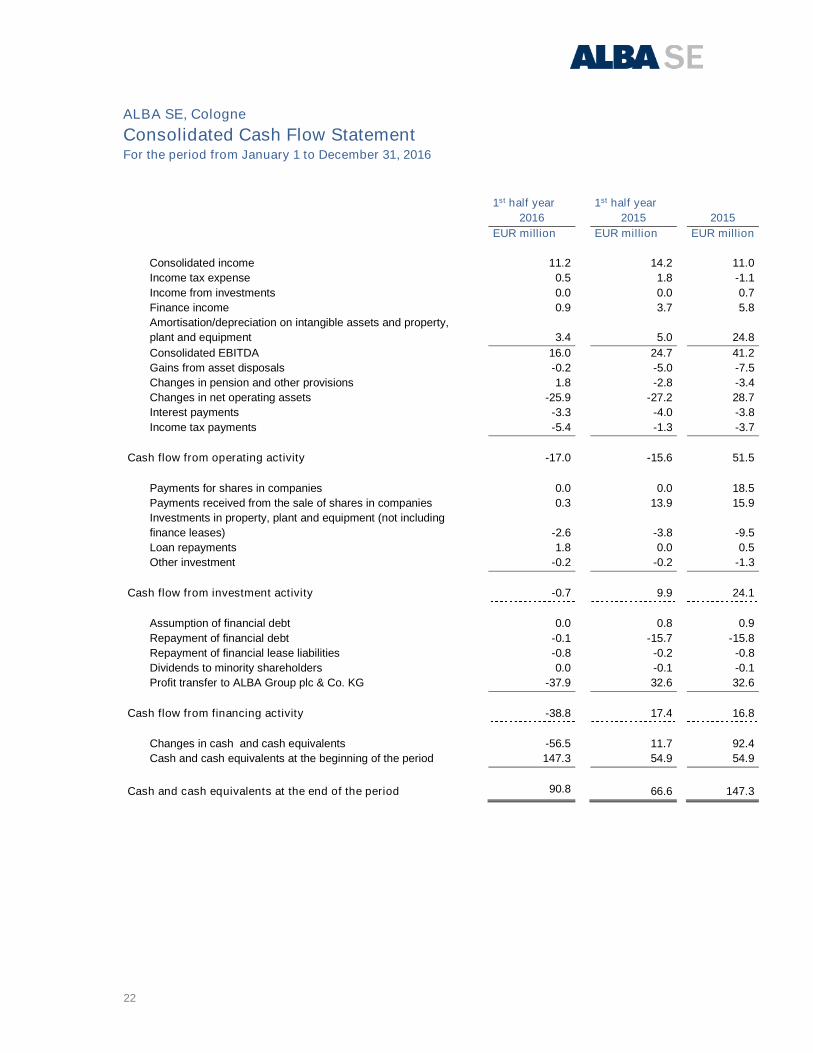
ALBA SE, Cologne
Consolidated Cash Flow StatementFor the period from January 1 to December 31, 2016
1st half year 1st half year
2016 2015 2015
EUR million EUR million EUR million
Consolidated income 11.2 14.2 11.0
Income tax expense 0.5 1.8 -1.1
Income from investments 0.0 0.0 0.7
Finance income 0.9 3.7 5.8
Amortisation/depreciation on intangible assets and property,
plant and equipment 3.4 5.0 24.8
Consolidated EBITDA 16.0 24.7 41.2
Gains from asset disposals -0.2 -5.0 -7.5
Changes in pension and other provisions 1.8 -2.8 -3.4
Changes in net operating assets -25.9 -27.2 28.7
Interest payments -3.3 -4.0 -3.8
Income tax payments -5.4 -1.3 -3.7
Cash flow from operating activity -17.0 -15.6 51.5
Payments for shares in companies 0.0 0.0 18.5
Payments received from the sale of shares in companies 0.3 13.9 15.9
Investments in property, plant and equipment (not including
finance leases) -2.6 -3.8 -9.5
Loan repayments 1.8 0.0 0.5
Other investment -0.2 -0.2 -1.3
Cash flow from investment activity -0.7 9.9 24.1
Assumption of financial debt 0.0 0.8 0.9
Repayment of financial debt -0.1 -15.7 -15.8
Repayment of financial lease liabilities -0.8 -0.2 -0.8
Dividends to minority shareholders 0.0 -0.1 -0.1
Profit transfer to ALBA Group plc & Co. KG -37.9 32.6 32.6
Cash flow from financing activity -38.8 17.4 16.8
Changes in cash and cash equivalents -56.5 11.7 92.4
Cash and cash equivalents at the beginning of the period 147.3 54.9 54.9
Cash and cash equivalents at the end of the period 90.8 66.6 147.3
23
Condensed Notes to the Consolidated Interim Financial Statementsfor the period January 1 to June 30, 2016
ALBA SE, Cologne
1. Information on the Company
ALBA SE is a listed stock corporation domiciled in Cologne, Germany. Its
business address is: Stollwerckstrasse 9a, 51149 Cologne. The
condensed consolidated interim financial statement for the first half of
2016 includes the Company, its subsidiaries and holdings in associated
companies (collectively termed the ALBA SE Group).
The ALBA SE Group is one of the leading environmental services and raw
materials providers in Europe. As service provider, the ALBA SE Group
organises recycling processes and, as supplier to steel works, smelters
and foundries, supplies processing industries. The business activities of
the ALBA SE Group are divided into two segments – steel and metals
recycling and services.
According to the control and profit transfer agreement with ALBA Group
plc & Co. KG (hereinafter: ALBA KG), the latter guarantees external
shareholders of ALBA SE a recurrent payment, a so-called equalisation
payment, for the duration of the agreement, for each full fiscal year in the
gross amount of EUR 3.94 per ALBA SE share, minus corporate taxes
and a solidarity surcharge according to the rate applicable to these taxes
for the relevant fiscal year.
The condensed consolidated interim financial statements covering the
first six months of fiscal 2016 were released for publication upon
resolution of the Administrative Board on August 5, 2016.
2. Accounting Policies
The creation of the condensed consolidated interim financial statements
for the period from January 1 to June 30, 2016 was compiled in
compliance with the International Financial Reporting Standards (IFRS),
IAS 34 "Interim reporting" and the relevant interpretations of the
International Accounting Standards Board (IASB), as these apply in the
European Union. It is a condensed interim financial statement, which does
not contain all information and annex information, which the IFRS requires
for the consolidated notes at the end of fiscal year.
The consolidated interim financial statements are prepared in euros, the
Company's functional currency. Amounts are – with the exception of the
24
consolidated balance sheet and consolidated income statement – shown
in millions of euros rounded to two decimal places. Rounding differences
occur in isolated cases.
Accounting policies applied in preparing the condensed consolidated
interim financial statements reflect the methods used in the consolidated
interim financial statements for the fiscal year ending December 31, 2015.
This also applies to the principles and methods relating to the required
assumptions and estimates in the interim financial statements.
A detailed description of the accounting policies is contained in the Notes
to the consolidated interim financial statements of December 31, 2015,
and published in our 2015 annual report.
Obligatory international financial reporting standards and interpretations
applicable in fiscal 2016 include:
The initial application of amended accounting rules did not have any
material influence on ALBA SE nor influence the presentation of the asset,
financial earnings situation of earnings per share.
Changes to IFRS 11 - Reporting the acquisition of shares in joint
arrangements
The supplement to IFRS 11 governs the reporting the acquisition of
shares in a joint arrangement, which represents an operation as defined
in IFRS 3 "Business Combinations". In such cases, the purchaser shall
apply the principles for reporting business combinations in accordance
with IFRS 3. These amendments are to be applied for the first time to
fiscal years starting on or after January 1, 2016.
Amendments to IAS 1 – Separate Financial Statements
The changes should lead to an improvement of presentation obligations
and relate to various reporting issues. They have an impact on materiality,
aggregation and disaggregation of entries in the balance sheet and
statement of comprehensive income, structure of the notes, the material
accounting methods and the separate reporting of other comprehensive
income (OCI) for companies valued at equity. These amendments are to
be applied for the first time to fiscal years starting on or after January 1,
2016.
25
Amendments to IAS 16 and IFRS 38 – Clarification of the permitted
depreciation methods
The supplements to IAS 16 and IAS 38 clarify that a revenue-based
depreciation of fixed assets and intangible assets is not appropriate and
only permitted in specific exceptional cases. These amendments are to
be applied for the first time to fiscal years starting on or after January 1,
2016.
Amendment to IAS 16 and IAS 41 - Agriculture: Fruit-bearing plants
Amendments to IAS 16 and IAS 41 state that fruit-bearing plants only used
to generate agricultural products need to be reported in compliance with
IAS 16. These amendments are to be applied for the first time to fiscal
years starting on or after January 1, 2016.
Amendments to IAS 27 Equity method in separate financial
statements
The change permits use of equity method as a reporting option for shares
in subsidiaries, joint ventures and associated companies in separate
financial reports for an investor once more. The existing option for
valuation at acquisition costs or in compliance with IAS 39 /IFRS 9
remains in place. These amendments are to be applied for the first time
to fiscal years starting on or after January 1, 2016.
Amendment to IFRS 2012-2014
Amendments to four standards were undertaken as part of the ‘annual
improvement project’. They specify the approach, the valuation and the
presentation of business incidents, uniform terminology and can generally
be seen as editorial corrections to existing standards. They shall apply to
the fiscal year starting on or after January 1, 2016.
3. Scope of Consolidation
a) Overview
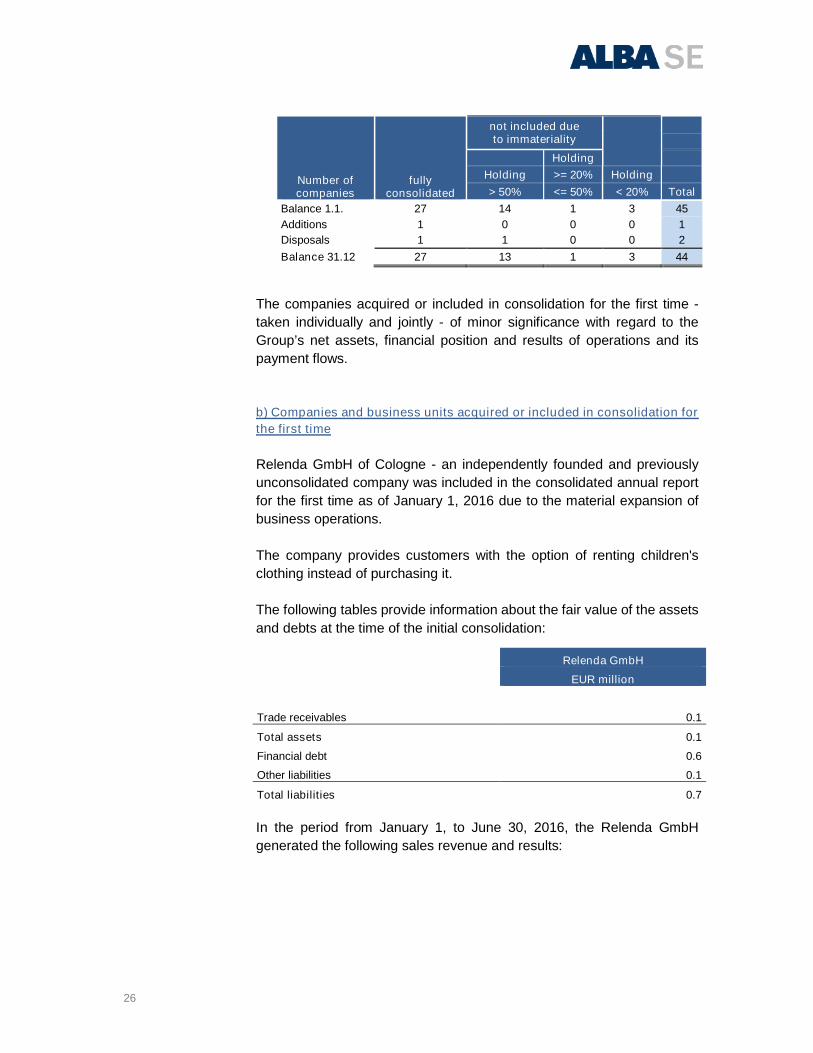
In the first half of 2016 changes were made to the consolidation scope,
which were as follows:
26
The companies acquired or included in consolidation for the first time -
taken individually and jointly - of minor significance with regard to the
Group’s net assets, financial position and results of operations and its
payment flows.
b) Companies and business units acquired or included in consolidation for
the first time
Relenda GmbH of Cologne - an independently founded and previously
unconsolidated company was included in the consolidated annual report
for the first time as of January 1, 2016 due to the material expansion of
business operations.
The company provides customers with the option of renting children's
clothing instead of purchasing it.
The following tables provide information about the fair value of the assets
and debts at the time of the initial consolidation:
In the period from January 1, to June 30, 2016, the Relenda GmbH
generated the following sales revenue and results:
Number ofcompanies
fullyconsolidated
not included dueto immateriality
Holding
Holding >= 20% Holding
> 50% <= 50% < 20% Total
Balance 1.1. 27 14 1 3 45
Additions 1 0 0 0 1
Disposals 1 1 0 0 2
Balance 31.12 27 13 1 3 44
Relenda GmbH
EUR million
Trade receivables 0.1
Total assets 0.1
Financial debt 0.6
Other liabilities 0.1
Total liabilities 0.7
27
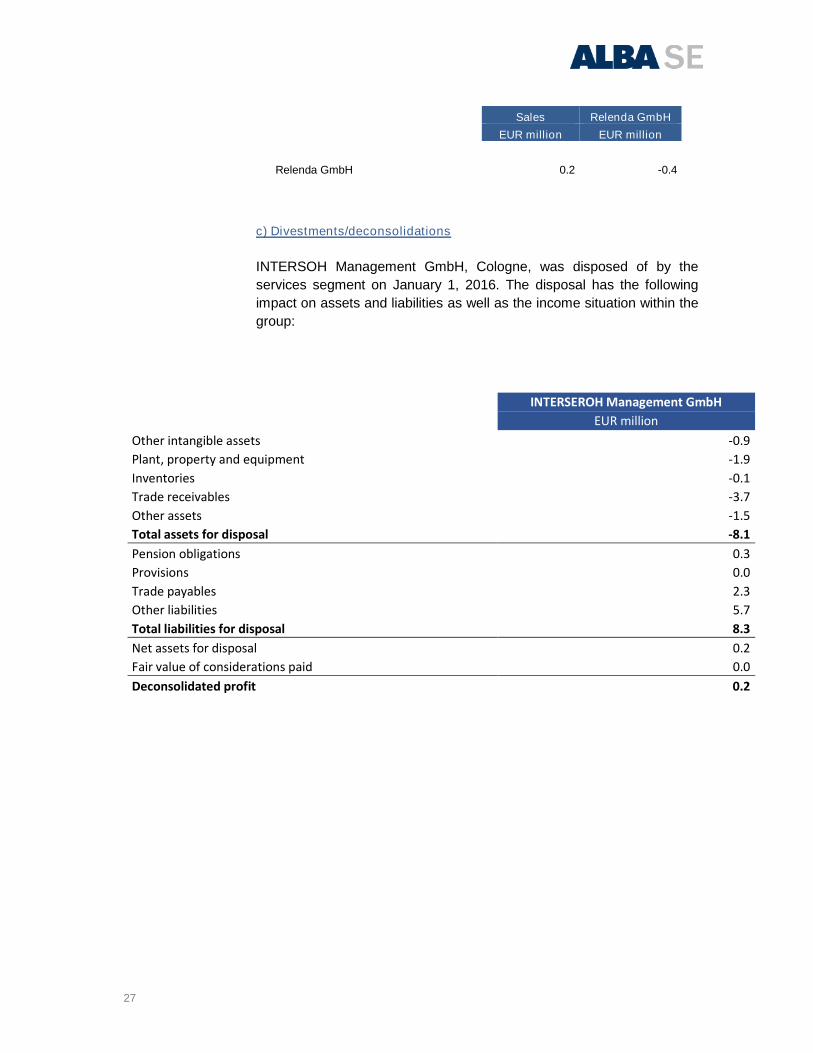
Sales Relenda GmbH
EUR million EUR million
Relenda GmbH 0.2 -0.4
c) Divestments/deconsolidations
INTERSOH Management GmbH, Cologne, was disposed of by the
services segment on January 1, 2016. The disposal has the following
impact on assets and liabilities as well as the income situation within the
group:
INTERSEROH Management GmbH
EUR million
Other intangible assets -0.9
Plant, property and equipment -1.9
Inventories -0.1
Trade receivables -3.7
Other assets -1.5
Total assets for disposal -8.1
Pension obligations 0.3
Provisions 0.0
Trade payables 2.3
Other liabilities 5.7
Total liabilities for disposal 8.3
Net assets for disposal 0.2
Fair value of considerations paid 0.0
Deconsolidated profit 0.2
28
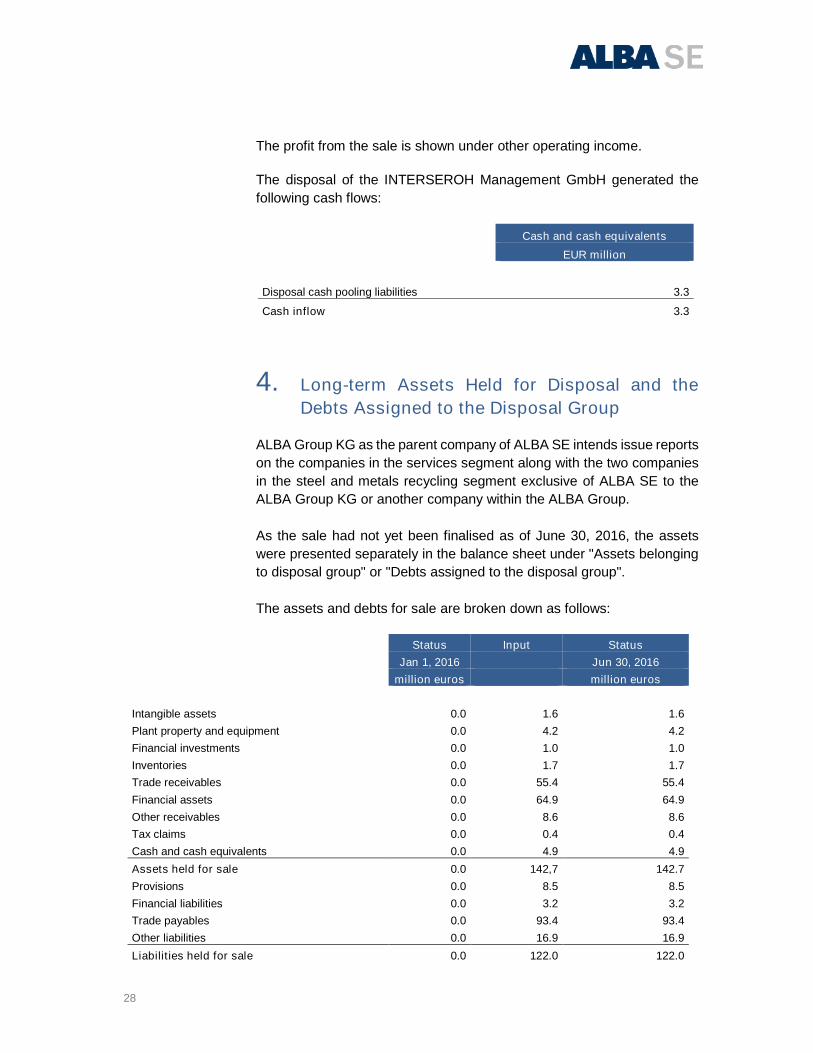
The profit from the sale is shown under other operating income.
The disposal of the INTERSEROH Management GmbH generated the
following cash flows:
Cash and cash equivalents
EUR million
n
Disposal cash pooling liabilities 3.3
Cash inflow 3.3
4. Long-term Assets Held for Disposal and the
Debts Assigned to the Disposal Group
ALBA Group KG as the parent company of ALBA SE intends issue reports
on the companies in the services segment along with the two companies
in the steel and metals recycling segment exclusive of ALBA SE to the
ALBA Group KG or another company within the ALBA Group.
As the sale had not yet been finalised as of June 30, 2016, the assets
were presented separately in the balance sheet under "Assets belonging
to disposal group" or "Debts assigned to the disposal group".
The assets and debts for sale are broken down as follows:
Status Input Status
Jan 1, 2016 Jun 30, 2016
million euros million euros
Intangible assets 0.0 1.6 1.6
Plant property and equipment 0.0 4.2 4.2
Financial investments 0.0 1.0 1.0
Inventories 0.0 1.7 1.7
Trade receivables 0.0 55.4 55.4
Financial assets 0.0 64.9 64.9
Other receivables 0.0 8.6 8.6
Tax claims 0.0 0.4 0.4
Cash and cash equivalents 0.0 4.9 4.9
Assets held for sale 0.0 142,7 142.7
Provisions 0.0 8.5 8.5
Financial liabilities 0.0 3.2 3.2
Trade payables 0.0 93.4 93.4
Other liabilities 0.0 16.9 16.9
Liabilities held for sale 0.0 122.0 122.0
29
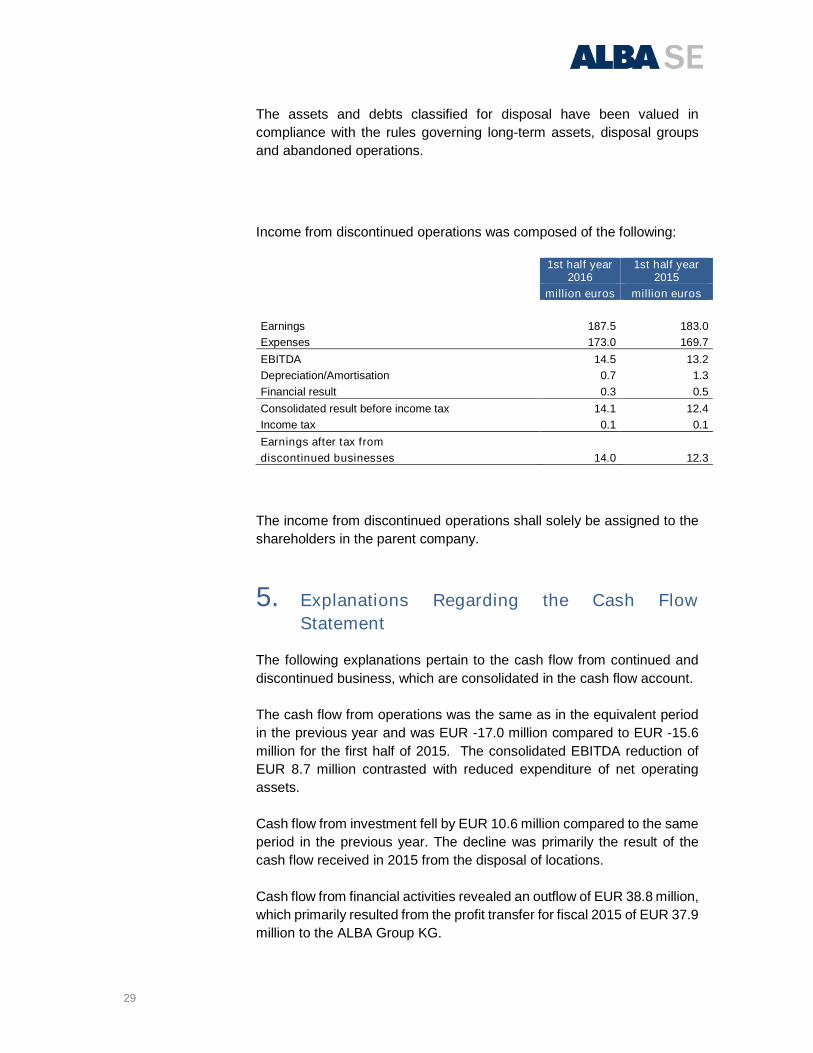
The assets and debts classified for disposal have been valued in
compliance with the rules governing long-term assets, disposal groups
and abandoned operations.
Income from discontinued operations was composed of the following:
1st half year2016
1st half year2015
million euros million euros
Earnings 187.5 183.0
Expenses 173.0 169.7
EBITDA 14.5 13.2
Depreciation/Amortisation 0.7 1.3
Financial result 0.3 0.5
Consolidated result before income tax 14.1 12.4
Income tax 0.1 0.1
Earnings after tax from
discontinued businesses 14.0 12.3
The income from discontinued operations shall solely be assigned to the
shareholders in the parent company.
5. Explanations Regarding the Cash Flow
Statement
The following explanations pertain to the cash flow from continued and
discontinued business, which are consolidated in the cash flow account.
The cash flow from operations was the same as in the equivalent period
in the previous year and was EUR -17.0 million compared to EUR -15.6
million for the first half of 2015. The consolidated EBITDA reduction of
EUR 8.7 million contrasted with reduced expenditure of net operating
assets.
Cash flow from investment fell by EUR 10.6 million compared to the same
period in the previous year. The decline was primarily the result of the
cash flow received in 2015 from the disposal of locations.
Cash flow from financial activities revealed an outflow of EUR 38.8 million,
which primarily resulted from the profit transfer for fiscal 2015 of EUR 37.9
million to the ALBA Group KG.
30
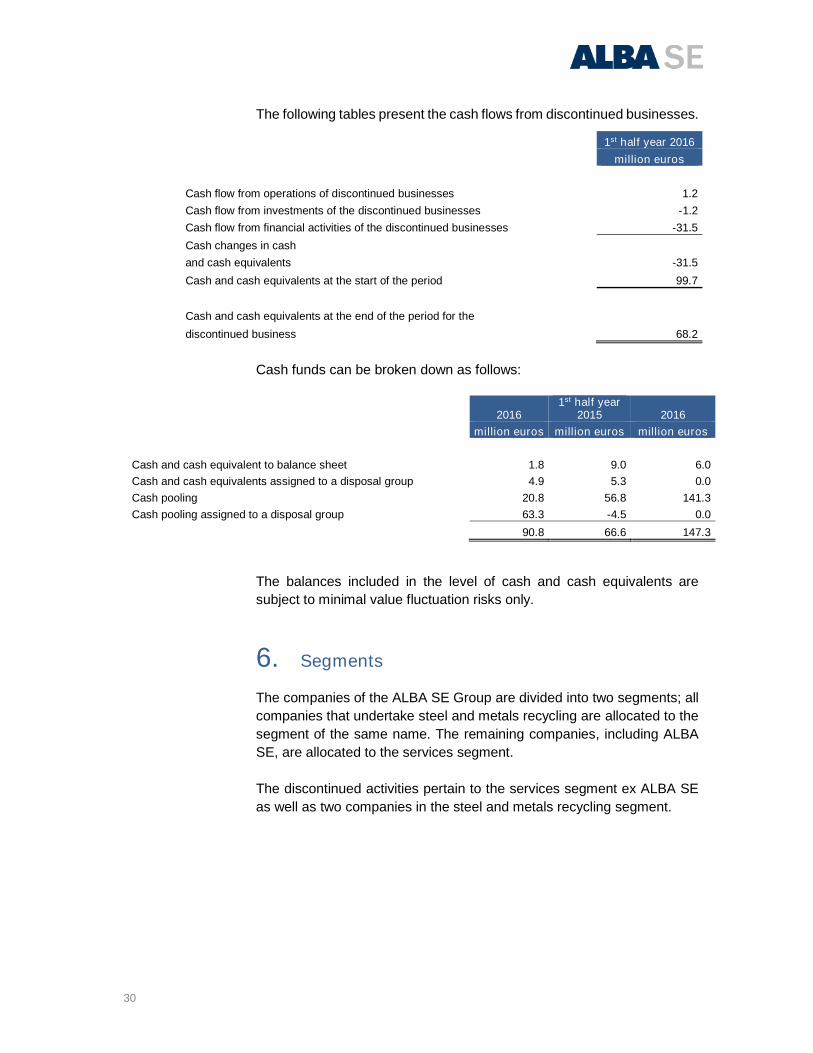
The following tables present the cash flows from discontinued businesses.
Cash funds can be broken down as follows:
20161st half year
2015 2016
million euros million euros million euros
Cash and cash equivalent to balance sheet 1.8 9.0 6.0
Cash and cash equivalents assigned to a disposal group 4.9 5.3 0.0
Cash pooling 20.8 56.8 141.3
Cash pooling assigned to a disposal group 63.3 -4.5 0.0
90.8 66.6 147.3
The balances included in the level of cash and cash equivalents are
subject to minimal value fluctuation risks only.
6. Segments
The companies of the ALBA SE Group are divided into two segments; all
companies that undertake steel and metals recycling are allocated to the
segment of the same name. The remaining companies, including ALBA
SE, are allocated to the services segment.
The discontinued activities pertain to the services segment ex ALBA SE
as well as two companies in the steel and metals recycling segment.
1st half year 2016
million euros
Cash flow from operations of discontinued businesses 1.2
Cash flow from investments of the discontinued businesses -1.2
Cash flow from financial activities of the discontinued businesses -31.5
Cash changes in cash
and cash equivalents -31.5
Cash and cash equivalents at the start of the period 99.7
Cash and cash equivalents at the end of the period for the
discontinued business 68.2
31
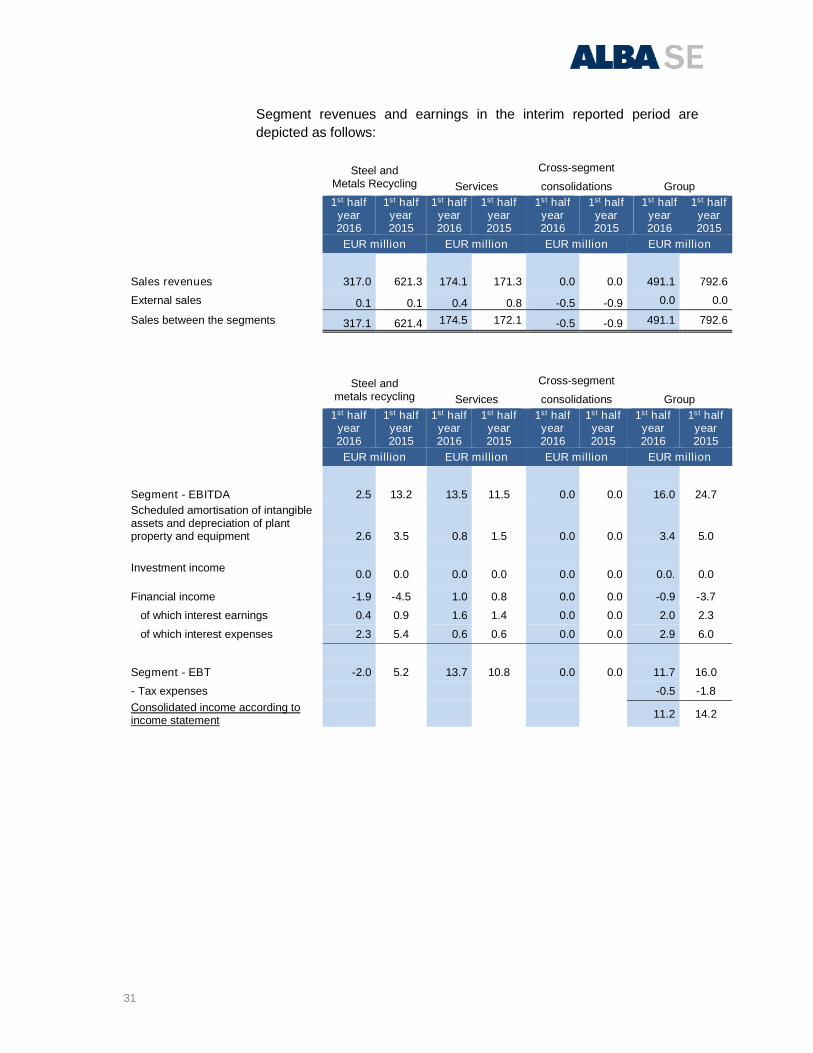
Segment revenues and earnings in the interim reported period are
depicted as follows:
Steel andMetals Recycling
Cross-segment
Services consolidations Group
1st halfyear2016
1st halfyear2015
1st halfyear2016
1st halfyear2015
1st halfyear2016
1st halfyear2015
1st halfyear2016
1st halfyear2015
EUR million EUR million EUR million EUR million
Sales revenues 317.0 621.3 174.1 171.3 0.0 0.0 491.1 792.6
External sales 0.1 0.1 0.4 0.8 -0.5 -0.9 0.0 0.0
Sales between the segments 317.1 621.4 174.5 172.1 -0.5 -0.9 491.1 792.6
Steel andmetals recycling
Cross-segment
Services consolidations Group
1st halfyear2016
1st halfyear2015
1st halfyear2016
1st halfyear2015
1st halfyear2016
1st halfyear2015
1st halfyear2016
1st halfyear2015
EUR million EUR million EUR million EUR million
Segment - EBITDA 2.5 13.2 13.5 11.5 0.0 0.0 16.0 24.7
Scheduled amortisation of intangibleassets and depreciation of plantproperty and equipment 2.6 3.5 0.8 1.5 0.0 0.0 3.4 5.0
Investment income0.0 0.0 0.0 0.0 0.0 0.0 0.0. 0.0
Financial income -1.9 -4.5 1.0 0.8 0.0 0.0 -0.9 -3.7
of which interest earnings 0.4 0.9 1.6 1.4 0.0 0.0 2.0 2.3
of which interest expenses 2.3 5.4 0.6 0.6 0.0 0.0 2.9 6.0
Segment - EBT -2.0 5.2 13.7 10.8 0.0 0.0 11.7 16.0
- Tax expenses -0.5 -1.8
Consolidated income according toincome statement
11.2 14.2
32
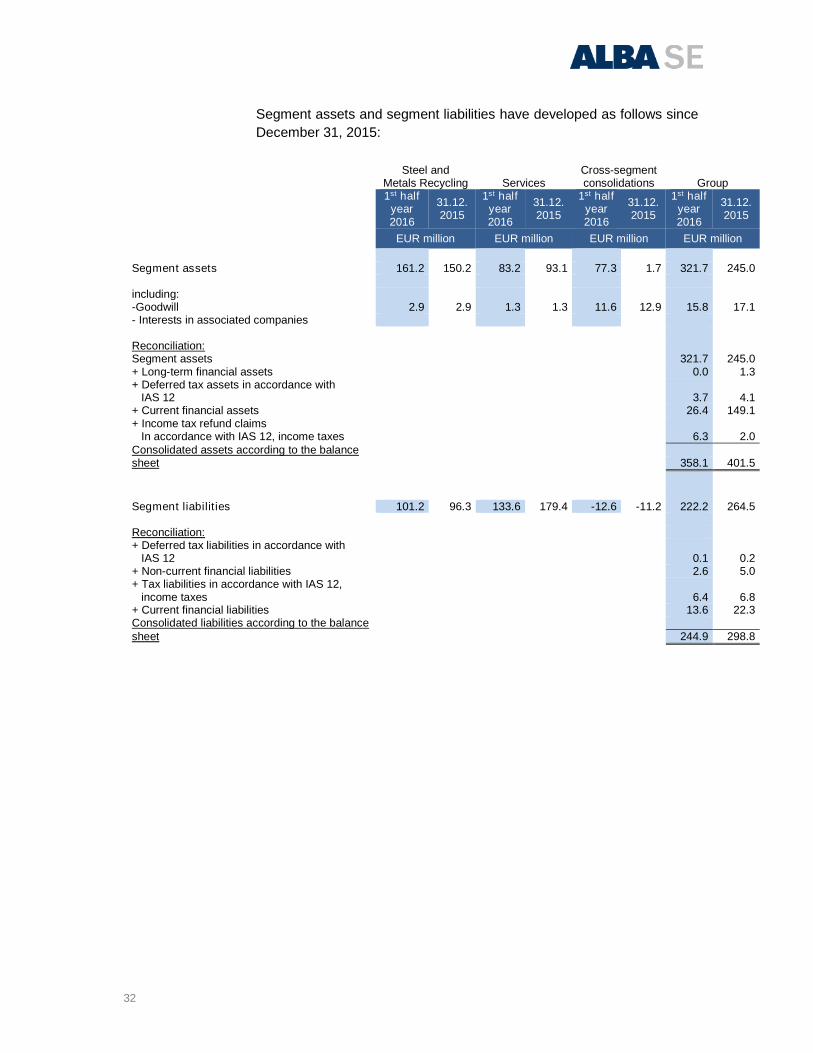
Segment assets and segment liabilities have developed as follows since
December 31, 2015:
Steel and Cross-segmentMetals Recycling Services consolidations Group1st half
year2016
31.12.2015
1st halfyear2016
31.12.2015
1st halfyear2016
31.12.2015
1st halfyear2016
31.12.2015
EUR million EUR million EUR million EUR million
Segment assets 161.2 150.2 83.2 93.1 77.3 1.7 321.7 245.0
including:-Goodwill 2.9 2.9 1.3 1.3 11.6 12.9 15.8 17.1- Interests in associated companies
Reconciliation:Segment assets 321.7 245.0+ Long-term financial assets 0.0 1.3+ Deferred tax assets in accordance with
IAS 12 3.7 4.1+ Current financial assets 26.4 149.1+ Income tax refund claims
In accordance with IAS 12, income taxes 6.3 2.0Consolidated assets according to the balancesheet 358.1 401.5
Segment liabilities 101.2 96.3 133.6 179.4 -12.6 -11.2 222.2 264.5
Reconciliation:+ Deferred tax liabilities in accordance with
IAS 12 0.1 0.2+ Non-current financial liabilities 2.6 5.0+ Tax liabilities in accordance with IAS 12,
income taxes 6.4 6.8+ Current financial liabilities 13.6 22.3Consolidated liabilities according to the balancesheet 244.9 298.8
33
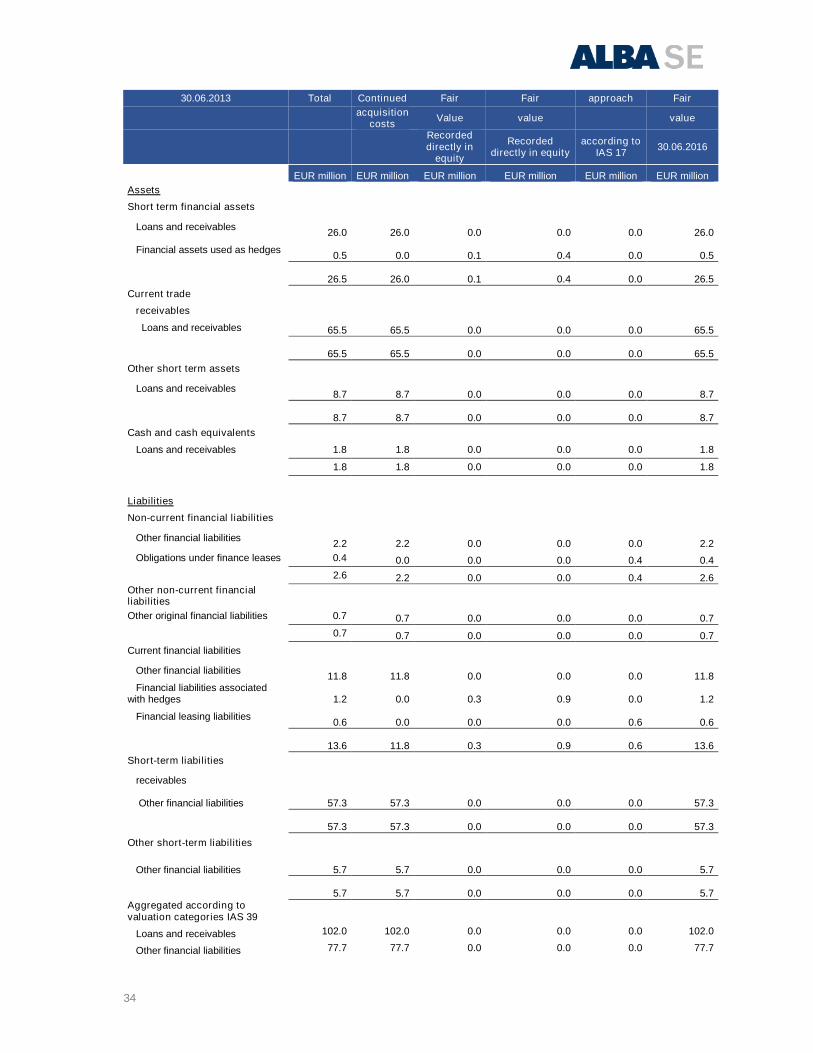
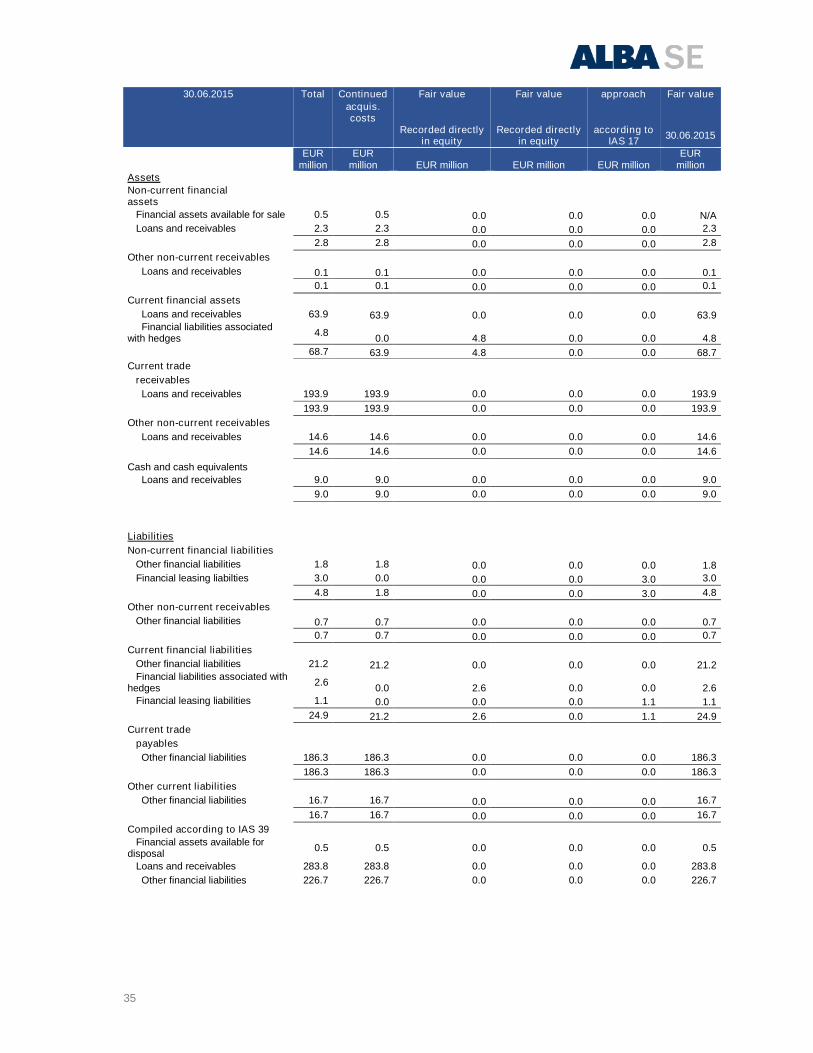
7. Financial Instruments
The following table depicts the financial assets and liabilities based on
valuation categories and classes. In the process, the financial instrument
classes correspond to the balance sheet classification. Liabilities from
financial leasing as well as derivatives with balance sheet hedges shall be
taken into account, even though they do not belong to any IAS 39
valuation category. The following financial instruments are reported in the
consolidated interim financial statements:
34
30.06.2013 Total Continued Fair Fair approach Fair
acquisitioncosts
Value value value
Recordeddirectly in
equity
Recordeddirectly in equity
according toIAS 17
30.06.2016
EUR million EUR million EUR million EUR million EUR million EUR million
Assets
Short term financial assets
Loans and receivables26.0 26.0 0.0 0.0 0.0 26.0
Financial assets used as hedges0.5 0.0 0.1 0.4 0.0 0.5
26.5 26.0 0.1 0.4 0.0 26.5
Current trade
receivables
Loans and receivables 65.5 65.5 0.0 0.0 0.0 65.5
65.5 65.5 0.0 0.0 0.0 65.5
Other short term assets
Loans and receivables8.7 8.7 0.0 0.0 0.0 8.7
8.7 8.7 0.0 0.0 0.0 8.7
Cash and cash equivalents
Loans and receivables 1.8 1.8 0.0 0.0 0.0 1.8
1.8 1.8 0.0 0.0 0.0 1.8
Liabilities
Non-current financial liabilities
Other financial liabilities2.2 2.2 0.0 0.0 0.0 2.2
Obligations under finance leases 0.4 0.0 0.0 0.0 0.4 0.4
2.6 2.2 0.0 0.0 0.4 2.6Other non-current financialliabilities
Other original financial liabilities 0.7 0.7 0.0 0.0 0.0 0.7
0.7 0.7 0.0 0.0 0.0 0.7
Current financial liabilities
Other financial liabilities11.8 11.8 0.0 0.0 0.0 11.8
Financial liabilities associatedwith hedges 1.2 0.0 0.3 0.9 0.0 1.2
Financial leasing liabilities0.6 0.0 0.0 0.0 0.6 0.6
13.6 11.8 0.3 0.9 0.6 13.6
Short-term liabilities
receivables
Other financial liabilities 57.3 57.3 0.0 0.0 0.0 57.3
57.3 57.3 0.0 0.0 0.0 57.3
Other short-term liabilities
Other financial liabilities 5.7 5.7 0.0 0.0 0.0 5.7
5.7 5.7 0.0 0.0 0.0 5.7Aggregated according tovaluation categories IAS 39
Loans and receivables 102.0 102.0 0.0 0.0 0.0 102.0
Other financial liabilities 77.7 77.7 0.0 0.0 0.0 77.7
35
30.06.2015 Total Continued Fair value Fair value approach Fair value
acquis.costs
Recorded directlyin equity
Recorded directlyin equity
according toIAS 17
30.06.2015
EURmillion
EURmillion EUR million EUR million EUR million
EURmillion
Assets
Non-current financialassets
Financial assets available for sale 0.5 0.5 0.0 0.0 0.0 N/A
Loans and receivables 2.3 2.3 0.0 0.0 0.0 2.3
2.8 2.8 0.0 0.0 0.0 2.8
Other non-current receivables
Loans and receivables 0.1 0.1 0.0 0.0 0.0 0.1
0.1 0.1 0.0 0.0 0.0 0.1
Current financial assets
Loans and receivables 63.9 63.9 0.0 0.0 0.0 63.9Financial liabilities associated
with hedges4.8
0.0 4.8 0.0 0.0 4.8
68.7 63.9 4.8 0.0 0.0 68.7
Current trade
receivables
Loans and receivables 193.9 193.9 0.0 0.0 0.0 193.9
193.9 193.9 0.0 0.0 0.0 193.9
Other non-current receivables
Loans and receivables 14.6 14.6 0.0 0.0 0.0 14.6
14.6 14.6 0.0 0.0 0.0 14.6
Cash and cash equivalents
Loans and receivables 9.0 9.0 0.0 0.0 0.0 9.0
9.0 9.0 0.0 0.0 0.0 9.0
Liabilities
Non-current financial liabilities
Other financial liabilities 1.8 1.8 0.0 0.0 0.0 1.8
Financial leasing liabilties 3.0 0.0 0.0 0.0 3.0 3.0
4.8 1.8 0.0 0.0 3.0 4.8
Other non-current receivables
Other financial liabilities 0.7 0.7 0.0 0.0 0.0 0.7
0.7 0.7 0.0 0.0 0.0 0.7
Current financial liabilities
Other financial liabilities 21.2 21.2 0.0 0.0 0.0 21.2Financial liabilities associated with
hedges2.6
0.0 2.6 0.0 0.0 2.6
Financial leasing liabilities 1.1 0.0 0.0 0.0 1.1 1.1
24.9 21.2 2.6 0.0 1.1 24.9
Current trade
payables
Other financial liabilities 186.3 186.3 0.0 0.0 0.0 186.3
186.3 186.3 0.0 0.0 0.0 186.3
Other current liabilities
Other financial liabilities 16.7 16.7 0.0 0.0 0.0 16.7
16.7 16.7 0.0 0.0 0.0 16.7
Compiled according to IAS 39
Financial assets available fordisposal
0.5 0.5 0.0 0.0 0.0 0.5
Loans and receivables 283.8 283.8 0.0 0.0 0.0 283.8
Other financial liabilities 226.7 226.7 0.0 0.0 0.0 226.7
36
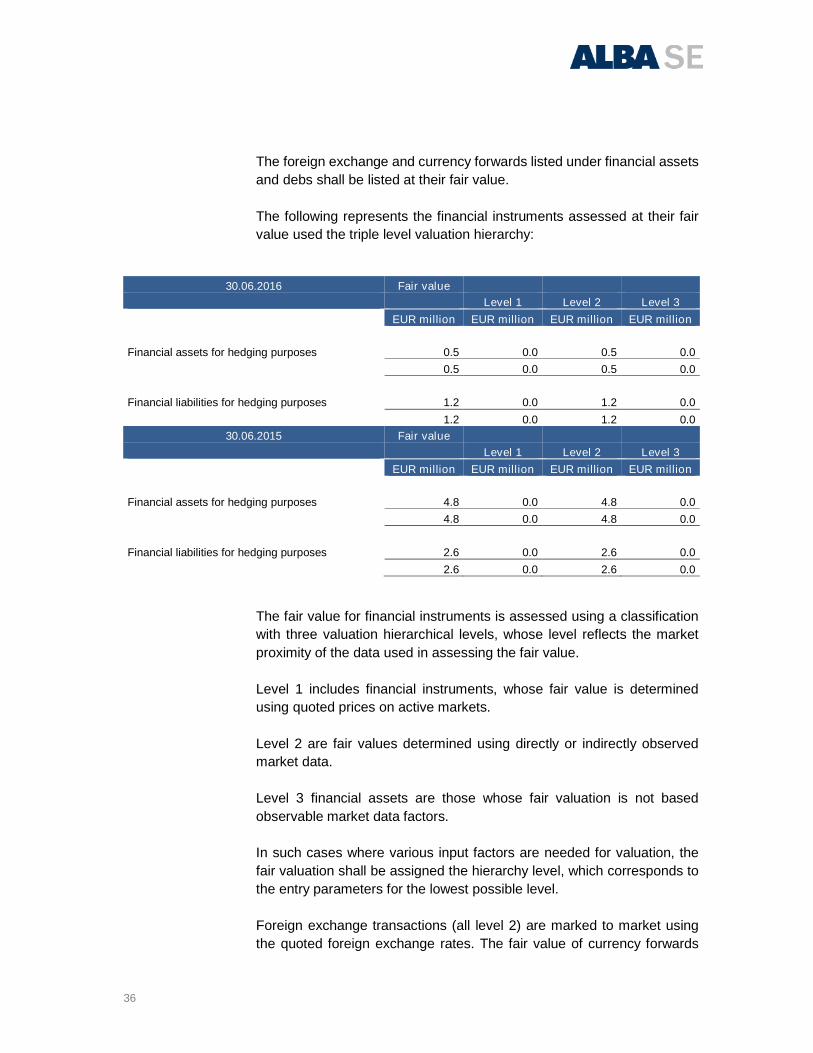
The foreign exchange and currency forwards listed under financial assets
and debs shall be listed at their fair value.
The following represents the financial instruments assessed at their fair
value used the triple level valuation hierarchy:
30.06.2016 Fair value
Level 1 Level 2 Level 3
EUR million EUR million EUR million EUR million
Financial assets for hedging purposes 0.5 0.0 0.5 0.0
0.5 0.0 0.5 0.0
Financial liabilities for hedging purposes 1.2 0.0 1.2 0.0
1.2 0.0 1.2 0.0
30.06.2015 Fair value
Level 1 Level 2 Level 3
EUR million EUR million EUR million EUR million
Financial assets for hedging purposes 4.8 0.0 4.8 0.0
4.8 0.0 4.8 0.0
Financial liabilities for hedging purposes 2.6 0.0 2.6 0.0
2.6 0.0 2.6 0.0
The fair value for financial instruments is assessed using a classification
with three valuation hierarchical levels, whose level reflects the market
proximity of the data used in assessing the fair value.
Level 1 includes financial instruments, whose fair value is determined
using quoted prices on active markets.
Level 2 are fair values determined using directly or indirectly observed
market data.
Level 3 financial assets are those whose fair valuation is not based
observable market data factors.
In such cases where various input factors are needed for valuation, the
fair valuation shall be assigned the hierarchy level, which corresponds to
the entry parameters for the lowest possible level.
Foreign exchange transactions (all level 2) are marked to market using
the quoted foreign exchange rates. The fair value of currency forwards
37
(Level 2) is calculated as the average of the price set by the market for
the previous month.
Financial instruments listed at their acquisition cost in the balance sheet
and whose fair value can first be found in the noted shall also be classified
using the triple level fair value hierarchy.
Trade receivables, short-term financial assets, other short-term
receivables as well as cash and cash equivalents are equal to the carrying
value based on the maturity used to approximate the fair value.
The fair value of all other financial assets and financial liabilities shall be
assessed using their cash value of the payments associated with these
balance sheet items. The calculation shall use the interest structure
curves applicable at the reporting date (Level 2).
8. Related Party Disclosures
The court decision of January 14, 2016 appointed Mr. Dirk Beuth as
Administrative Board member. The term ended at the end of the orderly
General Shareholders' Meeting on June 7, 2016. The ALBA SE general
meeting appointed Dr. Axel Schweitzer, Dirk Beuth and Robert Nansink
once again to the Administrative Board. The appointment of the
Administrative Board members was performed in compliance with § 8 (2)
of the company statutes for the period up to the end of the General
Shareholders' Meeting, which passed a resolution regarding approval for
the five fiscal year term in office, but no more than six years. The fiscal
year in which the appointment has been made is not included in such
calculations.
9. Events After the end of the Interim Reporting
Period
No material events have occurred since the end of the intermediate
reporting period.
10. Audit Review
The consolidated interim financial statements for the period January 1, to
June 30, 2016, and the interim management report as at June 30, 2016,
have neither been subject to audit review nor audited according to § 317
of the German Commercial Code (HGB).
38
11. Assurances of Legal Representatives
To the best of our knowledge we provide assurance that the consolidated
interim financial statements prepared in accordance with applicable
accounting principles for interim financial reporting represent a true and
fair view of the Group’s financial, earnings and liquidity position and that
the interim Group management report presents the course of business,
including business results and the situation of the Group, such that a true
and fair view is conveyed and that significant risks and opportunities
inherent in the anticipated development of the Group during the remaining
fiscal year are described.
Cologne, August 5, 2016
ALBA SE
Executive Director
Rob Nansink
39
Contacts:ALBA SEInvestor RelationsStollwerckstraße 9a51149 Cologne, GermanyPhone: +49 2203 9147-0E-Mail: [email protected]: www.alba-se.de