Embed Size (px)
Citation preview

AIRLINE QUARTERLY FINANCIAL REVIEW
FIRST QUARTER 2017
MAJORS
DEPARTMENT OF TRANSPORTATION OFFICE OF AVIATION ANALYSIS COMPETITION AND POLICY ANALYIS DIVISION
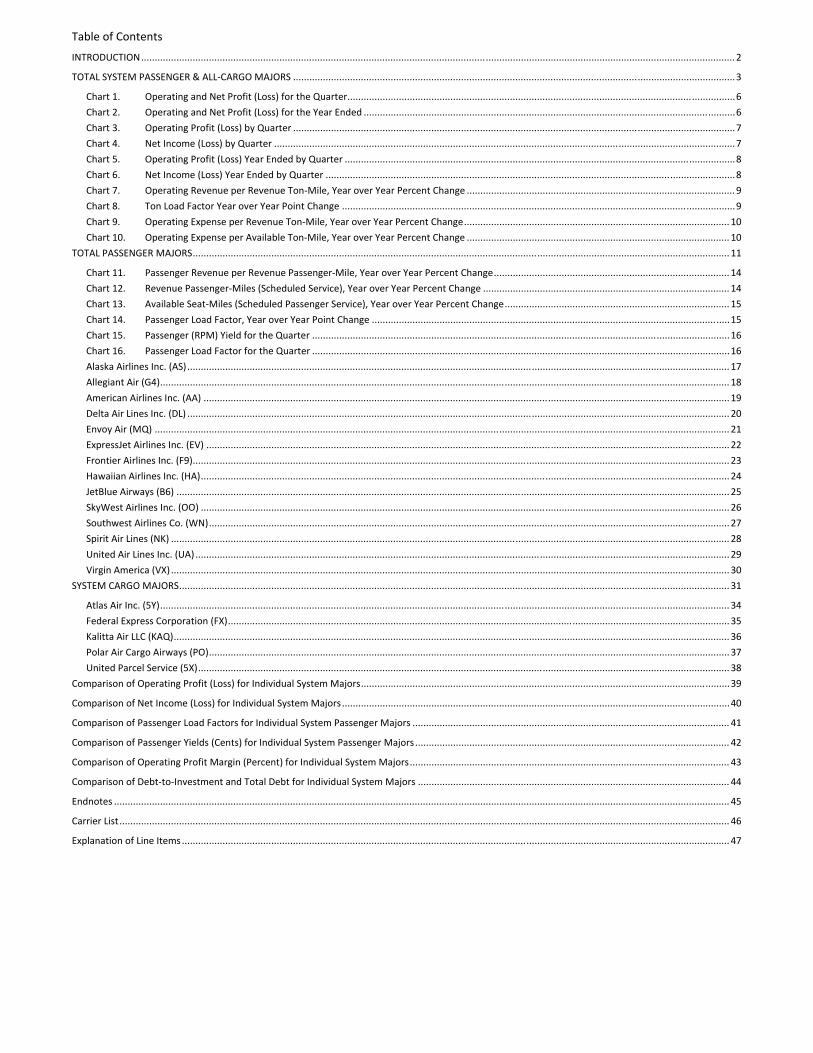
Table of Contents
INTRODUCTION ........................................................................................................................................................................................................................... 2
TOTAL SYSTEM PASSENGER & ALL‐CARGO MAJORS ................................................................................................................................................................... 3
Chart 1. Operating and Net Profit (Loss) for the Quarter ............................................................................................................................................... 6 Chart 2. Operating and Net Profit (Loss) for the Year Ended ......................................................................................................................................... 6 Chart 3. Operating Profit (Loss) by Quarter ................................................................................................................................................................... 7 Chart 4. Net Income (Loss) by Quarter .......................................................................................................................................................................... 7 Chart 5. Operating Profit (Loss) Year Ended by Quarter ................................................................................................................................................ 8 Chart 6. Net Income (Loss) Year Ended by Quarter ....................................................................................................................................................... 8 Chart 7. Operating Revenue per Revenue Ton‐Mile, Year over Year Percent Change ................................................................................................... 9 Chart 8. Ton Load Factor Year over Year Point Change ................................................................................................................................................. 9 Chart 9. Operating Expense per Revenue Ton‐Mile, Year over Year Percent Change .................................................................................................. 10 Chart 10. Operating Expense per Available Ton‐Mile, Year over Year Percent Change ................................................................................................. 10
TOTAL PASSENGER MAJORS ...................................................................................................................................................................................................... 11
Chart 11. Passenger Revenue per Revenue Passenger‐Mile, Year over Year Percent Change ....................................................................................... 14 Chart 12. Revenue Passenger‐Miles (Scheduled Service), Year over Year Percent Change ........................................................................................... 14 Chart 13. Available Seat‐Miles (Scheduled Passenger Service), Year over Year Percent Change ................................................................................... 15 Chart 14. Passenger Load Factor, Year over Year Point Change .................................................................................................................................... 15 Chart 15. Passenger (RPM) Yield for the Quarter .......................................................................................................................................................... 16 Chart 16. Passenger Load Factor for the Quarter .......................................................................................................................................................... 16 Alaska Airlines Inc. (AS) ........................................................................................................................................................................................................ 17 Allegiant Air (G4) .................................................................................................................................................................................................................. 18 American Airlines Inc. (AA) .................................................................................................................................................................................................. 19 Delta Air Lines Inc. (DL) ........................................................................................................................................................................................................ 20 Envoy Air (MQ) .................................................................................................................................................................................................................... 21 ExpressJet Airlines Inc. (EV) ................................................................................................................................................................................................. 22 Frontier Airlines Inc. (F9)...................................................................................................................................................................................................... 23 Hawaiian Airlines Inc. (HA) ................................................................................................................................................................................................... 24 JetBlue Airways (B6) ............................................................................................................................................................................................................ 25 SkyWest Airlines Inc. (OO) ................................................................................................................................................................................................... 26 Southwest Airlines Co. (WN) ................................................................................................................................................................................................ 27 Spirit Air Lines (NK) .............................................................................................................................................................................................................. 28 United Air Lines Inc. (UA) ..................................................................................................................................................................................................... 29 Virgin America (VX) .............................................................................................................................................................................................................. 30
SYSTEM CARGO MAJORS ........................................................................................................................................................................................................... 31
Atlas Air Inc. (5Y) .................................................................................................................................................................................................................. 34 Federal Express Corporation (FX) ......................................................................................................................................................................................... 35 Kalitta Air LLC (KAQ) ............................................................................................................................................................................................................. 36 Polar Air Cargo Airways (PO) ................................................................................................................................................................................................ 37 United Parcel Service (5X) .................................................................................................................................................................................................... 38
Comparison of Operating Profit (Loss) for Individual System Majors ........................................................................................................................................ 39
Comparison of Net Income (Loss) for Individual System Majors ............................................................................................................................................... 40
Comparison of Passenger Load Factors for Individual System Passenger Majors ..................................................................................................................... 41
Comparison of Passenger Yields (Cents) for Individual System Passenger Majors .................................................................................................................... 42
Comparison of Operating Profit Margin (Percent) for Individual System Majors ...................................................................................................................... 43
Comparison of Debt‐to‐Investment and Total Debt for Individual System Majors ................................................................................................................... 44
Endnotes ................................................................................................................................................................................................................................... 45
Carrier List ................................................................................................................................................................................................................................. 46
Explanation of Line Items .......................................................................................................................................................................................................... 47
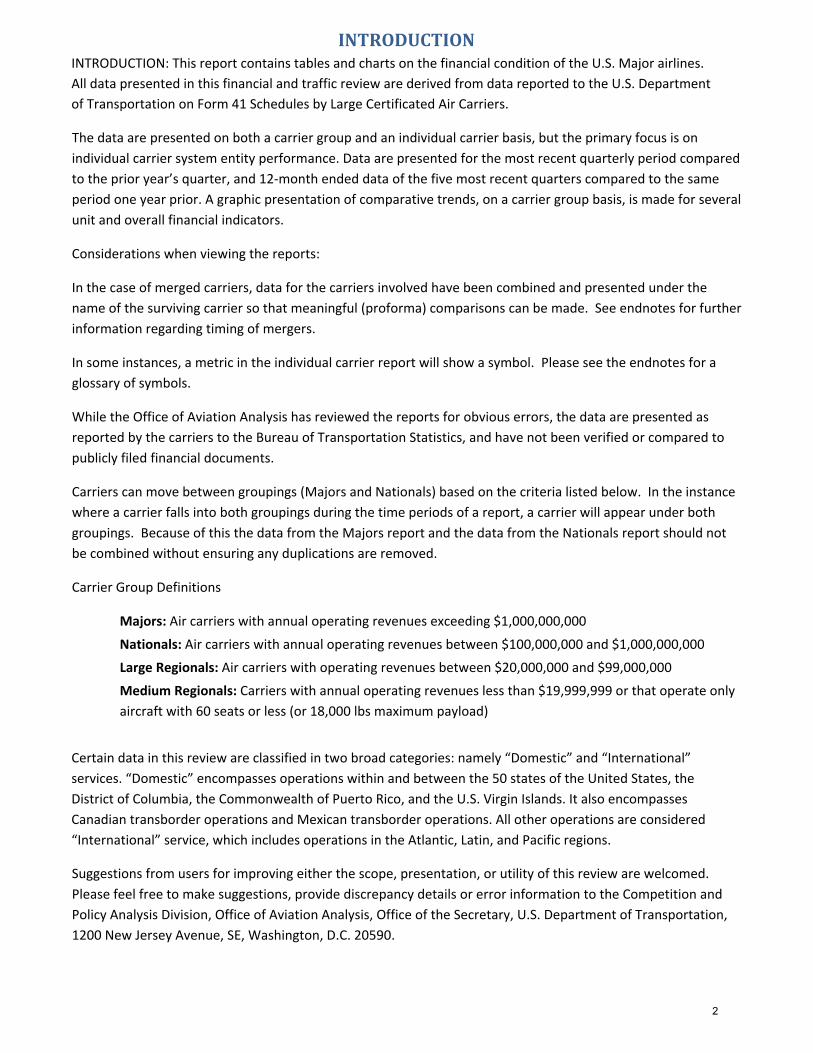
INTRODUCTIONINTRODUCTION: This report contains tables and charts on the financial condition of the U.S. Major airlines. All data presented in this financial and traffic review are derived from data reported to the U.S. Department of Transportation on Form 41 Schedules by Large Certificated Air Carriers.
The data are presented on both a carrier group and an individual carrier basis, but the primary focus is on
individual carrier system entity performance. Data are presented for the most recent quarterly period compared
to the prior year’s quarter, and 12‐month ended data of the five most recent quarters compared to the same
period one year prior. A graphic presentation of comparative trends, on a carrier group basis, is made for several
unit and overall financial indicators.
Considerations when viewing the reports:
In the case of merged carriers, data for the carriers involved have been combined and presented under the
name of the surviving carrier so that meaningful (proforma) comparisons can be made. See endnotes for further
information regarding timing of mergers.
In some instances, a metric in the individual carrier report will show a symbol. Please see the endnotes for a
glossary of symbols.
While the Office of Aviation Analysis has reviewed the reports for obvious errors, the data are presented as
reported by the carriers to the Bureau of Transportation Statistics, and have not been verified or compared to
publicly filed financial documents.
Carriers can move between groupings (Majors and Nationals) based on the criteria listed below. In the instance
where a carrier falls into both groupings during the time periods of a report, a carrier will appear under both
groupings. Because of this the data from the Majors report and the data from the Nationals report should not
be combined without ensuring any duplications are removed.
Carrier Group Definitions
Majors: Air carriers with annual operating revenues exceeding $1,000,000,000
Nationals: Air carriers with annual operating revenues between $100,000,000 and $1,000,000,000
Large Regionals: Air carriers with operating revenues between $20,000,000 and $99,000,000
Medium Regionals: Carriers with annual operating revenues less than $19,999,999 or that operate only
aircraft with 60 seats or less (or 18,000 lbs maximum payload)
Certain data in this review are classified in two broad categories: namely “Domestic” and “International” services. “Domestic” encompasses operations within and between the 50 states of the United States, the District of Columbia, the Commonwealth of Puerto Rico, and the U.S. Virgin Islands. It also encompasses Canadian transborder operations and Mexican transborder operations. All other operations are considered “International” service, which includes operations in the Atlantic, Latin, and Pacific regions.
Suggestions from users for improving either the scope, presentation, or utility of this review are welcomed.
Please feel free to make suggestions, provide discrepancy details or error information to the Competition and
Policy Analysis Division, Office of Aviation Analysis, Office of the Secretary, U.S. Department of Transportation,
1200 New Jersey Avenue, SE, Washington, D.C. 20590.
2

QUARTERLY FINANCIAL & TRAFFIC REVIEWSYSTEM OPERATIONS
System All Majors
2017 q1 2016 q1 2017 q1 2016 q4 2016 q3 2016 q2 2016 q1Quarter Ended 12 Months Ended
Items
FINANCIAL RESULTS: ($Millions)
1 Operating Revenues 49,028.1 46,018.7 204,528.8 201,519.4 198,642.6 197,614.8 197,665.4
2 Operating Expenses 45,055.6 39,740.6 178,869.1 173,554.1 169,243.7 166,712.9 166,516.4
3 Operating Profit (Loss) 3,972.5 6,278.1 25,659.7 27,965.3 29,398.8 30,901.9 31,149.0
4 Net Income (Loss) 2,093.5 3,624.4 14,880.8 16,411.7 20,978.1 25,908.3 26,359.4
TRAFFIC: (Billions)
5 RPMs - Scheduled Rev. Svc. 205.8 201.8 892.1 888.1 882.8 877.2 869.4
6 ASMs - Scheduled Rev. Svc. 253.7 248.3 1,066.4 1,060.9 1,054.2 1,045.3 1,035.9
7 Overall RTMs (All Svc.) 29.0 28.0 123.9 122.9 121.9 121.1 120.3
8 Overall ATMs (All Svc.) 47.2 46.5 201.3 200.6 198.4 196.7 194.7
YIELD & UNIT COST & PROFITS: (Cents)
9 Operating Revenue per RTM 169.1 164.4 165.1 164.0 163.0 163.2 164.3
10 Operating Expense per RTM 155.4 142.0 144.4 141.2 138.9 137.7 138.4
11 Operating Profit (Loss) per RTM 13.7 22.4 20.7 22.8 24.1 25.5 25.9
12 Operating Expense per ATM 95.5 85.4 88.8 86.5 85.3 84.8 85.5
13 Passenger Revenue per RPM 13.67 13.74 13.50 13.52 13.57 13.74 13.96
FINANCIAL RATIOS:
14 Operating Revenues to Total Investment * * 1.60 1.63 1.66 1.72 1.79
15 Times Interest Earned * * 10.95 12.08 12.47 12.62 12.47
16 Current Assets to Current Liabilities * * 0.83 0.85 0.83 0.76 0.77
17 No. of Days Cash Coverage of Cash Exp. * * 52.5 53.6 63.3 60.0 56.4
FINANCIAL PERCENTAGES: (%)
18 Operating Profit (Loss) to Operating Revenue 8.1 13.6 12.5 13.9 14.8 15.6 15.8
19 Net Income to Stockholders Equity * * 20.22 23.06 30.74 40.34 43.84
20 Corporate Return on Investment * * 13.5 15.1 19.4 24.6 26.0
21 Debt to Total Investment * * 42.9 41.8 42.0 42.2 43.3
LOAD FACTOR: (%)
22 Passenger Load Factor (Sch. Svc.) 81.1 81.3 83.7 83.7 83.7 83.9 83.9
23 Ton Load Factor (All Svc.) 61.4 60.2 61.6 61.3 61.4 61.5 61.8
Employment & Productivity:
24 Employment, Total Weighted Avg CY 598,424 532,310 589,249 572,721 556,295 539,207 526,978
25 Overall RTM's per Employee (000) 48.4 52.6 210.3 214.6 219.0 224.5 228.4
CHANGE OVER COMPARABLE PERIOD 12 MONTHS EARLIER
26 Operating Revenues (%) 6.5 -0.7 3.5 1.8 -0.2 -1.1 -1.6
27 Operating Expenses (%) 13.4 -2.7 7.4 3.5 -2.0 -5.8 -7.9
28 Operating Profit (Loss) (in Millions $) -2,305.6 768.9 -5,489.3 -2,414.7 3,089.9 8,036.9 11,143.5
29 Net Income (Loss) (in Millions $) -1,530.9 149.0 -11,478.6 -9,798.7 1,727.3 12,759.2 15,055.8
30 RPMs (Sch. Svc.) (%) 2.0 5.2 2.6 3.3 4.1 4.9 4.9
31 ASMs (Sch. Svc.) (%) 2.2 5.3 2.9 3.7 4.0 4.3 4.5
32 Operating Revenues per RTM (%) 2.9 -2.7 0.5 -0.8 -2.8 -3.8 -4.4
33 Operating Expense per RTM (%) 9.5 -4.7 4.3 0.9 -4.5 -8.4 -10.6
34 Passenger Revenue per RPM (Sch. Svc.)(%) -0.5 -6.5 -3.3 -4.7 -5.9 -6.3 -6.0
3

QUARTERLY FINANCIAL & TRAFFIC REVIEWDOMESTIC OPERATIONS
Domestic All Majors
2017 q1 2016 q1 2017 q1 2016 q4 2016 q3 2016 q2 2016 q1Quarter Ended 12 Months Ended
Items
FINANCIAL RESULTS: ($Millions)
1 Operating Revenues 35,481.2 33,274.4 147,049.3 144,842.4 142,946.3 141,987.0 141,417.0
2 Operating Expenses 31,119.9 27,756.1 123,504.6 120,140.7 117,419.4 115,693.8 115,223.7
3 Operating Profit (Loss) 4,361.3 5,518.3 23,544.7 24,701.7 25,526.9 26,293.2 26,193.3
4 Net Income (Loss) 2,448.6 3,008.1 13,635.3 14,194.9 18,248.8 20,846.7 21,132.7
TRAFFIC: (Billions)
5 RPMs - Scheduled Rev. Svc. 147.1 143.1 628.8 624.8 619.8 614.0 607.1
6 ASMs - Scheduled Rev. Svc. 177.9 172.7 739.7 734.4 728.1 719.7 711.9
7 Overall RTMs (All Svc.) 18.0 17.3 76.3 75.7 75.0 74.2 73.5
8 Overall ATMs (All Svc.) 28.4 28.0 119.0 118.6 117.1 116.1 115.1
YIELD & UNIT COST & PROFITS: (Cents)
9 Operating Revenue per RTM 197.7 192.0 192.8 191.4 190.7 191.2 192.4
10 Operating Expense per RTM 173.4 160.2 161.9 158.8 156.6 155.8 156.7
11 Operating Profit (Loss) per RTM 24.3 31.8 30.9 32.7 34.1 35.4 35.6
12 Operating Expense per ATM 109.5 99.0 103.8 101.3 100.3 99.7 100.1
13 Passenger Revenue per RPM 13.97 14.09 13.78 13.80 13.87 14.02 14.21
FINANCIAL RATIOS:
14 Operating Revenues to Total Investment * * ** ** ** ** **
15 Times Interest Earned * * ** ** ** ** **
16 Current Assets to Current Liabilities * * ** ** ** ** **
17 No. of Days Cash Coverage of Cash Exp. * * ** ** ** ** **
FINANCIAL PERCENTAGES: (%)
18 Operating Profit (Loss) to Operating Revenue 12.3 16.6 16.0 17.1 17.9 18.5 18.5
19 Net Income to Stockholders Equity * * ** ** ** ** **
20 Corporate Return on Investment * * ** ** ** ** **
21 Debt to Total Investment * * ** ** ** ** **
LOAD FACTOR: (%)
22 Passenger Load Factor (Sch. Svc.) 82.7 82.8 85.0 85.1 85.1 85.3 85.3
23 Ton Load Factor (All Svc.) 63.2 61.8 64.1 63.8 64.0 64.0 63.9
Employment & Productivity:
24 Employment, Total Weighted Avg CY * * ** ** ** ** **
25 Overall RTM's per Employee (000) * * ** ** ** ** **
CHANGE OVER COMPARABLE PERIOD 12 MONTHS EARLIER
26 Operating Revenues (%) 6.6 0.8 4.0 2.6 1.3 0.8 0.3
27 Operating Expenses (%) 12.1 -1.3 7.2 3.9 -0.8 -4.2 -6.3
28 Operating Profit (Loss) (in Millions $) -1,157.0 606.7 -2,648.6 -885.0 2,758.9 6,097.3 8,096.5
29 Net Income (Loss) (in Millions $) -559.5 -12.6 -7,497.3 -6,950.4 2,705.6 8,943.5 10,429.2
30 RPMs (Sch. Svc.) (%) 2.8 6.6 3.6 4.4 5.4 6.0 6.1
31 ASMs (Sch. Svc.) (%) 3.0 6.9 3.9 4.8 5.2 5.3 5.6
32 Operating Revenues per RTM (%) 2.9 -3.9 0.2 -1.4 -3.2 -4.0 -4.6
33 Operating Expense per RTM (%) 8.2 -5.9 3.3 -0.1 -5.2 -8.7 -10.8
34 Passenger Revenue per RPM (Sch. Svc.)(%) -0.8 -5.1 -3.0 -4.0 -4.7 -4.9 -4.6
4

QUARTERLY FINANCIAL & TRAFFIC REVIEWINTERNATIONAL OPERATIONS
International All Majors
2017 q1 2016 q1 2017 q1 2016 q4 2016 q3 2016 q2 2016 q1Quarter Ended 12 Months Ended
Items
FINANCIAL RESULTS: ($Millions)
1 Operating Revenues 13,546.9 12,744.4 57,479.5 56,677.0 55,696.2 55,627.8 56,248.4
2 Operating Expenses 13,935.7 11,984.6 55,364.5 53,413.4 51,824.3 51,019.1 51,292.7
3 Operating Profit (Loss) -388.8 759.8 2,115.0 3,263.6 3,871.9 4,608.7 4,955.6
4 Net Income (Loss) -355.1 616.3 1,245.5 2,216.9 2,729.3 5,061.6 5,226.8
TRAFFIC: (Billions)
5 RPMs - Scheduled Rev. Svc. 58.7 58.7 263.3 263.3 263.0 263.2 262.3
6 ASMs - Scheduled Rev. Svc. 75.8 75.6 326.7 326.5 326.1 325.6 324.1
7 Overall RTMs (All Svc.) 11.0 10.7 47.6 47.3 46.9 46.8 46.8
8 Overall ATMs (All Svc.) 18.8 18.5 82.4 82.1 81.3 80.6 79.6
YIELD & UNIT COST & PROFITS: (Cents)
9 Operating Revenue per RTM 122.7 119.5 120.7 119.9 118.8 118.8 120.1
10 Operating Expense per RTM 126.2 112.4 116.2 113.0 110.5 109.0 109.5
11 Operating Profit (Loss) per RTM -3.5 7.1 4.4 6.9 8.3 9.8 10.6
12 Operating Expense per ATM 74.2 64.9 67.2 65.1 63.7 63.3 64.4
13 Passenger Revenue per RPM 12.93 12.90 12.84 12.84 12.85 13.08 13.40
FINANCIAL RATIOS:
14 Operating Revenues to Total Investment * * ** ** ** ** **
15 Times Interest Earned * * ** ** ** ** **
16 Current Assets to Current Liabilities * * ** ** ** ** **
17 No. of Days Cash Coverage of Cash Exp. * * ** ** ** ** **
FINANCIAL PERCENTAGES: (%)
18 Operating Profit (Loss) to Operating Revenue -2.9 6.0 3.7 5.8 7.0 8.3 8.8
19 Net Income to Stockholders Equity * * ** ** ** ** **
20 Corporate Return on Investment * * ** ** ** ** **
21 Debt to Total Investment * * ** ** ** ** **
LOAD FACTOR: (%)
22 Passenger Load Factor (Sch. Svc.) 77.5 77.7 80.6 80.6 80.7 80.8 81.0
23 Ton Load Factor (All Svc.) 58.8 57.7 57.8 57.6 57.7 58.1 58.8
Employment & Productivity:
24 Employment, Total Weighted Avg CY * * ** ** ** ** **
25 Overall RTM's per Employee (000) * * ** ** ** ** **
CHANGE OVER COMPARABLE PERIOD 12 MONTHS EARLIER
26 Operating Revenues (%) 6.3 -4.4 2.2 -0.3 -3.8 -5.5 -6.0
27 Operating Expenses (%) 16.3 -5.9 7.9 2.6 -4.7 -9.2 -11.4
28 Operating Profit (Loss) (in Millions $) -1,148.6 162.2 -2,840.7 -1,529.8 331.0 1,939.6 3,047.0
29 Net Income (Loss) (in Millions $) -971.4 161.6 -3,981.3 -2,848.3 -978.3 3,815.7 4,626.5
30 RPMs (Sch. Svc.) (%) 0.0 1.9 0.4 0.8 1.2 2.4 2.2
31 ASMs (Sch. Svc.) (%) 0.3 2.0 0.8 1.2 1.3 2.1 2.1
32 Operating Revenues per RTM (%) 2.6 -2.2 0.5 -0.7 -3.4 -5.1 -5.8
33 Operating Expense per RTM (%) 12.3 -3.7 6.1 2.2 -4.3 -8.9 -11.3
34 Passenger Revenue per RPM (Sch. Svc.)(%) 0.2 -10.2 -4.1 -6.4 -9.0 -9.9 -9.2
5

-$200
$0
$200
$400
$600
$800
$1,000
$1,200
Op Profit 604 215 148 1068 -1 -3 66 72 -2 59 47 278 -14 658
Net Income 263 123 85 616 0 0 64 39 1 32 28 97 -21 351
AA^ AS B6 DL EV^ F9 G4^ HA MQ NK^ OO UA VX^ WN^
Chart 1. Operating Profit and Net Income (Loss)For the Quarter 2017q1
COMPARISONS AMOUNG PASSENGER MAJOR GROUP AIRLINES
$Millions
-$1,000
$0
$1,000
$2,000
$3,000
$4,000
$5,000
$6,000
$7,000
Op Profit 4585 1354 1107 6500 -290 255 299 452 9 402 228 3970 160 3474
Net Income 2334 817 644 4071 94 164 288 226 2 235 13 2047 64 2082
AA^ AS B6 DL EV^ F9 G4^ HA MQ NK^ OO UA VX^ WN^
Chart 2. Operating Profit and Net Income (Loss)For the Year Ended 2017q1$Millions
SYSTEM ENTITY
6

$0
$1
$2
$3
$4
$5
$6
$7
$8
$9
$10
2014q2 2014q3 2014q4 2015q1 2015q2 2015q3 2015q4 2016q1 2016q2 2016q3 2016q4 2017q1
Chart 3. Operating Profit (Loss)
By Quarter
TOTAL ALL MAJOR GROUP AIRLINES
$Billions
SYSTEM ENTITY
$0
$2
$4
$6
$8
$10
$12
2014q2 2014q3 2014q4 2015q1 2015q2 2015q3 2015q4 2016q1 2016q2 2016q3 2016q4 2017q1
Chart 4. Net Income (Loss)
By Quarter$Billions
7

$0
$5
$10
$15
$20
$25
$30
$35
2014q2 2014q3 2014q4 2015q1 2015q2 2015q3 2015q4 2016q1 2016q2 2016q3 2016q4 2017q1
Chart 5. Operating Profit (Loss)
Year Ended By Quarter
TOTAL ALL MAJOR GROUP AIRLINES
$Billions
SYSTEM ENTITY
$0
$5
$10
$15
$20
$25
$30
2014q2 2014q3 2014q4 2015q1 2015q2 2015q3 2015q4 2016q1 2016q2 2016q3 2016q4 2017q1
Chart 6. Net Income (Loss)
Year Ended By Quarter$Billions
8

-3.00
-2.50
-2.00
-1.50
-1.00
-0.50
0.00
0.50
1.00
1.50
2014q2 2014q3 2014q4 2015q1 2015q2 2015q3 2015q4 2016q1 2016q2 2016q3 2016q4 2017q1
Quarter Year Ended By Quarter
-6%
-4%
-2%
0%
2%
4%
6%
2014q2 2014q3 2014q4 2015q1 2015q2 2015q3 2015q4 2016q1 2016q2 2016q3 2016q4 2017q1
Quarter Year Ended By Quarter
Chart 7. Operating Revenue Per Revenue Ton-Mile
Year Over Year Percent ChangePercent Change YOY
Chart 8. Ton Load Factor
Year Over Year Point ChangePoint Change YOY
TOTAL ALL MAJOR GROUP AIRLINES
SYSTEM ENTITY
9

-20%
-15%
-10%
-5%
0%
5%
10%
15%
2014q2 2014q3 2014q4 2015q1 2015q2 2015q3 2015q4 2016q1 2016q2 2016q3 2016q4 2017q1
Quarter Year Ended By Quarter
-20%
-15%
-10%
-5%
0%
5%
10%
15%
2014q2 2014q3 2014q4 2015q1 2015q2 2015q3 2015q4 2016q1 2016q2 2016q3 2016q4 2017q1
Quarter Year Ended By Quarter
Chart 9. Operating Expense Per Revenue Ton-Mile
Year Over Year Percent ChangePercent Change YOY
Chart 10. Operating Expense Per Available Ton-Mile
Year Over Year Percent ChangePercent Change YOY
TOTAL ALL MAJOR GROUP AIRLINES
SYSTEM ENTITY
10
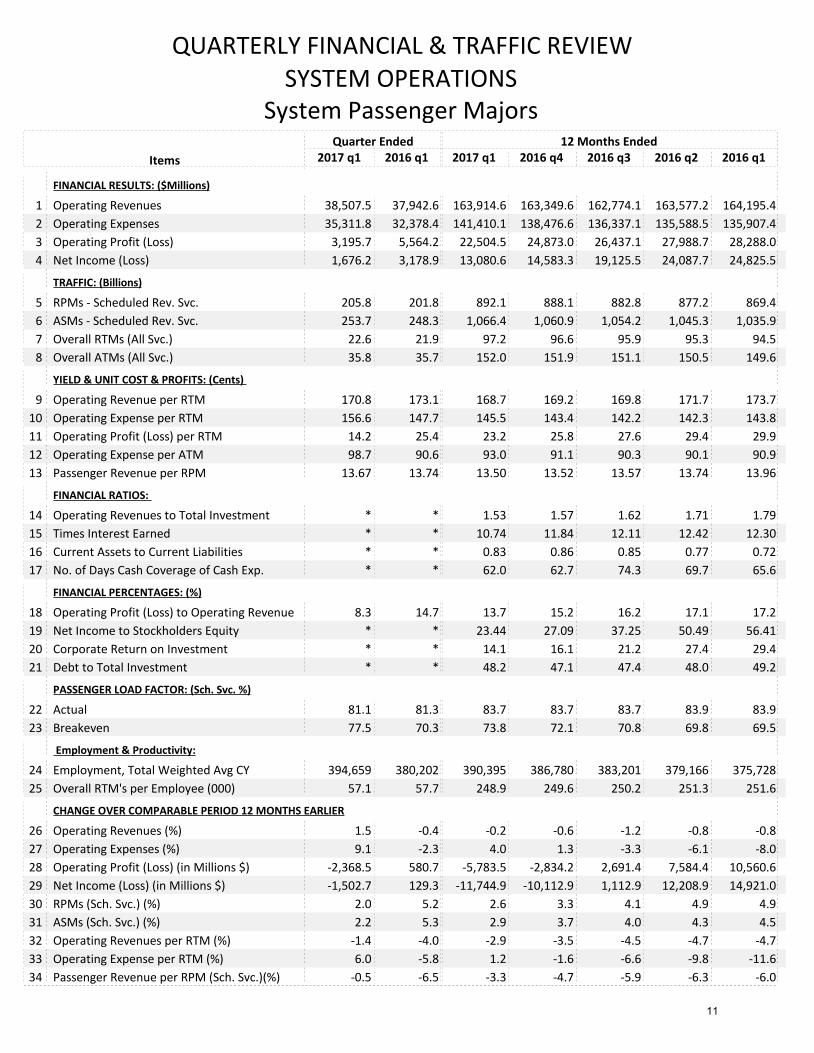
QUARTERLY FINANCIAL & TRAFFIC REVIEWSYSTEM OPERATIONS
System Passenger Majors
2017 q1 2016 q1 2017 q1 2016 q4 2016 q3 2016 q2 2016 q1Quarter Ended 12 Months Ended
Items
FINANCIAL RESULTS: ($Millions)
1 Operating Revenues 38,507.5 37,942.6 163,914.6 163,349.6 162,774.1 163,577.2 164,195.4
2 Operating Expenses 35,311.8 32,378.4 141,410.1 138,476.6 136,337.1 135,588.5 135,907.4
3 Operating Profit (Loss) 3,195.7 5,564.2 22,504.5 24,873.0 26,437.1 27,988.7 28,288.0
4 Net Income (Loss) 1,676.2 3,178.9 13,080.6 14,583.3 19,125.5 24,087.7 24,825.5
TRAFFIC: (Billions)
5 RPMs - Scheduled Rev. Svc. 205.8 201.8 892.1 888.1 882.8 877.2 869.4
6 ASMs - Scheduled Rev. Svc. 253.7 248.3 1,066.4 1,060.9 1,054.2 1,045.3 1,035.9
7 Overall RTMs (All Svc.) 22.6 21.9 97.2 96.6 95.9 95.3 94.5
8 Overall ATMs (All Svc.) 35.8 35.7 152.0 151.9 151.1 150.5 149.6
YIELD & UNIT COST & PROFITS: (Cents)
9 Operating Revenue per RTM 170.8 173.1 168.7 169.2 169.8 171.7 173.7
10 Operating Expense per RTM 156.6 147.7 145.5 143.4 142.2 142.3 143.8
11 Operating Profit (Loss) per RTM 14.2 25.4 23.2 25.8 27.6 29.4 29.9
12 Operating Expense per ATM 98.7 90.6 93.0 91.1 90.3 90.1 90.9
13 Passenger Revenue per RPM 13.67 13.74 13.50 13.52 13.57 13.74 13.96
FINANCIAL RATIOS:
14 Operating Revenues to Total Investment * * 1.53 1.57 1.62 1.71 1.79
15 Times Interest Earned * * 10.74 11.84 12.11 12.42 12.30
16 Current Assets to Current Liabilities * * 0.83 0.86 0.85 0.77 0.72
17 No. of Days Cash Coverage of Cash Exp. * * 62.0 62.7 74.3 69.7 65.6
FINANCIAL PERCENTAGES: (%)
18 Operating Profit (Loss) to Operating Revenue 8.3 14.7 13.7 15.2 16.2 17.1 17.2
19 Net Income to Stockholders Equity * * 23.44 27.09 37.25 50.49 56.41
20 Corporate Return on Investment * * 14.1 16.1 21.2 27.4 29.4
21 Debt to Total Investment * * 48.2 47.1 47.4 48.0 49.2
PASSENGER LOAD FACTOR: (Sch. Svc. %)
22 Actual 81.1 81.3 83.7 83.7 83.7 83.9 83.9
23 Breakeven 77.5 70.3 73.8 72.1 70.8 69.8 69.5
Employment & Productivity:
24 Employment, Total Weighted Avg CY 394,659 380,202 390,395 386,780 383,201 379,166 375,728
25 Overall RTM's per Employee (000) 57.1 57.7 248.9 249.6 250.2 251.3 251.6
CHANGE OVER COMPARABLE PERIOD 12 MONTHS EARLIER
26 Operating Revenues (%) 1.5 -0.4 -0.2 -0.6 -1.2 -0.8 -0.8
27 Operating Expenses (%) 9.1 -2.3 4.0 1.3 -3.3 -6.1 -8.0
28 Operating Profit (Loss) (in Millions $) -2,368.5 580.7 -5,783.5 -2,834.2 2,691.4 7,584.4 10,560.6
29 Net Income (Loss) (in Millions $) -1,502.7 129.3 -11,744.9 -10,112.9 1,112.9 12,208.9 14,921.0
30 RPMs (Sch. Svc.) (%) 2.0 5.2 2.6 3.3 4.1 4.9 4.9
31 ASMs (Sch. Svc.) (%) 2.2 5.3 2.9 3.7 4.0 4.3 4.5
32 Operating Revenues per RTM (%) -1.4 -4.0 -2.9 -3.5 -4.5 -4.7 -4.7
33 Operating Expense per RTM (%) 6.0 -5.8 1.2 -1.6 -6.6 -9.8 -11.6
34 Passenger Revenue per RPM (Sch. Svc.)(%) -0.5 -6.5 -3.3 -4.7 -5.9 -6.3 -6.0
11

QUARTERLY FINANCIAL & TRAFFIC REVIEWDOMESTIC OPERATIONS
Domestic Passenger Majors
2017 q1 2016 q1 2017 q1 2016 q4 2016 q3 2016 q2 2016 q1Quarter Ended 12 Months Ended
Items
FINANCIAL RESULTS: ($Millions)
1 Operating Revenues 29,272.0 27,595.1 122,805.9 121,129.0 119,520.3 118,726.1 118,215.8
2 Operating Expenses 26,343.3 23,335.3 104,738.4 101,730.4 99,246.2 97,659.5 97,174.1
3 Operating Profit (Loss) 2,928.7 4,259.8 18,067.5 19,398.6 20,274.1 21,066.6 21,041.7
4 Net Income (Loss) 1,612.4 2,201.7 10,197.4 10,786.7 14,795.0 17,408.6 17,898.1
TRAFFIC: (Billions)
5 RPMs - Scheduled Rev. Svc. 147.1 143.1 628.8 624.8 619.8 614.0 607.1
6 ASMs - Scheduled Rev. Svc. 177.9 172.7 739.7 734.4 728.1 719.7 711.9
7 Overall RTMs (All Svc.) 15.1 14.6 64.4 63.9 63.4 62.8 62.2
8 Overall ATMs (All Svc.) 23.1 23.0 96.6 96.5 95.6 95.0 94.5
YIELD & UNIT COST & PROFITS: (Cents)
9 Operating Revenue per RTM 193.9 188.8 190.7 189.5 188.5 189.0 190.2
10 Operating Expense per RTM 174.5 159.6 162.6 159.1 156.5 155.5 156.3
11 Operating Profit (Loss) per RTM 19.4 29.1 28.0 30.3 32.0 33.5 33.9
12 Operating Expense per ATM 113.8 101.4 108.4 105.4 103.9 102.8 102.9
13 Passenger Revenue per RPM 13.97 14.09 13.78 13.80 13.87 14.02 14.21
FINANCIAL RATIOS:
14 Operating Revenues to Total Investment * * ** ** ** ** **
15 Times Interest Earned * * ** ** ** ** **
16 Current Assets to Current Liabilities * * ** ** ** ** **
17 No. of Days Cash Coverage of Cash Exp. * * ** ** ** ** **
FINANCIAL PERCENTAGES: (%)
18 Operating Profit (Loss) to Operating Revenue 10.0 15.4 14.7 16.0 17.0 17.7 17.8
19 Net Income to Stockholders Equity * * ** ** ** ** **
20 Corporate Return on Investment * * ** ** ** ** **
21 Debt to Total Investment * * ** ** ** ** **
PASSENGER LOAD FACTOR: (Sch. Svc. %)
22 Actual 82.7 82.8 85.0 85.1 85.1 85.3 85.3
23 Breakeven 77.3 69.3 73.9 72.0 70.5 69.5 69.6
Employment & Productivity:
24 Employment, Total Weighted Avg CY * * ** ** ** ** **
25 Overall RTM's per Employee (000) * * ** ** ** ** **
CHANGE OVER COMPARABLE PERIOD 12 MONTHS EARLIER
26 Operating Revenues (%) 6.1 0.7 3.9 2.6 1.5 1.2 0.9
27 Operating Expenses (%) 12.9 -1.2 7.8 4.4 -0.7 -4.3 -6.5
28 Operating Profit (Loss) (in Millions $) -1,331.0 489.9 -2,974.2 -1,153.2 2,465.0 5,826.9 7,834.4
29 Net Income (Loss) (in Millions $) -589.3 -63.6 -7,700.8 -7,175.1 2,343.5 8,622.8 10,389.9
30 RPMs (Sch. Svc.) (%) 2.8 6.6 3.6 4.4 5.4 6.0 6.1
31 ASMs (Sch. Svc.) (%) 3.0 6.9 3.9 4.8 5.2 5.3 5.6
32 Operating Revenues per RTM (%) 2.7 -5.0 0.2 -1.5 -3.5 -4.2 -4.7
33 Operating Expense per RTM (%) 9.3 -6.8 4.0 0.1 -5.6 -9.4 -11.7
34 Passenger Revenue per RPM (Sch. Svc.)(%) -0.8 -5.1 -3.0 -4.0 -4.7 -4.9 -4.6
12

QUARTERLY FINANCIAL & TRAFFIC REVIEWINTERNATIONAL OPERATIONS
International Passenger Majors
2017 q1 2016 q1 2017 q1 2016 q4 2016 q3 2016 q2 2016 q1Quarter Ended 12 Months Ended
Items
FINANCIAL RESULTS: ($Millions)
1 Operating Revenues 9,235.5 10,347.5 41,108.6 42,220.7 43,253.9 44,851.1 45,979.6
2 Operating Expenses 8,968.5 9,043.1 36,671.7 36,746.2 37,090.9 37,929.0 38,733.3
3 Operating Profit (Loss) 266.9 1,304.4 4,437.0 5,474.4 6,163.0 6,922.1 7,246.2
4 Net Income (Loss) 63.8 977.1 2,883.2 3,796.6 4,330.5 6,679.1 6,927.4
TRAFFIC: (Billions)
5 RPMs - Scheduled Rev. Svc. 58.7 58.7 263.3 263.3 263.0 263.2 262.3
6 ASMs - Scheduled Rev. Svc. 75.8 75.6 326.7 326.5 326.1 325.6 324.1
7 Overall RTMs (All Svc.) 7.5 7.3 32.8 32.6 32.5 32.5 32.4
8 Overall ATMs (All Svc.) 12.6 12.7 55.4 55.5 55.5 55.5 55.1
YIELD & UNIT COST & PROFITS: (Cents)
9 Operating Revenue per RTM 123.9 141.7 125.4 129.4 133.2 138.1 142.0
10 Operating Expense per RTM 120.3 123.8 111.9 112.7 114.2 116.8 119.6
11 Operating Profit (Loss) per RTM 3.6 17.9 13.5 16.8 19.0 21.3 22.4
12 Operating Expense per ATM 71.0 71.0 66.2 66.2 66.8 68.3 70.3
13 Passenger Revenue per RPM 12.93 12.90 12.84 12.84 12.85 13.08 13.40
FINANCIAL RATIOS:
14 Operating Revenues to Total Investment * * ** ** ** ** **
15 Times Interest Earned * * ** ** ** ** **
16 Current Assets to Current Liabilities * * ** ** ** ** **
17 No. of Days Cash Coverage of Cash Exp. * * ** ** ** ** **
FINANCIAL PERCENTAGES: (%)
18 Operating Profit (Loss) to Operating Revenue 2.9 12.6 10.8 13.0 14.2 15.4 15.8
19 Net Income to Stockholders Equity * * ** ** ** ** **
20 Corporate Return on Investment * * ** ** ** ** **
21 Debt to Total Investment * * ** ** ** ** **
PASSENGER LOAD FACTOR: (Sch. Svc. %)
22 Actual 77.5 77.7 80.6 80.6 80.7 80.8 81.0
23 Breakeven 78.3 73.0 73.9 72.7 71.8 70.8 69.4
Employment & Productivity:
24 Employment, Total Weighted Avg CY * * ** ** ** ** **
25 Overall RTM's per Employee (000) * * ** ** ** ** **
CHANGE OVER COMPARABLE PERIOD 12 MONTHS EARLIER
26 Operating Revenues (%) -10.7 -3.4 -10.6 -8.9 -7.9 -5.8 -4.8
27 Operating Expenses (%) -0.8 -4.8 -5.3 -6.2 -9.6 -10.6 -11.5
28 Operating Profit (Loss) (in Millions $) -1,037.5 90.8 -2,809.3 -1,681.0 226.4 1,757.5 2,726.2
29 Net Income (Loss) (in Millions $) -913.4 192.9 -4,044.1 -2,937.9 -1,230.6 3,586.1 4,531.1
30 RPMs (Sch. Svc.) (%) 0.0 1.9 0.4 0.8 1.2 2.4 2.2
31 ASMs (Sch. Svc.) (%) 0.3 2.0 0.8 1.2 1.3 2.1 2.1
32 Operating Revenues per RTM (%) -12.6 -2.9 -11.7 -9.5 -8.3 -6.8 -5.5
33 Operating Expense per RTM (%) -2.9 -4.3 -6.5 -6.8 -10.0 -11.6 -12.1
34 Passenger Revenue per RPM (Sch. Svc.)(%) 0.2 -10.2 -4.1 -6.4 -9.0 -9.9 -9.2
13

0%
1%
2%
3%
4%
5%
6%
7%
2014q2 2014q3 2014q4 2015q1 2015q2 2015q3 2015q4 2016q1 2016q2 2016q3 2016q4 2017q1
Quarter Year Ended By Quarter
-8%
-6%
-4%
-2%
0%
2%
4%
6%
2014q2 2014q3 2014q4 2015q1 2015q2 2015q3 2015q4 2016q1 2016q2 2016q3 2016q4 2017q1
Quarter Year Ended By Quarter
Chart 11. Passenger Revenue Per Revenue Passenger Mile
Year Over Year Percent ChangePercent Change YOY
Chart 12. Revenue Passenger Miles (Scheduled Service)
Year Over Year Percent ChangePercent Change YOY
TOTAL PASSENGER MAJOR GROUP AIRLINES
SYSTEM ENTITY
14

-1.0
-0.5
0.0
0.5
1.0
1.5
2.0
2014q2 2014q3 2014q4 2015q1 2015q2 2015q3 2015q4 2016q1 2016q2 2016q3 2016q4 2017q1
Quarter Year Ended By Quarter
0%
1%
2%
3%
4%
5%
6%
2014q2 2014q3 2014q4 2015q1 2015q2 2015q3 2015q4 2016q1 2016q2 2016q3 2016q4 2017q1
Quarter Year Ended By Quarter
Chart 13. Available Seat Miles (Scheduled Passenger Service)
Year Over Year Percent ChangePercent Change YOY
Chart 14. Passenger Load Factor
Year Over Year Point ChangePoint Change YOY
TOTAL PASSENGER MAJOR GROUP AIRLINES
SYSTEM ENTITY
15

70%
72%
74%
76%
78%
80%
82%
84%
86%
88%
LF % 0.799 0.826 0.84 0.838 0.764 0.865 0.826 0.84 0.762 0.811 0.787 0.795 0.794 0.799
AA^ AS B6 DL EV^ F9 G4^ HA MQ NK^ OO UA VX^ WN^
TOTAL PASSENGER MAJOR GROUP AIRLINES
SYSTEM ENTITY
0¢
5¢
10¢
15¢
20¢
25¢
Cents 14.61 11.83 12.73 14.44 10.9 6.27 8.96 14.08 20.29 5.88 12.44 13.78 11.15 15.08
AA^ AS B6 DL EV^ F9 G4^ HA MQ NK^ OO UA VX^ WN^
Chart 15. Passenger (RPM) Yield
For the Quarter 2017q1RPM Yield
Chart 16. Passenger Load Factor
For the Quarter 2017q1Pax LF
16

QUARTERLY FINANCIAL & TRAFFIC REVIEW
SYSTEM OPERATIONSAlaska Airlines Inc. (AS)
2017 q1 2016 q1 2017 q1 2016 q4 2016 q3 2016 q2 2016 q1Quarter Ended 12 Months Ended
Items
FINANCIAL RESULTS: ($Millions)
1 Operating Revenues 1,391.1 1,345.8 5,873.2 5,827.9 5,780.8 5,729.5 5,672.1
2 Operating Expenses 1,175.8 1,046.9 4,519.0 4,390.1 4,383.5 4,322.3 4,320.2
3 Operating Profit (Loss) 215.2 298.8 1,354.2 1,437.8 1,397.3 1,407.2 1,351.9
4 Net Income (Loss) 122.7 185.3 816.7 879.3 901.3 903.8 868.3
TRAFFIC: (Billions)
5 RPMs - Scheduled Rev. Svc. 8.1 7.7 33.2 32.8 32.4 31.8 31.0
6 ASMs - Scheduled Rev. Svc. 9.8 9.3 39.1 38.6 38.4 37.7 36.9
7 Overall RTMs (All Svc.) 0.8 0.8 3.4 3.4 3.3 3.3 3.2
8 Overall ATMs (All Svc.) 1.3 1.2 5.0 4.9 4.9 4.8 4.7
YIELD & UNIT COST & PROFITS: (Cents)
9 Operating Revenue per RTM 168.5 171.1 172.8 173.5 174.1 176.0 178.6
10 Operating Expense per RTM 142.5 133.1 133.0 130.7 132.1 132.8 136.0
11 Operating Profit (Loss) per RTM 26.1 38.0 39.8 42.8 42.1 43.2 42.6
12 Operating Expense per ATM 93.1 88.5 90.4 89.2 89.8 90.4 92.7
13 Passenger Revenue per RPM 11.83 12.07 12.21 12.27 12.38 12.58 12.84
FINANCIAL RATIOS:
14 Operating Revenues to Total Investment * * 1.03 1.14 1.28 1.43 1.50
15 Times Interest Earned * * 37.84 58.85 134.47 160.35 155.26
16 Current Assets to Current Liabilities * * 1.98 2.05 2.19 1.62 1.52
17 No. of Days Cash Coverage of Cash Exp. * * 128.2 116.0 287.6 145.4 141.2
FINANCIAL PERCENTAGES: (%)
18 Operating Profit (Loss) to Operating Revenue 15.5 22.2 23.1 24.7 24.2 24.6 23.8
19 Net Income to Stockholders Equity * * 19.31 21.84 23.65 25.32 26.02
20 Corporate Return on Investment * * 14.9 17.6 20.1 22.8 23.2
21 Debt to Total Investment * * 33.4 34.8 30.8 8.9 9.8
PASSENGER LOAD FACTOR: (Sch. Svc. %)
22 Actual 82.6 82.5 84.9 84.9 84.3 84.3 84.2
23 Breakeven 70.0 61.7 62.6 60.6 60.7 60.3 61.1
Employment & Productivity:
24 Employment, Total Weighted Avg CY 11,789 10,981 11,435 11,233 11,090 10,995 10,891
25 Overall RTM's per Employee (000) 70.0 71.6 297.2 299.1 299.3 296.0 291.6
CHANGE OVER COMPARABLE PERIOD 12 MONTHS EARLIER
26 Operating Revenues (%) 3.4 6.2 3.5 4.2 4.7 4.7 4.9
27 Operating Expenses (%) 12.3 1.7 4.6 2.0 3.1 0.1 -0.9
28 Operating Profit (Loss) (in Millions $) -83.6 60.7 2.3 146.6 124.4 252.6 302.2
29 Net Income (Loss) (in Millions $) -62.6 39.8 -51.6 50.8 112.6 190.9 217.7
30 RPMs (Sch. Svc.) (%) 5.0 10.3 7.0 8.3 9.9 9.8 9.5
31 ASMs (Sch. Svc.) (%) 4.8 12.0 6.1 7.8 10.5 10.6 10.9
32 Operating Revenues per RTM (%) -1.5 -3.7 -3.2 -3.8 -4.7 -4.5 -4.1
33 Operating Expense per RTM (%) 7.0 -7.8 -2.2 -5.8 -6.1 -8.7 -9.3
34 Passenger Revenue per RPM (Sch. Svc.)(%) -2.0 -6.3 -4.9 -5.9 -6.3 -5.9 -4.9
17

QUARTERLY FINANCIAL & TRAFFIC REVIEW
SYSTEM OPERATIONSAllegiant Air (G4)^
2017 q1 2016 q1 2017 q1 2016 q4 2016 q3 2016 q2 2016 q1Quarter Ended 12 Months Ended
Items
FINANCIAL RESULTS: ($Millions)
1 Operating Revenues 362.0 337.3 1,342.0 1,317.3 1,294.4 1,262.3 1,240.6
2 Operating Expenses 296.0 221.8 1,043.1 969.0 917.4 884.0 872.6
3 Operating Profit (Loss) 66.1 115.5 298.9 348.3 377.0 378.4 368.0
4 Net Income (Loss) 63.7 112.4 287.6 336.3 365.5 366.6 356.5
TRAFFIC: (Billions)
5 RPMs - Scheduled Rev. Svc. 2.7 2.5 10.4 10.2 9.9 9.5 9.2
6 ASMs - Scheduled Rev. Svc. 3.3 2.9 12.3 11.9 11.6 11.1 10.7
7 Overall RTMs (All Svc.) 0.3 0.3 1.1 1.0 1.0 1.0 0.9
8 Overall ATMs (All Svc.) 0.8 0.6 2.8 2.6 2.5 2.2 2.0
YIELD & UNIT COST & PROFITS: (Cents)
9 Operating Revenue per RTM 132.9 133.2 127.4 127.4 128.2 130.3 133.0
10 Operating Expense per RTM 108.7 87.6 99.0 93.7 90.8 91.2 93.6
11 Operating Profit (Loss) per RTM 24.3 45.6 28.4 33.7 37.3 39.0 39.5
12 Operating Expense per ATM 39.4 35.8 37.7 36.7 36.9 40.2 43.9
13 Passenger Revenue per RPM 8.96 9.10 8.42 8.44 8.54 8.76 9.02
FINANCIAL RATIOS:
14 Operating Revenues to Total Investment * * 0.81 0.84 0.88 0.92 0.97
15 Times Interest Earned * * 30.11 32.48 37.79 38.87 39.66
16 Current Assets to Current Liabilities * * 2.37 2.48 2.20 2.39 2.28
17 No. of Days Cash Coverage of Cash Exp. * * 6.2 9.1 5.9 12.9 9.3
FINANCIAL PERCENTAGES: (%)
18 Operating Profit (Loss) to Operating Revenue 18.2 34.2 22.3 26.4 29.1 30.0 29.7
19 Net Income to Stockholders Equity * * 22.08 27.49 32.11 34.87 37.07
20 Corporate Return on Investment * * 18.1 22.2 25.4 27.4 28.5
21 Debt to Total Investment * * 19.2 20.0 22.7 20.3 22.7
PASSENGER LOAD FACTOR: (Sch. Svc. %)
22 Actual 82.6 86.3 84.5 85.5 86.0 86.0 86.3
23 Breakeven 77.1 58.0 74.6 69.4 65.7 64.2 64.7
Employment & Productivity:
24 Employment, Total Weighted Avg CY 3,482 2,975 3,325 3,198 3,059 2,882 2,715
25 Overall RTM's per Employee (000) 78.2 85.1 316.8 323.4 330.1 336.2 343.5
CHANGE OVER COMPARABLE PERIOD 12 MONTHS EARLIER
26 Operating Revenues (%) 7.3 6.0 8.2 7.8 8.8 9.1 10.2
27 Operating Expenses (%) 33.4 2.9 19.5 11.8 0.3 -4.9 -6.8
28 Operating Profit (Loss) (in Millions $) -49.4 12.9 -69.2 -6.8 101.8 150.9 177.7
29 Net Income (Loss) (in Millions $) -48.6 12.5 -68.9 -7.7 104.4 153.3 178.3
30 RPMs (Sch. Svc.) (%) 7.9 14.9 13.0 14.9 16.9 17.3 17.0
31 ASMs (Sch. Svc.) (%) 12.7 17.9 15.3 16.6 19.3 20.6 21.0
32 Operating Revenues per RTM (%) -0.2 -7.9 -4.2 -6.2 -7.1 -7.0 -5.8
33 Operating Expense per RTM (%) 24.1 -10.6 5.8 -2.7 -14.3 -19.0 -20.3
34 Passenger Revenue per RPM (Sch. Svc.)(%) -1.5 -10.8 -6.7 -9.1 -10.5 -11.3 -11.6
18

QUARTERLY FINANCIAL & TRAFFIC REVIEW
SYSTEM OPERATIONSAmerican Airlines Inc. (AA)^
2017 q1 2016 q1 2017 q1 2016 q4 2016 q3 2016 q2 2016 q1Quarter Ended 12 Months Ended
Items
FINANCIAL RESULTS: ($Millions)
1 Operating Revenues 9,620.6 9,497.1 40,545.1 40,421.5 40,296.5 40,340.3 40,739.7
2 Operating Expenses 9,016.8 8,173.9 35,960.3 35,117.4 34,720.4 34,193.7 34,429.2
3 Operating Profit (Loss) 603.8 1,323.2 4,584.8 5,304.2 5,576.1 6,146.5 6,310.5
4 Net Income (Loss) 262.6 710.3 2,333.5 2,781.2 6,190.7 7,154.8 7,647.8
TRAFFIC: (Billions)
5 RPMs - Scheduled Rev. Svc. 45.2 46.2 197.9 198.9 199.8 201.0 200.7
6 ASMs - Scheduled Rev. Svc. 56.6 57.5 240.6 241.5 241.9 241.6 240.9
7 Overall RTMs (All Svc.) 5.1 5.2 22.3 22.3 22.4 22.4 22.4
8 Overall ATMs (All Svc.) 8.7 9.0 37.5 37.8 37.9 37.9 37.8
YIELD & UNIT COST & PROFITS: (Cents)
9 Operating Revenue per RTM 187.1 183.8 181.8 181.0 180.3 179.8 181.9
10 Operating Expense per RTM 175.4 158.2 161.2 157.3 155.3 152.4 153.7
11 Operating Profit (Loss) per RTM 11.7 25.6 20.6 23.8 24.9 27.4 28.2
12 Operating Expense per ATM 103.3 91.2 95.8 93.0 91.6 90.2 91.1
13 Passenger Revenue per RPM 14.61 14.21 14.11 14.02 13.97 14.01 14.25
FINANCIAL RATIOS:
14 Operating Revenues to Total Investment * * 1.20 1.25 1.34 1.47 1.65
15 Times Interest Earned * * 5.00 5.90 5.70 6.48 6.89
16 Current Assets to Current Liabilities * * 1.16 1.20 1.15 1.08 0.91
17 No. of Days Cash Coverage of Cash Exp. * * 70.7 68.9 74.0 79.0 76.4
FINANCIAL PERCENTAGES: (%)
18 Operating Profit (Loss) to Operating Revenue 6.3 13.9 11.3 13.1 13.8 15.2 15.5
19 Net Income to Stockholders Equity * * 19.32 24.32 61.32 86.13 120.04
20 Corporate Return on Investment * * 9.7 11.4 23.5 29.2 34.2
21 Debt to Total Investment * * 63.8 64.1 63.2 64.1 65.8
PASSENGER LOAD FACTOR: (Sch. Svc. %)
22 Actual 79.9 80.3 82.3 82.3 82.6 83.2 83.3
23 Breakeven 80.8 70.5 77.3 74.8 73.6 71.8 71.2
Employment & Productivity:
24 Employment, Total Weighted Avg CY 99,876 97,545 99,130 98,547 97,997 97,454 96,927
25 Overall RTM's per Employee (000) 51.5 53.0 225.0 226.6 228.1 230.3 231.0
CHANGE OVER COMPARABLE PERIOD 12 MONTHS EARLIER
26 Operating Revenues (%) 1.3 -3.5 -0.5 -1.6 -3.2 -4.2 -4.6
27 Operating Expenses (%) 10.3 -5.4 4.4 0.6 -2.7 -7.3 -9.4
28 Operating Profit (Loss) (in Millions $) -719.4 121.5 -1,725.7 -884.8 -389.4 920.2 1,609.5
29 Net Income (Loss) (in Millions $) -447.7 -98.0 -5,314.3 -4,964.6 1,756.2 3,487.2 4,575.0
30 RPMs (Sch. Svc.) (%) -2.1 3.0 -1.4 -0.2 1.1 3.2 3.2
31 ASMs (Sch. Svc.) (%) -1.7 3.0 -0.1 1.0 1.2 1.8 1.9
32 Operating Revenues per RTM (%) 1.8 -5.9 -0.1 -1.9 -4.3 -6.8 -7.1
33 Operating Expense per RTM (%) 10.8 -7.7 4.9 0.3 -3.8 -9.8 -11.8
34 Passenger Revenue per RPM (Sch. Svc.)(%) 2.8 -8.8 -1.0 -3.7 -5.9 -8.1 -7.9
19

QUARTERLY FINANCIAL & TRAFFIC REVIEW
SYSTEM OPERATIONSDelta Air Lines Inc. (DL)
2017 q1 2016 q1 2017 q1 2016 q4 2016 q3 2016 q2 2016 q1Quarter Ended 12 Months Ended
Items
FINANCIAL RESULTS: ($Millions)
1 Operating Revenues 9,196.1 9,295.7 39,750.0 39,849.6 39,888.1 40,478.6 40,703.8
2 Operating Expenses 8,128.2 7,751.3 33,250.0 32,873.2 32,219.3 32,566.6 32,719.3
3 Operating Profit (Loss) 1,067.9 1,544.3 6,500.0 6,976.4 7,668.7 7,912.0 7,984.5
4 Net Income (Loss) 615.9 955.2 4,070.6 4,409.8 4,764.5 4,814.4 4,749.2
TRAFFIC: (Billions)
5 RPMs - Scheduled Rev. Svc. 43.0 42.7 191.8 191.5 191.0 191.1 189.6
6 ASMs - Scheduled Rev. Svc. 51.3 51.5 224.5 224.6 224.1 223.1 221.3
7 Overall RTMs (All Svc.) 4.8 4.8 21.2 21.2 21.1 21.2 21.1
8 Overall ATMs (All Svc.) 7.5 7.6 33.0 33.1 33.1 33.0 32.8
YIELD & UNIT COST & PROFITS: (Cents)
9 Operating Revenue per RTM 192.5 195.5 187.7 188.4 188.7 190.9 192.8
10 Operating Expense per RTM 170.1 163.0 157.0 155.4 152.4 153.6 155.0
11 Operating Profit (Loss) per RTM 22.4 32.5 30.7 33.0 36.3 37.3 37.8
12 Operating Expense per ATM 108.9 102.2 100.9 99.4 97.4 98.6 99.7
13 Passenger Revenue per RPM 14.44 14.65 14.25 14.30 14.40 14.64 14.84
FINANCIAL RATIOS:
14 Operating Revenues to Total Investment * * 1.96 2.03 1.98 1.98 1.95
15 Times Interest Earned * * 18.48 19.36 19.79 18.99 17.85
16 Current Assets to Current Liabilities * * 0.43 0.49 0.48 0.47 0.51
17 No. of Days Cash Coverage of Cash Exp. * * 30.1 37.8 37.5 34.4 33.8
FINANCIAL PERCENTAGES: (%)
18 Operating Profit (Loss) to Operating Revenue 11.6 16.6 16.4 17.5 19.2 19.5 19.6
19 Net Income to Stockholders Equity * * 33.37 37.43 39.81 40.26 39.64
20 Corporate Return on Investment * * 21.8 24.3 25.5 25.5 24.9
21 Debt to Total Investment * * 41.6 37.3 37.6 39.8 42.7
PASSENGER LOAD FACTOR: (Sch. Svc. %)
22 Actual 83.8 82.9 85.4 85.2 85.3 85.7 85.7
23 Breakeven 73.3 68.8 69.8 68.7 67.1 67.4 67.5
Employment & Productivity:
24 Employment, Total Weighted Avg CY 79,793 79,164 79,939 79,782 79,661 79,414 79,021
25 Overall RTM's per Employee (000) 59.9 60.1 264.9 265.1 265.4 267.1 267.1
CHANGE OVER COMPARABLE PERIOD 12 MONTHS EARLIER
26 Operating Revenues (%) -1.1 -1.2 -2.3 -2.4 -2.5 -1.3 -0.5
27 Operating Expenses (%) 4.9 -3.1 1.6 -0.3 -9.4 -10.7 -12.2
28 Operating Profit (Loss) (in Millions $) -476.4 139.9 -1,484.5 -868.2 2,318.1 3,374.4 4,327.5
29 Net Income (Loss) (in Millions $) -339.3 210.7 -678.6 -128.6 1,916.0 2,923.7 3,538.3
30 RPMs (Sch. Svc.) (%) 0.7 3.8 1.2 1.8 2.5 3.7 3.9
31 ASMs (Sch. Svc.) (%) -0.3 3.4 1.4 2.3 2.3 3.0 3.4
32 Operating Revenues per RTM (%) -1.5 -2.8 -2.6 -2.9 -3.5 -3.2 -2.6
33 Operating Expense per RTM (%) 4.4 -4.7 1.3 -0.9 -10.3 -12.4 -14.0
34 Passenger Revenue per RPM (Sch. Svc.)(%) -1.5 -5.0 -4.0 -4.7 -5.0 -4.8 -4.3
20

QUARTERLY FINANCIAL & TRAFFIC REVIEW
SYSTEM OPERATIONSEnvoy Air (MQ)
2017 q1 2016 q1 2017 q1 2016 q4 2016 q3 2016 q2 2016 q1Quarter Ended 12 Months Ended
Items
FINANCIAL RESULTS: ($Millions)
1 Operating Revenues 275.0 249.1 1,083.8 1,058.0 983.4 907.4 865.9
2 Operating Expenses 277.2 245.6 1,074.9 1,043.3 988.6 938.4 903.0
3 Operating Profit (Loss) -2.3 3.5 8.9 14.6 -5.2 -31.0 -37.1
4 Net Income (Loss) 0.7 -2.6 2.2 -1.1 13.6 -9.9 -18.8
TRAFFIC: (Billions)
5 RPMs - Scheduled Rev. Svc. 1.4 1.1 5.7 5.4 5.1 4.9 5.0
6 ASMs - Scheduled Rev. Svc. 1.8 1.4 7.1 6.8 6.5 6.2 6.3
7 Overall RTMs (All Svc.) 0.1 0.1 0.6 0.5 0.5 0.5 0.5
8 Overall ATMs (All Svc.) 0.2 0.2 0.9 0.9 0.8 0.8 0.8
YIELD & UNIT COST & PROFITS: (Cents)
9 Operating Revenue per RTM 203.2 230.0 190.4 195.1 191.6 183.8 171.7
10 Operating Expense per RTM 204.9 226.8 188.9 192.4 192.6 190.1 179.1
11 Operating Profit (Loss) per RTM -1.7 3.2 1.6 2.7 -1.0 -6.3 -7.4
12 Operating Expense per ATM 122.5 135.2 118.6 121.0 121.3 119.4 113.2
13 Passenger Revenue per RPM 20.29 22.55 19.02 19.41 18.14 16.31 14.20
FINANCIAL RATIOS:
14 Operating Revenues to Total Investment * * 5.60 5.51 5.23 4.90 4.64
15 Times Interest Earned * * 9,377.17 4,104.05 -0.14 -5.31 -4.74
16 Current Assets to Current Liabilities * * 1.10 1.30 1.22 1.13 1.31
17 No. of Days Cash Coverage of Cash Exp. * * 0.1 0.1 0.1 0.0 0.1
FINANCIAL PERCENTAGES: (%)
18 Operating Profit (Loss) to Operating Revenue -0.8 1.4 0.8 1.4 -0.5 -3.4 -4.3
19 Net Income to Stockholders Equity * * 1.15 -0.57 7.29 -5.36 -10.08
20 Corporate Return on Investment * * 1.1 -0.6 8.7 -2.3 -5.5
21 Debt to Total Investment * * 7.2 3.8 0.0 0.1
PASSENGER LOAD FACTOR: (Sch. Svc. %)
22 Actual 76.2 74.9 79.5 79.4 79.3 79.0 79.3
23 Breakeven 77.1 75.5 79.0 78.8 84.3 92.1 99.8
Employment & Productivity:
24 Employment, Total Weighted Avg CY 11,155 10,644 10,895 10,767 10,711 10,417 10,466
25 Overall RTM's per Employee (000) 12.1 10.2 52.2 50.4 47.9 47.4 48.2
CHANGE OVER COMPARABLE PERIOD 12 MONTHS EARLIER
26 Operating Revenues (%) 10.4 5.0 25.2 23.9 7.9 -6.5 -14.7
27 Operating Expenses (%) 12.8 2.9 19.0 16.4 5.7 -3.2 -9.7
28 Operating Profit (Loss) (in Millions $) -5.7 5.0 46.0 56.7 19.2 -32.2 -52.0
29 Net Income (Loss) (in Millions $) 3.2 -1.9 20.9 15.8 32.7 -5.5 -25.3
30 RPMs (Sch. Svc.) (%) 25.1 -24.7 12.9 0.4 -13.8 -24.4 -28.7
31 ASMs (Sch. Svc.) (%) 23.0 -25.6 12.6 -0.4 -15.3 -26.1 -30.9
32 Operating Revenues per RTM (%) -11.6 39.4 10.9 23.3 25.1 23.6 19.5
33 Operating Expense per RTM (%) -9.7 36.6 5.4 15.9 22.4 28.0 26.5
34 Passenger Revenue per RPM (Sch. Svc.)(%) -10.0 68.8 34.0 57.8 48.7 33.4 17.1
21

QUARTERLY FINANCIAL & TRAFFIC REVIEW
SYSTEM OPERATIONSExpressJet Airlines Inc. (EV)^
2017 q1 2016 q1 2017 q1 2016 q4 2016 q3 2016 q2 2016 q1Quarter Ended 12 Months Ended
Items
FINANCIAL RESULTS: ($Millions)
1 Operating Revenues 228.7 267.8 1,005.7 1,044.8 1,067.7 1,090.3 1,129.2
2 Operating Expenses 229.5 273.6 1,295.4 1,339.6 1,089.8 1,115.7 1,146.4
3 Operating Profit (Loss) -0.8 -5.8 -289.8 -294.7 -22.1 -25.4 -17.3
4 Net Income (Loss) -0.4 -5.2 94.1 89.2 -19.6 -22.7 -18.6
TRAFFIC: (Billions)
5 RPMs - Scheduled Rev. Svc. 2.1 2.6 10.0 10.5 10.8 11.4 12.1
6 ASMs - Scheduled Rev. Svc. 2.7 3.3 12.4 13.0 13.5 14.2 15.0
7 Overall RTMs (All Svc.) 0.2 0.3 1.0 1.0 1.1 1.1 1.2
8 Overall ATMs (All Svc.) 0.3 0.4 1.4 1.5 1.5 1.6 1.7
YIELD & UNIT COST & PROFITS: (Cents)
9 Operating Revenue per RTM 109.6 104.5 100.8 100.0 98.6 95.9 93.4
10 Operating Expense per RTM 110.0 106.8 129.9 128.2 100.6 98.1 94.9
11 Operating Profit (Loss) per RTM -0.4 -2.3 -29.0 -28.2 -2.0 -2.2 -1.4
12 Operating Expense per ATM 75.2 73.6 93.2 92.0 72.1 70.7 68.9
13 Passenger Revenue per RPM 10.90 10.38 10.01 9.93 9.78 9.52 9.28
FINANCIAL RATIOS:
14 Operating Revenues to Total Investment * * 1.74 1.63 1.57 1.51 1.23
15 Times Interest Earned * * -1.23 -1.79 -4.67 -4.18 -2.58
16 Current Assets to Current Liabilities * * 0.25 0.88 0.88 2.83 0.93
17 No. of Days Cash Coverage of Cash Exp. * * 3.1 2.7 3.4 3.2 14.1
FINANCIAL PERCENTAGES: (%)
18 Operating Profit (Loss) to Operating Revenue -0.4 -2.2 -28.8 -28.2 -2.1 -2.3 -1.5
19 Net Income to Stockholders Equity * * 26.77 23.27 -5.06 -5.83 -3.81
20 Corporate Return on Investment * * 17.3 15.0 -2.1 -2.2 -1.2
21 Debt to Total Investment * * 38.2 36.6 36.6 86.7 41.7
PASSENGER LOAD FACTOR: (Sch. Svc. %)
22 Actual 76.4 76.8 80.4 80.3 80.0 80.2 80.6
23 Breakeven 77.2 79.3 106.9 106.3 82.5 83.0 82.6
Employment & Productivity:
24 Employment, Total Weighted Avg CY 6,127 7,217 6,501 6,773 7,051 7,327 7,624
25 Overall RTM's per Employee (000) 34.0 35.5 153.4 154.3 153.6 155.2 158.5
CHANGE OVER COMPARABLE PERIOD 12 MONTHS EARLIER
26 Operating Revenues (%) -14.6 -13.2 -10.9 -10.7 -13.7 -15.8 -15.1
27 Operating Expenses (%) -16.1 -14.3 13.0 12.4 -14.1 -16.1 -17.6
28 Operating Profit (Loss) (in Millions $) 5.0 4.9 -272.5 -272.6 8.3 9.1 43.2
29 Net Income (Loss) (in Millions $) 4.8 4.5 112.6 112.2 15.4 13.3 45.6
30 RPMs (Sch. Svc.) (%) -18.6 -18.9 -17.5 -17.6 -20.2 -21.7 -21.3
31 ASMs (Sch. Svc.) (%) -18.1 -17.9 -17.2 -17.2 -19.6 -21.2 -20.9
32 Operating Revenues per RTM (%) 4.9 7.1 7.9 8.4 8.1 7.5 7.8
33 Operating Expense per RTM (%) 3.1 5.7 36.9 36.4 7.7 7.2 4.7
34 Passenger Revenue per RPM (Sch. Svc.)(%) 5.0 7.0 7.9 8.3 7.9 7.2 7.3
22

QUARTERLY FINANCIAL & TRAFFIC REVIEW
SYSTEM OPERATIONSFrontier Airlines Inc. (F9)
2017 q1 2016 q1 2017 q1 2016 q4 2016 q3 2016 q2 2016 q1Quarter Ended 12 Months Ended
Items
FINANCIAL RESULTS: ($Millions)
1 Operating Revenues 429.9 368.1 1,775.4 1,713.6 1,683.2 1,610.1 1,602.7
2 Operating Expenses 432.6 305.9 1,519.9 1,393.3 1,371.7 1,329.2 1,315.0
3 Operating Profit (Loss) -2.7 62.2 255.4 320.3 311.5 280.9 287.7
4 Net Income (Loss) -0.2 38.5 163.9 202.6 189.3 145.9 153.2
TRAFFIC: (Billions)
5 RPMs - Scheduled Rev. Svc. 4.2 3.5 16.6 15.9 15.2 14.1 13.4
6 ASMs - Scheduled Rev. Svc. 4.9 4.0 19.1 18.2 17.4 16.1 15.4
7 Overall RTMs (All Svc.) 0.4 0.4 1.7 1.6 1.5 1.5 1.4
8 Overall ATMs (All Svc.) 0.5 0.4 1.9 1.8 1.8 2.3 3.3
YIELD & UNIT COST & PROFITS: (Cents)
9 Operating Revenue per RTM 102.3 104.3 106.4 107.0 108.7 110.7 114.3
10 Operating Expense per RTM 103.0 86.7 91.1 87.0 88.6 91.4 93.8
11 Operating Profit (Loss) per RTM -0.6 17.6 15.3 20.0 20.1 19.3 20.5
12 Operating Expense per ATM 88.6 75.6 79.1 75.8 77.6 56.7 40.3
13 Passenger Revenue per RPM 6.27 6.93 6.67 6.83 7.20 7.87 8.62
FINANCIAL RATIOS:
14 Operating Revenues to Total Investment * * 3.03 2.88 2.98 3.02 3.19
15 Times Interest Earned * * -428.77 627.04 199.64 88.24 61.33
16 Current Assets to Current Liabilities * * 0.98 1.29 1.16 0.99 0.87
17 No. of Days Cash Coverage of Cash Exp. * * 134.6 167.3 154.4 137.6 104.9
FINANCIAL PERCENTAGES: (%)
18 Operating Profit (Loss) to Operating Revenue -0.6 16.9 14.4 18.7 18.5 17.4 17.9
19 Net Income to Stockholders Equity * * 46.28 55.65 55.83 46.15 51.65
20 Corporate Return on Investment * * 27.9 34.1 33.8 27.9 31.3
21 Debt to Total Investment * * 43.5 34.5 35.4 40.7 45.9
PASSENGER LOAD FACTOR: (Sch. Svc. %)
22 Actual 86.5 87.3 87.0 87.2 87.7 87.6 87.2
23 Breakeven 114.9 79.7 91.0 82.6 79.6 75.9 71.2
Employment & Productivity:
24 Employment, Total Weighted Avg CY 3,472 2,992 3,279 3,159 3,046 2,950 2,877
25 Overall RTM's per Employee (000) 121.0 118.0 508.7 506.8 508.4 492.9 487.3
CHANGE OVER COMPARABLE PERIOD 12 MONTHS EARLIER
26 Operating Revenues (%) 16.8 -0.4 10.8 6.8 4.9 -1.6 -0.8
27 Operating Expenses (%) 41.4 -4.1 15.6 4.9 3.1 -2.3 -4.2
28 Operating Profit (Loss) (in Millions $) -64.9 11.8 -32.2 44.4 36.4 5.1 44.7
29 Net Income (Loss) (in Millions $) -38.8 7.7 10.6 57.1 37.8 -28.3 3.5
30 RPMs (Sch. Svc.) (%) 20.4 33.4 23.4 26.3 29.6 24.5 23.7
31 ASMs (Sch. Svc.) (%) 21.5 29.9 23.7 25.6 28.1 24.4 25.9
32 Operating Revenues per RTM (%) -1.9 -18.0 -6.9 -10.6 -15.0 -17.6 -17.5
33 Operating Expense per RTM (%) 18.8 -21.1 -2.8 -12.2 -16.4 -18.2 -20.3
34 Passenger Revenue per RPM (Sch. Svc.)(%) -9.5 -34.7 -22.7 -28.1 -31.9 -30.3 -27.1
23

QUARTERLY FINANCIAL & TRAFFIC REVIEW
SYSTEM OPERATIONSHawaiian Airlines Inc. (HA)
2017 q1 2016 q1 2017 q1 2016 q4 2016 q3 2016 q2 2016 q1Quarter Ended 12 Months Ended
Items
FINANCIAL RESULTS: ($Millions)
1 Operating Revenues 612.5 547.8 2,506.3 2,441.5 2,383.3 2,343.9 2,321.7
2 Operating Expenses 540.7 452.5 2,054.0 1,965.8 1,878.2 1,860.4 1,867.4
3 Operating Profit (Loss) 71.9 95.3 452.2 475.7 505.1 483.4 454.3
4 Net Income (Loss) 39.0 53.0 226.4 240.4 276.2 243.8 213.2
TRAFFIC: (Billions)
5 RPMs - Scheduled Rev. Svc. 3.8 3.5 15.7 15.5 15.2 14.9 14.6
6 ASMs - Scheduled Rev. Svc. 4.5 4.4 18.5 18.3 18.2 17.9 17.8
7 Overall RTMs (All Svc.) 0.4 0.4 1.8 1.8 1.7 1.7 1.7
8 Overall ATMs (All Svc.) 0.8 0.8 3.3 3.2 3.2 3.2 3.1
YIELD & UNIT COST & PROFITS: (Cents)
9 Operating Revenue per RTM 139.1 135.3 138.1 137.2 136.9 137.5 138.1
10 Operating Expense per RTM 122.8 111.7 113.2 110.5 107.9 109.1 111.1
11 Operating Profit (Loss) per RTM 16.3 23.5 24.9 26.7 29.0 28.4 27.0
12 Operating Expense per ATM 66.8 58.9 62.6 60.7 58.7 58.9 59.5
13 Passenger Revenue per RPM 14.08 13.53 13.90 13.78 13.69 13.73 13.85
FINANCIAL RATIOS:
14 Operating Revenues to Total Investment * * 2.39 2.33 2.25 2.18 2.10
15 Times Interest Earned * * 13.11 12.36 12.19 9.82 8.06
16 Current Assets to Current Liabilities * * 0.87 0.88 0.95 0.84 0.87
17 No. of Days Cash Coverage of Cash Exp. * * 125.0 105.9 128.5 114.3 124.1
FINANCIAL PERCENTAGES: (%)
18 Operating Profit (Loss) to Operating Revenue 11.7 17.4 18.0 19.5 21.2 20.6 19.6
19 Net Income to Stockholders Equity * * 30.69 35.43 45.01 45.34 45.15
20 Corporate Return on Investment * * 24.4 26.2 29.8 26.8 23.7
21 Debt to Total Investment * * 22.7 25.9 26.8 31.2 42.3
PASSENGER LOAD FACTOR: (Sch. Svc. %)
22 Actual 84.0 81.1 85.0 84.3 83.6 82.9 81.9
23 Breakeven 75.0 66.8 69.1 67.0 64.5 64.5 64.8
Employment & Productivity:
24 Employment, Total Weighted Avg CY 5,606 5,125 5,471 5,351 5,214 5,092 4,993
25 Overall RTM's per Employee (000) 78.6 79.0 331.7 332.5 333.8 334.8 336.8
CHANGE OVER COMPARABLE PERIOD 12 MONTHS EARLIER
26 Operating Revenues (%) 11.8 1.6 7.9 5.5 3.0 1.0 -0.2
27 Operating Expenses (%) 19.5 -3.2 10.0 4.4 -2.0 -5.8 -7.4
28 Operating Profit (Loss) (in Millions $) -23.5 23.3 -2.1 44.7 107.1 135.9 145.1
29 Net Income (Loss) (in Millions $) -14.1 20.4 13.2 47.6 107.3 108.0 97.8
30 RPMs (Sch. Svc.) (%) 7.2 6.2 7.6 7.4 6.4 5.0 4.5
31 ASMs (Sch. Svc.) (%) 3.5 3.3 3.7 3.7 3.3 3.0 3.4
32 Operating Revenues per RTM (%) 2.8 0.0 0.0 -0.6 -1.4 -1.6 -2.6
33 Operating Expense per RTM (%) 9.9 -4.7 1.9 -1.7 -6.1 -8.2 -9.6
34 Passenger Revenue per RPM (Sch. Svc.)(%) 4.0 -3.2 0.4 -1.3 -3.1 -4.0 -4.9
24

QUARTERLY FINANCIAL & TRAFFIC REVIEW
SYSTEM OPERATIONSJetBlue Airways (B6)
2017 q1 2016 q1 2017 q1 2016 q4 2016 q3 2016 q2 2016 q1Quarter Ended 12 Months Ended
Items
FINANCIAL RESULTS: ($Millions)
1 Operating Revenues 1,603.9 1,616.4 6,619.9 6,632.4 6,585.0 6,540.9 6,508.8
2 Operating Expenses 1,456.3 1,267.4 5,513.1 5,324.3 5,248.8 5,209.1 5,205.1
3 Operating Profit (Loss) 147.6 348.9 1,106.8 1,308.1 1,336.2 1,331.8 1,303.7
4 Net Income (Loss) 85.3 199.5 644.4 758.6 768.6 767.7 739.5
TRAFFIC: (Billions)
5 RPMs - Scheduled Rev. Svc. 11.4 11.0 46.1 45.6 45.0 44.2 43.1
6 ASMs - Scheduled Rev. Svc. 13.6 13.0 54.2 53.6 53.1 52.3 50.9
7 Overall RTMs (All Svc.) 1.1 1.1 4.6 4.6 4.5 4.4 4.3
8 Overall ATMs (All Svc.) 1.7 1.6 6.8 6.7 6.7 6.6 6.4
YIELD & UNIT COST & PROFITS: (Cents)
9 Operating Revenue per RTM 140.7 147.1 143.6 145.2 146.1 147.7 150.4
10 Operating Expense per RTM 127.7 115.3 119.6 116.6 116.5 117.6 120.3
11 Operating Profit (Loss) per RTM 12.9 31.8 24.0 28.6 29.7 30.1 30.1
12 Operating Expense per ATM 86.0 77.5 81.2 79.1 78.7 79.3 81.3
13 Passenger Revenue per RPM 12.73 13.46 13.00 13.18 13.28 13.49 13.84
FINANCIAL RATIOS:
14 Operating Revenues to Total Investment * * 1.23 1.25 1.26 1.28 1.30
15 Times Interest Earned * * 11.37 12.84 12.61 12.19 11.46
16 Current Assets to Current Liabilities * * 0.61 0.70 0.80 0.80 0.72
17 No. of Days Cash Coverage of Cash Exp. * * 74.7 71.9 109.0 113.8 96.8
FINANCIAL PERCENTAGES: (%)
18 Operating Profit (Loss) to Operating Revenue 9.2 21.6 16.7 19.7 20.3 20.4 20.0
19 Net Income to Stockholders Equity * * 17.04 20.93 22.44 23.88 24.42
20 Corporate Return on Investment * * 13.8 16.2 16.7 17.2 17.1
21 Debt to Total Investment * * 25.1 25.6 30.5 32.4 34.3
PASSENGER LOAD FACTOR: (Sch. Svc. %)
22 Actual 84.0 84.3 85.0 85.1 84.8 84.5 84.6
23 Breakeven 77.8 64.3 71.1 67.8 66.7 66.2 66.6
Employment & Productivity:
24 Employment, Total Weighted Avg CY 16,882 15,364 16,365 15,985 15,630 15,283 14,978
25 Overall RTM's per Employee (000) 67.5 71.5 281.6 285.7 288.3 289.7 288.9
CHANGE OVER COMPARABLE PERIOD 12 MONTHS EARLIER
26 Operating Revenues (%) -0.8 6.1 1.7 3.4 5.0 7.1 8.6
27 Operating Expenses (%) 14.9 -1.0 5.9 2.0 0.3 -1.0 -1.5
28 Operating Profit (Loss) (in Millions $) -201.3 105.3 -196.9 109.8 300.0 482.2 595.6
29 Net Income (Loss) (in Millions $) -114.2 62.5 -95.1 81.5 194.1 312.6 205.7
30 RPMs (Sch. Svc.) (%) 3.9 14.1 6.9 9.4 11.0 11.4 11.1
31 ASMs (Sch. Svc.) (%) 4.2 14.1 6.5 8.8 10.4 11.6 10.7
32 Operating Revenues per RTM (%) -4.4 -6.4 -4.5 -5.0 -4.7 -3.4 -1.8
33 Operating Expense per RTM (%) 10.7 -12.7 -0.6 -6.2 -9.0 -10.7 -11.0
34 Passenger Revenue per RPM (Sch. Svc.)(%) -5.5 -8.0 -6.1 -6.7 -6.9 -5.4 -2.8
25

QUARTERLY FINANCIAL & TRAFFIC REVIEW
SYSTEM OPERATIONSSkyWest Airlines Inc. (OO)
2017 q1 2016 q1 2017 q1 2016 q4 2016 q3 2016 q2 2016 q1Quarter Ended 12 Months Ended
Items
FINANCIAL RESULTS: ($Millions)
1 Operating Revenues 535.9 493.8 2,117.0 2,075.0 2,054.6 2,026.1 1,974.2
2 Operating Expenses 488.5 442.0 1,889.4 1,842.9 1,809.3 1,778.9 1,743.4
3 Operating Profit (Loss) 47.4 51.8 227.6 232.1 245.3 247.2 230.7
4 Net Income (Loss) 27.5 28.0 13.1 13.5 135.6 135.5 123.9
TRAFFIC: (Billions)
5 RPMs - Scheduled Rev. Svc. 4.2 4.2 17.6 17.5 17.6 17.6 17.3
6 ASMs - Scheduled Rev. Svc. 5.3 5.2 21.4 21.3 21.4 21.3 21.0
7 Overall RTMs (All Svc.) 0.4 0.4 1.8 1.8 1.8 1.8 1.7
8 Overall ATMs (All Svc.) 0.6 0.6 2.6 2.6 2.6 2.6 2.6
YIELD & UNIT COST & PROFITS: (Cents)
9 Operating Revenue per RTM 128.7 118.9 120.6 118.2 116.7 115.3 113.9
10 Operating Expense per RTM 117.3 106.5 107.6 105.0 102.8 101.2 100.6
11 Operating Profit (Loss) per RTM 11.4 12.5 13.0 13.2 13.9 14.1 13.3
12 Operating Expense per ATM 78.3 69.2 73.6 71.4 69.5 68.3 67.9
13 Passenger Revenue per RPM 12.44 11.52 11.69 11.48 11.33 11.21 11.07
FINANCIAL RATIOS:
14 Operating Revenues to Total Investment * * 0.60 0.62 0.64 0.65 0.66
15 Times Interest Earned * * 1.86 1.96 9.10 8.50 7.38
16 Current Assets to Current Liabilities * * 1.62 2.10 1.65 1.43 1.44
17 No. of Days Cash Coverage of Cash Exp. * * 119.1 117.9 118.1 109.3 98.4
FINANCIAL PERCENTAGES: (%)
18 Operating Profit (Loss) to Operating Revenue 8.8 10.5 10.8 11.2 11.9 12.2 11.7
19 Net Income to Stockholders Equity * * 0.90 0.93 9.40 9.63 9.00
20 Corporate Return on Investment * * 1.1 1.2 5.1 5.3 5.2
21 Debt to Total Investment * * 63.2 62.5 56.9 54.9 53.8
PASSENGER LOAD FACTOR: (Sch. Svc. %)
22 Actual 78.7 79.4 82.2 82.4 82.4 82.5 82.6
23 Breakeven 71.6 70.6 72.7 72.4 71.7 71.6 72.2
Employment & Productivity:
24 Employment, Total Weighted Avg CY 11,067 10,545 10,793 10,663 10,556 10,381 10,196
25 Overall RTM's per Employee (000) 37.6 39.4 162.7 164.6 166.8 169.3 169.9
CHANGE OVER COMPARABLE PERIOD 12 MONTHS EARLIER
26 Operating Revenues (%) 8.5 9.4 7.2 7.4 7.2 6.6 4.3
27 Operating Expenses (%) 10.5 6.7 8.4 7.4 2.9 1.9 -0.7
28 Operating Profit (Loss) (in Millions $) -4.4 14.6 -3.1 16.0 86.3 92.3 92.9
29 Net Income (Loss) (in Millions $) -0.4 10.6 -110.8 -99.8 61.1 66.6 67.2
30 RPMs (Sch. Svc.) (%) 0.3 9.2 1.3 3.4 6.3 8.6 9.8
31 ASMs (Sch. Svc.) (%) 1.1 11.5 1.8 4.2 7.1 9.4 10.5
32 Operating Revenues per RTM (%) 8.2 0.1 5.8 3.9 0.8 -1.8 -5.0
33 Operating Expense per RTM (%) 10.2 -2.3 6.9 3.9 -3.2 -6.2 -9.5
34 Passenger Revenue per RPM (Sch. Svc.)(%) 8.0 0.5 5.6 3.9 1.0 -1.3 -4.4
26

QUARTERLY FINANCIAL & TRAFFIC REVIEW
SYSTEM OPERATIONSSouthwest Airlines Co. (WN)^
2017 q1 2016 q1 2017 q1 2016 q4 2016 q3 2016 q2 2016 q1Quarter Ended 12 Months Ended
Items
FINANCIAL RESULTS: ($Millions)
1 Operating Revenues 4,882.7 4,826.3 20,481.6 20,425.2 20,326.9 20,505.7 20,232.2
2 Operating Expenses 4,224.6 3,882.5 17,007.3 16,665.1 16,386.5 16,034.8 15,952.2
3 Operating Profit (Loss) 658.0 943.8 3,474.3 3,760.1 3,940.4 4,470.9 4,280.0
4 Net Income (Loss) 351.5 511.3 2,082.1 2,242.0 2,255.6 2,451.7 2,239.7
TRAFFIC: (Billions)
5 RPMs - Scheduled Rev. Svc. 29.3 28.4 125.7 124.8 123.2 121.9 120.1
6 ASMs - Scheduled Rev. Svc. 36.7 35.3 150.0 148.5 146.8 145.2 143.5
7 Overall RTMs (All Svc.) 3.0 2.8 12.7 12.6 12.4 12.3 12.1
8 Overall ATMs (All Svc.) 4.4 4.3 18.2 18.0 17.8 17.6 17.4
YIELD & UNIT COST & PROFITS: (Cents)
9 Operating Revenue per RTM 164.4 169.7 161.1 162.2 163.5 166.6 166.9
10 Operating Expense per RTM 142.3 136.5 133.7 132.4 131.8 130.3 131.6
11 Operating Profit (Loss) per RTM 22.2 33.2 27.3 29.9 31.7 36.3 35.3
12 Operating Expense per ATM 95.0 91.0 93.7 92.7 92.3 91.3 91.9
13 Passenger Revenue per RPM 15.08 15.48 14.81 14.90 15.04 15.24 15.43
FINANCIAL RATIOS:
14 Operating Revenues to Total Investment * * 1.82 1.83 1.90 1.97 2.01
15 Times Interest Earned * * 44.80 47.82 46.92 49.04 44.56
16 Current Assets to Current Liabilities * * 0.62 0.66 0.62 0.57 0.55
17 No. of Days Cash Coverage of Cash Exp. * * 80.7 78.1 82.6 83.5 87.8
FINANCIAL PERCENTAGES: (%)
18 Operating Profit (Loss) to Operating Revenue 13.5 19.6 17.0 18.4 19.4 21.8 21.2
19 Net Income to Stockholders Equity * * 26.02 28.63 29.92 33.31 31.21
20 Corporate Return on Investment * * 19.1 20.8 21.8 24.4 23.0
21 Debt to Total Investment * * 27.2 28.6 29.0 30.0 30.6
PASSENGER LOAD FACTOR: (Sch. Svc. %)
22 Actual 79.9 80.5 83.8 84.0 83.9 83.9 83.7
23 Breakeven 66.5 61.2 66.3 65.0 64.0 61.4 62.1
Employment & Productivity:
24 Employment, Total Weighted Avg CY 54,417 50,446 53,169 52,176 51,145 49,998 48,889
25 Overall RTM's per Employee (000) 54.6 56.4 239.2 241.3 243.1 246.1 248.0
CHANGE OVER COMPARABLE PERIOD 12 MONTHS EARLIER
26 Operating Revenues (%) 1.2 9.3 1.2 3.1 4.4 8.2 7.3
27 Operating Expenses (%) 8.8 6.8 6.6 6.1 4.0 1.1 -0.7
28 Operating Profit (Loss) (in Millions $) -285.8 163.5 -805.7 -356.4 229.9 1,371.0 1,489.8
29 Net Income (Loss) (in Millions $) -159.9 58.4 -157.6 60.7 420.0 871.7 802.7
30 RPMs (Sch. Svc.) (%) 3.3 9.9 4.7 6.2 7.5 8.8 9.4
31 ASMs (Sch. Svc.) (%) 4.1 9.2 4.5 5.7 6.5 7.3 7.9
32 Operating Revenues per RTM (%) -3.1 0.8 -3.5 -2.6 -2.5 -0.2 -1.6
33 Operating Expense per RTM (%) 4.2 -1.5 1.6 0.3 -2.9 -6.7 -8.9
34 Passenger Revenue per RPM (Sch. Svc.)(%) -2.6 -4.2 -4.0 -4.3 -5.1 -5.2 -5.4
27

QUARTERLY FINANCIAL & TRAFFIC REVIEW
SYSTEM OPERATIONSSpirit Air Lines (NK)^
2017 q1 2016 q1 2017 q1 2016 q4 2016 q3 2016 q2 2016 q1Quarter Ended 12 Months Ended
Items
FINANCIAL RESULTS: ($Millions)
1 Operating Revenues 591.7 538.1 2,375.6 2,322.0 2,263.5 2,217.0 2,186.3
2 Operating Expenses 532.3 436.8 1,973.8 1,878.3 1,784.8 1,716.3 1,685.1
3 Operating Profit (Loss) 59.4 101.3 401.8 443.7 478.7 500.7 501.2
4 Net Income (Loss) 31.9 61.9 234.9 264.9 295.2 316.6 320.2
TRAFFIC: (Billions)
5 RPMs - Scheduled Rev. Svc. 5.6 5.1 22.1 21.6 20.9 20.1 19.1
6 ASMs - Scheduled Rev. Svc. 6.9 6.0 26.5 25.6 24.8 23.9 22.7
7 Overall RTMs (All Svc.) 0.6 0.5 2.2 2.2 2.1 2.0 1.9
8 Overall ATMs (All Svc.) 0.7 1.1 3.1 3.5 3.3 3.2 2.9
YIELD & UNIT COST & PROFITS: (Cents)
9 Operating Revenue per RTM 105.4 106.1 107.4 107.6 108.0 110.2 114.7
10 Operating Expense per RTM 94.8 86.1 89.2 87.0 85.2 85.3 88.4
11 Operating Profit (Loss) per RTM 10.6 20.0 18.2 20.6 22.9 24.9 26.3
12 Operating Expense per ATM 77.4 40.4 63.1 53.3 54.1 53.5 58.1
13 Passenger Revenue per RPM 5.88 5.93 6.06 6.08 6.10 6.28 6.67
FINANCIAL RATIOS:
14 Operating Revenues to Total Investment * * 1.76 1.78 1.80 1.84 1.88
15 Times Interest Earned * * 14.29 18.72 34.81 125.97 -890.28
16 Current Assets to Current Liabilities * * 1.69 1.82 1.92 1.94 1.88
17 No. of Days Cash Coverage of Cash Exp. * * 179.8 164.5 200.1 227.6 205.6
FINANCIAL PERCENTAGES: (%)
18 Operating Profit (Loss) to Operating Revenue 10.0 18.8 16.9 19.1 21.1 22.6 22.9
19 Net Income to Stockholders Equity * * 17.42 20.26 23.46 26.25 27.60
20 Corporate Return on Investment * * 19.5 22.1 24.5 26.6 27.6
21 Debt to Total Investment * *
PASSENGER LOAD FACTOR: (Sch. Svc. %)
22 Actual 81.1 84.1 83.4 84.2 84.5 84.0 84.1
23 Breakeven 65.2 52.7 55.7 52.5 49.3 47.0 47.3
Employment & Productivity:
24 Employment, Total Weighted Avg CY 5,691 4,888 5,430 5,230 5,010 4,772 4,535
25 Overall RTM's per Employee (000) 98.6 103.8 407.4 412.7 418.1 421.6 420.1
CHANGE OVER COMPARABLE PERIOD 12 MONTHS EARLIER
26 Operating Revenues (%) 10.0 9.1 8.7 8.4 8.0 8.6 10.0
27 Operating Expenses (%) 21.9 13.7 17.1 15.1 10.4 6.0 6.5
28 Operating Profit (Loss) (in Millions $) -41.9 -8.0 -99.4 -65.5 -0.1 79.0 96.6
29 Net Income (Loss) (in Millions $) -30.0 -7.1 -85.3 -62.4 -11.2 46.1 61.6
30 RPMs (Sch. Svc.) (%) 10.6 26.3 16.1 19.9 23.4 26.8 28.0
31 ASMs (Sch. Svc.) (%) 14.7 27.5 17.1 20.1 23.8 29.1 30.6
32 Operating Revenues per RTM (%) -0.6 -13.6 -6.4 -9.6 -12.5 -14.4 -14.0
33 Operating Expense per RTM (%) 10.2 -10.0 0.9 -4.1 -10.6 -16.4 -16.8
34 Passenger Revenue per RPM (Sch. Svc.)(%) -0.9 -19.7 -9.2 -13.7 -18.2 -20.8 -20.3
28
QUARTERLY FINANCIAL & TRAFFIC REVIEW
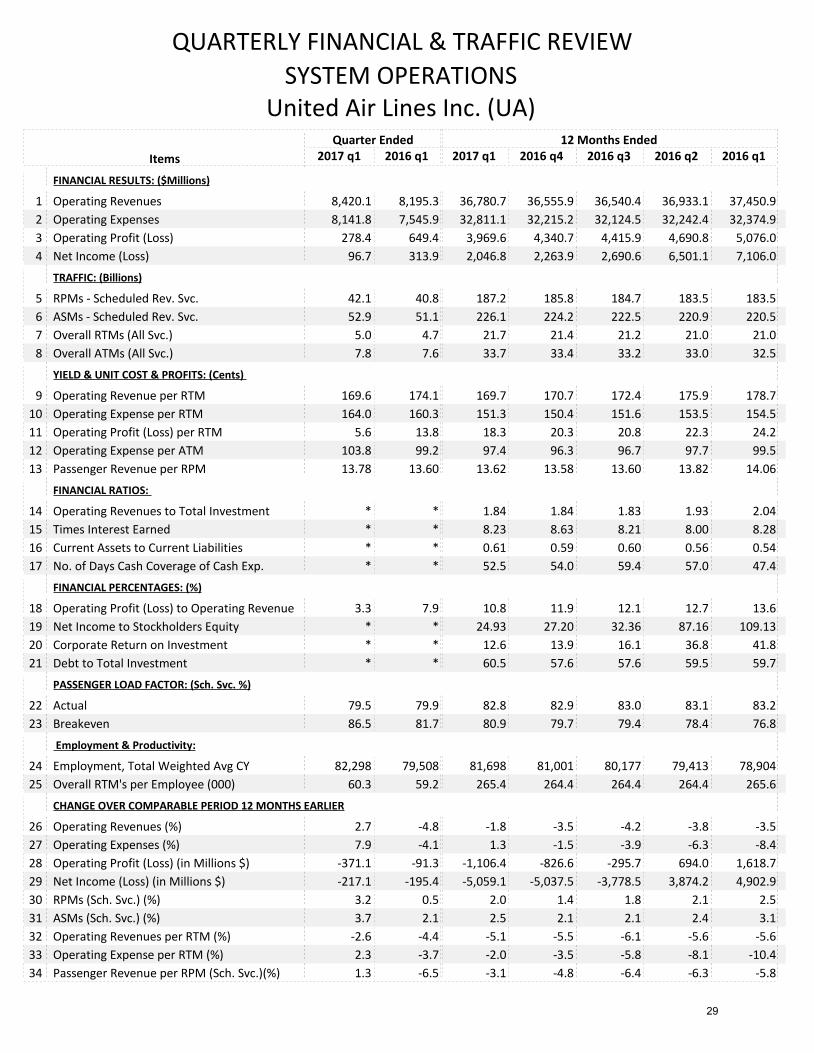
SYSTEM OPERATIONSUnited Air Lines Inc. (UA)
2017 q1 2016 q1 2017 q1 2016 q4 2016 q3 2016 q2 2016 q1Quarter Ended 12 Months Ended
Items
FINANCIAL RESULTS: ($Millions)
1 Operating Revenues 8,420.1 8,195.3 36,780.7 36,555.9 36,540.4 36,933.1 37,450.9
2 Operating Expenses 8,141.8 7,545.9 32,811.1 32,215.2 32,124.5 32,242.4 32,374.9
3 Operating Profit (Loss) 278.4 649.4 3,969.6 4,340.7 4,415.9 4,690.8 5,076.0
4 Net Income (Loss) 96.7 313.9 2,046.8 2,263.9 2,690.6 6,501.1 7,106.0
TRAFFIC: (Billions)
5 RPMs - Scheduled Rev. Svc. 42.1 40.8 187.2 185.8 184.7 183.5 183.5
6 ASMs - Scheduled Rev. Svc. 52.9 51.1 226.1 224.2 222.5 220.9 220.5
7 Overall RTMs (All Svc.) 5.0 4.7 21.7 21.4 21.2 21.0 21.0
8 Overall ATMs (All Svc.) 7.8 7.6 33.7 33.4 33.2 33.0 32.5
YIELD & UNIT COST & PROFITS: (Cents)
9 Operating Revenue per RTM 169.6 174.1 169.7 170.7 172.4 175.9 178.7
10 Operating Expense per RTM 164.0 160.3 151.3 150.4 151.6 153.5 154.5
11 Operating Profit (Loss) per RTM 5.6 13.8 18.3 20.3 20.8 22.3 24.2
12 Operating Expense per ATM 103.8 99.2 97.4 96.3 96.7 97.7 99.5
13 Passenger Revenue per RPM 13.78 13.60 13.62 13.58 13.60 13.82 14.06
FINANCIAL RATIOS:
14 Operating Revenues to Total Investment * * 1.84 1.84 1.83 1.93 2.04
15 Times Interest Earned * * 8.23 8.63 8.21 8.00 8.28
16 Current Assets to Current Liabilities * * 0.61 0.59 0.60 0.56 0.54
17 No. of Days Cash Coverage of Cash Exp. * * 52.5 54.0 59.4 57.0 47.4
FINANCIAL PERCENTAGES: (%)
18 Operating Profit (Loss) to Operating Revenue 3.3 7.9 10.8 11.9 12.1 12.7 13.6
19 Net Income to Stockholders Equity * * 24.93 27.20 32.36 87.16 109.13
20 Corporate Return on Investment * * 12.6 13.9 16.1 36.8 41.8
21 Debt to Total Investment * * 60.5 57.6 57.6 59.5 59.7
PASSENGER LOAD FACTOR: (Sch. Svc. %)
22 Actual 79.5 79.9 82.8 82.9 83.0 83.1 83.2
23 Breakeven 86.5 81.7 80.9 79.7 79.4 78.4 76.8
Employment & Productivity:
24 Employment, Total Weighted Avg CY 82,298 79,508 81,698 81,001 80,177 79,413 78,904
25 Overall RTM's per Employee (000) 60.3 59.2 265.4 264.4 264.4 264.4 265.6
CHANGE OVER COMPARABLE PERIOD 12 MONTHS EARLIER
26 Operating Revenues (%) 2.7 -4.8 -1.8 -3.5 -4.2 -3.8 -3.5
27 Operating Expenses (%) 7.9 -4.1 1.3 -1.5 -3.9 -6.3 -8.4
28 Operating Profit (Loss) (in Millions $) -371.1 -91.3 -1,106.4 -826.6 -295.7 694.0 1,618.7
29 Net Income (Loss) (in Millions $) -217.1 -195.4 -5,059.1 -5,037.5 -3,778.5 3,874.2 4,902.9
30 RPMs (Sch. Svc.) (%) 3.2 0.5 2.0 1.4 1.8 2.1 2.5
31 ASMs (Sch. Svc.) (%) 3.7 2.1 2.5 2.1 2.1 2.4 3.1
32 Operating Revenues per RTM (%) -2.6 -4.4 -5.1 -5.5 -6.1 -5.6 -5.6
33 Operating Expense per RTM (%) 2.3 -3.7 -2.0 -3.5 -5.8 -8.1 -10.4
34 Passenger Revenue per RPM (Sch. Svc.)(%) 1.3 -6.5 -3.1 -4.8 -6.4 -6.3 -5.8
29

QUARTERLY FINANCIAL & TRAFFIC REVIEW
SYSTEM OPERATIONSVirgin America (VX)^
2017 q1 2016 q1 2017 q1 2016 q4 2016 q3 2016 q2 2016 q1Quarter Ended 12 Months Ended
Items
FINANCIAL RESULTS: ($Millions)
1 Operating Revenues 357.4 364.0 1,658.4 1,665.0 1,626.4 1,592.1 1,567.2
2 Operating Expenses 371.5 332.1 1,498.7 1,459.3 1,414.3 1,396.8 1,373.5
3 Operating Profit (Loss) -14.1 31.9 159.7 205.7 212.1 195.3 193.8
4 Net Income (Loss) -20.7 17.5 64.3 102.5 298.3 318.3 345.2
TRAFFIC: (Billions)
5 RPMs - Scheduled Rev. Svc. 2.7 2.6 12.3 12.2 11.8 11.2 10.8
6 ASMs - Scheduled Rev. Svc. 3.5 3.3 14.8 14.6 14.2 13.6 13.1
7 Overall RTMs (All Svc.) 0.3 0.3 1.2 1.2 1.2 1.1 1.1
8 Overall ATMs (All Svc.) 0.4 0.4 1.9 1.9 1.8 1.8 1.7
YIELD & UNIT COST & PROFITS: (Cents)
9 Operating Revenue per RTM 130.0 139.0 134.7 136.7 137.5 141.6 145.1
10 Operating Expense per RTM 135.1 126.8 121.8 119.8 119.6 124.3 127.2
11 Operating Profit (Loss) per RTM -5.1 12.2 13.0 16.9 17.9 17.4 17.9
12 Operating Expense per ATM 83.0 78.3 78.4 77.3 76.9 78.9 80.4
13 Passenger Revenue per RPM 11.15 12.11 11.71 11.92 12.01 12.38 12.70
FINANCIAL RATIOS:
14 Operating Revenues to Total Investment * * 0.84 1.03 1.37 1.52 1.74
15 Times Interest Earned * * 4.17 5.67 16.16 20.61 26.90
16 Current Assets to Current Liabilities * * 0.89 0.98 1.55 1.34 1.28
17 No. of Days Cash Coverage of Cash Exp. * * 50.8 67.4 162.4 160.2 152.0
FINANCIAL PERCENTAGES: (%)
18 Operating Profit (Loss) to Operating Revenue -4.0 8.8 9.6 12.4 13.0 12.3 12.4
19 Net Income to Stockholders Equity * * 4.12 8.47 36.40 42.77 51.96
20 Corporate Return on Investment * * 4.3 7.7 26.8 31.9 39.8
21 Debt to Total Investment * * 12.9 12.8 33.4 34.7 31.1
PASSENGER LOAD FACTOR: (Sch. Svc. %)
22 Actual 79.4 80.4 83.3 83.5 83.4 82.5 82.2
23 Breakeven 87.0 74.3 76.5 73.8 72.8 72.7 72.1
Employment & Productivity:
24 Employment, Total Weighted Avg CY 3,000 2,802 2,959 2,910 2,847 2,781 2,706
25 Overall RTM's per Employee (000) 91.7 93.4 416.0 418.5 415.4 404.2 399.1
CHANGE OVER COMPARABLE PERIOD 12 MONTHS EARLIER
26 Operating Revenues (%) -1.8 11.5 5.8 8.9 7.7 5.8 4.3
27 Operating Expenses (%) 11.9 6.8 9.1 7.9 5.3 2.7 -0.3
28 Operating Profit (Loss) (in Millions $) -46.1 16.5 -34.1 28.5 45.1 49.8 68.9
29 Net Income (Loss) (in Millions $) -38.2 4.7 -280.9 -238.0 144.8 195.1 250.0
30 RPMs (Sch. Svc.) (%) 5.0 16.0 14.0 16.7 16.0 10.8 6.5
31 ASMs (Sch. Svc.) (%) 6.3 15.6 12.6 14.9 14.5 10.9 6.9
32 Operating Revenues per RTM (%) -6.5 -3.9 -7.2 -6.7 -7.2 -4.6 -2.1
33 Operating Expense per RTM (%) 6.5 -8.0 -4.3 -7.5 -9.3 -7.3 -6.4
34 Passenger Revenue per RPM (Sch. Svc.)(%) -7.9 -4.5 -7.8 -7.2 -7.7 -5.2 -2.8
30

QUARTERLY FINANCIAL & TRAFFIC REVIEW
SYSTEM OPERATIONSSystem Cargo Majors
2017 q1 2016 q1 2017 q1 2016 q4 2016 q3 2016 q2 2016 q1Quarter Ended 12 Months Ended
Items
FINANCIAL RESULTS: ($Millions)
1 Operating Revenues 10,520.6 8,076.1 40,614.2 38,169.8 35,868.4 34,037.6 33,470.0
2 Operating Expenses 9,743.8 7,362.2 37,459.0 35,077.5 32,906.6 31,124.4 30,609.0
3 Operating Profit (Loss) 776.8 713.9 3,155.2 3,092.3 2,961.8 2,913.2 2,861.0
4 Net Income (Loss) 417.3 445.6 1,800.2 1,828.4 1,852.7 1,820.6 1,533.9
TRAFFIC: (Billions)
5 RTMs - Scheduled Svc. 4.5 4.3 18.7 18.5 18.4 18.3 18.2
6 ATMs - Scheduled Svc. 7.8 7.7 32.5 32.4 32.2 32.0 31.8
7 Overall RTMs (All Svc.) 6.4 6.1 26.7 26.4 26.0 25.8 25.8
8 Overall ATMs (All Svc.) 11.4 10.8 49.3 48.7 47.3 46.2 45.1
YIELD & UNIT COST & PROFITS: (Cents)
9 Operating Revenue per RTM 163.3 133.0 152.0 144.8 138.1 132.1 129.7
10 Operating Expense per RTM 151.2 121.3 140.2 133.1 126.7 120.8 118.6
11 Operating Profit (Loss) per RTM 12.1 11.8 11.8 11.7 11.4 11.3 11.1
12 Operating Expense per ATM 85.3 68.3 75.9 72.0 69.5 67.4 67.9
13 Passenger Revenue per RPM ++ ++ ++ ++ ++ ++ ++
FINANCIAL RATIOS:
14 Operating Revenues to Total Investment * * 1.98 1.92 1.85 1.80 1.81
15 Times Interest Earned * * 12.80 14.54 16.97 14.76 14.64
16 Current Assets to Current Liabilities * * 0.82 0.79 0.75 0.72 1.45
17 No. of Days Cash Coverage of Cash Exp. * * 17.2 18.4 18.3 17.9 15.5
FINANCIAL PERCENTAGES: (%)
18 Operating Profit (Loss) to Operating Revenue 7.4 8.8 7.8 8.1 8.3 8.6 8.5
19 Net Income to Stockholders Equity * * 10.13 10.54 10.96 11.02 9.52
20 Corporate Return on Investment * * 9.9 10.2 10.4 10.7 9.2
21 Debt to Total Investment * * 15.0 13.4 13.5 12.5 12.7
TON LOAD FACTOR: (%)
22 Scheduled Svc. 57.5 56.2 57.4 57.1 57.1 57.1 57.2
23 All Services 56.4 56.3 54.2 54.1 54.9 55.8 57.2
Employment & Productivity:
24 Employment, Total Weighted Avg CY 203,764 152,108 198,854 185,940 173,094 160,040 151,250
25 Overall RTM's per Employee (000) 31.6 39.9 134.4 141.7 150.0 161.0 170.7
CHANGE OVER COMPARABLE PERIOD 12 MONTHS EARLIER
26 Operating Revenues (%) 30.3 -2.1 21.3 13.5 4.6 -2.6 -5.5
27 Operating Expenses (%) 32.3 -4.7 22.4 13.3 3.7 -4.2 -7.7
28 Operating Profit (Loss) (in Millions $) 62.9 188.2 294.2 419.5 398.5 452.5 582.9
29 Net Income (Loss) (in Millions $) -28.2 19.8 266.2 314.3 614.4 550.3 134.8
30 RTMS (All Svc.) (%) 6.1 -3.5 3.5 1.2 -0.4 -1.6 -0.9
31 ATMs (All Svc.) (%) 5.9 1.7 9.4 8.4 6.5 3.3 1.9
32 Operating Revenues per RTM (%) 22.8 1.5 17.2 12.1 5.1 -1.0 -4.7
33 Operating Expense per RTM (%) 24.7 -1.1 18.2 11.9 4.2 -2.6 -6.9
34 Passenger Revenue per RPM (Sch. Svc.)(%) ++ ++ ++ ++ ++ ++ ++
31

QUARTERLY FINANCIAL & TRAFFIC REVIEW
DOMESTIC OPERATIONSDomestic Cargo Majors
2017 q1 2016 q1 2017 q1 2016 q4 2016 q3 2016 q2 2016 q1Quarter Ended 12 Months Ended
Items
FINANCIAL RESULTS: ($Millions)
1 Operating Revenues 6,209.2 5,679.3 24,243.4 23,713.5 23,426.1 23,260.9 23,201.2
2 Operating Expenses 4,776.6 4,420.8 18,766.2 18,410.3 18,173.2 18,034.3 18,049.6
3 Operating Profit (Loss) 1,432.6 1,258.5 5,477.2 5,303.1 5,252.9 5,226.6 5,151.6
4 Net Income (Loss) 836.1 806.4 3,438.0 3,408.2 3,453.8 3,438.1 3,234.5
TRAFFIC: (Billions)
5 RTMs - Scheduled Svc. 2.4 2.4 10.1 10.1 10.0 9.9 9.8
6 ATMs - Scheduled Svc. 4.5 4.5 18.7 18.7 18.5 18.3 18.0
7 Overall RTMs (All Svc.) 2.9 2.7 11.9 11.7 11.5 11.4 11.4
8 Overall ATMs (All Svc.) 5.3 5.0 22.3 22.1 21.5 21.1 20.6
YIELD & UNIT COST & PROFITS: (Cents)
9 Operating Revenue per RTM 217.4 209.5 204.3 202.3 202.8 203.5 204.3
10 Operating Expense per RTM 167.3 163.1 158.2 157.1 157.4 157.8 158.9
11 Operating Profit (Loss) per RTM 50.2 46.4 46.2 45.2 45.5 45.7 45.4
12 Operating Expense per ATM 90.5 87.7 84.0 83.3 84.4 85.6 87.5
13 Passenger Revenue per RPM ++ ++ ++ ++ ++ ++ ++
FINANCIAL RATIOS:
14 Operating Revenues to Total Investment * * ** ** ** ** **
15 Times Interest Earned * * ** ** ** ** **
16 Current Assets to Current Liabilities * * ** ** ** ** **
17 No. of Days Cash Coverage of Cash Exp. * * ** ** ** ** **
FINANCIAL PERCENTAGES: (%)
18 Operating Profit (Loss) to Operating Revenue 23.1 22.2 22.6 22.4 22.4 22.5 22.2
19 Net Income to Stockholders Equity * * ** ** ** ** **
20 Corporate Return on Investment * * ** ** ** ** **
21 Debt to Total Investment * * ** ** ** ** **
TON LOAD FACTOR: (%)
22 Scheduled Svc. 54.4 53.7 54.1 53.9 54.2 54.5 54.8
23 All Services 54.1 53.8 53.1 53.0 53.6 54.2 55.1
Employment & Productivity:
24 Employment, Total Weighted Avg CY * * ** ** ** ** **
25 Overall RTM's per Employee (000) * * ** ** ** ** **
CHANGE OVER COMPARABLE PERIOD 12 MONTHS EARLIER
26 Operating Revenues (%) 9.3 0.9 4.5 2.4 0.2 -1.7 -2.9
27 Operating Expenses (%) 8.0 -1.5 4.0 1.6 -1.3 -3.5 -5.0
28 Operating Profit (Loss) (in Millions $) 174.0 116.7 325.6 268.3 293.9 270.4 262.1
29 Net Income (Loss) (in Millions $) 29.8 51.0 203.4 224.7 362.1 320.7 39.4
30 RTMS (All Svc.) (%) 5.3 -0.6 4.5 3.1 1.9 1.1 0.9
31 ATMs (All Svc.) (%) 4.7 6.3 8.3 8.8 7.9 6.1 4.7
32 Operating Revenues per RTM (%) 3.8 1.5 0.0 -0.6 -1.6 -2.7 -3.8
33 Operating Expense per RTM (%) 2.6 -0.9 -0.5 -1.4 -3.1 -4.6 -5.9
34 Passenger Revenue per RPM (Sch. Svc.)(%) ++ ++ ++ ++ ++ ++ ++
32
QUARTERLY FINANCIAL & TRAFFIC REVIEW
INTERNATIONAL OPERATIONSInternational Cargo Majors
2017 q1 2016 q1 2017 q1 2016 q4 2016 q3 2016 q2 2016 q1Quarter Ended 12 Months Ended
Items
FINANCIAL RESULTS: ($Millions)
1 Operating Revenues 4,311.4 2,396.8 16,370.8 14,456.3 12,442.3 10,776.7 10,268.8
2 Operating Expenses 4,967.1 2,941.5 18,692.8 16,667.2 14,733.4 13,090.1 12,559.4
3 Operating Profit (Loss) -655.8 -544.6 -2,322.0 -2,210.8 -2,291.1 -2,313.4 -2,290.6
4 Net Income (Loss) -418.8 -360.8 -1,637.8 -1,579.8 -1,601.2 -1,617.5 -1,700.6
TRAFFIC: (Billions)
5 RTMs - Scheduled Svc. 2.1 1.9 8.6 8.4 8.4 8.3 8.3
6 ATMs - Scheduled Svc. 3.4 3.3 13.8 13.8 13.7 13.7 13.8
7 Overall RTMs (All Svc.) 3.6 3.4 14.9 14.6 14.4 14.3 14.5
8 Overall ATMs (All Svc.) 6.1 5.7 27.0 26.6 25.8 25.1 24.5
YIELD & UNIT COST & PROFITS: (Cents)
9 Operating Revenue per RTM 120.2 71.3 110.2 98.8 86.3 75.2 71.0
10 Operating Expense per RTM 138.5 87.5 125.8 113.9 102.2 91.3 86.9
11 Operating Profit (Loss) per RTM -18.3 -16.2 -15.6 -15.1 -15.9 -16.1 -15.8
12 Operating Expense per ATM 80.8 51.2 69.3 62.7 57.1 52.1 51.3
13 Passenger Revenue per RPM ++ ++ ++ ++ ++ ++ ++
FINANCIAL RATIOS:
14 Operating Revenues to Total Investment * * ** ** ** ** **
15 Times Interest Earned * * ** ** ** ** **
16 Current Assets to Current Liabilities * * ** ** ** ** **
17 No. of Days Cash Coverage of Cash Exp. * * ** ** ** ** **
FINANCIAL PERCENTAGES: (%)
18 Operating Profit (Loss) to Operating Revenue -15.2 -22.7 -14.2 -15.3 -18.4 -21.5 -22.3
19 Net Income to Stockholders Equity * * ** ** ** ** **
20 Corporate Return on Investment * * ** ** ** ** **
21 Debt to Total Investment * * ** ** ** ** **
TON LOAD FACTOR: (%)
22 Scheduled Svc. 61.6 59.6 61.9 61.4 61.0 60.5 60.3
23 All Services 58.4 58.5 55.1 55.0 55.9 57.1 59.1
Employment & Productivity:
24 Employment, Total Weighted Avg CY * * ** ** ** ** **
25 Overall RTM's per Employee (000) * * ** ** ** ** **
CHANGE OVER COMPARABLE PERIOD 12 MONTHS EARLIER
26 Operating Revenues (%) 79.9 -8.4 59.4 37.8 14.1 -4.5 -11.1
27 Operating Expenses (%) 68.9 -9.0 48.8 29.7 10.7 -5.0 -11.3
28 Operating Profit (Loss) (in Millions $) -111.2 71.4 -31.4 151.2 104.6 182.1 320.8
29 Net Income (Loss) (in Millions $) -58.0 -31.2 62.8 89.6 252.3 229.6 95.5
30 RTMS (All Svc.) (%) 6.7 -5.8 2.8 -0.2 -2.2 -3.6 -2.3
31 ATMs (All Svc.) (%) 7.0 -2.1 10.3 8.1 5.5 1.0 -0.4
32 Operating Revenues per RTM (%) 68.5 -2.8 55.1 38.1 16.7 -0.9 -9.0
33 Operating Expense per RTM (%) 58.2 -3.4 44.8 29.9 13.3 -1.4 -9.2
34 Passenger Revenue per RPM (Sch. Svc.)(%) ++ ++ ++ ++ ++ ++ ++
33

QUARTERLY FINANCIAL & TRAFFIC REVIEW
SYSTEM OPERATIONSAtlas Air Inc. (5Y)
2017 q1 2016 q1 2017 q1 2016 q4 2016 q3 2016 q2 2016 q1Quarter Ended 12 Months Ended
Items
FINANCIAL RESULTS: ($Millions)
1 Operating Revenues 408.6 377.2 1,632.0 1,600.6 1,573.0 1,604.0 1,640.1
2 Operating Expenses 409.9 375.3 1,542.8 1,508.2 1,519.1 1,520.1 1,521.5
3 Operating Profit (Loss) -1.4 1.9 89.2 92.4 53.9 83.9 118.6
4 Net Income (Loss) -12.6 -10.2 -4.7 -2.3 -16.6 -30.3 -9.8
TRAFFIC: (Billions)
5 RTMs - Scheduled Svc.
6 ATMs - Scheduled Svc.
7 Overall RTMs (All Svc.) 0.9 0.8 3.7 3.6 3.4 3.5 3.5
8 Overall ATMs (All Svc.) 2.1 1.6 10.4 9.9 8.9 8.2 7.3
YIELD & UNIT COST & PROFITS: (Cents)
9 Operating Revenue per RTM 46.9 49.2 44.2 44.6 45.7 46.2 46.3
10 Operating Expense per RTM 47.0 48.9 41.8 42.1 44.2 43.8 43.0
11 Operating Profit (Loss) per RTM -0.2 0.2 2.4 2.6 1.6 2.4 3.3
12 Operating Expense per ATM 19.7 23.5 14.8 15.2 17.0 18.5 20.9
13 Passenger Revenue per RPM ++ ++ ++ ++ ++ ++ ++
FINANCIAL RATIOS:
14 Operating Revenues to Total Investment * * 0.72 0.72 0.73 0.75 0.77
15 Times Interest Earned * * 1.54 1.57 0.84 0.60 0.85
16 Current Assets to Current Liabilities * * 0.73 0.74 0.50 0.62 0.67
17 No. of Days Cash Coverage of Cash Exp. * * 18.2 10.3 7.2 17.4 23.8
FINANCIAL PERCENTAGES: (%)
18 Operating Profit (Loss) to Operating Revenue -0.3 0.5 5.5 5.8 3.4 5.2 7.2
19 Net Income to Stockholders Equity * * -0.66 -0.33 -2.46 -4.46 -1.43
20 Corporate Return on Investment * * 2.4 2.6 2.2 4.7 5.8
21 Debt to Total Investment * * 68.4 65.7 69.3 69.4 68.7
TON LOAD FACTOR: (%)
22 Scheduled Svc.
23 All Services 41.8 48.1 35.5 36.2 38.6 42.2 48.6
Employment & Productivity:
24 Employment, Total Weighted Avg CY 2,286 2,064 2,231 2,175 2,098 2,015 1,935
25 Overall RTM's per Employee (000) 381.4 371.5 1,654.5 1,648.7 1,639.9 1,721.6 1,830.8
CHANGE OVER COMPARABLE PERIOD 12 MONTHS EARLIER
26 Operating Revenues (%) 8.3 -5.6 -0.5 -3.7 -6.4 -5.5 -2.4
27 Operating Expenses (%) 9.2 3.1 1.4 -0.1 -0.5 -0.7 -0.5
28 Operating Profit (Loss) (in Millions $) -3.3 -33.8 -29.4 -59.9 -99.4 -82.3 -33.4
29 Net Income (Loss) (in Millions $) -2.4 -23.3 5.1 -15.8 -37.6 -104.4 -89.3
30 RTMS (All Svc.) (%) 13.7 -9.7 4.2 -1.1 -7.2 -6.2 -3.3
31 ATMs (All Svc.) (%) 30.8 -0.8 42.8 35.8 25.6 9.3 -1.3
32 Operating Revenues per RTM (%) -4.8 4.5 -4.5 -2.7 0.9 0.8 0.9
33 Operating Expense per RTM (%) -4.0 14.1 -2.7 0.9 7.2 5.9 2.9
34 Passenger Revenue per RPM (Sch. Svc.)(%) ++ ++ ++ ++ ++ ++ ++
34

QUARTERLY FINANCIAL & TRAFFIC REVIEW
SYSTEM OPERATIONSFederal Express Corporation (FX)
2017 q1 2016 q1 2017 q1 2016 q4 2016 q3 2016 q2 2016 q1Quarter Ended 12 Months Ended
Items
FINANCIAL RESULTS: ($Millions)
1 Operating Revenues 8,430.8 6,221.4 32,397.7 30,188.4 28,056.8 26,145.0 25,400.8
2 Operating Expenses 7,698.5 5,567.9 29,606.6 27,476.0 25,425.0 23,583.4 22,944.4
3 Operating Profit (Loss) 732.3 653.5 2,791.1 2,712.3 2,631.8 2,561.6 2,456.5
4 Net Income (Loss) 418.8 422.8 1,665.1 1,669.2 1,692.1 1,694.3 1,431.6
TRAFFIC: (Billions)
5 RTMs - Scheduled Svc. 2.7 2.6 10.9 10.8 10.7 10.8 10.8
6 ATMs - Scheduled Svc. 4.9 4.8 19.8 19.7 19.6 19.5 19.5
7 Overall RTMs (All Svc.) 2.7 2.6 10.9 10.8 10.8 10.8 10.8
8 Overall ATMs (All Svc.) 4.9 4.8 19.9 19.8 19.7 19.6 19.5
YIELD & UNIT COST & PROFITS: (Cents)
9 Operating Revenue per RTM 313.3 239.3 297.7 279.8 260.6 242.6 235.3
10 Operating Expense per RTM 286.1 214.2 272.1 254.6 236.2 218.9 212.6
11 Operating Profit (Loss) per RTM 27.2 25.1 25.6 25.1 24.4 23.8 22.8
12 Operating Expense per ATM 157.4 116.0 149.0 138.9 129.1 120.3 117.5
13 Passenger Revenue per RPM ++ ++ ++ ++ ++ ++ ++
FINANCIAL RATIOS:
14 Operating Revenues to Total Investment * * 2.58 2.48 2.37 2.28 2.30
15 Times Interest Earned * * 17.79 23.13 37.34 113.19 -313.35
16 Current Assets to Current Liabilities * * 0.68 0.67 0.63 0.64 1.46
17 No. of Days Cash Coverage of Cash Exp. * * 18.7 20.7 21.1 20.3 16.4
FINANCIAL PERCENTAGES: (%)
18 Operating Profit (Loss) to Operating Revenue 8.7 10.5 8.6 9.0 9.4 9.8 9.7
19 Net Income to Stockholders Equity * * 13.55 14.02 14.66 15.14 13.24
20 Corporate Return on Investment * * 14.5 14.6 14.9 15.0 12.9
21 Debt to Total Investment * * 2.1 2.3 2.5 2.5 2.1
TON LOAD FACTOR: (%)
22 Scheduled Svc. 55.2 54.3 54.9 54.7 54.7 55.1 55.4
23 All Services 55.0 54.2 54.8 54.6 54.6 55.0 55.3
Employment & Productivity:
24 Employment, Total Weighted Avg CY 194,434 143,245 189,713 176,916 164,185 151,247 142,566
25 Overall RTM's per Employee (000) 13.8 18.1 57.4 61.0 65.6 71.2 75.7
CHANGE OVER COMPARABLE PERIOD 12 MONTHS EARLIER
26 Operating Revenues (%) 35.5 0.5 27.5 19.0 9.2 0.3 -3.7
27 Operating Expenses (%) 38.3 -3.8 29.0 18.6 7.6 -2.3 -6.7
28 Operating Profit (Loss) (in Millions $) 78.8 253.5 334.7 509.4 554.3 609.7 689.5
29 Net Income (Loss) (in Millions $) -4.0 158.2 233.5 395.7 522.3 608.8 279.4
30 RTMS (All Svc.) (%) 3.5 -2.9 0.8 -0.8 -1.8 -2.2 -2.4
31 ATMs (All Svc.) (%) 2.0 1.8 1.7 1.7 1.1 0.3 -0.1
32 Operating Revenues per RTM (%) 30.9 3.6 26.5 19.9 11.2 2.5 -1.3
33 Operating Expense per RTM (%) 33.6 -0.9 28.0 19.5 9.6 -0.1 -4.5
34 Passenger Revenue per RPM (Sch. Svc.)(%) ++ ++ ++ ++ ++ ++ ++
35
QUARTERLY FINANCIAL & TRAFFIC REVIEW
SYSTEM OPERATIONSKalitta Air LLC (KAQ)^
2017 q1 2016 q1 2017 q1 2016 q4 2016 q3 2016 q2 2016 q1Quarter Ended 12 Months Ended
Items
FINANCIAL RESULTS: ($Millions)
1 Operating Revenues 136.0 119.3 592.4 575.7 536.7 530.1 546.8
2 Operating Expenses 140.6 121.9 552.5 533.8 512.5 513.8 523.1
3 Operating Profit (Loss) -4.5 -2.6 40.0 41.9 24.2 16.3 23.7
4 Net Income (Loss) -6.2 -3.1 36.5 39.6 20.6 12.7 19.6
TRAFFIC: (Billions)
5 RTMs - Scheduled Svc.
6 ATMs - Scheduled Svc.
7 Overall RTMs (All Svc.) 0.4 0.3 1.6 1.6 1.5 1.4 1.5
8 Overall ATMs (All Svc.) 0.5 0.5 2.4 2.4 2.3 2.2 2.3
YIELD & UNIT COST & PROFITS: (Cents)
9 Operating Revenue per RTM 37.7 34.5 37.7 37.0 36.2 36.7 36.9
10 Operating Expense per RTM 39.0 35.3 35.1 34.3 34.6 35.5 35.3
11 Operating Profit (Loss) per RTM -1.3 -0.8 2.5 2.7 1.6 1.1 1.6
12 Operating Expense per ATM 26.9 23.1 23.2 22.3 22.6 23.1 22.9
13 Passenger Revenue per RPM ++ ++ ++ ++ ++ ++ ++
FINANCIAL RATIOS:
14 Operating Revenues to Total Investment * * 1.25 1.27 1.25 1.26 1.30
15 Times Interest Earned * * 8.53 11.25 8.00 5.00 6.75
16 Current Assets to Current Liabilities * * 1.92 2.10 1.60 1.78 2.15
17 No. of Days Cash Coverage of Cash Exp. * * 60.6 63.4 31.6 34.2 47.2
FINANCIAL PERCENTAGES: (%)
18 Operating Profit (Loss) to Operating Revenue -3.3 -2.2 6.7 7.3 4.5 3.1 4.3
19 Net Income to Stockholders Equity * * 9.20 10.15 5.44 3.39 5.30
20 Corporate Return on Investment * * 8.7 9.6 5.5 3.8 5.5
21 Debt to Total Investment * * 22.3 19.9 16.6 9.7 10.3
TON LOAD FACTOR: (%)
22 Scheduled Svc.
23 All Services 69.0 65.5 66.0 65.2 65.4 65.1 65.0
Employment & Productivity:
24 Employment, Total Weighted Avg CY 1,257 1,190 1,242 1,225 1,200 1,173 1,144
25 Overall RTM's per Employee (000) 286.9 290.4 1,265.9 1,271.2 1,235.2 1,232.4 1,296.9
CHANGE OVER COMPARABLE PERIOD 12 MONTHS EARLIER
26 Operating Revenues (%) 14.0 -24.6 8.4 -1.7 -13.6 -18.3 -18.9
27 Operating Expenses (%) 15.3 -10.0 5.6 -0.5 -10.8 -14.7 -17.4
28 Operating Profit (Loss) (in Millions $) -2.0 -25.4 16.3 -7.1 -22.5 -29.8 -17.7
29 Net Income (Loss) (in Millions $) -3.1 -25.3 16.8 -5.4 -23.2 -30.4 -19.9
30 RTMS (All Svc.) (%) 4.4 -9.3 6.0 2.5 -2.0 -4.1 3.7
31 ATMs (All Svc.) (%) -0.9 -1.7 4.5 4.3 -0.5 -0.7 8.1
32 Operating Revenues per RTM (%) 9.2 -16.8 2.2 -4.1 -11.8 -14.8 -21.8
33 Operating Expense per RTM (%) 10.5 -0.7 -0.3 -2.9 -8.9 -11.1 -20.3
34 Passenger Revenue per RPM (Sch. Svc.)(%) ++ ++ ++ ++ ++ ++ ++
36

QUARTERLY FINANCIAL & TRAFFIC REVIEW
SYSTEM OPERATIONSPolar Air Cargo Airways (PO)^
2017 q1 2016 q1 2017 q1 2016 q4 2016 q3 2016 q2 2016 q1Quarter Ended 12 Months Ended
Items
FINANCIAL RESULTS: ($Millions)
1 Operating Revenues 276.5 223.4 1,087.4 1,034.4 1,010.5 1,021.5 1,060.3
2 Operating Expenses 275.8 222.9 1,085.9 1,033.0 1,008.9 1,019.3 1,056.8
3 Operating Profit (Loss) 0.6 0.5 1.5 1.3 1.5 2.2 3.5
4 Net Income (Loss) 0.0 0.0 0.0 0.0 0.0 0.0
TRAFFIC: (Billions)
5 RTMs - Scheduled Svc.
6 ATMs - Scheduled Svc.
7 Overall RTMs (All Svc.) 0.7 0.6 2.8 2.7 2.6 2.6 2.6
8 Overall ATMs (All Svc.) 0.9 0.9 3.9 3.9 3.8 3.7 3.7
YIELD & UNIT COST & PROFITS: (Cents)
9 Operating Revenue per RTM 39.9 36.7 39.3 38.6 38.5 39.6 41.1
10 Operating Expense per RTM 39.8 36.6 39.3 38.5 38.4 39.5 40.9
11 Operating Profit (Loss) per RTM 0.1 0.1 0.1 0.0 0.1 0.1 0.1
12 Operating Expense per ATM 29.4 24.6 27.8 26.7 26.3 27.6 28.8
13 Passenger Revenue per RPM ++ ++ ++ ++ ++ ++ ++
FINANCIAL RATIOS:
14 Operating Revenues to Total Investment * * 70.34 66.90 65.36 66.07 68.58
15 Times Interest Earned * * 1.06 1.07 1.02 1.01 1.00
16 Current Assets to Current Liabilities * * 1.12 1.19 1.19 1.23 1.21
17 No. of Days Cash Coverage of Cash Exp. * * 16.9 10.4 15.2 10.3 13.3
FINANCIAL PERCENTAGES: (%)
18 Operating Profit (Loss) to Operating Revenue 0.2 0.2 0.1 0.1 0.2 0.2 0.3
19 Net Income to Stockholders Equity * * 0.00 0.00 0.00 0.00
20 Corporate Return on Investment * * 5.7 5.5 5.1 5.7 6.6
21 Debt to Total Investment * *
TON LOAD FACTOR: (%)
22 Scheduled Svc.
23 All Services 73.9 67.3 70.7 69.2 68.5 69.8 70.4
Employment & Productivity:
24 Employment, Total Weighted Avg CY 188 178 184 182 179 175 171
25 Overall RTM's per Employee (000) 3,688.3 3,420.6 15,024.3 14,724.9 14,666.7 14,728.6 15,099.8
CHANGE OVER COMPARABLE PERIOD 12 MONTHS EARLIER
26 Operating Revenues (%) 23.8 -10.6 2.6 -4.8 -9.0 -8.5 -2.9
27 Operating Expenses (%) 23.7 -10.5 2.8 -4.6 -8.8 -8.5 -3.0
28 Operating Profit (Loss) (in Millions $) 0.2 -0.3 -2.0 -2.5 -2.1 -0.9 1.7
29 Net Income (Loss) (in Millions $) 0.0 0.0 0.0 0.0 0.0 0.0
30 RTMS (All Svc.) (%) 13.9 -1.5 7.1 3.4 6.0 8.0 16.8
31 ATMs (All Svc.) (%) 3.8 6.6 6.6 7.3 11.9 14.0 23.5
32 Operating Revenues per RTM (%) 8.7 -9.3 -4.2 -8.0 -14.1 -15.4 -16.8
33 Operating Expense per RTM (%) 8.6 -9.2 -4.0 -7.8 -14.0 -15.3 -16.9
34 Passenger Revenue per RPM (Sch. Svc.)(%) ++ ++ ++ ++ ++ ++ ++
37

QUARTERLY FINANCIAL & TRAFFIC REVIEW
SYSTEM OPERATIONSUnited Parcel Service (5X)
2017 q1 2016 q1 2017 q1 2016 q4 2016 q3 2016 q2 2016 q1Quarter Ended 12 Months Ended
Items
FINANCIAL RESULTS: ($Millions)
1 Operating Revenues 1,268.8 1,134.8 4,904.6 4,770.7 4,691.5 4,737.0 4,822.0
2 Operating Expenses 1,219.0 1,074.2 4,671.2 4,526.4 4,441.2 4,487.8 4,563.2
3 Operating Profit (Loss) 49.8 60.6 233.5 244.3 250.3 249.2 258.8
4 Net Income (Loss) 17.3 36.0 103.3 122.0 156.5 143.9 92.5
TRAFFIC: (Billions)
5 RTMs - Scheduled Svc. 1.8 1.8 7.8 7.7 7.6 7.5 7.4
6 ATMs - Scheduled Svc. 3.0 3.0 12.7 12.7 12.6 12.4 12.3
7 Overall RTMs (All Svc.) 1.8 1.8 7.8 7.7 7.7 7.5 7.4
8 Overall ATMs (All Svc.) 3.0 3.0 12.8 12.7 12.6 12.5 12.3
YIELD & UNIT COST & PROFITS: (Cents)
9 Operating Revenue per RTM 69.5 64.8 62.7 61.6 61.3 63.2 65.1
10 Operating Expense per RTM 66.7 61.4 59.8 58.5 58.0 59.9 61.6
11 Operating Profit (Loss) per RTM 2.7 3.5 3.0 3.2 3.3 3.3 3.5
12 Operating Expense per ATM 40.9 36.3 36.6 35.5 35.2 36.0 37.0
13 Passenger Revenue per RPM ++ ++ ++ ++ ++ ++ ++
FINANCIAL RATIOS:
14 Operating Revenues to Total Investment * * 0.94 0.95 0.94 0.98 0.99
15 Times Interest Earned * * 8.71 7.15 6.41 5.55 4.68
16 Current Assets to Current Liabilities * * 2.91 2.24 2.48 1.84 1.76
17 No. of Days Cash Coverage of Cash Exp. * * 1.7 2.8 3.9 4.3 4.4
FINANCIAL PERCENTAGES: (%)
18 Operating Profit (Loss) to Operating Revenue 3.9 5.3 4.8 5.1 5.3 5.3 5.4
19 Net Income to Stockholders Equity * * 2.37 2.82 3.64 3.38 2.18
20 Corporate Return on Investment * * 2.4 3.0 3.8 3.7 2.7
21 Debt to Total Investment * * 21.8 16.8 16.7 12.3 13.7
TON LOAD FACTOR: (%)
22 Scheduled Svc. 61.3 59.2 61.4 60.9 60.7 60.2 60.1
23 All Services 61.3 59.2 61.2 60.8 60.6 60.2 60.1
Employment & Productivity:
24 Employment, Total Weighted Avg CY 5,598 5,430 5,482 5,440 5,431 5,428 5,433
25 Overall RTM's per Employee (000) 326.3 322.4 1,425.9 1,422.9 1,410.2 1,381.2 1,363.5
CHANGE OVER COMPARABLE PERIOD 12 MONTHS EARLIER
26 Operating Revenues (%) 11.8 -9.3 1.7 -3.4 -9.3 -12.2 -14.2
27 Operating Expenses (%) 13.5 -9.3 2.4 -3.2 -9.2 -12.1 -14.0
28 Operating Profit (Loss) (in Millions $) -10.8 -5.9 -25.3 -20.4 -31.7 -44.1 -57.2
29 Net Income (Loss) (in Millions $) -18.7 -89.8 10.8 -60.3 152.9 76.2 -35.4
30 RTMS (All Svc.) (%) 4.3 -1.0 5.5 4.2 3.1 -1.1 -3.5
31 ATMs (All Svc.) (%) 0.8 1.9 3.6 3.8 3.9 2.2 0.8
32 Operating Revenues per RTM (%) 7.2 -8.4 -3.6 -7.3 -12.0 -11.3 -11.1
33 Operating Expense per RTM (%) 8.8 -8.4 -3.0 -7.1 -11.9 -11.1 -10.8
34 Passenger Revenue per RPM (Sch. Svc.)(%) ++ ++ ++ ++ ++ ++ ++
38

Comparison of Operating Profit (Loss)
Operating Profit (Loss) ($Billions)
2016 q1 Compared To 2017 q1
2016 q1 2017 q1 YE 2016 q1 YE 2017 q1
Quarterly Data 12 Months Ended Data$ Chg $ Chg
For Individual System Majors
System Passenger Majors -2,368.5 -5,783.55,564.2 3,195.7 28,288.0 22,504.5
Alaska Airlines Inc. (AS) -83.6 2.3298.8 215.2 1,351.9 1,354.2
Allegiant Air (G4)^ -49.4 -69.2115.5 66.1 368.0 298.9
American Airlines Inc. (AA)^ -719.4 -1,725.71,323.2 603.8 6,310.5 4,584.8
Delta Air Lines Inc. (DL) -476.4 -1,484.51,544.3 1,067.9 7,984.5 6,500.0
Envoy Air (MQ) -5.7 46.03.5 -2.3 -37.1 8.9
ExpressJet Airlines Inc. (EV)^ 5.0 -272.5-5.8 -0.8 -17.3 -289.8
Frontier Airlines Inc. (F9) -64.9 -32.262.2 -2.7 287.7 255.4
Hawaiian Airlines Inc. (HA) -23.5 -2.195.3 71.9 454.3 452.2
JetBlue Airways (B6) -201.3 -196.9348.9 147.6 1,303.7 1,106.8
SkyWest Airlines Inc. (OO) -4.4 -3.151.8 47.4 230.7 227.6
Southwest Airlines Co. (WN)^ -285.8 -805.7943.8 658.0 4,280.0 3,474.3
Spirit Air Lines (NK)^ -41.9 -99.4101.3 59.4 501.2 401.8
United Air Lines Inc. (UA) -371.1 -1,106.4649.4 278.4 5,076.0 3,969.6
Virgin America (VX)^ -46.1 -34.131.9 -14.1 193.8 159.7
System Cargo Majors 62.9 294.2713.9 776.8 2,861.0 3,155.2
Atlas Air Inc. (5Y) -3.3 -29.41.9 -1.4 118.6 89.2
Federal Express Corporation (FX) 78.8 334.7653.5 732.3 2,456.5 2,791.1
Kalitta Air LLC (KAQ)^ -2.0 16.3-2.6 -4.5 23.7 40.0
Polar Air Cargo Airways (PO)^ 0.2 -2.00.5 0.6 3.5 1.5
United Parcel Service (5X) -10.8 -25.360.6 49.8 258.8 233.5
-2,305.6 -5,489.36,278.1 3,972.5 31,149.0 25,659.7System All Majors
39

Comparison of Net Income (Loss)
Net Income (Loss) ($Millions)
2016 q1 Compared To 2017 q1
2016 q1 2017 q1 YE 2016 q1 YE 2017 q1
Quarterly Data 12 Months Ended Data$ Chg $ Chg
For Individual System Majors
System Passenger Majors -1,502.7 -11,744.93,178.9 1,676.2 24,825.5 13,080.6
Alaska Airlines Inc. (AS) -62.6 -51.6185.3 122.7 868.3 816.7
Allegiant Air (G4)^ -48.6 -68.9112.4 63.7 356.5 287.6
American Airlines Inc. (AA)^ -447.7 -5,314.3710.3 262.6 7,647.8 2,333.5
Delta Air Lines Inc. (DL) -339.3 -678.6955.2 615.9 4,749.2 4,070.6
Envoy Air (MQ) 3.2 20.9-2.6 0.7 -18.8 2.2
ExpressJet Airlines Inc. (EV)^ 4.8 112.6-5.2 -0.4 -18.6 94.1
Frontier Airlines Inc. (F9) -38.8 10.638.5 -0.2 153.2 163.9
Hawaiian Airlines Inc. (HA) -14.1 13.253.0 39.0 213.2 226.4
JetBlue Airways (B6) -114.2 -95.1199.5 85.3 739.5 644.4
SkyWest Airlines Inc. (OO) -0.4 -110.828.0 27.5 123.9 13.1
Southwest Airlines Co. (WN)^ -159.9 -157.6511.3 351.5 2,239.7 2,082.1
Spirit Air Lines (NK)^ -30.0 -85.361.9 31.9 320.2 234.9
United Air Lines Inc. (UA) -217.1 -5,059.1313.9 96.7 7,106.0 2,046.8
Virgin America (VX)^ -38.2 -280.917.5 -20.7 345.2 64.3
System Cargo Majors -28.2 266.2445.6 417.3 1,533.9 1,800.2
Atlas Air Inc. (5Y) -2.4 5.1-10.2 -12.6 -9.8 -4.7
Federal Express Corporation (FX) -4.0 233.5422.8 418.8 1,431.6 1,665.1
Kalitta Air LLC (KAQ)^ -3.1 16.8-3.1 -6.2 19.6 36.5
Polar Air Cargo Airways (PO)^ 0.0 0.00.0 0.0 0.0 0.0
United Parcel Service (5X) -18.7 10.836.0 17.3 92.5 103.3
-1,530.9 -11,478.63,624.4 2,093.5 26,359.4 14,880.8System All Majors
40

Comparison of Passenger Load Factors
Passenger Load Factor (Percent)
2016 q1 Compared To 2017 q1
2016 q1 2017 q1 YE 2016 q1 YE 2017 q1
Quarterly Data 12 Months Ended DataPt Chg Pt Chg
For Individual System Passenger Majors
System Passenger Majors -0.2 -0.381.3 81.1 83.9 83.7
Alaska Airlines Inc. (AS) 0.1 0.782.5 82.6 84.2 84.9
Allegiant Air (G4)^ -3.7 -1.786.3 82.6 86.3 84.5
American Airlines Inc. (AA)^ -0.4 -1.180.3 79.9 83.3 82.3
Delta Air Lines Inc. (DL) 0.8 -0.282.9 83.8 85.7 85.4
Envoy Air (MQ) 1.3 0.274.9 76.2 79.3 79.5
ExpressJet Airlines Inc. (EV)^ -0.5 -0.276.8 76.4 80.6 80.4
Frontier Airlines Inc. (F9) -0.8 -0.287.3 86.5 87.2 87.0
Hawaiian Airlines Inc. (HA) 2.9 3.181.1 84.0 81.9 85.0
JetBlue Airways (B6) -0.3 0.484.3 84.0 84.6 85.0
SkyWest Airlines Inc. (OO) -0.6 -0.479.4 78.7 82.6 82.2
Southwest Airlines Co. (WN)^ -0.6 0.280.5 79.9 83.7 83.8
Spirit Air Lines (NK)^ -3.0 -0.784.1 81.1 84.1 83.4
United Air Lines Inc. (UA) -0.3 -0.479.9 79.5 83.2 82.8
Virgin America (VX)^ -0.9 1.080.4 79.4 82.2 83.3
41

Comparison of Passenger Yields (Cents)
Passenger Yields (Cents)
2016 q1 Compared To 2017 q1
2016 q1 2017 q1 YE 2016 q1 YE 2017 q1
Quarterly Data 12 Months Ended Data% Chg % Chg
For Individual System Passenger Majors
System Passenger Majors -0.5% -3.3%13.7 13.7 14.0 13.5
Alaska Airlines Inc. (AS) -2.0% -4.9%12.1 11.8 12.8 12.2
Allegiant Air (G4)^ -1.5% -6.7%9.1 9.0 9.0 8.4
American Airlines Inc. (AA)^ 2.8% -1.0%14.2 14.6 14.2 14.1
Delta Air Lines Inc. (DL) -1.5% -4.0%14.7 14.4 14.8 14.3
Envoy Air (MQ) -10.0% 34.0%22.5 20.3 14.2 19.0
ExpressJet Airlines Inc. (EV)^ 5.0% 7.9%10.4 10.9 9.3 10.0
Frontier Airlines Inc. (F9) -9.5% -22.7%6.9 6.3 8.6 6.7
Hawaiian Airlines Inc. (HA) 4.0% 0.4%13.5 14.1 13.9 13.9
JetBlue Airways (B6) -5.5% -6.1%13.5 12.7 13.8 13.0
SkyWest Airlines Inc. (OO) 8.0% 5.6%11.5 12.4 11.1 11.7
Southwest Airlines Co. (WN)^ -2.6% -4.0%15.5 15.1 15.4 14.8
Spirit Air Lines (NK)^ -0.9% -9.2%5.9 5.9 6.7 6.1
United Air Lines Inc. (UA) 1.3% -3.1%13.6 13.8 14.1 13.6
Virgin America (VX)^ -7.9% -7.8%12.1 11.2 12.7 11.7
42

Comparison of Operating Profit Margin (Percent)
Operating Profit Margin (Percent)
2016 q1 Compared To 2017 q1
2016 q1 2017 q1 YE 2016 q1 YE 2017 q1
Quarterly Data 12 Months Ended DataPt Chg Pt Chg
For Individual System Majors
System Passenger Majors -6.4 -3.514.7 8.3 17.2 13.7
Alaska Airlines Inc. (AS) -6.7 -0.822.2 15.5 23.8 23.1
Allegiant Air (G4)^ -16.0 -7.434.2 18.2 29.7 22.3
American Airlines Inc. (AA)^ -7.7 -4.213.9 6.3 15.5 11.3
Delta Air Lines Inc. (DL) -5.0 -3.316.6 11.6 19.6 16.4
Envoy Air (MQ) -2.2 5.11.4 -0.8 -4.3 0.8
ExpressJet Airlines Inc. (EV)^ 1.8 -27.3-2.2 -0.4 -1.5 -28.8
Frontier Airlines Inc. (F9) -17.5 -3.616.9 -0.6 17.9 14.4
Hawaiian Airlines Inc. (HA) -5.7 -1.517.4 11.7 19.6 18.0
JetBlue Airways (B6) -12.4 -3.321.6 9.2 20.0 16.7
SkyWest Airlines Inc. (OO) -1.7 -0.910.5 8.8 11.7 10.8
Southwest Airlines Co. (WN)^ -6.1 -4.219.6 13.5 21.2 17.0
Spirit Air Lines (NK)^ -8.8 -6.018.8 10.0 22.9 16.9
United Air Lines Inc. (UA) -4.6 -2.87.9 3.3 13.6 10.8
Virgin America (VX)^ -12.7 -2.78.8 -4.0 12.4 9.6
System Cargo Majors -1.5 -0.88.8 7.4 8.5 7.8
Atlas Air Inc. (5Y) -0.8 -1.80.5 -0.3 7.2 5.5
Federal Express Corporation (FX) -1.8 -1.110.5 8.7 9.7 8.6
Kalitta Air LLC (KAQ)^ -1.2 2.4-2.2 -3.3 4.3 6.7
Polar Air Cargo Airways (PO)^ 0.0 -0.20.2 0.2 0.3 0.1
United Parcel Service (5X) -1.4 -0.65.3 3.9 5.4 4.8
-5.5 -3.213.6 8.1 15.8 12.5System All Majors
43

Comparison of Debt-to-Investment and Total Debt
2016 q1 Compared To 2017 q1
2016 q1 2017 q1 2016 q1 2017 q1
Quarterly Data Quarterly DataPt Chg $ Chg
For Individual System Majors
Debt To Investment (Percent) Total Debt ($Millions)
System Passenger Majors -1.0 6,440.849.2 48.2 48,962.4 55,403.2
Alaska Airlines Inc. (AS) 23.6 1,890.89.8 33.4 408.8 2,299.7
Allegiant Air (G4)^ -3.5 4.122.7 19.2 337.3 341.4
American Airlines Inc. (AA)^ -1.9 2,767.065.8 63.8 20,007.9 22,774.9
Delta Air Lines Inc. (DL) -1.1 775.342.7 41.6 8,451.3 9,226.5
Envoy Air (MQ) 0.1 0.1
ExpressJet Airlines Inc. (EV)^ -3.5 -146.441.7 38.2 345.3 198.9
Frontier Airlines Inc. (F9) -2.5 -15.845.9 43.5 239.9 224.1
Hawaiian Airlines Inc. (HA) -19.5 -186.242.3 22.7 431.6 245.4
JetBlue Airways (B6) -9.2 -443.334.3 25.1 1,780.0 1,336.7
SkyWest Airlines Inc. (OO) 9.4 797.553.8 63.2 1,668.9 2,466.4
Southwest Airlines Co. (WN)^ -3.4 -243.230.6 27.2 3,309.0 3,065.8
United Air Lines Inc. (UA) 0.8 1,237.759.7 60.5 11,605.5 12,843.2
Virgin America (VX)^ -18.1 3.431.1 12.9 376.8 380.2
System Cargo Majors 2.3 813.012.7 15.0 2,463.6 3,276.6
Atlas Air Inc. (5Y) -0.2 168.768.7 68.4 1,485.0 1,653.6
Federal Express Corporation (FX) 0.0 26.02.1 2.1 249.5 275.5
Kalitta Air LLC (KAQ)^ 12.1 76.010.3 22.3 43.3 119.3
United Parcel Service (5X) 8.0 542.413.7 21.8 685.9 1,228.3
-0.4 7,253.843.3 42.9 51,426.0 58,679.8System All Majors
44

Not Calculated on a quarterly basis.*
** Cannot be calculated because balance sheet data not submitted on an entity basis. Data presented only on a system basis.
++ Not calculated for all-cargo carriers.
^ Carrier specific note. See below.
ENDNOTES
& Meaningfull calculation cannot be made.
Allegiant Air (G4)
Effective 2016q1 Allegiant Air was designated a Group III Major. All data collected by the Department for Allegiant Air is included in this report.
American Airlines Inc. (AA)
Effective 2015q3 US Airways (US) ceased reporting data to the Department because of the American - US Airways merger. All data for US Airways has been combined with American Airlines in this report.
ExpressJet Airlines Inc. (EV)
Effective 2013q1 ExpressJet Airlines was designated a Group III Major. All data collected by the Department for ExpressJet is included in this report.
Kalitta Air LLC (KAQ)
Effective 2015q1 Kalitta Air was no longer designated a Group III Major. All data collected by the Department for Kalitta Air is included in this report.
Polar Air Cargo Airways (PO)
Effective 2015q1 Polar Air Cargo was designated a Group III Major. All data collected by the Department for Polar Air Cargo is included in this report.
Southwest Airlines Co. (WN)
Effective 2012q2 AirTran Airways (FL) ceased reporting Financial data to the Department because of the Southwest - AirTran merger. All data for AirTran Airways has been combined with Southwest Airlines in this report.
Spirit Air Lines (NK)
Effective 2013q1 Spirit Air Lines was designated a Group III Major. All data collected by the Department for Spirit Air Lines is included in this report.
Virgin America (VX)
Effective 2013q1 Virgin America was designated a Group III Major. All data collected by the Department for Virgin America is included in this report.
45

Carrier List
Passenger
FL AirTran Airways Corporation
AS Alaska Airlines Inc.
G4^ Allegiant Air
AA^ American Airlines Inc.
DL Delta Air Lines Inc.
MQ Envoy Air
EV^ ExpressJet Airlines Inc.
F9 Frontier Airlines Inc.
HA Hawaiian Airlines Inc.
B6 JetBlue Airways
OO SkyWest Airlines Inc.
WN^ Southwest Airlines Co.
NK^ Spirit Air Lines
UA United Air Lines Inc.
US US Airways Inc.
VX^ Virgin America
Cargo
5Y Atlas Air Inc.
FX Federal Express Corporation
KAQ^ Kalitta Air LLC
PO^ Polar Air Cargo Airways
5X United Parcel Service
46

Explanation of Line Items
Line
#
Reported
By
Description of Line
ItemLine Item Derivation
FINANCIAL RESULTS: ($Millions)
1 All Operating Revenues Total Operating Revenues (P012 Account 49990)
2 All Operating Expenses Total Operating Expenses (P012 Account 71990)
3 All Operating Profit (Loss) Operating Profit Or Loss (P012 Account 79990)
4 All Net Income (Loss) Net Income (P012 Account 98990)
TRAFFIC: (Billions)
Combi Only RPMs ‐ Scheduled Rev. Svc. Scheduled Revenue Passenger Miles (T100_K_RPM_140)
Cargo Only RTMs ‐ Scheduled Rev. Svc. Scheduled Revenue Ton Miles (T100_K_RTM_240)
Combi Only ASMs ‐ Scheduled Rev. Svc. Scheduled Available Passenger Miles (T100_K_ASM_320)
Cargo Only ATMs ‐ Scheduled Rev. Svc. Scheduled Available Ton Miles (T100_K_ATM_280)
7 All RTMs (All Svc.) RTMs (All Svc.) (T100_Z_RTM_240)
8 All ATMs (All Svc.) ATMs (All Svc.) (T100_Z_ATM_280)
YIELD & UNIT COST & PROFITS: (Cents)
9 All Operating Revenue per RTMOperating Revenues (P012 Account 49990)
All Services Revenue Ton‐Miles (T100_Z_RTM_240)
10 All Operating Expense per RTMOperating Expenses (P012 Account 71990)
All Services Revenue Ton‐Miles (T100_Z_RTM_240)
11 AllOperating Profit (Loss) per
RTM
Operating Profit (P012 Account 79990)
All Services Revenue Ton‐Miles (T100_Z_RTM_240)
12 All Operating Expense per ATMOperating Expenses (P012 Account 71990)
All Services Available Ton‐Miles (T100_Z_ATM_280)
13 All Passenger Revenue per RPMPassenger Revenues (schd service) (P012 Account 39010)
Scheduled Revenue Passenger Miles (T100_K_RPM_140)
5
6
47

Explanation of Line Items
Line
#
Reported
By
Description of Line
ItemLine Item Derivation
FINANCIAL RATIOS:
Total Operating Revenues (P012 Account 49990)
(Current Maturities of Long‐Term Debt (B010 Account 20000) + Current Obligations Under Capital
Leases (B010 Account 20800) + Long‐Term Debt (B010 Account 22100) + Advances from Associated
Companies (B010 Account 22400) + Noncurrent Obligations Under Capital Leases (B010 Account 22800) + Net Stockholders' Equity (B010 Account 29950) (A five‐quarter average is used)
Income Before Income Tax (P012 Account 89990) + Interest on Long‐Term Debt and Capital Leases
(P012 Account 81810) + Other Interest Expense (P012 Account 81820)
Interest On Long‐Term Debt and Capital Leases (P012 Account 81810) + Other Interest Expense (P012 Account 81820)
16 AllCurrent Assets to Current
Liabilities
Total Current Assets (B010 Account 14990)
Total Current Liabilities (B010 Account 21990)
17 AllNo. of Days Cash Coverage of
Cash Exp.
Cash (B010 Account 10100) + Short Term Investments (B010 Account 11000)
(Total Operating Expenses (P012 Account 71990) + Depreciation And Amortization (B010 Account 70000) / 365
FINANCIAL PERCENTAGES:
18 AllOperating Profit (Loss) to
Operating Revenue
Operating Profit Or Loss (P012 Account 79990)
Total Operating Revenues (P012 Account 49990)
19 AllNet Income to Stockholders
Equity
Net Income (P012 Account 98990)
Net Stockholders' Equity (B010 Account 29950)
Corporate Return on
Investment(Net Income minus Interest Expense) / Total Investment
Net Income (P012 Account 98990) ‐ (Interest On Long Term Debt And Capital Leases
(P012 Account 81810 ) + Other Interest Expense (P012 Account 81820))
Current Maturities Of Long‐Term Debt (B010 Account 20000) + Current Obligations Under Capital Leases (B010 Account 20800) + Long Term Debt (B010 Account 22100) + Advances From
Associated Companies (B010 Account 22400) + Nonrecurrent Obligations Under Capital Leases (B010 Account 22800) + Net Stockholders' Equity (B010 Account 29950)
Current Maturities Of Long‐Term Debt (B010 Account 20000) + Current Obligations Under Capital Leases (B010 Account 20800) + Long Term Debt (B010 Account 22100) + Advances From
Associated Companies (B010 Account 22400) +
Nonrecurrent Obligations Under Capital Leases (B010 Account 22800)
Current Maturities Of Long‐Term Debt (B010 Account 20000) + Current Obligations Under Capital Leases (B010 Account 20800) + Advances From Associated Companies (B010 Account 22400)
+ Nonrecurrent Obligations Under Capital Leases (B010 Account 22800) +
Net Stockholders' Equity (B010 Account 29950) + Long Term Debt (B010 Account 22100)
All
All
14Operating Revenues to Total
Investment
15 Times Interest Earned
Corporate Return on
Investment
(Calculation Details)
20 All
21 Debt to Total InvestmentAll
48

Explanation of Line Items
Line
#
Reported
By
Description of Line
ItemLine Item Derivation
LOAD FACTOR: (%)
22 AllActual Passenger Load Factor
(Sch. Svc.)
Scheduled Revenue Passenger Miles (T100 K_RPM_140)
Scheduled Available Passenger Miles (T100 K_ASM_320)
(Total Operating Revenues (P012 Account 49990) + Transport Revenues Expenses (P012 Account 71000) ‐ (Transport Revenues ‐ Passenger (P012 Account 39010) *.90) ‐ Total Operating
Expenses (P012 Account 71990) ‐ Transport Related Revenues (P012 Account 48980) ) *
(Scheduled Revenue Passenger Miles (T100 K_RPM_140) / Scheduled Available Passenger Miles (T100 K_ASM_320))
(Transport Revenues ‐ Passenger (P012 Account 39010) * .90))
Cargo Only Ton Load Factor (All Svc.)Overall RTMs (All Svc.) (T100 Z_RTM_240)
Overall ATMs (All Svc.) (T100 Z_ATM_280)
Employment & Productivity:
24 AllEmployment, Total Weighted
Avg CY
((P1a Account Z_f99007) + ((P1a Account Z‐f99008)/2))
Months in Period (3 Quarter; 12 Month Ended)
Overall RTMs (All Svc.) (T100 Z_RTM_240)
(((P1a Account Z_f99007) + ((P1a Account Z‐f99008)/ 2))
Months in Period (3 Quarter; 12 Month Ended))
Change Over Comparable Period 12 Month Earlier:
26 All Operating Revenues (%) Total Operating Revenues (P012 Account 49990) (CY/PY)
27 All Operating Expenses (%) Total Operating Expenses (P012 Account 71990) (CY/PY)
28 AllOperating Profit (Loss)
(in Millions $)Operating Profit Or Loss (P012 Account 79990) (CY/PY)
29 AllNet Income (Loss)
(in Millions $)Net Income (P012 Account 98990) (CY/PY)
30 All RPMs (Sch. Svc.) (%) Scheduled Revenue Passenger Miles (T100_K_RPM_140) (CY/PY)
31 All ASMs (Sch. Svc.) (%) Scheduled Available Passenger Miles (T100_K_ASM_320) (CY/PY)
32 AllOperating Revenues per RTM
(%)
Operating Revenues (P012 Account 49990)
System Ton‐Miles (T100_Z_RTM_240) (CY/PY)
33 AllOperating Expense per RTM
(%)
Operating expenses (P012 Account 71990)
System Available Ton‐Miles (T100_Z_ATM_280) (CY/PY)
34 AllPassenger Revenue per RPM
(Sch. Svc.) (%)
Passenger Revenues (schd service) (P012 Account 39010)
Scheduled Revenue Passenger Miles (T100_K_RPM_140) (CY/PY)
Combi Only
23
25Overall RTM's per Employee
(000)
Breakeven Passenger Load
Factor (Sch. Svc.)
All
49