Embed Size (px)
Citation preview
Aircraft Identification, Trajectory Tracking and Prediction
Final Report
Luis C. Cattani Paul J. Eagle
University of Detroit Mercy Mechanical Engineering Department
Detroit, MI 48219-0900
Prepared for
U.S. Army ARDEC Picatinny Arsenal, New Jersey 07801-5000
Technical Monitor: Frank P. Kuhl (201) 724-6267
Contract No. DAAA21-92-C-0089
U.S. ARMY ARMAMENT RESEARCH, DEVELOPMENT AND ENGINEERING CENTER
Picatinny Arsenal, New Jersey
TTHTT* INSPECT 2 pjXC QUALITY
imm m Approved for public release; distribution unlimited.

The views, opinions, and/or findings contained in this report are those of the authors and should not be construed as an official Department of the Army position, policy, or decision, unless so designated by other documents.
REPORT DOCUMENTATION PAGE "'? \ö -'-
-^•^ Z 3 ^1 '. A-3EKCY JSE ON.Y '_e,»v* SW*) I 2 REPORT GA'£
PCTOBER 1995 FINAL/ 1/93 - 10/95 I"! TIE AND SwJTl*Li
AIRCRAFT IDENTIFICATION,TRAJECTORY TRACKING AND PREDICTION
I AUTHOR 5J LUIS C. CATTANI, PAUL J. EAGLE
UNIVERSITY OF DETROIT MERCY
DAAA21-92-0089
7 PERFCRV1NG CRGANIZ»T;ON NAME{S; *NC ADDRESSES;
UNIVERSITY OF DETROIT MERCY MECHANICAL ENGINEERING DEPARTMENT
! P. 0. BOX 19900 DETROIT, MI 48219
9. SPONSORING MONITORING AGENOT NAMES, A.SD' *OOR£5S(ES)
ARDEC SMCAR-FSF-RC, B95 PICATINNY ARSENAL NJ 07806-5000
8. PERFORMING ~SGAN'ZAro«i
10. SPONSORING M0N!TCRIN<3 AOENCT «fPOPT NUMOCa
11. SumSMENTARY NOTES
PREPARED UNDER THE DIRECTION OF DR. FRANK P. KUHL, TECHNICAL MONITOR FOR THE ABOVE REFERENCED CONTRACT
12» WSTHWUTIOM/AVAILABUTY STATEMENT
APPROVED FOR PUBLIC RELEASE DISTRIBUTION IS UNLIMITED
12b. DISTRIBUTION COOE
U. AKTfcACT (,Vj»mumJO0wwji;
Techniques are presented for improving methods of aircraft identification and trajectory prediction. This work represents an extension of the advanced trackers that use both translation and attitude data to improve accuracy of trajectory tracking and prediction. The novel extension in this work deals with the development of a new tracking algorithm based on a radius of curvature estimator, use of regression-based artificial measurements during the prediction interval and development of aircraft identification techniques for vehicles being tracked based on remote trajectory measurements. The procedure was evaluated with actual position and attitude trajectory data for a F-14A, AV-8B and A6 aircraft acquired during training flights.
14. SU*JECT TERMS
TRACKING, TRAJECTORY, KALMAN FILTER, ESTIMATION, REGRESSION, TRACKERS
:i. Sicuwn CLASSISCATION OF RfOORT
UNCLASSIFIED NSN /i<S04;:-<!-iu-5jJV
18. StXUWTY CLASSIFICATION. OF TMI< »kC
UNCLASSIFIED
19. SECURITY CUSStTICAT'ON OF ABSTRACT
UNCLASSIFIED
15 NUMBER Of PASES
88 11. PRICE COOE
20. LIMITATION Of ABSTRACT
SAR
Summary
Techniques are presented for improving methods of aircraft identification and trajectory prediction. This work represents an extension of the advanced trackers that use both translation and attitude data to improve accuracy of trajectory tracking and prediction. The novel extension in this work deals with the development of a new tracking algorithm based on a radius of curvature estimator, use of regression-based artificial measurements during the prediction interval and development of aircraft identification techniques for vehicles being tracked based on remote trajectory measurements. The procedure was evaluated with actual position and attitude trajectory data for a F-14A, AV-8B and A6 aircraft acquired during training flights.

Acknowledgements
There were a number of sources of data and advice that were critical in performing this work. Bruce J. Pippett, Loral Aerospace, Edward McMullen, Cherry Point MCAS and T. Daniel Blair, Naval Air Systems Command, were responsible for providing the TACTS trajectory data used to test the tracking algorithms described in this work. Marge Draper-Donley, Cedric Walker and Thomas Lawrence, Naval Air Systems Command, were responsible for providing the vehicle specific characteristics used to implement certain trackers.

Table of Contents
Summary
Acknowledgements
1. Introduction
2. Research Objectives
3. Tracking and Prediction Technique Using Regression-Based Artificial Measurements
4. The Use of Aircraft Parameters for Identify Friend or Foe (IFF) Applications
5. Sample Application of the Trajectory Tracking/Prediction and Friend or Foe Aircraft Classification
6. Conclusions
7. Recommendations
1. Introduction
Pilots of unfriendly aircraft will employ all of their aircraft capabilities in order to increase the chances of their survival and their mission success. In order to maximize the probability of intercepting an unfriendly aircraft (by firing a projectile at the target), several challenges need to be addressed. Firstly, the type of aircraft in the scene needs to be recognized in order to resolve the uncertainty of having a friend or foe target. Secondly, the target position and orientation in space and its velocity needs to be determined. Lastly, a trajectory predictor needs to be implemented in order to calculate future target positions to direct the air defenses at the correct lead angle.
The research presented in this work is directed at improving methods of aircraft identification and trajectory prediction, in order to do so, several concepts needs to be understood before a problem definition could be formulated. This section will introduce the ideas of estimation and pattern recognition as relates to the problem that needs to be solved. Estimation is the process of extracting information from data which may be corrupted by
disturbances or noise. Modern estimation methods use known physical and mathematical relationships to compute desired information from measurements. These methods take into account measurement errors, the effects of disturbances and control actions on the system [43].
There are three types of estimation problems. When the time at which an estimate is desired coincides with the last measurement point, the problem is referred to as filtering. When the time of interest falls within the span of available measurement data, the problem is termed smoothing. And, when the time of interest occurs after the last available measurement, the problem is called prediction [43].
For nearly three decades the problem of filtering and predicting the trajectory of an aircraft for fire control has been a wide application area of state estimation theory. In this problem, a sensor system tracks the current position and sometimes the orientation of the target with an associated measurement error. The purpose of the filter is to process the noisy measurements in such a manner as to estimate the parameters required for the prediction model. Such parameters might include current target position, velocity, and acceleration.
The estimation problem in target trajectory tracking is to process the sensor outputs such that the best estimates of the trajectory parameters are obtained. Computer implemented data processing algorithms called trackers are used to perform the filtering and prediction of the target trajectory.
The research presented in this work is directed at improving methods of aircraft trajectory tracking. The goal is to improve the ability to filter and predict target trajectories using advanced regression-based data conditioning techniques in conjunction with attitude/translation models of the target dynamics.
1.1 Pattern Classification
Pattern Classification, the assignment of an object to one of a number of predetermined groups, is of fundamental importance in many areas of science and technology. The problem of classification is to find a way of assigning a new object on the basis of a set of measurements to one of a number of possible groups. Inherent in this statement of the problem is the idea of
8
a classification rule, that is, a well defined procedure that can be described and applied without the need for any additional subjective judgments [30, 55],
In the combat situation where a Friend needs to be identified from a Foe target, the problem of pattern classification takes an essential role. Furthermore, for military aircraft, it is of fundamental importance to define the type of aircraft in the scene, its position and orientation in space and its velocity, so that a trajectory estimator can be used to calculate the aircraft trajectory and consequently to direct the air defenses at the correct lead angle so as to maximize the probability of hitting the aircraft.
The research presented in this work describes a new approach to aircraft identification. Remote measurements of target aircraft trajectory are used to identify between friend and foe aircraft, and to determine foe aircraft classes.
1.2 The Fire Control Problem
The problem of fire control in air-to-air operations may be defined as follows: How can a projectile be fired from a potentially moving weapon station to strike a target aircraft? There are certain probabilistic factors influencing the problem: the target position at the time of hit and the projectile's time of flight, during which the projectile is under the influence of natural phenomena outside the launcher's control. Some of the variables in the fire control problem are illustrated in Figure 1.1.
Important quantities used in analyzing fire control problems are:
1. The line of sight between the attacking aircraft to the target. 2. The weapon line or direction in which the weapon should be launched. 3. The prediction angle between these two directions.
These three factors are all invariant to the reference frame chosen for expressing the fire control problem.
In order hit the target, the prediction or lead angle must be computed a priori with consideration given to the three physical factors that can cause the projectile to miss the target if it were launched directly along the line of sight:
1. Target motion (the target is moving during the projectile's time of flight). 2. Curvature (the projectile changes its speed and/or curve of its trajectory during
its fight to the target). 3. Jump (there is an initial projectile velocity direction different from that of the
weapon line) [89].
These phenomena, target motion, trajectory curvature and jump must be tracked (filtered and predicted) in order to set the correction to the weapon-aiming line prior to firing the projectile.
1.3 Importance of a Tracking Method for Fire Control
An important part of any tracker in military applications is to improve the probability of hit (Ph) against violently maneuvering aircraft. This task can be accomplished by tracking the target aircraft and then predicting the position of the target in the future when the projectile arrives at
Weapon Station
the target.
Figure 1.1 Fire Control Variables in an Air to Air Operation [89]
Target motion involves the apparent travel of the target during the time of flight of the projectile between the time of firing and the instant of impact with the target. This apparent travel is derived from the integrated effects of target velocity and acceleration during the time of flight (Figure 1.2).
Future target position can be expressed as function of present airplane target range, present velocity integrated over the time of flight and the double integral of target acceleration over the time of flight. Several approaches to the treatment of target acceleration as it influences the fire control problem can be made:
Target acceleration is assumed zero, so that target is Considered to be moving in a straight line at constant speed. Target acceleration is assumed constant, thereby simplifying the integration
10
procedure.
Target Position at Firing (Present Target Position) (Projactile Position After
Time of Flight)
Integrated Velocity ond Acceleration of Target During Time of Flight Giving Target Travel
\ Target Position After
Projectile Time of Flight (Futurs Torget Pozifion)
Line of Sign» to Target at Firing
(Present Line of Sight)
Angular Miss Due to Target Trowel
When Initial Project Velocity is Along
Present Line of Sight
Line of Sight to Torget After Projectile Time of Flight
(Future Line of Sight)
Weapon Station Position at Firing
Weapon Station After Projectile Time of Flight
Figure 1.2 Basic Factors Associated with the Prediction Angle [89]
0 Maneuvers may be anticipated, if the probabilities of various target courses can be ascertained. Obviously, this is the most difficult thing to do [89].
Improving a weapons Ph against violently maneuvering aircraft can be achieved by first identifying the class of target and its maneuvering capabilities, tracking its movements, and then predicting an aim point for a high Ph. Incorporating this type of real-time computer generated information into a weapons fire control system could produce a higher hit probability for air defense weapons and may prove applicable against certain ground targets.
1.4 Importance of a Parameter Identification Technique in Aircraft Tracking Problems
A compromise is made with the application of advanced trackers between improved tracking accuracy and the need for an increased amount of vehicle specific information. In order to effectively use an attitude/translation tracking algorithm, the target vehicle must be identified and appropriate vehicle specific parameters must be applied to the tracking algorithm. It may be unrealistic for an imaging system to be able to correctly and efficiently identify a target - especially at great distances where only a limited number of pixels of image data may be discernable.
11
The observed trajectory should offer a means of estimating the dynamic characteristics of the aircraft. The observed trajectory alone would allow the system to estimate vehicle characteristic parameters to be used in target recognition. Once that the target is identified the appropriate vehicle specific parameters could be obtained from an aircraft properties database. This approach is not unrealistic at all if an observation is made: most of the foe aircraft flying in combat situations have been built by the U.S. or allied countries, therefore their specific parameters are well recorded.
The aircraft characteristic parameters provide two significant benefits. The target class can be identified a priori and accurate values of vehicle specific information be determined. With this information significant improvements in the accuracy of the prediction process in an attitude/translation tracker could be made [5,6]. Perhaps more importantly, vehicle characteristic parameters can aid in identifying whether the vehicle being tracked is friend or foe (IFF). A space of vehicle parameters can be searched for the closest match by a discriminant classifier [55].
1.5 Problem Definition
The classical problem of anti-aircraft gun fire control is the definition of the type of aircraft in the scene and the accurate prediction of the future position of a given target at the time of projectile intercept. The correct gun-pointing angles (or equivalent) can be determined based on this information. Current approaches to the solution of this problem typically employ the use of modern estimation techniques (Kaiman filtering) to estimate target velocity and acceleration on the basis of target position measurements. Once the velocity and acceleration estimates have been obtained, the prediction of the future position can be accomplished by numerical integration or other techniques.
The tracking problem is a state estimation problem, where the state vector X(t) contains target position, velocity, and sometimes acceleration as the state variables at time t . In some situations, key parameters characterizing other important target properties are also included as state variables (i.e., target orientation angles). The state of a target is assumed to evolve in time according to the equation:
X - a(X(t),t) + w(*) 1-1
As seen in Equation 1.1, a non-linear model represents the target behavior, this is due to the fact that the target dynamics are a non-linear functions of target state variables. The corresponding discrete measurement vector (obtained by remote sensors) is given by:
Z(k) - h(X(k),k) + v(k) 1.2
where w(0 is a process noise vector representing modeling errors and v(k) is the measurement noise vector that accounts for sensing errors. The system process noise and measurement noise are assumed to be mean white noise processes with w(f)~(0,<?(0) and v(k) ~(0,R(k)) . Q(t) is selected to compensate for modeling
errors (discrepancies between the model and the actual processes). The statistics of the measurement noise R (k) should also be selected to represent all possible excursions from the ideal observation such as measurement biases, false measurements, etc. [21]
12
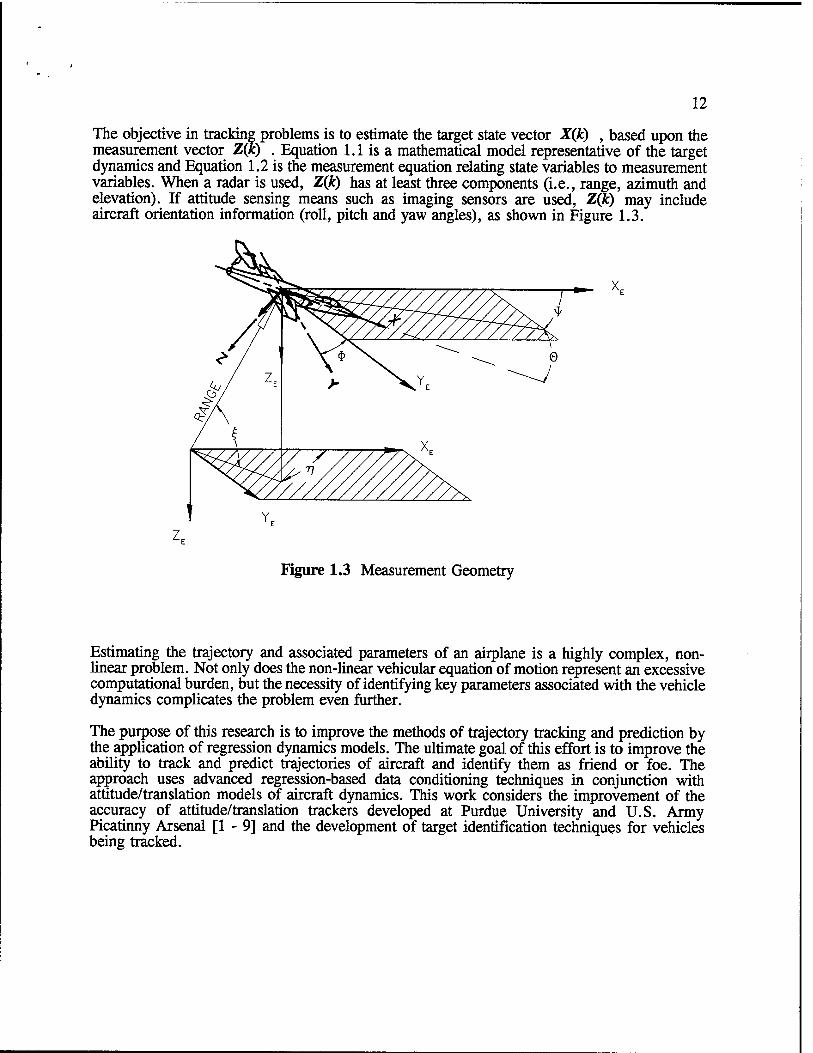
The objective in tracking problems is to estimate the target state vector X(k) , based upon the measurement vector Z()c) . Equation 1.1 is a mathematical model representative of the target dynamics and Equation 1.2 is the measurement equation relating state variables to measurement variables. When a radar is used, Z(k) has at least three components (i.e., range, azimuth and elevation). If attitude sensing means such as imaging sensors are used, Z(fc) may include aircraft orientation information (roll, pitch and yaw angles), as shown in Figure 1.3.
Figure 1.3 Measurement Geometry
Estimating the trajectory and associated parameters of an airplane is a highly complex, non- linear problem. Not only does the non-linear vehicular equation of motion represent an excessive computational burden, but the necessity of identifying key parameters associated with the vehicle dynamics complicates the problem even further.
The purpose of this research is to improve the methods of trajectory tracking and prediction by the application of regression dynamics models. The ultimate goal of this effort is to improve the ability to track and predict trajectories of aircraft and identify them as friend or foe. The approach uses advanced regression-based data conditioning techniques in conjunction with attitude/translation models of aircraft dynamics. This work considers the improvement of the accuracy of attitude/translation trackers developed at Purdue University and U.S. Army Picatinny Arsenal [1 - 9] and the development of target identification techniques for vehicles being tracked.
13
2. Objectives
This work represents an extension of the advanced trackers that were developed at Purdue University and the U.S. Army Picatinny Arsenal [1 - 9]. These trackers used both translation and attitude data to improve the accuracy of conventional trackers. Translation measurements from radar data (range, azimuth and elevation) and their associated rates are used in conjunction with aircraft attitude data (roll, pitch and yaw angles) to improve tracking accuracy by providing a more complete dynamic model of aircraft performance. This dynamic model can yield increases in tracking and prediction accuracy by providing useful estimates of target acceleration.
The novel extension in this work deals with the development of a new tracking algorithm based on a radius of curvature estimator, use of artificial measurements during the prediction interval and development of aircraft identification techniques for vehicles being tracked based on remote trajectory measurements.
This work examines the use of regression models of translation and attitude measurements that are constructed in real time and used for estimation of tracking measurement data and prediction of measurement data during the lead time interval. The rationale for the use of regression models of measurement data is based on the concept of underlying dynamics for each measurable parameter. These underlying dynamics may not be well understood from first principles, but they can be adequately represented by regression models [31 - 35]. These regression models can be used for the creation of state models useful for Kaiman filter estimation of the measurement data and prediction of measurement data during the lead interval.
The motivation for regression modeling is to attempt to improve the position prediction by applying predicted measurement data as input to the translation/attitude model of aircraft performance. This approach allows the underlying dynamics of the measurement data to enhance the effectiveness of the dynamic model of the aircraft.
The goal of this effort is to improve the ability to track and predict the position of a target aircraft. This problem is complicated by the tendency of aircraft to violently maneuver as an evasive tactic. The violent maneuvering has the effect of making the future position of the vehicle less predictable. The predicted position is necessary in order to compute an appropriate lead angle.
The presented work can be summarized as follows:
1. Implementation of a new tracking algorithm based on a radius of curvature estimator. This approach has a significant advantage over the existing attitude/translation tracker, because, both position and attitude are used to estimate vehicle dynamics without requiring vehicle specific inertial data.
2. Use of regression-based predictions of the trajectory measurement data as input to the radius of curvature dynamic model for target position prediction improvement.
3. Development of a target type identification technique, that uses real-time observations of aircraft trajectory performance, to estimate aircraft characteristic parameters for target classification. This technique offers both improved accuracy in tracking when aircraft parameter specific filters are used and a method to "identify friend or foe" (IFF) for potential targets.
14
4. Performance comparisons of the new tracking methods to the attitude/translation tracking techniques [5], using actual flight data (translation and attitude) from the Navy's Tactical Aircrew Combat Training System (TACTS).
The study was conducted using actual position and attitude trajectory data for F-14A, A6 and AV-8B aircraft acquired during training flights. The data was supplied through the Navy's TACTS at Cherry Point Marine Corps Air Station [69 - 71]. All positional data was collected by ground-based radar and attitude data was collected using on-board gyroscopic instruments. A unique aspect of this study is the use of actual trajectory data. Many prior comparative studies of filter performance have been made using purely simulated data or attitude data estimated from translational data.
15
3. Tracking and Prediction Technique Using Regression-Based Artificial Measurements
This section details the different phases studied during the implementation of the prediction method based on artificial measurements: an integrated tracking and prediction technique, radius of curvature state model, continuous-discrete extended Kaiman filter implementation, and regression-based models of measurement dynamics.
3.1 Integrated Tracking and Prediction Technique
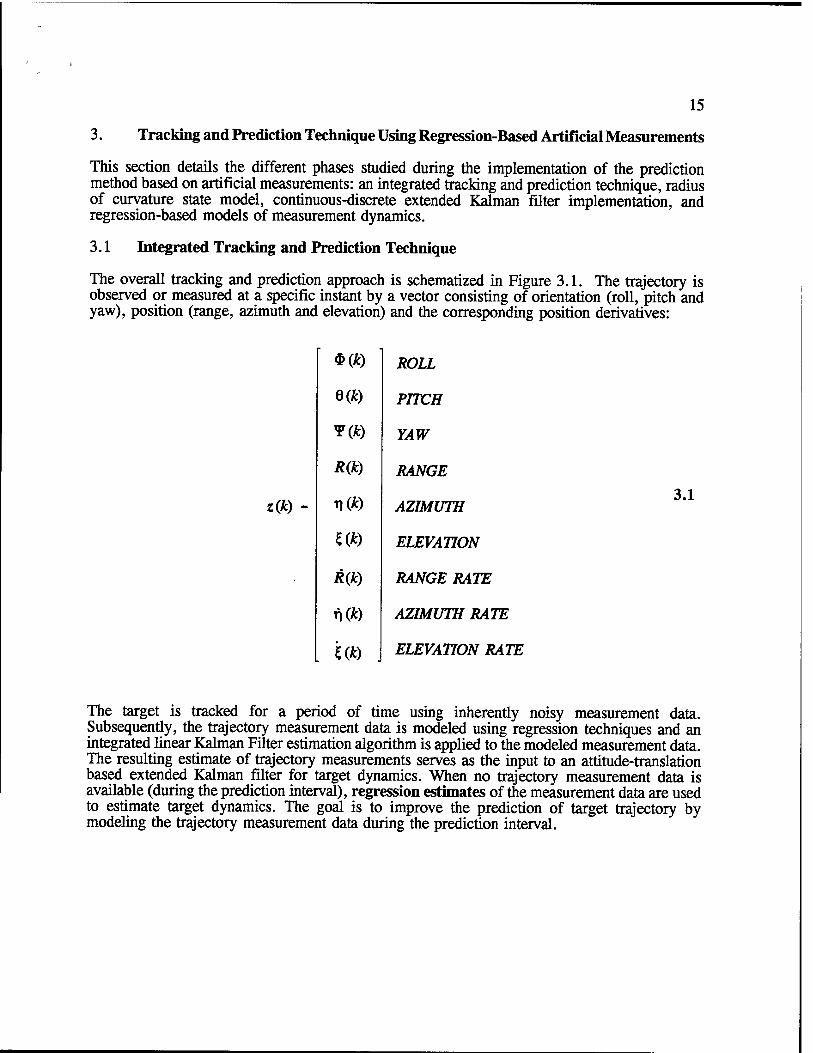
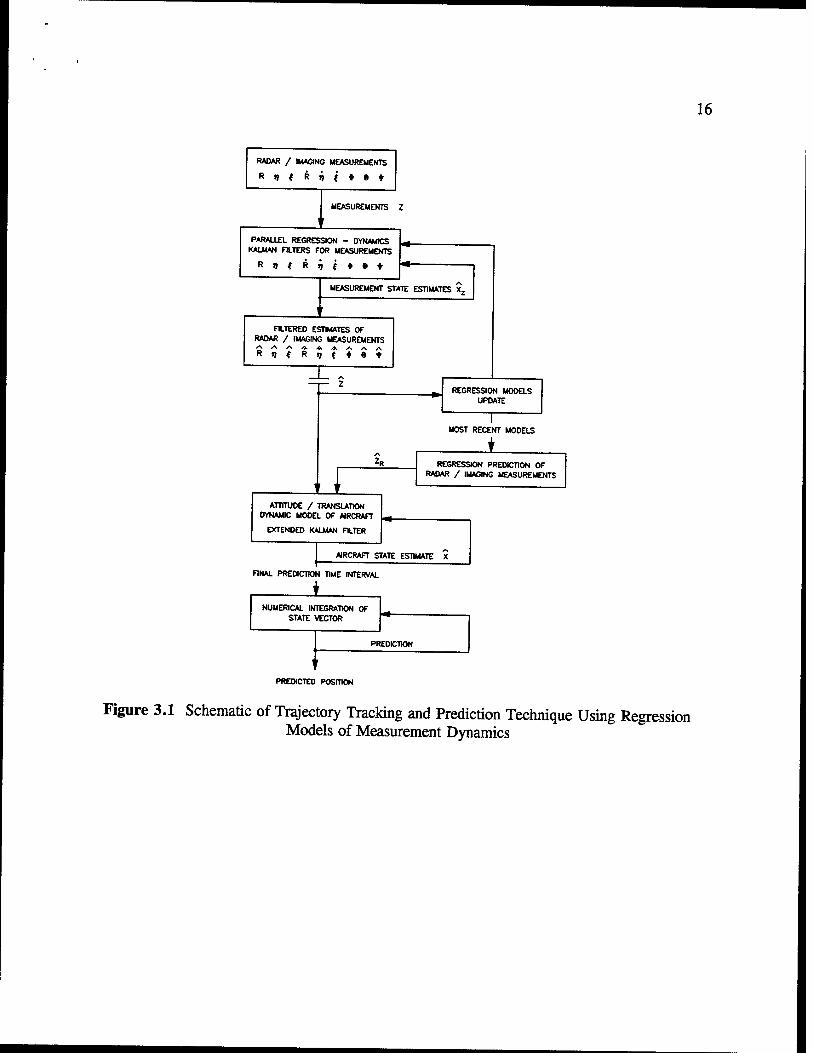
The overall tracking and prediction approach is schematized in Figure 3.1. The trajectory is observed or measured at a specific instant by a vector consisting of orientation (roll, pitch and yaw), position (range, azimuth and elevation) and the corresponding position derivatives:
z(k)
*(*) ROLL
e(*) PITCH
T(k) YAW
R(k) RANGE
r\(k) AZIMUTH
S(k) ELEVATION
R(k) RANGE RATE
*<*) AZIMUTH RATE
l(k) . ELEVATION RATE
3.1
The target is tracked for a period of time using inherently noisy measurement data. Subsequently, the trajectory measurement data is modeled using regression techniques and an integrated linear Kaiman Filter estimation algorithm is applied to the modeled measurement data. The resulting estimate of trajectory measurements serves as the input to an attitude-translation based extended Kaiman filter for target dynamics. When no trajectory measurement data is available (during the prediction interval), regression estimates of the measurement data are used to estimate target dynamics. The goal is to improve the prediction of target trajectory by modeling the trajectory measurement data during the prediction interval.
16
RADAR / IMAGING MEASUREMENTS
M M i f » • *
Z MEASUREMENTS
PARALLEL REGRESSION - DYNAMICS
KALMAN FILTERS FOR MEASUREMENTS
ATE ESTIMATES Xz MEASUREMENT ST
'
FILTERED ESTMATES OF RADAR / IMAGING MEASUREMENTS
M < R ? ( ♦ M
— 2 REGRESSION MODELS
UPDATE
1 MOST RECENT MODELS
ZR REGRESSION PREDICTION OF
RADAR / IMAGING MEASUREMENTS
' r ' ' ATTITUDE / TRANSLATION
DYNAMIC MODEL OF AIRCRAFT
EXTENOED KALMAN FILTER
ESTI AIRCRAFT SI CATE MATE X
FINAL PREDICTION TIME INTERVAL
NUMERICAL INTEGRATION OF STATE VECTOR
PREDICTION
PREDICTED POSITION
Figure 3.1 Schematic of Trajectory Tracking and Prediction Technique Using Regression Models of Measurement Dynamics
17
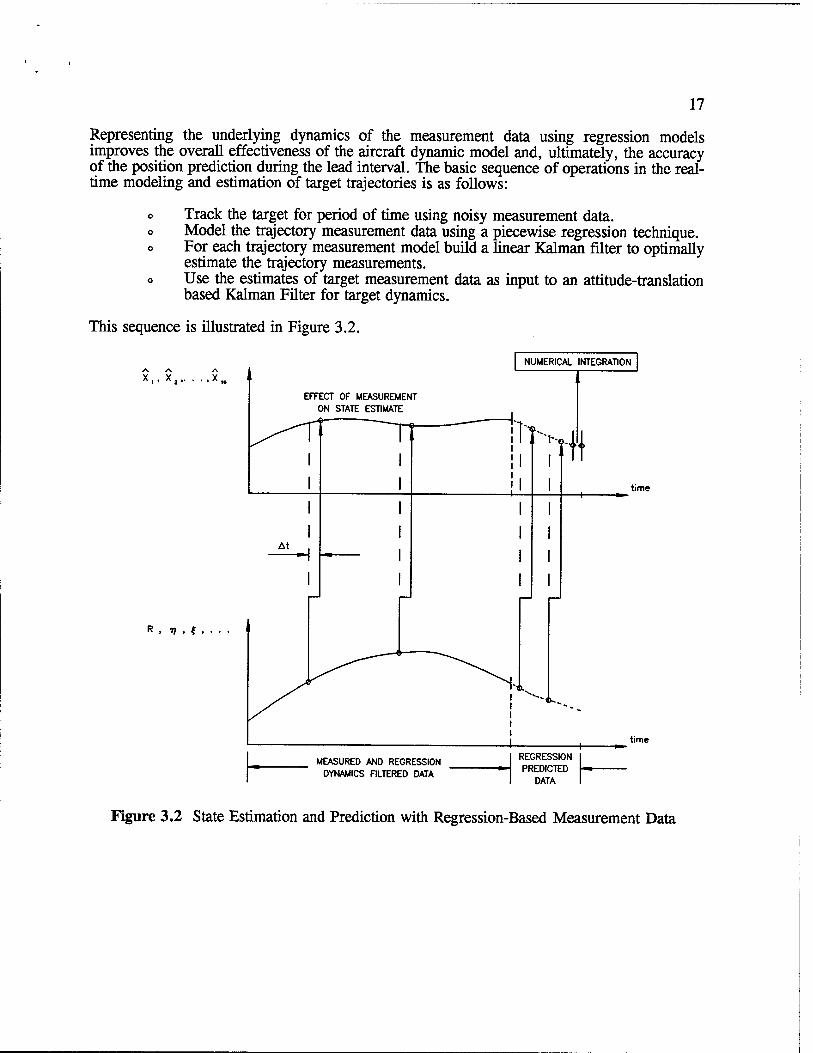
Representing the underlying dynamics of the measurement data using regression models improves the overall effectiveness of the aircraft dynamic model and, ultimately, the accuracy of the position prediction during the lead interval. The basic sequence of operations in the real- time modeling and estimation of target trajectories is as follows:
Track the target for period of time using noisy measurement data. Model the trajectory measurement data using a piecewise regression technique. For each trajectory measurement model build a linear Kaiman filter to optimally estimate the trajectory measurements. Use the estimates of target measurement data as input to an attitude-translation based Kaiman Filter for target dynamics.
This sequence is illustrated in Figure 3.2.
x,, x2. .x, NUMERICAL INTEGRATION
EFFECT OF MEASUREMENT
ON STATE ESTIMATE
R . v . f
time
time
MEASURED AND REGRESSION
DYNAMICS FILTERED DATA
REGRESSION
PREDICTED DATA
Figure 3.2 State Estimation and Prediction with Regression-Based Measurement Data
18
This method uses nine Kaiman filters running in parallel to estimate the dynamics of the measurement data. These filtered estimates of the measurement data are used as input to the Kaiman filter for aircraft dynamics (utilizing the attitude-translational model). Ultimately, when measurement data is not available (during the lead prediction interval), the algorithm will use regression estimates of measurement data as input to the extended Kaiman filter to estimate target dynamics.
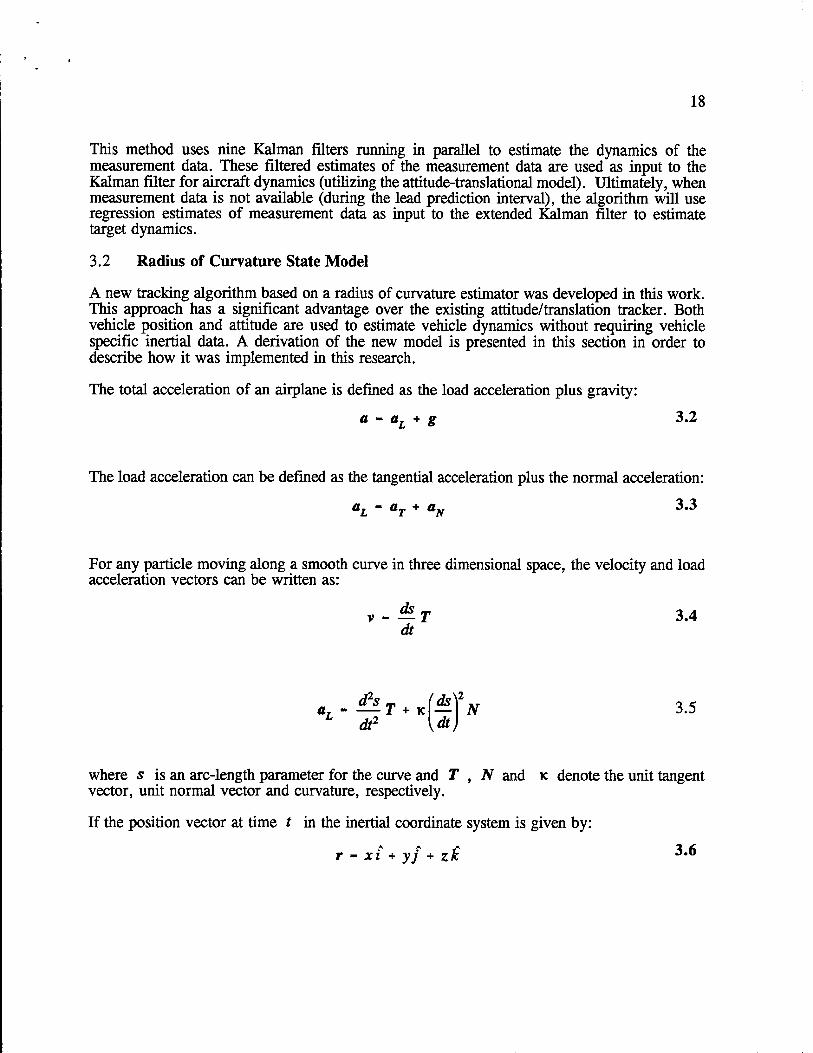
3.2 Radius of Curvature State Model
A new tracking algorithm based on a radius of curvature estimator was developed in this work. This approach has a significant advantage over the existing attitude/translation tracker. Both vehicle position and attitude are used to estimate vehicle dynamics without requiring vehicle specific inertial data. A derivation of the new model is presented in this section in order to describe how it was implemented in this research.
The total acceleration of an airplane is defined as the load acceleration plus gravity:
a - aL + g 3.2
The load acceleration can be defined as the tangential acceleration plus the normal acceleration:
aL~ aT+ aN 3'3
For any particle moving along a smooth curve in three dimensional space, the velocity and load acceleration vectors can be written as:
v - — T 3.4 dt
3.5
where s is an arc-length parameter for the curve and T , N and K denote the unit tangent vector, unit normal vector and curvature, respectively.
If the position vector at time t in the inertial coordinate system is given by:
r - xi + yf + zJc 3*°
19
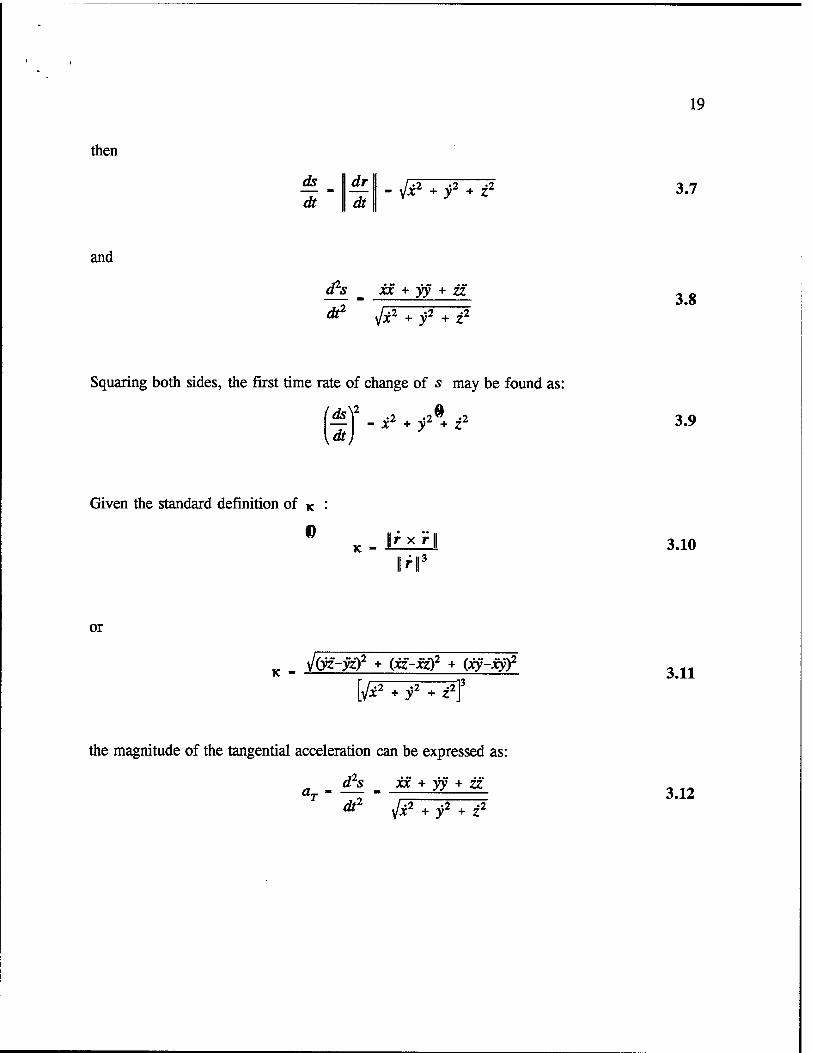
then
ds II dt II Hy Ty To It "\~Jt\ ~VX +y Z at at
3.7
and
d2s ix + yy + zz
dt2 " { x2 + y2 + z2 3.8
Squaring both sides, the first time rate of change of s may be found as:
•1 •2*' -5 x + y + z (ds\2 .2 ^ .2e .2
\dt. 3.9
Given the standard definition of K :
D l|rxr||
\r\* 3.10
or
_ J(yz~yQ2 + (xz-xz)2 + (xy-xyf
[jx2 + f + z2f 3.11
the magnitude of the tangential acceleration can be expressed as:
d2s _ xx + yy + zz
dt2 sjx2 +f + z2 3.12
20
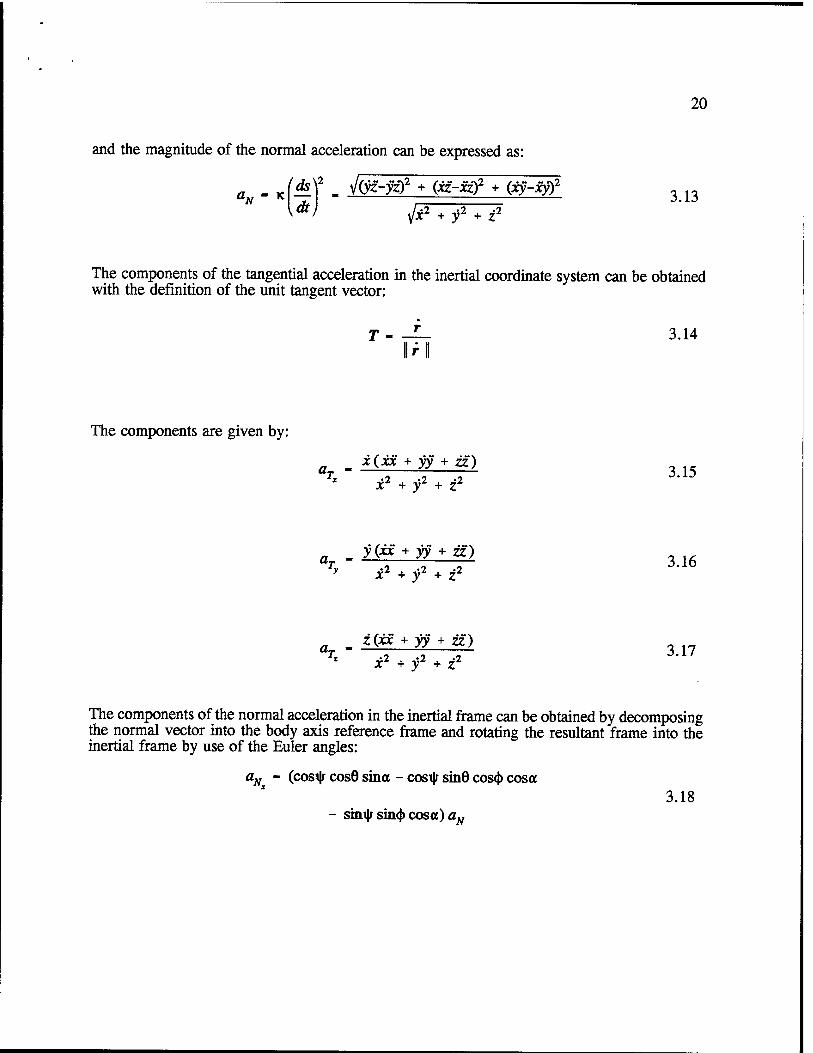
and the magnitude of the normal acceleration can be expressed as:
aN- K
fds¥ . V(yz-yz)2 + (xz-xzf + (xy-xy? 3.13 y + z
The components of the tangential acceleration in the inertial coordinate system can be obtained with the definition of the unit tangent vector:
T - — 3.14 II r |
The components are given by:
. x(xx + yy + zz) ^ •2 -2 '1 x + yL + z
a _ y (xx + yy + zz) ^v -2 -2 •"! y xz + y + z
3.16
a - ^ (^ + yy + zz) ^z -2 -2 -2 jr + yz + z
3.17
The components of the normal acceleration in the inertial frame can be obtained by decomposing the normal vector into the body axis reference frame and rotating the resultant frame into the inertial frame by use of the Euler angles:
aN - (cosi|; cos8 sina - cosijr sinö cos(J> cosa 3.18
- sini|/ sinxf> cosa) aN
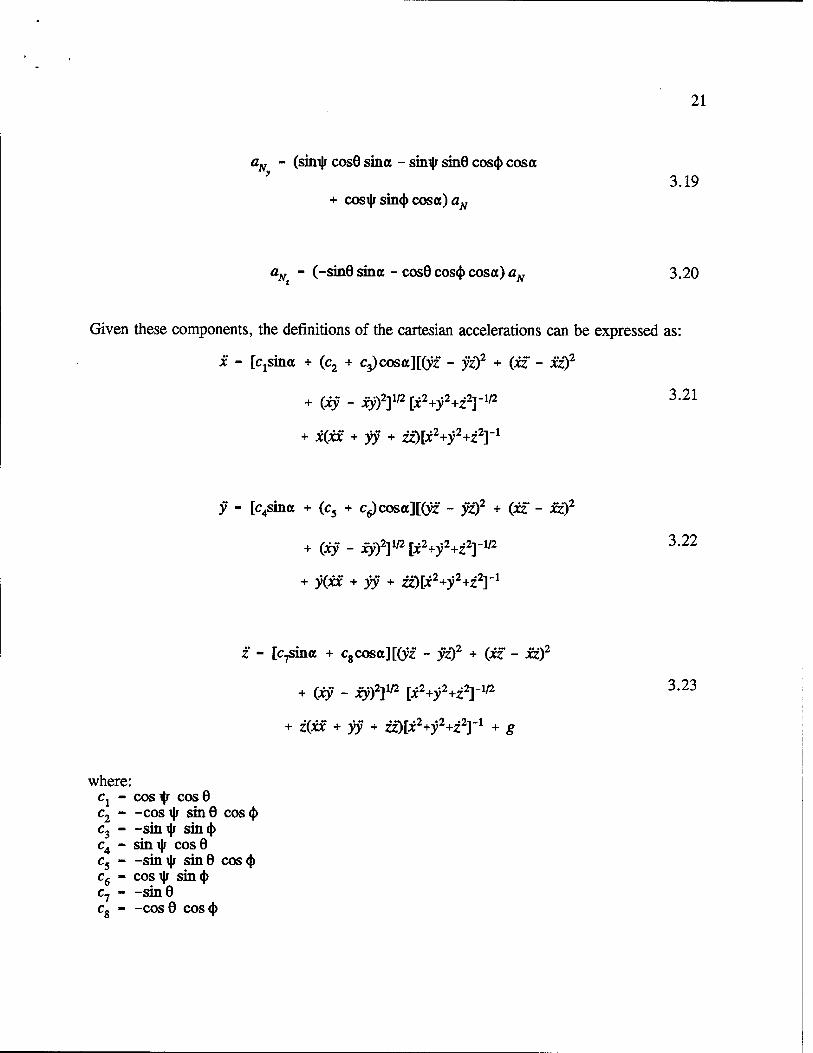
21
aN - (sini|j cos0 since - sinilr sinö cos(j) cosa "y
+ cosi|r sin<f> cosa) aN
3.19
a^ - (-sinö sina - cos8 cos<J) cosa) aN 3.20
Given these components, the definitions of the cartesian accelerations can be expressed as:
x - [Cjsina + (c2 + c^)cosa][(yz - yz)2 + (xz - xz)2
+ (# - m2]112 ix2+f+z2r112 3-21
+ i(xx + yy + zz}[x2+y2+i2Yx
y - [c4sina + (c5 + Cg)cosa][(yf - yz)2 + (if - xz)2
+ (xy - xy)2]1/2 [i2^2^2]"1/2 3-22
+ y(xx + yy + i£)\x2+y2+z2Tl
z - [Cjsina + c8cosa][(y£ - yz)2 + (xz - xz)2
+ (# - xy)2]1/2 [i2+;y2+z2r1/2 3'23
+ z(xf + yy + zz)[i2+y2+z2]"1 + g
where: c1 - costy cos6 c2 - -costy sinö coso) c3 —sini|r sin(|) c4 - sini|j coso c5 - -sini|r sin0 coscj) c6 - cosijr sin<|) c7 —sin 6 c„ —cos0 cos<J)
22
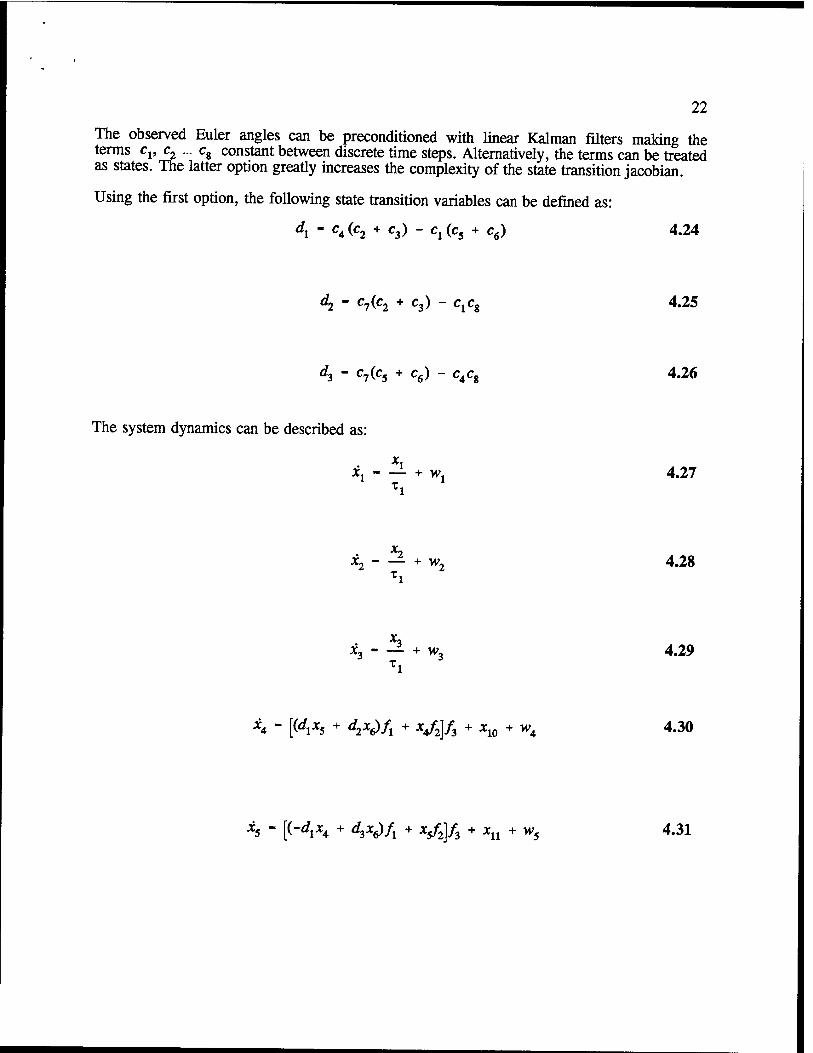
The observed Euler angles can be preconditioned with linear Kaiman filters making the terms cvc~ ... c8 constant between discrete time steps. Alternatively, the terms can be treated as states. The latter option greatly increases the complexity of the state transition jacobian.
Using the first option, the following state transition variables can be defined as:
dl ~ C4(C2 + C3) " Cl(C5 + cö) 4'24
d2 - c7(c2 + c3) - CjCg 4.25
d3 - c7(c5 + c6) - c4cg 4.26
The system dynamics can be described as:
xi xx + >Vj 4.27 Ti
X2 x2 + w2 4.28 Ti
*3 x. - -i + w, 4.29 Ti
x4 - [(dlXs + d2x£fx + x/2]/3 + xw + w4 4.30
x5 - [(-<*,*, + ^/j + X$f2]f3 + JCU + w5 4.31
23
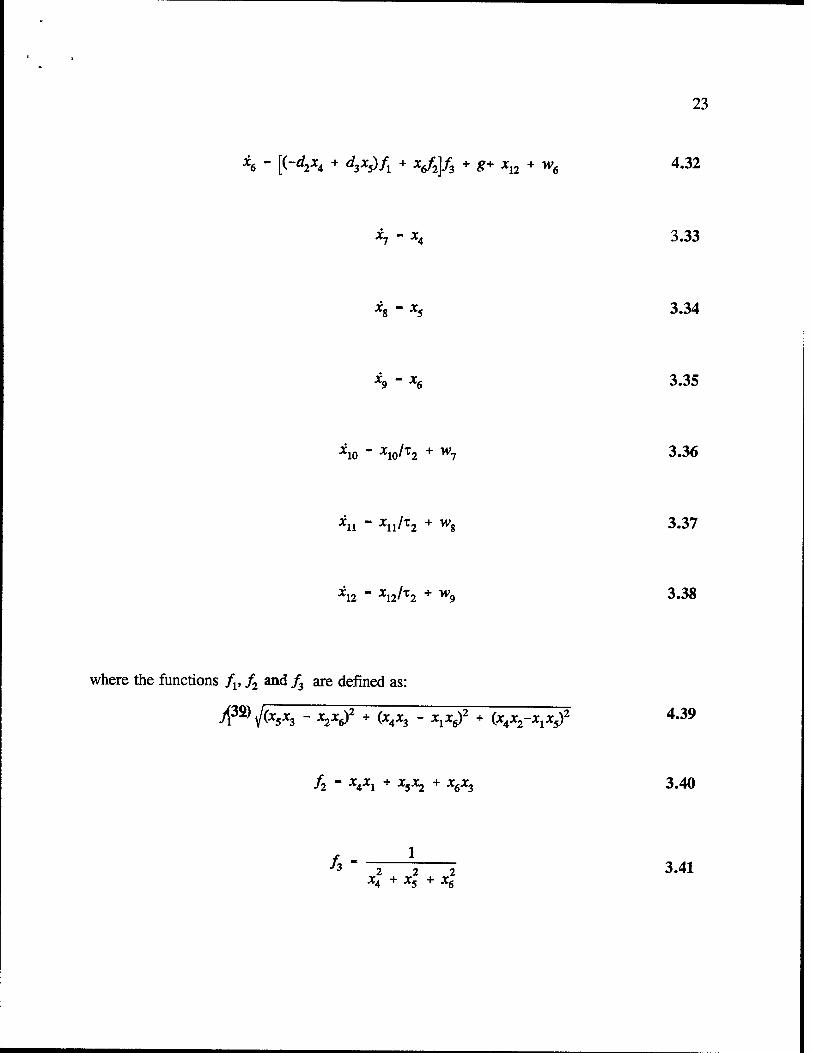
*6 - [(-4**4 + <W/i + V2]/3 + #+ *n + w6 4.32
*7 - x4 3.33
Jc8 - x5 3.34
*9 - *6 3.35
*io " xw^2 + wi 3.36
*n " *n/T2 + w8 3.37
*12 " X\2lX2 + W9 3.38
where the functions fv f2 and f3 are defined as:
J^fas** " *2*6)2 + (*4*3 " W + ^^^1^ 4*39
A " ¥l + X5*2 + X6X3 3.40
/3 ~2 2 I 3.41 x4 + x5 + x6
24
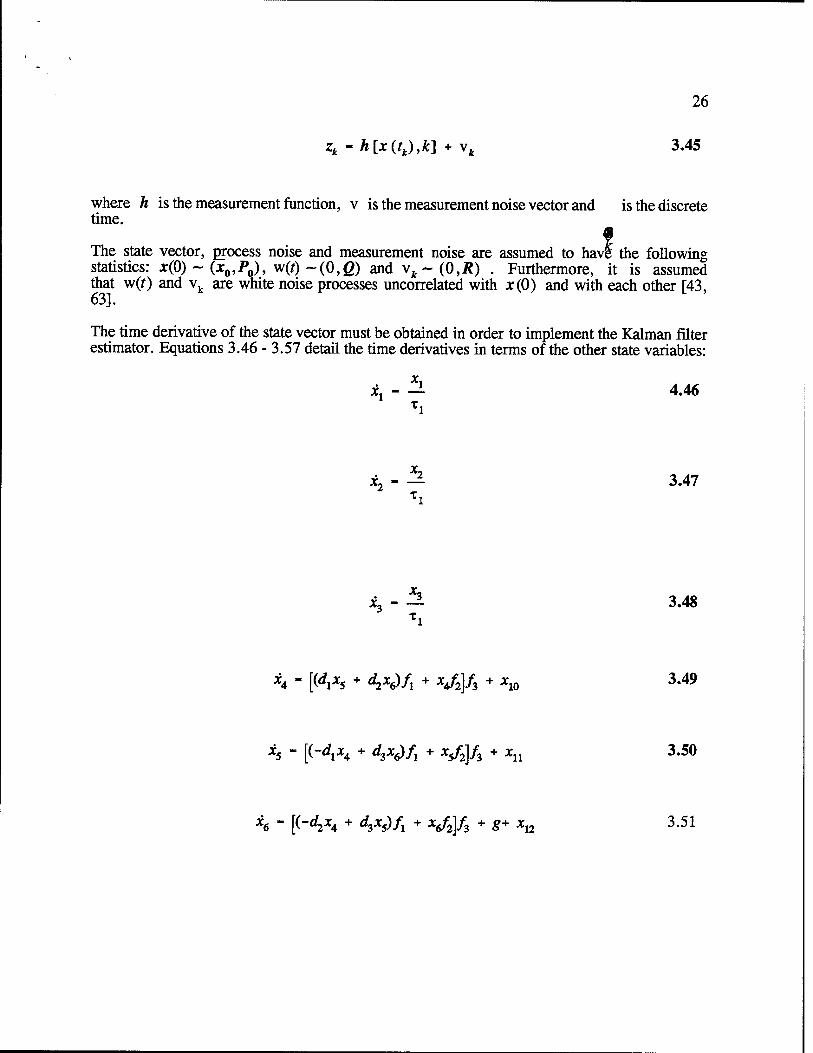
^ ierkJLS modeled as a Markov process. The terms wv w2 ... w9 represent Gaussian noise added The state variables x10, xu and xn are process noise added to compensate for unmodeled lateral accelerations and gusts. (42)
3.3 Implementation of the Continuous-Discrete Extended Kaiman Filter
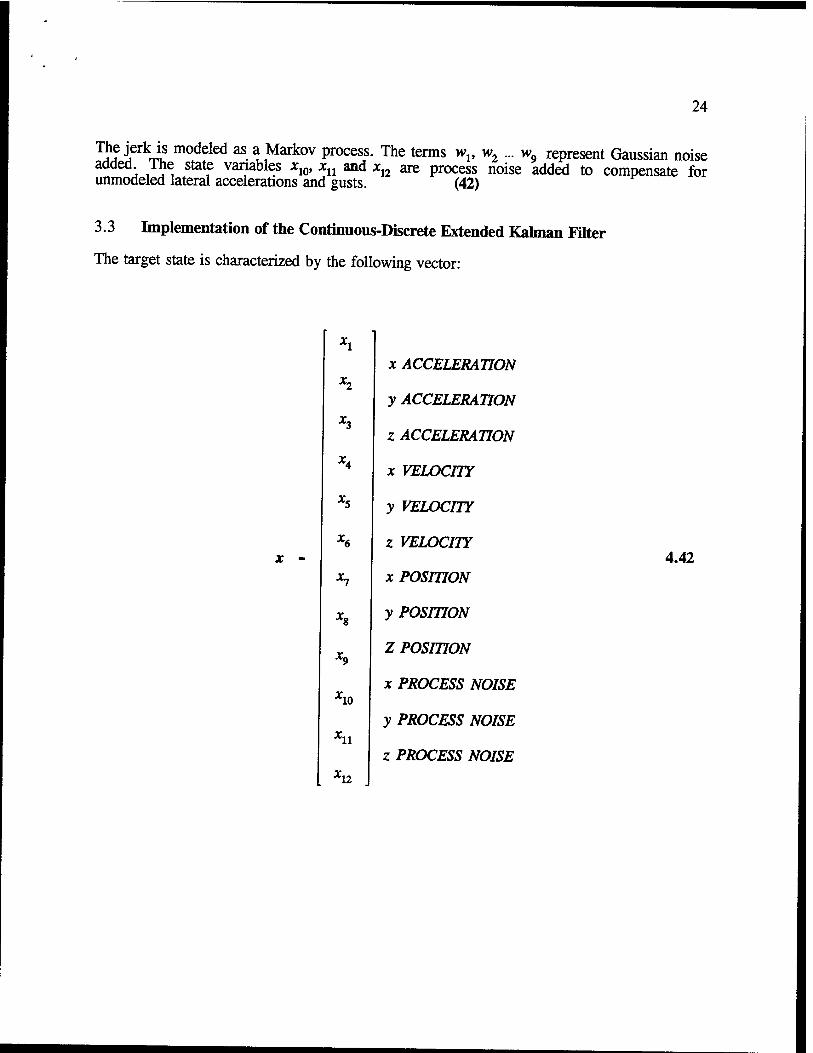
The target state is characterized by the following vector:
x -
"IO
"11
"12
x ACCELERATION
y ACCELERATION
z ACCELERATION
x VELOCITY
y VELOCITY
z VELOCITY
x POSITION
y POSITION
Z POSITION
x PROCESS NOISE
y PROCESS NOISE
z PROCESS NOISE
4.42
25
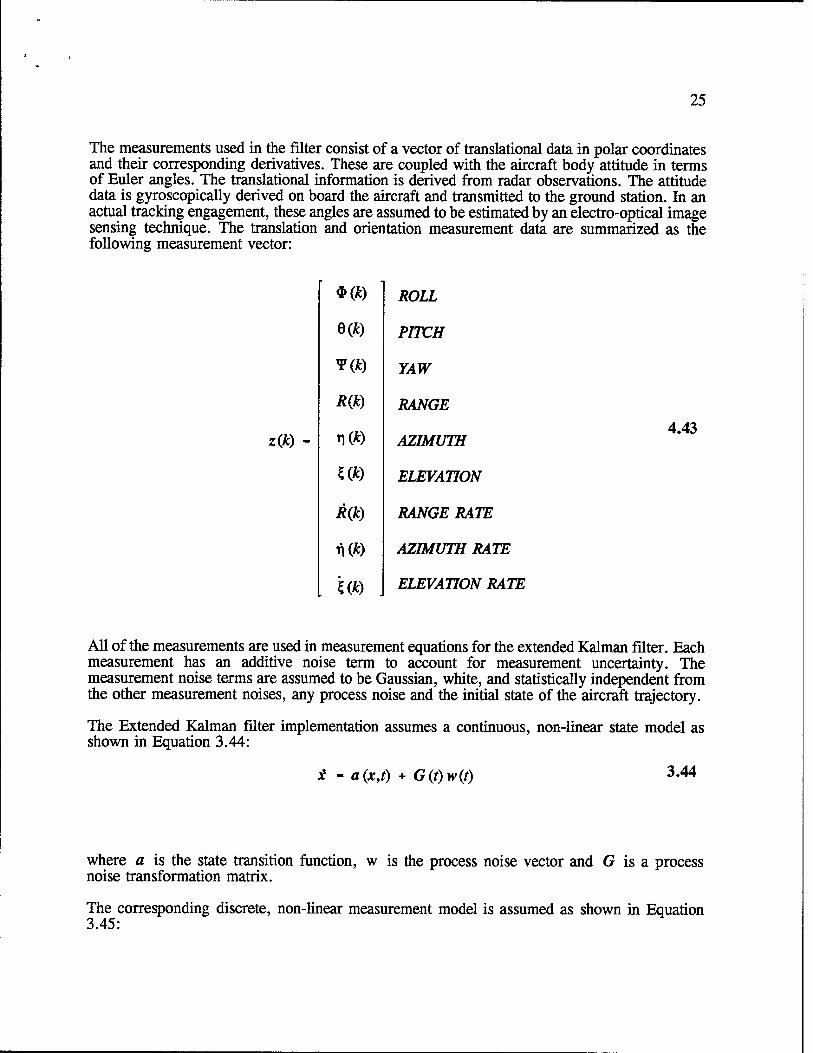
The measurements used in the filter consist of a vector of translation^ data in polar coordinates and their corresponding derivatives. These are coupled with the aircraft body attitude in terms of Euler angles. The translational information is derived from radar observations. The attitude data is gyroscopically derived on board the aircraft and transmitted to the ground station. In an actual tracking engagement, these angles are assumed to be estimated by an electro-optical image sensing technique. The translation and orientation measurement data are summarized as the following measurement vector:
z(k)
*<B ROLL
eot) PITCH
Y(fc) YAW
R(k) RANGE
r\(k) AZIMUTH
m ELEVATION
R(k) RANGE RATE
Xi(k) AZIMUTH RATE
Uk) . ELEVATION RATE
4.43
All of the measurements are used in measurement equations for the extended Kaiman filter. Each measurement has an additive noise term to account for measurement uncertainty. The measurement noise terms are assumed to be Gaussian, white, and statistically independent from the other measurement noises, any process noise and the initial state of the aircraft trajectory.
The Extended Kaiman filter implementation assumes a continuous, non-linear state model as shown in Equation 3.44:
£ - a(x,t) + G(t)w(t) 3.44
where a is the state transition function, w is the process noise vector and G is a process noise transformation matrix.
The corresponding discrete, non-linear measurement model is assumed as shown in Equation 3.45:
26
zk - h[x(L),k] + \k 3.45
where h is the measurement function, v is the measurement noise vector and is the discrete time.
The state vector, process noise and measurement noise are assumed to have the following statistics: x(0) - (x0,P0), w(f) ~(0,ß) and vt~(0,U) . Furthermore, it is assumed that w(0 and vk are white noise processes uncorrelated with x(0) and with each other [43, 63].
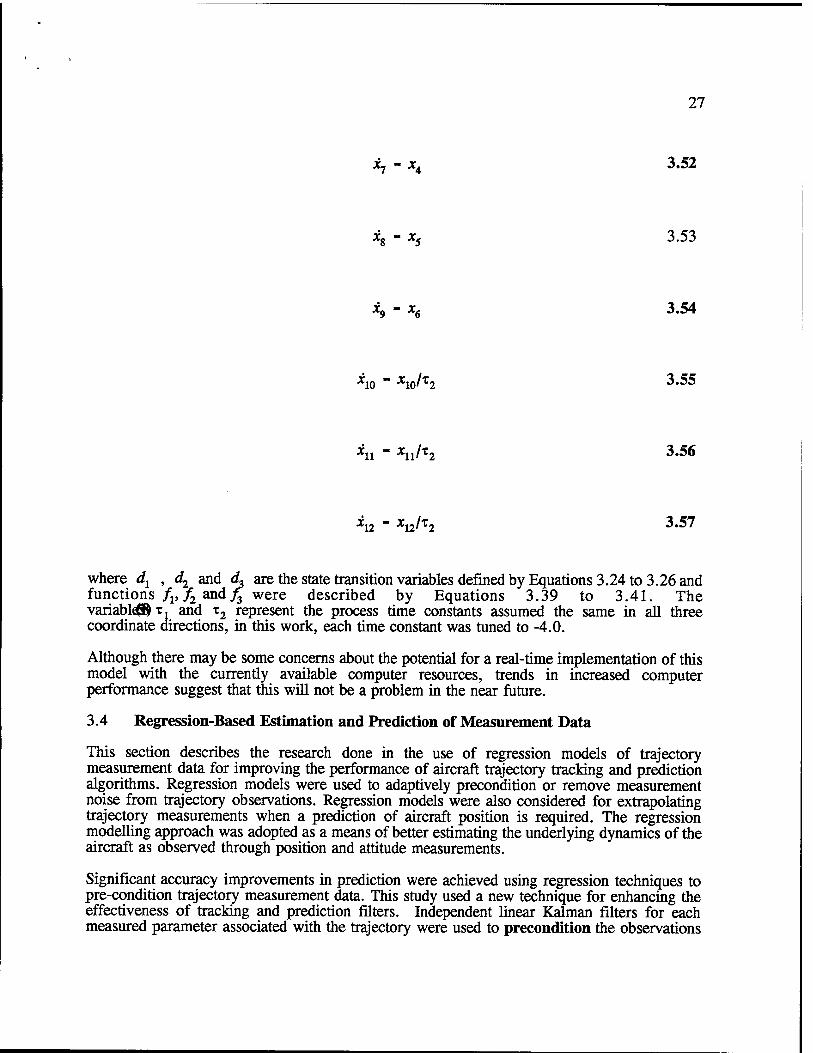
The time derivative of the state vector must be obtained in order to implement the Kaiman filter estimator. Equations 3.46 - 3.57 detail the time derivatives in terms of the other state variables:
*i- — 4.46 Ti
x, - -2- 3.47
x, x, - — 3.48
x4 - [{dxxs + d2x^fx + vy/3 + x10 3.49
x5 - [(-^x4 + dzx^fx + vy/3 + xu 3.50
*6 - [(~d2X4 + rf3*5>/l + Vy/3 + #+ *12 3-51
27
Xj - xA 3.52
Xa mm X* J.JJ
Xn Ä Xr <3«3iT
*io " *10'X2 3.55
*n ™ ^ii' ^2 3,56
A»A ™ \ilo J»3 /
where «^ , rf2 and ^ are the state transition variables defined by Equations 3.24 to 3.26 and functions /j, ^ and)J were described by Equations 3.39 to 3.41. The variable® Tj and x2 represent the process time constants assumed the same in all three coordinate directions, in this work, each time constant was tuned to -4.0.
Although there may be some concerns about the potential for a real-time implementation of this model with the currently available computer resources, trends in increased computer performance suggest that this will not be a problem in the near future.
3.4 Regression-Based Estimation and Prediction of Measurement Data
This section describes the research done in the use of regression models of trajectory measurement data for improving the performance of aircraft trajectory tracking and prediction algorithms. Regression models were used to adaptively precondition or remove measurement noise from trajectory observations. Regression models were also considered for extrapolating trajectory measurements when a prediction of aircraft position is required. The regression modelling approach was adopted as a means of better estimating the underlying dynamics of the aircraft as observed through position and attitude measurements.
Significant accuracy improvements in prediction were achieved using regression techniques to pre-condition trajectory measurement data. This study used a new technique for enhancing the effectiveness of tracking and prediction filters. Independent linear Kaiman filters for each measured parameter associated with the trajectory were used to precondition the observations
28
prior to use in the tracking and prediction filter. Independent parameters such as range, azimuth and elevation as well as roll, pitch and yaw are preconditioned in order to improve the resultant state estimates. The basic concept involves the creation of a regression model (specifically, an nth order power series in time) of the parameter signature over a brief interval. The resulting regression model is differentiated n times. The resulting differential equation is converted into a state model and used to implement a linear Kaiman filter for that measurement [31 - 35]. A derivation of the method for converting a power series into a state model is provided in Appendix C.
The regression model is updated for each time step in the discrete measurement process. Statistics for the process noise are extracted from the model derived at each time step. Measurement noise statistics are found by conventional techniques. This approach makes the usual assumptions regarding the statistics of the states and disturbances. It should be noted that the state of the measurement that results from this modeling is not identical to the vector consisting of the measurement and its relevant time derivatives. However, a linear transformation can be performed to convert this state into the units of the measurement. This transformation is also extracted from the regression model [31, 32, 33].
This method is intended to remove noise disturbances from a measurement that has significant dynamics. It has been shown to be effective in improving the quality of measurement signatures in a variety of manufacturing processes [34, 35]. The method uses an assumption that a time- varying measurement has dynamics that are describable and applicable to a linear Kaiman filter. These dynamics may not be understood from first principles; however, they may be described in a terms of a regression model. The regression model derives useful information from the measurement process and helps in estimating the actual measurement.
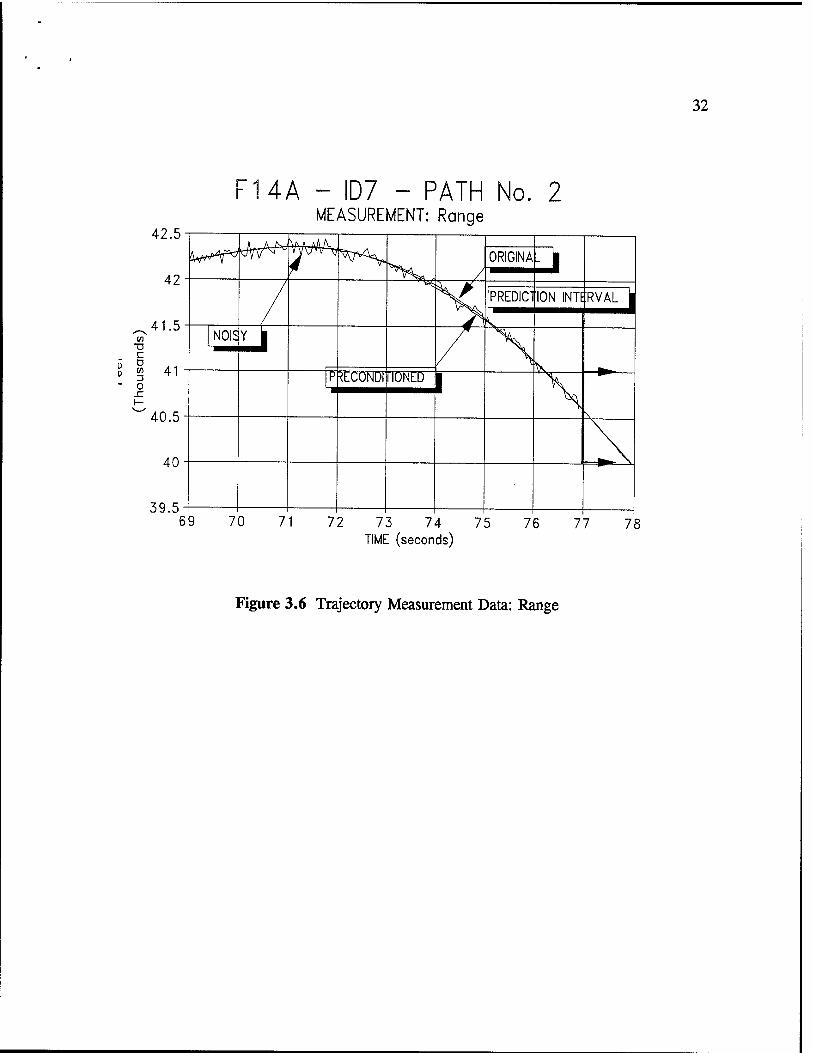
This approach is not simply a low-pass filtering of the measurement. The regression model for the measurement is selected based on the statistical significance of the terms in the power series. If the measurement process has high-order dynamics, corresponding terms in the regression model will be significant in describing the time signatures (as evaluated by standard t-tests and F-tests). In practice, short intervals of aircraft trajectory measurements such as range can be effectively modeled by a third-order power series. This is reasonable since the measurement is likely to be describable in terms of velocity, acceleration and jerk.
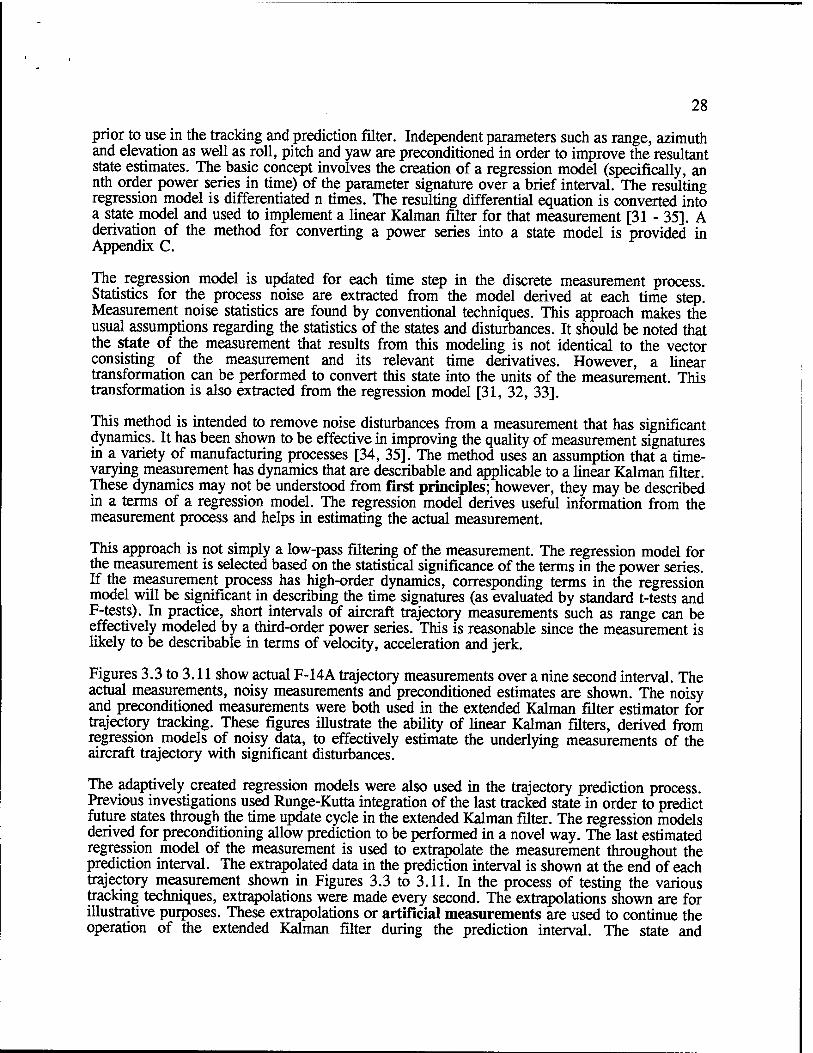
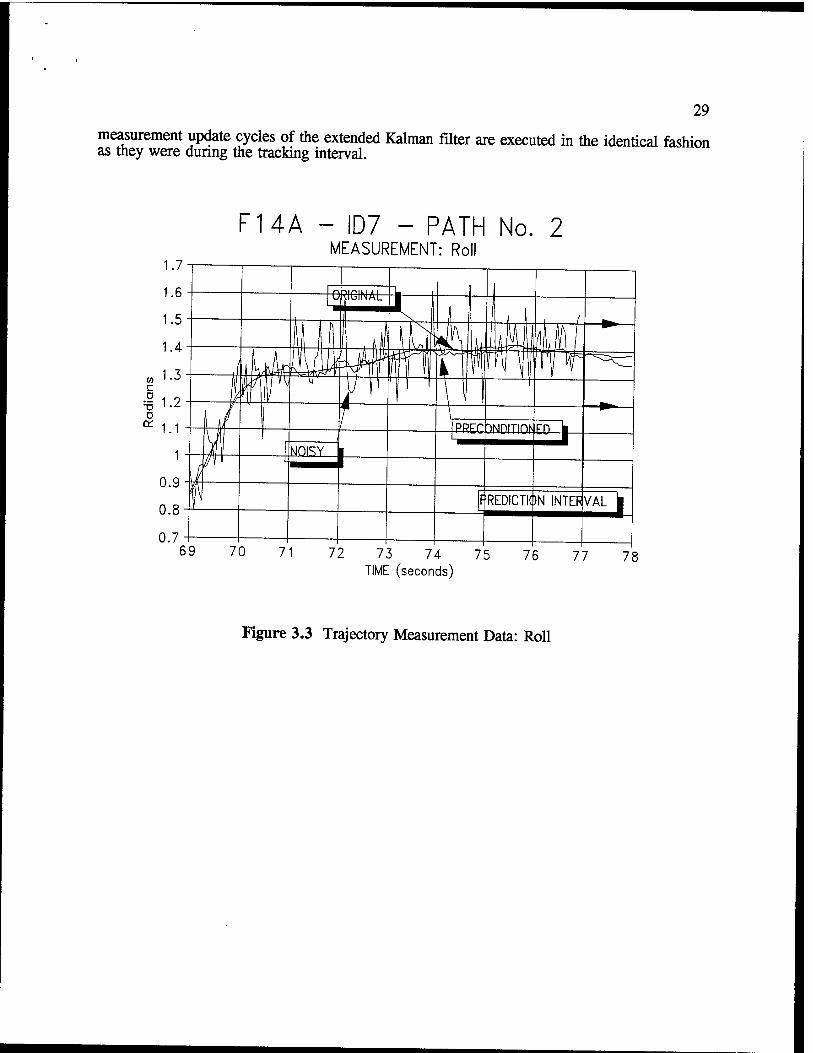
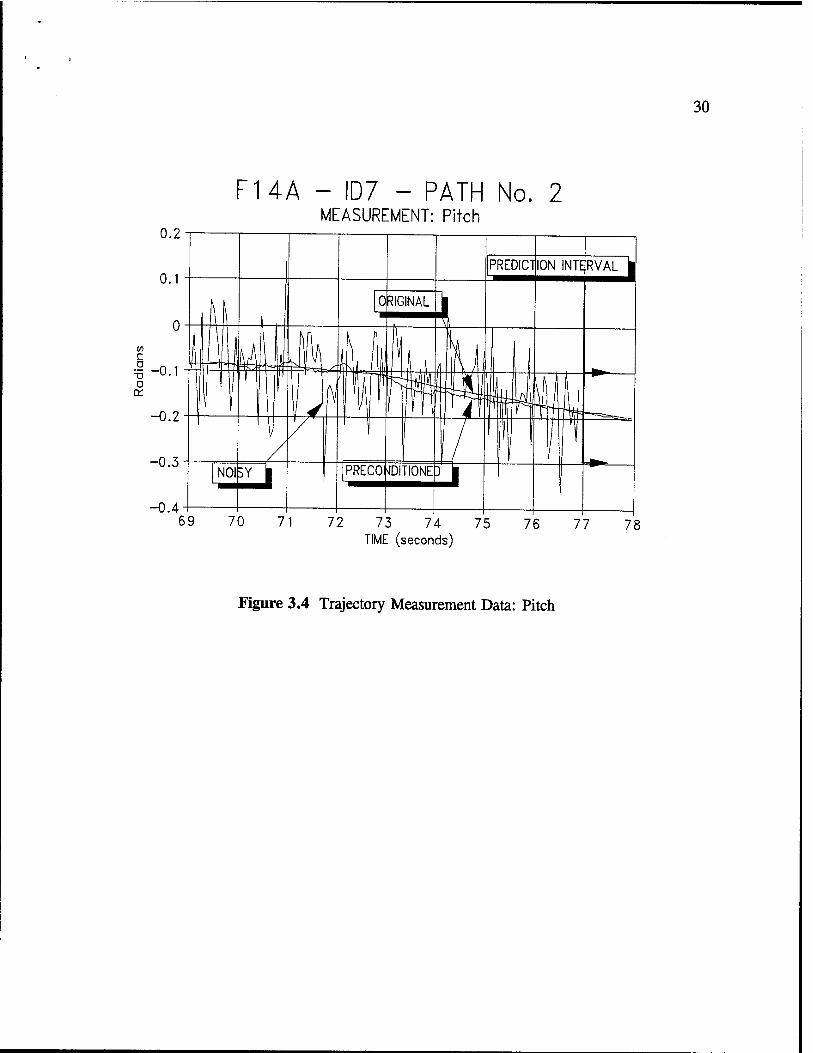
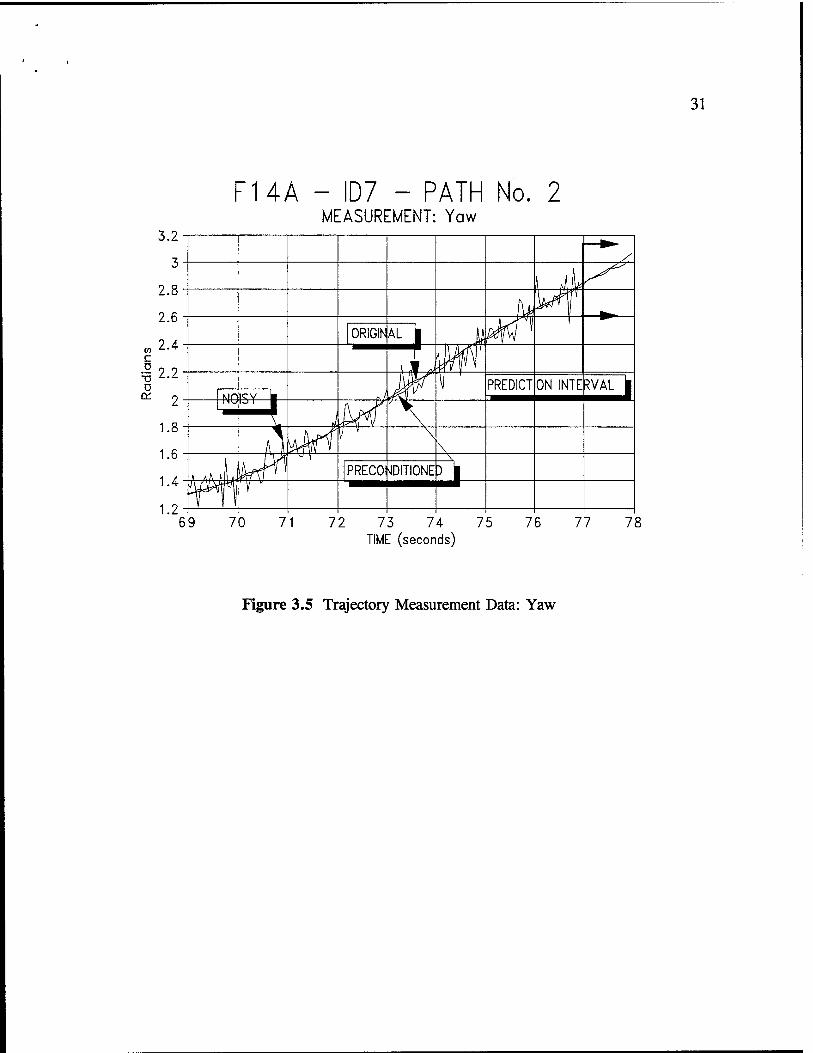
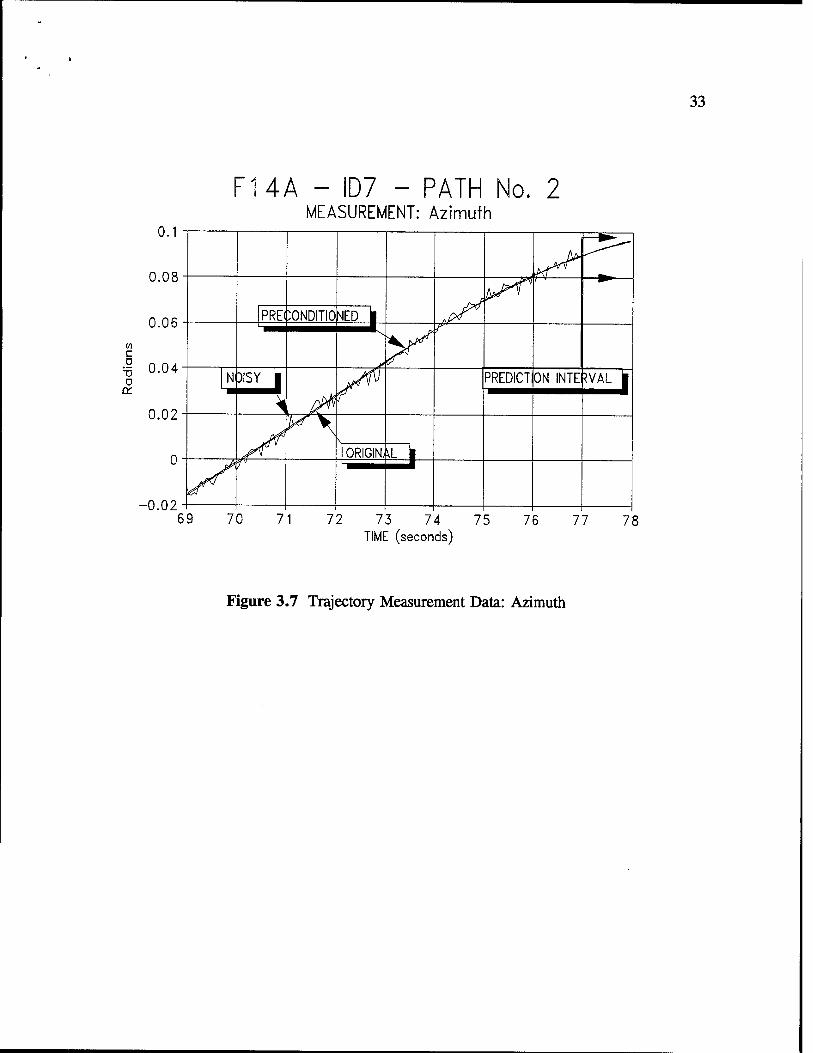
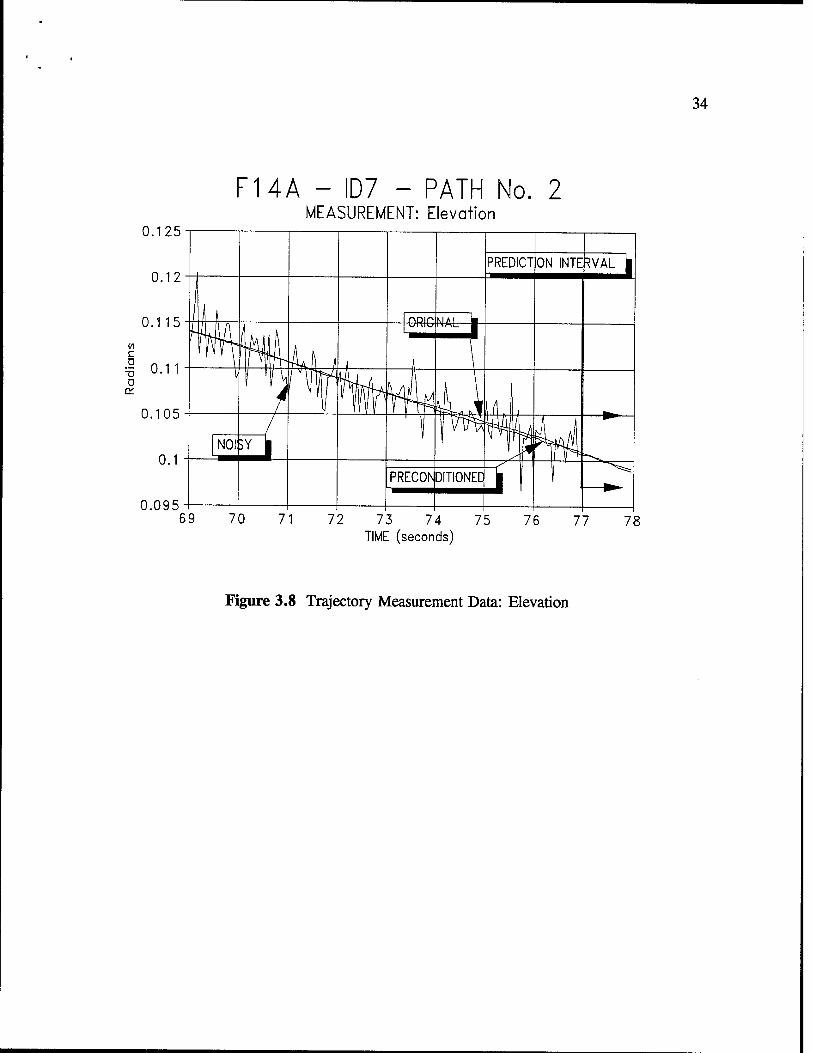
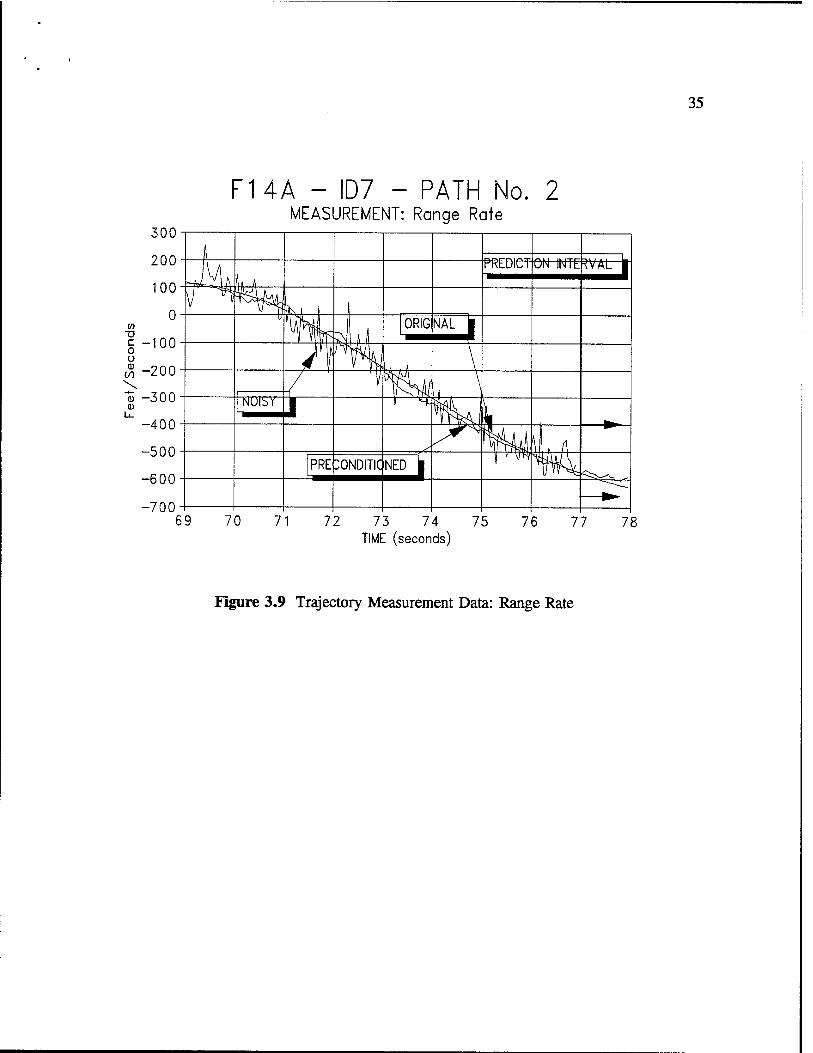
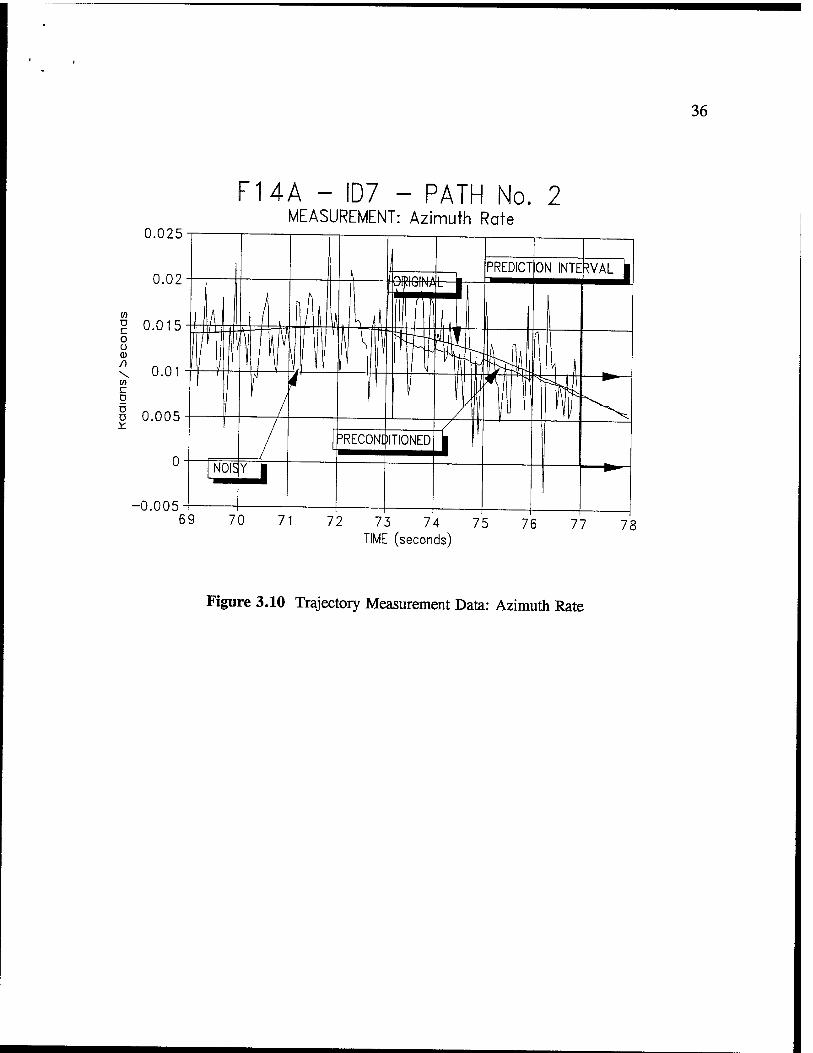
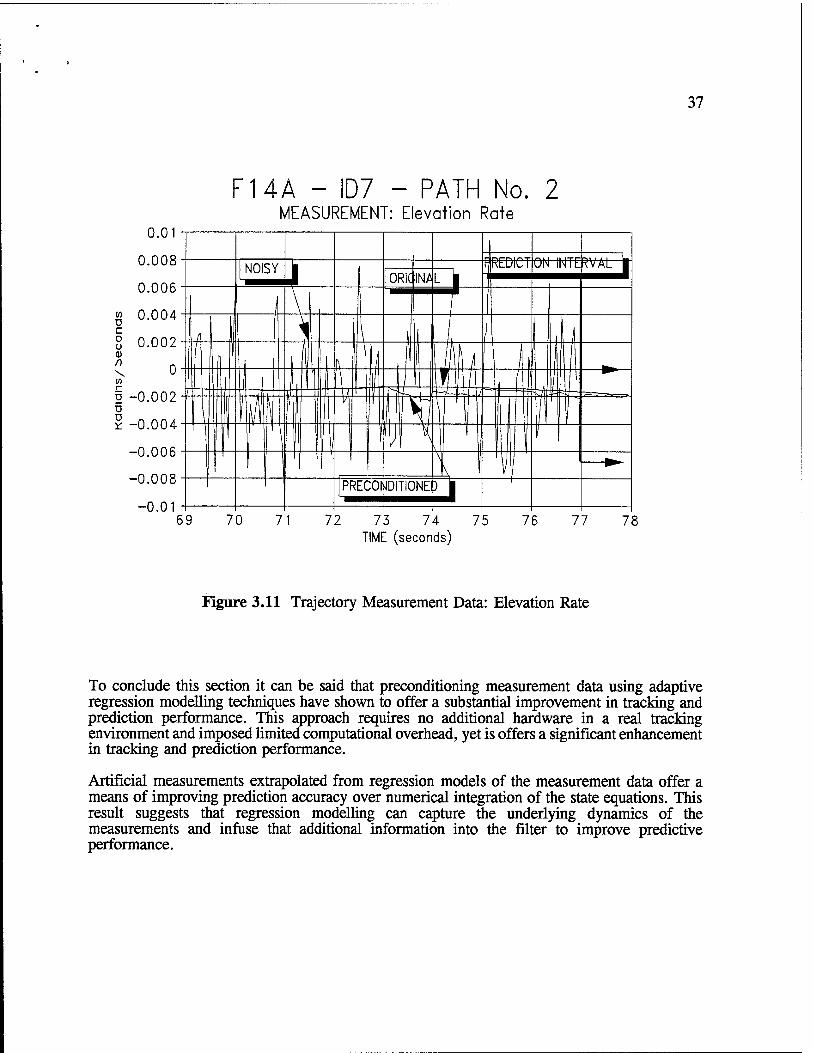
Figures 3.3 to 3.11 show actual F-14A trajectory measurements over a nine second interval. The actual measurements, noisy measurements and preconditioned estimates are shown. The noisy and preconditioned measurements were both used in the extended Kaiman filter estimator for trajectory tracking. These figures illustrate the ability of linear Kaiman filters, derived from regression models of noisy data, to effectively estimate the underlying measurements of the aircraft trajectory with significant disturbances.
The adaptively created regression models were also used in the trajectory prediction process. Previous investigations used Runge-Kutta integration of the last tracked state in order to predict future states through the time update cycle in the extended Kaiman filter. The regression models derived for preconditioning allow prediction to be performed in a novel way. The last estimated regression model of the measurement is used to extrapolate the measurement throughout the prediction interval. The extrapolated data in the prediction interval is shown at the end of each trajectory measurement shown in Figures 3.3 to 3.11. In the process of testing the various tracking techniques, extrapolations were made every second. The extrapolations shown are for illustrative purposes. These extrapolations or artificial measurements are used to continue the operation of the extended Kaiman filter during the prediction interval. The state and
29
measurement update cycles of the extended Kaiman filter are executed in the identical fashion as they were during the tracking interval.
FUA - ID7 - PATH No. 2 MEASUREMENT: Roll
Figure 3.3 Trajectory Measurement Data: Roll
30
FUA - ID7 - PATH No. 2 MEASUREMENT: Pitch
Figure 3.4 Trajectory Measurement Data: Pitch
31
3.2
3
2.8
2.6
„2.4 c .5 2 ? Ö
* 2
1.8
1.6
1.4
1.2
FHA - ID7 - PATH No. 2 MEASUREMENT: Yaw
69 70 71
/
\ A ^
Wf ^- i ORIGIN AL 1 L \\sLf
PREDICT ON INTERVAL | I MD icv b
\ \
A y\KilL-
\ PRECO OITIONE Yfi
72 73 74 75 TIME (seconds)
76 77 78
Figure 3.5 Trajectory Measurement Data: Yaw
32
FUA - ID7 - PATH No. 2 MEASUREMENT: Range
71 72 73 74 75 TIME (seconds)
76 77 78
Figure 3.6 Trajectory Measurement Data: Range
33
-0.02
F14A - ID7 - PATH No. 2 MEASUREMENT: Azimuth
Figure 3.7 Trajectory Measurement Data: Azimuth
34
0.125
F14A - ID7 - PATH No. 2 MEASUREMENT: Elevation
Figure 3.8 Trajectory Measurement Data: Elevation
35
in TS C o Ü <D
00
300
200
100
0
-100
-200
-300
-400
-500
-600
-700
FUA - ID7 - PATH No. 2 MEASUREMENT: Range Rate
PREDICT UN imt^VAL |
ORIG NAL |
\ I | NUbY
—^
PRE bONDITIC NED |
_^T~
19 70 71 72 73 74 75 76 77 78 TIME (seconds)
Figure 3.9 Trajectory Measurement Data: Range Rate
36
FUA - ID7 - PATH No. 2 MEASUREMENT: Azimuth Rate
-0.005
Figure 3.10 Trajectory Measurement Data: Azimuth Rate
37
FUA - ID7 - PATH No. 2 MEASUREMENT: Elevation Rate
73 74 75 TIME (seconds)
76 77 78
Figure 3.11 Trajectory Measurement Data: Elevation Rate
To conclude this section it can be said that preconditioning measurement data using adaptive regression modelling techniques have shown to offer a substantial improvement in tracking and prediction performance. This approach requires no additional hardware in a real tracking environment and imposed limited computational overhead, yet is offers a significant enhancement in tracking and prediction performance.
Artificial measurements extrapolated from regression models of the measurement data offer a means of improving prediction accuracy over numerical integration of the state equations. This result suggests that regression modelling can capture the underlying dynamics of the measurements and infuse that additional information into the filter to improve predictive performance.
38
4. The Use of Aircraft Parameters for Identify Friend or Foe (IFF) Applications
4.1 Criterion of Classification
The problem of classification is to find a way of assigning a new object on the basis of a set of measurements to one of a number of possible groups [55]. Inherent in this statement of the problem is the idea of a classification rule, that is a well defined procedure that can be described and applied without the need for any additional subjective judgements.
Obviously, it is possible to think up any number of procedures for classifying an object into one of a number of groups, ranging from random allocation to an arbitrary rule using any of the measurements. The problem is to select one of the set of possible classification rules based on its performance. In other words we would like to use the classification that was in some sense best. Even though there are a great many criteria which can be used to select a best classification rule the overwhelming majority of applications make use of the obvious criterion of minimum error and as a result this will be used as the standard criterion. To be precise, the classification rule that we seek is optimum in the sense that minimizes the total error of classification.
As conditional probabilities can be used to summarize any information that we have about an event, it should come as no surprise that they are central to the classification of an object based on any measurements that we have made. For example, suppose that there are two classes of aircraft in the air (Friend and Foe) and we need a way of knowing if an aircraft belongs to the Friend or Foe class. Obviously, if the Friend class makes up 90% of all the aircraft in the air then the probability of any given aircraft coming from the Friend class is 0.9. That is:
P(Friend) - 0.9 4#1
and if Friend and Foe exhaustively describe the possible outcomes:
4.2 P(Foe) - 0.1
In the absence of any other information it seems reasonable to assign an aircraft of unknown class to Friend class, after all, more aircraft come from Friend class.
Now suppose, on the basis of a number of measurements (aerodynamic coefficients, wing span, wing area, etc.), it is possible to obtain the conditional probabilities on the set of measurements ( X ) and for a particular set they are:
® P(Friend \ X) - 0.2 4.3
P(Foe I X) « 0.8
39
It seems reasonable to assume that on the basis of the set of measurements ( X ) the aircraft found came from class Foe. This classification rule assign the object to the group with the highest conditional probability. The approach is known as Bayes' rule and it is not difficult to prove that is the rule which minimizes the total error of classification [30, 42]. It is the optimal rule that we seek.
Put more formally, Bayes' rule will assign the object to group i where:
P{Gi | X) > P(Gj \X) V j <> i 3"4
If by any chance there are more than one group with the largest conditional probability then the tie can be broken by allocating the object at random to one of the tied groups. Bayes' rule is telling us is that all of the information that we have about possible group membership is contained in the set of conditional probabilities.
4.2 Feature Selection
The study of aircraft remote identification has received considerable attention as described in previously. An extensive study of classification problems has resulted in a variety of abstract mathematical models that provide the theoretical basis for the design of classifiers [30].
One of the preoccupations of multivariate statistics in general is the reduction of the number of variables that have to be considered to reach a conclusion about the data being studied. In general, the fewer variables involved in a problem, the more likely we are to understand it and the more likely is it that any solution will be practical. This is certainly true of classification where methods of reducing the number of variables involved in a classification rule, without severely affecting the rule's performance, are known collectively as feature selection [55]. The use of the word feature originated in pattern recognition where a feature is some identifiable part which serves to distinguish between groups. However, its use does not seem inappropriate when taken to mean any variable or combination of variables important for classification.
Suppose some aircraft (event) is to be assigned to one of several aircraft types (classes). A sensor system (radar and imagery devices) is used to collect the event's information to be used in the process of classification. The output of the measurement system is directed into a feature extractor, whose purpose is to reduce the available data by generating certain features or properties that distinguish the classes of events that may occur. Classification can not always be reliably performed on events using only one feature. If more than one feature is extracted from a measurement, the data is expressed in a feature vector where each feature becomes a dimension in a feature space. If a feature extractor can derive n features from a measurement, the point in the feature space, C , is given as:
The classification process attempts to partition the space into regions where all of the points corresponding to a specific class can be isolated. A set of training samples with known classes is used to develop the appropriate partition or to train the system.
40
5.5
'n-\
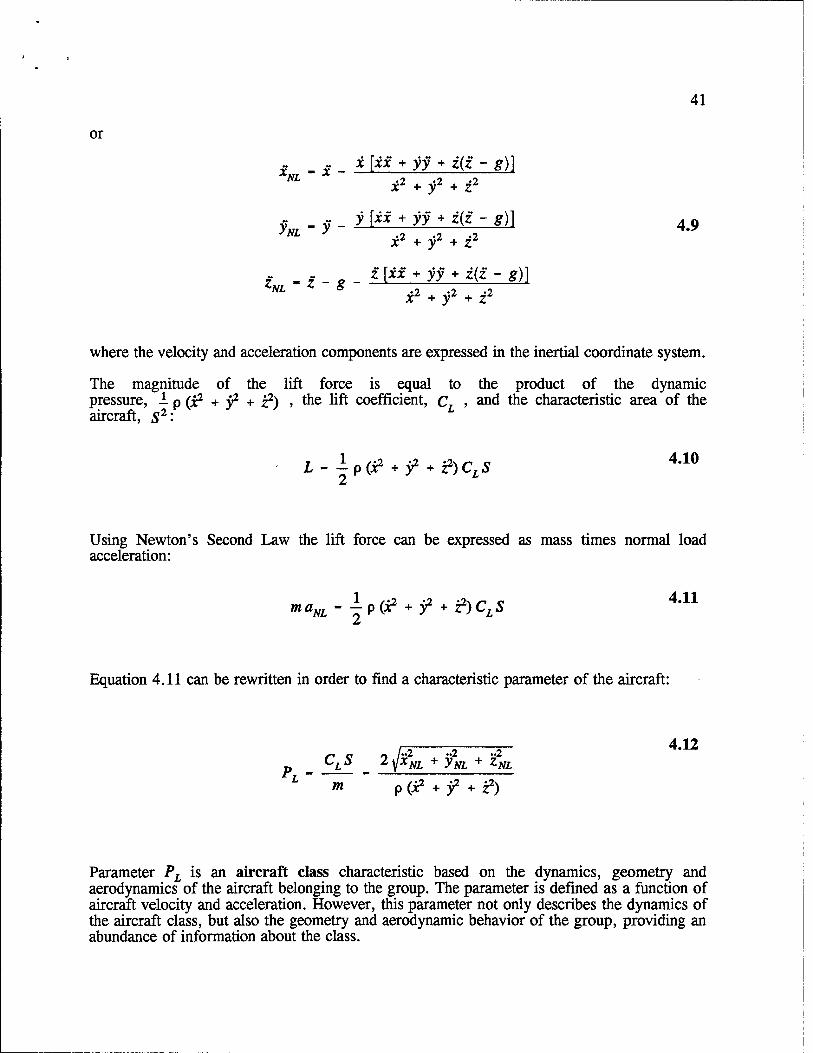
4.3 Aircraft Feature Parameter Based on Lift Coefficient, Characteristic Area and Mass
The purpose of this section is to obtain a characteristic feature to be used in target recognition based on the dynamics, geometry and aerodynamics of the aircraft. This novel technique uses aircraft's velocity and acceleration estimates obtained by the tracking filter discussed earlier to define the aircraft parameter:
CLS 4.6
m
where CL is the lift coefficient, S is the characteristic area and m is the mass of the target.
The idea behind the calculation of this parameter is to represent a characteristic for each aircraft type that involves the dynamics (mass), geometry (characteristic area) and aerodynamic behavior (lift coefficient) that all aircraft of the same class have in common. In order to do that, an equation involving these quantities and remotely measurable observations of the aircraft needs to be developed. However, before that equation is evolved, the load and normal accelerations need to be defined.
Load acceleration, aL , is defined as total acceleration, a , minus gravity, g
aL- a- g 4.7
Assuming a coordinated flight (no lateral component of velocity), the normal load acceleration can be formed by removing from the load acceleration any component of load acceleration along the velocity vector, v '•
*NL - *I. ~ ("
V.a, -) v 4.8
41
or
XNL - X - x [xx + yy + • / a*
z(z - e)] • 2 «2 x* + yz
+ z2
y^L - y - y [xx + yy + z(z - 8)}
• 2 '2 or + )r + z2
ZNL z - 8
z [xx + yy + z(z -g)]
x2 + yz + z: #
4.9
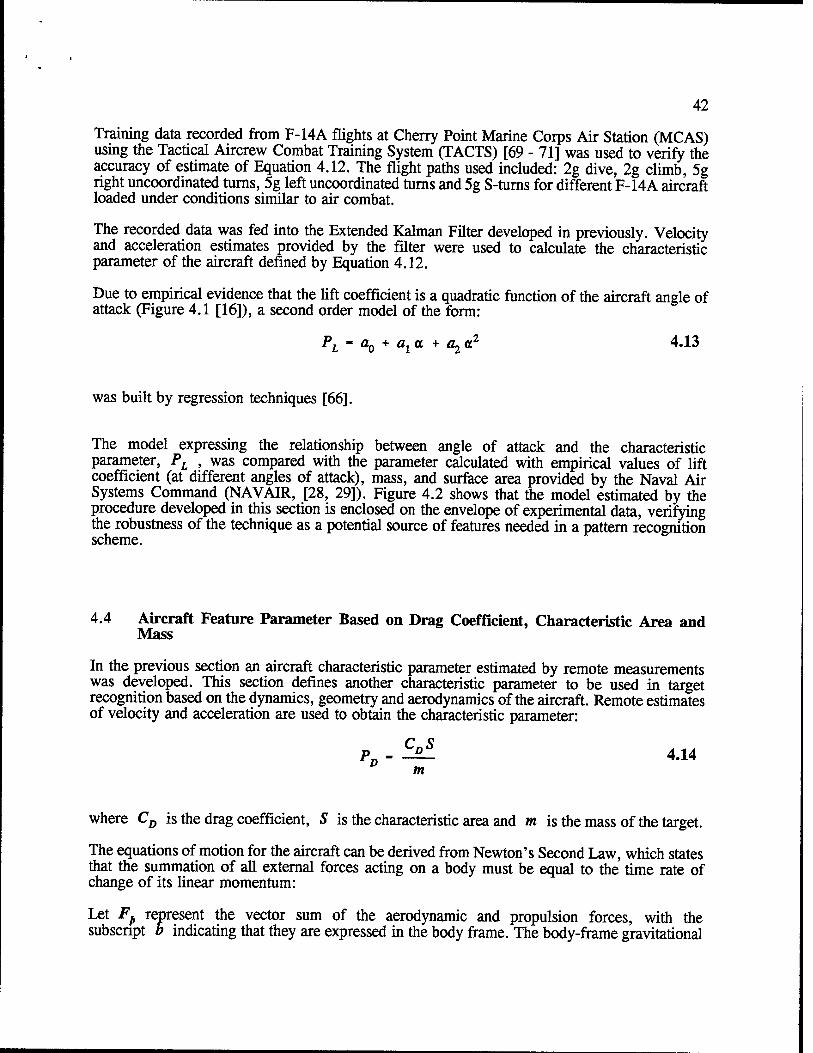
where the velocity and acceleration components are expressed in the inertial coordinate system.
The magnitude of the lift force is equal to the product of the dynamic pressure, I p (r2 + y1 + i2) , the lift coefficient, r , and the characteristic area of the aircraft, s2:
L-±9& + ?+'*)CLS 4'10
Using Newton's Second Law the lift force can be expressed as mass times normal load acceleration:
maNL - 2p(? + ? + ^CLS
Equation 4.11 can be rewritten in order to find a characteristic parameter of the aircraft:
p _ cLs m
2 iXNL +y*L + Zm. rL
p (x2 + y2 + z2)
4.12
Parameter PL is an aircraft class characteristic based on the dynamics, geometry and aerodynamics of the aircraft belonging to the group. The parameter is defined as a function of aircraft velocity and acceleration. However, this parameter not only describes the dynamics of the aircraft class, but also the geometry and aerodynamic behavior of the group, providing an abundance of information about the class.
42
Training data recorded from F-14A flights at Cherry Point Marine Corps Air Station (MCAS) using the Tactical Aircrew Combat Training System (TACTS) [69 - 71] was used to verify the accuracy of estimate of Equation 4.12. The flight paths used included: 2g dive, 2g climb, 5g right uncoordinated turns, 5g left uncoordinated turns and 5g S-turns for different F-14A aircraft loaded under conditions similar to air combat.
The recorded data was fed into the Extended Kaiman Filter developed in previously. Velocity and acceleration estimates provided by the filter were used to calculate the characteristic parameter of the aircraft defined by Equation 4.12.
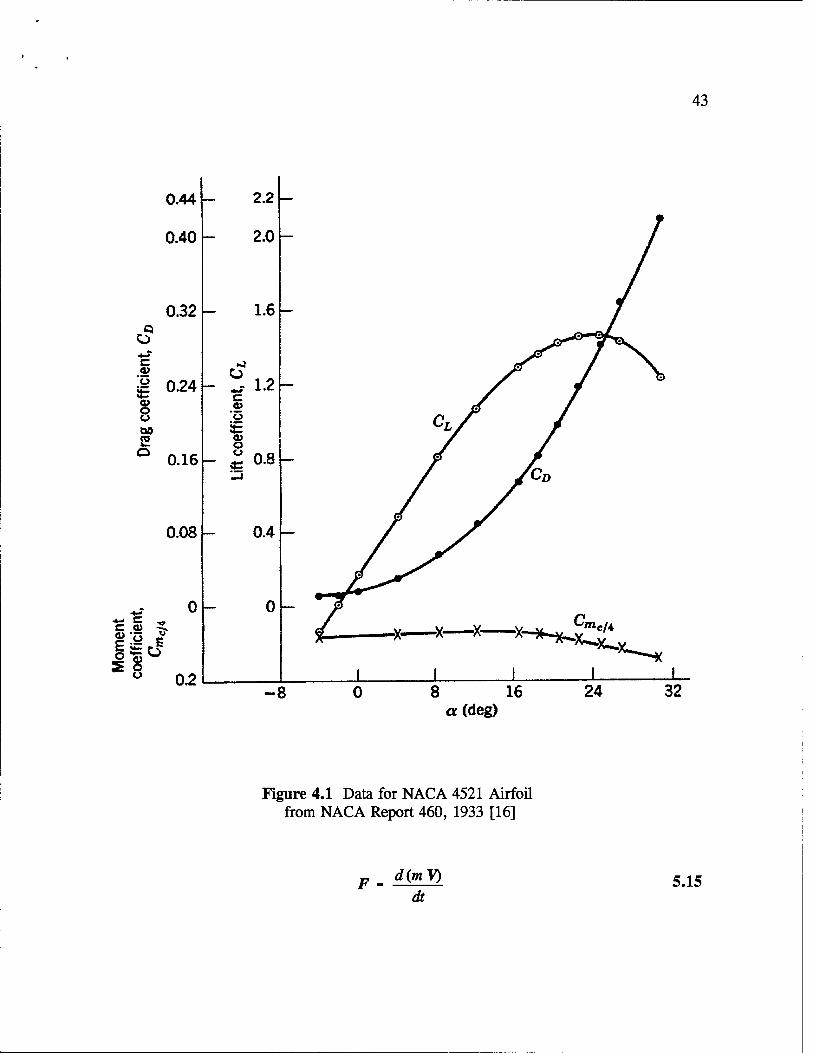
Due to empirical evidence that the lift coefficient is a quadratic function of the aircraft angle of attack (Figure 4.1 [16]), a second order model of the form:
PL - a0 + ata + a2 a2 4.13
was built by regression techniques [66].
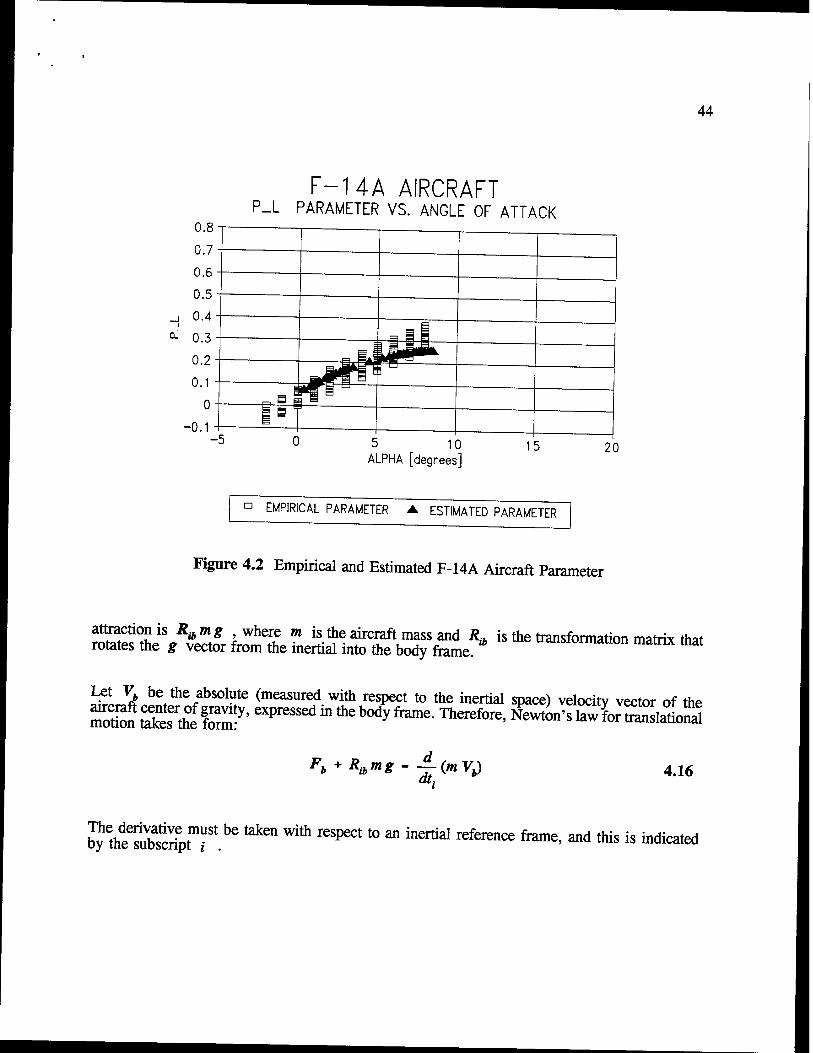
The model expressing the relationship between angle of attack and the characteristic parameter, PL , was compared with the parameter calculated with empirical values of lift coefficient (at different angles of attack), mass, and surface area provided by the Naval Air Systems Command (NAVAIR, [28, 29]). Figure 4.2 shows that the model estimated by the procedure developed in this section is enclosed on the envelope of experimental data, verifying the robustness of the technique as a potential source of features needed in a pattern recognition scheme.
4.4 Aircraft Feature Parameter Based on Drag Coefficient, Characteristic Area and Mass
In the previous section an aircraft characteristic parameter estimated by remote measurements was developed. This section defines another characteristic parameter to be used in target recognition based on the dynamics, geometry and aerodynamics of the aircraft. Remote estimates of velocity and acceleration are used to obtain the characteristic parameter:
PD - E*l 4.14 m
where CD is the drag coefficient, S is the characteristic area and m is the mass of the target.
The equations of motion for the aircraft can be derived from Newton's Second Law, which states that the summation of all external forces acting on a body must be equal to the time rate of change of its linear momentum:
Let Fp represent the vector sum of the aerodynamic and propulsion forces, with the subscript B indicating that they are expressed in the body frame. The body-frame gravitational
43
0.44
0.40
0.32
I- 2.2
2.0
U 1.6
0.08
0.2
Q o *-*■ c ►j a> ü u it: 0.24
c 1.2
% a> u o BO 5= TO a> k. o o 0.16 — 4= 0.8
0.4
-8 0 8 16 a (deg)
Figure 4.1 Data for NACA 4521 Airfoil from NACA Report 460, 1933 [16]
F - djjnV) dt
5.15
44
F-14A AIRCRAFT P_L PARAMETER VS. ANGLE OF ATTACK
5 10 ALPHA [degrees]
15 20
° EMPIRICAL PARAMETER A ESTIMATED PARAMETER
Figure 4.2 Empirical and Estimated F-14A Aircraft Parameter
attraction is Ra mg where m is the aircraft mass and Ra is the transformation matrix that rotates the g vector from the inertial into the body frame. ^rormauon matrix that
Let V. be the absolute (measured with respect to the inertial space) velocity vector of the
mSSftheS^' eXPreSSed ln th& b0dy frame- ™erefore' Newton's kX^V^nS
F> + Ra,mg- -£-0»VJ 4.16
^tteS^rr.1*tokBn with respect to **inertiai reference frame' ^this is imficated
Equation 4.16 can be written as:
45
where:
Fb + RibMg - m
*b 4.17
*b X
yb -** y
.2*. z_
4.18
and,
g -
0
0 4.19
Force Fh has components due to aerodynamic effects and engine thrust. These components will be denoted, respectively, by the subscripts A and T :
FB ~ F*A + FiT 4.20
Equation 4.20 can be replaced in 4.17 to give:
46
FbA + FiT + RibmS - m yb
4.21
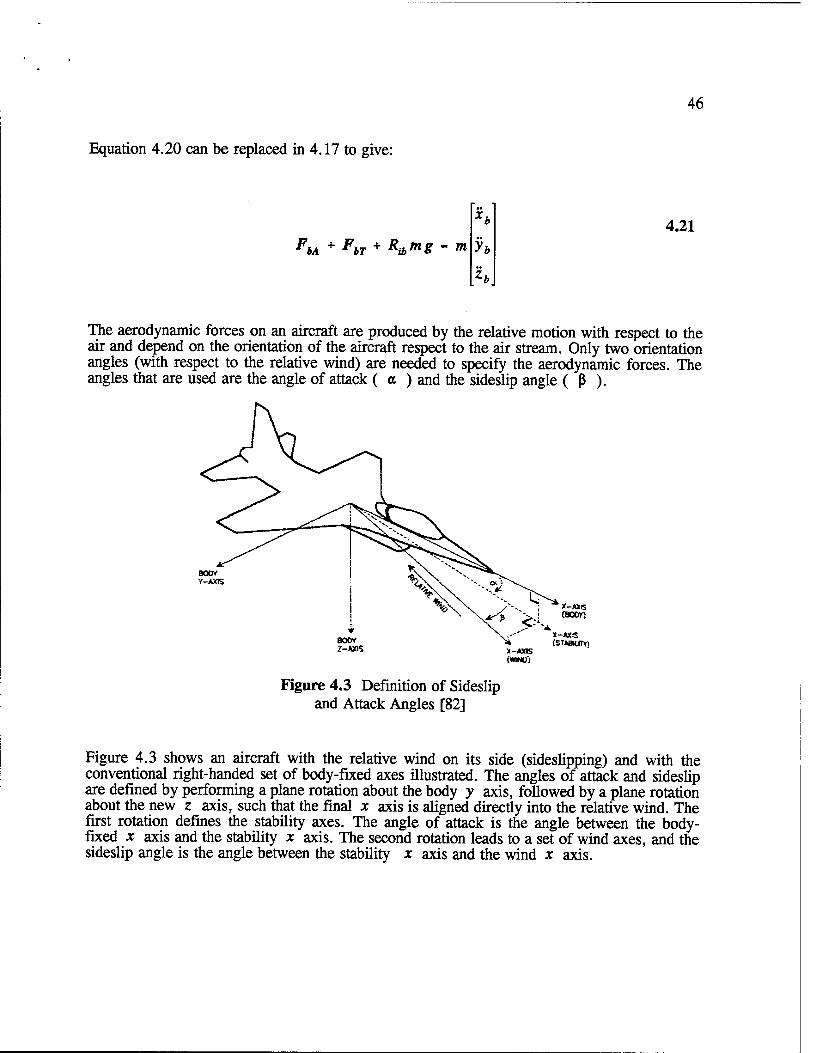
The aerodynamic forces on an aircraft are produced by the relative motion with respect to the air and depend on the orientation of the aircraft respect to the air stream. Only two orientation angles (with respect to the relative wind) are needed to specify the aerodynamic forces. The angles that are used are the angle of attack ( a ) and the sideslip angle ( ß ).
Figure 4.3 Definition of Sideslip and Attack Angles [82]
Figure 4.3 shows an aircraft with the relative wind on its side (sideslipping) and with the conventional right-handed set of body-fixed axes illustrated. The angles of attack and sideslip are defined by performing a plane rotation about the body y axis, followed by a plane rotation about the new z axis, such that the final x axis is aligned directly into the relative wind. The first rotation defines the stability axes. The angle of attack is the angle between the body- fixed x axis and the stability x axis. The second rotation leads to a set of wind axes, and the sideslip angle is the angle between the stability x axis and the wind x axis.
47
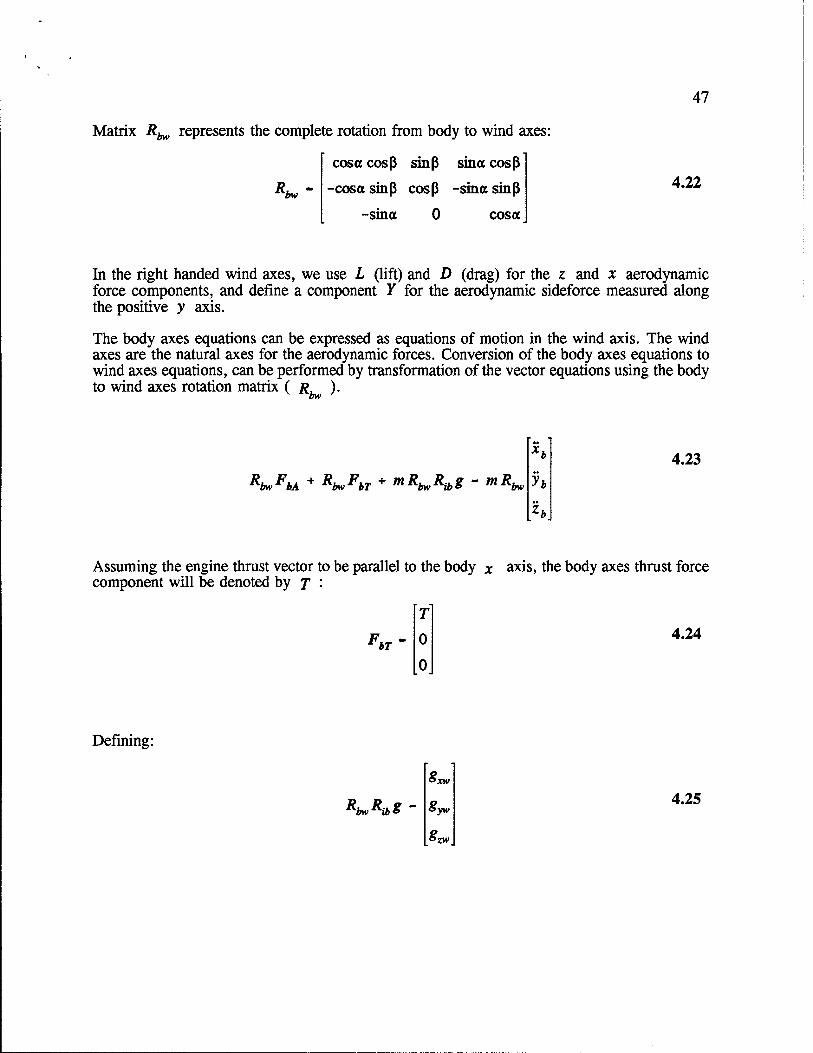
Matrix R^ represents the complete rotation from body to wind axes:
cosa cosß sinß sina cosß
Rbw " -cosa sinß cosß -sina sinß
-sina 0 cosa
4.22
In the right handed wind axes, we use L (lift) and D (drag) for the z and x aerodynamic force components, and define a component Y for the aerodynamic sideforce measured along the positive y axis.
The body axes equations can be expressed as equations of motion in the wind axis. The wind axes are the natural axes for the aerodynamic forces. Conversion of the body axes equations to wind axes equations, can be performed by transformation of the vector equations using the body to wind axes rotation matrix ( /? ).
UW
RbwFbA + RbwFbT + mRbwRib8 ~ mRbw
*b
yb
4.23
Assuming the engine thrust vector to be parallel to the body x axis, the body axes thrust force component will be denoted by j :
bT
T
0
0
4.24
Defining:
RbwRu>8
8X
8 4.25 yw
g. zw
and,
48
RbwRib
4.26
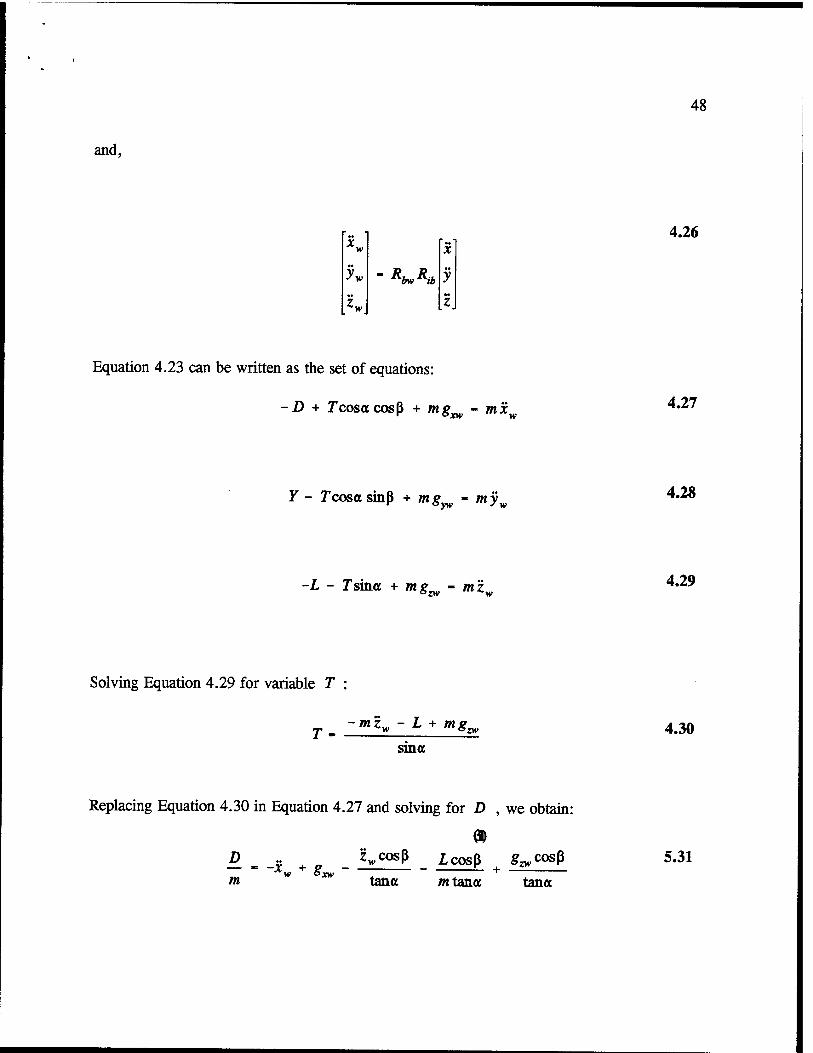
Equation 4.23 can be written as the set of equations:
-D + rcosacosß + mgw - mxw 4.27
Y - Tcosa sinß + mg - myw 4.28
-L - Tsina + mg - m'z zw ~w 4.29
Solving Equation 4.29 for variable T :
r- ~mK- L + mg. ZW>
sina 4.30
Replacing Equation 4.30 in Equation 4.27 and solving for D , we obtain:
— - -x + P - ^^ß _ £cosß g^cosß m tana mtana tana
5.31
49
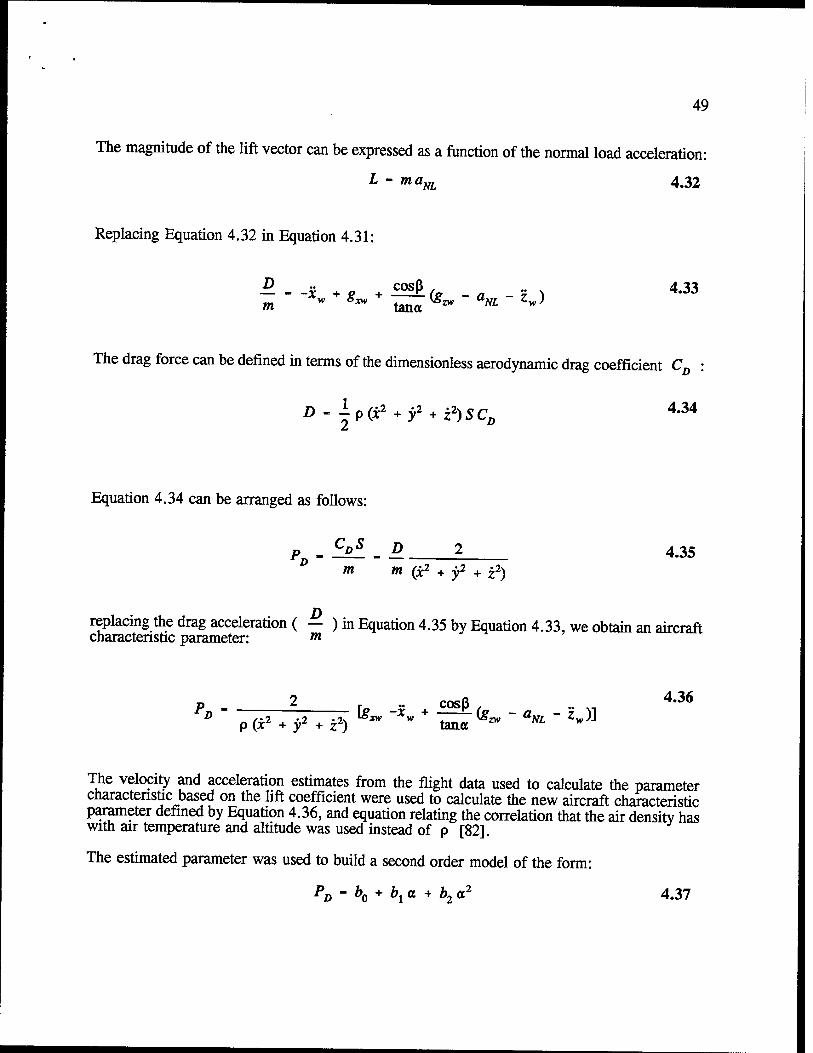
The magnitude of the lift vector can be expressed as a function of the normal load acceleration:
L - maNL 4.32
Replacing Equation 4.32 in Equation 4.31:
& - cosß , „ 4«
The drag force can be defined in terms of the dimensionless aerodynamic drag coefficient C D
D- ip(i2 + y2 + z2)SCD
4*34
Equation 4.34 can be arranged as follows:
P - 5»5 _ D 2 4.35 m m (xz + y2 + z2)
replacing the drag acceleration ( — ) in Equation 4.35 by Equation 4.33, we obtain an aircraft characteristic parameter: m
p 2 r cosß , .. ., p (jr + yz + z) tana w
4.36
The velocity and acceleration estimates from the flight data used to calculate the parameter characteristic^based on the lift coefficient were used to calculate the new aircraft characteristic parameter defined by Equation 4.36, and equation relating the correlation that the air density has with air temperature and altitude was used instead of p [82].
The estimated parameter was used to build a second order model of the form:
PD - bo + bia + b2al 4-37
50
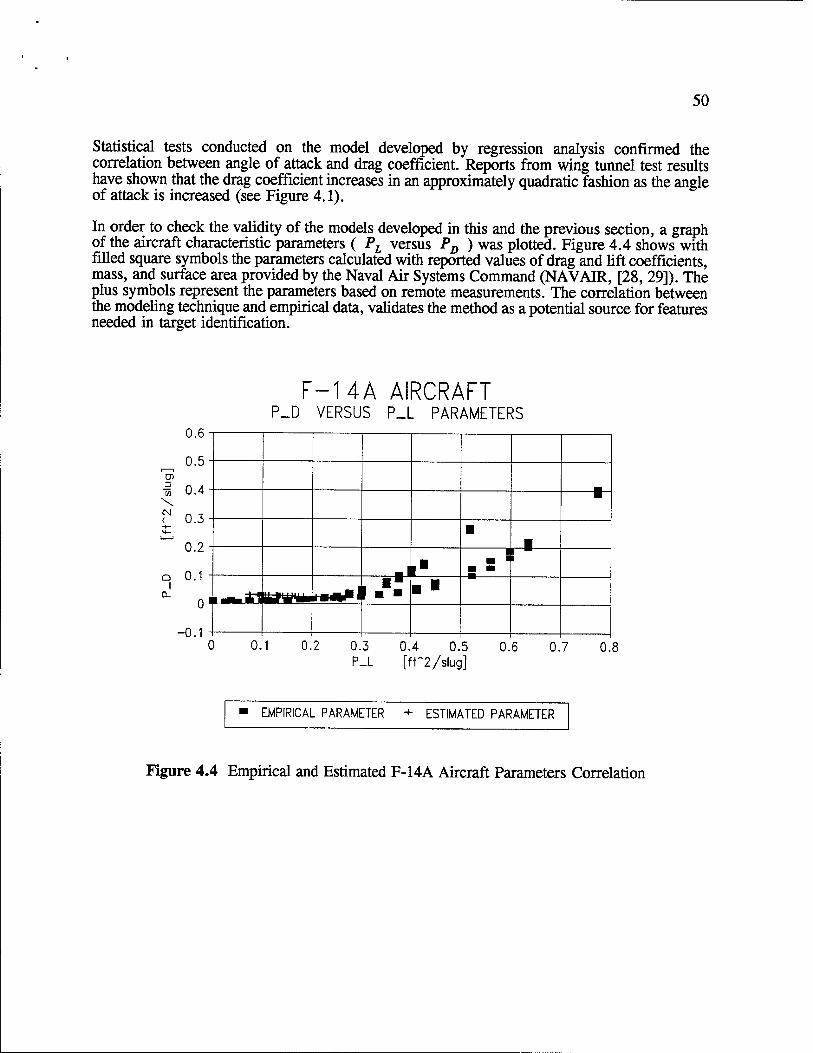
Statistical tests conducted on the model developed by regression analysis confirmed the correlation between angle of attack and drag coefficient. Reports from wing runnel test results have shown that the drag coefficient increases in an approximately quadratic fashion as the angle of attack is increased (see Figure 4.1).
In order to check the validity of the models developed in this and the previous section, a graph of the aircraft characteristic parameters ( PL versus PD ) was plotted. Figure 4.4 shows with filled square symbols the parameters calculated with reported values of drag and lift coefficients, mass, and surface area provided by the Naval Air Systems Command (NAVAIR, [28, 29]). The plus symbols represent the parameters based on remote measurements. The correlation between the modeling technique and empirical data, validates the method as a potential source for features needed in target identification.
V)
\ CM <
0.6
0.5
i, 0.4
0.3
0.2
0.1
0
-0.1
F-14A AIRCRAFT P_D VERSUS P_L PARAMETERS
■ |r_i
•JJ'üML »HT T ■ ■ "
0.1 0.2 0.3 P_L
0.4 0.5 [fr2/slug]
0.6 0.7 0.8
EMPIRICAL PARAMETER ESTIMATED PARAMETER
Figure 4.4 Empirical and Estimated F-14A Aircraft Parameters Correlation
51
As can be seen from Figure 4.3 there is only a limited range of values for the Pr and PD estimated parameters. The reason for that is given by the flight paths and aircraft load configurations used to estimate the parameters. These flight paths correspond to typical air combat situations with the F-14A fully loaded with weapons. During these maneuvers, the pilot tends to flight at subsonic speeds (most air engagements take effect at MACH numbers m the 0.4 to 0.8 range) because the high load carried by the aircraft [28, 29]. Maneuvering the F-14A under these conditions results in a finite group of values for the angle of attack (range between 2 to 8 degrees, see Figure 4.1) that, in fact, cause a narrow range of estimated PL and PD parameters.
4.5 Fusion of Aircraft Feature Parameters into a Two Dimensional Feature Space
Two aircraft characteristic parameters based on remote estimates of aircraft velocity, acceleration and orientation were previously defined. The problem with these parameters is that each one is dependent on the aircraft angle of attack. In other words, each characteristic ( PL or PD ) is a continuous function of the independent variable a and, consequently, on the dynamics of the flight path. A feature extractor model, whose purpose is to reduce the dynamics dependent aircraft characteristic information into a dynamics independent properties vector needs to be developed. This section describes the fusion of the available aircraft parameter data into a two dimensional feature vector, where each feature will become an aircraft characteristic parameter independent of the flight dynamics.
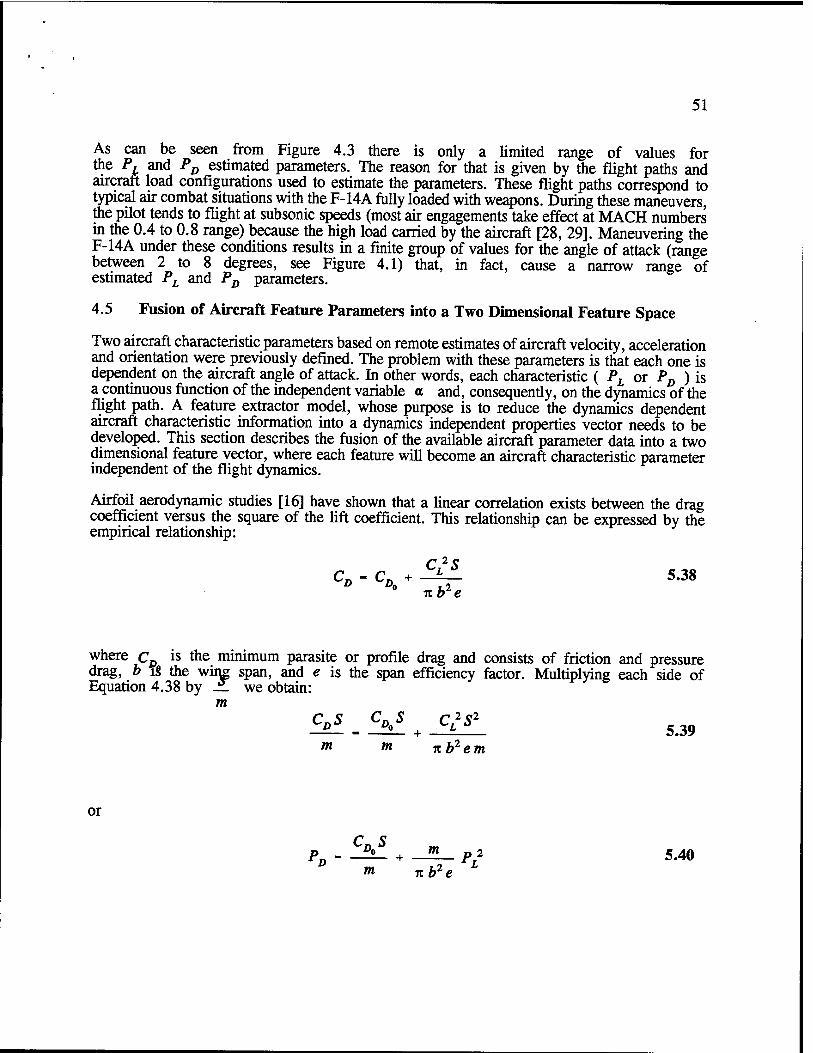
Airfoil aerodynamic studies [16] have shown that a linear correlation exists between the drag coefficient versus the square of the lift coefficient. This relationship can be expressed by the empirical relationship:
c2? Cn-Cn + -^f. 5.38
Tt be 'D -D0
where CD is the minimum parasite or profile drag and consists of friction and pressure drag, b i§ the wine span, and e is the span efficiency factor. Multiplying each side of Equation 4.38 by _ we obtain:
m cDs cDos cL
2S> m m nb2em
5.39
or
PD - -A_ + m p* 5.40 *» izb2e
52
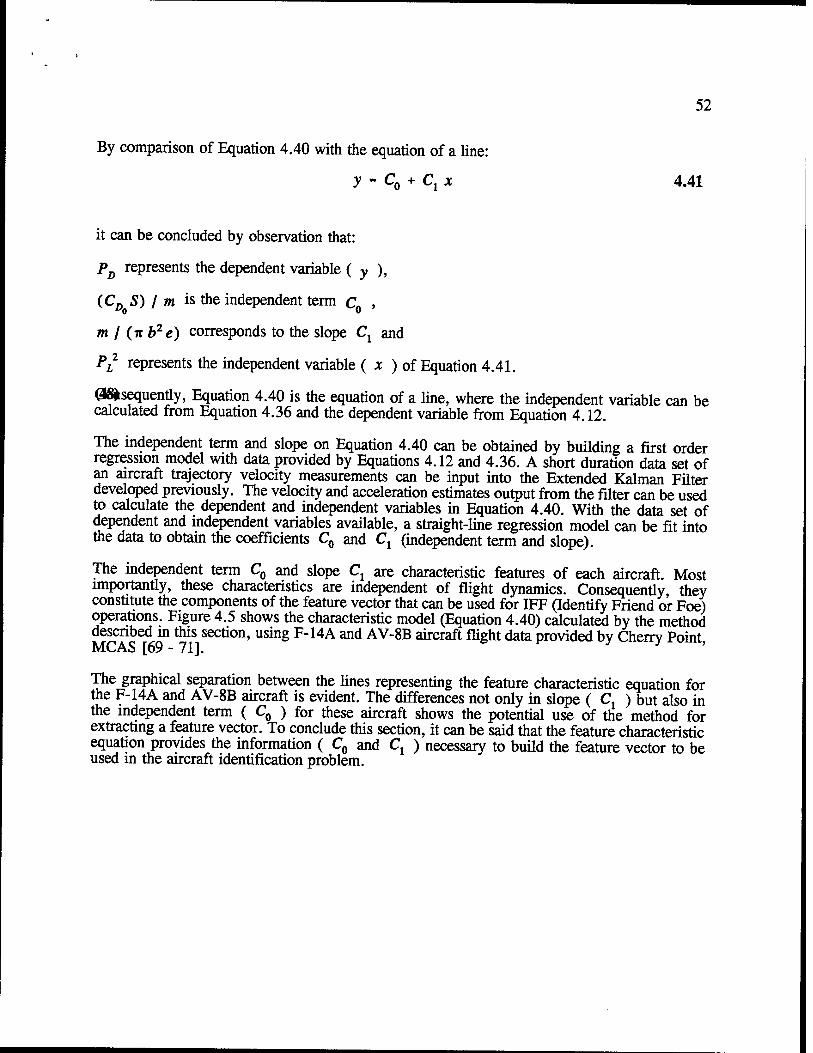
By comparison of Equation 4.40 with the equation of a line:
y - C0 + Cx x 4.41
it can be concluded by observation that:
PD represents the dependent variable ( y ),
(CD S) I m is the independent term co ,
m / (nb2e) corresponds to the slope Cx and
Pjr2 represents the independent variable ( x ) of Equation 4.41.
@8jksequently, Equation 4.40 is the equation of a line, where the independent variable can be calculated from Equation 4.36 and the dependent variable from Equation 4.12.
The independent term and slope on Equation 4.40 can be obtained by building a first order regression model with data provided by Equations 4.12 and 4.36. A short duration data set of an aircraft trajectory velocity measurements can be input into the Extended Kaiman Filter developed previously. The velocity and acceleration estimates output from the filter can be used to calculate the dependent and independent variables in Equation 4.40. With the data set of dependent and independent variables available, a straight-line regression model can be fit into the data to obtain the coefficients C0 and Cx (independent term and slope).
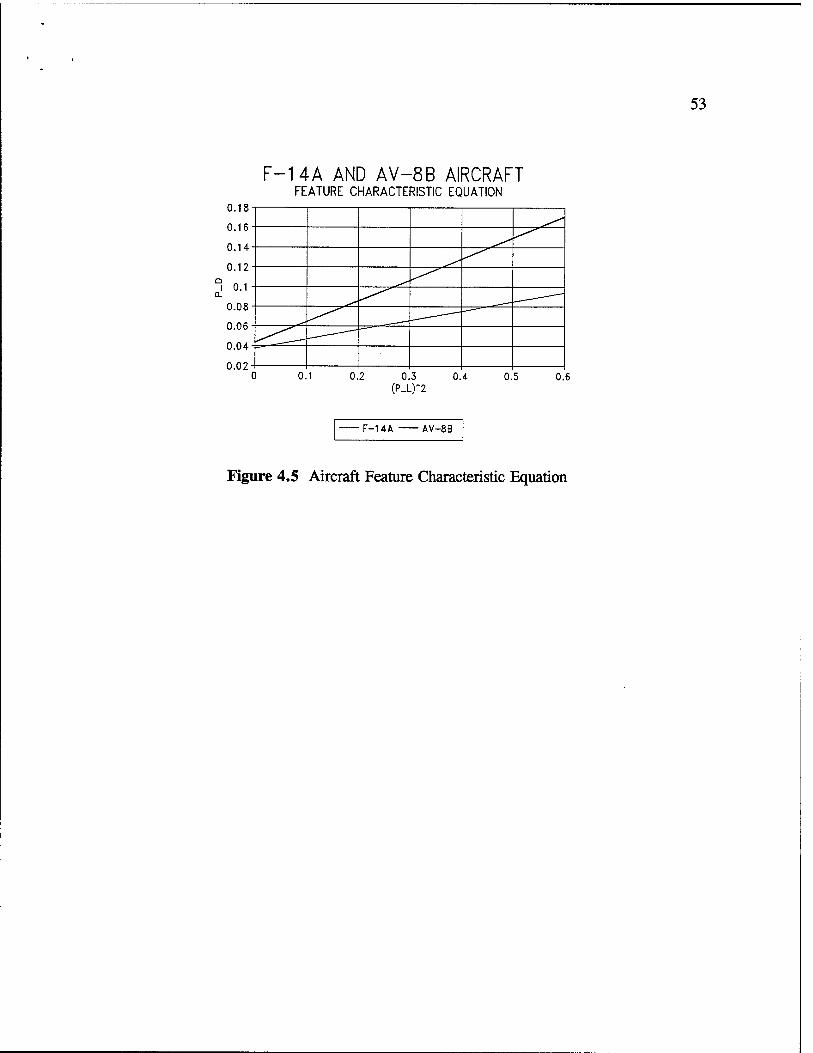
The independent term C0 and slope Cx are characteristic features of each aircraft. Most importantly, these characteristics are independent of flight dynamics. Consequently they constitute the components of the feature vector that can be used for IFF (Identify Friend or Foe) operations. Figure 4.5 shows the characteristic model (Equation 4.40) calculated by the method described in this section, using F-14A and AV-8B aircraft flight data provided by Cherry Point MCAS [69 - 71]. '
The graphical separation between the lines representing the feature characteristic equation for the F-14A and AV-8B aircraft is evident. The differences not only in slope ( C, ) but also in the independent term ( C0 ) for these aircraft shows the potential use of the method for extracting a feature vector. To conclude this section, it can be said that the feature characteristic equation provides the information ( C0 and Cx ) necessary to build the feature vector to be used in the aircraft identification problem.
53
F-14A AND AV-8B AIRCRAFT FEATURE CHARACTERISTIC EQUATION
U.IO ^
0.07- 0.1 0.2 0.3
(P_L)~2 0.4 0.5 0.6
■F-UA AV-8B
Figure 4.5 Aircraft Feature Characteristic Equation
54
5. System Operation
5.1 System Training for Friend or Foe Aircraft Classification
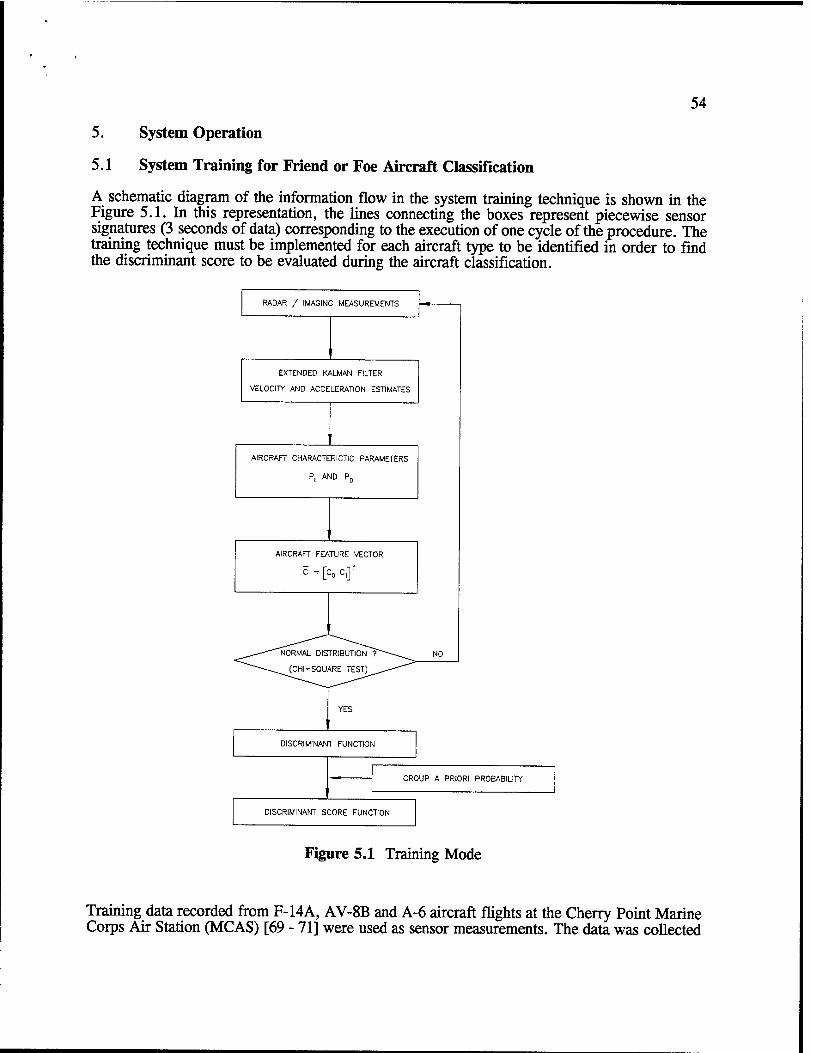
A schematic diagram of the information flow in the system training technique is shown in the Figure 5.1. In this representation, the lines connecting the boxes represent piecewise sensor signatures (3 seconds of data) corresponding to the execution of one cycle of the procedure. The training technique must be implemented for each aircraft type to be identified in order to find the discriminant score to be evaluated during the aircraft classification.
RADAR / IMAGING MEASUREMENTS
EXTENDED KALMAN FILTER
VELOCITY AND ACCELERATION ESTIMATES
AIRCRAFT CHARACTERICTIC PARAMETERS
PL AND PD
AIRCRAFT FEATURE VECTOR
c = [c0 c,]T
YES
DISCRIMINANT FUNCTION
GROUP A PRIORI PROBABILITY
DISCRIMINANT SCORE FUNCTION
Figure 5.1 Training Mode
Training data recorded from F-14A, AV-8B and A-6 aircraft flights at the Cherry Point Marine Corps Air Station (MCAS) [69 - 71] were used as sensor measurements. The data was collected
55
as a normal part of the training mission using the Tactical Aircrew Combat Training System (TACTS). A full set of position, and rate information was collected from training aircraft via radar and a telemetry unit mounted on the training aircraft. A gyroscope recorded the orientation angles (attitude data) during the maneuvers. A transponder transmitted the information to the ground tracker, establishing a form of air-ground data link.
The flight paths used included: 2g dive, 2g climb, 5g right uncoordinated turn, 5g left uncoordinated turn and 5g S-turn for different aircraft types loaded under conditions similar to air combat. Three second long data segments recorded by the radar and gyroscopic sensor devices are directed into the Extended Kaiman Filter developed previously. Velocity and acceleration estimates calculated by the filter are used to estimate the aircraft characteristic parameters defined by Equations 4.12 and 4.36. The lift and drag characteristic parameters are combined by the fusion algorithm developed earlier to obtain the two dimensional aircraft feature vector.
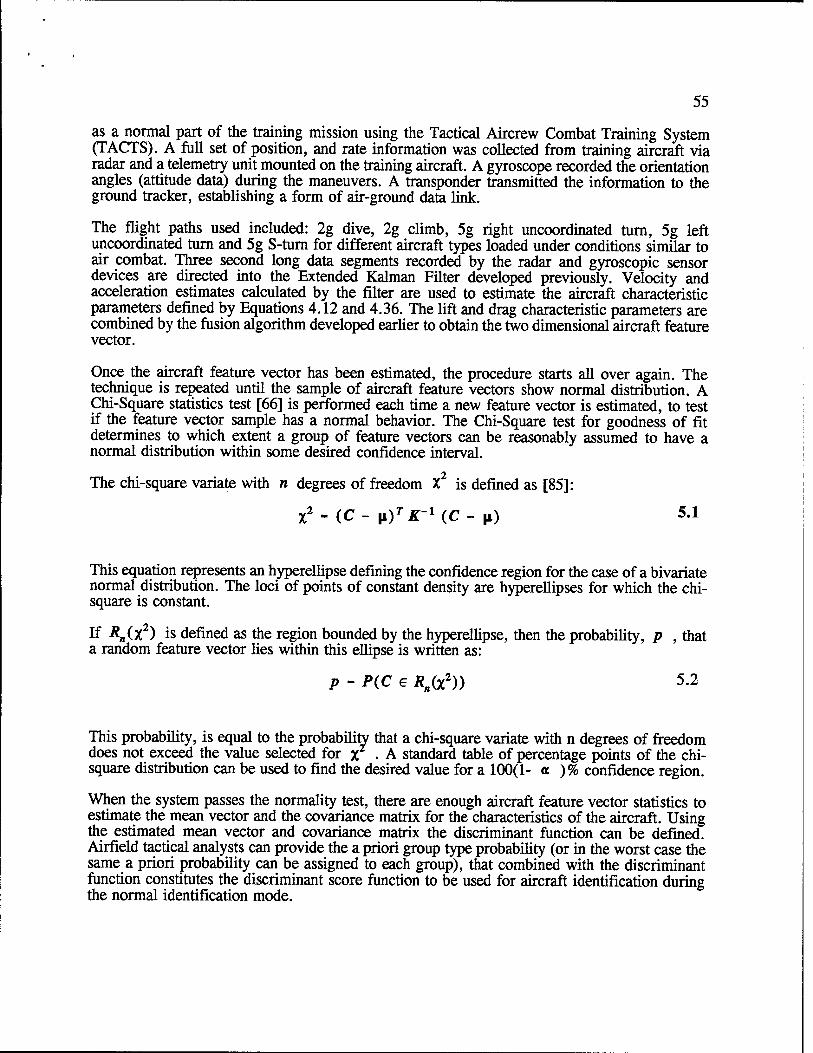
Once the aircraft feature vector has been estimated, the procedure starts all over again. The technique is repeated until the sample of aircraft feature vectors show normal distribution. A Chi-Square statistics test [66] is performed each time a new feature vector is estimated, to test if the feature vector sample has a normal behavior. The Chi-Square test for goodness of fit determines to which extent a group of feature vectors can be reasonably assumed to have a normal distribution within some desired confidence interval.
The chi-square variate with n degrees of freedom X2 is defined as [85]:
X2-(C- ii)**-1«:- |i) 5.1
This equation represents an hyperellipse defining the confidence region for the case of a bivariate normal distribution. The loci of points of constant density are hyperellipses for which the chi- square is constant.
If Ä„(X2) is defined as the region bounded by the hyperellipse, then the probability, p , that a random feature vector lies within this ellipse is written as:
p-P(C€ Rn(x2)) 5.2
This probability, is equal to the probability that a chi-square variate with n degrees of freedom does not exceed the value selected for x • A standard table of percentage points of the chi- square distribution can be used to find the desired value for a 100(1- a ) % confidence region.
When the system passes the normality test, there are enough aircraft feature vector statistics to estimate the mean vector and the covariance matrix for the characteristics of the aircraft. Using the estimated mean vector and covariance matrix the discriminant function can be defined. Airfield tactical analysts can provide the a priori group type probability (or in the worst case the same a priori probability can be assigned to each group), that combined with the discriminant function constitutes the discriminant score function to be used for aircraft identification during the normal identification mode.
56
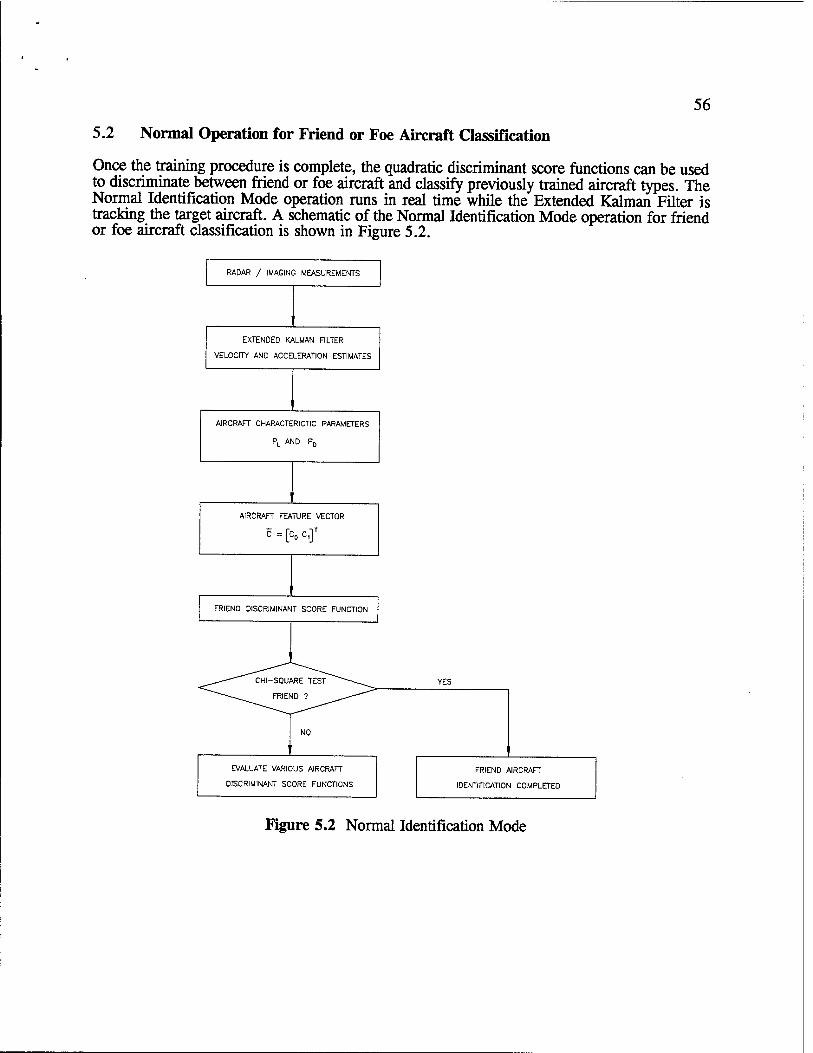
5.2 Normal Operation for Friend or Foe Aircraft Classification
Once the training procedure is complete, the quadratic discriminant score functions can be used to discriminate between friend or foe aircraft and classify previously trained aircraft types. The Normal Identification Mode operation runs in real time while the Extended Kaiman Filter is tracking the target aircraft. A schematic of the Normal Identification Mode operation for friend or foe aircraft classification is shown in Figure 5.2.
RADAR / IMAGING MEASUREMENTS
EXTENDED KAIMAN FILTER
VELOCITY AND ACCELERATION ESTIMATES
AIRCRAFT CHARACTERICTIC PARAMETERS
P, AND P„
AIRCRAFT FEATURE VECTOR
C = [C0 C,]T
FRIEND DISCRIMINANT SCORE FUNCTION
YES
NO
EVALUATE VARIOUS AIRCRAFT
DISCRIMINANT SCORE FUNCTIONS
FRIEND AIRCRAFT
IDENTIFICATION COMPLETED
Figure 5.2 Normal Identification Mode
57
6. Sample Application of the Trajectory Tracking/Prediction and Friend or Foe Aircraft Classification
This research was conducted using existing equipment at the University of Detroit Mercy. Personal computers were used to test the tracking algorithms against aircraft trajectory data. The software was developed in the Pascal and C languages.
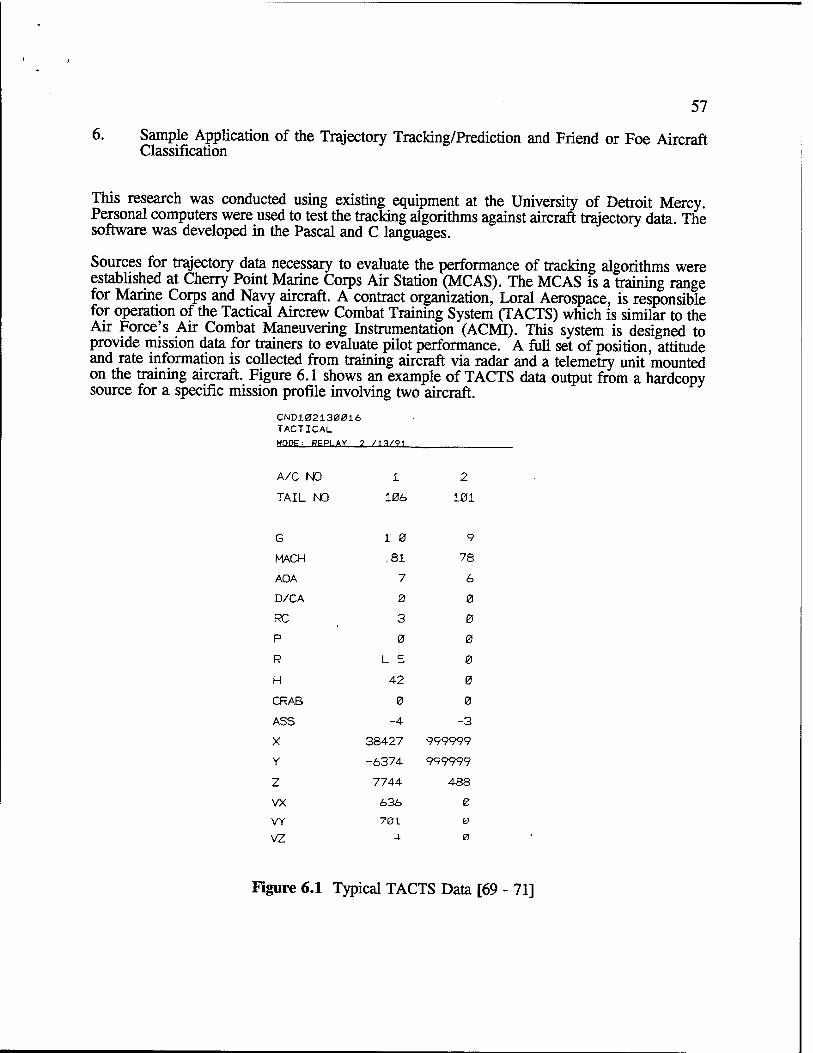
Sources for trajectory data necessary to evaluate the performance of tracking algorithms were established at Cherry Point Marine Corps Air Station (MCAS). The MCAS is a training range for Marine Corps and Navy aircraft. A contract organization, Loral Aerospace, is responsible for operation of the Tactical Aircrew Combat Training System (TACTS) which is similar to the Air Force's Air Combat Maneuvering Instrumentation (ACMI). This system is designed to provide mission data for trainers to evaluate pilot performance. A full set of position, attitude and rate information is collected from training aircraft via radar and a telemetry unit mounted on the training aircraft. Figure 6.1 shows an example of TACTS data output from a hardcopy source for a specific mission profile involving two aircraft.
CND102130016 TACTICAL
MODE; REPLAY 2 /ia/91
A/C NO 1 2
TAIL NO 106 101
G 1 0 9
MACH .81 78
AOA 7 6
D/CA 0 0
RC 3 0
P 0 0
R L 5 0
H 42 0
CRAB 0 0
ASS -4 -3
X 38427 999999
Y -6374 999999
Z 7744 488
vx 6Sfe 0
VY 701 0
VZ J. 0
Figure 6.1 Typical TACTS Data [69 - 71]
58
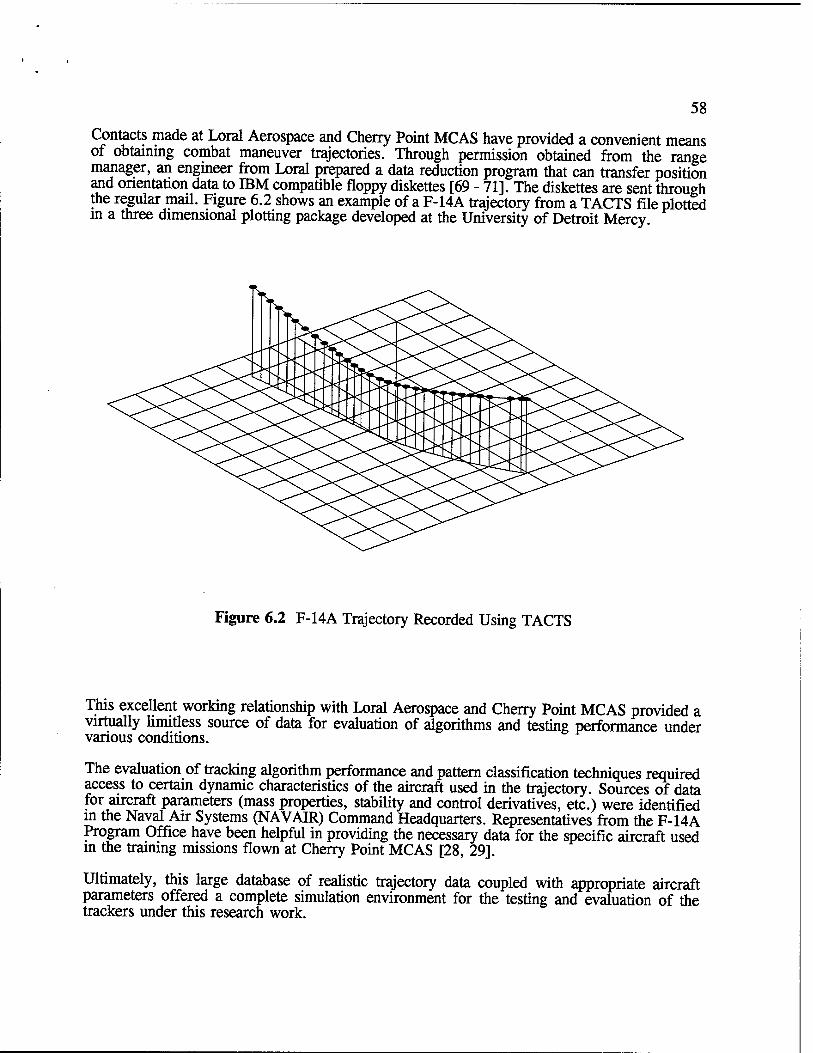
Contacts made at Loral Aerospace and Cherry Point MCAS have provided a convenient means of obtaining combat maneuver trajectories. Through permission obtained from the range manager, an engineer from Loral prepared a data reduction program that can transfer position and orientation data to IBM compatible floppy diskettes [69 - 71]. The diskettes are sent through the regular mail. Figure 6.2 shows an example of a F-14A trajectory from a TACTS file plotted in a three dimensional plotting package developed at the University of Detroit Mercy.
Figure 6.2 F-14A Trajectory Recorded Using TACTS
This excellent working relationship with Loral Aerospace and Cherry Point MCAS provided a virtually limitless source of data for evaluation of algorithms and testing performance under various conditions.
The evaluation of tracking algorithm performance and pattern classification techniques required access to certain dynamic characteristics of the aircraft used in the trajectory. Sources of data for aircraft parameters (mass properties, stability and control derivatives, etc.) were identified in the Naval Air Systems (NAVAIR) Command Headquarters. Representatives from the F-14A Program Office have been helpful in providing the necessary data for the specific aircraft used in the training missions flown at Cherry Point MCAS [28, 29].
Ultimately, this large database of realistic trajectory data coupled with appropriate aircraft parameters offered a complete simulation environment for the testing and evaluation of the trackers under this research work.
59
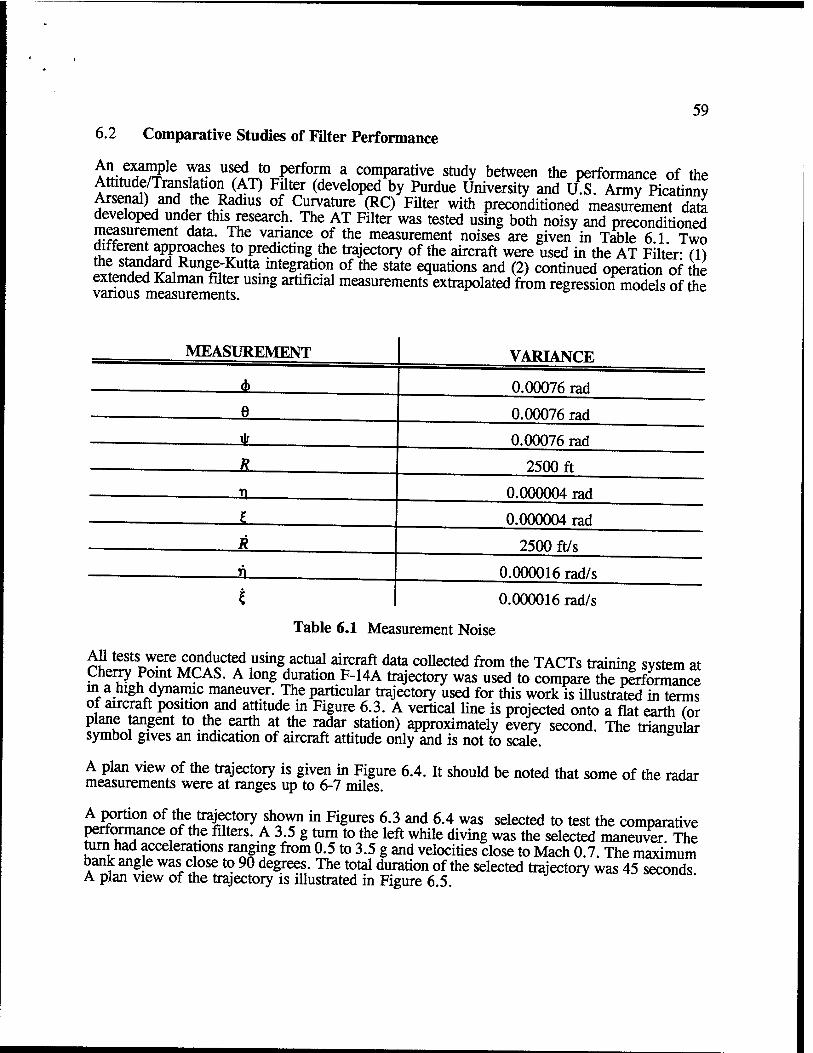
6.2 Comparative Studies of Filter Performance
^Xf!$le ™* us,^ '° P^0™ a c0111!»»0^ study between the performance of the Attitude/Translation (AT) Filter (developed by Purdue University and tLS. Army Picatinnv Arsenal) and the Radius of Curvature (RC) Filter with preconditioned measurement data developed under this research. The AT Filter was tested using both noisy and preconditioned measurement data. The variance of the measurement noises are given in Table 6 1 Two different approaches to predicting the trajectory of the aircraft were used in the AT Filter- (1) the standard Runge-Kutta integration of the state equations and (2) continued operation of the extended Kaiman filter using artificial measurements extrapolated from regression models of the various measurements. fe
MEASUREMENT
A. e
jt
R
VARIANCE
0.00076 rad
0.00076 rad
0.00076 rad
2500 ft
0.000004 rad
0.000004 rad
2500 ft/s
0.000016 rad/s
0.000016 rad/s
Table 6.1 Measurement Noise
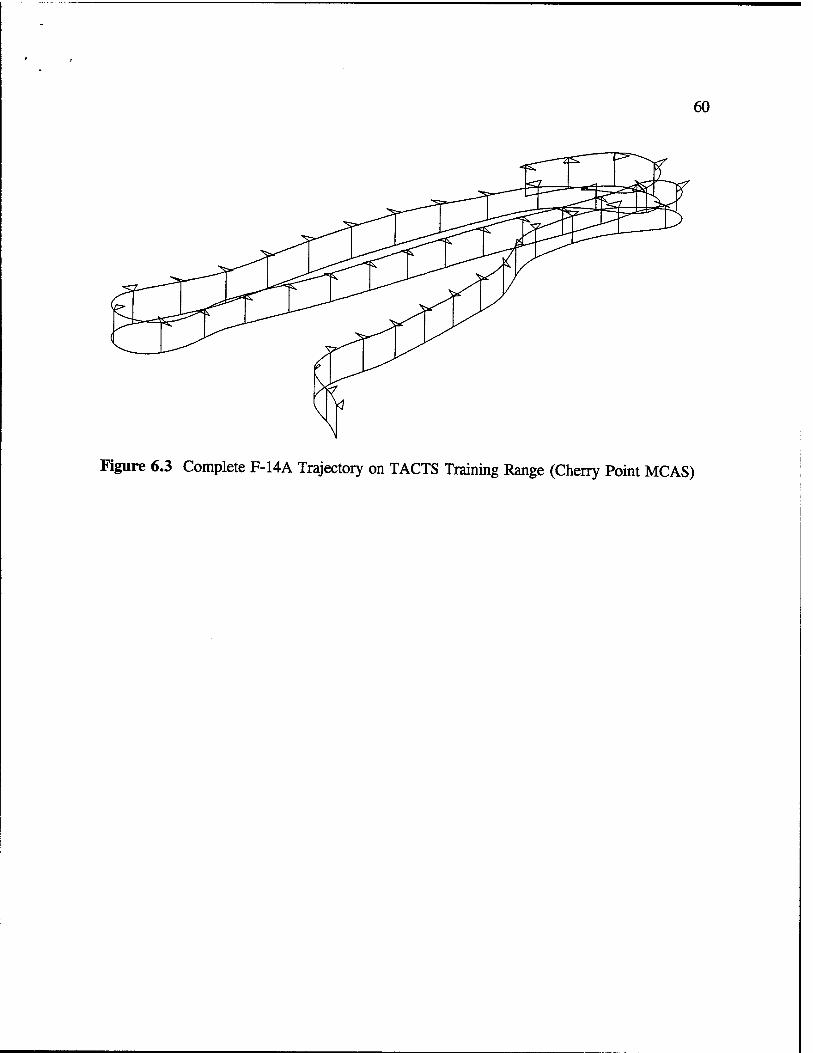
All tests were conducted using actual aircraft data collected from the TACTs training system at Cherry Point MCAS. A long duration F-14A trajectory was used to compare the performance in a high dynamic maneuver. The particular trajectory used for this work is illustrated in terms of aircraft position and attitude in Figure 6.3. A vertical line is projected onto a flat earth (or plane tangent to the earth at the radar station) approximately every second. The triangular symbol gives an indication of aircraft attitude only and is not to scale.
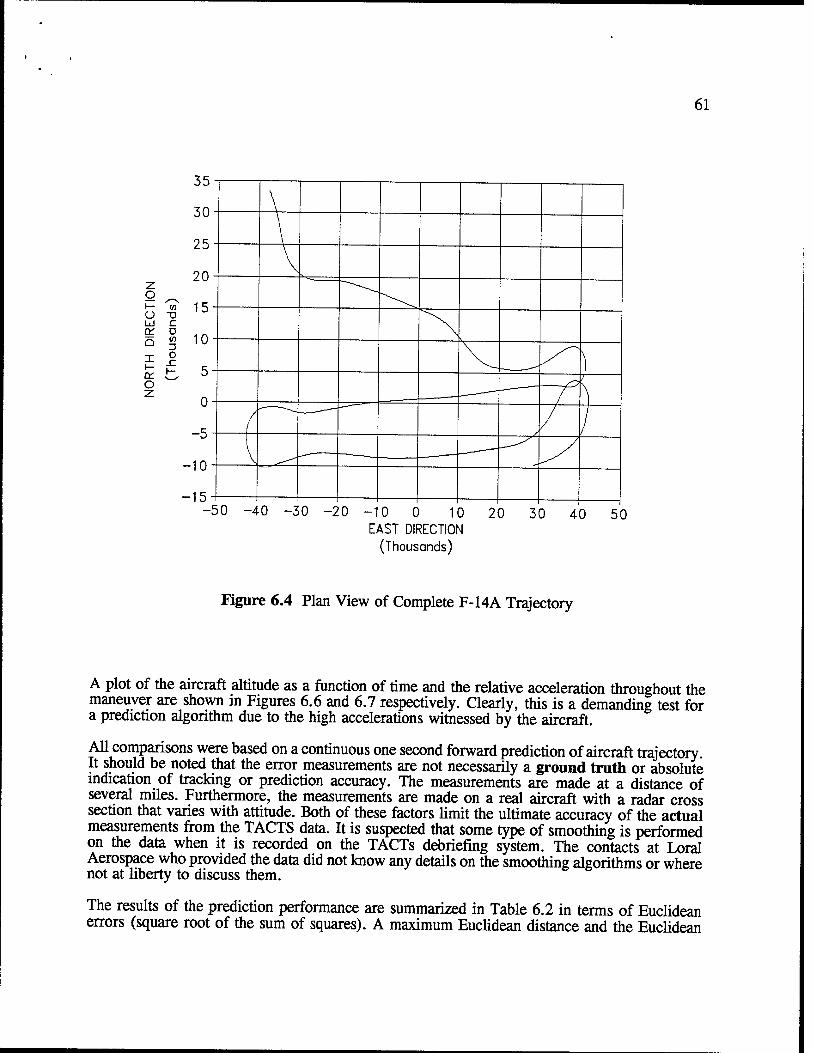
A plan view of the trajectory is given in Figure 6.4. It should be noted that some of the radar measurements were at ranges up to 6-7 miles.
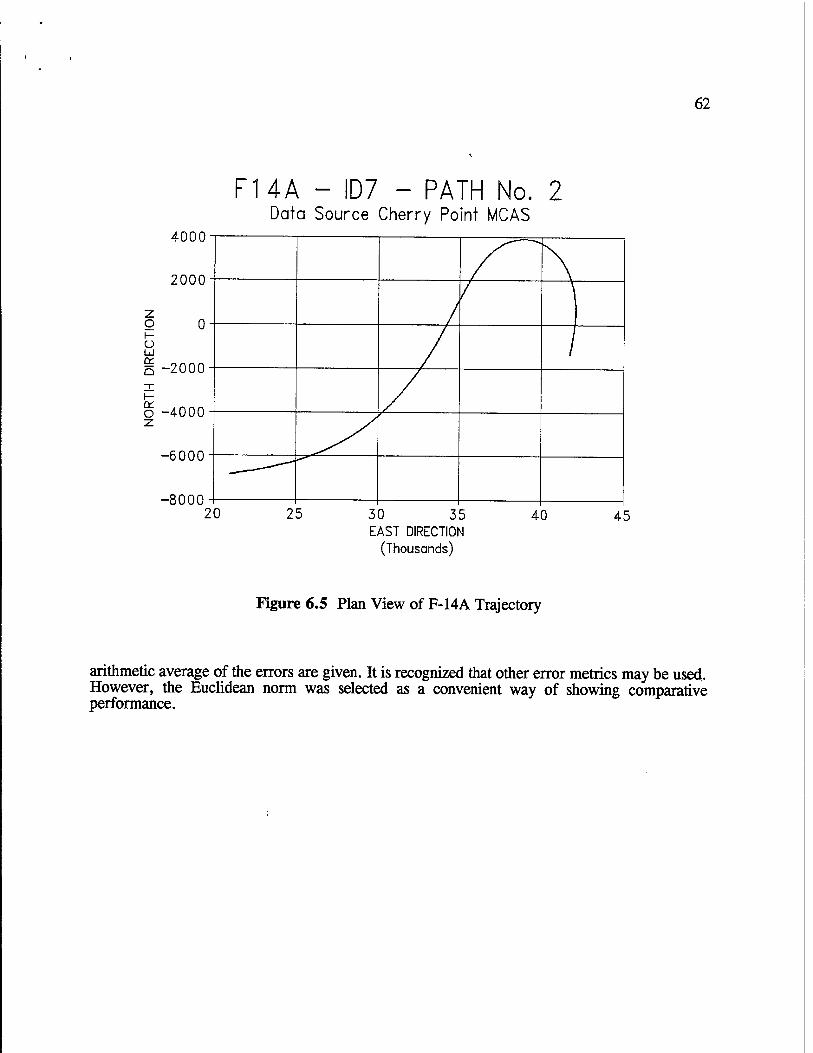
A portion of the trajectory shown in Figures 6.3 and 6.4 was selected to test the comparative performance of the filters. A 3.5 g turn to the left while diving was the selected maneuver The turn had accelerations ranging from 0.5 to 3.5 g and velocities close to Mach 0.7. The maximum bank angle was close to 90 degrees. The total duration of the selected trajectory was 45 seconds A plan view of the trajectory is illustrated in Figure 6.5
60
Figure 6.3 Complete F-14A Trajectory on TACTS Training Range (Cherry Point MCAS)
61
-50 -40 -30 -20-10 0 10 EAST DIRECTION
(Thousands)
20 30 40 50
Figure 6.4 Plan View of Complete F-14A Trajectory
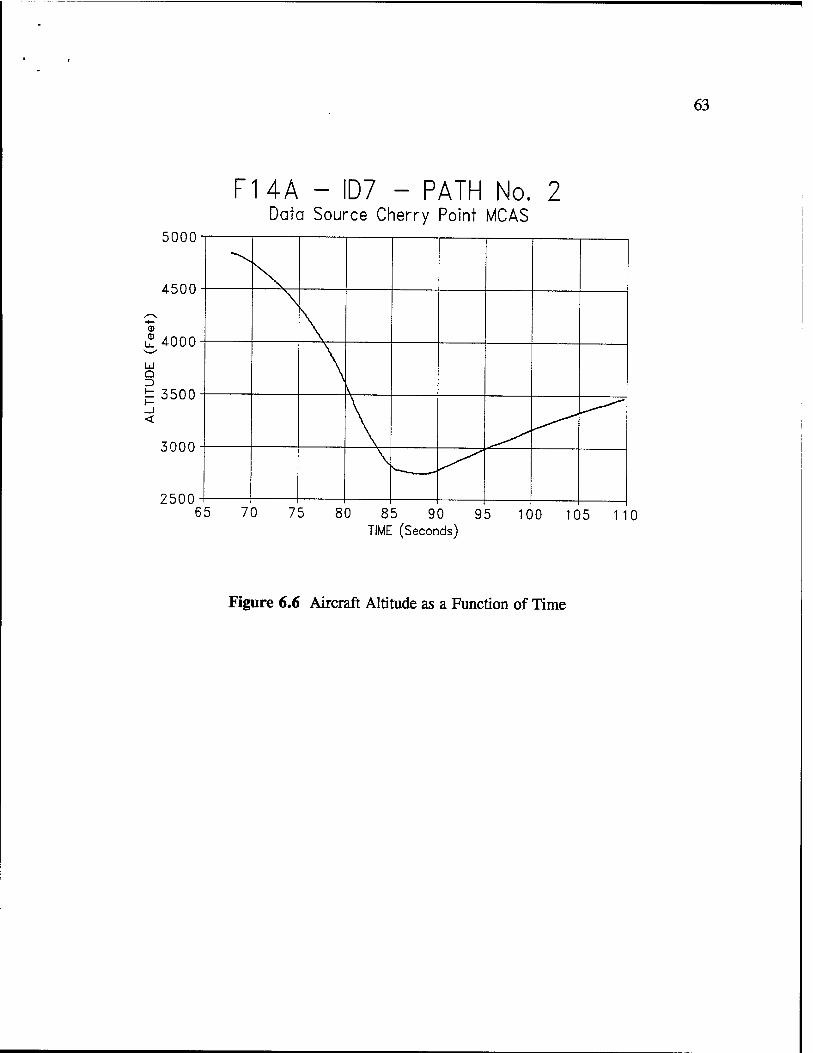
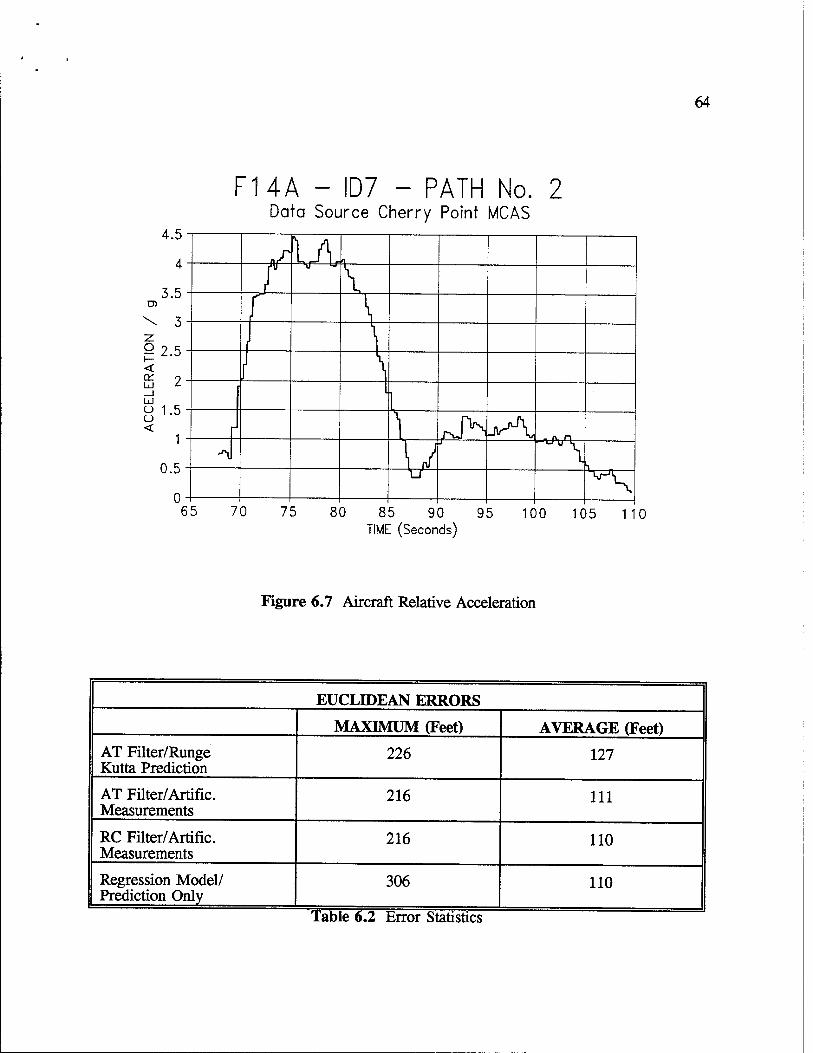
A plot of the aircraft altitude as a function of time and the relative acceleration throughout the maneuver are shown in Figures 6.6 and 6.7 respectively. Clearly, this is a demanding test for a prediction algorithm due to the high accelerations witnessed by the aircraft.
All comparisons were based on a continuous one second forward prediction of aircraft trajectory. It should be noted that the error measurements are not necessarily a ground truth or absolute indication of tracking or prediction accuracy. The measurements are made at a distance of several miles. Furthermore, the measurements are made on a real aircraft with a radar cross section that varies with attitude. Both of these factors limit the ultimate accuracy of the actual measurements from the TACTS data. It is suspected that some type of smoothing is performed on the data when it is recorded on the TACTs debriefing system. The contacts at Loral Aerospace who provided the data did not know any details on the smoothing algorithms or where not at liberty to discuss them.
The results of the prediction performance are summarized in Table 6.2 in terms of Euclidean errors (square root of the sum of squares). A maximum Euclidean distance and the Euclidean
62
FHA - ID7 - PATH No. 2 Data Source Cherry Point MCAS
4000
-8000 25 30 35
EAST DIRECTION (Thousands)
40 45
Figure 6.5 Plan View of F-14A Trajectory
arithmetic average of the errors are given. It is recognized that other error metrics may be used. However, the Euclidean norm was selected as a convenient way of showing comparative performance.
63
Ld Q
F14A - ID7 - PATH No. 2 Data Source Cherry Point MCAS
ouuu
4000 -
"^snn -
^ooo -
2500- 65 70 75 80 85 90 95 100 105 110
TIME (Seconds)
Figure 6.6 Aircraft Altitude as a Function of Time
64
D>
22 < rr Lü _l Lü
<
4.5
4
3.5
3
.5
2
.5
1
.5
0
F14A - ID7 - PATH No. 2 Data Source Cherry Point MCAS
j/] lA 1
/
Tl l-r
\,
..{. \
\ 1 \ l {
l-l \
rJS^\ •"J ly \ T_r
65 70 75 80 85 90 95 100 105 11 TIME (Seconds)
0
Figure 6.7 Aircraft Relative Acceleration
EUCLIDEAN ERRORS
MAXIMUM (Feet) AVERAGE (Feet) AT Filter/Runge Kutta Prediction
226 127
AT Filter/Artific. Measurements
216 111
RC Filter/Artific. Measurements
216 110
Regression Model/ Prediction Only
306 110
Table 6.2 Error Statistics
65
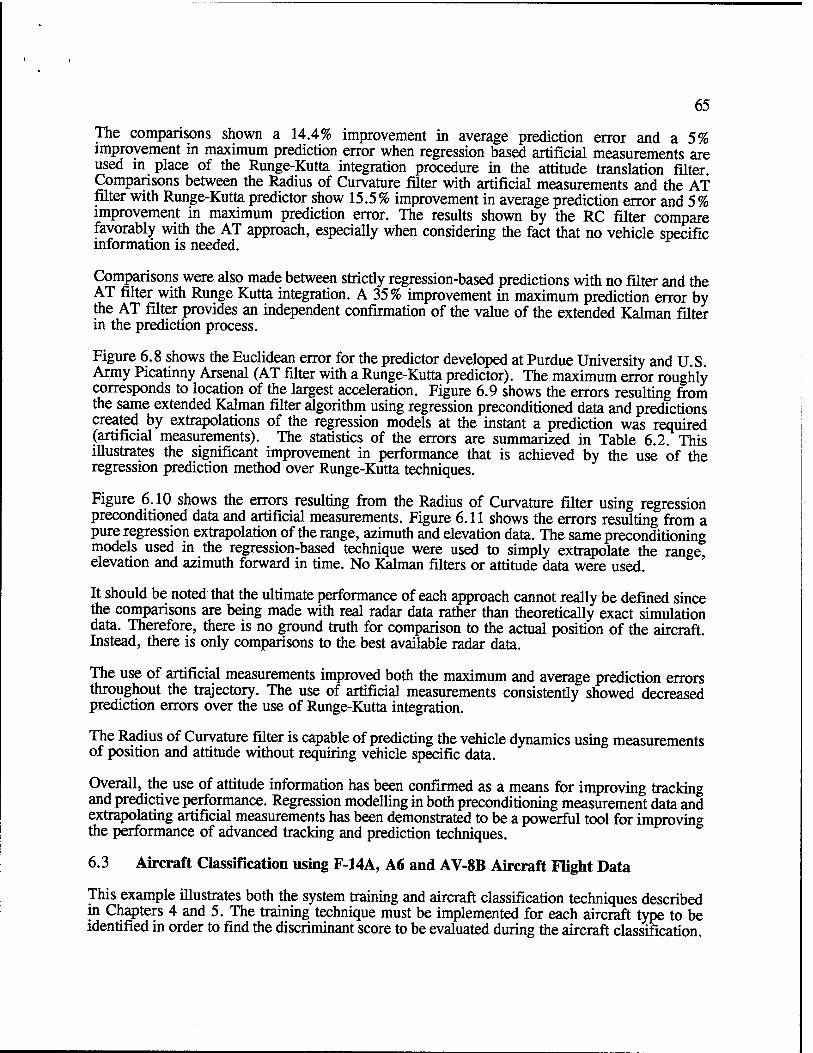
The comparisons shown a 14.4% improvement in average prediction error and a 5% improvement in maximum prediction error when regression based artificial measurements are used in place of the Runge-Kutta integration procedure in the attitude translation filter. Comparisons between the Radius of Curvature filter with artificial measurements and the AT filter with Runge-Kutta predictor show 15.5% improvement in average prediction error and 5% improvement in maximum prediction error. The results shown by the RC filter compare favorably with the AT approach, especially when considering the fact that no vehicle specific information is needed.
Comparisons were also made between strictly regression-based predictions with no filter and the AT filter with Runge Kutta integration. A 35% improvement in maximum prediction error by the AT filter provides an independent confirmation of the value of the extended Kaiman filter in the prediction process.
Figure 6.8 shows the Euclidean error for the predictor developed at Purdue University and U.S. Army Picatinny Arsenal (AT filter with a Runge-Kutta predictor). The maximum error roughly corresponds to location of the largest acceleration. Figure 6.9 shows the errors resulting from the same extended Kaiman filter algorithm using regression preconditioned data and predictions created by extrapolations of the regression models at the instant a prediction was required (artificial measurements). The statistics of the errors are summarized in Table 6.2. This illustrates the significant improvement in performance that is achieved by the use of the regression prediction method over Runge-Kutta techniques.
Figure 6.10 shows the errors resulting from the Radius of Curvature filter using regression preconditioned data and artificial measurements. Figure 6.11 shows the errors resulting from a pure regression extrapolation of the range, azimuth and elevation data. The same preconditioning models used in the regression-based technique were used to simply extrapolate the range, elevation and azimuth forward in time. No Kaiman filters or attitude data were used.
It should be noted that the ultimate performance of each approach cannot really be defined since the comparisons are being made with real radar data rather than theoretically exact simulation data. Therefore, there is no ground truth for comparison to the actual position of the aircraft. Instead, there is only comparisons to the best available radar data.
The use of artificial measurements improved both the maximum and average prediction errors throughout the trajectory. The use of artificial measurements consistently showed decreased prediction errors over the use of Runge-Kutta integration.
The Radius of Curvature filter is capable of predicting the vehicle dynamics using measurements of position and attitude without requiring vehicle specific data.
Overall, the use of attitude information has been confirmed as a means for improving tracking and predictive performance. Regression modelling in both preconditioning measurement data and extrapolating artificial measurements has been demonstrated to be a powerful tool for improving the performance of advanced tracking and prediction techniques.
6.3 Aircraft Classification using F-14A, A6 and AV-8B Aircraft Flight Data
This example illustrates both the system training and aircraft classification techniques described in Chapters 4 and 5. The training technique must be implemented for each aircraft type to be identified in order to find the discriminant score to be evaluated during the aircraft classification.
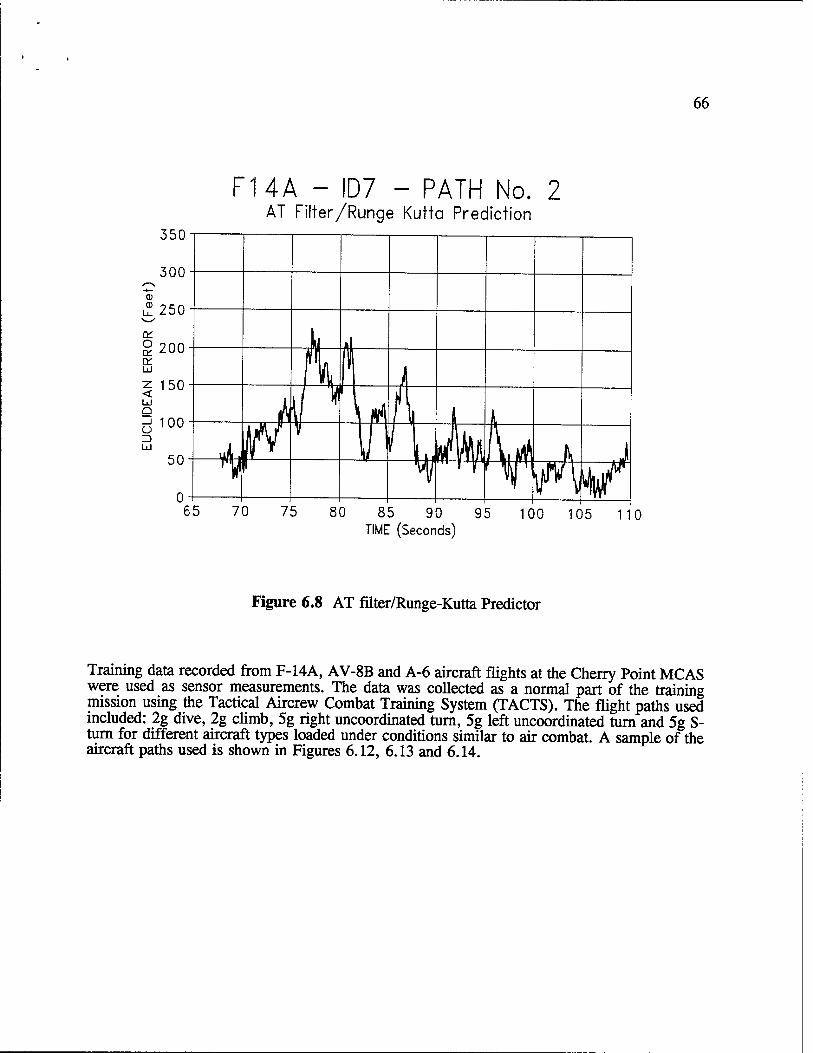
66
350
F14A - ID7 - PATH No. 2 AT Filter/Runge Kutta Prediction
90 95 TIME (Seconds)
110
Figure 6.8 AT filter/Runge-Kutta Predictor
Training data recorded from F-14A, AV-8B and A-6 aircraft flights at the Cherry Point MCAS were used as sensor measurements. The data was collected as a normal part of the training mission using the Tactical Aircrew Combat Training System (TACTS). The flight paths used included: 2g dive, 2g climb, 5g right uncoordinated turn, 5g left uncoordinated turn and 5g S- turn for different aircraft types loaded under conditions similar to air combat. A sample of the aircraft paths used is shown in Figures 6.12, 6.13 and 6.14.
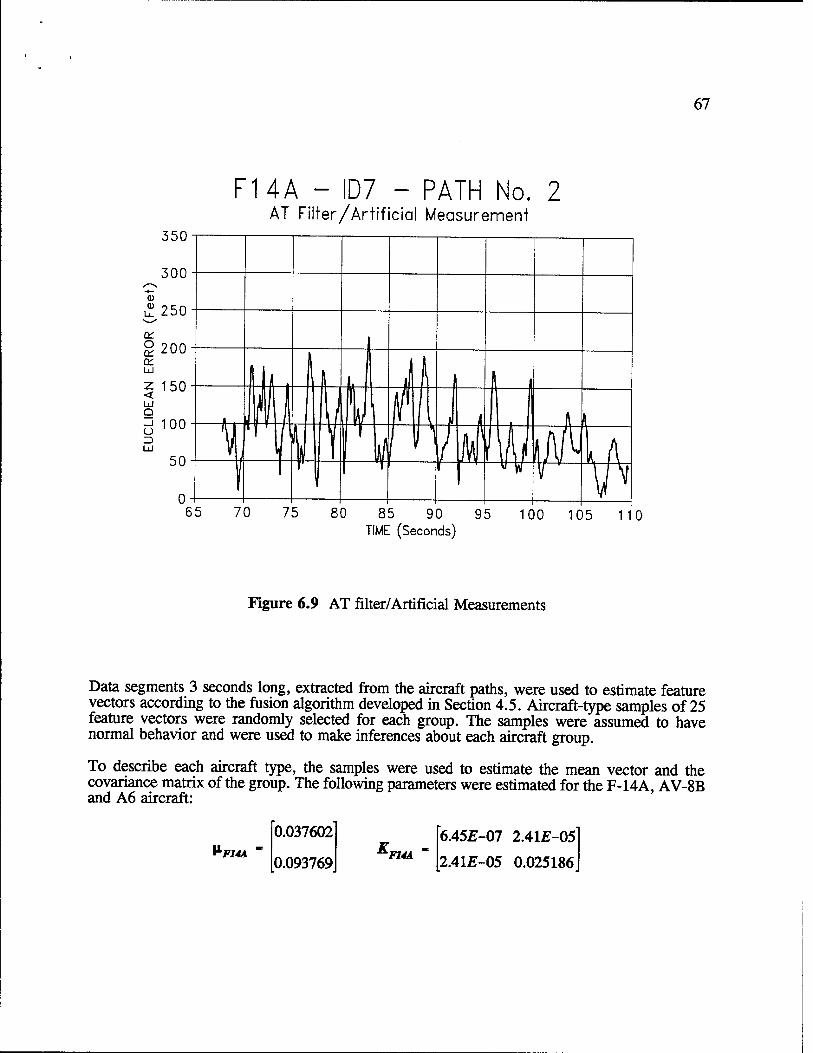
67
350
F14A - ID7 - PATH No. 2 AT Filter/Artificial Measurement
85 90 95 TIME (Seconds)
Figure 6.9 AT filter/Artificial Measurements
Data segments 3 seconds long, extracted from the aircraft paths, were used to estimate feature vectors according to the fusion algorithm developed in Section 4.5. Aircraft-type samples of 25 feature vectors were randomly selected for each group. The samples were assumed to have normal behavior and were used to make inferences about each aircraft group.
To describe each aircraft type, the samples were used to estimate the mean vector and the covariance matrix of the group. The following parameters were estimated for the F-14A, AV-8B and A6 aircraft:
^F14A
0.037602
0.093769 *-F14A
6A5E-01 2.41£-05
2.41E-05 0.025186
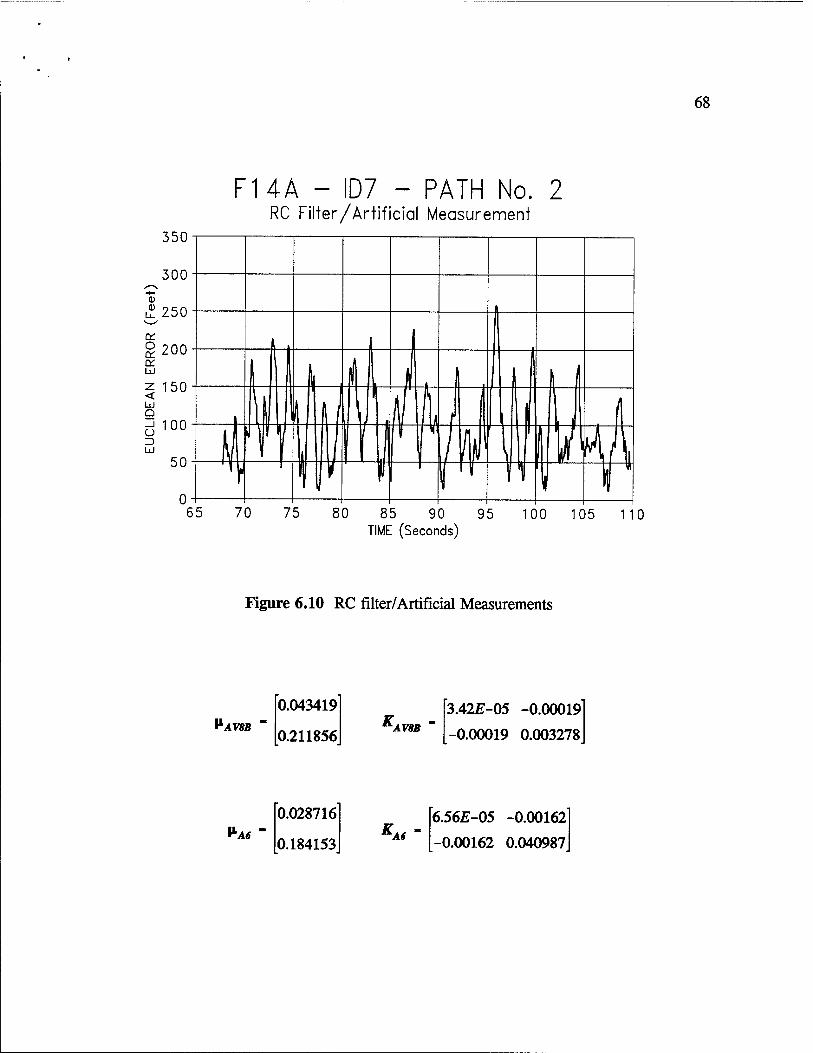
68
350
F14A - ID7 - PATH No. 2 RC Filter/Artificial Measurement
85 90 95 TIME (Seconds)
Figure 6.10 RC filter/Artificial Measurements
PAVSB
0.043419
0.211856 '■AVSB
3A2E-05 -0.00019
-0.00019 0.003278
*A*
0.028716
0.184153 M<f
6.56E-05 -0.00162
-0.00162 0.040987
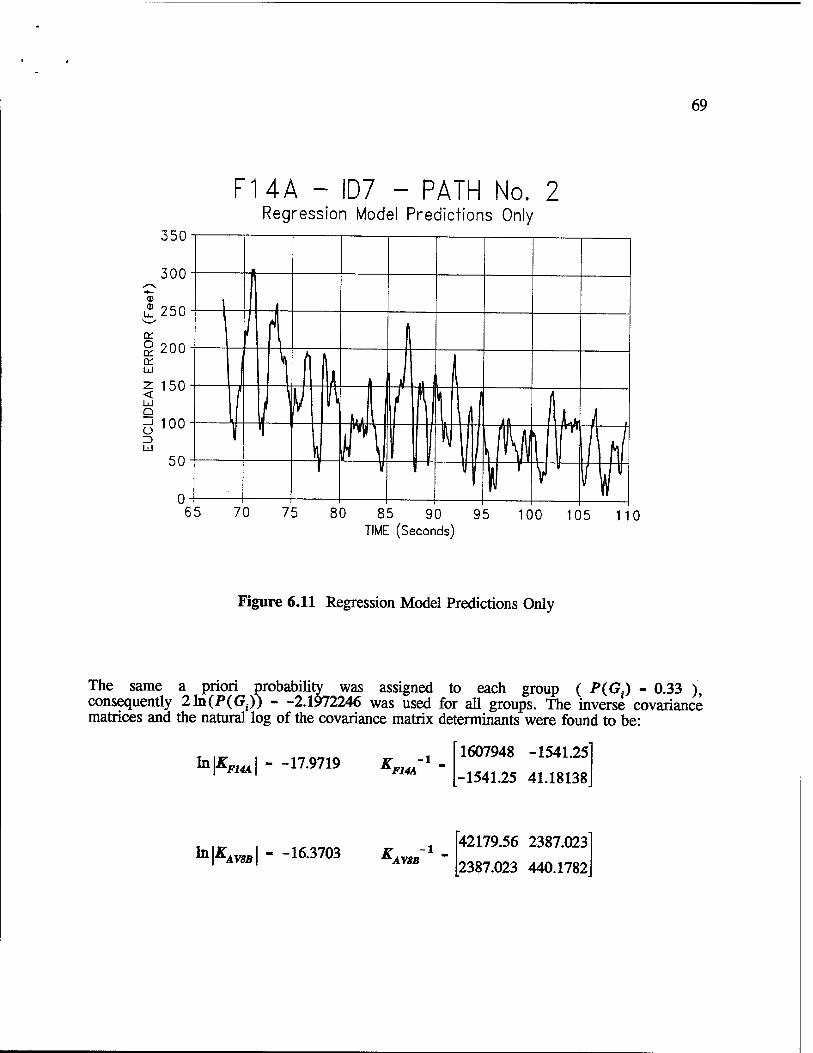
69
350
FUA - ID7 - PATH No. 2 Regression Model Predictions Only
80 85 90 95 TIME (Seconds)
100 105 110
Figure 6.11 Regression Model Predictions Only
The same a priori probability was assigned to each group ( P(G.) - 0.33 ), consequentiy 21n(P(Gl)) - -2.1972246 was used for all groups. The inverse covariance matrices and the natural log of the covariance matrix determinants were found to be:
^\KFUA\ ~ -17.9719 K -1
*F14A 1607948 -1541.25
-1541.25 41.18138
ln|£ AV8B -16.3703 K -1 ÄAV«B
42179.56 2387.023
2387.023 440.1782
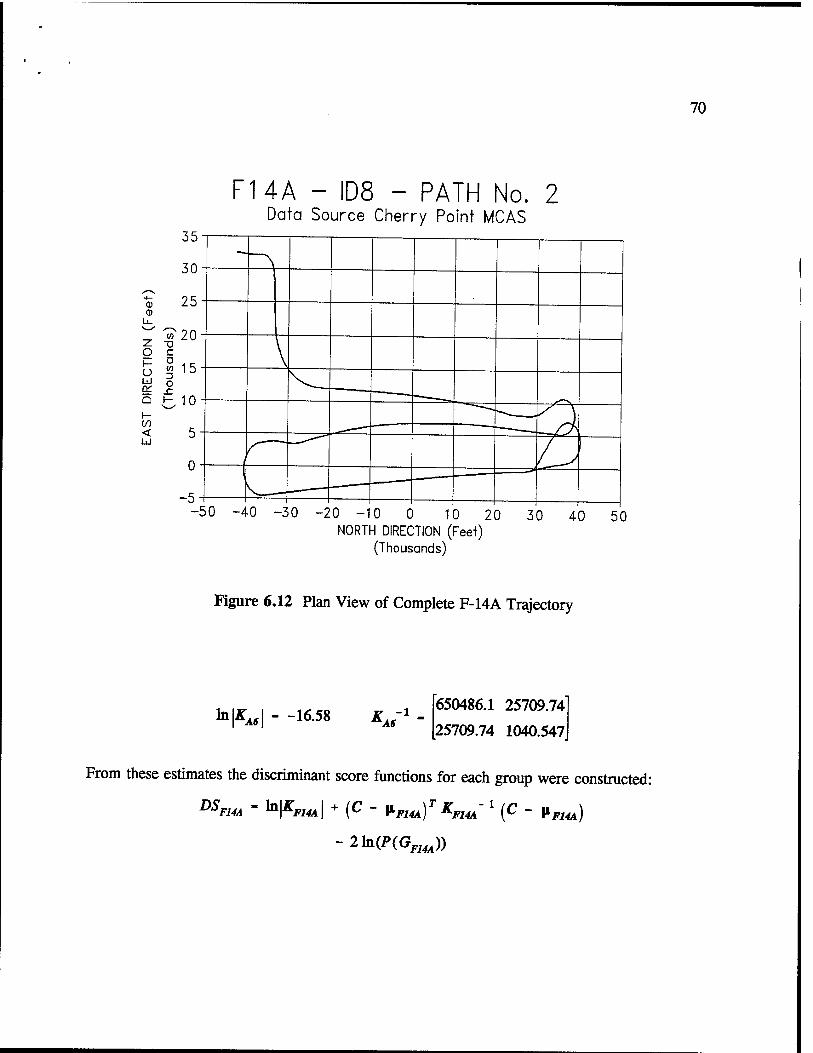
70
0) 0
O h- U LÜ 0£ Q
<
35
30
25
«20 C
§ 15 o A 10
-5
F14A - ID8 - PATH No. 2 Data Source Cherry Point MCAS
\ k
I /O I I
3,
-50 -40 -30 -20-10 0 10 20 NORTH DIRECTION (Feet)
(Thousands)
30 40 50
Figure 6.12 Plan View of Complete F-14A Trajectory
In If A6\ -16.58 Z*1 650486.1 25709.74
25709.74 1040.547
From these estimates the discriminant score functions for each group were constructed:
™F14A - k|*«4*| + (C " *FUA)T**U- ' (C ~ HF14A)
- 2hi(P(GF14A))
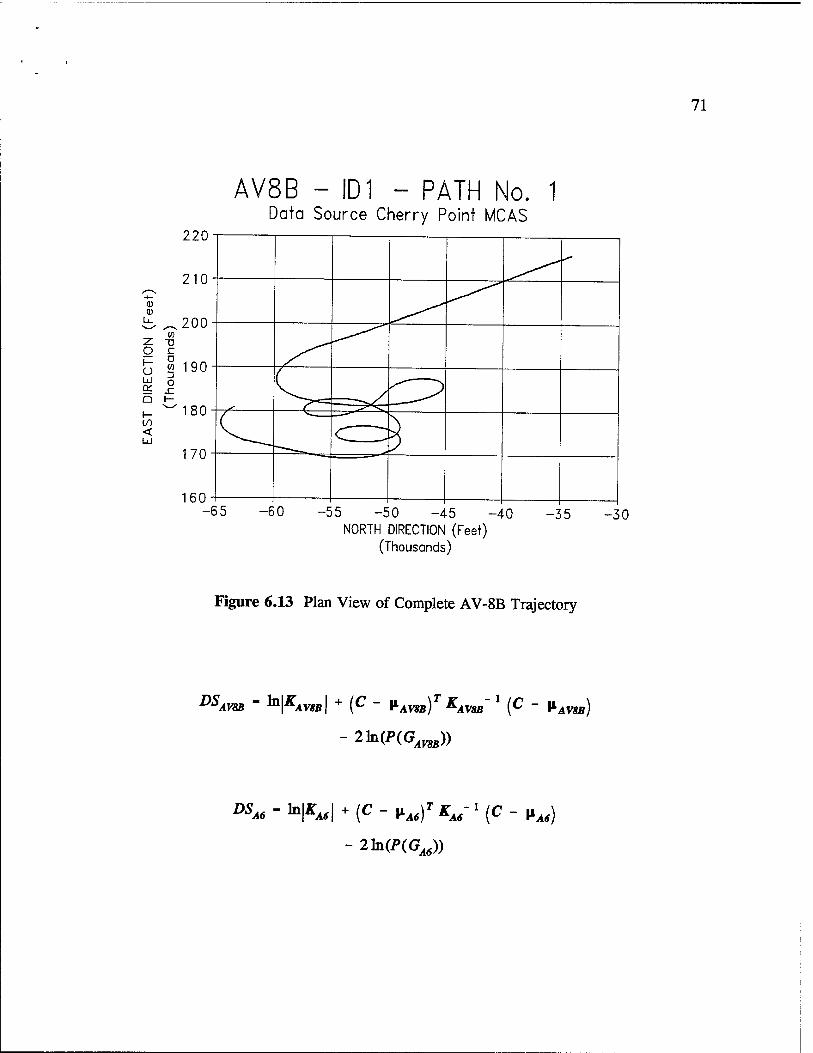
71
AV8B - ID1 - PATH No. 1 Data Source Cherry Point MCAS
220
-55 -50 -45 NORTH DIRECTION (Feet)
(Thousands)
0 -35 -30
Figure 6.13 Plan View of Complete AV-8B Trajectory
DSAV8B - In^l + (C - »AV8B)T KAV8B-» (C - vM)
~ 2hi(P(Gm))
™M - 1*1^1 + (C ~ »A6)T KA6- » (C - nA6)
- 2MP(GA6))
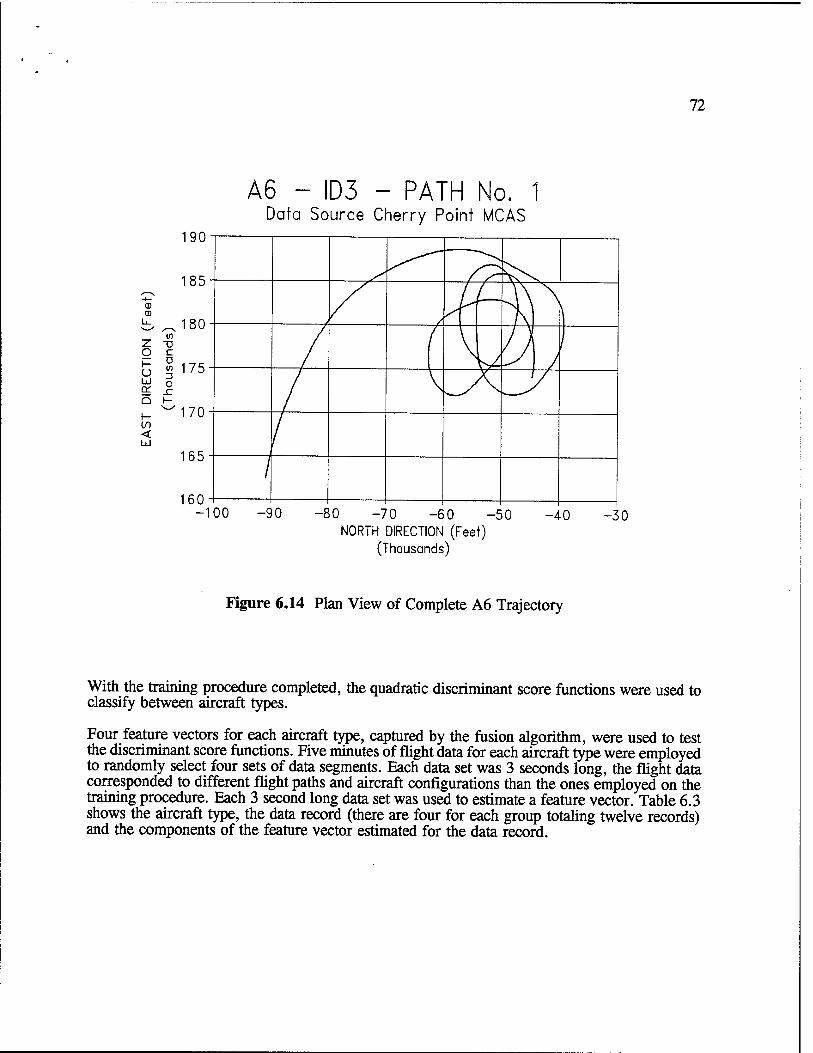
72
A6 - ID3 - PATH No. 1 Data Source Cherry Point MCAS
190
-100 -90 -80 -70 -60 -50 NORTH DIRECTION (Feet)
(Thousands)
-40 -30
Figure 6.14 Plan View of Complete A6 Trajectory
With the training procedure completed, classify between aircraft types.
the quadratic discriminant score functions were used to
Four feature vectors for each aircraft type, captured by the fusion algorithm, were used to test the discriminant score functions. Five minutes of flight data for each aircraft type were employed to randomly select four sets of data segments. Each data set was 3 seconds long, the flight data corresponded to different flight paths and aircraft configurations than the ones employed on the training procedure. Each 3 second long data set was used to estimate a feature vector. Table 6.3 shows the aircraft type, the data record (there are four for each group totaling twelve records) and the components of the feature vector estimated for the data record.
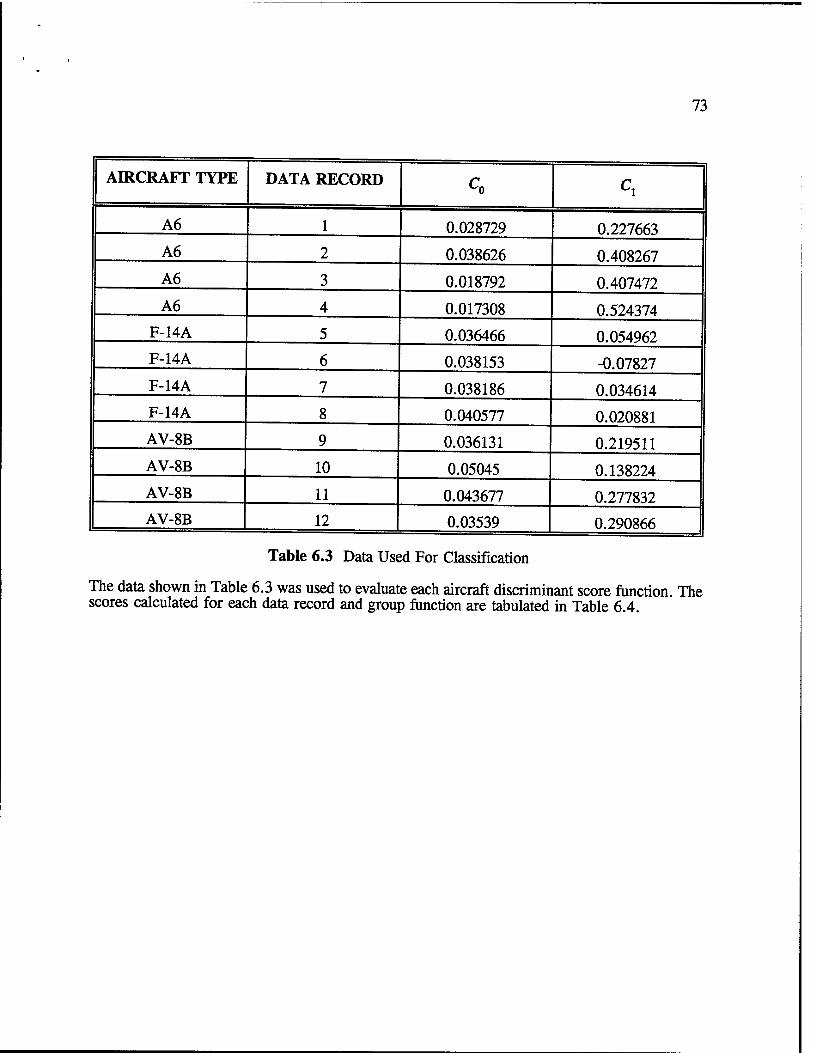
73
AIRCRAFT TYPE DATA RECORD C0 c, A6 1 0.028729 0.227663 A6 2 0.038626 0.408267
A6 3 0.018792 0.407472
A6 4 0.017308 0.524374 F-14A 5 0.036466 0.054962 F-14A 6 0.038153 -0.07827 F-14A 7 0.038186 0.034614 F-14A 8 0.040577 0.020881 AV-8B 9 0.036131 0.219511 AV-8B 10 0.05045 0.138224 AV-8B 11 0.043677 0.277832 AV-8B 12 0.03539 0.290866
Table 6.3 Data Used For Classification
The data shown in Table 6.3 was used to evaluate each aircraft discriminant score function. The scores calculated for each data record and group function are tabulated in Table 6.4.
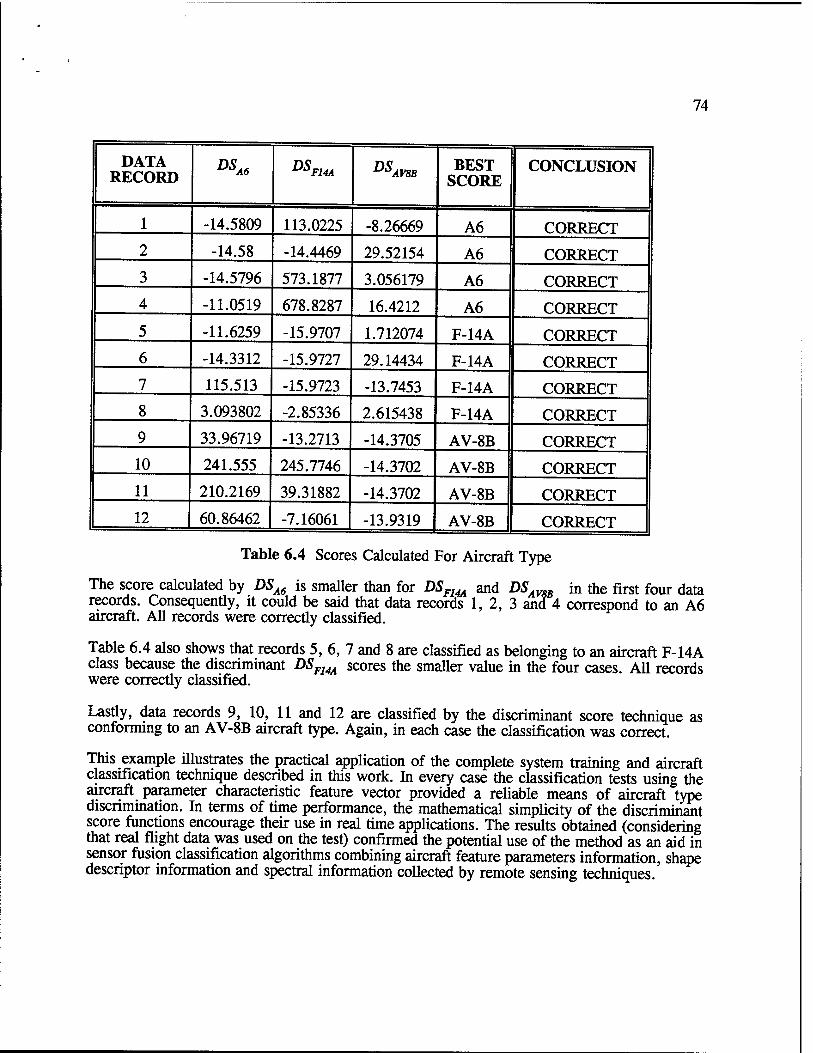
74
DATA RECORD ™A* DSF14A DSAV8B BEST
SCORE CONCLUSION
1 -14.5809 113.0225 -8.26669 A6 CORRECT 2 -14.58 -14.4469 29.52154 A6 CORRECT 3 -14.5796 573.1877 3.056179 A6 CORRECT 4 -11.0519 678.8287 16.4212 A6 CORRECT
5 -11.6259 -15.9707 1.712074 F-14A CORRECT 6 -14.3312 -15.9727 29.14434 F-14A CORRECT 7 115.513 -15.9723 -13.7453 F-14A CORRECT 8 3.093802 -2.85336 2.615438 F-14A CORRECT
9 33.96719 -13.2713 -14.3705 AV-8B CORRECT 10 241.555 245.7746 -14.3702 AV-8B CORRECT 11 210.2169 39.31882 -14.3702 AV-8B CORRECT
12 60.86462 -7.16061 -13.9319 AV-8B CORRECT
Table 6.4 Scores Calculated For Aircraft Type
The score calculated by DSA6 is smaller than for DSF14A and DSAV8B in the first four data records. Consequently, it could be said that data records 1, 2, 3 and 4 correspond to an A6 aircraft. All records were correctly classified.
Table 6.4 also shows that records 5, 6, 7 and 8 are classified as belonging to an aircraft F-14A class because the discriminant DSn4A scores the smaller value in the four cases. All records were correctly classified.
Lastly, data records 9, 10, 11 and 12 are classified by the discriminant score technique as conforming to an AV-8B aircraft type. Again, in each case the classification was correct.
This example illustrates the practical application of the complete system training and aircraft classification technique described in this work. In every case the classification tests using the aircraft parameter characteristic feature vector provided a reliable means of aircraft type discrimination. In terms of time performance, the mathematical simplicity of the discriminant score functions encourage their use in real time applications. The results obtained (considering that real flight data was used on the test) confirmed the potential use of the method as an aid in sensor fusion classification algorithms combining aircraft feature parameters information, shape descriptor information and spectral information collected by remote sensing techniques.
75
7. Conclusions
A new tracking algorithm based on a radius of curvature estimator was developed under this work. This approach has a significant advantage over the existing attitude/translation tracker. Both vehicle position and attitude are used to estimate vehicle dynamics without requiring vehicle specific data. Therefore, it enjoys the benefits of a better means of estimating acceleration while not requiring an extensive system description.
Tests performed on the radius of curvature model have been encouraging. The F-14A data was used to test the new technique. The identical trajectory applied in the development of the regression-based attitude/translation model was used to test this approach. Results compare favorably with the attitude/translation approach, especially when considering the fact that no vehicle specific information is needed.
Regression modelling of trajectory measurement data was examined as a means for improving the performance of aircraft trajectory tracking and prediction. Regression models were used for adaptively removing measurement noise from trajectory observations and extrapolating trajectory measurements. A comparative study was done between two models of aircraft dynamics used in an extended Kaiman filter: an attitude/translation model that uses vehicle specific inertial characteristics and an attitude/translation model based on the radius of curvature estimator. Adaptive regression models were used for measurement accuracy enhancement. Comparisons were also made between errors resulting from position and attitude predictions using Runge- Kutta integration and extrapolated regression models.
Two aircraft characteristic parameters based on the dynamics, geometry and aerodynamics of the aircraft were developed in this research. Remote measurements from F-14A, AV-8B and A6 flights were used to estimate the parameters and demonstrate their use in target recognition. Classification tests performed with actual data showed the potential use of the technique. The use of the aircraft parameter characteristic feature vector provides a consistently reliable means of aircraft type discrimination and the mathematical simplicity of the classification algorithm encouraging its use in real time applications.
A unique aspect of this study was the use of actual trajectory data. The study was conducted using actual position and attitude trajectory data for F-14A, AV-8B and A6 aircraft acquired during training flights. The data was supplied through the Navy's TACTS (Tactical Aircrew Training System) at the Cherry Point Marine Corps Air Station.
The following results can be summarized from the performance tests:
1. The new tracking algorithm based on a radius of curvature estimator has a significant advantage over the existing attitude/translation tracker. Both vehicle position and attitude are used to estimate vehicle dynamics without requiring vehicle specific data.
2. Measuring and modelling the attitude of the aircraft produces a significant improvement in both tracking and prediction accuracy.
The use of vehicle specific inertia in an attitude/translation tracker has negligible effects on the improvement of tracking and prediction performance. Only limited aerodynamic and mass data are needed to achieve the performance improvements associated with trackers that include attitude information.
76
4. Preconditioning measurement data using adaptive regression modelling techniques has been shown to offer a substantial improvement in tracking and prediction performance. This approach requires no additional hardware in a real tracking environment and imposed limited computational overhead, yet is offers a significant enhancement in tracking and prediction performance.
5. Artificial measurements extrapolated from regression models of the measurement data offer a means of improving prediction accuracy over numerical integration of the state equations. This result suggests that regression modelling can capture the underlying dynamics of the measurements and infuse that additional information into the filter to improve predictive performance.
6. The results obtained with the target recognition technique based on dynamics, geometry and aerodynamics of the aircraft confirmed the potential use of the method. Furthermore, it showed that it could be used as an aid in sensor fusion classification algorithms combining aircraft feature parameters information, shape descriptor information and spectral information collected by remote sensing techniques.
61.2 Impact of the Research
This work represents a means for improving the currently available methods of aircraft trajectory prediction and target recognition by the application of regression dynamics methods. There are significant benefits to be accrued by the implementation of this technique.
o Improved lead angle prediction and better target information in fire control systems.
o Enhanced capability for identifying friend or foe (IFF) by accurate trajectory estimation and target parameter estimation.
o Technical superiority for future fire control systems. The method has the potential to be integrated into the ballistic equation used for firing solutions to further improve the Probability of Hit in a complex tracking problem.
61.3 Possible Applications 61.3.1 Prediction (Lead Angle)
Target motion during the time of flight of the projectile is one of the factors to be used on the computation of the lead angle. Future target position can be expressed as a series of vectors involving present range, present target velocity integrated over the time of flight and the double integral of target acceleration over the time of flight.
Conventional trackers have used constant velocity or constant acceleration models to simplify the lead angle computation. This new approach can yield increases in the accuracy of lead angle computation by providing a new way to predict future target position.
Translation measurements from radar data (range, azimuth and elevation) and their associated rates are used in conjunction with aircraft attitude data (roll, pitch and yaw angles) to build target data regression models. These models carry useful target dynamic information that can predict (during the lead time) how the target is going to behave in the future. 61.3.2 Tracking
77
AU fire control systems must receive target information, as well as the direction and motion of the line of sight as the principal system inputs [89]. The orientation of the line of sight on the fire control equipment must change continuously in order to follow the target. Consequently a drive system is required in every fire control system. The drive system is used to orient the line of sight through electromechanical means.
A potentially more accurate tracking system can be implemented by applying the improved target aircraft dynamic model in combination with the target data regression modeling technique. The method could improve the control of the fire control drive system by applying predicted measurement data as input to the translation/attitude model in order to predict line of sight orientation. 61.3.3 Identifying Friend or Foe (IFF)
The observed trajectory offers a means of estimating the dynamic characteristics as well as geometry and aerodynamics of the aircraft. For an aircraft, located beyond the range of optical devices, the approach offers a unique means of accomplishing parameter estimation and providing a method to identify the type of vehicle being tracked.
61.3.4 Air Traffic Control (ATC)
One of the important applications of the target tracking-trajectory estimation problem is the tracking of commercial aircraft for air traffic control and collision avoidance.
The improved attitude-translation tracker could be employed for the purpose of safely controlling air traffic in route and in vicinity of airports. The potential increases in tracking and prediction accuracy provided by the new tracker could be a useful aid in controlling aircraft traffic at large airports.
Known stability and control derivatives in the dynamic model of the tracked aircraft in addition to an augmented measurement vector (tracker knowledge of surface and control deflections) could define a better performance tracking system for guiding aircraft to safe landing and avoiding collisions. 61.4 Significant Advances
This work represents a novel addition to the work done on advanced trackers at the U.S. Army Armament Research Development and Engineering Center (ARDEC), Picatinny Arsenai N J and Purdue University [1 - 9]. These advanced trackers used both translation and attitude data to improve the accuracy of conventional trackers. The new method represents a significant advance over the previous investigations by considering an aircraft dynamic model without use of aircraft specific parameters and improving the aircraft trajectory prediction by the application of regression dynamics methods. The ultimate goal of this work was to improve the ability to track and predict the position of an aircraft using radar measured position and image estimated attitude data.
In this approach, regression models of translational and attitude measurements were used to improve the estimation of trajectories and prediction of measurement data during the lead time interval. In addition, observed trajectory can offer a means of estimating the characteristic parameters necessary to implement the aircraft recognition. The integration of the improved aircraft model, parameter identification and regression based measurement models make this approach attractive for the estimation and prediction of target
78
position during the lead interval.
8. Recommendations
This study provides some evidence suggesting a number of ways of improving the tracking and prediction performance of advanced non-linear tracking filters. Since these approaches use extended Kaiman filters, they are non-optimal in a theoretical sense. Therefore, there is a potential for performance improvement. The empirical evidence in this work does not offer proof of improved performance of trackers by using preconditioned data and artificial measurements. Rather, these results demonstrate the potential of these techniques. More investigation is warranted. The following studies are recommended:
1. Perform comparative studies of filter performance using simulated trajectory data. This data is not subject to the limitations of actual radar data.
2. Use shorter range (and hence, more reliable) radar data in a suite of tests. Data should be used with ranges less than one mile to offer a comparison to the extended range data used in this test.
3. New approaches should be explored in an effort to augment the aircraft characteristic feature vector with the overall goal of improving the discrimination between aircraft classes.
4. The real-time operation of the trajectory tracking and prediction algorithm must be investigated. Because nine linear Kaiman Filters are used by the algorithm, parallel processing techniques appear to be an attractive means of implementing the algorithms and data processing strategies described in this work.
5. Investigate a new tracking algorithm that uses control surface (aileron, elevator and rudder) deflections as a leading indicator of aircraft trajectory. The new approach could estimate the tendency of the aircraft to rotate and change the orientation of the lift vector, thus providing an earlier indicator of future aircraft trajectory changes.
6. Perform a sensitivity study to find the influence that Euler angles measurement noise have on the overall performance of the filter.
7. The target trajectory tracking and prediction methods presented here should be implemented, in at least an observatory fashion, on an actual training aircraft to evaluate the utility of the procedure in the air-field environment.
6.6 Extension to Other Fields
The regression-based tracking algorithm proposed in this work may be applied to other tracking problems. The tracking of helicopters and ground vehicles share many of the same problems as fixed wing aircraft tracking.
The new reconnaissance RAH-66 Comanche helicopters [12] will be armed with smart weapons directed by an electro-optical target acquisition/designation system (EOTADS), providing greater accuracy in identifying, prioritizing, and discriminating between real and false targets. The improved attitude-translation tracker developed in this work, could be modified to potentially
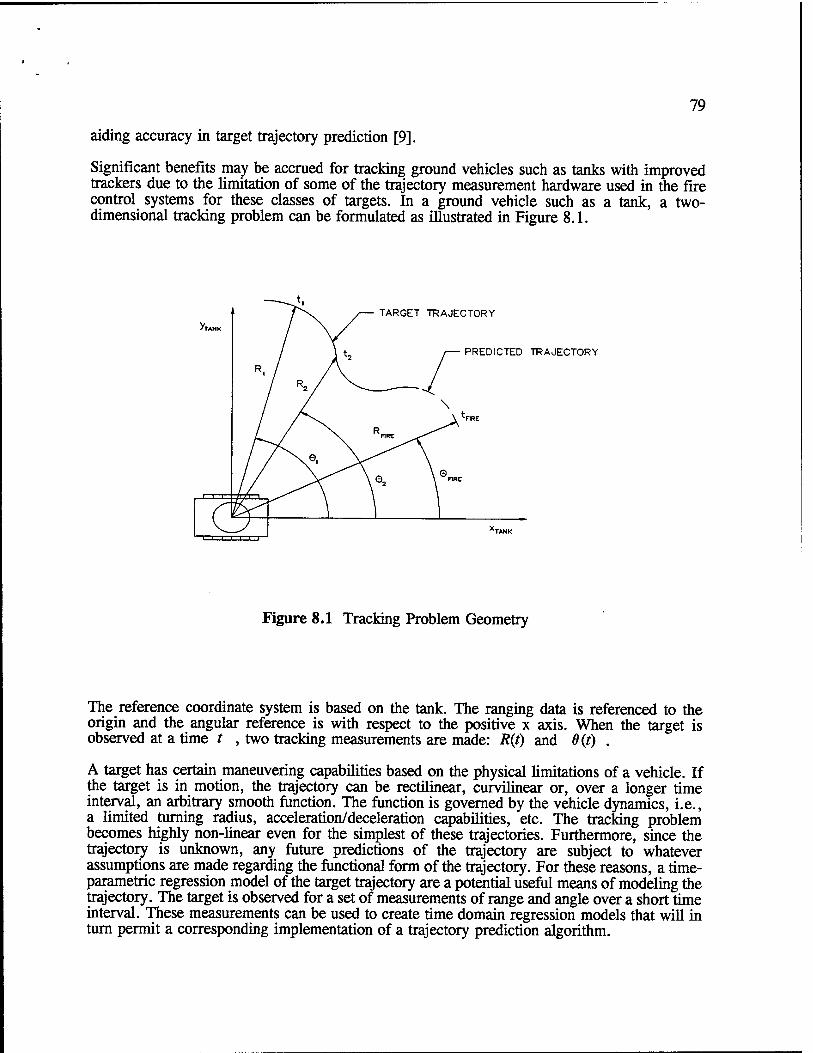
79
aiding accuracy in target trajectory prediction [9].
Significant benefits may be accrued for tracking ground vehicles such as tanks with improved trackers due to the limitation of some of the trajectory measurement hardware used in the fire control systems for these classes of targets. In a ground vehicle such as a tank, a two- dimensional tracking problem can be formulated as illustrated in Figure 8.1.
—o. . — TARGET TRAJECTORY
^TANK
i—r-*i— Jyv i
/ y
Atz
R
HRE ^
V2
\ \ *F1RE
\ © \ FIRE
XTANK 1 1—1,
Figure 8.1 Tracking Problem Geometry
The reference coordinate system is based on the tank. The ranging data is referenced to the origin and the angular reference is with respect to the positive x axis. When the target is observed at a time / , two tracking measurements are made: R(t) and 0(f) .
A target has certain maneuvering capabilities based on the physical limitations of a vehicle. If the target is in motion, the trajectory can be rectilinear, curvilinear or, over a longer time interval, an arbitrary smooth function. The function is governed by the vehicle dynamics, i.e., a limited turning radius, acceleration/deceleration capabilities, etc. The tracking problem becomes highly non-linear even for the simplest of these trajectories. Furthermore, since the trajectory is unknown, any future predictions of the trajectory are subject to whatever assumptions are made regarding the functional form of the trajectory. For these reasons, a time- parametric regression model of the target trajectory are a potential useful means of modeling the trajectory. The target is observed for a set of measurements of range and angle over a short time interval. These measurements can be used to create time domain regression models that will in turn permit a corresponding implementation of a trajectory prediction algorithm.

80
148
81
Bibliography
[1]
[2]
[3]
[4]
[5]
[6]
Andrisani, D and Kuhl, F.P., "Attitude Based Trackers for Airplane, Helicopter and Ground Targets," Remote Sensing Reviews, Vol. 6, No. 1, 1992.
Andrisani, D Kim E.T., and Kühl, F.P., "Tracking Accuracy Improvement Using Noisy Target Orientation Measurements," Remote Sensing Reviews Vol o, No. 1, 1992.
Andrisani, D. Tao, X., and Kühl, F.P., "A Comparison of Aircraft Trajectory Vof X6 No 1 ^92 TrackÜlg Using Simulated Data>" Remote Sensing Reviews,
Andrisani, D., and Kuhl, F.P., "Target Tracking Using Image Data," Remote Sensing Reviews, Vol. 6, No. 1, 1992.
Andrisani, D., FJ>. Kuhl and D. Gleason, "A Nonlinear Tracker Using Attitude M^s^en2?nts' ]?EE Transactions on Aerospace and Electronic Systems, Vol AES-22, No. 5, September 1986.
6nfifani-' $/' Gle^°nx'TD-' md Kuh1' RP> "A Tracker for Maneuvering Vehicles, Wescon/85, November 19-21, 1985, San Francisco, CA.
[7] Andrisani D., "Aircraft Trackers Using Attitude Measurements, Interim Report for the Period August 1985 - April 1986," School of Aeronautics and Astronautics, Purdue University, West Lafayette, IN, 1986.
[8] ^risani, D "New Linear Tracking Filters," Proceedings of the 1985 American Control Conference, June 19-21 1985.
[9] Andrisani, D., Kim, E.T., Schierman, J., and F.P. Kuhl, "A Nonlinear Helicopter Tracker Usmg Attitude Measurements," IEEE Transactions on Aerospace and Electronic Systems, Vol. AES-27, No. 1, January 1991.
[10] Andrisani D. Tenorio, M.F., Lu, J. and Kuhl, F., "A Hierarchical Target -EFSS^iSS* LnS,?ft;"oAmerican Control Conference, San Diego, CA, May 23-25, 1990, pp. 1004-1008. J
[11] ^??ers°n' T- W., An Introduction to Multivariate Statistical Analysis, John Wiley & Sons, New York, 1958. y
[12] Ashley, S., "Comanche: Tomorrow's High-Tech Helicopter," Mechanical Engineering, June 1991.
[13] ^y'.ga and KarPtos, W., Hybrid Computation, John Wiley and Sons, New
[14] Berg, R.F., "Estimation and Prediction for Maneuvering Targets " IEEE Transactions on Automatic Control, AC-28.3, March 1983. '
82
[15] Bierman, G.J., Factorization Methods for Discrete Sequential Estimation Academic Press, New York, 1977.
[16] Blakelock, J.H., Automatic Control of Aircraft and Missiles, Second Edition John Wüey & Sons, Inc., 1991.
[17] Breschncider, S., Carbone, R., and Longini, R., "An Adaptive Approach to Time-Series Forecasting," Decision Sciences, Vol. 10, No. 2, April 1978.
[18] Carbone, R., and Longini, R., "A Feedback Model For Automated real Estate Assessment, Management Science, Vol. 24, No. 3, November 1977.
[19] Cattam, L., Eagle, P., Zhuo, L., Xin, L., and Kühl, F., "Preconditioning Aircraft Trajectory Performance Based on Regression Models," American Congress on Surveying and Mapping, New Orleans, L.A., February 1993.
[20] $attam, L-» Eagle, p-» Zhuo, L., and Xin, L., "Aircraft Trajectory Tracking and Prediction, Final Report," University of Detroit Mercy, Mechanical Engineering Department, September 1992. Prepared for AMCCOM-ARDEC Picatinny Arsenal, New Jersey, 51 pages.
[21] Chang, C.B. and Tabaczynski J.A., "Application of State Estimation to Target Tracking, IEEE Transactions on Automatic Control, Vol. AC-29 No 2 February 1984. ' * '
[22] Chang, C.B., Whiting, R.H. and Athans, M., "On the State and Parameter Estimation for Maneuvering Reentry Vehicles," IEEE Transactions on Automatic control, Vol AC-22, February 1977.
[23] Clark, B. L., "The Development of an Adaptive Kaiman Target Tracking Filter " Proc. AIAA Guidance Control Conf., August 1976.
[24] Colwell, R. N. (ed.), Manual of Remote Sensing. Second Edition. Falls Church VA: American Society of Photogrammetry, 1983. '
[25] Cover, T., "Recent Books on Pattern Recognition," IEEE Transactions on Iformation Theory, Vol. IT-19, November 1973.
[26] Craig J., Introduction to Robotics: Mechanics and Control, Addison-Weslev Publishing Company, Inc., 1986.
[27] nj^x?'/"Yo'« Ubin' WX-' Radar Detection> Prentice-Hall, Inc., Englewood i—iiits, JN.J., lyoo.
[28] S^TSJ^' ??•' Personal communication, Naval Air Systems Command (NAVAIR), Washington, March 1992.
[29] 2™^~2?xnle/' M-' Personal communication, Naval Air Systems Command (NAVAIR), Washmgton, May 1993.
83
[30] Duda, R., and Hart, P., Pattern Classification and Scene Analysis, John Wiley & Sons, New York, 1972.
[31] Eagle, Paul and Tabrizi L.H., "State Model Estimation for Kaiman Filter Application," Journal of Industrial Mathematics, (Accepted for Publication).
[32] Eagle, Paul and Tabrizi L.H., "Regression Modelling Technique for State Model Estimation and Kaiman Filter Application", Proceedings of the 1990 IEEE Conference on Systems, Man and Cybernetics, 1990.
[33] Eagle, Paul and Tabrizi L.H., "State Model Estimation for Kaiman Filter Applications Using Regression Techniques", Proceedings of the 29th IEEE Conference on Decision and Control, 1990.
[34] Eagle, Paul and Tabrizi L.H., "Decision Theoretic Methods Applied to Fault Detection Using Features from State Models", Proceedings of the 1989 IEEE American Control Conference, 1989.
[35] Eagle, Paul and Tabrizi L.H., "Application of Kaiman Filters to Signature Monitoring Using Empirical Process Models", Proceedings of the Third International Conference on CAD/CAM and Robotics, 1988.
[36] ERIM, Proceedings of the 3rd National Symposium on Sensor Fusion, Ann Arbor, MI: ERIM, 1990.
[37] Finck, R.D., USAF Stability and Control Datcom, Flight Control Division, Air Force Flight Dynamics Laboratory, Wright-Patterson Air Force Base, Ohio, 1978.
[38] Fitzgerald, R., "Simple Tracking Filters: Closed-Form Solutions", IEEE Transactions on Aerospace and Electronic Systems, Vol. AES-17, No. 6 November 1981.
[39] Fu, K. S., "Recent Developments in Pattern Recognition," IEEE Transactions on Computers, Vol. C-29, No. 10, October 1980.
[40] Fu, K. S., "Syntactic Pattern Recognition Applications," New York, Springer,
[41] Fu, K. S., "Syntactic Methods in Pattern Recognition," New York, Academic Press, 1974.
[42] Fukunaga, K., Introduction to Statistical Pattern Recognition, Academic Press New York, 1972.
[43] Gelb, A., Applied Optimal Estimation, Cambridge, Mass., M.l.T. Press, 1974.
[44] Gleason D. and Andrisani D., "Discrete Error Covariance Analysis for Tracking Filters," Proceedings of the Twenty First Annual Asilomar Conference on Signals Systems and Computers, pp. 344-350, November 2-4, 1987, Pacific Grove, CA.
84
[45] Gleason D. and Andrisani D., "Error Covariance Analysis for Tracking Filters," Proceedings of the 1986 National Aerospace and Electronics Conference (NAECON), pp. 299-301, May 1986.
[46] Goel, N. S. (ed.), Remote Sensing Reviews. Harwood Academic Publishers, Vol. 6, No. 1-4, 1992.
[47] Goel, N. S., "Models of Vegetation Canopy Reflectance and their Use in Estimation of Biophysical Parameters from Reflectance Data." Remote Sensing Reviews, Vol 4, No. 1, 1988.
[48] Gorman, J.W., and Kühl, F., "Partial Shape Recognition as an Optimization Problem," Remote Sensing Reviews, Vol. 6, No. 1, 1992.
[49] Greenwood, D., Principles of Dynamics, Second Edition, Prentice-Hall, Inc., New Jersey, 1988.
[50] Grove, R., Bowles, R., and Mayhew, S., "A Procedure For Estimating Stability and Control Parameters from Flight Test Data by Using Maximum Likehood Methods Employing a Real-Time Digital System," NASA TN D-6735, NASA Langley Research Center, Hampton, Virginia, May 1972.
[51] Hand, D., Discrimination & Classification, John Wiley & Sons, New York, 1981.
[52] Harney, R. C. (ed.), Sensor Fusion III, Proc. SPIE. Bellingham , WA: SPIE, 1990.
[53] Huang, T., Computer Vision and Image Processing, Vol. 3. JAI Press Inc., London, 1988.
[54] Hutchins, R.S., and Sworder, D.D., "Image Fusion Algorithms for Tracking Maneuvering Targets," AIAA Journal of Guidance, Control, and Dynamics, Vol. 15, 1992.
[55] James, M., Classification Algorithms, John Wiley & Sons, New York, 1985.
[56] Kaiman, R.E., "A New Approach to Linear Filtering and Prediction Problems," Trans. ASME J. Basic Eng., Vol. 82, 1960.
[57] Kaiman, R.E., and Bucy, R.S., "New Results in Linear Filtering and Prediction Theory," Trans. ASME J. Basic Eng., Vol. 83, 1961.
[58] Kendrick, J., "Estimation of Aircraft Target Motion Using Pattern Recognition Orientation Measurements," Ph.D. Dissertation, Air Force Institute of Technology, 1978.
[59] Kendrick, J., Maybeck, P., Reid, J., "Estimation of Aircraft Target Motion Using Orientation Measurements," IEEE Transactions on Aerospace and Electronic Systems, Vol AES-17, No. 2, March 1981.
85
[60] Kirsten, P., and Ash, L., "A Comparison of Two Methods of Extracting Stability Derivatives from Flight Test Data," AFFTC-TD-73-5, Air force Flight Test Center, Edwards Air Force Base, May 1974.
[61] Lefas, C.C., "Using Roll-Angle Measurements to Track Aircraft Maneuvers," IEEE Transactions on Aerospace and Electronic Systems Vol. AES-20, No. 6, November 1984.
[62] LeMay, J., Kaiman Filtering: A National Short Course, Vol. I, St. Joseph Sciences, Inc., 1984.
[63] Lewis, F., Optimal Estimation, John Wiley & Sons, New York, 1986.
[64] Lloyd, J. M., Thermal Imaging Systems, New York, Plenum Press, 1979.
[65] Maine, R., and Illif, K., "Formulation and Implementation of a Practical Algorithm for Parameter Estimation with Process and Measurement Noise," NASA Dryden Flight research center Edwards, California, 1979.
[66] Mendenhall, W., and McClave, J.T., A Second Course in Business Statistics: Regression Analysis, San Francisco, Dellen, 1981.
[67] Park, G., "Parameter Identification Technology used in Determining In-Flight Airload Parameters," J. Aircraft, Vol. 14, No. 3, March 1977.
[68] Pavlidis, T., "Structural Pattern Recognition," New York, Springer-Verlag, 1977.
[69] Pippett, B., Personal communication, TACTS Det., Loral Aerospace Services, November 1991.
[70] Pippett, B., Personal communication, TACTS Det., Loral Aerospace Services, January 1992.
[71] Pippett, B., Personal communication, TACTS Det., Loral Aerospace Services, February 1992.
[72] Ridenour, L., Radar System Engineering, McGraw-Hill Book Company, Inc., New York and London, 1947.
[73] Roskman, J., "On Some Linear and Nonlinear Stability and Response Characteristics of Rigid Airplanes and a New Method to Integrate Nonlinear Ordinary Differential Equations," Ph.D. Dissertation, University of Washington,
[74] Roskman, J., Airplane Flight Dynamics and Automatic Control, Part 1, Roskman Aviation and Engineering Corp., The University of Kansas, Lawrence, K.S., 1979.
[75] Roskman, J., Airplane Flight Dynamics and Automatic Control, Part 2, Roskman
86
Aviation and Engineering Corp., The University of Kansas, Lawrence, K.S.,
[76] Seckel, E., Stability and Control of Airplanes and Helicopters, Academic Press New York, 1964. '
[77] Singer, R., "Estimating Optimal Tracking Filter performance for Manned Maneuvering Targets," IEEE Transactions on Aerospace and Electronic Systems Vol. AES-6, No. 4, July 1970.
[78] Sklansky, J. ,and Davison, G., "Recognizing Three-Dimensional Objects By Their Silhouettes," AGARD Conf. Proc., (No. 94 on Artificial Intelligence), May 1971.
[79] Skolnik, M., Introduction to Radar Systems, Second Edition, McGraw-Hill Book Company, 1980.
[80] Stark, H., and Woods J., "Probability, Random Processes, and Estimation Theory for Engineers," Prentice-Hall, Englewood Cliffs, New Jersey, 1986.
[81] Stepner, D., and Mehra, R., "Identification of M2/F3 Stability and Control Derivatives from Data Containing Gust Effects," Systems Control Inc., Palo Alto, California, 1974.
[82] Stevens, L.B., Lewis, F.L., Aircraft Control and Simulation, John Wiley & Sons, Inc., 1992.
[83] Strait, P., "A First Course in Probability and Statistics with Applications," Harcourt Brace Jovanovich Publishers Inc., New York, 1983.
[84] Symon, K., Mechanics, Third Edition, Addison-Wesley, 1971.
[85] Tatsuoka, M., Multivariate Analysis, John Wiley & Sons, New York, 1974.
[86] Taylor, R.W., Reeves, A.P., and Kühl, F.P., "Methods for Identifying Objects Class, Type, and Orientation in the Presence of Uncertainty," Remote Sensine Reviews, Vol. 6, No. 1, 1992.
[87] Ulaby, F. T., Moore, R. K. and Fung, A. K., Microwave Remote Sensing. Norwood, MA, Artech House, 1981.
[88] Wallace, T., and Mitchell, O., "Analysis of Three Dimensional Movement Using Fourier Descriptors," IEEE Transactions on Pattern Analysis and Machine Intelligence, PAMI-2(6), November 1980.
[89] Wrigley, W., Hovorka, J., Fire Control Principles, First Edition, McGraw-Hill Book Company, 1959.
[90] Young, T.Y., and Calvert, T.W., Classification Estimation, and Pattern Recognition, New York, Elsevier Publishing Co., 1974.
[91] Zen, C, and Shin-Ying, H., "Computer Vision for Robust 3D Aircraft
87
Recognition with fast Library Search," Pattern recognition, Vol. 24, No. 4, 1991.
[92] —, Principles of Radar, Second Edition, McGraw-Hill Book Company, Inc New York and London, 1946. V y '
Distribution 5Q Distribution List
Commander ARDEC U.S. Army AMCCOM ATTN: SMCAR-IMI-I (5) (Bldg 59) Picatinny Arsenal, NJ 07806-5000
Commander AMCCOM ATTN: AMSMC-GCL (D) Picatinny Arsenal, NJ 07806-5000
Administrator Defense Technical Information Center ATTN: Accessions Division Cameron Station Alexandria, VA 22304-6145
Director U.S. Army Materiel Systems Analysis Activity ATTN: AMXSY-MP Aberdeen Proving Ground, MD 21005-5066
Commander CRDEC U.S. Army AMCCOM ATTN: SMCCR-RSP-A Aberdeen Proving Ground, MD 21010-5423
Director Ballistic Research Laboratory ATTN: AMXBR-OD-ST Aberdeen Proving Ground, MD 21005-5066
Chief Benet Weapons Laboratory, CCAC ARDEC U.S. Army AMCCOM ATTN: SMCAR-CCB-TL Watervliet, NY 12189-5000

88
Commander U.S. Army AMCCOM ATTN: AMSMC-IMF-L Rock Island, IL 61299-6000
Director U.S. Army TRADOC Systems Analysis Activity ATTN: ATAA-SL White Sands Missile Range, NM 88002