Embed Size (px)
Citation preview
8/6/2019 Air Quality Study Final
http://slidepdf.com/reader/full/air-quality-study-final 1/320
City of Fort Worth Natural Gas Air Quality Study July 13, 2011
City of Fort WorthNatural Gas Air Quality Study
Final Report
Prepared for:
City of Fort Worth1000 Throckmorton Street
Fort Worth, Texas 76102-6311
Eastern Research Group, Inc. 1600 Perimeter Park Drive, Suite 200
Morrisville, NC 27560
July 13, 2011
Sage Environmental Consulting, LP4611 Bee Caves Road, Suite 100
Austin, TX 78746
8/6/2019 Air Quality Study Final
http://slidepdf.com/reader/full/air-quality-study-final 2/320
Fort Worth Natural Gas Air Quality Study Final Report July 13, 2011
i
Table of ContentsPage
Executive Summary ..................................................................................................... xii 1.0 Introduction ..................................................................................................... 1-1 2.0 Ambient Air Monitoring.................................................................................. 2-1
2.1 Site Selection ................................................................................................... 2-2 2.1.1 Site S-1 (Background Site) ................................................................. 2-4 2.1.2 Site S-2 (Mobile Sources Site)............................................................ 2-6 2.1.3 Site S-3 (Pre-Production Site)............................................................. 2-6 2.1.4 Site S-4 (High-Level Activity Site, Collocated) .................................. 2-8 2.1.5 Site S-5 (High-Level Activity Site, Collocated) .................................. 2-9 2.1.6 Site S-6 (Moderate-Level Activity/Fence line Site) ...........................2-10 2.1.7 Site S-7 (Moderate-Level Activity/Fence line Site) ...........................2-11
2.2 Sampling Protocol .......................................................................................... 2-12 2.3 Sample Analysis ............................................................................................ 2-15 2.4 Quality Assurance/Quality Control................................................................. 2-18
2.4.1 Completeness ....................................................................................2-19 2.4.2 Measurement Precision .....................................................................2-20 2.4.3 Measurement Accuracy .....................................................................2-22
2.5 Ambient Air Monitoring Results .................................................................... 2-22 2.5.1 Summary Statistics ............................................................................2-22 2.5.2 Study Period Averaging ....................................................................2-28 2.5.3 Key Pollutants ...................................................................................2-50 2.5.4 Integration with Meteorology ............................................................2-51
2.6 Ambient Air Monitoring Conclusions ............................................................ 2-73 3.0 Point Source Testing ........................................................................................ 3-1 3.1 Introduction ..................................................................................................... 3-1
3.2 Point Source Emissions Survey Sampling Equipment ...................................... 3-3 3.2.1 The FLIR™ Infrared Camera ............................................................. 3-6 3.2.2 The Toxic Vapor Analyzer (TVA) ...................................................... 3-7 3.2.3 The Hi Flow Sampler ......................................................................... 3-8 3.2.4 Summa Canisters................................................................................ 3-9 3.2.5 Miscellaneous Equipment .................................................................3-10
3.3 Point Source Survey and Sampling Procedures............................................... 3-10 3.3.1 Pre-Test Equipment Preparation ........................................................3-11 3.3.2 Final Preparations .............................................................................3-12 3.3.3
Site Arrival .......................................................................................3-12
3.3.4 IR Camera Survey .............................................................................3-14 3.3.5 Method 21 Site Survey with the Toxic Vapor Analyzer .....................3-15 3.3.6 Hi Flow Sampler Emissions Testing ..................................................3-17 3.3.7 Canister Sampling .............................................................................3-17 3.3.8 Completion of the Site Survey ...........................................................3-20
3.4 Emissions Calculation Procedures .................................................................. 3-23
8/6/2019 Air Quality Study Final
http://slidepdf.com/reader/full/air-quality-study-final 3/320
Fort Worth Natural Gas Air Quality Study Final Report July 13, 2011
ii
3.4.1 Well Pad, Compressor Station, Gas Plant, and Salt Water DisposalFacility Emissions .............................................................................3-23
3.4.2 Direct Emission Calculations ............................................................3-24 3.4.3 Indirect Emission Calculations -- Correlation Equation
Development .....................................................................................3-26 3.4.4
Applying Canister Results to Non-Canister Emission Points .............3-27
3.4.5 Surrogate Canister Profiles ................................................................3-29 3.4.6 Calculation of Non-Sampled Low Level Emission Points ..................3-30 3.4.7 Compressor Engine Emissions ..........................................................3-32 3.4.8 Well Drilling and Fracking Engine Emissions ...................................3-32 3.4.9 Calculation of Method 21 TOC Screening Emission Factors .............3-32
3.5 Point Source Emissions Results...................................................................... 3-33 3.5.1 Well Activity Emissions ....................................................................3-62 3.5.2 Method 21 TOC Screening Emission Factors ....................................3-64
3.6 Quality Control Results .................................................................................. 3-64 3.6.1 IR Camera Daily Demo Results .........................................................3-65 3.6.2
Hi Flow Sampler Calibration Verification .........................................3-65
3.6.3 TVA Calibration Procedures .............................................................3-79 3.6.4 Field Data Review .............................................................................3-89 3.6.5 Canister Sample Collection QC .........................................................3-89 3.6.6 Analytical QC Results .......................................................................3-97
3.7 Point Source Testing Conclusions .................................................................. 3-98 4.0 Air Dispersion Modeling.................................................................................. 4-1
4.1 Modeling Scenarios and Source Parameters ..................................................... 4-1 4.1.1 Scenario 1 (Typical Well Pad) ............................................................ 4-4 4.1.2 Scenario 2 (Worst-Case Well Pad) ..................................................... 4-7 4.1.3 Scenario 3 (Worst-Case Compressor Station) ....................................4-11 4.1.4 Scenario 4 (Co-located Worst-Case Well Pad and Worst-Case
Compressor Station) ..........................................................................4-14 4.2 Model Setup and Options ............................................................................... 4-15
4.2.1 Receptor Grids ..................................................................................4-15 4.2.2 Meteorological Data and Surface Parameters.....................................4-16
4.3 Model Output ................................................................................................. 4-16 4.4 Electronic Modeling Files .............................................................................. 4-28 4.5 Air Dispersion Modeling Conclusions ............................................................ 4-31
5.0 Public Health Evaluation ................................................................................. 5-1 5.1 Methodology .................................................................................................... 5-1 5.2 Interpretation of Ambient Air Monitoring Data ................................................ 5-3
5.2.1 Sensitivity of Monitoring Methods ..................................................... 5-3 5.2.2 Health Evaluation for Measured 24-Hour Average Concentrations ..... 5-9 5.2.3 Health Evaluation for Program-Average Concentrations ...................5-17 5.2.4 Measured Concentrations: Main Findings, Limitations, and
Uncertainties .....................................................................................5-23 5.3 Interpretation of Dispersion Modeling Data.................................................... 5-23
5.3.1 Comparison of Modeled and Measured Air Pollution Levels .............5-24
8/6/2019 Air Quality Study Final
http://slidepdf.com/reader/full/air-quality-study-final 4/320
Fort Worth Natural Gas Air Quality Study Final Report July 13, 2011
iii
5.3.2 Health Evaluation for Modeled 1-Hour Average Concentrations .......5-25 5.3.3 Health Evaluation for Modeled Annual Average Concentrations .......5-32 5.3.4 Adequacy of Setback Limits ..............................................................5-36 5.3.5 Modeled Concentrations: Main Findings, Limitations, and
Uncertainties .....................................................................................5-41 5.4
Additional Context for Selected Pollutants ..................................................... 5-41
5.5 Public Health Evaluation Conclusions ............................................................ 5-51
6.0 Regulatory Assessment .................................................................................... 6-1 6.1 Federal Air Quality Rules................................................................................. 6-1
6.1.1 Operating Permits .............................................................................. 6-1 6.1.2 Construction Permits .......................................................................... 6-2 6.1.3 New Source Performance Standards ................................................... 6-2 6.1.4 National Emission Standards for Hazardous Air Pollutants ................. 6-4 6.1.5 Greenhouse Gas Reporting Program ................................................... 6-6
6.2 Texas Commission on Environmental Quality Air Quality Rules ..................... 6-6 6.2.1 Permit-by-Rules ................................................................................. 6-7 6.2.2 Standard Permit .................................................................................. 6-8 6.2.3 New Source Review Permits .............................................................. 6-9 6.2.4 Control of Air Pollution from Visible Emissions and Particulate
Matter ................................................................................................ 6-9 6.2.5 Control of Air Pollution from Sulfur Compounds ............................... 6-9 6.2.6 Standards of Performance for Hazardous Air Pollutants and for
Designated Facilities and Pollutants ..................................................6-10 6.2.7 Control of Air Pollution from Volatile Organic Compounds ..............6-10 6.2.8 Control of Air Pollution from Nitrogen Compounds ..........................6-10 6.2.9 Federal Operating Permits .................................................................6-11
6.3 City of Fort Worth Air Quality Rules ............................................................. 6-11 6.4 Regulatory Assessment Conclusions .............................................................. 6-11
7.0 Full Build-Out Estimates ................................................................................. 7-1 7.1 Factors Affecting Natural Gas Production ........................................................ 7-2 7.2 Methodology for Forecasting Natural Gas Production ...................................... 7-5 7.3 2010 Base Year Emissions Inventory ............................................................... 7-6 7.4 2010 through 2018 Projected Emissions Inventories ....................................... 7-16 7.5 Full Build-Out Estimates Conclusions ............................................................ 7-21
8.0 Conclusions and Recommendations ................................................................ 8-1 8.1 Task Level Conclusions ................................................................................... 8-1 8.2 Study Question Answers .................................................................................. 8-3 8.3 Recommendations ............................................................................................ 8-6
9.0 References ........................................................................................................ 9-1

8/6/2019 Air Quality Study Final
http://slidepdf.com/reader/full/air-quality-study-final 5/320
Fort Worth Natural Gas Air Quality Study Final Report July 13, 2011
iv
Appendix 2-A—COC Forms for Sites S-1 and S-5Appendix 2-B—Analytical Results for SNMOC at Sites S-1 through S-5Appendix 2-C—Analytical Results for EPA Compendium Method TO-15 at Sites S-1
through S-5Appendix 2-D—Analytical Results for EPA Compendium Method TO-11A at Sites S-4 and S-5
Appendix 2-E—COC Forms and Analytical Results for Sites S-6 and S-7Appendix 2-F—Final Concentration DataAppendix 2-G—NATA Lowest Comparison LevelsAppendix 2-H—Final Meteorological DataAppendix 3-A—Site Emissions SummaryAppendix 3-B—Emissions Workbook and Field DataAppendix 3-C—Canister Data (Electronic)Appendix 4-A—Electronic Modeling FilesAppendix 5-A—Additional Information on Health-Based Screening Values

8/6/2019 Air Quality Study Final
http://slidepdf.com/reader/full/air-quality-study-final 6/320
Fort Worth Natural Gas Air Quality Study Final Report July 13, 2011
v
List of Tables
Page
Table 2.1-1. Final Ambient Air Network Monitoring Sites ...................................................... 2-2 Table 2.2-1. Schedule of Collection Events ........................................................................... 2-13 Table 2.3-1. EPA Compendium Method TO-15 Target Compounds and Method
Detection Limits ..................................................................................................... 2-15 Table 2.3-2. SNMOC Target Compounds and Method Detection Limits ............................... 2-17 Table 2.3-3. Carbonyl Target Compounds and Method Detection Limits ............................... 2-18 Table 2.3-4. Methane Method Detection Limit ...................................................................... 2-18 Table 2.4-1. Data Quality Objectives ..................................................................................... 2-19 Table 2.4-2. DQO: Overall Completeness ............................................................................. 2-20 Table 2.4-3. DQO: RSD Precision Calculation for Collocated VOC, Carbonyl, and
SNMOC Instruments .............................................................................................. 2-21 Table 2.4-4. DQO: RSD Precision Calculation for Collocated and Replicate VOC and
SNMOC Analyses .................................................................................................. 2-21 Table 2.4-5. VOC and Carbonyl HAP Audit Results ............................................................. 2-22 Table 2.5-1. Summary of VOC Measurements Across the Entire Monitoring Network .......... 2-24 Table 2.5-2. Summary of Carbonyl Measurements Across the Entire Monitoring Network ... 2-27 Table 2.5-3. Summary of Methane and Speciated Non-Methane Organic Compounds
Across the Entire Monitoring Network ................................................................... 2-29 Table 2.5-4. Site S-1 Pollutant Study Averages ..................................................................... 2-33 Table 2.5-5. Site S-2 Pollutant Study Averages ..................................................................... 2-36 Table 2.5-6. Site S-3A Pollutant Study Averages .................................................................. 2-38 Table 2.5-7. Site S-3B Pollutant Study Averages ................................................................... 2-40 Table 2.5-8. Site S-4 Pollutant Study Averages ..................................................................... 2-42 Table 2.5-9. Site 5 Pollutant Study Averages ......................................................................... 2-45 Table 2.5-10. Site S-6 Pollutant Study Averages ................................................................... 2-48 Table 2.5-11. Site S-7 Pollutant Study Averages ................................................................... 2-49 Table 2.5-12. Site S-1 Key Pollutant Averages ...................................................................... 2-52 Table 2.5-13. Site S-2 Key Pollutant Averages ...................................................................... 2-53 Table 2.5-14. Site S-3A Key Pollutant Averages ................................................................... 2-53 Table 2.5-15. Site S-3B Key Pollutant Averages ................................................................... 2-54 Table 2.5-16. Site S-4 Key Pollutant Averages ...................................................................... 2-54 Table 2.5-17. Site S-5 Key Pollutant Averages ...................................................................... 2-55 Table 2.5-18. Site S-6 Key Pollutant Averages ...................................................................... 2-55 Table 2.5-19. Site S-7 Key Pollutant Averages ...................................................................... 2-56 Table 2.5-20. Meteorological Stations Used in This Study .................................................... 2-61 Table 3.1-1. Point Source Sites by Owner and Type ................................................................ 3-4 Table 3.4-1. Comparison of Emissions Between Tank and Non-Tank Emission Sources ...... 3-27 Table 3.4-2. Non-Canister Methane Emissions Calculation Example ..................................... 3-29 Table 3.4-3. Surrogate Tank and Non-Tank Emission Profiles............................................... 3-29 Table 3.5-1. Average and Maximum Point Source Emission Rates by Site Typea .................. 3-33 Table 3.5-2. Average Point Source Emission Volumes by Site Type ..................................... 3-34 Table 3.5-3. Point Source Emissions Summary by Site a........................................................ 3-35 Table 3.5-4. Summary of Repeat Surveysa............................................................................. 3-62
8/6/2019 Air Quality Study Final
http://slidepdf.com/reader/full/air-quality-study-final 7/320
Fort Worth Natural Gas Air Quality Study Final Report July 13, 2011
vi
Table 3.5-5. TOC Screening Emission Factors ...................................................................... 3-64 Table 3.6-1. IR Camera ID: GasFindIR Daily Demo September – October, 2010 .................. 3-66 Table 3.6-2. IR Camera ID: GF-320 Daily Demo September – October, 2010 ....................... 3-68 Table 3.6-3. IR Camera ID: Dexter Daily Demo September – October, 2010 ........................ 3-70 Table 3.6-4. IR Camera ID: GasFindIR Daily Demo January – February, 2011 ..................... 3-71 Table 3.6-5. IR Camera ID: GF-320 Daily Demo January – February, 2011 .......................... 3-73
Table 3.6-6. Hi Flow ID: QS1002 Verification September – October 2010 ............................ 3-75 Table 3.6-7. Hi Flow ID: QS1005 Verification September – October 2010 ............................ 3-76 Table 3.6-8. Hi Flow ID: QS1002 Verification January – February, 2011 .............................. 3-77 Table 3.6-9. Hi Flow ID: QX1007 Verification January – February, 2011 ............................. 3-78 Table 3.6-10. TVA S/N: 5362 Calibration and Drift Check Results September –
October 2010 .......................................................................................................... 3-79 Table 3.6-11. TVA S/N: K10419 Calibration and Drift Check Results September –
October 2010 .......................................................................................................... 3-81 Table 3.6-12. TVA S/N: 5362 Calibration and Drift Check Results January –
February 2011 ........................................................................................................ 3-83 Table 3.6-13. TVA S/N: 0528413543 Calibration and Drift Check Results January –February 2011 ........................................................................................................ 3-85 Table 3.6-14. TVA S/N: R6488 Calibration and Drift Check Results January –
February 2011 ........................................................................................................ 3-86 Table 3.6-15. TVA S/N: R1376 Calibration and Drift Check Results January –
February 2011 ........................................................................................................ 3-88 Table 3.6-16. Duplicate Canister Results ............................................................................... 3-90 Table 4.1-1. Source Types Modeled ........................................................................................ 4-4 Table 4.1-2. Scenario 1 (Typical Well Pad) Model Input Emission Rates ................................ 4-5 Table 4.1-3. Scenario 2 (Worst-Case Well Pad) Model Input Emission Rates .......................... 4-8 Table 4.1-4. Scenario 3 (Worst-Case Compressor Station) Model Input Emission Rates ....... 4-11 Table 4.3-1. Modeled Impacts—Scenario 1 (Typical Well Pad) ............................................ 4-16 Table 4.3-2. Modeled Impacts—Scenario 2 (Worst-Case Scenario Well Pad)........................ 4-18 Table 4.3-3. Modeled Impacts—Scenario 3 (Worst-Case Compressor Station) ...................... 4-21 Table 4.3-4. Modeled Impacts—Scenario 4 (Co-located Well Pad and Compressor Station) . 4-24 Table 4.4-1. BEEST Pollutant Abbreviation Crosswalk ......................................................... 4-29 Table 5.2-1. Ranges of Detection Limits, by Laboratory .......................................................... 5-4 Table 5.2-2. Highest Measured Concentrations and TCEQ Short-Term Screening Levels...... 5-10 Table 5.2-3. Program-Average Concentrations and TCEQ Long-Term Screening Levels ...... 5-18 Table 5.3-1. Monitor-to-Model Comparisons for Selected Pollutants ..................................... 5-24 Table 5.3-2. Modeled 1-Hour Average Concentrations and TCEQ Short-Term Screening
Levels ..................................................................................................................... 5-26 Table 5.3-3. Modeled Annual Average Concentrations and TCEQ Long-Term Screening
Levels ..................................................................................................................... 5-33 Table 5.5-1. Key Findings for Health Evaluation ................................................................... 5-53 Table 6.2-1. New PBR Emission Rates.................................................................................... 6-7 Table 6.4-1. Sources Above Regulatory Thresholds .............................................................. 6-12 Table 7.3-1. 2010 Base Year Well Pad Emissions Inventory ................................................... 7-7 Table 7.3-2. 2010 Base Year Compressor Station Emissions Inventory ................................. 7-10 Table 7.3-3. 2010 Base Year Cumulative Emissions Inventory .............................................. 7-13

8/6/2019 Air Quality Study Final
http://slidepdf.com/reader/full/air-quality-study-final 8/320
Fort Worth Natural Gas Air Quality Study Final Report July 13, 2011
vii
Table 7.4-1. Growth Factors for Years 2010–2018 ................................................................ 7-16 Table 7.4-2. Projected Emissions for Years 2010–2018 ......................................................... 7-17 Table 8.2-1. Average Emissions by Site Type ......................................................................... 8-3 Table 8.2-2. Total City-Wide Emissions from Natural Gas Production Activity, by Pollutant
Category ................................................................................................................... 8-3 Table 8.2-3. Sources Above Regulatory Thresholds ................................................................ 8-4
Table 8.2-4. Off-Site Air Pollution Levels for Selected Pollutants as Determined Through
the Ambient Air Monitoring Network ....................................................................... 8-5 Table 8.2-5. Off-Site Air Pollution Levels for Selected Pollutants as Determined Through
Air Dispersion Modeling .......................................................................................... 8-5

8/6/2019 Air Quality Study Final
http://slidepdf.com/reader/full/air-quality-study-final 9/320
Fort Worth Natural Gas Air Quality Study Final Report July 13, 2011
viii
List of Figures
Page
Figure 2.1-1. Ambient Air Monitoring Sites ............................................................................ 2-3 Figure 2.1-2. Aerial Map of Site S-1—Fire Station 33 ............................................................. 2-4
Figure 2.1-3. Overview of Barnett Shale Well Pads Near Site S-1 ........................................... 2-5 Figure 2.1-4. Aerial Map of Site S-2—Environmental Collection Center ................................. 2-6 Figure 2.1-5. Aerial Map of Site S-3A—Eastside Landfill ....................................................... 2-7 Figure 2.1-6. Aerial Map of Site S-3B—Devon Energy Lease ................................................. 2-8 Figure 2.1-7. Aerial Map of Site S-4—Brennan Service Center ............................................... 2-9 Figure 2.1-8. Aerial Map of Site S-5—Fire Station 34 ........................................................... 2-10 Figure 2.1-9. Aerial Map of Site S-6—Spinks Airport (South) .............................................. 2-11 Figure 2.1-10. Aerial Map of Site S-7—Spinks Airport (North) ............................................ 2-12 Figure 2.5-1. Acetaldehyde Average Concentrations by Site ................................................. 2-57 Figure 2.5-2. Benzene Average Concentrations by Site ......................................................... 2-57 Figure 2.5-3. 1,3-Butadiene Average Concentrations by Site ................................................. 2-58
Figure 2.5-4. Carbon Tetrachloride Average Concentrations by Site...................................... 2-58 Figure 2.5-5. p-Dichlorobenzene Average Concentrations by Site ......................................... 2-59 Figure 2.5-6. Formaldehyde Average Concentrations by Site ................................................ 2-59 Figure 2.5-7. Tetrachloroethylene Average Concentrations by Site........................................ 2-60 Figure 2.5-8. Meteorological Stations and Monitoring Site Locations .................................... 2-64 Figure 2.5-9. Site S-1 Windrose Comparisons ....................................................................... 2-65 Figure 2.5-10. Site S-2 Windrose Comparisons ..................................................................... 2-66 Figure 2.5-11. Site S-3A Windrose Comparisons .................................................................. 2-67 Figure 2.5-12. Site S-3B Windrose Comparisons ................................................................... 2-68 Figure 2.5-13. Site S-4 Windrose Comparisons ..................................................................... 2-69 Figure 2.5-14. Site S-5 Windrose Comparisons ..................................................................... 2-70 Figure 2.5-15. Site S-6 Windrose Comparisons ..................................................................... 2-71 Figure 2.5-16. Site S-7 Windrose Comparisons ..................................................................... 2-72 Figure 3.1-1. Point Source Survey Sites (August 2010 – February 2011) ................................. 3-5 Figure 3.1-2. Wet Gas and Dry Gas Well Pads ........................................................................ 3-6 Figure 3.2-1. IR Camera Imaging at a Well Site ...................................................................... 3-7 Figure 3.2-2. Method 21 Screening with the TVA at a Well Site ............................................. 3-8 Figure 3.2-3. Sampling a Tank Vent with the Hi Flow Sampler ............................................... 3-9 Figure 3.2-4. Collecting a Canister Sample from the Exhaust Port of the Hi Flow Sampler .. 3-10 Figure 3.3-1. Front Gate Signage ........................................................................................... 3-13 Figure 3.3-2. Point Source Site Characterization Form .......................................................... 3-14 Figure 3.3-3. Canister Sample Locations ............................................................................... 3-19 Figure 3.3-4. Canister Sampling Manifold ............................................................................. 3-20 Figure 3.3-5. Site Documentation – Wells ............................................................................. 3-21 Figure 3.3-6. Site Documentation – Tanks and Separators ..................................................... 3-21 Figure 3.3-7. Site Documentation – Lift Compressor ............................................................. 3-22 Figure 3.3-8. Example Site Sketch ........................................................................................ 3-22 Figure 3.4-1. Emissions Calculation Flowchart ..................................................................... 3-25 Figure 3.4-2. Default-Zero Values ......................................................................................... 3-31
8/6/2019 Air Quality Study Final
http://slidepdf.com/reader/full/air-quality-study-final 10/320
Fort Worth Natural Gas Air Quality Study Final Report July 13, 2011
ix
Figure 3.5-1. The Effect of Compressors on Site Emissions .................................................. 3-34 Figure 3.5-2. Average TOC Emissions by Component Category ........................................... 3-59 Figure 3.5-3. Average TOC Emissions in Category “Other” .................................................. 3-59 Figure 3.5-4. Average Annual Emissions from Well Pad Compressor Engines ...................... 3-60 Figure 3.5-5. Non-Tank vs. Tank: Average VOC and HAP Emissions .................................. 3-60 Figure 3.5-6. Average Wet Gas vs. Dry Gas TOC Emissions................................................. 3-61
Figure 3.5-7. Average Wet Gas vs. Dry Gas VOC and HAP Emissions ................................. 3-61 Figure 3.5-8. Well Activity Emissions (lbs/hr) ...................................................................... 3-63 Figure 3.7-1. Thief Hatch Left Open ..................................................................................... 3-99 Figure 3.7-2. Pneumatic Valve Controller on Separator ....................................................... 3-100 Figure 3.7-3. Storage Tank Vent ......................................................................................... 3-101 Figure 3.7-4. Natural Gas Pressure Regulator ...................................................................... 3-101 Figure 3.7-5. Hole in Tank Roof - Miscellaneous Emission Source ..................................... 3-102 Figure 4.1-1. Storage Tanks .................................................................................................... 4-2 Figure 4.1-2. Fugitive Emission Points .................................................................................... 4-3 Figure 4.1-3. Natural Gas Compression Engine ....................................................................... 4-4 Figure 4.1-4. Scenario 1 Layout (Typical Well Pad) ................................................................ 4-7
Figure 4.1-5. Scenario 2 Layout (Worst-Case Well Pad)........................................................ 4-10 Figure 4.1-6. Scenario 3 Layout (Worst-Case Compressor Station) ....................................... 4-14 Figure 4.1-7. Scenario 4 Layout (Co-located Well Pad and Compressor Station) ................... 4-15 Figure 4.3-1. Formaldehyde Modeling Results for Scenarios 1 - 4 ......................................... 4-27 Figure 5.2-1. All Measurements of Hexachloro-1,3-Butadiene during the Ambient Air
Monitoring Program ............................................................................................... 5-16 Figure 5.3-1. Locations of Estimated Annual Average Benzene Concentrations Greater Than
TCEQ’s Long-Term ESL, by Modeling Scenario .................................................... 5-38 Figure 5.3-3. Locations of Estimated Annual Average Formaldehyde Concentrations Greater
Than TCEQ’s Long-Term ESL, by Modeling Scenario ........................................... 5-40 Figure 5.4-1. Comparison of Program-Average Benzene Concentrations in Fort Worth to 2010
Annual Average Benzene Concentrations Statewide (see Section 5.4) .................... 5-43 Figure 5.4-2. Toxicity of Acrolein: Short-Term Exposures .................................................... 5-45 Figure 5.4-3. Toxicity of Acrolein: Long-Term Exposures .................................................... 5-46 Figure 5.4-4. Comparison of Program-Average Formaldehyde Concentrations in Fort Worth to
2010 Annual Average Formaldehyde Concentrations Statewide (see Section 5.4) ... 5-48 Figure 5.4-5. Toxicity of Formaldehyde: Short-Term Exposures ........................................... 5-49 Figure 5.4-6. Toxicity of Formaldehyde: Long-Term Exposures ........................................... 5-50 Figure 7.1-1. Natural Gas Production in the Barnett Shale and Tarrant County (1993–2010) ... 7-3 Figure 7.1-2. Texas Natural Gas Wellhead Price (2000–2010) ................................................ 7-3 Figure 7.1-3. Permits, Rig Counts, and Wellhead Gas Prices in Tarrant County (2000–2010) .. 7-4 Figure 7.2-1. Projected Production in Eight Shale Plays (BCF) (1998–2018)........................... 7-5 Figure 7.2-2. Barnett Shale and Tarrant County Actual and Projected Natural Gas Production
(2000–2018) ............................................................................................................. 7-6
8/6/2019 Air Quality Study Final
http://slidepdf.com/reader/full/air-quality-study-final 11/320
Fort Worth Natural Gas Air Quality Study Final Report July 13, 2011
x
Abbreviations
% CH4 Leak expressed as percent methaneµg/m3 Micrograms per cubic meterAQS Air Quality Subsystem
ATSDR Agency for Toxic Substances and Disease RegistryBACT Best available control technologyBP Barometric PressureBtu British thermal unitCCV Continuing Calibration VerificationCFM Cubic feet per minuteCH4 MethaneCO Carbon monoxideCO2 Carbon dioxideCOC Chain of custodyCV Coefficient of variation
DNPH 2,4-dinitrophenylhydrazineDQO Data Quality ObjectiveEPA U.S. Environmental Protection AgencyERG Eastern Research Group, Inc.FID Flame ionization detectorGC Gas chromatographGC/MS Gas chromatograph/Mass spectrometerGIS Geographic information systemGPS Global Positioning SystemH2S Hydrogen sulfideHAP Hazardous Air Pollutants
Hg MercuryHI Hihp HorsepowerID IdentificationIR InfraredIRIS Integrated Risk Information SystemkPa Kilopascalslb Poundlbs/yr Pounds per yearLCL Lowest Comparison LevelLCS Laboratory Control Standard
MDL Method Detection Limitmm MillimeterNA Not available/not applicableNATA National-Scale Air Toxics AssessmentNESHAP National Emissions Standard for Hazardous Air PollutantsNM Not monitoredNOx Oxides of nitrogenNSPS New Source Performance Standards
8/6/2019 Air Quality Study Final
http://slidepdf.com/reader/full/air-quality-study-final 12/320
Fort Worth Natural Gas Air Quality Study Final Report July 13, 2011
xi
NSR New Source ReviewNWS National Weather ServiceoF Degrees FahrenheitPBR Permit-by-RulePM Particulate matter
PM2.5 Particulate matter with a diameter of 2.5 micrometers or lessPM10 Particulate matter with a diameter of 10 micrometers or lessppbC Parts per billion by carbonppbv Parts per billion by volumeppmv Parts per million by volumePRV Pressure Relief ValveQA/QC Quality Assurance/Quality ControlQAPP Quality Assurance Project PlanRH Relative HumidityRRC Railroad CommissionRSD Relative standard deviation
S/N Serial NumberSATMP Schools Air Toxic Monitoring ProgramSCFM Standard Cubic Feet per MinuteSIM Selected ion monitoringSNMOC Speciated Non-Methane Organic CompoundsSO2 Sulfur dioxideSOCMI Synthetic Organic Chemical Manufacturing IndustryTCD Thermal Conductivity DetectorTCEQ Texas Commission on Environmental QualityTEMP TemperatureTOC Total Organic Compoundstpy Tons per yearTVA Toxic Vapor AnalyzerVOC Volatile Organic CompoundsWBAN Weather Bureau/Air Force NumberWD Wind DirectionWS Wind Speed
8/6/2019 Air Quality Study Final
http://slidepdf.com/reader/full/air-quality-study-final 13/320
Fort Worth Natural Gas Air Quality Study Final Report July 13, 2011
xii
Executive Summary
The city of Fort Worth is home to extensive natural gas production and exploration as itlies on top of the Barnett Shale, a highly productive natural gas shale formation in north-centralTexas. The Barnett Shale underlies 23 counties, including four (Tarrant, Denton, Wise, and
Parker) that lie partly within the Fort Worth city boundaries. Over the last several years, naturalgas production in the Barnett Shale has increased dramatically. This increase in activity has beenbrought about by advancements in drilling technologies, most notably hydraulic fracturing(fracking) and horizontal drilling.
As the Barnett Shale formation is located beneath a highly populated urban environment,extraction of natural gas from it has involved exploration and production operations in residentialareas, near public roads and schools, and close to where the citizens of Fort Worth live and work.Due to the highly visible nature of natural gas drilling, fracturing, compression, and collectionactivities, many individual citizens and community groups in the Fort Worth area have becomeconcerned that these activities could have an adverse effect on their quality of life.
In response to these concerns, on March 9, 2010, the Fort Worth City Council adoptedResolution 3866-03-2010 appointing a committee to review air quality issues associated withnatural gas exploration and production. This committee was composed of private citizens,members of local community groups, members of environmental advocacy groups, andrepresentatives from industry. The committee was charged to make recommendations to the CityCouncil on a scope of work for a comprehensive air quality assessment to evaluate the impacts of natural gas exploration and production, to evaluate proposals submitted in response to asolicitation for conducting this study, and to ultimately choose a qualified organization toconduct the study.
Following an open bidding process, Eastern Research Group, Inc. (ERG) was selected toperform the Fort Worth Natural Gas Air Quality Study (FWNGAQS). ERG was asked to designa study that answered four key questions, originally established by the air quality committee.Since that time, ERG has completed extensive sampling activity throughout Fort Worth, and thesampling results support the following main conclusions:
• How much air pollution is being released by natural gas exploration in Fort Worth? ERG estimated emissions for 375 well pads, 8 compressor stations, one gas processingplant, a saltwater treatment facility, a drilling operation, a fracking operation, and acompletion operation. Summed across all these sites, the total estimated emissions of organic compounds was 20,818 tons per year, with well pads accounting for more than
three-fourths of those total emissions. The emissions contained dozens of pollutants withvarying toxicities. Pollutants with relatively low toxicities (e.g., methane, ethane, propane,and butane) accounted for the overwhelming majority—approximately 98%—of the city-wide emissions. However, several pollutants with relatively high toxicities (e.g., benzene)were also emitted from these sites, though in considerably lower quantities. At a smallsubset of sites, the point source testing team noted signs of malfunctioning equipmentthat likely caused increased emissions. For example, some hatches atop tanks were ajarand not closed, and corrosion had apparently caused a hole to form on the roof of at least
8/6/2019 Air Quality Study Final
http://slidepdf.com/reader/full/air-quality-study-final 14/320
Fort Worth Natural Gas Air Quality Study Final Report July 13, 2011
xiii
one tank. Enhanced inspection and maintenance of equipment at the sites can help ensurethat these preventable emissions are greatly reduced or eliminated. ERG also projectedfuture emission rates based on an analysis of market forces, natural gas reserves, andother factors. This analysis found that city-wide emissions from the production of naturalgas are projected to peak in 2012 and 2013 at 9% above 2010 levels. More detailed and
technical information on emissions from natural gas sites is found in Sections 3 and 7 of this report.
• Do sites comply with environmental regulation? Numerous state and federal regulationscould apply to natural gas production sites, but applicability of all regulations depends onsite-specific nuances. The primary environmental regulation that would apply to naturalgas extraction sites is TCEQ’s oil and gas “permit-by-rule”. This regulation is in theTexas Administrative Code and sets criteria for air permitting, based on the amount andtype of emissions from a given facility. Based on the emission rates that ERG calculatedfor this project, five sites—a processing facility, three compressor stations, and one wellpad—had overall emission rates that exceed regulatory thresholds that are supposed to
trigger certain permitting requirements. Section 6 of this report identifies these five sitesand presents their estimated emission rates.
• How do releases from these sites affect off-site air pollution levels? Scientists typicallyuse two different methods when trying to understand how a given air pollution sourceaffects local air quality. One approach is to conduct ambient air monitoring, which isdirectly measuring air pollution levels that people breathe. Another approach is to usedispersion modeling, which is estimating air pollution levels using models that predicthow pollutants move through the air from the point where they are released. ERG usedboth approaches in the FWNGAQS. The ambient air monitoring program identifiedactual air pollution levels of nearly 140 pollutants at eight locations throughout the city,
and the dispersion modeling study estimated air pollution levels at times when, andlocations where, ambient monitoring did not take place.
A health-screening analysis of the measured and estimated air pollution levels identifiedthree pollutants—acrolein, benzene, and formaldehyde—as the most important from arisk perspective. While Fort Worth residents are exposed to these and other pollutantsreleased from natural gas sites, the measured and estimated air pollution levels did notreach levels that have been observed to cause adverse health effects. Further, themeasured benzene and formaldehyde levels in Fort Worth were not unusually elevatedwhen compared to levels currently measured by TCEQ elsewhere in Texas. There wasinsufficient data available to do a similar comparison for acrolein. ERG recommended
focused additional study to ensure that these pollutants do not reach unhealthy levels inthe future. Sections 2, 4, and 5 describe the monitoring, modeling, and health-screeninganalysis in greater technical detail.
• Are the city’s required setbacks for these sites adequate to protect public health? For theoverwhelming majority of sites considered in this study, the modeling analysis indicatesthat Fort Worth’s 600-foot setback distance is adequate. For the relatively few sites withmultiple, large line compressor engines, the modeling analysis found some areas beyond

8/6/2019 Air Quality Study Final
http://slidepdf.com/reader/full/air-quality-study-final 15/320
Fort Worth Natural Gas Air Quality Study Final Report July 13, 2011
xiv
the setbacks to have estimated acrolein and formaldehyde concentrations greater thanprotective health-based screening levels published by TCEQ. However, the estimated airpollution levels did not reach levels that have actually been found to cause symptoms orillness among exposed populations. Because the findings for these two pollutants arebased entirely on estimated emission rates and modeled air quality impacts (as opposed to
measured values), ERG recommends further evaluations of acrolein and formaldehyde atsites with multiple, large line engines to provide greater confidence in the adequacy andprotectiveness of the city’s setbacks. Some recent, short-term studies of limited scopehave monitored for these pollutants, but a longer-term monitoring program is bettersuited for confirming this study’s findings for acrolein and formaldehyde. Section 5describes how ERG reached its conclusions regarding the adequacy of the city’s setback distances.
Although this study did not reveal any significant health threats beyond setback distances,it is important to remember that the sources of concern for this project—natural gas explorationand production activity—are located in residential settings throughout a metropolitan area.
Though the most toxic pollutants these sources emit are released in relatively low quantities,ERG fully supports implementing all reasonable precautions to reduce emissions from the wellpads and compressor stations. Our recommendations in Section 8 of this report identify severalspecific opportunities for reducing emissions from natural gas production sites in Fort Worth.
8/6/2019 Air Quality Study Final
http://slidepdf.com/reader/full/air-quality-study-final 16/320
Fort Worth Natural Gas Air Quality Study Final Report July 13, 2011
1-1
1.0 Introduction
The city of Fort Worth is home to extensive natural gas production and exploration as itlies on top of the Barnett Shale, a highly productive natural gas shale formation in north-centralTexas. The Barnett Shale underlies 23 counties, including four (Tarrant, Denton, Wise, and
Parker) that lie partly within the Fort Worth city boundaries. Over the last several years, naturalgas production in the Barnett Shale has increased dramatically. This increase in activity has beenbrought about by advancements in drilling technologies, most notably hydraulic fracturing andhorizontal drilling.
As the Barnett Shale formation is located beneath a highly populated urban environment,extraction of natural gas from it has involved exploration and production operations in residentialareas, near public roads and schools, and close to where the citizens of Fort Worth live and work.Due to the highly visible nature of natural gas drilling, fracturing, compression, and collectionactivities, many individual citizens and community groups in the Fort Worth area have becomeconcerned that these activities could have an adverse effect on their quality of life.
In response to these concerns, on March 9, 2010, the Fort Worth City Council adoptedResolution 3866-03-2010 appointing a committee to review air quality issues associated withnatural gas exploration and production. This committee was composed of private citizens,members of local community groups, members of environmental advocacy groups, andrepresentatives from industry. The committee was charged to make recommendations to the CityCouncil on a scope of work for a comprehensive air quality assessment to evaluate the impacts of natural gas exploration and production, to evaluate proposals submitted in response to asolicitation for conducting this study, and to ultimately choose a qualified organization toconduct the study.
The goals of the air quality study, as established by the air quality committee, are to helpcity officials answer the following four questions:
• How much air pollution is being released by natural gas exploration in Fort Worth?
• Do sites comply with environmental regulation?
• How do releases from these sites affect off-site air pollution levels?
• Are the city’s required setbacks for these sites adequate to protect public health?
In order to answer these questions, the air quality committee identified several key tasksthat should be included in this study: ambient air monitoring, point source testing, and air
dispersion modeling.
Ambient air monitoring was conducted to measure outdoor pollution levels. Ambient airmonitoring was included in the Fort Worth Natural Gas Air Quality Study to measure airpollution levels near selected natural gas facilities.
Point source testing was conducted to determine how much air pollution is being releasedby natural gas production in Fort Worth, and if natural gas extraction and processing sites
8/6/2019 Air Quality Study Final
http://slidepdf.com/reader/full/air-quality-study-final 17/320
Fort Worth Natural Gas Air Quality Study Final Report July 13, 2011
1-2
comply with environmental regulations. Under this task, various types of air testing equipmentwere used to detect, identify, and quantify the type and amount of air pollutants being emitted.
Air dispersion modeling was used to estimate the incremental air quality impacts causedby emissions from natural gas facilities. The modeling results provide perspective on air
pollution levels at locations where, and at times when, ambient air samples were not collected.The results were used to assess whether the city’s required setbacks (as published in CityOrdinance No. 18449-02-2009) are adequately protective of public health.
Finally, a health evaluation compared the results of the ambient air monitoring programand air dispersion modeling to protective health-based screening levels. For selected pollutants,additional context was provided on toxicity and pollution levels typically observed at otherlocations in Texas.
This report presents the results of each of these tasks and activities, and is organized intoeight sections as follows:
• Section 1 – Introduction. This section provides background information on the study.
• Section 2 – Ambient Air Monitoring. This section describes how the ambient airmonitoring network was designed and implemented, and presents the ambient airmonitoring results.
• Section 3 – Point Source Testing. This section describes how the point source testingtask was conducted, what equipment was used, and how the data obtained was used toestimate emissions. The section also summarizes point source testing results.
• Section 4 – Air Dispersion Modeling. This section describes the air dispersionmodeling task. It documents the major inputs, assumptions, site configurations, and
results.• Section 5 – Public Health Evaluation. This section interprets the ambient air
monitoring data and the air dispersion modeling data from a public health perspective.It also comments on whether the setbacks are adequately protective of public health.
• Section 6 – Regulatory Assessment. This section provides details on the types of airquality regulations that may apply to natural gas exploration and production activities,and draws conclusions (where appropriate) on whether the sites visited under thepoint source task comply with applicable regulatory thresholds.
• Section 7 – Full Build-Out Estimates. This section discusses the factors expected toaffect the growth of natural gas exploration and production in Fort Worth in the
coming years and estimates future peak air emissions in Fort Worth.• Section 8 – Conclusions and Recommendations. This section draws upon the results
of each of the project activities to answer the four questions that defined the overallscope of this study. Several recommendations are also provided.
8/6/2019 Air Quality Study Final
http://slidepdf.com/reader/full/air-quality-study-final 18/320
Fort Worth Natural Gas Air Quality Study Final Report July 13, 2011
2-1
2.0 Ambient Air Monitoring
This section presents the findings of the ambient air monitoring component of this study,and contains six sub-sections.
• 2.1 Site Selection – Describes how the monitoring sites were identified.• 2.2 Sampling Protocol – Describes how the ambient air monitoring samples were
obtained.
• 2.3 Sample Analysis – Describes how the ambient air moniroting samples wereanalyzed at the laboratory.
• 2.4 Quality Assurance/Quality Control – This section describes the quality assuranceand quality control (QA/QC) procedures employed during collection and analysis of the ambient air samples.
• 2.5 Ambient Air Monitoring Results – The results of the ambient air monitoring
program are discussed in this section, including site-by-site study results.• 2.6 Ambient Air Monitoring Conclusions – This section presents the conclusions of
the ambient air monitoring program.
Ambient air is the air that people might expect to be exposed to at a road, school, or park near an air pollution emission source, such as a natural gas well pad or compressor station.Ambient air monitors are instruments that measure outdoor pollution levels in the ambient air. Inthis study, ambient air monitoring was conducted to assess the short-term prevalence andmagnitude of concentrations of selected air toxics present in the air outside the propertyboundaries of air emissions sources such as a natural gas well pad or compressor station.
In this study, air pollution levels of nearly 140 pollutants (including over 40 HazardousAir Pollutants (HAPs)) were measured over a two-month period with ambient air monitoringstations at eight different locations in Fort Worth. Sampling commenced on September 4, 2010,and concluded on October 31. Data obtained from this ambient air monitoring network can beused to:
• Assist in a better understanding of conclusions drawn from the point source samplingand analysis efforts.
• Characterize exposure to selected air toxics in ambient air at various locations in thecity, as related to the proximity to certain natural gas activities (well pads, compressor
stations, fracturing operations, etc.).• Establish a representative determination of the concentration of air toxics, such as
benzene, present in the ambient air in the area.
• Allow for a public health evaluation (See Section 5 for the full public healthevaluation).
8/6/2019 Air Quality Study Final
http://slidepdf.com/reader/full/air-quality-study-final 19/320
Fort Worth Natural Gas Air Quality Study Final Report July 13, 2011
2-2
The ambient air monitoring network deployed in the field under this project wasimplemented in accordance with the Ambient Air Monitoring Plan, drafted in August 2010 andfinalized on September 15, 2010. The Ambient Air Monitoring Plan identifies the goals andobjectives of the ambient air monitoring network, provides technical background information(such as historical meteorological data) needed to identify candidate monitoring site locations,
specifies the technical approach used to focus the list of candidate monitoring sites, and providesthe final list of sites used in the study. Also, prior to implementation of the monitoring study,ERG prepared an approved Level 1 Ambient Air Monitoring Quality Assurance Project Plan
(QAPP) which provided specific information on the sampling protocols, sampling analyses, anddata reporting.
2.1 Site Selection
The final selection of eight monitoring sites occurred in two phases.
In Phase 1, geographic information system (GIS) data was obtained from the city of Fort
Worth showing the locations of active and permitted natural gas activities, compressor stations,city property, nearby roadways, meteorological stations, and other features. These data and mapswere overlaid to show natural gas activities in relation to residences, schools, businesses, existing(non-natural-gas) emission sources, and city-owned property. Monitoring on city-ownedproperty was desirable for several reasons, including ensuring that the project team had siteaccess seven days a week, maintaining the security of project staff and sampling equipment, andmaintaining the integrity of the air sample by limiting the chance of vandalism or othertampering. During Phase 1, 20 potential monitoring site locations were identified.
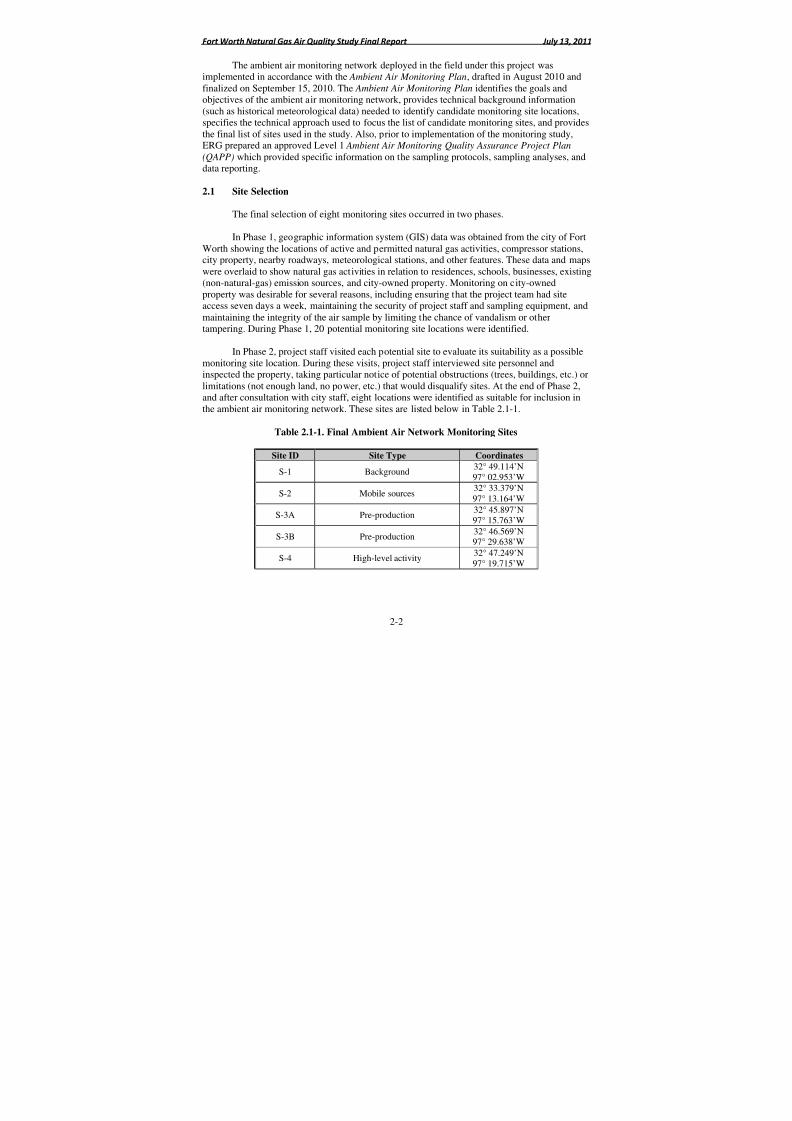
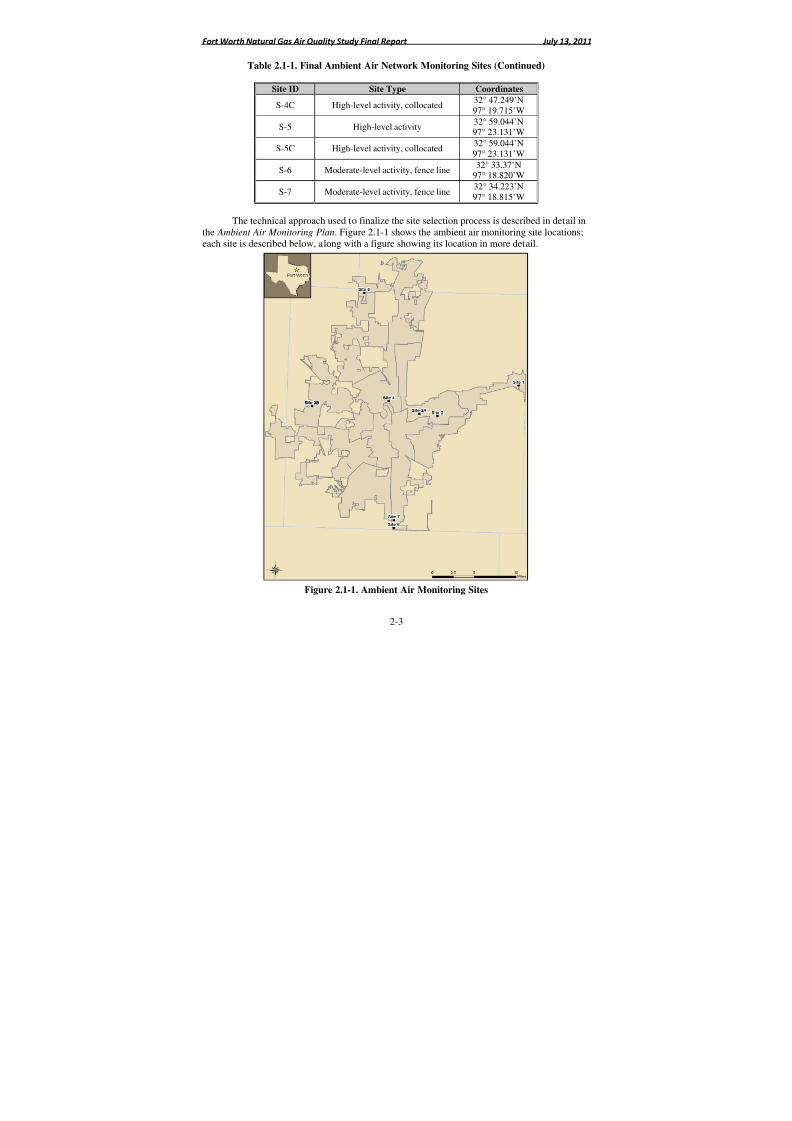
In Phase 2, project staff visited each potential site to evaluate its suitability as a possiblemonitoring site location. During these visits, project staff interviewed site personnel andinspected the property, taking particular notice of potential obstructions (trees, buildings, etc.) orlimitations (not enough land, no power, etc.) that would disqualify sites. At the end of Phase 2,and after consultation with city staff, eight locations were identified as suitable for inclusion inthe ambient air monitoring network. These sites are listed below in Table 2.1-1.
Table 2.1-1. Final Ambient Air Network Monitoring Sites
Site ID Site Type Coordinates
S-1 Background32° 49.114’N97° 02.953’W
S-2 Mobile sources32° 33.379’N97° 13.164’W
S-3A Pre-production 32° 45.897’N97° 15.763’W
S-3B Pre-production32° 46.569’N97° 29.638’W
S-4 High-level activity32° 47.249’N97° 19.715’W
8/6/2019 Air Quality Study Final
http://slidepdf.com/reader/full/air-quality-study-final 20/320
Fort Worth Natural Gas Air Quality Study Final Report July 13, 2011
2-3
Table 2.1-1. Final Ambient Air Network Monitoring Sites (Continued)
Site ID Site Type Coordinates
S-4C High-level activity, collocated32° 47.249’N97° 19.715’W
S-5 High-level activity32° 59.044’N97° 23.131’W
S-5C High-level activity, collocated32° 59.044’N97° 23.131’W
S-6 Moderate-level activity, fence line32° 33.37’N
97° 18.820’W
S-7 Moderate-level activity, fence line32° 34.223’N97° 18.815’W
The technical approach used to finalize the site selection process is described in detail inthe Ambient Air Monitoring Plan. Figure 2.1-1 shows the ambient air monitoring site locations;each site is described below, along with a figure showing its location in more detail.
Figure 2.1-1. Ambient Air Monitoring Sites
8/6/2019 Air Quality Study Final
http://slidepdf.com/reader/full/air-quality-study-final 21/320
Fort Worth Natural Gas Air Quality Study Final Report July 13, 2011
2-4
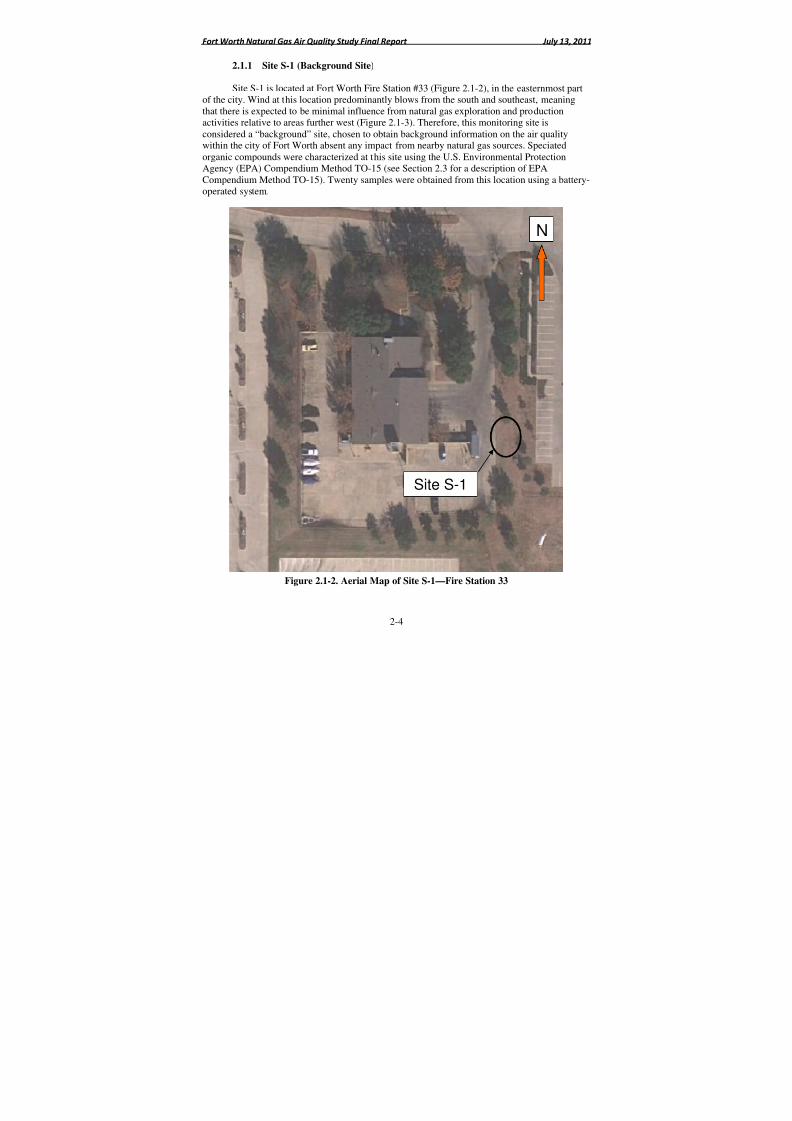
2.1.1 Site S-1 (Background Site)
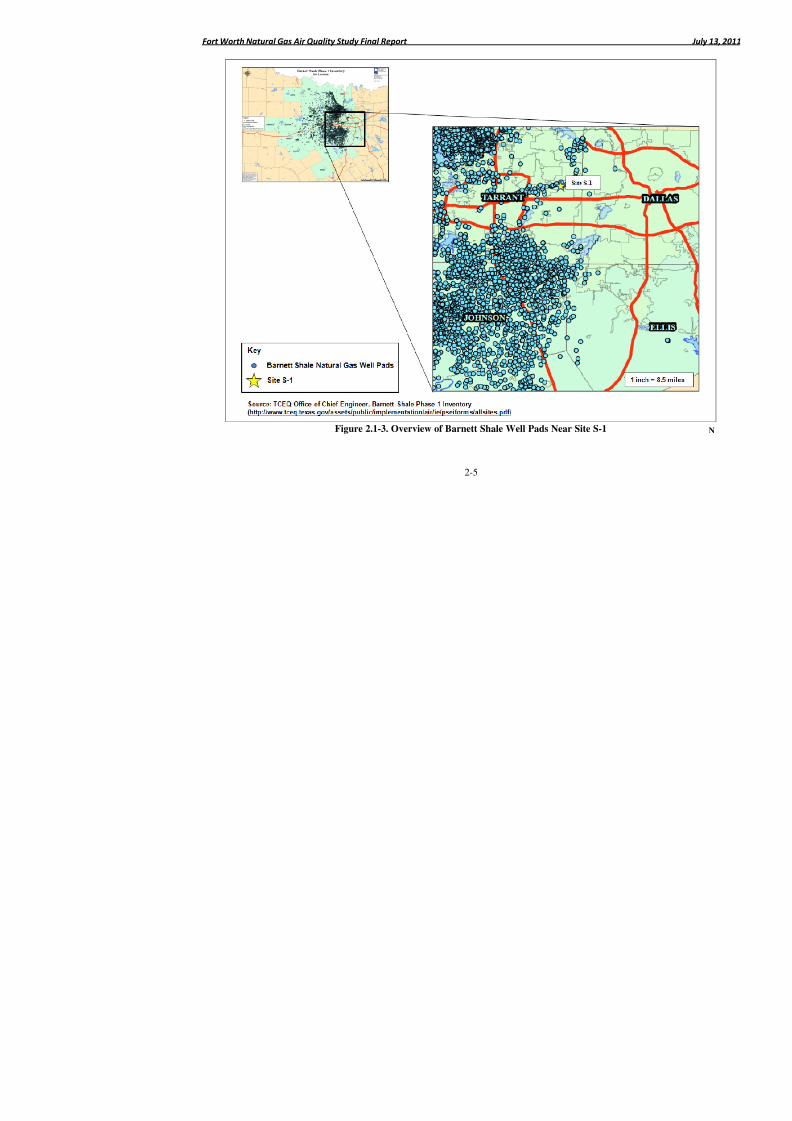
Site S-1 is located at Fort Worth Fire Station #33 (Figure 2.1-2), in the easternmost partof the city. Wind at this location predominantly blows from the south and southeast, meaningthat there is expected to be minimal influence from natural gas exploration and production
activities relative to areas further west (Figure 2.1-3). Therefore, this monitoring site isconsidered a “background” site, chosen to obtain background information on the air qualitywithin the city of Fort Worth absent any impact from nearby natural gas sources. Speciatedorganic compounds were characterized at this site using the U.S. Environmental ProtectionAgency (EPA) Compendium Method TO-15 (see Section 2.3 for a description of EPACompendium Method TO-15). Twenty samples were obtained from this location using a battery-operated system.
Figure 2.1-2. Aerial Map of Site S-1—Fire Station 33
Site S-1
N
8/6/2019 Air Quality Study Final
http://slidepdf.com/reader/full/air-quality-study-final 22/320
Fort Worth Natural Gas Air Quality Study Final Report
2-5
Figure 2.1-3. Overview of Barnett Shale Well Pads Near Site S-1
8/6/2019 Air Quality Study Final
http://slidepdf.com/reader/full/air-quality-study-final 23/320
Fort Worth Natural Gas Air Quality Study Final Report July 13, 2011
2-6
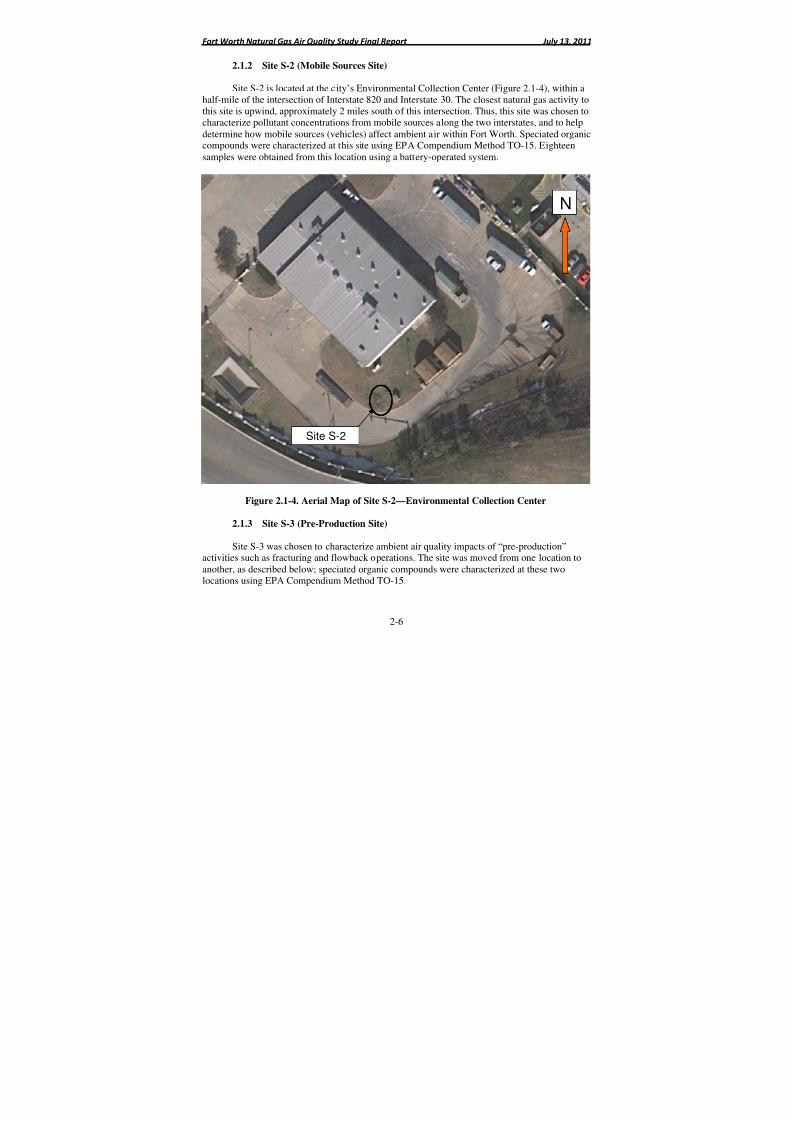
2.1.2 Site S-2 (Mobile Sources Site)
Site S-2 is located at the city’s Environmental Collection Center (Figure 2.1-4), within ahalf-mile of the intersection of Interstate 820 and Interstate 30. The closest natural gas activity tothis site is upwind, approximately 2 miles south of this intersection. Thus, this site was chosen to
characterize pollutant concentrations from mobile sources along the two interstates, and to helpdetermine how mobile sources (vehicles) affect ambient air within Fort Worth. Speciated organiccompounds were characterized at this site using EPA Compendium Method TO-15. Eighteensamples were obtained from this location using a battery-operated system.
Figure 2.1-4. Aerial Map of Site S-2—Environmental Collection Center
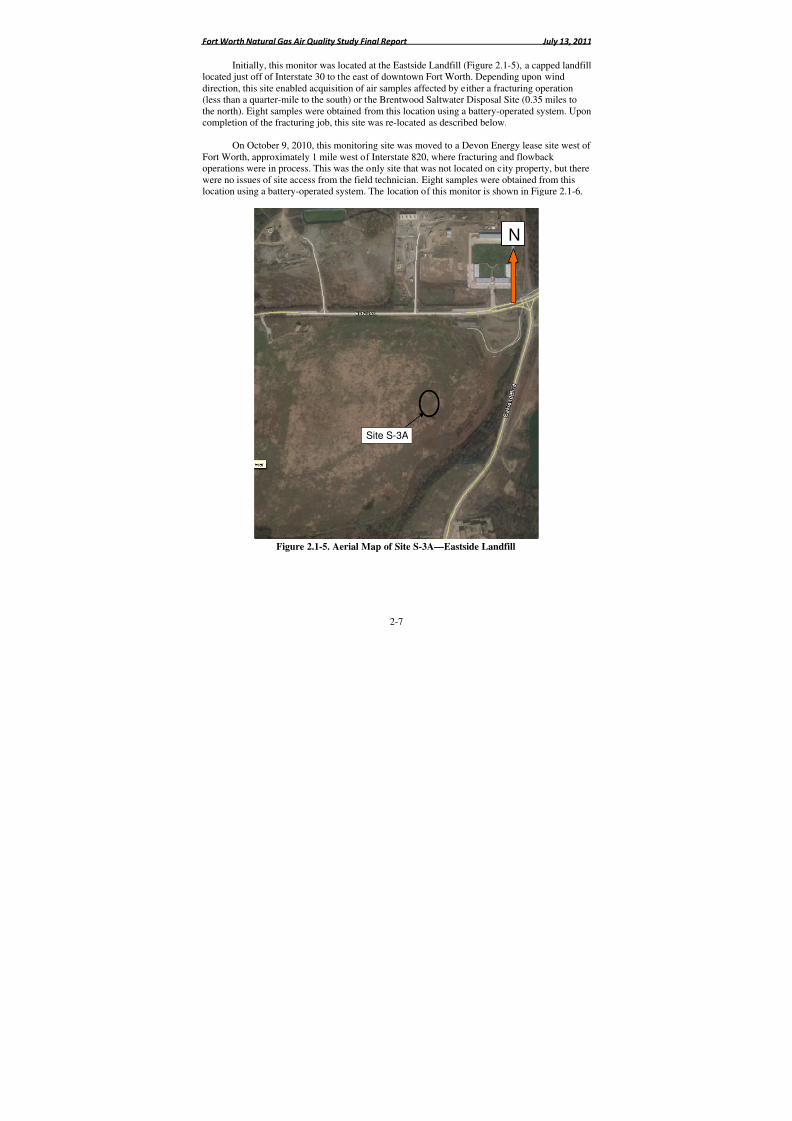
2.1.3 Site S-3 (Pre-Production Site)
Site S-3 was chosen to characterize ambient air quality impacts of “pre-production”activities such as fracturing and flowback operations. The site was moved from one location toanother, as described below; speciated organic compounds were characterized at these twolocations using EPA Compendium Method TO-15.
Site S-2
N
8/6/2019 Air Quality Study Final
http://slidepdf.com/reader/full/air-quality-study-final 24/320
Fort Worth Natural Gas Air Quality Study Final Report July 13, 2011
2-7
Initially, this monitor was located at the Eastside Landfill (Figure 2.1-5), a capped landfilllocated just off of Interstate 30 to the east of downtown Fort Worth. Depending upon winddirection, this site enabled acquisition of air samples affected by either a fracturing operation(less than a quarter-mile to the south) or the Brentwood Saltwater Disposal Site (0.35 miles tothe north). Eight samples were obtained from this location using a battery-operated system. Upon
completion of the fracturing job, this site was re-located as described below.
On October 9, 2010, this monitoring site was moved to a Devon Energy lease site west of Fort Worth, approximately 1 mile west of Interstate 820, where fracturing and flowback operations were in process. This was the only site that was not located on city property, but therewere no issues of site access from the field technician. Eight samples were obtained from thislocation using a battery-operated system. The location of this monitor is shown in Figure 2.1-6.
Figure 2.1-5. Aerial Map of Site S-3A—Eastside Landfill
Site S-3A
N
8/6/2019 Air Quality Study Final
http://slidepdf.com/reader/full/air-quality-study-final 25/320
Fort Worth Natural Gas Air Quality Study Final Report July 13, 2011
2-8
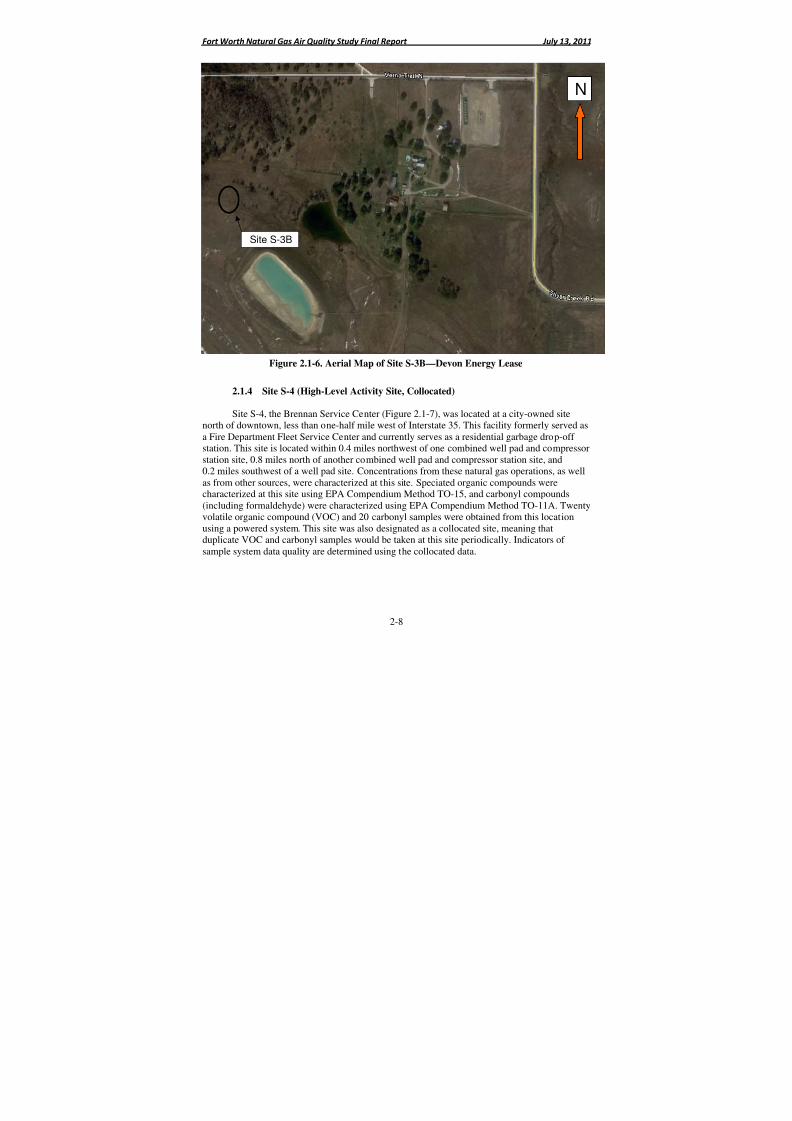
Figure 2.1-6. Aerial Map of Site S-3B—Devon Energy Lease
2.1.4 Site S-4 (High-Level Activity Site, Collocated)
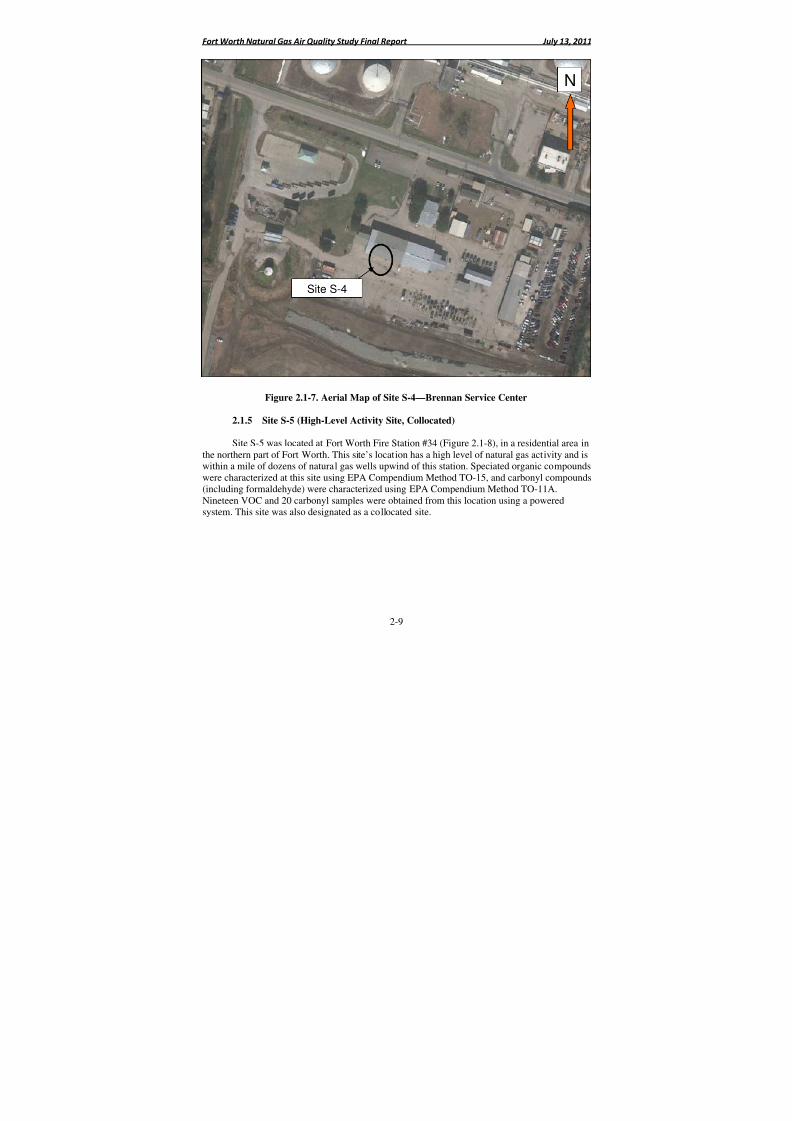
Site S-4, the Brennan Service Center (Figure 2.1-7), was located at a city-owned sitenorth of downtown, less than one-half mile west of Interstate 35. This facility formerly served asa Fire Department Fleet Service Center and currently serves as a residential garbage drop-off station. This site is located within 0.4 miles northwest of one combined well pad and compressorstation site, 0.8 miles north of another combined well pad and compressor station site, and0.2 miles southwest of a well pad site. Concentrations from these natural gas operations, as wellas from other sources, were characterized at this site. Speciated organic compounds werecharacterized at this site using EPA Compendium Method TO-15, and carbonyl compounds
(including formaldehyde) were characterized using EPA Compendium Method TO-11A. Twentyvolatile organic compound (VOC) and 20 carbonyl samples were obtained from this locationusing a powered system. This site was also designated as a collocated site, meaning thatduplicate VOC and carbonyl samples would be taken at this site periodically. Indicators of sample system data quality are determined using the collocated data.
Site S-3B
N
8/6/2019 Air Quality Study Final
http://slidepdf.com/reader/full/air-quality-study-final 26/320
Fort Worth Natural Gas Air Quality Study Final Report July 13, 2011
2-9
Figure 2.1-7. Aerial Map of Site S-4—Brennan Service Center
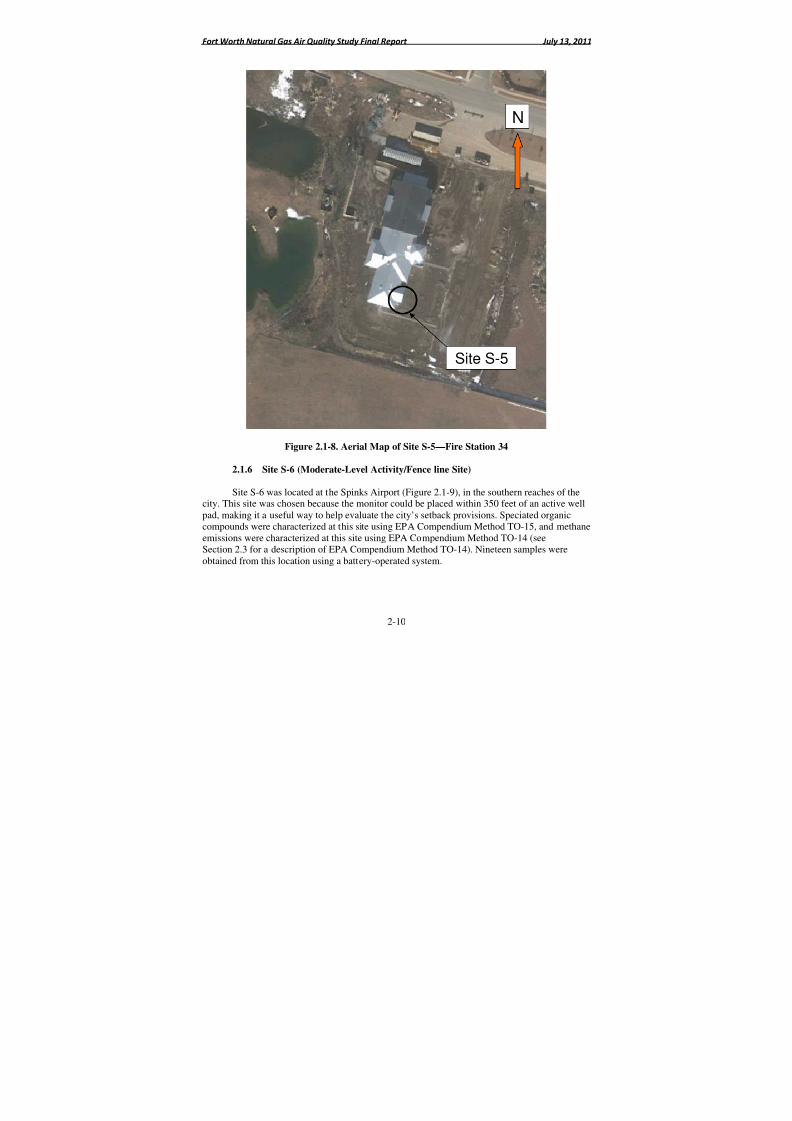
2.1.5 Site S-5 (High-Level Activity Site, Collocated)
Site S-5 was located at Fort Worth Fire Station #34 (Figure 2.1-8), in a residential area inthe northern part of Fort Worth. This site’s location has a high level of natural gas activity and iswithin a mile of dozens of natural gas wells upwind of this station. Speciated organic compoundswere characterized at this site using EPA Compendium Method TO-15, and carbonyl compounds(including formaldehyde) were characterized using EPA Compendium Method TO-11A.Nineteen VOC and 20 carbonyl samples were obtained from this location using a poweredsystem. This site was also designated as a collocated site.
Site S-4
N
8/6/2019 Air Quality Study Final
http://slidepdf.com/reader/full/air-quality-study-final 27/320
Fort Worth Natural Gas Air Quality Study Final Report July 13, 2011
2-10
Figure 2.1-8. Aerial Map of Site S-5—Fire Station 34
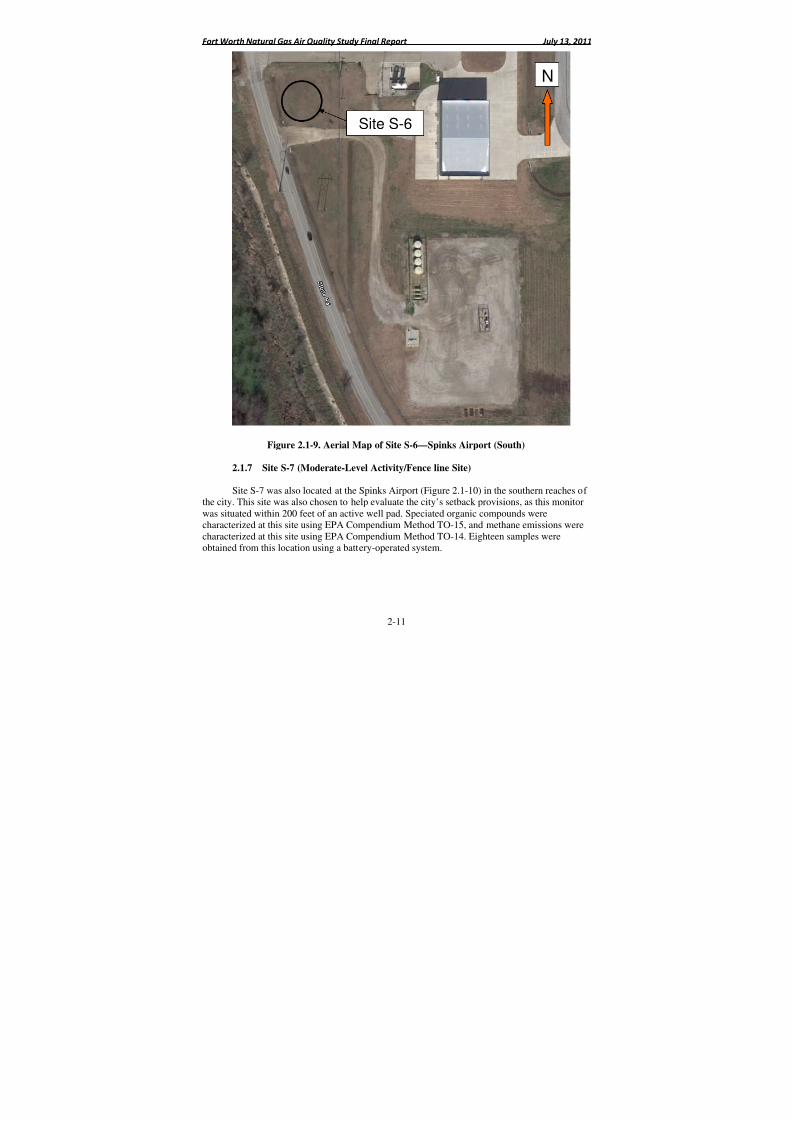
2.1.6 Site S-6 (Moderate-Level Activity/Fence line Site)
Site S-6 was located at the Spinks Airport (Figure 2.1-9), in the southern reaches of the
city. This site was chosen because the monitor could be placed within 350 feet of an active wellpad, making it a useful way to help evaluate the city’s setback provisions. Speciated organiccompounds were characterized at this site using EPA Compendium Method TO-15, and methaneemissions were characterized at this site using EPA Compendium Method TO-14 (seeSection 2.3 for a description of EPA Compendium Method TO-14). Nineteen samples wereobtained from this location using a battery-operated system.
Site S-5
N
8/6/2019 Air Quality Study Final
http://slidepdf.com/reader/full/air-quality-study-final 28/320
Fort Worth Natural Gas Air Quality Study Final Report July 13, 2011
2-11
9
Figure 2.1-9. Aerial Map of Site S-6—Spinks Airport (South)
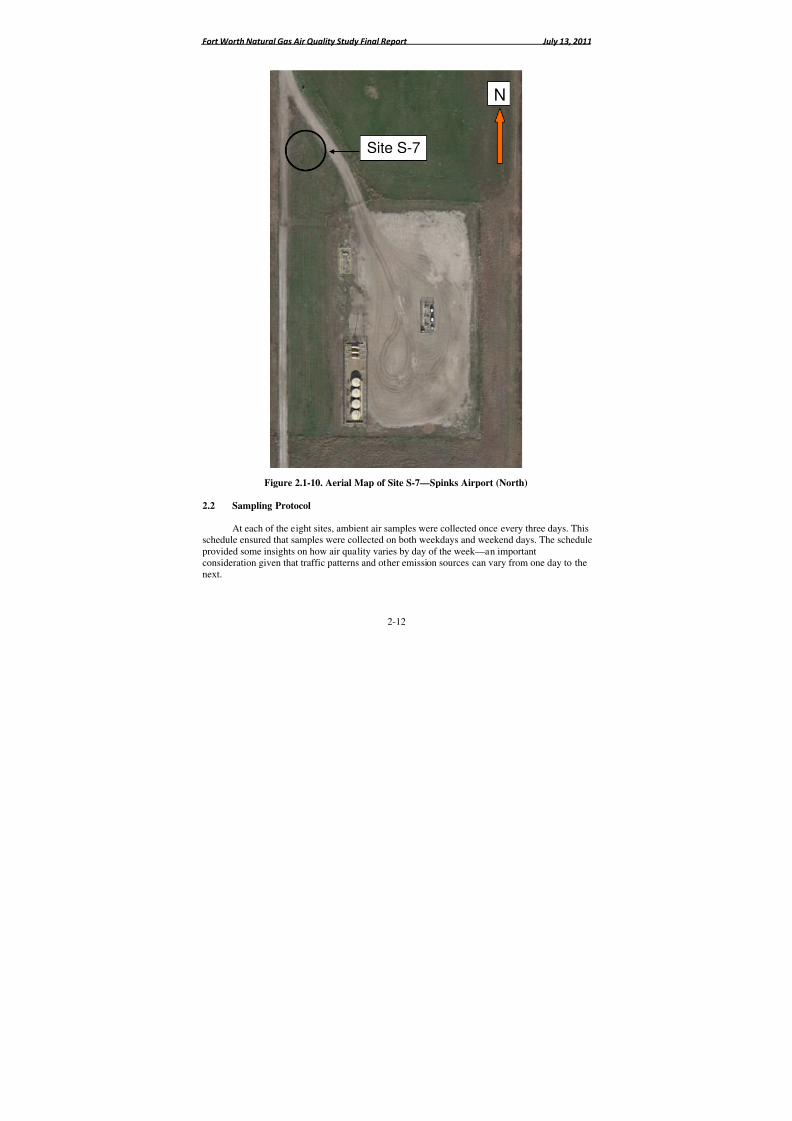
2.1.7 Site S-7 (Moderate-Level Activity/Fence line Site)
Site S-7 was also located at the Spinks Airport (Figure 2.1-10) in the southern reaches of
the city. This site was also chosen to help evaluate the city’s setback provisions, as this monitorwas situated within 200 feet of an active well pad. Speciated organic compounds werecharacterized at this site using EPA Compendium Method TO-15, and methane emissions werecharacterized at this site using EPA Compendium Method TO-14. Eighteen samples wereobtained from this location using a battery-operated system.
Site S-6
N
8/6/2019 Air Quality Study Final
http://slidepdf.com/reader/full/air-quality-study-final 29/320
Fort Worth Natural Gas Air Quality Study Final Report July 13, 2011
2-12
Figure 2.1-10. Aerial Map of Site S-7—Spinks Airport (North)
2.2 Sampling Protocol
At each of the eight sites, ambient air samples were collected once every three days. Thisschedule ensured that samples were collected on both weekdays and weekend days. The scheduleprovided some insights on how air quality varies by day of the week—an importantconsideration given that traffic patterns and other emission sources can vary from one day to thenext.
Site S-7
N
8/6/2019 Air Quality Study Final
http://slidepdf.com/reader/full/air-quality-study-final 30/320
Fort Worth Natural Gas Air Quality Study Final Report July 13, 2011
2-13
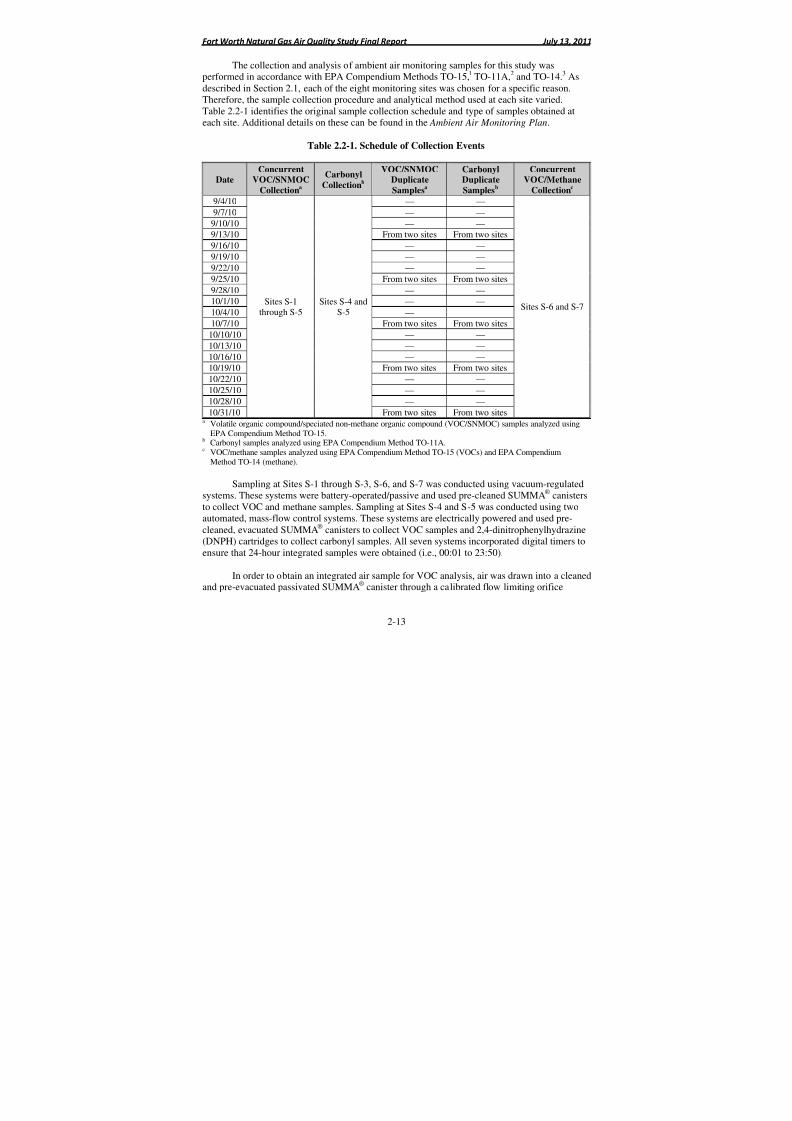
The collection and analysis of ambient air monitoring samples for this study wasperformed in accordance with EPA Compendium Methods TO-15,1 TO-11A,2 and TO-14.3 Asdescribed in Section 2.1, each of the eight monitoring sites was chosen for a specific reason.Therefore, the sample collection procedure and analytical method used at each site varied.Table 2.2-1 identifies the original sample collection schedule and type of samples obtained at
each site. Additional details on these can be found in the Ambient Air Monitoring Plan.
Table 2.2-1. Schedule of Collection Events
DateConcurrent
VOC/SNMOC
Collectiona
Carbonyl
Collectionb
VOC/SNMOCDuplicate
Samplesa
CarbonylDuplicate
Samplesb
ConcurrentVOC/Methane
Collectionc
9/4/10
Sites S-1through S-5
Sites S-4 andS-5
— —
Sites S-6 and S-7
9/7/10 — —
9/10/10 — —
9/13/10 From two sites From two sites
9/16/10 — —
9/19/10 — —9/22/10 — —
9/25/10 From two sites From two sites
9/28/10 — —
10/1/10 — —
10/4/10 — —
10/7/10 From two sites From two sites
10/10/10 — —
10/13/10 — —
10/16/10 — —
10/19/10 From two sites From two sites
10/22/10 — —10/25/10 — —
10/28/10 — —
10/31/10 From two sites From two sitesa Volatile organic compound/speciated non-methane organic compound (VOC/SNMOC) samples analyzed using
EPA Compendium Method TO-15.b Carbonyl samples analyzed using EPA Compendium Method TO-11A. c VOC/methane samples analyzed using EPA Compendium Method TO-15 (VOCs) and EPA Compendium
Method TO-14 (methane).
Sampling at Sites S-1 through S-3, S-6, and S-7 was conducted using vacuum-regulatedsystems. These systems were battery-operated/passive and used pre-cleaned SUMMA® canisters
to collect VOC and methane samples. Sampling at Sites S-4 and S-5 was conducted using twoautomated, mass-flow control systems. These systems are electrically powered and used pre-cleaned, evacuated SUMMA® canisters to collect VOC samples and 2,4-dinitrophenylhydrazine(DNPH) cartridges to collect carbonyl samples. All seven systems incorporated digital timers toensure that 24-hour integrated samples were obtained (i.e., 00:01 to 23:50).
In order to obtain an integrated air sample for VOC analysis, air was drawn into a cleanedand pre-evacuated passivated SUMMA® canister through a calibrated flow limiting orifice
8/6/2019 Air Quality Study Final
http://slidepdf.com/reader/full/air-quality-study-final 31/320
Fort Worth Natural Gas Air Quality Study Final Report July 13, 2011
2-14
assembly that regulated the rate and duration of sampling. After the air sample was collected, thecanister valve was closed automatically. The day following the sample collection, project staff visited each site; inspected the sample media for any errors, inconsistencies, or signs of tampering; and completed a chain-of-custody (COC) form for each of the samples. For eachsample that was deemed viable for analysis, the sample and the COC form were shipped together
to the laboratory for analysis. The information on the COC form included the following:
• Sample ID number
• Sampling equipment identification
• Sampling date
• Sampling start time
• Sampling end time
• Elapsed time
• Initial flowrate
• End flowrate
• Average flowrate
• Sample volume (total liters)
• Comments (field observations and/or anomalies during sampling)
• Name and signature of field operator releasing samples for shipment
• Condition of custody seal upon receipt by laboratory
• Condition of samples upon receipt by laboratory
• Signature of laboratory representative receiving shipment
• Date of sample receipt at laboratory
The samples obtained at Sites S-1 through S-5 were analyzed at Eastern ResearchGroup’s (ERG’s) laboratory in Morrisville, North Carolina, while the samples obtained at SitesS-6 and S-7 were analyzed at TestAmerica’s™ laboratory in Austin, Texas. Appendix 2-Acontains the COC forms for Sites S-1 through S-5, Appendix 2-B contains the analytical resultsfor SNMOCs at Sites S-1 through S-5, Appendix 2-C contains the analytical results for EPACompendium Method TO-15 at Sites S-1 through S-5, Appendix 2-D contains the analyticalresults for EPA Compendium Method TO-11A at Sites S-4 and S-5, and Appendix 2-E containsthe COC forms and analytical results for Sites S-6 and S-7.
Upon receipt, the canister information was recorded and the sample stored until analysis.Storage times of up to 45 days without compound concentration losses have been demonstratedfor many of the VOCs (e.g., benzene, toluene, ethylbenzene, and xylenes) found in urbanatmospheres. Although the required turnaround time under the method guidelines is 45 days, anactual turnaround time of approximately 30 days from sample receipt to sample analysis wastypical.
8/6/2019 Air Quality Study Final
http://slidepdf.com/reader/full/air-quality-study-final 32/320
Fort Worth Natural Gas Air Quality Study Final Report July 13, 2011
2-15
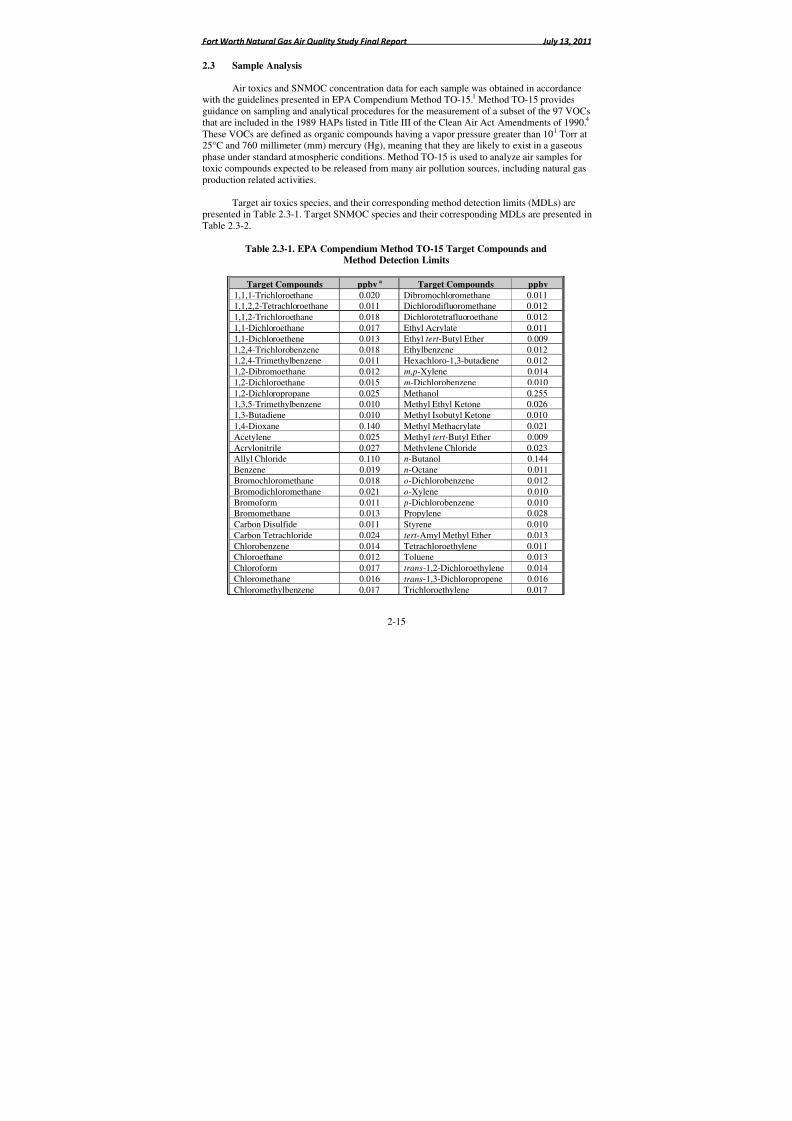
2.3 Sample Analysis
Air toxics and SNMOC concentration data for each sample was obtained in accordancewith the guidelines presented in EPA Compendium Method TO-15.1 Method TO-15 providesguidance on sampling and analytical procedures for the measurement of a subset of the 97 VOCs
that are included in the 1989 HAPs listed in Title III of the Clean Air Act Amendments of 1990.
4
These VOCs are defined as organic compounds having a vapor pressure greater than 10-1 Torr at25°C and 760 millimeter (mm) mercury (Hg), meaning that they are likely to exist in a gaseousphase under standard atmospheric conditions. Method TO-15 is used to analyze air samples fortoxic compounds expected to be released from many air pollution sources, including natural gasproduction related activities.
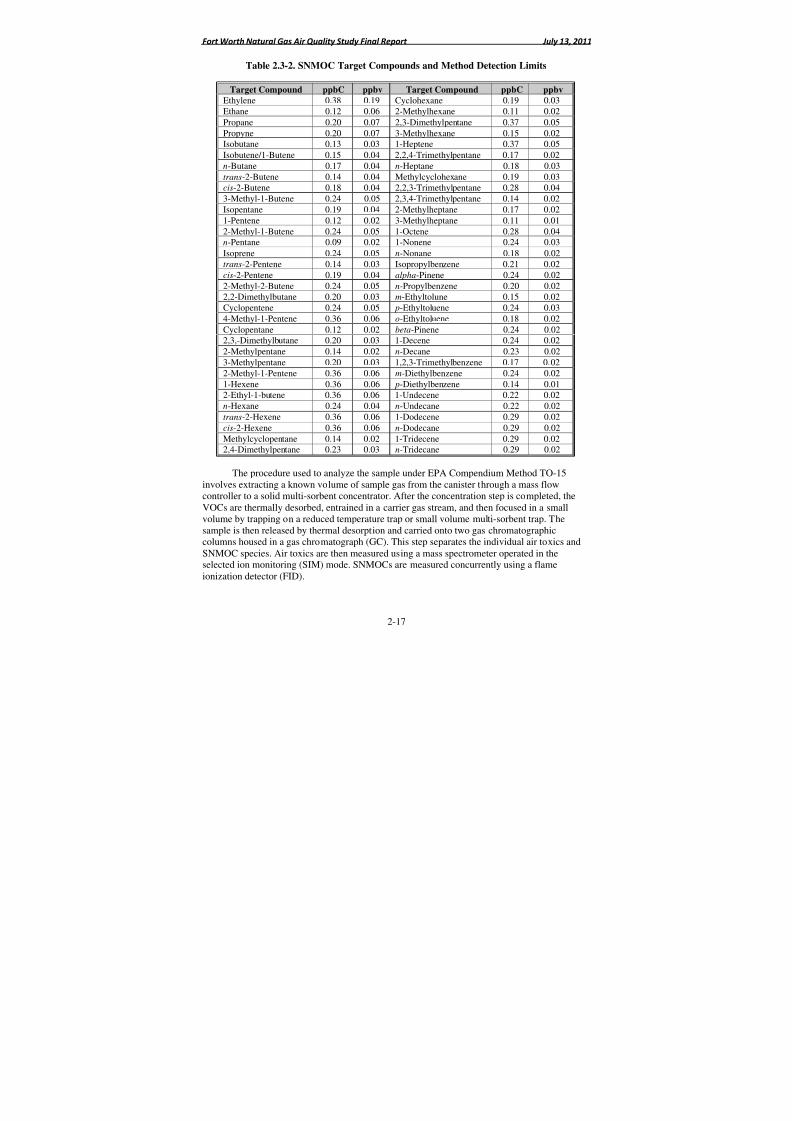
Target air toxics species, and their corresponding method detection limits (MDLs) arepresented in Table 2.3-1. Target SNMOC species and their corresponding MDLs are presented inTable 2.3-2.
Table 2.3-1. EPA Compendium Method TO-15 Target Compounds andMethod Detection Limits
Target Compounds ppbva
Target Compounds ppbv
1,1,1-Trichloroethane 0.020 Dibromochloromethane 0.0111,1,2,2-Tetrachloroethane 0.011 Dichlorodifluoromethane 0.012
1,1,2-Trichloroethane 0.018 Dichlorotetrafluoroethane 0.012
1,1-Dichloroethane 0.017 Ethyl Acrylate 0.011
1,1-Dichloroethene 0.013 Ethyl tert -Butyl Ether 0.009
1,2,4-Trichlorobenzene 0.018 Ethylbenzene 0.0121,2,4-Trimethylbenzene 0.011 Hexachloro-1,3-butadiene 0.012
1,2-Dibromoethane 0.012 m,p-Xylene 0.014
1,2-Dichloroethane 0.015 m-Dichlorobenzene 0.0101,2-Dichloropropane 0.025 Methanol 0.2551,3,5-Trimethylbenzene 0.010 Methyl Ethyl Ketone 0.026
1,3-Butadiene 0.010 Methyl Isobutyl Ketone 0.010
1,4-Dioxane 0.140 Methyl Methacrylate 0.021
Acetylene 0.025 Methyl tert -Butyl Ether 0.009
Acrylonitrile 0.027 Methylene Chloride 0.023Allyl Chloride 0.110 n-Butanol 0.144
Benzene 0.019 n-Octane 0.011
Bromochloromethane 0.018 o-Dichlorobenzene 0.012
Bromodichloromethane 0.021 o-Xylene 0.010
Bromoform 0.011 p-Dichlorobenzene 0.010Bromomethane 0.013 Propylene 0.028
Carbon Disulfide 0.011 Styrene 0.010
Carbon Tetrachloride 0.024 tert -Amyl Methyl Ether 0.013
Chlorobenzene 0.014 Tetrachloroethylene 0.011Chloroethane 0.012 Toluene 0.013
Chloroform 0.017 trans-1,2-Dichloroethylene 0.014
Chloromethane 0.016 trans-1,3-Dichloropropene 0.016
Chloromethylbenzene 0.017 Trichloroethylene 0.017

8/6/2019 Air Quality Study Final
http://slidepdf.com/reader/full/air-quality-study-final 33/320
Fort Worth Natural Gas Air Quality Study Final Report July 13, 2011
2-16
Table 2.3-1. EPA Compendium Method TO-15 Target Compounds and Method DetectionLimits (Continued)
Target Compounds ppbv Target Compounds ppbv
Chloroprene 0.014 Trichlorofluoromethane 0.012
cis-1,2-Dichloroethylene 0.036 Trichlorotrifluoroethane 0.0141,2-Dichloropropane 0.025 Vinyl Acetate 0.208
cis-1,3-Dichloropropene 0.015 Vinyl Chloride 0.013a
ppbv = parts per billion by volume
8/6/2019 Air Quality Study Final
http://slidepdf.com/reader/full/air-quality-study-final 34/320
Fort Worth Natural Gas Air Quality Study Final Report July 13, 2011
2-17
Table 2.3-2. SNMOC Target Compounds and Method Detection Limits
Target Compound ppbC ppbv Target Compound ppbC ppbv
Ethylene 0.38 0.19 Cyclohexane 0.19 0.03
Ethane 0.12 0.06 2-Methylhexane 0.11 0.02
Propane 0.20 0.07 2,3-Dimethylpentane 0.37 0.05Propyne 0.20 0.07 3-Methylhexane 0.15 0.02Isobutane 0.13 0.03 1-Heptene 0.37 0.05
Isobutene/1-Butene 0.15 0.04 2,2,4-Trimethylpentane 0.17 0.02
n-Butane 0.17 0.04 n-Heptane 0.18 0.03
trans-2-Butene 0.14 0.04 Methylcyclohexane 0.19 0.03cis-2-Butene 0.18 0.04 2,2,3-Trimethylpentane 0.28 0.04
3-Methyl-1-Butene 0.24 0.05 2,3,4-Trimethylpentane 0.14 0.02
Isopentane 0.19 0.04 2-Methylheptane 0.17 0.02
1-Pentene 0.12 0.02 3-Methylheptane 0.11 0.01
2-Methyl-1-Butene 0.24 0.05 1-Octene 0.28 0.04n-Pentane 0.09 0.02 1-Nonene 0.24 0.03
Isoprene 0.24 0.05 n-Nonane 0.18 0.02trans-2-Pentene 0.14 0.03 Isopropylbenzene 0.21 0.02
cis-2-Pentene 0.19 0.04 alpha-Pinene 0.24 0.02
2-Methyl-2-Butene 0.24 0.05 n-Propylbenzene 0.20 0.022,2-Dimethylbutane 0.20 0.03 m-Ethyltolune 0.15 0.02
Cyclopentene 0.24 0.05 p-Ethyltoluene 0.24 0.03
4-Methyl-1-Pentene 0.36 0.06 o-Ethyltoluene 0.18 0.02
Cyclopentane 0.12 0.02 beta-Pinene 0.24 0.022,3,-Dimethylbutane 0.20 0.03 1-Decene 0.24 0.02
2-Methylpentane 0.14 0.02 n-Decane 0.23 0.02
3-Methylpentane 0.20 0.03 1,2,3-Trimethylbenzene 0.17 0.02
2-Methyl-1-Pentene 0.36 0.06 m-Diethylbenzene 0.24 0.02
1-Hexene 0.36 0.06 p-Diethylbenzene 0.14 0.012-Ethyl-1-butene 0.36 0.06 1-Undecene 0.22 0.02
n-Hexane 0.24 0.04 n-Undecane 0.22 0.02
trans-2-Hexene 0.36 0.06 1-Dodecene 0.29 0.02
cis-2-Hexene 0.36 0.06 n-Dodecane 0.29 0.02
Methylcyclopentane 0.14 0.02 1-Tridecene 0.29 0.022,4-Dimethylpentane 0.23 0.03 n-Tridecane 0.29 0.02
The procedure used to analyze the sample under EPA Compendium Method TO-15involves extracting a known volume of sample gas from the canister through a mass flowcontroller to a solid multi-sorbent concentrator. After the concentration step is completed, the
VOCs are thermally desorbed, entrained in a carrier gas stream, and then focused in a smallvolume by trapping on a reduced temperature trap or small volume multi-sorbent trap. Thesample is then released by thermal desorption and carried onto two gas chromatographiccolumns housed in a gas chromatograph (GC). This step separates the individual air toxics andSNMOC species. Air toxics are then measured using a mass spectrometer operated in theselected ion monitoring (SIM) mode. SNMOCs are measured concurrently using a flameionization detector (FID).
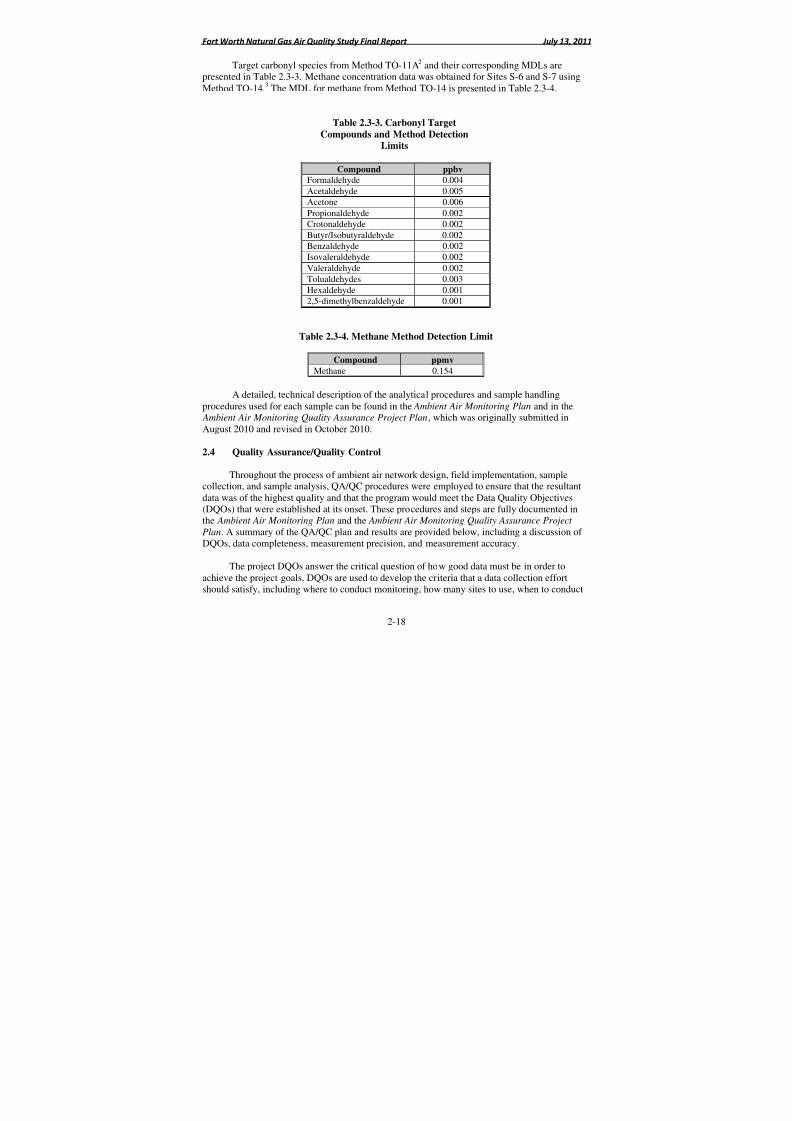
8/6/2019 Air Quality Study Final
http://slidepdf.com/reader/full/air-quality-study-final 35/320
Fort Worth Natural Gas Air Quality Study Final Report July 13, 2011
2-18
Target carbonyl species from Method TO-11A2 and their corresponding MDLs arepresented in Table 2.3-3. Methane concentration data was obtained for Sites S-6 and S-7 usingMethod TO-14.3 The MDL for methane from Method TO-14 is presented in Table 2.3-4.
Table 2.3-3. Carbonyl TargetCompounds and Method DetectionLimits
Compound ppbv
Formaldehyde 0.004
Acetaldehyde 0.005
Acetone 0.006
Propionaldehyde 0.002
Crotonaldehyde 0.002
Butyr/Isobutyraldehyde 0.002
Benzaldehyde 0.002
Isovaleraldehyde 0.002
Valeraldehyde 0.002
Tolualdehydes 0.003
Hexaldehyde 0.001
2,5-dimethylbenzaldehyde 0.001
Table 2.3-4. Methane Method Detection Limit
Compound ppmv
Methane 0.154
A detailed, technical description of the analytical procedures and sample handlingprocedures used for each sample can be found in the Ambient Air Monitoring Plan and in the Ambient Air Monitoring Quality Assurance Project Plan, which was originally submitted inAugust 2010 and revised in October 2010.
2.4 Quality Assurance/Quality Control
Throughout the process of ambient air network design, field implementation, samplecollection, and sample analysis, QA/QC procedures were employed to ensure that the resultantdata was of the highest quality and that the program would meet the Data Quality Objectives
(DQOs) that were established at its onset. These procedures and steps are fully documented inthe Ambient Air Monitoring Plan and the Ambient Air Monitoring Quality Assurance Project
Plan. A summary of the QA/QC plan and results are provided below, including a discussion of DQOs, data completeness, measurement precision, and measurement accuracy.
The project DQOs answer the critical question of how good data must be in order toachieve the project goals. DQOs are used to develop the criteria that a data collection effortshould satisfy, including where to conduct monitoring, how many sites to use, when to conduct
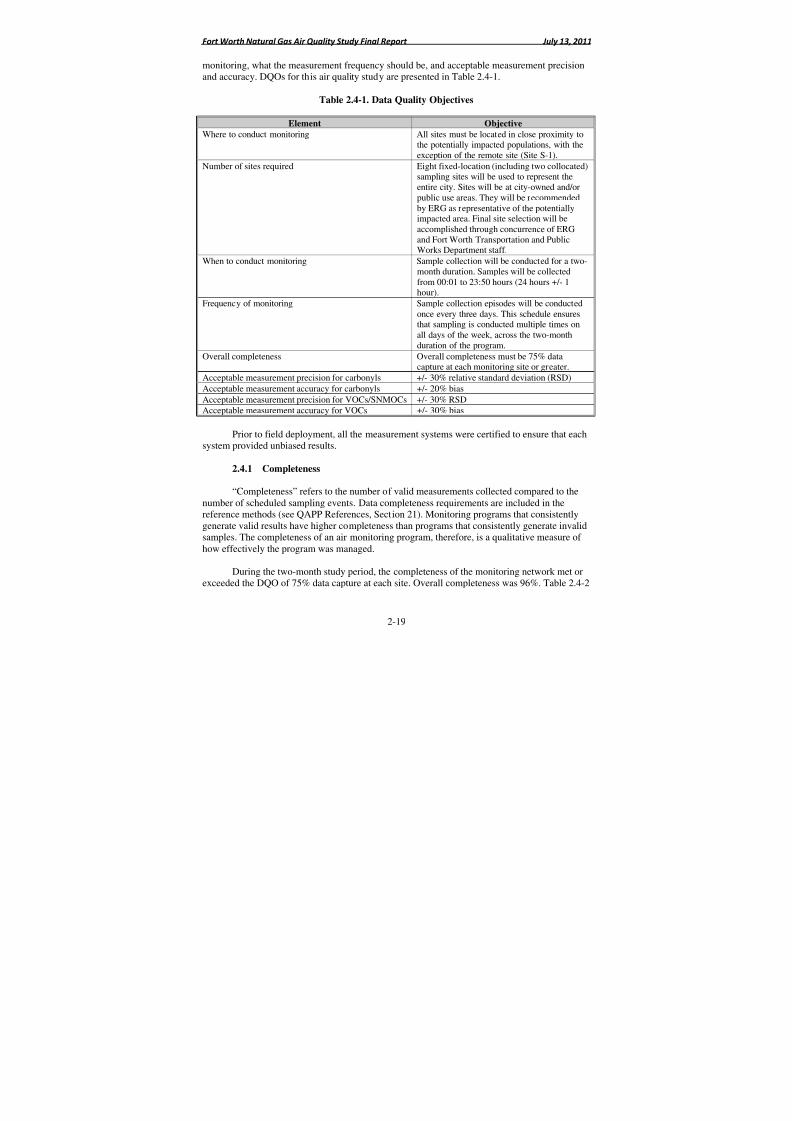
8/6/2019 Air Quality Study Final
http://slidepdf.com/reader/full/air-quality-study-final 36/320
Fort Worth Natural Gas Air Quality Study Final Report July 13, 2011
2-19
monitoring, what the measurement frequency should be, and acceptable measurement precisionand accuracy. DQOs for this air quality study are presented in Table 2.4-1.
Table 2.4-1. Data Quality Objectives
Element Objective Where to conduct monitoring All sites must be located in close proximity tothe potentially impacted populations, with theexception of the remote site (Site S-1).
Number of sites required Eight fixed-location (including two collocated)sampling sites will be used to represent theentire city. Sites will be at city-owned and/orpublic use areas. They will be recommendedby ERG as representative of the potentiallyimpacted area. Final site selection will beaccomplished through concurrence of ERGand Fort Worth Transportation and Public
Works Department staff.When to conduct monitoring Sample collection will be conducted for a two-month duration. Samples will be collectedfrom 00:01 to 23:50 hours (24 hours +/- 1hour).
Frequency of monitoring Sample collection episodes will be conductedonce every three days. This schedule ensuresthat sampling is conducted multiple times onall days of the week, across the two-monthduration of the program.
Overall completeness Overall completeness must be 75% datacapture at each monitoring site or greater.
Acceptable measurement precision for carbonyls +/- 30% relative standard deviation (RSD)Acceptable measurement accuracy for carbonyls +/- 20% bias
Acceptable measurement precision for VOCs/SNMOCs +/- 30% RSDAcceptable measurement accuracy for VOCs +/- 30% bias
Prior to field deployment, all the measurement systems were certified to ensure that eachsystem provided unbiased results.
2.4.1 Completeness
“Completeness” refers to the number of valid measurements collected compared to the
number of scheduled sampling events. Data completeness requirements are included in thereference methods (see QAPP References, Section 21). Monitoring programs that consistentlygenerate valid results have higher completeness than programs that consistently generate invalidsamples. The completeness of an air monitoring program, therefore, is a qualitative measure of how effectively the program was managed.
During the two-month study period, the completeness of the monitoring network met orexceeded the DQO of 75% data capture at each site. Overall completeness was 96%. Table 2.4-2
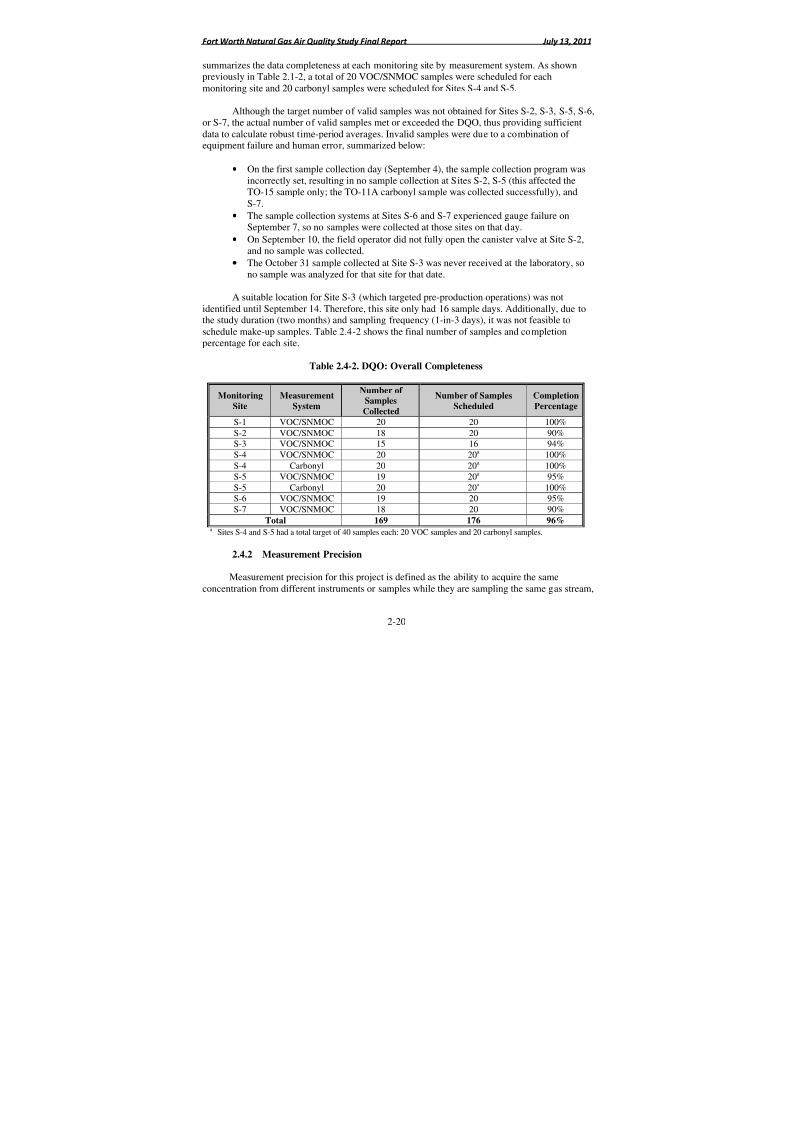
8/6/2019 Air Quality Study Final
http://slidepdf.com/reader/full/air-quality-study-final 37/320
Fort Worth Natural Gas Air Quality Study Final Report July 13, 2011
2-20
summarizes the data completeness at each monitoring site by measurement system. As shownpreviously in Table 2.1-2, a total of 20 VOC/SNMOC samples were scheduled for eachmonitoring site and 20 carbonyl samples were scheduled for Sites S-4 and S-5.
Although the target number of valid samples was not obtained for Sites S-2, S-3, S-5, S-6,
or S-7, the actual number of valid samples met or exceeded the DQO, thus providing sufficientdata to calculate robust time-period averages. Invalid samples were due to a combination of equipment failure and human error, summarized below:
• On the first sample collection day (September 4), the sample collection program wasincorrectly set, resulting in no sample collection at Sites S-2, S-5 (this affected theTO-15 sample only; the TO-11A carbonyl sample was collected successfully), andS-7.
• The sample collection systems at Sites S-6 and S-7 experienced gauge failure onSeptember 7, so no samples were collected at those sites on that day.
• On September 10, the field operator did not fully open the canister valve at Site S-2,
and no sample was collected.• The October 31 sample collected at Site S-3 was never received at the laboratory, so
no sample was analyzed for that site for that date.
A suitable location for Site S-3 (which targeted pre-production operations) was notidentified until September 14. Therefore, this site only had 16 sample days. Additionally, due tothe study duration (two months) and sampling frequency (1-in-3 days), it was not feasible toschedule make-up samples. Table 2.4-2 shows the final number of samples and completionpercentage for each site.
Table 2.4-2. DQO: Overall Completeness
Monitoring
Site
Measurement
System
Number of Samples
Collected
Number of Samples
Scheduled
Completion
Percentage
S-1 VOC/SNMOC 20 20 100%
S-2 VOC/SNMOC 18 20 90%S-3 VOC/SNMOC 15 16 94%
S-4 VOC/SNMOC 20 20a 100%
S-4 Carbonyl 20 20a 100%
S-5 VOC/SNMOC 19 20a 95%
S-5 Carbonyl 20 20a 100%S-6 VOC/SNMOC 19 20 95%
S-7 VOC/SNMOC 18 20 90%Total 169 176 96%
a Sites S-4 and S-5 had a total target of 40 samples each: 20 VOC samples and 20 carbonyl samples.
2.4.2 Measurement Precision
Measurement precision for this project is defined as the ability to acquire the sameconcentration from different instruments or samples while they are sampling the same gas stream,
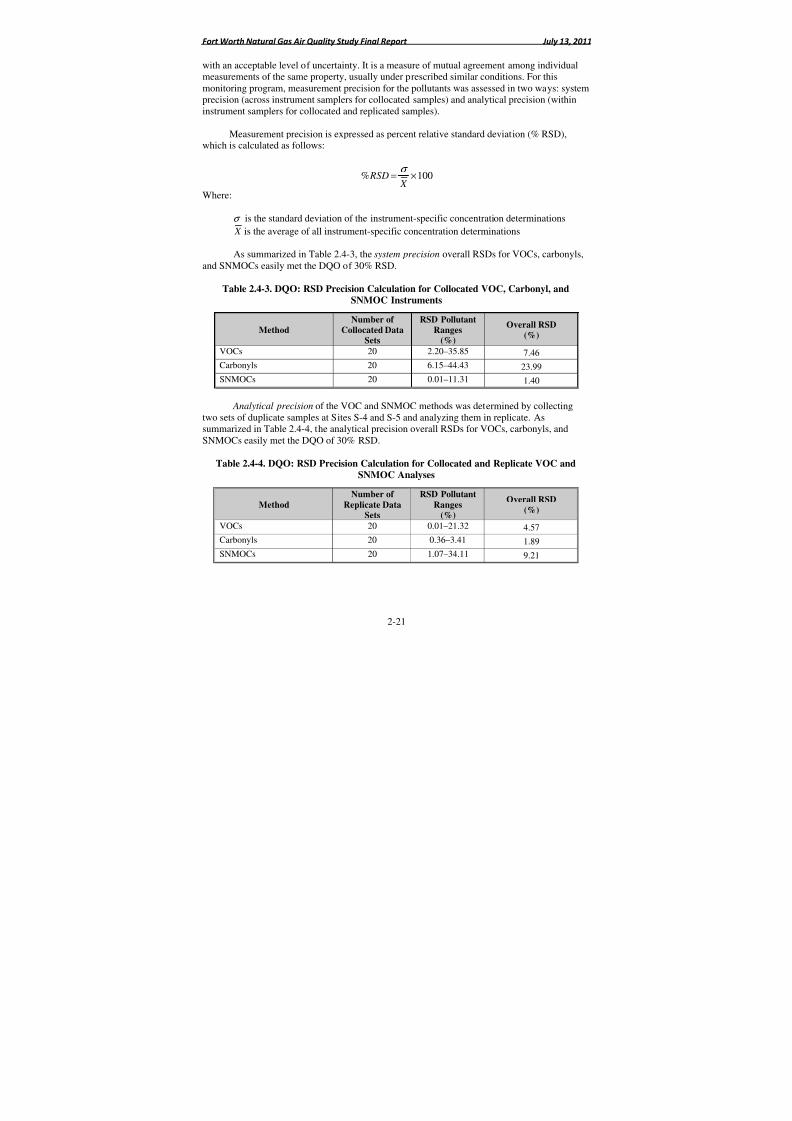
8/6/2019 Air Quality Study Final
http://slidepdf.com/reader/full/air-quality-study-final 38/320
Fort Worth Natural Gas Air Quality Study Final Report July 13, 2011
2-21
with an acceptable level of uncertainty. It is a measure of mutual agreement among individualmeasurements of the same property, usually under prescribed similar conditions. For thismonitoring program, measurement precision for the pollutants was assessed in two ways: systemprecision (across instrument samplers for collocated samples) and analytical precision (withininstrument samplers for collocated and replicated samples).
Measurement precision is expressed as percent relative standard deviation (% RSD),which is calculated as follows:
100% ×=
X RSD
σ
Where:
σ is the standard deviation of the instrument-specific concentration determinations
X is the average of all instrument-specific concentration determinations
As summarized in Table 2.4-3, the system precision overall RSDs for VOCs, carbonyls,and SNMOCs easily met the DQO of 30% RSD.
Table 2.4-3. DQO: RSD Precision Calculation for Collocated VOC, Carbonyl, andSNMOC Instruments
Analytical precision of the VOC and SNMOC methods was determined by collectingtwo sets of duplicate samples at Sites S-4 and S-5 and analyzing them in replicate. Assummarized in Table 2.4-4, the analytical precision overall RSDs for VOCs, carbonyls, andSNMOCs easily met the DQO of 30% RSD.
Table 2.4-4. DQO: RSD Precision Calculation for Collocated and Replicate VOC andSNMOC Analyses
Method
Number of
Collocated DataSets
RSD Pollutant
Ranges(%)
Overall RSD
(%)
VOCs 20 2.20–35.85 7.46
Carbonyls 20 6.15–44.43 23.99
SNMOCs 20 0.01–11.31 1.40
Method
Number of
Replicate DataSets
RSD Pollutant
Ranges(%)
Overall RSD
(%)
VOCs 20 0.01–21.32 4.57
Carbonyls 20 0.36–3.41 1.89
SNMOCs 20 1.07–34.11 9.21
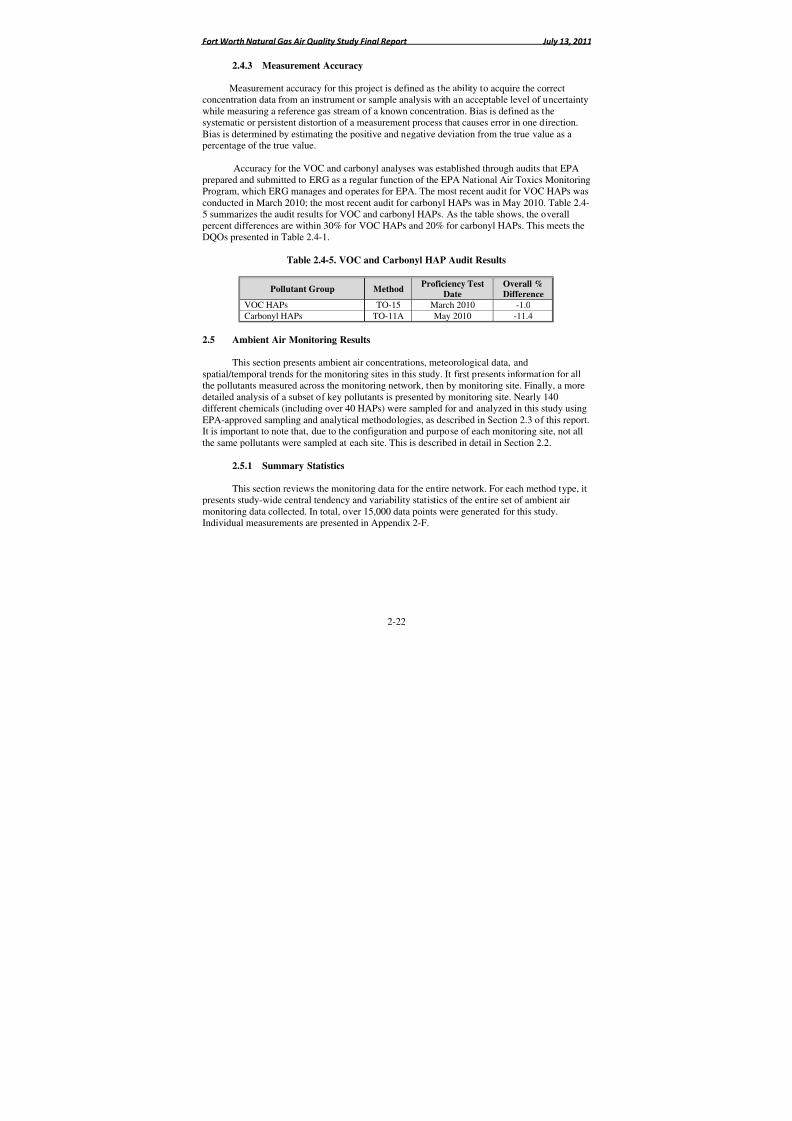
8/6/2019 Air Quality Study Final
http://slidepdf.com/reader/full/air-quality-study-final 39/320
Fort Worth Natural Gas Air Quality Study Final Report July 13, 2011
2-22
2.4.3 Measurement Accuracy
Measurement accuracy for this project is defined as the ability to acquire the correctconcentration data from an instrument or sample analysis with an acceptable level of uncertaintywhile measuring a reference gas stream of a known concentration. Bias is defined as the
systematic or persistent distortion of a measurement process that causes error in one direction.Bias is determined by estimating the positive and negative deviation from the true value as apercentage of the true value.
Accuracy for the VOC and carbonyl analyses was established through audits that EPAprepared and submitted to ERG as a regular function of the EPA National Air Toxics MonitoringProgram, which ERG manages and operates for EPA. The most recent audit for VOC HAPs wasconducted in March 2010; the most recent audit for carbonyl HAPs was in May 2010. Table 2.4-5 summarizes the audit results for VOC and carbonyl HAPs. As the table shows, the overallpercent differences are within 30% for VOC HAPs and 20% for carbonyl HAPs. This meets theDQOs presented in Table 2.4-1.
Table 2.4-5. VOC and Carbonyl HAP Audit Results
Pollutant Group MethodProficiency Test
DateOverall %Difference
VOC HAPs TO-15 March 2010 -1.0
Carbonyl HAPs TO-11A May 2010 -11.4
2.5 Ambient Air Monitoring Results
This section presents ambient air concentrations, meteorological data, andspatial/temporal trends for the monitoring sites in this study. It first presents information for allthe pollutants measured across the monitoring network, then by monitoring site. Finally, a moredetailed analysis of a subset of key pollutants is presented by monitoring site. Nearly 140different chemicals (including over 40 HAPs) were sampled for and analyzed in this study usingEPA-approved sampling and analytical methodologies, as described in Section 2.3 of this report.It is important to note that, due to the configuration and purpose of each monitoring site, not allthe same pollutants were sampled at each site. This is described in detail in Section 2.2.
2.5.1 Summary Statistics
This section reviews the monitoring data for the entire network. For each method type, itpresents study-wide central tendency and variability statistics of the entire set of ambient airmonitoring data collected. In total, over 15,000 data points were generated for this study.Individual measurements are presented in Appendix 2-F.
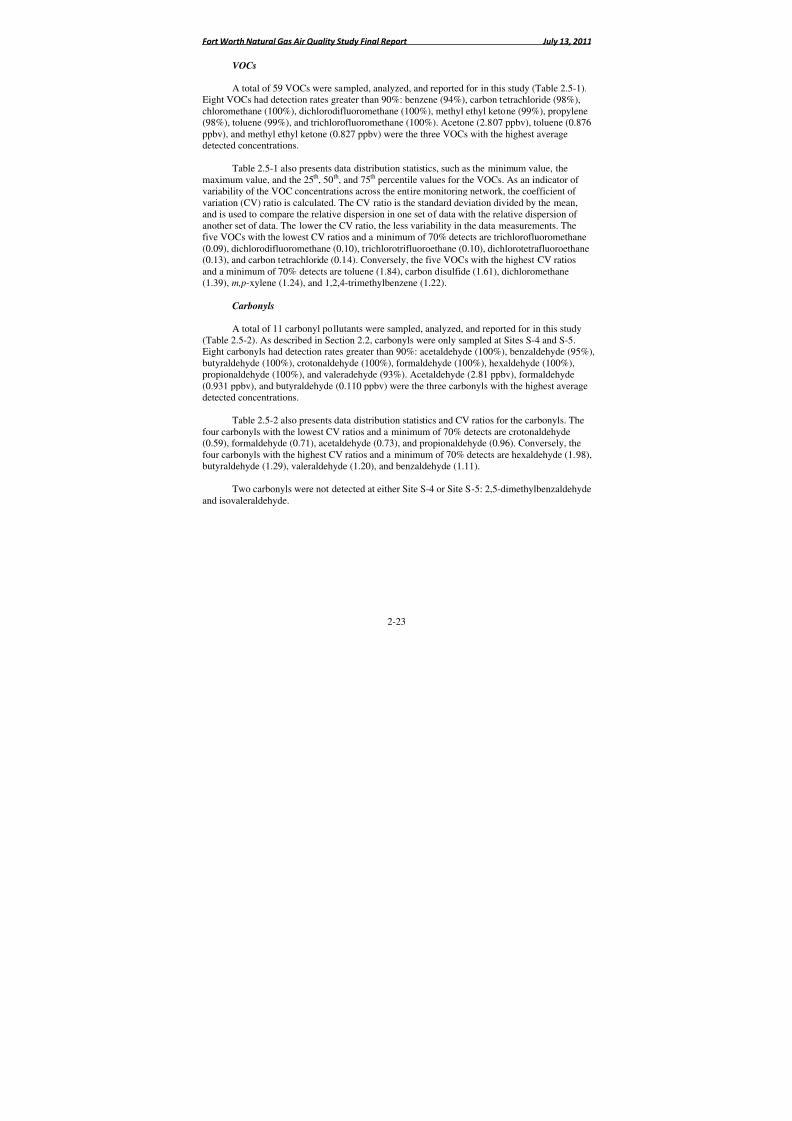
8/6/2019 Air Quality Study Final
http://slidepdf.com/reader/full/air-quality-study-final 40/320
Fort Worth Natural Gas Air Quality Study Final Report July 13, 2011
2-23
VOCs
A total of 59 VOCs were sampled, analyzed, and reported for in this study (Table 2.5-1).Eight VOCs had detection rates greater than 90%: benzene (94%), carbon tetrachloride (98%),chloromethane (100%), dichlorodifluoromethane (100%), methyl ethyl ketone (99%), propylene
(98%), toluene (99%), and trichlorofluoromethane (100%). Acetone (2.807 ppbv), toluene (0.876ppbv), and methyl ethyl ketone (0.827 ppbv) were the three VOCs with the highest averagedetected concentrations.
Table 2.5-1 also presents data distribution statistics, such as the minimum value, themaximum value, and the 25th, 50th, and 75th percentile values for the VOCs. As an indicator of variability of the VOC concentrations across the entire monitoring network, the coefficient of variation (CV) ratio is calculated. The CV ratio is the standard deviation divided by the mean,and is used to compare the relative dispersion in one set of data with the relative dispersion of another set of data. The lower the CV ratio, the less variability in the data measurements. Thefive VOCs with the lowest CV ratios and a minimum of 70% detects are trichlorofluoromethane
(0.09), dichlorodifluoromethane (0.10), trichlorotrifluoroethane (0.10), dichlorotetrafluoroethane(0.13), and carbon tetrachloride (0.14). Conversely, the five VOCs with the highest CV ratiosand a minimum of 70% detects are toluene (1.84), carbon disulfide (1.61), dichloromethane(1.39), m,p-xylene (1.24), and 1,2,4-trimethylbenzene (1.22).
Carbonyls
A total of 11 carbonyl pollutants were sampled, analyzed, and reported for in this study(Table 2.5-2). As described in Section 2.2, carbonyls were only sampled at Sites S-4 and S-5.Eight carbonyls had detection rates greater than 90%: acetaldehyde (100%), benzaldehyde (95%),butyraldehyde (100%), crotonaldehyde (100%), formaldehyde (100%), hexaldehyde (100%),propionaldehyde (100%), and valeradehyde (93%). Acetaldehyde (2.81 ppbv), formaldehyde(0.931 ppbv), and butyraldehyde (0.110 ppbv) were the three carbonyls with the highest averagedetected concentrations.
Table 2.5-2 also presents data distribution statistics and CV ratios for the carbonyls. Thefour carbonyls with the lowest CV ratios and a minimum of 70% detects are crotonaldehyde(0.59), formaldehyde (0.71), acetaldehyde (0.73), and propionaldehyde (0.96). Conversely, thefour carbonyls with the highest CV ratios and a minimum of 70% detects are hexaldehyde (1.98),butyraldehyde (1.29), valeraldehyde (1.20), and benzaldehyde (1.11).
Two carbonyls were not detected at either Site S-4 or Site S-5: 2,5-dimethylbenzaldehydeand isovaleraldehyde.
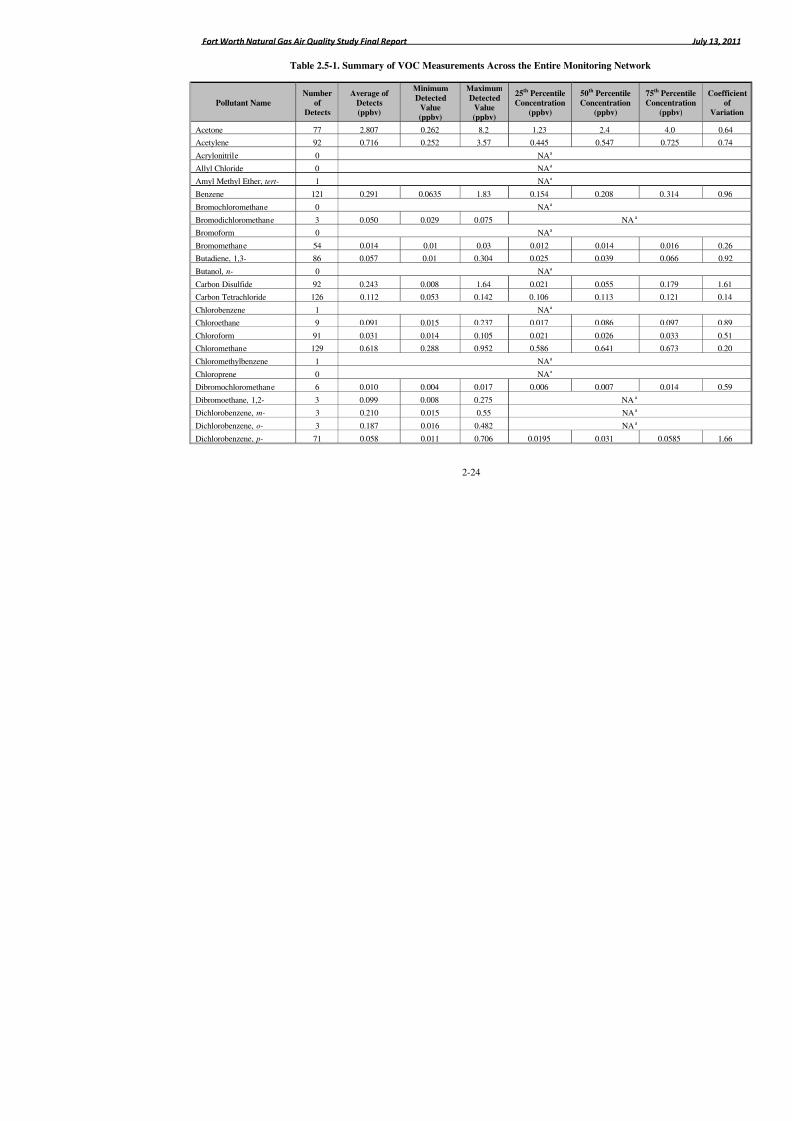
8/6/2019 Air Quality Study Final
http://slidepdf.com/reader/full/air-quality-study-final 41/320
Fort Worth Natural Gas Air Quality Study Final Report
2-24
Table 2.5-1. Summary of VOC Measurements Across the Entire Monitoring N
Pollutant Name
Number
of
Detects
Average of
Detects
(ppbv)
Minimum
Detected
Value
(ppbv)
Maximum
Detected
Value
(ppbv)
25th
Percentile
Concentration
(ppbv)
50th
Percen
Concentrat
(ppbv)
Acetone 77 2.807 0.262 8.2 1.23 2.4
Acetylene 92 0.716 0.252 3.57 0.445 0.547
Acrylonitrile 0 NAa
Allyl Chloride 0 NAa
Amyl Methyl Ether, tert - 1 NAa
Benzene 121 0.291 0.0635 1.83 0.154 0.208
Bromochloromethane 0 NAa
Bromodichloromethane 3 0.050 0.029 0.075
Bromoform 0 NAa
Bromomethane 54 0.014 0.01 0.03 0.012 0.014
Butadiene, 1,3- 86 0.057 0.01 0.304 0.025 0.039
Butanol, n- 0 NAa
Carbon Disulfide 92 0.243 0.008 1.64 0.021 0.055
Carbon Tetrachloride 126 0.112 0.053 0.142 0.106 0.113
Chlorobenzene 1 NAa
Chloroethane 9 0.091 0.015 0.237 0.017 0.086
Chloroform 91 0.031 0.014 0.105 0.021 0.026
Chloromethane 129 0.618 0.288 0.952 0.586 0.641
Chloromethylbenzene 1 NAa
Chloroprene 0 NAa
Dibromochloromethane 6 0.010 0.004 0.017 0.006 0.007
Dibromoethane, 1,2- 3 0.099 0.008 0.275
Dichlorobenzene, m- 3 0.210 0.015 0.55
Dichlorobenzene, o- 3 0.187 0.016 0.482
Dichlorobenzene, p- 71 0.058 0.011 0.706 0.0195 0.031
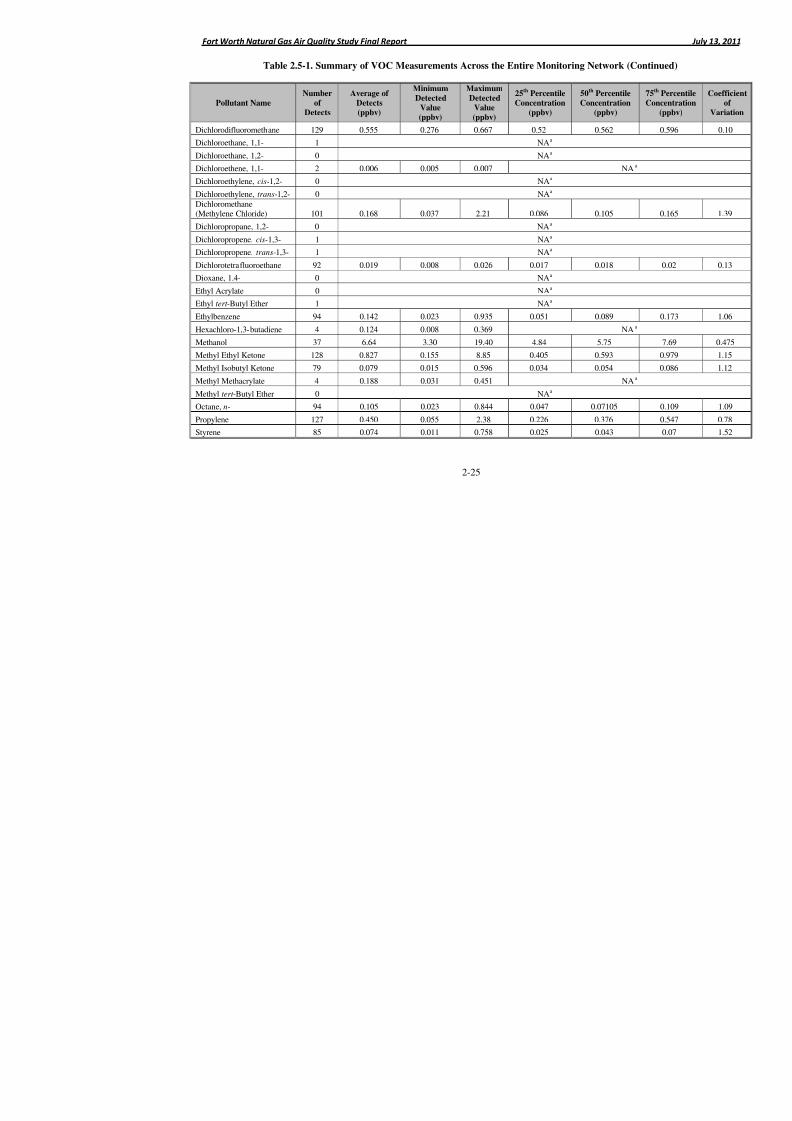
8/6/2019 Air Quality Study Final
http://slidepdf.com/reader/full/air-quality-study-final 42/320
Fort Worth Natural Gas Air Quality Study Final Report
2-25
Table 2.5-1. Summary of VOC Measurements Across the Entire Monitoring Networ
Pollutant Name
Number
of
Detects
Average of
Detects
(ppbv)
Minimum
Detected
Value
(ppbv)
Maximum
Detected
Value
(ppbv)
25th
Percentile
Concentration
(ppbv)
50th
Percen
Concentrat
(ppbv)
Dichlorodifluoromethane 129 0.555 0.276 0.667 0.52 0.562
Dichloroethane, 1,1- 1 NAa
Dichloroethane, 1,2- 0 NAa
Dichloroethene, 1,1- 2 0.006 0.005 0.007
Dichloroethylene, cis-1,2- 0 NAa
Dichloroethylene, trans-1,2- 0 NAa Dichloromethane(Methylene Chloride) 101 0.168 0.037 2.21 0.086 0.105
Dichloropropane, 1,2- 0 NAa
Dichloropropene, cis-1,3- 1 NAa
Dichloropropene, trans-1,3- 1 NAa
Dichlorotetrafluoroethane 92 0.019 0.008 0.026 0.017 0.018
Dioxane, 1.4- 0 NAa
Ethyl Acrylate 0 NAa
Ethyl tert -Butyl Ether 1 NAa
Ethylbenzene 94 0.142 0.023 0.935 0.051 0.089
Hexachloro-1,3-butadiene 4 0.124 0.008 0.369
Methanol 37 6.64 3.30 19.40 4.84 5.75
Methyl Ethyl Ketone 128 0.827 0.155 8.85 0.405 0.593
Methyl Isobutyl Ketone 79 0.079 0.015 0.596 0.034 0.054
Methyl Methacrylate 4 0.188 0.031 0.451
Methyl tert -Butyl Ether 0 NAa
Octane, n- 94 0.105 0.023 0.844 0.047 0.07105
Propylene 127 0.450 0.055 2.38 0.226 0.376
Styrene 85 0.074 0.011 0.758 0.025 0.043
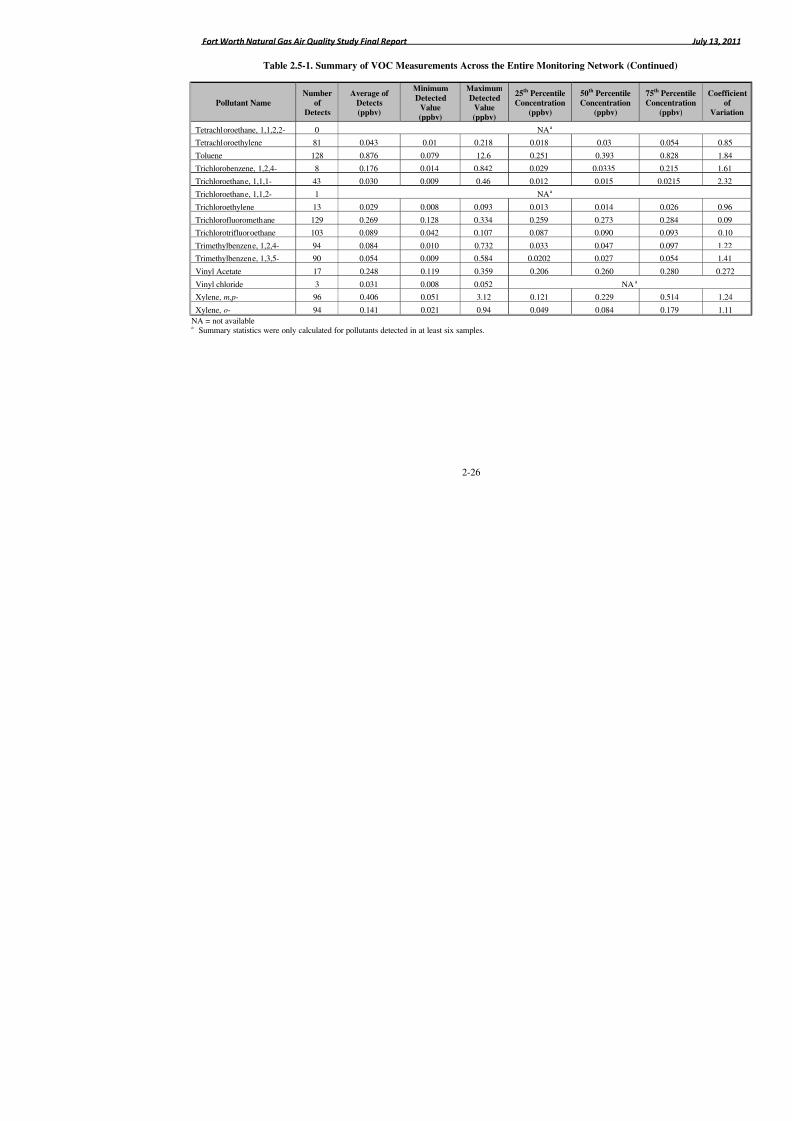
8/6/2019 Air Quality Study Final
http://slidepdf.com/reader/full/air-quality-study-final 43/320
Fort Worth Natural Gas Air Quality Study Final Report
2-26
Table 2.5-1. Summary of VOC Measurements Across the Entire Monitoring Networ
Pollutant Name
Number
of
Detects
Average of
Detects
(ppbv)
Minimum
Detected
Value
(ppbv)
Maximum
Detected
Value
(ppbv)
25th
Percentile
Concentration
(ppbv)
50th
Percen
Concentrat
(ppbv)
Tetrachloroethane, 1,1,2,2- 0 NAa
Tetrachloroethylene 81 0.043 0.01 0.218 0.018 0.03
Toluene 128 0.876 0.079 12.6 0.251 0.393
Trichlorobenzene, 1,2,4- 8 0.176 0.014 0.842 0.029 0.0335
Trichloroethane, 1,1,1- 43 0.030 0.009 0.46 0.012 0.015
Trichloroethane, 1,1,2- 1 NAa
Trichloroethylene 13 0.029 0.008 0.093 0.013 0.014
Trichlorofluoromethane 129 0.269 0.128 0.334 0.259 0.273
Trichlorotrifluoroethane 103 0.089 0.042 0.107 0.087 0.090
Trimethylbenzene, 1,2,4- 94 0.084 0.010 0.732 0.033 0.047
Trimethylbenzene, 1,3,5- 90 0.054 0.009 0.584 0.0202 0.027
Vinyl Acetate 17 0.248 0.119 0.359 0.206 0.260
Vinyl chloride 3 0.031 0.008 0.052
Xylene, m,p- 96 0.406 0.051 3.12 0.121 0.229
Xylene, o- 94 0.141 0.021 0.94 0.049 0.084
NA = not availablea Summary statistics were only calculated for pollutants detected in at least six samples.
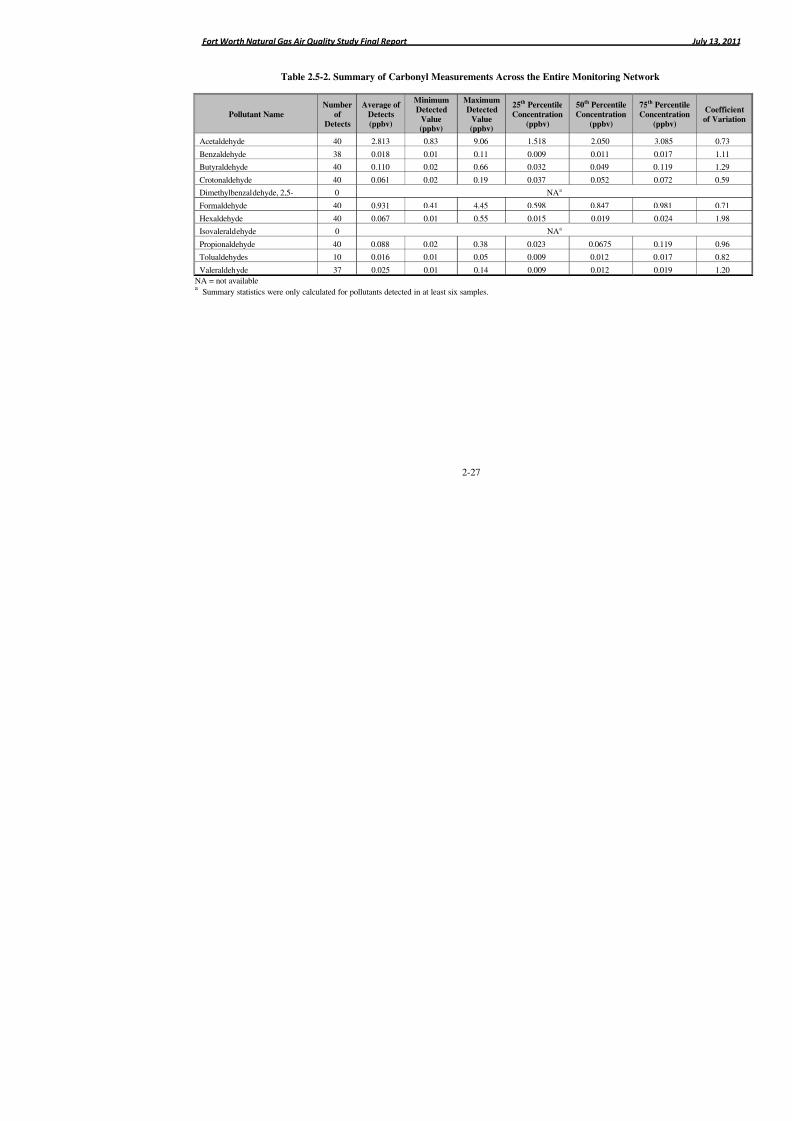
8/6/2019 Air Quality Study Final
http://slidepdf.com/reader/full/air-quality-study-final 44/320
Fort Worth Natural Gas Air Quality Study Final Report
2-27
Table 2.5-2. Summary of Carbonyl Measurements Across the Entire Monitoring
Pollutant Name
Number
of
Detects
Average of
Detects
(ppbv)
Minimum
Detected
Value
(ppbv)
Maximum
Detected
Value
(ppbv)
25th
Percentile
Concentration
(ppbv)
50th
Percent
Concentratio
(ppbv)
Acetaldehyde 40 2.813 0.83 9.06 1.518 2.050
Benzaldehyde 38 0.018 0.01 0.11 0.009 0.011
Butyraldehyde 40 0.110 0.02 0.66 0.032 0.049
Crotonaldehyde 40 0.061 0.02 0.19 0.037 0.052
Dimethylbenzaldehyde, 2,5- 0 NAa
Formaldehyde 40 0.931 0.41 4.45 0.598 0.847
Hexaldehyde 40 0.067 0.01 0.55 0.015 0.019
Isovaleraldehyde 0 NAa
Propionaldehyde 40 0.088 0.02 0.38 0.023 0.0675
Tolualdehydes 10 0.016 0.01 0.05 0.009 0.012
Valeraldehyde 37 0.025 0.01 0.14 0.009 0.012
NA = not availablea
Summary statistics were only calculated for pollutants detected in at least six samples.
8/6/2019 Air Quality Study Final
http://slidepdf.com/reader/full/air-quality-study-final 45/320
Fort Worth Natural Gas Air Quality Study Final Report July 13, 2011
2-28
Methane and Speciated Non-Methane Organics
Methane was detected in each sample taken (100%)—37 samples at Sites S-6 and S-7(Table 2.5-3). Methane had the highest concentrations of the study analytes (average of detects =5,686 ppbv). Methane is not a HAP, and the overall CV ratio was 0.24.
A total of 67 SNMOCs were sampled, analyzed, and reported for in this study (Table 2.5-3). Seven speciated organics had detection rates greater than 90%: n-butane (93%), ethane(100%), ethylene (99%), isobutane (97%), isobutene/1-butene (97%), n-pentane (98%), andpropane (100%). Ethane (16.028 ppbv), propane (5.325 ppbv), and isopentane (4.028 ppbv) werethe three SNMOCs with the highest average detected concentrations.
Data distribution statistics and CV ratios for methane and the SNMOCs are alsopresented in Table 2.5-3. The five SNMOCs with the lowest CV ratios and a minimum of 70%detects are 1-hexene (0.48), isoprene (0.63), ethylene (0.69), 3-methylehexane (0.77), and 2-methylheptane (0.85). Conversely, the five VOCs with the highest CV ratios and a minimum of
70% detects are n-decane (1.92), n-nonane (1.90), isopentane (1.84), trans-2-butene (1.83), andn-Pentane (1.80).
All SNMOCs were detected at least once during the study period.
2.5.2 Study Period Averaging
This section presents information on the average pollutant concentrations, at eachmonitoring site, for the study period. Non-detect observations were replaced with zeroes whencalculating these averages. This section focuses only on pollutants that were detected in at least70% of the samples, because average concentrations for these pollutants have the least influencefrom non-detect observations. Thus, study period averages for pollutants that had more than 30%of their samples as non-detects were not calculated. This averaging technique is consistent withthe study period averaging EPA uses in its Schools Air Toxics Monitoring Program (SATMP)5 and National-Scale Air Toxics Assessment (NATA) model-to-monitor comparison.6 In additionto the study period average, this section presents the confidence intervals for the study periodaverage concentrations. The confidence interval is calculated using Student’s T -test at the 95th percentile confidence level.
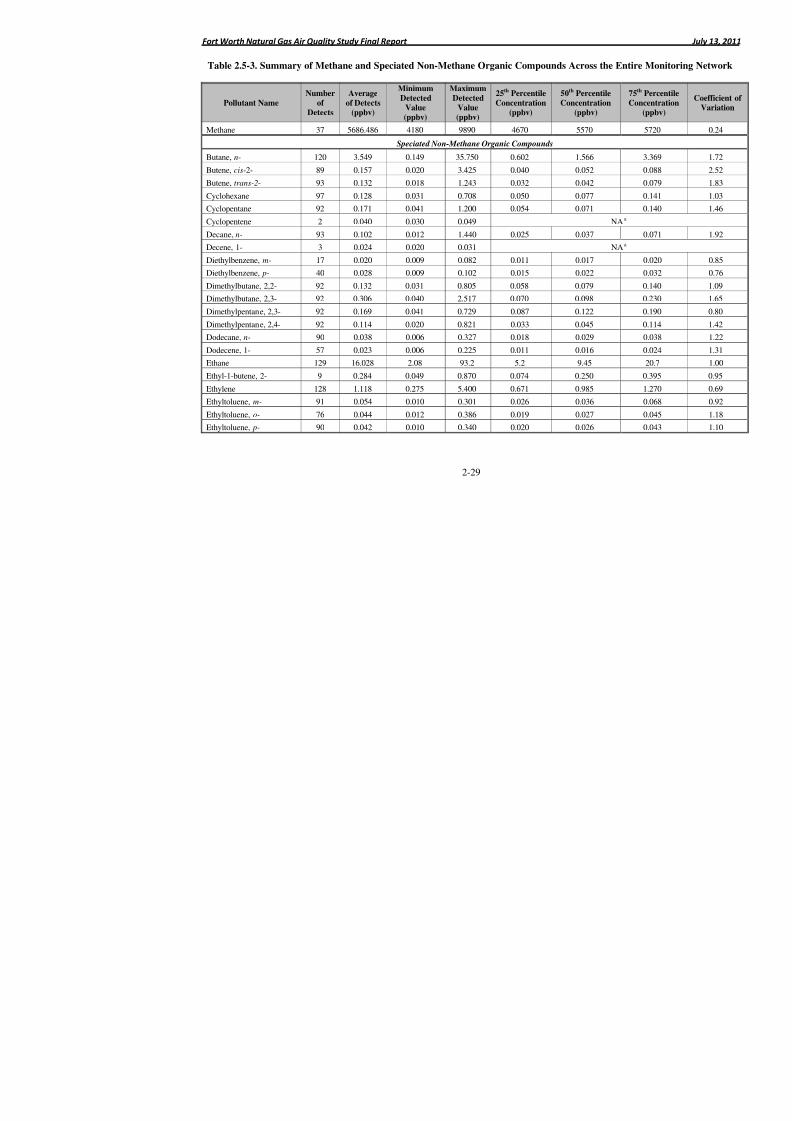
8/6/2019 Air Quality Study Final
http://slidepdf.com/reader/full/air-quality-study-final 46/320
Fort Worth Natural Gas Air Quality Study Final Report
2-29
Table 2.5-3. Summary of Methane and Speciated Non-Methane Organic Compounds Across the E
Pollutant Name
Number
of
Detects
Average
of Detects
(ppbv)
Minimum
Detected
Value
(ppbv)
Maximum
Detected
Value
(ppbv)
25th
Percentile
Concentration
(ppbv)
50th
Percentile
Concentration
(ppbv)
Methane 37 5686.486 4180 9890 4670 5570
Speciated Non-Methane Organic Compounds
Butane, n- 120 3.549 0.149 35.750 0.602 1.566
Butene, cis-2- 89 0.157 0.020 3.425 0.040 0.052
Butene, trans-2- 93 0.132 0.018 1.243 0.032 0.042
Cyclohexane 97 0.128 0.031 0.708 0.050 0.077
Cyclopentane 92 0.171 0.041 1.200 0.054 0.071
Cyclopentene 2 0.040 0.030 0.049 N
Decane, n- 93 0.102 0.012 1.440 0.025 0.037
Decene, 1- 3 0.024 0.020 0.031 N
Diethylbenzene, m- 17 0.020 0.009 0.082 0.011 0.017
Diethylbenzene, p- 40 0.028 0.009 0.102 0.015 0.022
Dimethylbutane, 2,2- 92 0.132 0.031 0.805 0.058 0.079
Dimethylbutane, 2,3- 92 0.306 0.040 2.517 0.070 0.098
Dimethylpentane, 2,3- 92 0.169 0.041 0.729 0.087 0.122
Dimethylpentane, 2,4- 92 0.114 0.020 0.821 0.033 0.045
Dodecane, n- 90 0.038 0.006 0.327 0.018 0.029
Dodecene, 1- 57 0.023 0.006 0.225 0.011 0.016
Ethane 129 16.028 2.08 93.2 5.2 9.45
Ethyl-1-butene, 2- 9 0.284 0.049 0.870 0.074 0.250 Ethylene 128 1.118 0.275 5.400 0.671 0.985
Ethyltoluene, m- 91 0.054 0.010 0.301 0.026 0.036
Ethyltoluene, o- 76 0.044 0.012 0.386 0.019 0.027
Ethyltoluene, p- 90 0.042 0.010 0.340 0.020 0.026
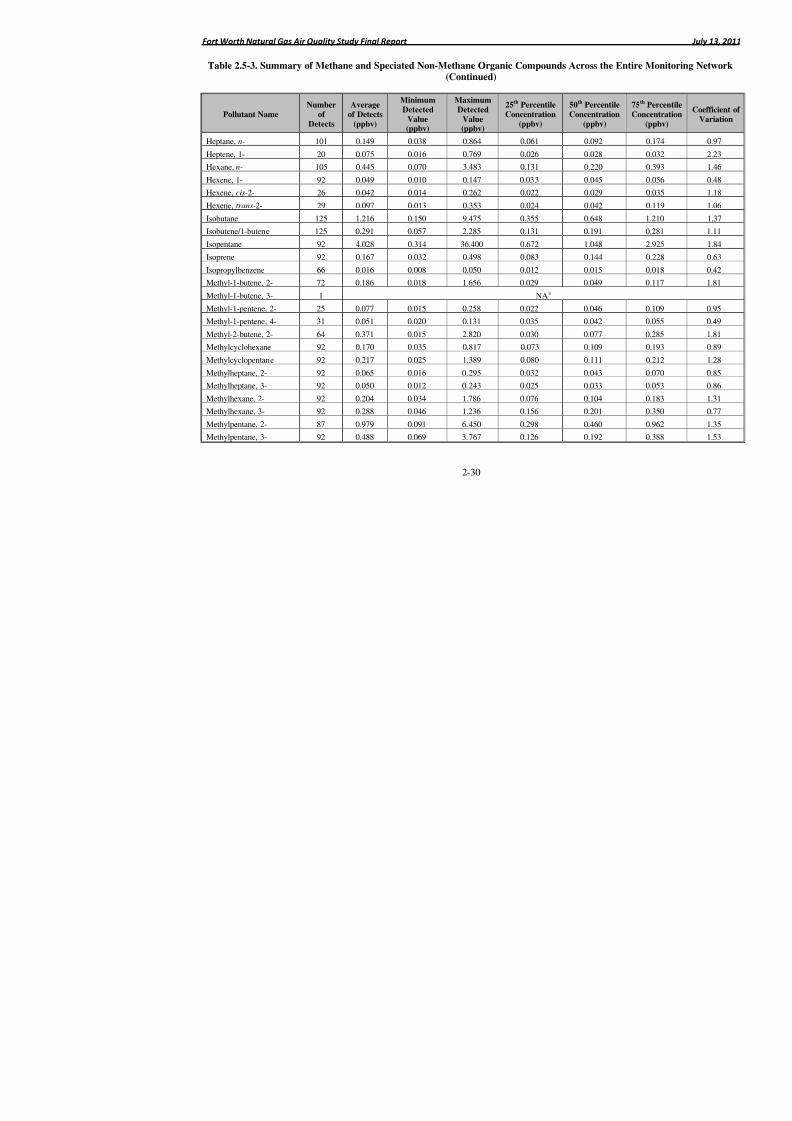
8/6/2019 Air Quality Study Final
http://slidepdf.com/reader/full/air-quality-study-final 47/320
Fort Worth Natural Gas Air Quality Study Final Report
2-30
Table 2.5-3. Summary of Methane and Speciated Non-Methane Organic Compounds Across the E(Continued)
Pollutant Name
Number
of
Detects
Average
of Detects
(ppbv)
Minimum
Detected
Value
(ppbv)
Maximum
Detected
Value
(ppbv)
25th
Percentile
Concentration
(ppbv)
50th
Percentile
Concentration
(ppbv)
Heptane, n- 101 0.149 0.038 0.864 0.061 0.092
Heptene, 1- 20 0.075 0.016 0.769 0.026 0.028
Hexane, n- 105 0.445 0.070 3.483 0.131 0.220
Hexene, 1- 92 0.049 0.010 0.147 0.033 0.045
Hexene, cis-2- 26 0.042 0.014 0.262 0.022 0.029
Hexene, trans-2- 29 0.097 0.013 0.353 0.024 0.042
Isobutane 125 1.216 0.150 9.475 0.355 0.648
Isobutene/1-butene 125 0.291 0.057 2.285 0.131 0.191
Isopentane 92 4.028 0.314 36.400 0.672 1.048
Isoprene 92 0.167 0.032 0.498 0.083 0.144
Isopropylbenzene 66 0.016 0.008 0.050 0.012 0.015
Methyl-1-butene, 2- 72 0.186 0.018 1.656 0.029 0.049
Methyl-1-butene, 3- 1 NAa
Methyl-1-pentene, 2- 25 0.077 0.015 0.258 0.022 0.046
Methyl-1-pentene, 4- 31 0.051 0.020 0.131 0.035 0.042
Methyl-2-butene, 2- 64 0.371 0.015 2.820 0.030 0.077
Methylcyclohexane 92 0.170 0.035 0.817 0.073 0.109
Methylcyclopentane 92 0.217 0.025 1.389 0.080 0.111
Methylheptane, 2- 92 0.065 0.016 0.295 0.032 0.043
Methylheptane, 3- 92 0.050 0.012 0.243 0.025 0.033
Methylhexane, 2- 92 0.204 0.034 1.786 0.076 0.104
Methylhexane, 3- 92 0.288 0.046 1.236 0.156 0.201
Methylpentane, 2- 87 0.979 0.091 6.450 0.298 0.460
Methylpentane, 3- 92 0.488 0.069 3.767 0.126 0.192
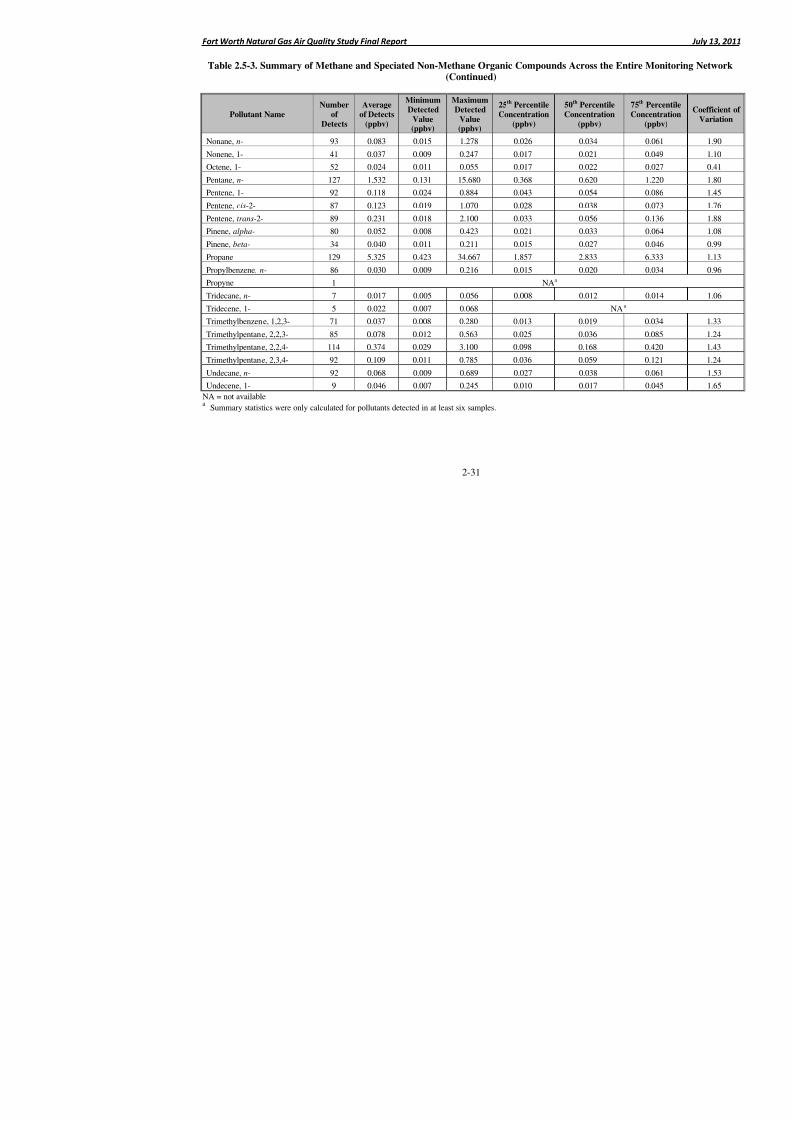
8/6/2019 Air Quality Study Final
http://slidepdf.com/reader/full/air-quality-study-final 48/320
Fort Worth Natural Gas Air Quality Study Final Report
2-31
Table 2.5-3. Summary of Methane and Speciated Non-Methane Organic Compounds Across the E(Continued)
Pollutant Name
Number
of
Detects
Average
of Detects
(ppbv)
Minimum
Detected
Value
(ppbv)
Maximum
Detected
Value
(ppbv)
25th
Percentile
Concentration
(ppbv)
50th
Percentile
Concentration
(ppbv)
Nonane, n- 93 0.083 0.015 1.278 0.026 0.034
Nonene, 1- 41 0.037 0.009 0.247 0.017 0.021
Octene, 1- 52 0.024 0.011 0.055 0.017 0.022
Pentane, n- 127 1.532 0.131 15.680 0.368 0.620
Pentene, 1- 92 0.118 0.024 0.884 0.043 0.054
Pentene, cis-2- 87 0.123 0.019 1.070 0.028 0.038
Pentene, trans-2- 89 0.231 0.018 2.100 0.033 0.056
Pinene, alpha- 80 0.052 0.008 0.423 0.021 0.033
Pinene, beta- 34 0.040 0.011 0.211 0.015 0.027
Propane 129 5.325 0.423 34.667 1.857 2.833
Propylbenzene, n- 86 0.030 0.009 0.216 0.015 0.020
Propyne 1 NAa
Tridecane, n- 7 0.017 0.005 0.056 0.008 0.012
Tridecene, 1- 5 0.022 0.007 0.068 NA
Trimethylbenzene, 1,2,3- 71 0.037 0.008 0.280 0.013 0.019
Trimethylpentane, 2,2,3- 85 0.078 0.012 0.563 0.025 0.036
Trimethylpentane, 2,2,4- 114 0.374 0.029 3.100 0.098 0.168
Trimethylpentane, 2,3,4- 92 0.109 0.011 0.785 0.036 0.059
Undecane, n- 92 0.068 0.009 0.689 0.027 0.038
Undecene, 1- 9 0.046 0.007 0.245 0.010 0.017
NA = not availablea
Summary statistics were only calculated for pollutants detected in at least six samples.
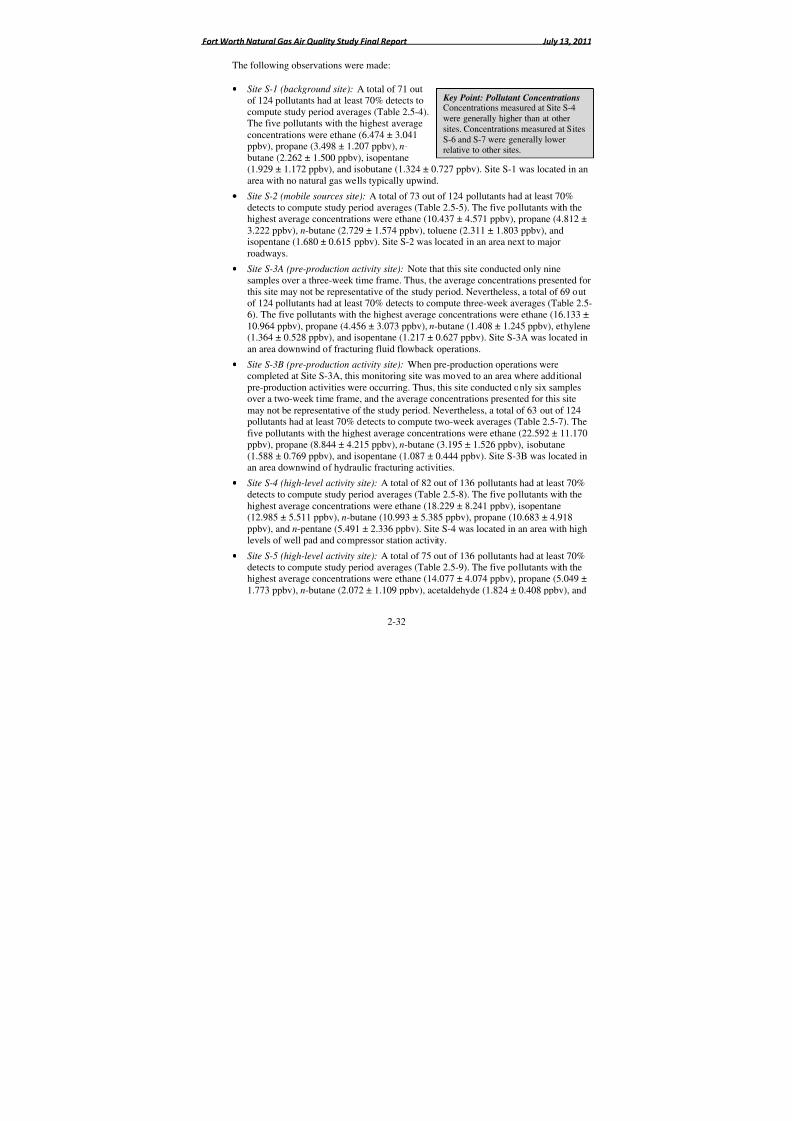
8/6/2019 Air Quality Study Final
http://slidepdf.com/reader/full/air-quality-study-final 49/320
Fort Worth Natural Gas Air Quality Study Final Report July 13, 2011
2-32
The following observations were made:
• Site S-1 (background site): A total of 71 outof 124 pollutants had at least 70% detects tocompute study period averages (Table 2.5-4).
The five pollutants with the highest averageconcentrations were ethane (6.474 ± 3.041ppbv), propane (3.498 ± 1.207 ppbv), n-butane (2.262 ± 1.500 ppbv), isopentane(1.929 ± 1.172 ppbv), and isobutane (1.324 ± 0.727 ppbv). Site S-1 was located in anarea with no natural gas wells typically upwind.
• Site S-2 (mobile sources site): A total of 73 out of 124 pollutants had at least 70%detects to compute study period averages (Table 2.5-5). The five pollutants with thehighest average concentrations were ethane (10.437 ± 4.571 ppbv), propane (4.812 ±3.222 ppbv), n-butane (2.729 ± 1.574 ppbv), toluene (2.311 ± 1.803 ppbv), andisopentane (1.680 ± 0.615 ppbv). Site S-2 was located in an area next to major
roadways.• Site S-3A (pre-production activity site): Note that this site conducted only nine
samples over a three-week time frame. Thus, the average concentrations presented forthis site may not be representative of the study period. Nevertheless, a total of 69 outof 124 pollutants had at least 70% detects to compute three-week averages (Table 2.5-6). The five pollutants with the highest average concentrations were ethane (16.133 ±10.964 ppbv), propane (4.456 ± 3.073 ppbv), n-butane (1.408 ± 1.245 ppbv), ethylene(1.364 ± 0.528 ppbv), and isopentane (1.217 ± 0.627 ppbv). Site S-3A was located inan area downwind of fracturing fluid flowback operations.
• Site S-3B (pre-production activity site): When pre-production operations were
completed at Site S-3A, this monitoring site was moved to an area where additionalpre-production activities were occurring. Thus, this site conducted only six samplesover a two-week time frame, and the average concentrations presented for this sitemay not be representative of the study period. Nevertheless, a total of 63 out of 124pollutants had at least 70% detects to compute two-week averages (Table 2.5-7). Thefive pollutants with the highest average concentrations were ethane (22.592 ± 11.170ppbv), propane (8.844 ± 4.215 ppbv), n-butane (3.195 ± 1.526 ppbv), isobutane(1.588 ± 0.769 ppbv), and isopentane (1.087 ± 0.444 ppbv). Site S-3B was located inan area downwind of hydraulic fracturing activities.
• Site S-4 (high-level activity site): A total of 82 out of 136 pollutants had at least 70%detects to compute study period averages (Table 2.5-8). The five pollutants with the
highest average concentrations were ethane (18.229 ± 8.241 ppbv), isopentane(12.985 ± 5.511 ppbv), n-butane (10.993 ± 5.385 ppbv), propane (10.683 ± 4.918ppbv), and n-pentane (5.491 ± 2.336 ppbv). Site S-4 was located in an area with highlevels of well pad and compressor station activity.
• Site S-5 (high-level activity site): A total of 75 out of 136 pollutants had at least 70%detects to compute study period averages (Table 2.5-9). The five pollutants with thehighest average concentrations were ethane (14.077 ± 4.074 ppbv), propane (5.049 ±1.773 ppbv), n-butane (2.072 ± 1.109 ppbv), acetaldehyde (1.824 ± 0.408 ppbv), and
Key Point: Pollutant ConcentrationsConcentrations measured at Site S-4were generally higher than at other
sites. Concentrations measured at SitesS-6 and S-7 were generally lowerrelative to other sites.
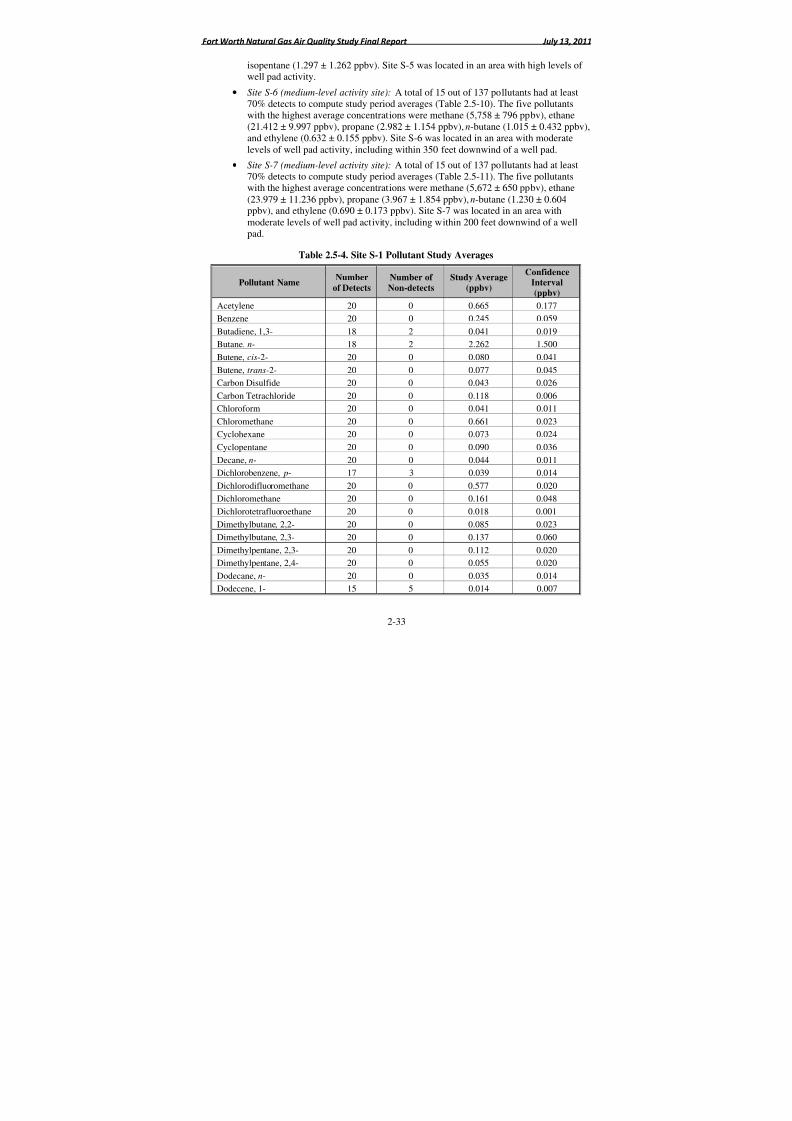
8/6/2019 Air Quality Study Final
http://slidepdf.com/reader/full/air-quality-study-final 50/320
Fort Worth Natural Gas Air Quality Study Final Report July 13, 2011
2-33
isopentane (1.297 ± 1.262 ppbv). Site S-5 was located in an area with high levels of well pad activity.
• Site S-6 (medium-level activity site): A total of 15 out of 137 pollutants had at least70% detects to compute study period averages (Table 2.5-10). The five pollutantswith the highest average concentrations were methane (5,758 ± 796 ppbv), ethane
(21.412 ± 9.997 ppbv), propane (2.982 ± 1.154 ppbv), n-butane (1.015 ± 0.432 ppbv),and ethylene (0.632 ± 0.155 ppbv). Site S-6 was located in an area with moderatelevels of well pad activity, including within 350 feet downwind of a well pad.
• Site S-7 (medium-level activity site): A total of 15 out of 137 pollutants had at least70% detects to compute study period averages (Table 2.5-11). The five pollutantswith the highest average concentrations were methane (5,672 ± 650 ppbv), ethane(23.979 ± 11.236 ppbv), propane (3.967 ± 1.854 ppbv), n-butane (1.230 ± 0.604ppbv), and ethylene (0.690 ± 0.173 ppbv). Site S-7 was located in an area withmoderate levels of well pad activity, including within 200 feet downwind of a wellpad.
Table 2.5-4. Site S-1 Pollutant Study Averages
Pollutant NameNumber
of Detects
Number of
Non-detects
Study Average
(ppbv)
ConfidenceInterval
(ppbv)
Acetylene 20 0 0.665 0.177
Benzene 20 0 0.245 0.059
Butadiene, 1,3- 18 2 0.041 0.019
Butane, n- 18 2 2.262 1.500
Butene, cis-2- 20 0 0.080 0.041
Butene, trans-2- 20 0 0.077 0.045
Carbon Disulfide 20 0 0.043 0.026
Carbon Tetrachloride 20 0 0.118 0.006
Chloroform 20 0 0.041 0.011
Chloromethane 20 0 0.661 0.023
Cyclohexane 20 0 0.073 0.024
Cyclopentane 20 0 0.090 0.036
Decane, n- 20 0 0.044 0.011
Dichlorobenzene, p- 17 3 0.039 0.014
Dichlorodifluoromethane 20 0 0.577 0.020
Dichloromethane 20 0 0.161 0.048
Dichlorotetrafluoroethane 20 0 0.018 0.001
Dimethylbutane, 2,2- 20 0 0.085 0.023
Dimethylbutane, 2,3- 20 0 0.137 0.060
Dimethylpentane, 2,3- 20 0 0.112 0.020
Dimethylpentane, 2,4- 20 0 0.055 0.020
Dodecane, n- 20 0 0.035 0.014
Dodecene, 1- 15 5 0.014 0.007

8/6/2019 Air Quality Study Final
http://slidepdf.com/reader/full/air-quality-study-final 51/320
Fort Worth Natural Gas Air Quality Study Final Report July 13, 2011
2-34
Table 2.5-4. Site S-1 Pollutant Study Averages (Continued)
Pollutant NameNumber
of Detects
Number of
Non-detects
Study Average
(ppbv)
ConfidenceInterval
(ppbv)
Ethane 20 0 6.475 3.041
Ethylbenzene 20 0 0.082 0.023
Ethylene 20 0 1.181 0.271
Ethyltoluene, m- 20 0 0.035 0.009
Ethyltoluene, o- 16 4 0.024 0.009
Ethyltoluene, p- 20 0 0.025 0.005
Heptane, n- 20 0 0.086 0.028
Hexane, n- 20 0 0.204 0.084
Hexene, 1- 20 0 0.041 0.006
Isobutane 20 0 1.324 0.727Isobutene/1-Butene 20 0 0.294 0.119
Isopentane 20 0 1.929 1.172
Isoprene 20 0 0.266 0.062
Methyl Ethyl Ketone 20 0 0.817 0.157
Methyl Isobutyl Ketone 18 2 0.046 0.013
Methyl-1-butene, 2- 16 4 0.064 0.047
Methylcyclohexane 20 0 0.106 0.031
Methylcyclopentane 20 0 0.121 0.042
Methylheptane, 2- 20 0 0.037 0.009
Methylheptane, 3- 20 0 0.028 0.007Methylhexane, 2- 20 0 0.099 0.030
Methylhexane, 3- 20 0 0.202 0.050
Methylpentane, 2- 18 2 0.462 0.204
Methylpentane, 3- 20 0 0.220 0.091
Nonane, n- 20 0 0.032 0.008
Pentane, n- 20 0 0.939 0.454
Pentene, 1- 20 0 0.075 0.030
Pentene, cis-2- 19 1 0.050 0.027
Pentene, trans-2- 18 2 0.086 0.057
Pinene, alpha- 17 3 0.050 0.019Propane 20 0 3.498 1.207
Propylbenzene, n- 19 1 0.018 0.004
Propylene 20 0 0.478 0.120
Styrene 19 1 0.170 0.095
Tetrachloroethylene 17 3 0.038 0.014
Toluene 20 0 0.544 0.202

8/6/2019 Air Quality Study Final
http://slidepdf.com/reader/full/air-quality-study-final 52/320
Fort Worth Natural Gas Air Quality Study Final Report July 13, 2011
2-35
Table 2.5-4. Site S-1 Pollutant Study Averages (Continued)
Pollutant NameNumber
of DetectsNumber of Non-detects
Study Average(ppbv)
Confidence
Interval
(ppbv)
Trichlorofluoromethane 20 0 0.283 0.011Trichlorotrifluoroethane 20 0 0.091 0.002
Trimethylbenzene, 1,2,3- 14 6 0.016 0.008
Trimethylbenzene, 1,2,4- 20 0 0.077 0.024
Trimethylbenzene, 1,3,5- 20 0 0.029 0.008
Trimethylpentane, 2,2,3- 17 3 0.035 0.016
Trimethylpentane, 2,2,4- 20 0 0.198 0.086
Trimethylpentane, 2,3,4- 20 0 0.062 0.023
Undecane, n- 20 0 0.045 0.018
Xylene, m,p- 20 0 0.185 0.063
Xylene, o- 20 0 0.073 0.024
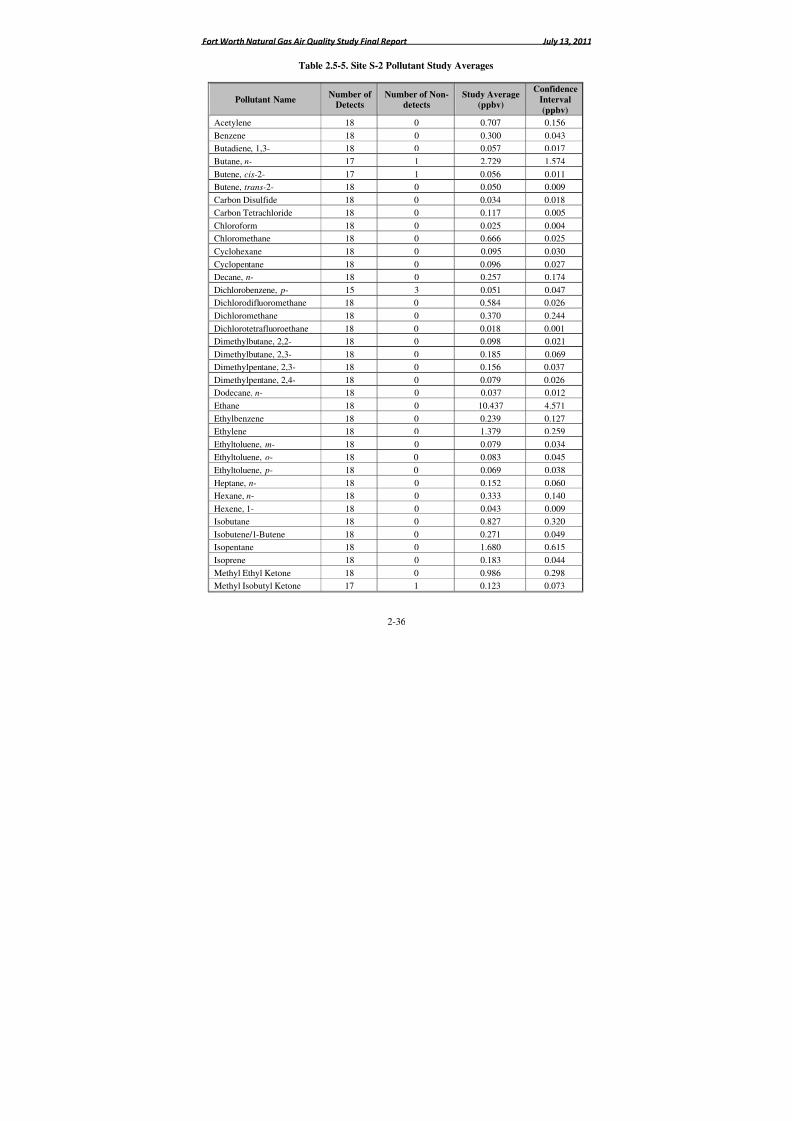
8/6/2019 Air Quality Study Final
http://slidepdf.com/reader/full/air-quality-study-final 53/320
Fort Worth Natural Gas Air Quality Study Final Report July 13, 2011
2-36
Table 2.5-5. Site S-2 Pollutant Study Averages
Pollutant NameNumber of
DetectsNumber of Non-
detectsStudy Average
(ppbv)
Confidence
Interval
(ppbv)
Acetylene 18 0 0.707 0.156Benzene 18 0 0.300 0.043
Butadiene, 1,3- 18 0 0.057 0.017
Butane, n- 17 1 2.729 1.574
Butene, cis-2- 17 1 0.056 0.011
Butene, trans-2- 18 0 0.050 0.009
Carbon Disulfide 18 0 0.034 0.018
Carbon Tetrachloride 18 0 0.117 0.005
Chloroform 18 0 0.025 0.004
Chloromethane 18 0 0.666 0.025
Cyclohexane 18 0 0.095 0.030Cyclopentane 18 0 0.096 0.027
Decane, n- 18 0 0.257 0.174
Dichlorobenzene, p- 15 3 0.051 0.047
Dichlorodifluoromethane 18 0 0.584 0.026
Dichloromethane 18 0 0.370 0.244
Dichlorotetrafluoroethane 18 0 0.018 0.001
Dimethylbutane, 2,2- 18 0 0.098 0.021
Dimethylbutane, 2,3- 18 0 0.185 0.069
Dimethylpentane, 2,3- 18 0 0.156 0.037
Dimethylpentane, 2,4- 18 0 0.079 0.026Dodecane, n- 18 0 0.037 0.012
Ethane 18 0 10.437 4.571
Ethylbenzene 18 0 0.239 0.127
Ethylene 18 0 1.379 0.259
Ethyltoluene, m- 18 0 0.079 0.034
Ethyltoluene, o- 18 0 0.083 0.045
Ethyltoluene, p- 18 0 0.069 0.038
Heptane, n- 18 0 0.152 0.060
Hexane, n- 18 0 0.333 0.140
Hexene, 1- 18 0 0.043 0.009Isobutane 18 0 0.827 0.320
Isobutene/1-Butene 18 0 0.271 0.049
Isopentane 18 0 1.680 0.615
Isoprene 18 0 0.183 0.044
Methyl Ethyl Ketone 18 0 0.986 0.298
Methyl Isobutyl Ketone 17 1 0.123 0.073
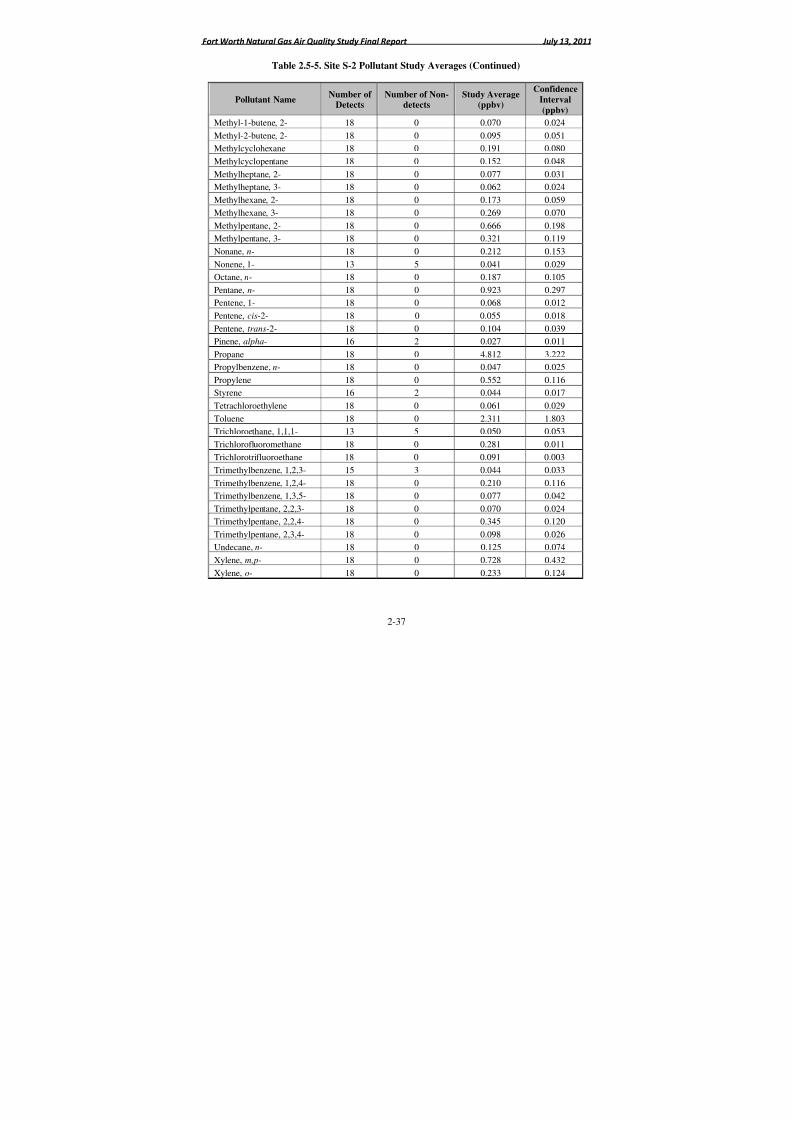
8/6/2019 Air Quality Study Final
http://slidepdf.com/reader/full/air-quality-study-final 54/320
Fort Worth Natural Gas Air Quality Study Final Report July 13, 2011
2-37
Table 2.5-5. Site S-2 Pollutant Study Averages (Continued)
Pollutant NameNumber of
DetectsNumber of Non-
detectsStudy Average
(ppbv)
Confidence
Interval
(ppbv)
Methyl-1-butene, 2- 18 0 0.070 0.024Methyl-2-butene, 2- 18 0 0.095 0.051
Methylcyclohexane 18 0 0.191 0.080
Methylcyclopentane 18 0 0.152 0.048
Methylheptane, 2- 18 0 0.077 0.031
Methylheptane, 3- 18 0 0.062 0.024
Methylhexane, 2- 18 0 0.173 0.059
Methylhexane, 3- 18 0 0.269 0.070
Methylpentane, 2- 18 0 0.666 0.198
Methylpentane, 3- 18 0 0.321 0.119
Nonane, n- 18 0 0.212 0.153Nonene, 1- 13 5 0.041 0.029
Octane, n- 18 0 0.187 0.105
Pentane, n- 18 0 0.923 0.297
Pentene, 1- 18 0 0.068 0.012
Pentene, cis-2- 18 0 0.055 0.018
Pentene, trans-2- 18 0 0.104 0.039
Pinene, alpha- 16 2 0.027 0.011
Propane 18 0 4.812 3.222
Propylbenzene, n- 18 0 0.047 0.025
Propylene 18 0 0.552 0.116Styrene 16 2 0.044 0.017
Tetrachloroethylene 18 0 0.061 0.029
Toluene 18 0 2.311 1.803
Trichloroethane, 1,1,1- 13 5 0.050 0.053
Trichlorofluoromethane 18 0 0.281 0.011
Trichlorotrifluoroethane 18 0 0.091 0.003
Trimethylbenzene, 1,2,3- 15 3 0.044 0.033
Trimethylbenzene, 1,2,4- 18 0 0.210 0.116
Trimethylbenzene, 1,3,5- 18 0 0.077 0.042
Trimethylpentane, 2,2,3- 18 0 0.070 0.024Trimethylpentane, 2,2,4- 18 0 0.345 0.120
Trimethylpentane, 2,3,4- 18 0 0.098 0.026
Undecane, n- 18 0 0.125 0.074
Xylene, m,p- 18 0 0.728 0.432
Xylene, o- 18 0 0.233 0.124

8/6/2019 Air Quality Study Final
http://slidepdf.com/reader/full/air-quality-study-final 55/320
Fort Worth Natural Gas Air Quality Study Final Report July 13, 2011
2-38
Table 2.5-6. Site S-3A Pollutant Study Averages
Pollutant NameNumber of
Detects
Number of
Non-detects
Study Average
(ppbv)
ConfidenceInterval
(ppbv)
Acetylene 9 0 0.735 0.399
Benzene 9 0 0.301 0.128
Butadiene, 1,3- 8 1 0.049 0.033
Butane, n- 7 2 1.408 1.245
Butene, cis-2- 8 1 0.046 0.021
Butene, trans-2- 9 0 0.139 0.221
Carbon Disulfide 9 0 0.050 0.053
Carbon Tetrachloride 9 0 0.118 0.007
Chloroform 9 0 0.029 0.006
Chloromethane 9 0 0.628 0.040Cyclohexane 9 0 0.081 0.039
Cyclopentane 9 0 0.069 0.024
Decane, n- 9 0 0.034 0.013
Dichlorobenzene, p- 9 0 0.030 0.013
Dichlorodifluoromethane 9 0 0.570 0.017
Dichloromethane 9 0 0.169 0.034
Dichlorotetrafluoroethane 9 0 0.017 0.000
Dimethylbutane, 2,2- 9 0 0.070 0.025
Dimethylbutane, 2,3- 9 0 0.121 0.056
Dimethylpentane, 2,3- 9 0 0.122 0.028Dimethylpentane, 2,4- 9 0 0.055 0.023
Dodecane, n- 9 0 0.031 0.008
Ethane 9 0 16.133 10.964
Ethylbenzene 9 0 0.090 0.035
Ethylene 9 0 1.364 0.528
Ethyltoluene, m- 9 0 0.044 0.017
Ethyltoluene, o- 8 1 0.029 0.012
Ethyltoluene, p- 9 0 0.025 0.009
Heptane, n- 9 0 0.098 0.053
Hexane, n- 9 0 0.241 0.139Hexene, 1- 9 0 0.046 0.011
Isobutane 9 0 0.820 0.553
Isobutene/1-Butene 9 0 0.236 0.088
Isopentane 9 0 1.217 0.628
Isoprene 9 0 0.149 0.048
Methyl Ethyl Ketone 9 0 0.637 0.182
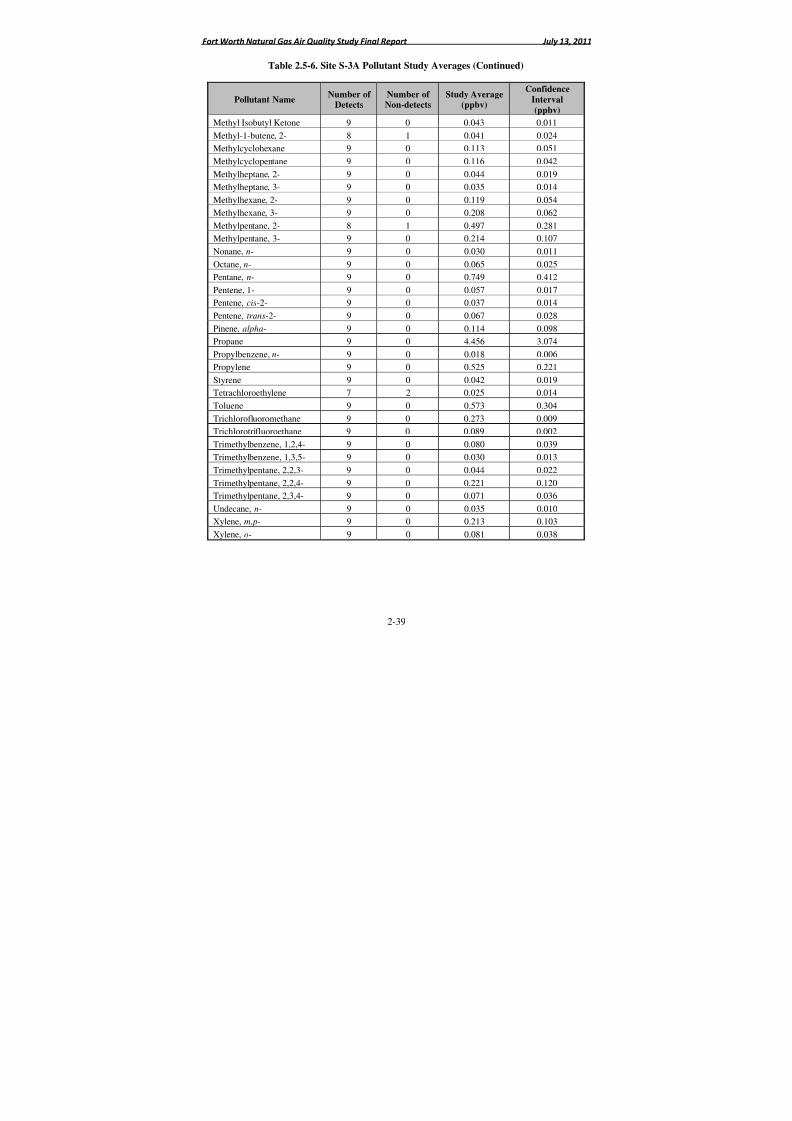
8/6/2019 Air Quality Study Final
http://slidepdf.com/reader/full/air-quality-study-final 56/320
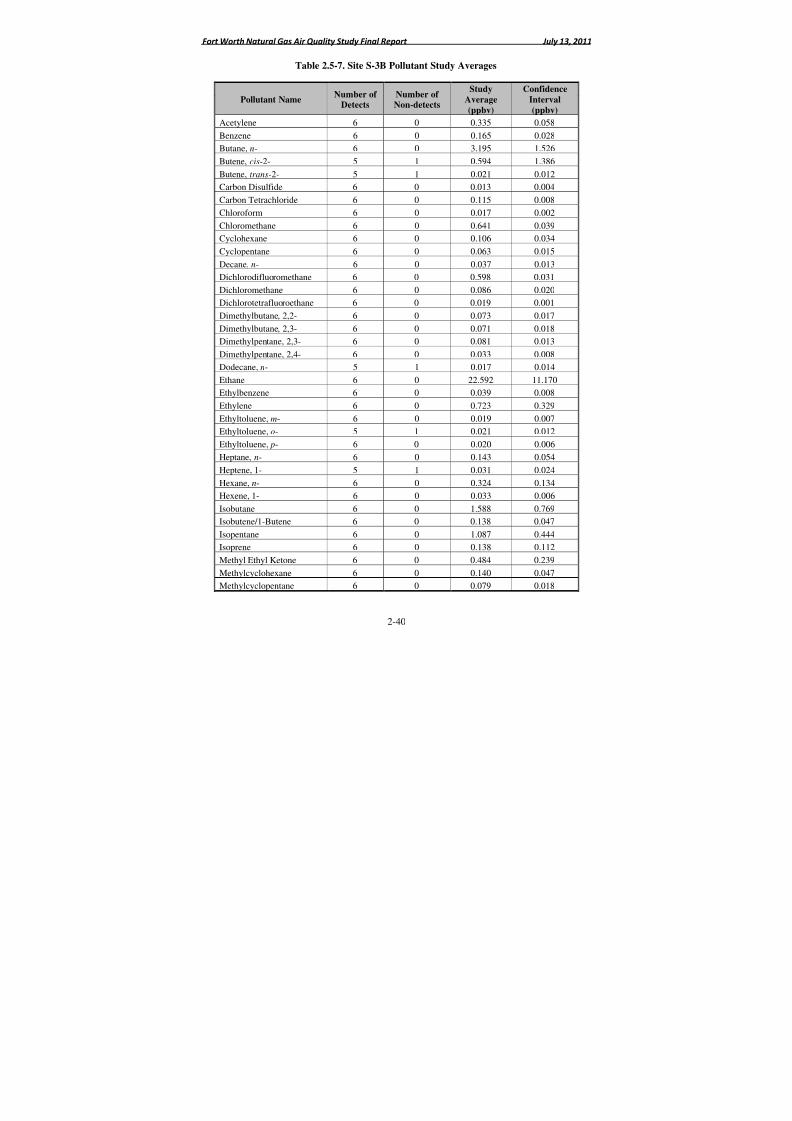
8/6/2019 Air Quality Study Final
http://slidepdf.com/reader/full/air-quality-study-final 57/320
Fort Worth Natural Gas Air Quality Study Final Report July 13, 2011
2-40
Table 2.5-7. Site S-3B Pollutant Study Averages
Pollutant NameNumber of
DetectsNumber of Non-detects
Study
Average
(ppbv)
Confidence
Interval
(ppbv)
Acetylene 6 0 0.335 0.058Benzene 6 0 0.165 0.028
Butane, n- 6 0 3.195 1.526
Butene, cis-2- 5 1 0.594 1.386
Butene, trans-2- 5 1 0.021 0.012
Carbon Disulfide 6 0 0.013 0.004
Carbon Tetrachloride 6 0 0.115 0.008
Chloroform 6 0 0.017 0.002
Chloromethane 6 0 0.641 0.039
Cyclohexane 6 0 0.106 0.034
Cyclopentane 6 0 0.063 0.015Decane, n- 6 0 0.037 0.013
Dichlorodifluoromethane 6 0 0.598 0.031
Dichloromethane 6 0 0.086 0.020
Dichlorotetrafluoroethane 6 0 0.019 0.001
Dimethylbutane, 2,2- 6 0 0.073 0.017
Dimethylbutane, 2,3- 6 0 0.071 0.018
Dimethylpentane, 2,3- 6 0 0.081 0.013
Dimethylpentane, 2,4- 6 0 0.033 0.008
Dodecane, n- 5 1 0.017 0.014
Ethane 6 0 22.592 11.170Ethylbenzene 6 0 0.039 0.008
Ethylene 6 0 0.723 0.329
Ethyltoluene, m- 6 0 0.019 0.007
Ethyltoluene, o- 5 1 0.021 0.012
Ethyltoluene, p- 6 0 0.020 0.006
Heptane, n- 6 0 0.143 0.054
Heptene, 1- 5 1 0.031 0.024
Hexane, n- 6 0 0.324 0.134
Hexene, 1- 6 0 0.033 0.006
Isobutane 6 0 1.588 0.769Isobutene/1-Butene 6 0 0.138 0.047
Isopentane 6 0 1.087 0.444
Isoprene 6 0 0.138 0.112
Methyl Ethyl Ketone 6 0 0.484 0.239
Methylcyclohexane 6 0 0.140 0.047
Methylcyclopentane 6 0 0.079 0.018
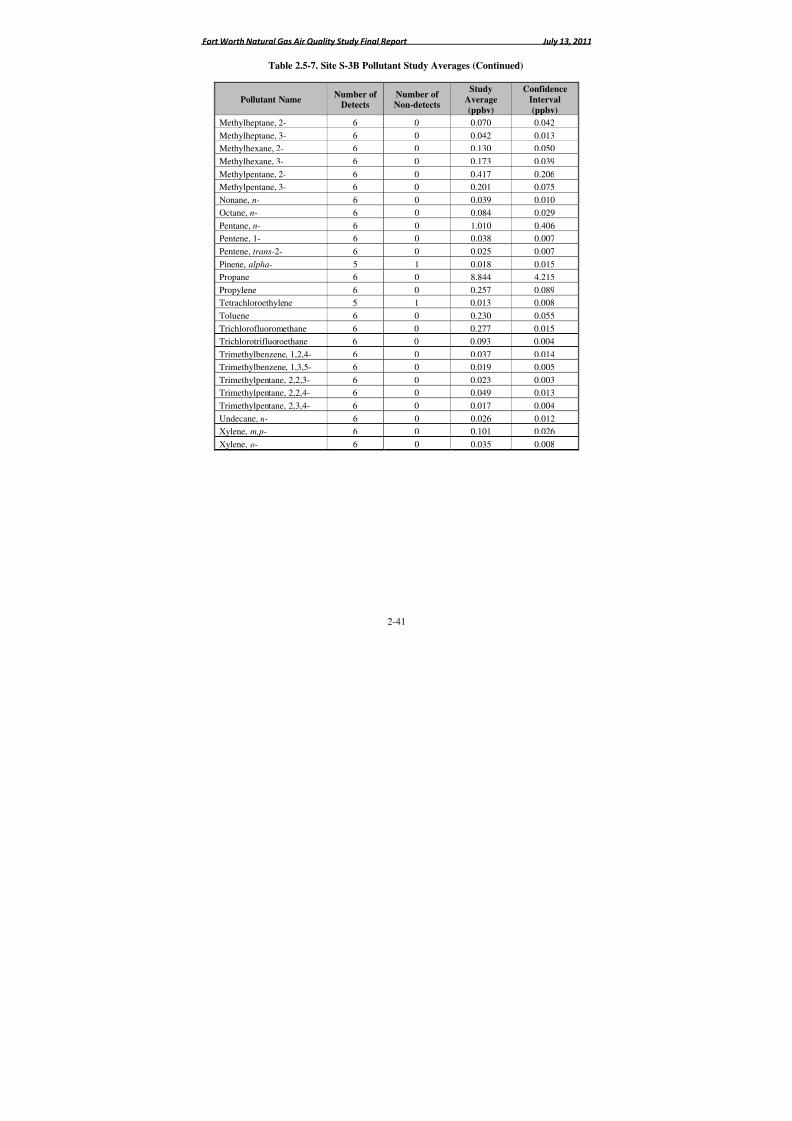
8/6/2019 Air Quality Study Final
http://slidepdf.com/reader/full/air-quality-study-final 58/320
Fort Worth Natural Gas Air Quality Study Final Report July 13, 2011
2-41
Table 2.5-7. Site S-3B Pollutant Study Averages (Continued)
Pollutant NameNumber of
DetectsNumber of Non-detects
Study
Average
(ppbv)
Confidence
Interval
(ppbv)
Methylheptane, 2- 6 0 0.070 0.042Methylheptane, 3- 6 0 0.042 0.013
Methylhexane, 2- 6 0 0.130 0.050
Methylhexane, 3- 6 0 0.173 0.039
Methylpentane, 2- 6 0 0.417 0.206
Methylpentane, 3- 6 0 0.201 0.075
Nonane, n- 6 0 0.039 0.010
Octane, n- 6 0 0.084 0.029
Pentane, n- 6 0 1.010 0.406
Pentene, 1- 6 0 0.038 0.007
Pentene, trans-2- 6 0 0.025 0.007Pinene, alpha- 5 1 0.018 0.015
Propane 6 0 8.844 4.215
Propylene 6 0 0.257 0.089
Tetrachloroethylene 5 1 0.013 0.008
Toluene 6 0 0.230 0.055
Trichlorofluoromethane 6 0 0.277 0.015
Trichlorotrifluoroethane 6 0 0.093 0.004
Trimethylbenzene, 1,2,4- 6 0 0.037 0.014
Trimethylbenzene, 1,3,5- 6 0 0.019 0.005
Trimethylpentane, 2,2,3- 6 0 0.023 0.003Trimethylpentane, 2,2,4- 6 0 0.049 0.013
Trimethylpentane, 2,3,4- 6 0 0.017 0.004
Undecane, n- 6 0 0.026 0.012
Xylene, m,p- 6 0 0.101 0.026
Xylene, o- 6 0 0.035 0.008
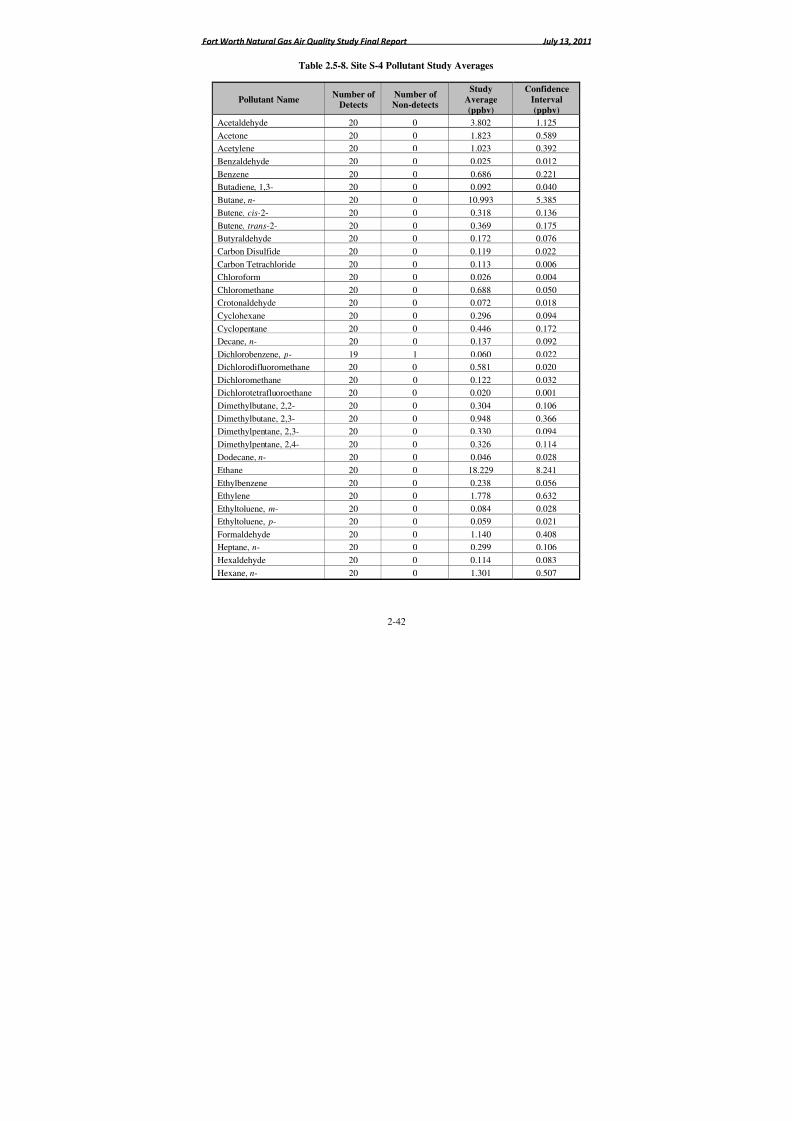
8/6/2019 Air Quality Study Final
http://slidepdf.com/reader/full/air-quality-study-final 59/320
Fort Worth Natural Gas Air Quality Study Final Report July 13, 2011
2-42
Table 2.5-8. Site S-4 Pollutant Study Averages
Pollutant NameNumber of
DetectsNumber of Non-detects
Study
Average
(ppbv)
Confidence
Interval
(ppbv)
Acetaldehyde 20 0 3.802 1.125Acetone 20 0 1.823 0.589
Acetylene 20 0 1.023 0.392
Benzaldehyde 20 0 0.025 0.012
Benzene 20 0 0.686 0.221
Butadiene, 1,3- 20 0 0.092 0.040
Butane, n- 20 0 10.993 5.385
Butene, cis-2- 20 0 0.318 0.136
Butene, trans-2- 20 0 0.369 0.175
Butyraldehyde 20 0 0.172 0.076
Carbon Disulfide 20 0 0.119 0.022Carbon Tetrachloride 20 0 0.113 0.006
Chloroform 20 0 0.026 0.004
Chloromethane 20 0 0.688 0.050
Crotonaldehyde 20 0 0.072 0.018
Cyclohexane 20 0 0.296 0.094
Cyclopentane 20 0 0.446 0.172
Decane, n- 20 0 0.137 0.092
Dichlorobenzene, p- 19 1 0.060 0.022
Dichlorodifluoromethane 20 0 0.581 0.020
Dichloromethane 20 0 0.122 0.032Dichlorotetrafluoroethane 20 0 0.020 0.001
Dimethylbutane, 2,2- 20 0 0.304 0.106
Dimethylbutane, 2,3- 20 0 0.948 0.366
Dimethylpentane, 2,3- 20 0 0.330 0.094
Dimethylpentane, 2,4- 20 0 0.326 0.114
Dodecane, n- 20 0 0.046 0.028
Ethane 20 0 18.229 8.241
Ethylbenzene 20 0 0.238 0.056
Ethylene 20 0 1.778 0.632
Ethyltoluene, m- 20 0 0.084 0.028Ethyltoluene, p- 20 0 0.059 0.021
Formaldehyde 20 0 1.140 0.408
Heptane, n- 20 0 0.299 0.106
Hexaldehyde 20 0 0.114 0.083
Hexane, n- 20 0 1.301 0.507
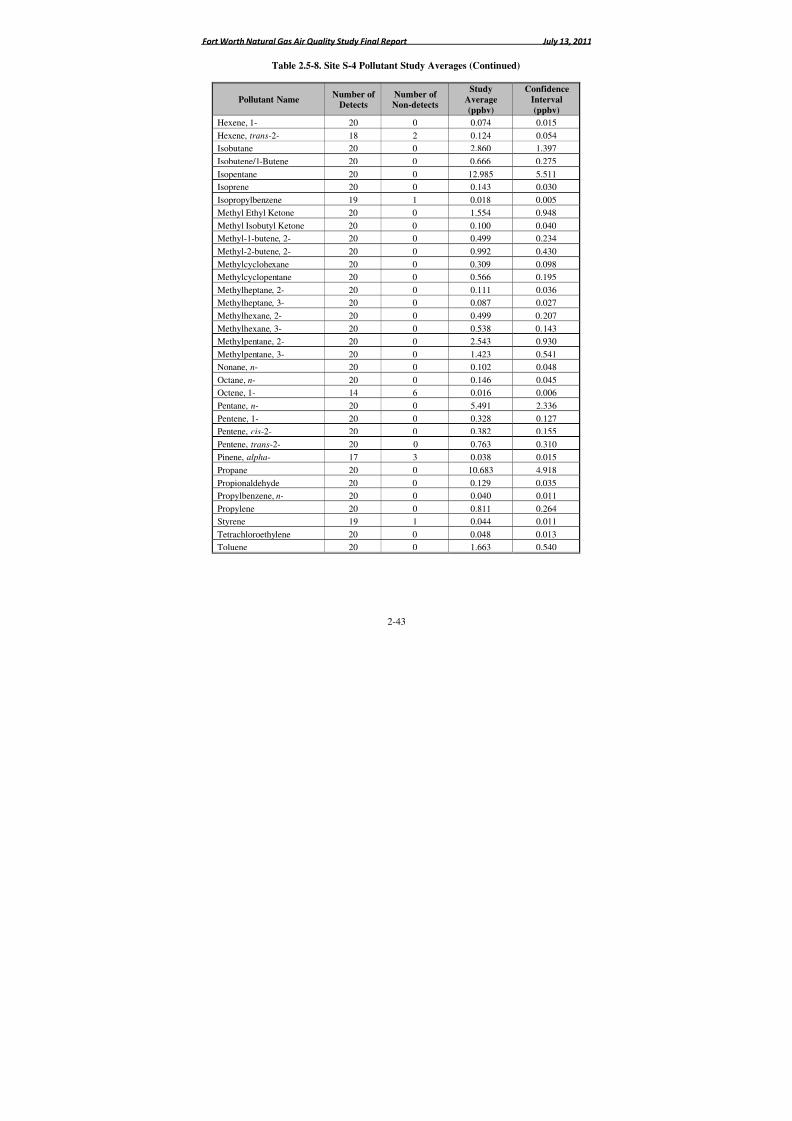
8/6/2019 Air Quality Study Final
http://slidepdf.com/reader/full/air-quality-study-final 60/320
Fort Worth Natural Gas Air Quality Study Final Report July 13, 2011
2-43
Table 2.5-8. Site S-4 Pollutant Study Averages (Continued)
Pollutant NameNumber of
DetectsNumber of Non-detects
Study
Average
(ppbv)
Confidence
Interval
(ppbv)
Hexene, 1- 20 0 0.074 0.015Hexene, trans-2- 18 2 0.124 0.054
Isobutane 20 0 2.860 1.397
Isobutene/1-Butene 20 0 0.666 0.275
Isopentane 20 0 12.985 5.511
Isoprene 20 0 0.143 0.030
Isopropylbenzene 19 1 0.018 0.005
Methyl Ethyl Ketone 20 0 1.554 0.948
Methyl Isobutyl Ketone 20 0 0.100 0.040
Methyl-1-butene, 2- 20 0 0.499 0.234
Methyl-2-butene, 2- 20 0 0.992 0.430Methylcyclohexane 20 0 0.309 0.098
Methylcyclopentane 20 0 0.566 0.195
Methylheptane, 2- 20 0 0.111 0.036
Methylheptane, 3- 20 0 0.087 0.027
Methylhexane, 2- 20 0 0.499 0.207
Methylhexane, 3- 20 0 0.538 0.143
Methylpentane, 2- 20 0 2.543 0.930
Methylpentane, 3- 20 0 1.423 0.541
Nonane, n- 20 0 0.102 0.048
Octane, n- 20 0 0.146 0.045Octene, 1- 14 6 0.016 0.006
Pentane, n- 20 0 5.491 2.336
Pentene, 1- 20 0 0.328 0.127
Pentene, cis-2- 20 0 0.382 0.155
Pentene, trans-2- 20 0 0.763 0.310
Pinene, alpha- 17 3 0.038 0.015
Propane 20 0 10.683 4.918
Propionaldehyde 20 0 0.129 0.035
Propylbenzene, n- 20 0 0.040 0.011
Propylene 20 0 0.811 0.264Styrene 19 1 0.044 0.011
Tetrachloroethylene 20 0 0.048 0.013
Toluene 20 0 1.663 0.540

8/6/2019 Air Quality Study Final
http://slidepdf.com/reader/full/air-quality-study-final 61/320
Fort Worth Natural Gas Air Quality Study Final Report July 13, 2011
2-44
Table 2.5-8. Site S-4 Pollutant Study Averages (Continued)
Pollutant NameNumber of
DetectsNumber of Non-detects
Study
Average
(ppbv)
Confidence
Interval
(ppbv)
Trichlorofluoromethane 20 0 0.276 0.008Trichlorotrifluoroethane 20 0 0.090 0.002
Trimethylbenzene, 1,2,3- 20 0 0.051 0.026
Trimethylbenzene, 1,2,4- 20 0 0.218 0.084
Trimethylbenzene, 1,3,5- 20 0 0.073 0.026
Trimethylpentane, 2,2,3- 20 0 0.183 0.067
Trimethylpentane, 2,2,4- 20 0 1.137 0.403
Trimethylpentane, 2,3,4- 20 0 0.279 0.094
Undecane, n- 20 0 0.068 0.026
Valeraldehyde 20 0 0.039 0.017
Xylene, m,p- 20 0 0.758 0.189Xylene, o- 20 0 0.255 0.066
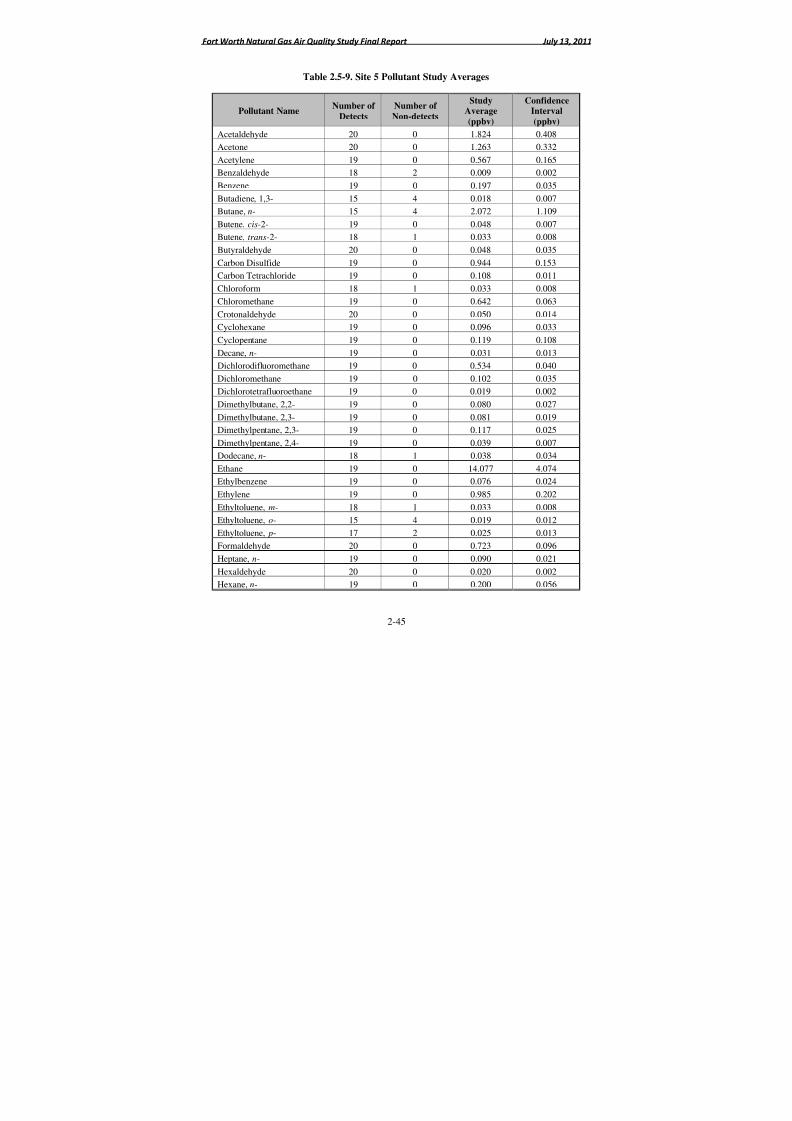
8/6/2019 Air Quality Study Final
http://slidepdf.com/reader/full/air-quality-study-final 62/320
Fort Worth Natural Gas Air Quality Study Final Report July 13, 2011
2-45
Table 2.5-9. Site 5 Pollutant Study Averages
Pollutant NameNumber of
Detects
Number of
Non-detects
StudyAverage
(ppbv)
ConfidenceInterval
(ppbv)
Acetaldehyde 20 0 1.824 0.408
Acetone 20 0 1.263 0.332
Acetylene 19 0 0.567 0.165
Benzaldehyde 18 2 0.009 0.002
Benzene 19 0 0.197 0.035
Butadiene, 1,3- 15 4 0.018 0.007
Butane, n- 15 4 2.072 1.109
Butene, cis-2- 19 0 0.048 0.007
Butene, trans-2- 18 1 0.033 0.008
Butyraldehyde 20 0 0.048 0.035Carbon Disulfide 19 0 0.944 0.153
Carbon Tetrachloride 19 0 0.108 0.011
Chloroform 18 1 0.033 0.008
Chloromethane 19 0 0.642 0.063
Crotonaldehyde 20 0 0.050 0.014
Cyclohexane 19 0 0.096 0.033
Cyclopentane 19 0 0.119 0.108
Decane, n- 19 0 0.031 0.013
Dichlorodifluoromethane 19 0 0.534 0.040
Dichloromethane 19 0 0.102 0.035Dichlorotetrafluoroethane 19 0 0.019 0.002
Dimethylbutane, 2,2- 19 0 0.080 0.027
Dimethylbutane, 2,3- 19 0 0.081 0.019
Dimethylpentane, 2,3- 19 0 0.117 0.025
Dimethylpentane, 2,4- 19 0 0.039 0.007
Dodecane, n- 18 1 0.038 0.034
Ethane 19 0 14.077 4.074
Ethylbenzene 19 0 0.076 0.024
Ethylene 19 0 0.985 0.202
Ethyltoluene, m- 18 1 0.033 0.008Ethyltoluene, o- 15 4 0.019 0.012
Ethyltoluene, p- 17 2 0.025 0.013
Formaldehyde 20 0 0.723 0.096
Heptane, n- 19 0 0.090 0.021
Hexaldehyde 20 0 0.020 0.002
Hexane, n- 19 0 0.200 0.056
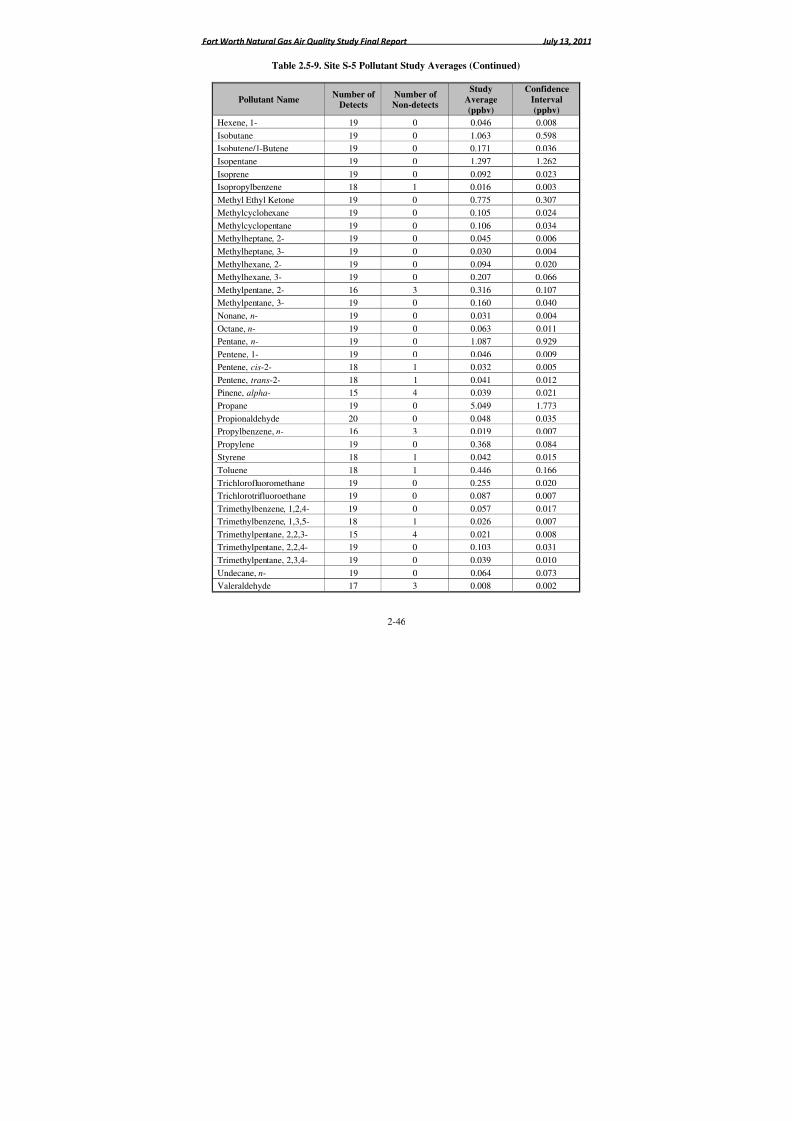
8/6/2019 Air Quality Study Final
http://slidepdf.com/reader/full/air-quality-study-final 63/320
Fort Worth Natural Gas Air Quality Study Final Report July 13, 2011
2-46
Table 2.5-9. Site S-5 Pollutant Study Averages (Continued)
Pollutant NameNumber of
DetectsNumber of Non-detects
Study
Average
(ppbv)
Confidence
Interval
(ppbv)
Hexene, 1- 19 0 0.046 0.008Isobutane 19 0 1.063 0.598
Isobutene/1-Butene 19 0 0.171 0.036
Isopentane 19 0 1.297 1.262
Isoprene 19 0 0.092 0.023
Isopropylbenzene 18 1 0.016 0.003
Methyl Ethyl Ketone 19 0 0.775 0.307
Methylcyclohexane 19 0 0.105 0.024
Methylcyclopentane 19 0 0.106 0.034
Methylheptane, 2- 19 0 0.045 0.006
Methylheptane, 3- 19 0 0.030 0.004Methylhexane, 2- 19 0 0.094 0.020
Methylhexane, 3- 19 0 0.207 0.066
Methylpentane, 2- 16 3 0.316 0.107
Methylpentane, 3- 19 0 0.160 0.040
Nonane, n- 19 0 0.031 0.004
Octane, n- 19 0 0.063 0.011
Pentane, n- 19 0 1.087 0.929
Pentene, 1- 19 0 0.046 0.009
Pentene, cis-2- 18 1 0.032 0.005
Pentene, trans-2- 18 1 0.041 0.012Pinene, alpha- 15 4 0.039 0.021
Propane 19 0 5.049 1.773
Propionaldehyde 20 0 0.048 0.035
Propylbenzene, n- 16 3 0.019 0.007
Propylene 19 0 0.368 0.084
Styrene 18 1 0.042 0.015
Toluene 18 1 0.446 0.166
Trichlorofluoromethane 19 0 0.255 0.020
Trichlorotrifluoroethane 19 0 0.087 0.007
Trimethylbenzene, 1,2,4- 19 0 0.057 0.017Trimethylbenzene, 1,3,5- 18 1 0.026 0.007
Trimethylpentane, 2,2,3- 15 4 0.021 0.008
Trimethylpentane, 2,2,4- 19 0 0.103 0.031
Trimethylpentane, 2,3,4- 19 0 0.039 0.010
Undecane, n- 19 0 0.064 0.073
Valeraldehyde 17 3 0.008 0.002

8/6/2019 Air Quality Study Final
http://slidepdf.com/reader/full/air-quality-study-final 64/320
Fort Worth Natural Gas Air Quality Study Final Report July 13, 2011
2-47
Table 2.5-9. Site S-5 Pollutant Study Averages (Continued)
Pollutant NameNumber of
DetectsNumber of Non-detects
Study
Average
(ppbv)
Confidence
Interval
(ppbv)
Xylene, m,p- 19 0 0.198 0.060Xylene, o- 19 0 0.071 0.020

8/6/2019 Air Quality Study Final
http://slidepdf.com/reader/full/air-quality-study-final 65/320
Fort Worth Natural Gas Air Quality Study Final Report July 13, 2011
2-48
Table 2.5-10. Site S-6 Pollutant Study Averages
Pollutant NameNumber of
DetectsNumber of Non-detects
Study
Average
(ppbv)
Confidence
Interval
(ppbv)
Benzene 15 4 0.097 0.036Butane, n- 19 0 1.015 0.432
Carbon Tetrachloride 18 1 0.097 0.013
Chloromethane 19 0 0.510 0.061
Dichlorodifluoromethane 19 0 0.511 0.017
Ethane 19 0 21.412 9.997
Ethylene 18 1 0.632 0.155
Isobutane 17 2 0.418 0.180
Methane 17 0 5758.824 795.537
Methanol 10 0 6.545 1.681
Methyl Ethyl Ketone 18 1 0.427 0.121Pentane, n- 18 1 0.399 0.146
Propane 19 0 2.982 1.154
Propylene 18 1 0.210 0.074
Toluene 19 0 0.305 0.083
Trichlorofluoromethane 19 0 0.257 0.008

8/6/2019 Air Quality Study Final
http://slidepdf.com/reader/full/air-quality-study-final 66/320
Fort Worth Natural Gas Air Quality Study Final Report July 13, 2011
2-49
Table 2.5-11. Site S-7 Pollutant Study Averages
Pollutant NameNumber of
Detects
Number of
Non-detects
StudyAverage
(ppbv)
ConfidenceInterval
(ppbv)
Benzene 14 4 0.109 0.043
Butane, n- 18 0 1.230 0.604
Carbon Tetrachloride 16 2 0.098 0.019
Chloromethane 18 0 0.523 0.071
Dichlorodifluoromethane 18 0 0.520 0.017
Ethane 18 0 23.979 11.236
Ethylene 18 0 0.690 0.173
Isobutane 16 2 0.481 0.246
Methane 17 0 5672.353 650.290
Methanol 18 0 6.740 1.403Methyl Ethyl Ketone 18 0 0.512 0.183
Pentane, n- 17 1 0.468 0.217
Propane 18 0 3.967 1.854
Propylene 17 1 0.234 0.107
Toluene 18 0 0.314 0.128
Trichlorofluoromethane 18 0 0.259 0.007
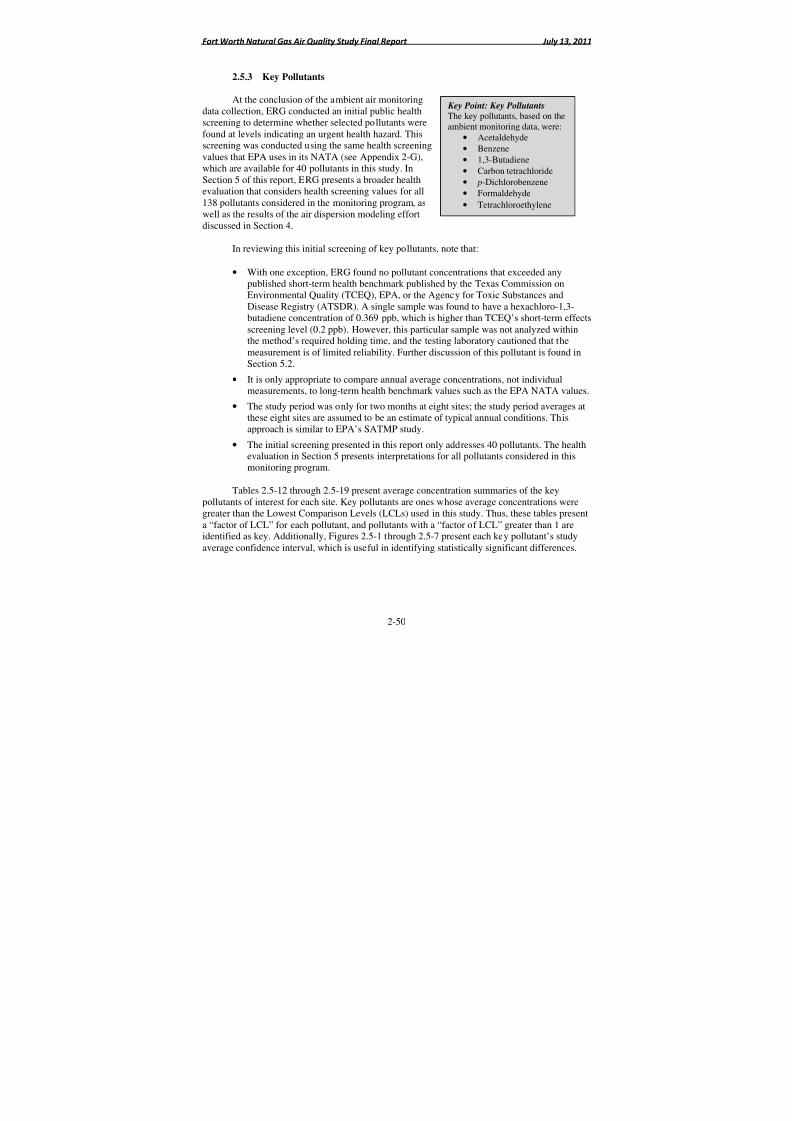
8/6/2019 Air Quality Study Final
http://slidepdf.com/reader/full/air-quality-study-final 67/320
Fort Worth Natural Gas Air Quality Study Final Report July 13, 2011
2-50
Key Point: Key PollutantsThe key pollutants, based on the
ambient monitoring data, were:• Acetaldehyde
• Benzene
• 1,3-Butadiene
• Carbon tetrachloride
• p-Dichlorobenzene
• Formaldehyde
• Tetrachloroethylene
2.5.3 Key Pollutants
At the conclusion of the ambient air monitoringdata collection, ERG conducted an initial public health
screening to determine whether selected pollutants werefound at levels indicating an urgent health hazard. Thisscreening was conducted using the same health screeningvalues that EPA uses in its NATA (see Appendix 2-G),which are available for 40 pollutants in this study. InSection 5 of this report, ERG presents a broader healthevaluation that considers health screening values for all138 pollutants considered in the monitoring program, aswell as the results of the air dispersion modeling effortdiscussed in Section 4.
In reviewing this initial screening of key pollutants, note that:
• With one exception, ERG found no pollutant concentrations that exceeded anypublished short-term health benchmark published by the Texas Commission onEnvironmental Quality (TCEQ), EPA, or the Agency for Toxic Substances andDisease Registry (ATSDR). A single sample was found to have a hexachloro-1,3-butadiene concentration of 0.369 ppb, which is higher than TCEQ’s short-term effectsscreening level (0.2 ppb). However, this particular sample was not analyzed withinthe method’s required holding time, and the testing laboratory cautioned that themeasurement is of limited reliability. Further discussion of this pollutant is found inSection 5.2.
• It is only appropriate to compare annual average concentrations, not individualmeasurements, to long-term health benchmark values such as the EPA NATA values.
• The study period was only for two months at eight sites; the study period averages atthese eight sites are assumed to be an estimate of typical annual conditions. Thisapproach is similar to EPA’s SATMP study.
• The initial screening presented in this report only addresses 40 pollutants. The healthevaluation in Section 5 presents interpretations for all pollutants considered in thismonitoring program.
Tables 2.5-12 through 2.5-19 present average concentration summaries of the key
pollutants of interest for each site. Key pollutants are ones whose average concentrations weregreater than the Lowest Comparison Levels (LCLs) used in this study. Thus, these tables presenta “factor of LCL” for each pollutant, and pollutants with a “factor of LCL” greater than 1 areidentified as key. Additionally, Figures 2.5-1 through 2.5-7 present each key pollutant’s studyaverage confidence interval, which is useful in identifying statistically significant differences.
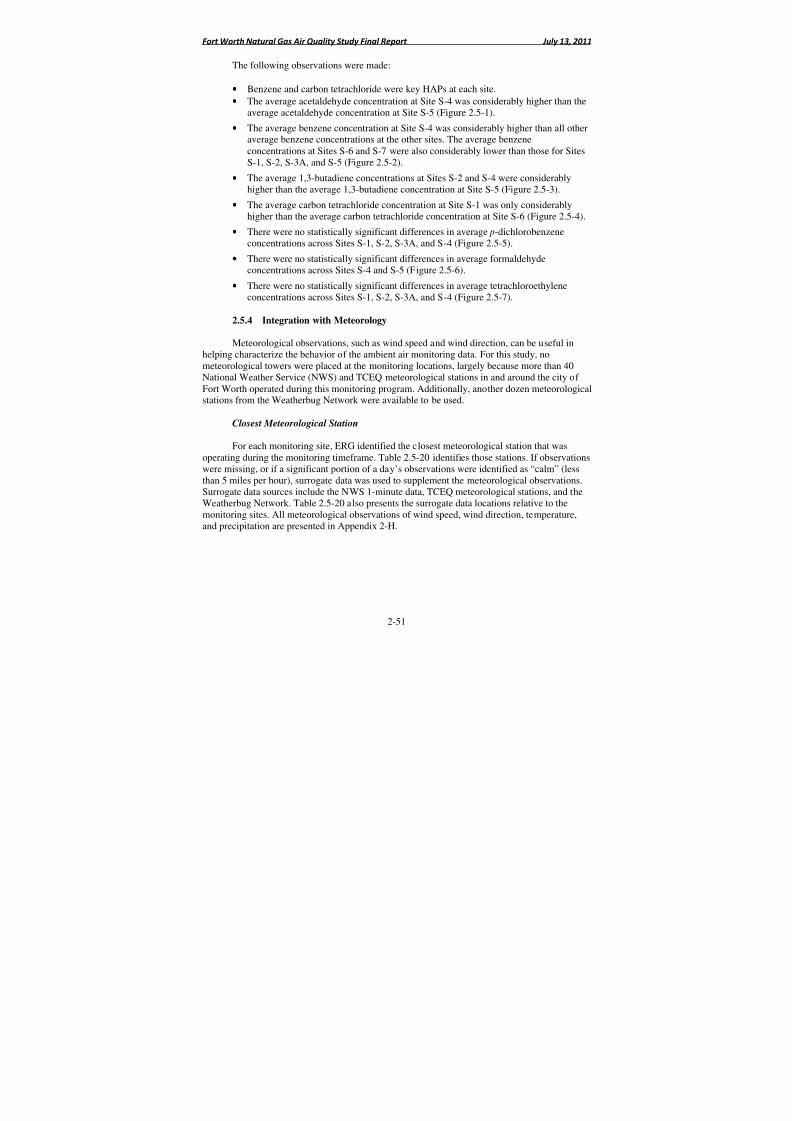
8/6/2019 Air Quality Study Final
http://slidepdf.com/reader/full/air-quality-study-final 68/320
Fort Worth Natural Gas Air Quality Study Final Report July 13, 2011
2-51
The following observations were made:
• Benzene and carbon tetrachloride were key HAPs at each site.
• The average acetaldehyde concentration at Site S-4 was considerably higher than theaverage acetaldehyde concentration at Site S-5 (Figure 2.5-1).
• The average benzene concentration at Site S-4 was considerably higher than all otheraverage benzene concentrations at the other sites. The average benzeneconcentrations at Sites S-6 and S-7 were also considerably lower than those for SitesS-1, S-2, S-3A, and S-5 (Figure 2.5-2).
• The average 1,3-butadiene concentrations at Sites S-2 and S-4 were considerablyhigher than the average 1,3-butadiene concentration at Site S-5 (Figure 2.5-3).
• The average carbon tetrachloride concentration at Site S-1 was only considerablyhigher than the average carbon tetrachloride concentration at Site S-6 (Figure 2.5-4).
• There were no statistically significant differences in average p-dichlorobenzeneconcentrations across Sites S-1, S-2, S-3A, and S-4 (Figure 2.5-5).
• There were no statistically significant differences in average formaldehydeconcentrations across Sites S-4 and S-5 (Figure 2.5-6).
• There were no statistically significant differences in average tetrachloroethyleneconcentrations across Sites S-1, S-2, S-3A, and S-4 (Figure 2.5-7).
2.5.4 Integration with Meteorology
Meteorological observations, such as wind speed and wind direction, can be useful inhelping characterize the behavior of the ambient air monitoring data. For this study, nometeorological towers were placed at the monitoring locations, largely because more than 40
National Weather Service (NWS) and TCEQ meteorological stations in and around the city of Fort Worth operated during this monitoring program. Additionally, another dozen meteorologicalstations from the Weatherbug Network were available to be used.
Closest Meteorological Station
For each monitoring site, ERG identified the closest meteorological station that wasoperating during the monitoring timeframe. Table 2.5-20 identifies those stations. If observationswere missing, or if a significant portion of a day’s observations were identified as “calm” (lessthan 5 miles per hour), surrogate data was used to supplement the meteorological observations.Surrogate data sources include the NWS 1-minute data, TCEQ meteorological stations, and the
Weatherbug Network. Table 2.5-20 also presents the surrogate data locations relative to themonitoring sites. All meteorological observations of wind speed, wind direction, temperature,and precipitation are presented in Appendix 2-H.
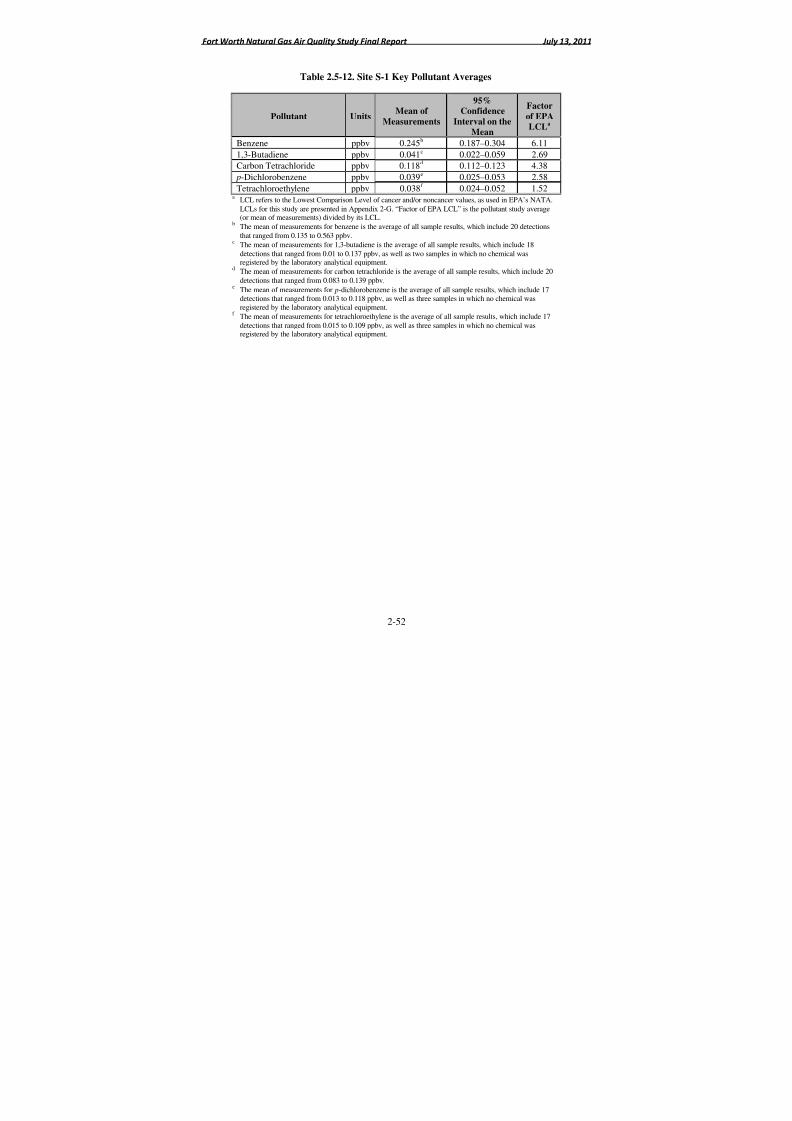
8/6/2019 Air Quality Study Final
http://slidepdf.com/reader/full/air-quality-study-final 69/320
Fort Worth Natural Gas Air Quality Study Final Report July 13, 2011
2-52
Table 2.5-12. Site S-1 Key Pollutant Averages
Pollutant UnitsMean of
Measurements
95%Confidence
Interval on the
Mean
Factor
of EPA
LCLa
Benzene ppbv 0.245b 0.187–0.304 6.11
1,3-Butadiene ppbv 0.041c 0.022–0.059 2.69
Carbon Tetrachloride ppbv 0.118d 0.112–0.123 4.38
p-Dichlorobenzene ppbv 0.039e 0.025–0.053 2.58
Tetrachloroethylene ppbv 0.038f 0.024–0.052 1.52a
LCL refers to the Lowest Comparison Level of cancer and/or noncancer values, as used in EPA’s NATA.
LCLs for this study are presented in Appendix 2-G. “Factor of EPA LCL” is the pollutant study average(or mean of measurements) divided by its LCL.
bThe mean of measurements for benzene is the average of all sample results, which include 20 detections
that ranged from 0.135 to 0.563 ppbv.c
The mean of measurements for 1,3-butadiene is the average of all sample results, which include 18
detections that ranged from 0.01 to 0.137 ppbv, as well as two samples in which no chemical wasregistered by the laboratory analytical equipment.
dThe mean of measurements for carbon tetrachloride is the average of all sample results, which include 20
detections that ranged from 0.083 to 0.139 ppbv.e
The mean of measurements for p-dichlorobenzene is the average of all sample results, which include 17detections that ranged from 0.013 to 0.118 ppbv, as well as three samples in which no chemical wasregistered by the laboratory analytical equipment.
f The mean of measurements for tetrachloroethylene is the average of all sample results, which include 17
detections that ranged from 0.015 to 0.109 ppbv, as well as three samples in which no chemical wasregistered by the laboratory analytical equipment.
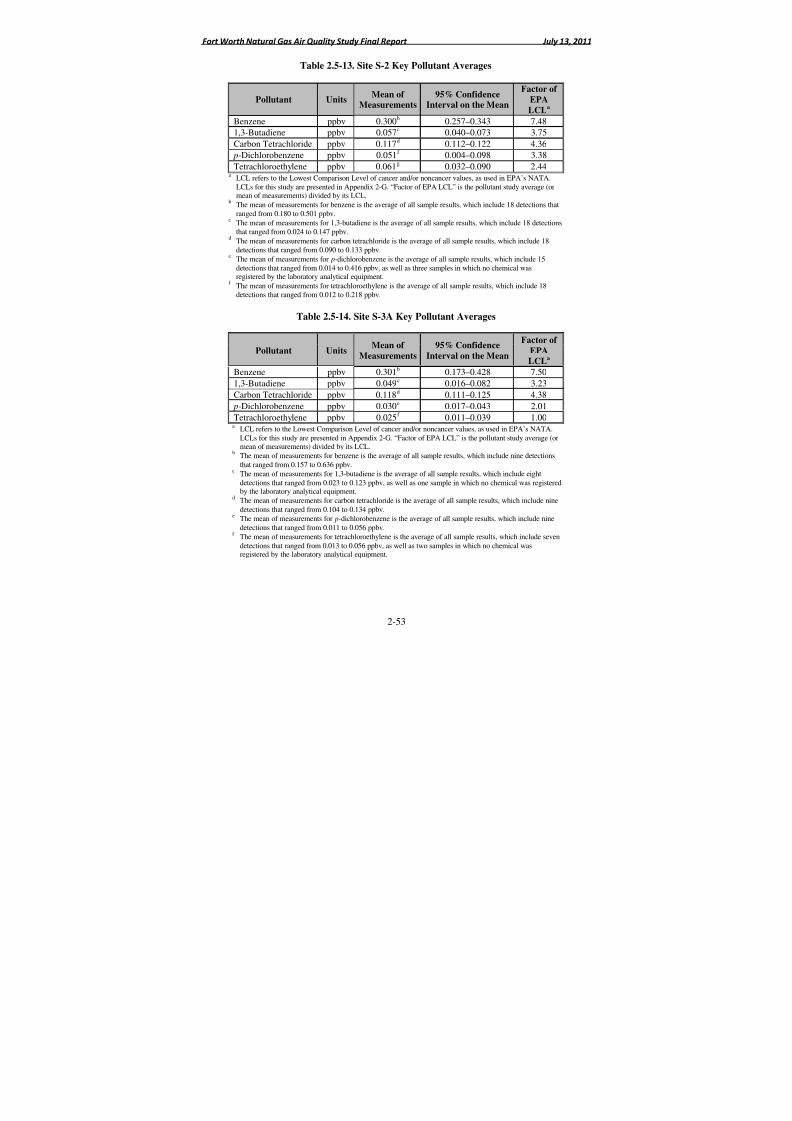
8/6/2019 Air Quality Study Final
http://slidepdf.com/reader/full/air-quality-study-final 70/320
Fort Worth Natural Gas Air Quality Study Final Report July 13, 2011
2-53
Table 2.5-13. Site S-2 Key Pollutant Averages
Pollutant UnitsMean of
Measurements95% Confidence
Interval on the Mean
Factor of
EPA
LCLa
Benzene ppbv 0.300b 0.257–0.343 7.48
1,3-Butadiene ppbv 0.057c 0.040–0.073 3.75
Carbon Tetrachloride ppbv 0.117d 0.112–0.122 4.36
p-Dichlorobenzene ppbv 0.051f 0.004–0.098 3.38
Tetrachloroethylene ppbv 0.061g 0.032–0.090 2.44a
LCL refers to the Lowest Comparison Level of cancer and/or noncancer values, as used in EPA’s NATA.LCLs for this study are presented in Appendix 2-G. “Factor of EPA LCL” is the pollutant study average (ormean of measurements) divided by its LCL.
bThe mean of measurements for benzene is the average of all sample results, which include 18 detections thatranged from 0.180 to 0.501 ppbv.
cThe mean of measurements for 1,3-butadiene is the average of all sample results, which include 18 detectionsthat ranged from 0.024 to 0.147 ppbv.
dThe mean of measurements for carbon tetrachloride is the average of all sample results, which include 18
detections that ranged from 0.090 to 0.133 ppbv.eThe mean of measurements for p-dichlorobenzene is the average of all sample results, which include 15detections that ranged from 0.014 to 0.416 ppbv, as well as three samples in which no chemical wasregistered by the laboratory analytical equipment.
f The mean of measurements for tetrachloroethylene is the average of all sample results, which include 18detections that ranged from 0.012 to 0.218 ppbv.
Table 2.5-14. Site S-3A Key Pollutant Averages
Pollutant UnitsMean of
Measurements
95% Confidence
Interval on the Mean
Factor of
EPA
LCLa
Benzene ppbv 0.301b 0.173–0.428 7.50
1,3-Butadiene ppbv 0.049c 0.016–0.082 3.23Carbon Tetrachloride ppbv 0.118d 0.111–0.125 4.38
p-Dichlorobenzene ppbv 0.030e 0.017–0.043 2.01
Tetrachloroethylene ppbv 0.025f 0.011–0.039 1.00a
LCL refers to the Lowest Comparison Level of cancer and/or noncancer values, as used in EPA’s NATA.
LCLs for this study are presented in Appendix 2-G. “Factor of EPA LCL” is the pollutant study average (ormean of measurements) divided by its LCL.
bThe mean of measurements for benzene is the average of all sample results, which include nine detections
that ranged from 0.157 to 0.636 ppbv.c
The mean of measurements for 1,3-butadiene is the average of all sample results, which include eight
detections that ranged from 0.023 to 0.123 ppbv, as well as one sample in which no chemical was registeredby the laboratory analytical equipment.
dThe mean of measurements for carbon tetrachloride is the average of all sample results, which include nine
detections that ranged from 0.104 to 0.134 ppbv.e
The mean of measurements for p-dichlorobenzene is the average of all sample results, which include nine
detections that ranged from 0.011 to 0.056 ppbv.f
The mean of measurements for tetrachloroethylene is the average of all sample results, which include seven
detections that ranged from 0.013 to 0.056 ppbv, as well as two samples in which no chemical wasregistered by the laboratory analytical equipment.
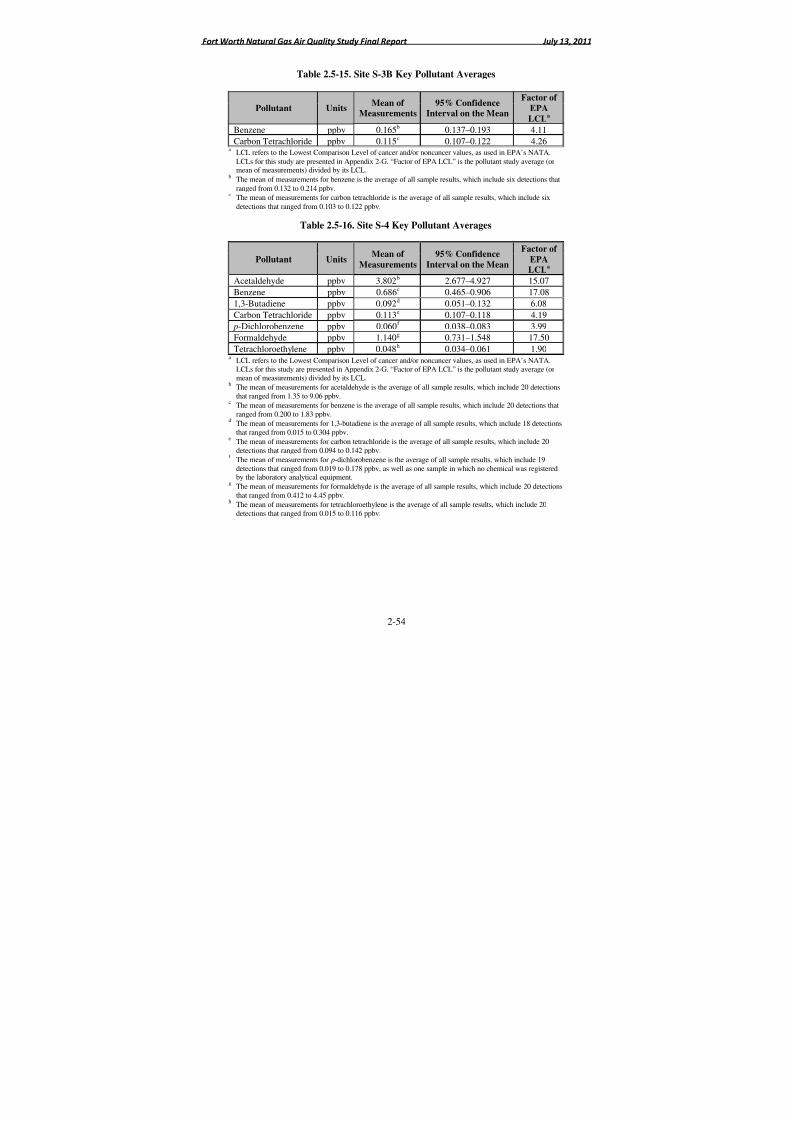
8/6/2019 Air Quality Study Final
http://slidepdf.com/reader/full/air-quality-study-final 71/320
Fort Worth Natural Gas Air Quality Study Final Report July 13, 2011
2-54
Table 2.5-15. Site S-3B Key Pollutant Averages
Pollutant UnitsMean of
Measurements95% Confidence
Interval on the Mean
Factor of
EPA
LCLa
Benzene ppbv 0.165b 0.137–0.193 4.11
Carbon Tetrachloride ppbv 0.115c 0.107–0.122 4.26a
LCL refers to the Lowest Comparison Level of cancer and/or noncancer values, as used in EPA’s NATA.
LCLs for this study are presented in Appendix 2-G. “Factor of EPA LCL” is the pollutant study average (ormean of measurements) divided by its LCL.
bThe mean of measurements for benzene is the average of all sample results, which include six detections that
ranged from 0.132 to 0.214 ppbv.c
The mean of measurements for carbon tetrachloride is the average of all sample results, which include six
detections that ranged from 0.103 to 0.122 ppbv.
Table 2.5-16. Site S-4 Key Pollutant Averages
Pollutant Units Mean of Measurements
95% ConfidenceInterval on the Mean
Factor of EPALCL
a
Acetaldehyde ppbv 3.802b 2.677–4.927 15.07
Benzene ppbv 0.686c 0.465–0.906 17.08
1,3-Butadiene ppbv 0.092d 0.051–0.132 6.08
Carbon Tetrachloride ppbv 0.113e 0.107–0.118 4.19
p-Dichlorobenzene ppbv 0.060f 0.038–0.083 3.99
Formaldehyde ppbv 1.140g 0.731–1.548 17.50
Tetrachloroethylene ppbv 0.048h 0.034–0.061 1.90a
LCL refers to the Lowest Comparison Level of cancer and/or noncancer values, as used in EPA’s NATA.LCLs for this study are presented in Appendix 2-G. “Factor of EPA LCL” is the pollutant study average (or
mean of measurements) divided by its LCL.bThe mean of measurements for acetaldehyde is the average of all sample results, which include 20 detectionsthat ranged from 1.35 to 9.06 ppbv.
cThe mean of measurements for benzene is the average of all sample results, which include 20 detections thatranged from 0.200 to 1.83 ppbv.
dThe mean of measurements for 1,3-butadiene is the average of all sample results, which include 18 detectionsthat ranged from 0.015 to 0.304 ppbv.
eThe mean of measurements for carbon tetrachloride is the average of all sample results, which include 20detections that ranged from 0.094 to 0.142 ppbv.
f The mean of measurements for p-dichlorobenzene is the average of all sample results, which include 19detections that ranged from 0.019 to 0.178 ppbv, as well as one sample in which no chemical was registeredby the laboratory analytical equipment.
gThe mean of measurements for formaldehyde is the average of all sample results, which include 20 detectionsthat ranged from 0.412 to 4.45 ppbv.
h
The mean of measurements for tetrachloroethylene is the average of all sample results, which include 20detections that ranged from 0.015 to 0.116 ppbv.
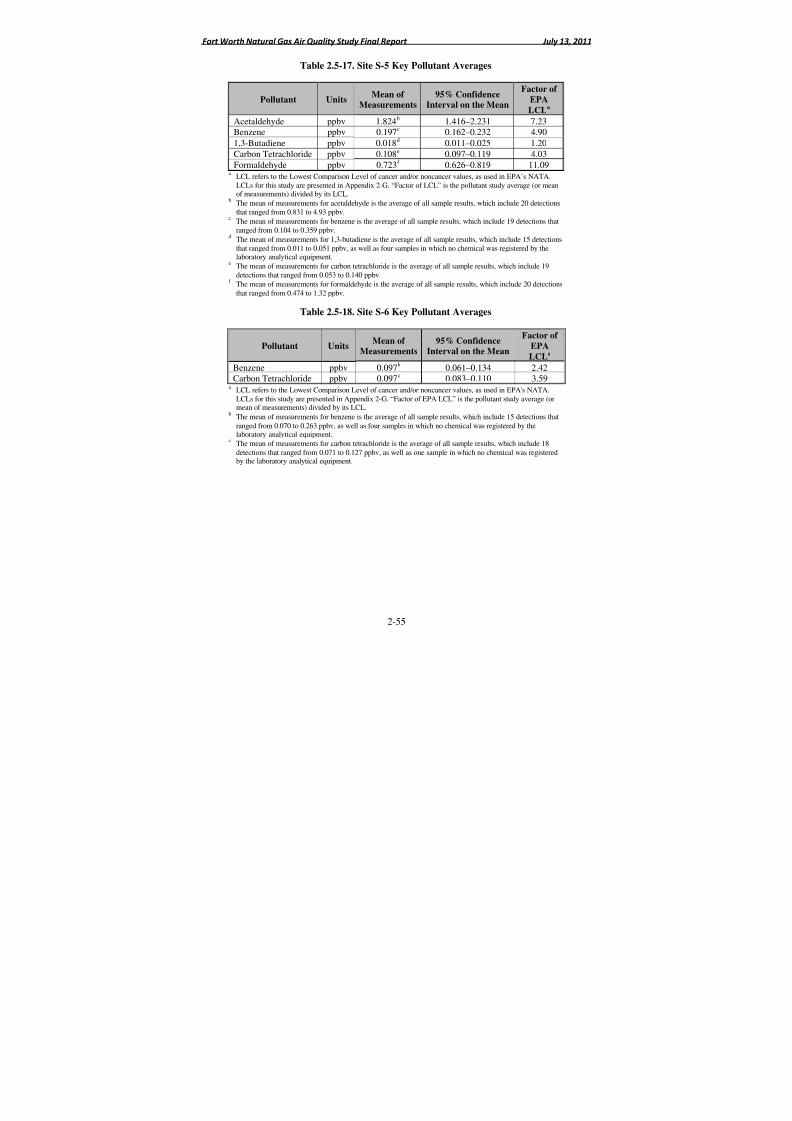
8/6/2019 Air Quality Study Final
http://slidepdf.com/reader/full/air-quality-study-final 72/320
Fort Worth Natural Gas Air Quality Study Final Report July 13, 2011
2-55
Table 2.5-17. Site S-5 Key Pollutant Averages
Pollutant UnitsMean of
Measurements95% Confidence
Interval on the Mean
Factor of
EPA
LCLa
Acetaldehyde ppbv 1.824b 1.416–2.231 7.23Benzene ppbv 0.197c 0.162–0.232 4.90
1,3-Butadiene ppbv 0.018d 0.011–0.025 1.20
Carbon Tetrachloride ppbv 0.108e 0.097–0.119 4.03
Formaldehyde ppbv 0.723f 0.626–0.819 11.09a
LCL refers to the Lowest Comparison Level of cancer and/or noncancer values, as used in EPA’s NATA.LCLs for this study are presented in Appendix 2-G. “Factor of LCL” is the pollutant study average (or meanof measurements) divided by its LCL.
bThe mean of measurements for acetaldehyde is the average of all sample results, which include 20 detectionsthat ranged from 0.831 to 4.93 ppbv.
cThe mean of measurements for benzene is the average of all sample results, which include 19 detections thatranged from 0.104 to 0.359 ppbv.
dThe mean of measurements for 1,3-butadiene is the average of all sample results, which include 15 detectionsthat ranged from 0.011 to 0.051 ppbv, as well as four samples in which no chemical was registered by thelaboratory analytical equipment.
eThe mean of measurements for carbon tetrachloride is the average of all sample results, which include 19detections that ranged from 0.053 to 0.140 ppbv.
f The mean of measurements for formaldehyde is the average of all sample results, which include 20 detections
that ranged from 0.474 to 1.32 ppbv.
Table 2.5-18. Site S-6 Key Pollutant Averages
Pollutant UnitsMean of
Measurements95% Confidence
Interval on the Mean
Factor of
EPA
LCLa
Benzene ppbv 0.097b 0.061–0.134 2.42
Carbon Tetrachloride ppbv 0.097c
0.083–0.110 3.59aLCL refers to the Lowest Comparison Level of cancer and/or noncancer values, as used in EPA's NATA.LCLs for this study are presented in Appendix 2-G. “Factor of EPA LCL” is the pollutant study average (ormean of measurements) divided by its LCL.
bThe mean of measurements for benzene is the average of all sample results, which include 15 detections that
ranged from 0.070 to 0.263 ppbv, as well as four samples in which no chemical was registered by thelaboratory analytical equipment.
cThe mean of measurements for carbon tetrachloride is the average of all sample results, which include 18
detections that ranged from 0.071 to 0.127 ppbv, as well as one sample in which no chemical was registeredby the laboratory analytical equipment.

8/6/2019 Air Quality Study Final
http://slidepdf.com/reader/full/air-quality-study-final 73/320
Fort Worth Natural Gas Air Quality Study Final Report July 13, 2011
2-56
Table 2.5-19. Site S-7 Key Pollutant Averages
Pollutant UnitsMean of
Measurements95% Confidence
Interval on the Mean
Factor of
EPA
LCLa
Benzene ppbv 0.109b 0.066–0.152 2.71Carbon Tetrachloride ppbv 0.098c 0.079–0.117 3.65
aLCL refers to the Lowest Comparison Level of cancer and/or noncancer values, as used in EPA’s NATA.LCLs for this study are presented in Appendix 2-G. “Factor of EPA LCL” is the pollutant study average (ormean of measurements) divided by its LCL.
bThe mean of measurements for benzene is the average of all sample results, which include 14 detections thatranged from 0.064 to 0.282 ppbv, as well as four samples in which no chemical was registered by thelaboratory analytical equipment.
cThe mean of measurements for carbon tetrachloride is the average of all sample results, which include 16detections that ranged from 0.077 to 0.142 ppbv, as well as two samples in which no chemical was registeredby the laboratory analytical equipment.
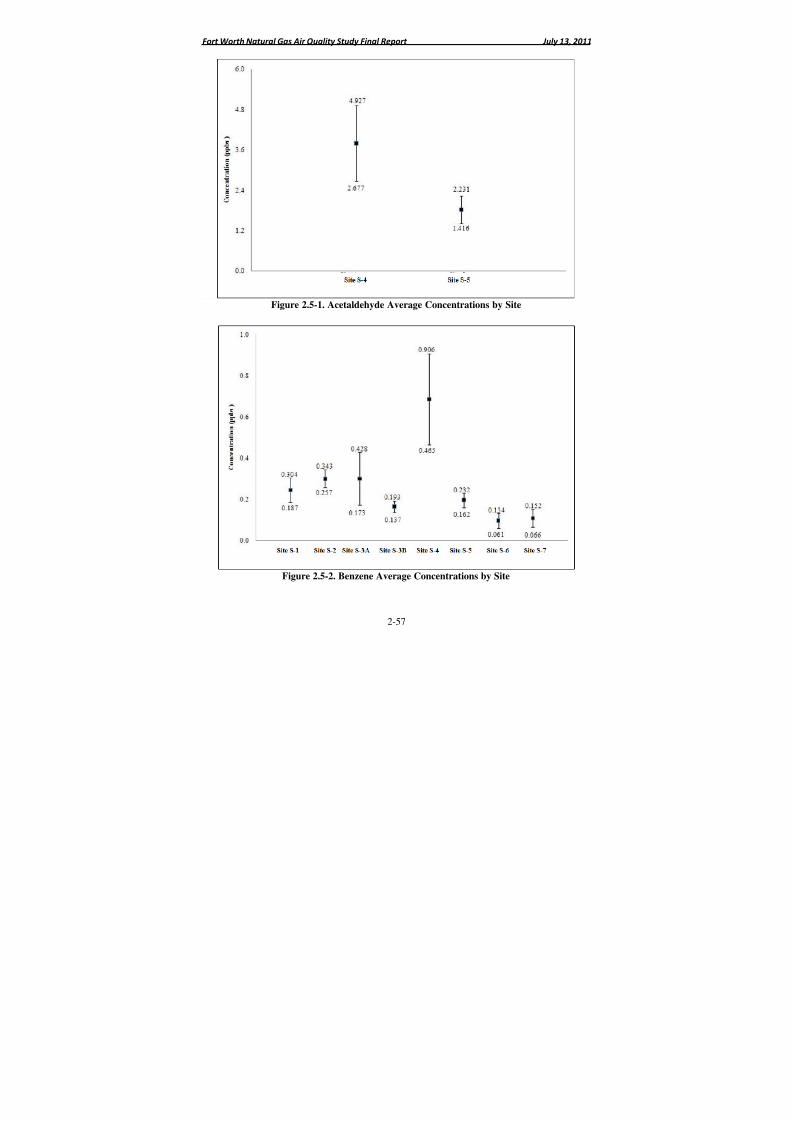
8/6/2019 Air Quality Study Final
http://slidepdf.com/reader/full/air-quality-study-final 74/320
Fort Worth Natural Gas Air Quality Study Final Report July 13, 2011
2-57
Figure 2.5-1. Acetaldehyde Average Concentrations by Site
Figure 2.5-2. Benzene Average Concentrations by Site
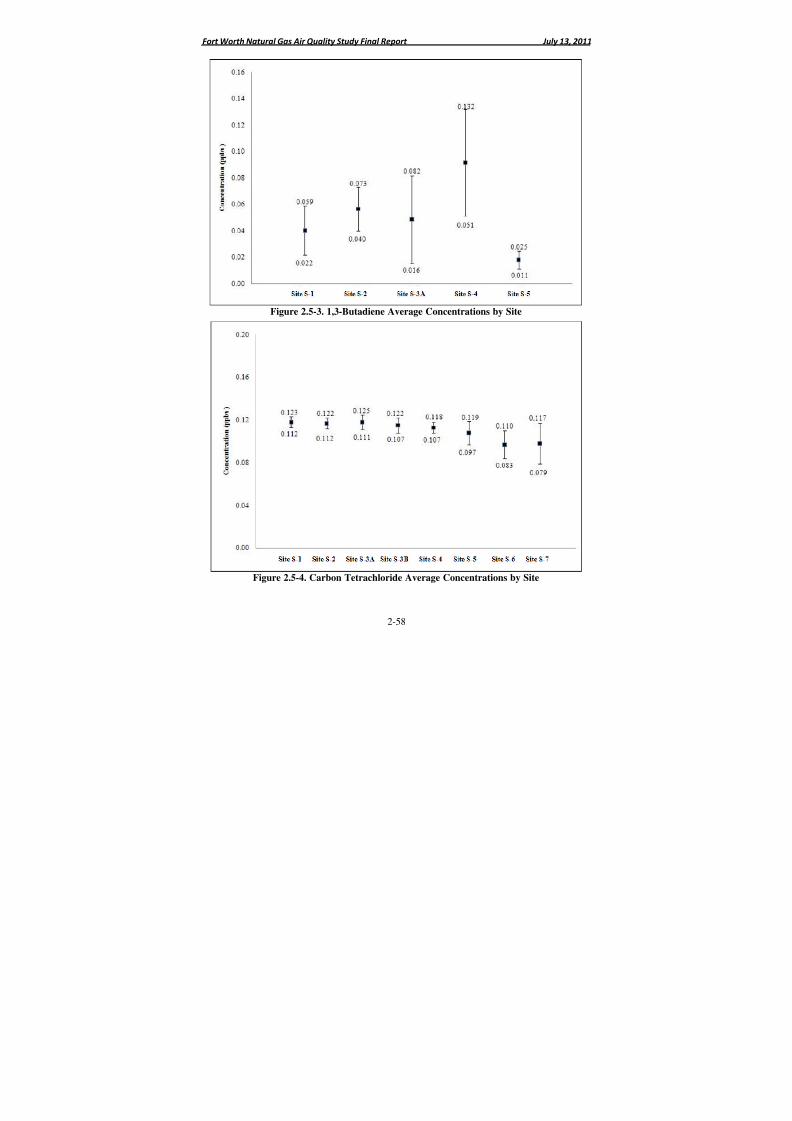
8/6/2019 Air Quality Study Final
http://slidepdf.com/reader/full/air-quality-study-final 75/320
Fort Worth Natural Gas Air Quality Study Final Report July 13, 2011
2-58
Figure 2.5-3. 1,3-Butadiene Average Concentrations by Site
Figure 2.5-4. Carbon Tetrachloride Average Concentrations by Site
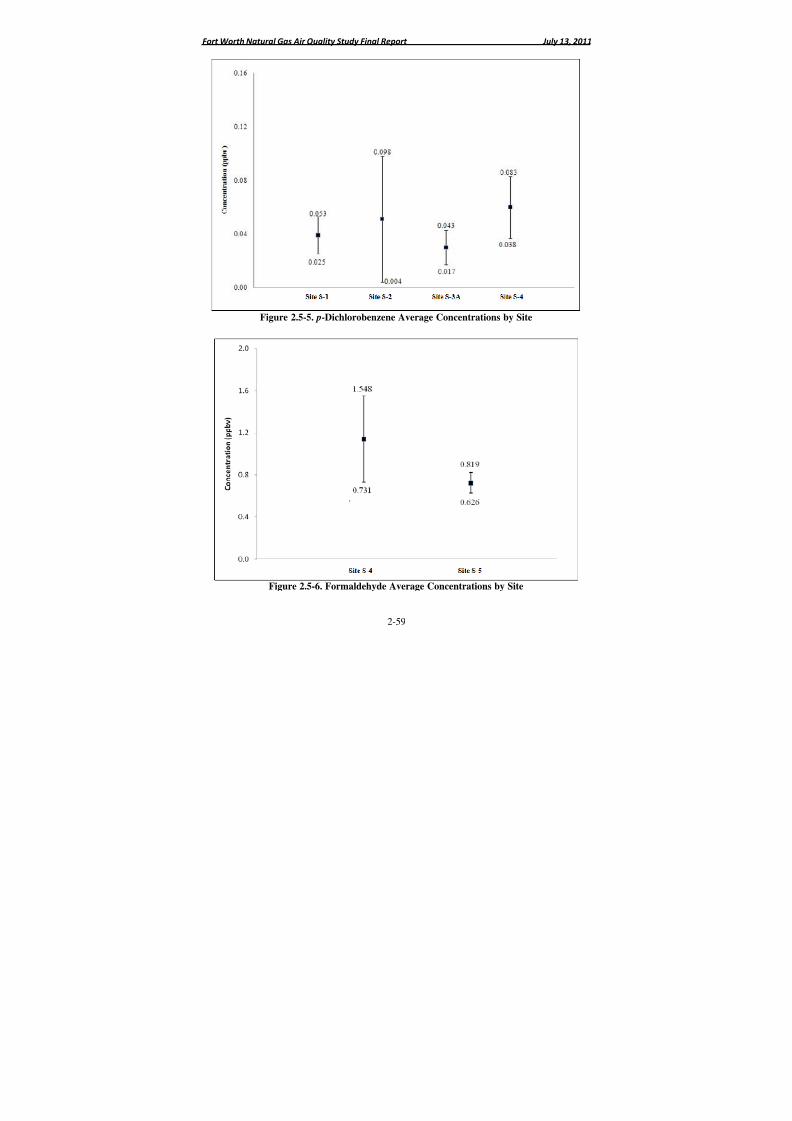
8/6/2019 Air Quality Study Final
http://slidepdf.com/reader/full/air-quality-study-final 76/320
Fort Worth Natural Gas Air Quality Study Final Report July 13, 2011
2-59
Figure 2.5-5. p-Dichlorobenzene Average Concentrations by Site
Figure 2.5-6. Formaldehyde Average Concentrations by Site
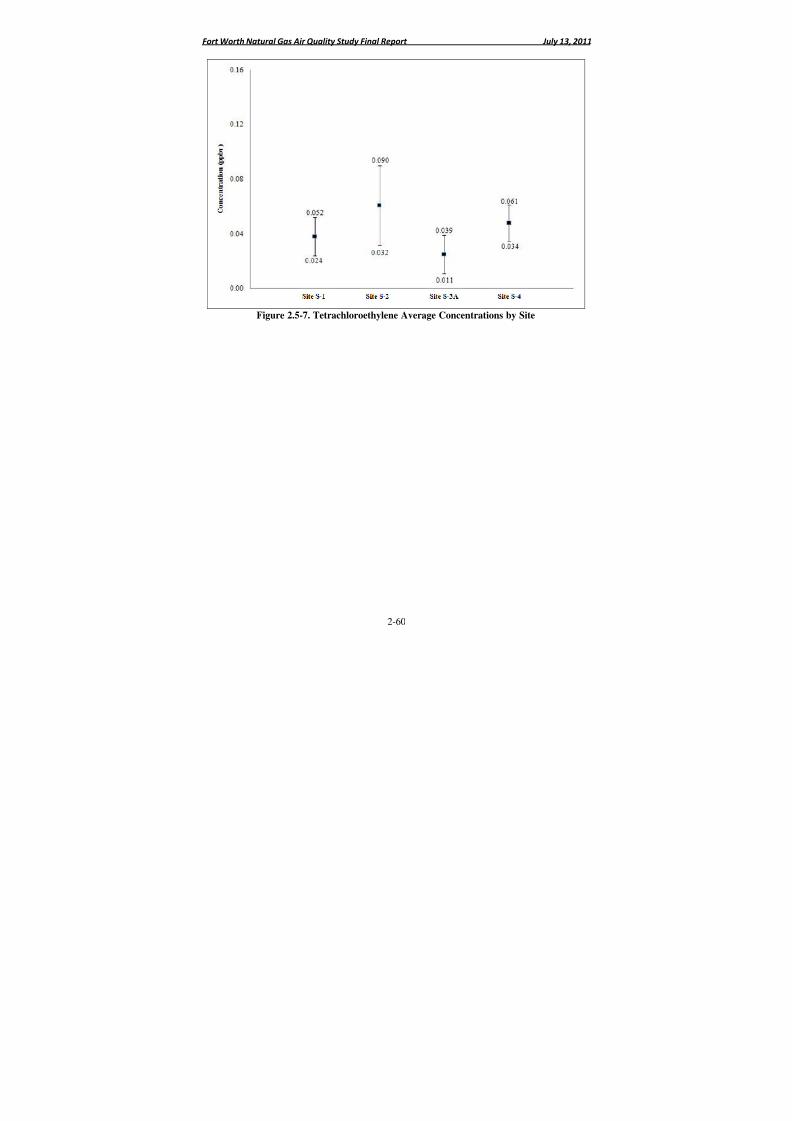
8/6/2019 Air Quality Study Final
http://slidepdf.com/reader/full/air-quality-study-final 77/320
Fort Worth Natural Gas Air Quality Study Final Report July 13, 2011
2-60
Figure 2.5-7. Tetrachloroethylene Average Concentrations by Site

8/6/2019 Air Quality Study Final
http://slidepdf.com/reader/full/air-quality-study-final 78/320
Fort Worth Natural Gas Air Quality Study Final Report
2-61
Table 2.5-20. Meteorological Stations Used in This Study
Site
Closest
Meteorological
Station
Distance/ Orientation from Site
Type
Alternate
Meteorological
Station
D
O
f
S-1Dallas–Ft. Worth
International (03927)5.29 miles/
northNational Weather
ServiceOakwood TerraceElementary School
2
S-2Nolan High School
(NOLAN)2.22 miles/
westWeatherbug
Arlington MunicipalAirport
10s
S-3ANolan High School
(NOLAN)0.50 miles/ southeast
WeatherbugArlington Municipal
Airport12
s
S-3BFt. Worth Naval Air
Station/Carswell Field(13911)
3.11 miles/ east
National WeatherService
Ft. Worth Northwest(48-439-1002)
8eas
S-4Ft. Worth Meacham
Airport (13961)2.98 miles/ northwest
National WeatherService
Ft. Worth Northwest(48-439-1002)
2n
S-5Ft. Worth Alliance
Airport (53909)
3.88 miles/
east
National Weather
Service
Eagle Mountain Lake
(48-439-0075)
5
S-6 Spinks Airport (03985)0.69 miles/
north-northeastNational Weather
ServiceWm. Stribling
Elementary School2s
S-7 Spinks Airport (03985)0.40 miles/ southeast
National WeatherService
Wm. StriblingElementary School
3s
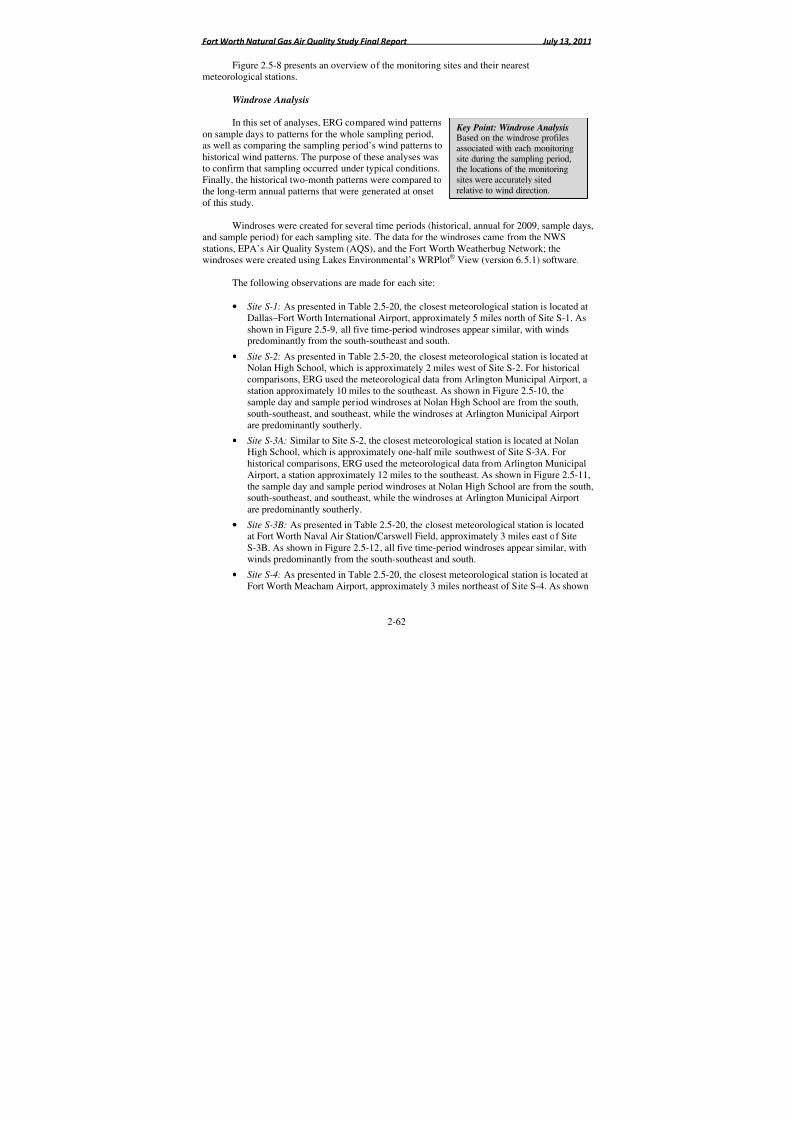
8/6/2019 Air Quality Study Final
http://slidepdf.com/reader/full/air-quality-study-final 79/320
Fort Worth Natural Gas Air Quality Study Final Report July 13, 2011
2-62
Key Point: Windrose AnalysisBased on the windrose profilesassociated with each monitoringsite during the sampling period,the locations of the monitoringsites were accurately sitedrelative to wind direction.
Figure 2.5-8 presents an overview of the monitoring sites and their nearestmeteorological stations.
Windrose Analysis
In this set of analyses, ERG compared wind patternson sample days to patterns for the whole sampling period,as well as comparing the sampling period’s wind patterns tohistorical wind patterns. The purpose of these analyses wasto confirm that sampling occurred under typical conditions.Finally, the historical two-month patterns were compared tothe long-term annual patterns that were generated at onsetof this study.
Windroses were created for several time periods (historical, annual for 2009, sample days,and sample period) for each sampling site. The data for the windroses came from the NWS
stations, EPA’s Air Quality System (AQS), and the Fort Worth Weatherbug Network; thewindroses were created using Lakes Environmental’s WRPlot® View (version 6.5.1) software.
The following observations are made for each site:
• Site S-1: As presented in Table 2.5-20, the closest meteorological station is located atDallas–Fort Worth International Airport, approximately 5 miles north of Site S-1. Asshown in Figure 2.5-9, all five time-period windroses appear similar, with windspredominantly from the south-southeast and south.
• Site S-2: As presented in Table 2.5-20, the closest meteorological station is located atNolan High School, which is approximately 2 miles west of Site S-2. For historical
comparisons, ERG used the meteorological data from Arlington Municipal Airport, astation approximately 10 miles to the southeast. As shown in Figure 2.5-10, thesample day and sample period windroses at Nolan High School are from the south,south-southeast, and southeast, while the windroses at Arlington Municipal Airportare predominantly southerly.
• Site S-3A: Similar to Site S-2, the closest meteorological station is located at NolanHigh School, which is approximately one-half mile southwest of Site S-3A. Forhistorical comparisons, ERG used the meteorological data from Arlington MunicipalAirport, a station approximately 12 miles to the southeast. As shown in Figure 2.5-11,the sample day and sample period windroses at Nolan High School are from the south,south-southeast, and southeast, while the windroses at Arlington Municipal Airport
are predominantly southerly.
• Site S-3B: As presented in Table 2.5-20, the closest meteorological station is locatedat Fort Worth Naval Air Station/Carswell Field, approximately 3 miles east of SiteS-3B. As shown in Figure 2.5-12, all five time-period windroses appear similar, withwinds predominantly from the south-southeast and south.
• Site S-4: As presented in Table 2.5-20, the closest meteorological station is located atFort Worth Meacham Airport, approximately 3 miles northeast of Site S-4. As shown

8/6/2019 Air Quality Study Final
http://slidepdf.com/reader/full/air-quality-study-final 80/320
Fort Worth Natural Gas Air Quality Study Final Report July 13, 2011
2-63
in Figure 2.5-13, all five time-period windroses appear similar, with windspredominantly from the south-southeast and south.
• Site S-5: As presented in Table 2.5-20, the closest meteorological station is located atFort Worth Alliance Airport, approximately 4 miles east of Site S-5. As shown inFigure 2.5-14, all five time-period windroses appear similar, with winds
predominantly from the south-southeast and south.• Site S-6: As presented in Table 2.5-20, the closest meteorological station is located at
Spinks Airport, less than 0.75 miles north-northeast of Site S-6. As shown inFigure 2.5-15, all five time-period windroses appear similar, with windspredominantly from the south-southeast and south.
• Site S-7: Similar to Site S-6, the closest meteorological station is located at SpinksAirport, less than half a mile southeast of Site S-7. As shown in Figure 2.5-16, all fivetime-period windroses appear similar, with winds predominantly from the south-southeast and south.
As described in the Ambient Air Monitoring Plan, the monitoring network was designedin part after understanding typical wind patterns in and around the City of Fort Worth throughthe use of historical windroses. Monitoring sites were placed to capture ambient air downwind of the target areas of interest. The general conclusion from the above windrose comparisons at eachmonitoring site during the study period is that wind patterns on sample days were generallytypical of year-round and long-term historical wind patterns, indicating that the monitoring siteswere able to collect samples from the target direction.
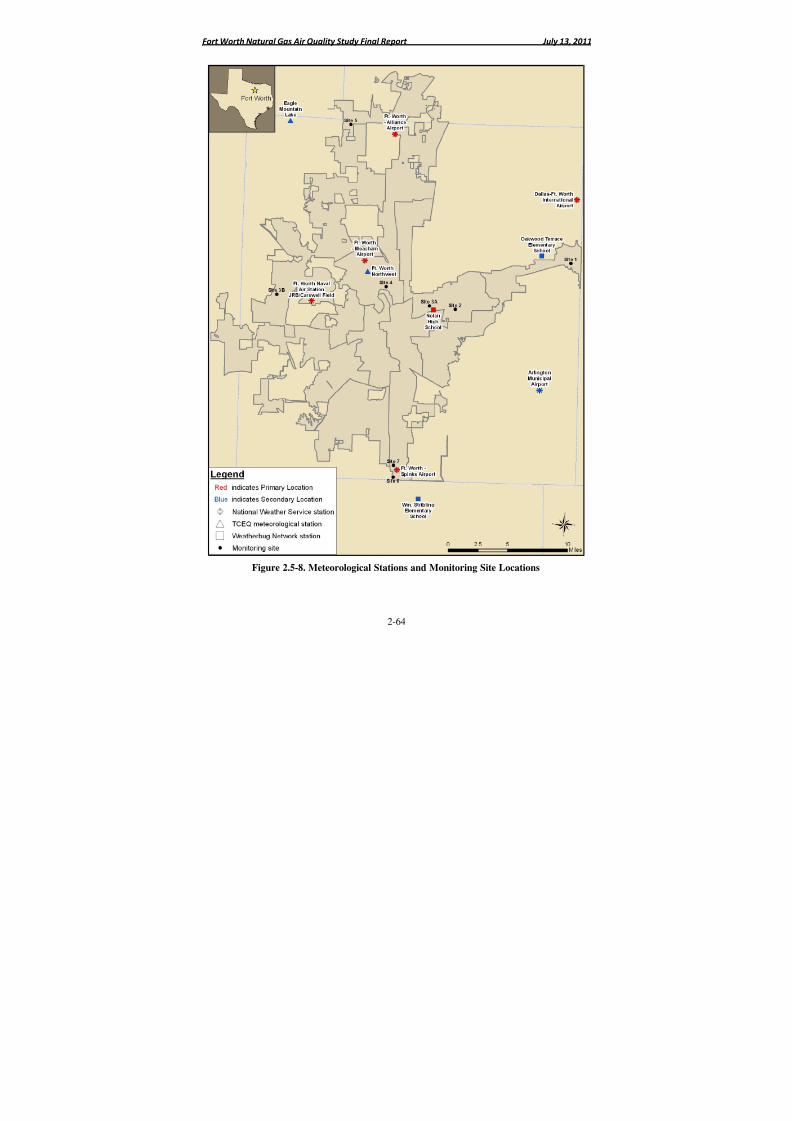
8/6/2019 Air Quality Study Final
http://slidepdf.com/reader/full/air-quality-study-final 81/320
Fort Worth Natural Gas Air Quality Study Final Report July 13, 2011
2-64
Figure 2.5-8. Meteorological Stations and Monitoring Site Locations
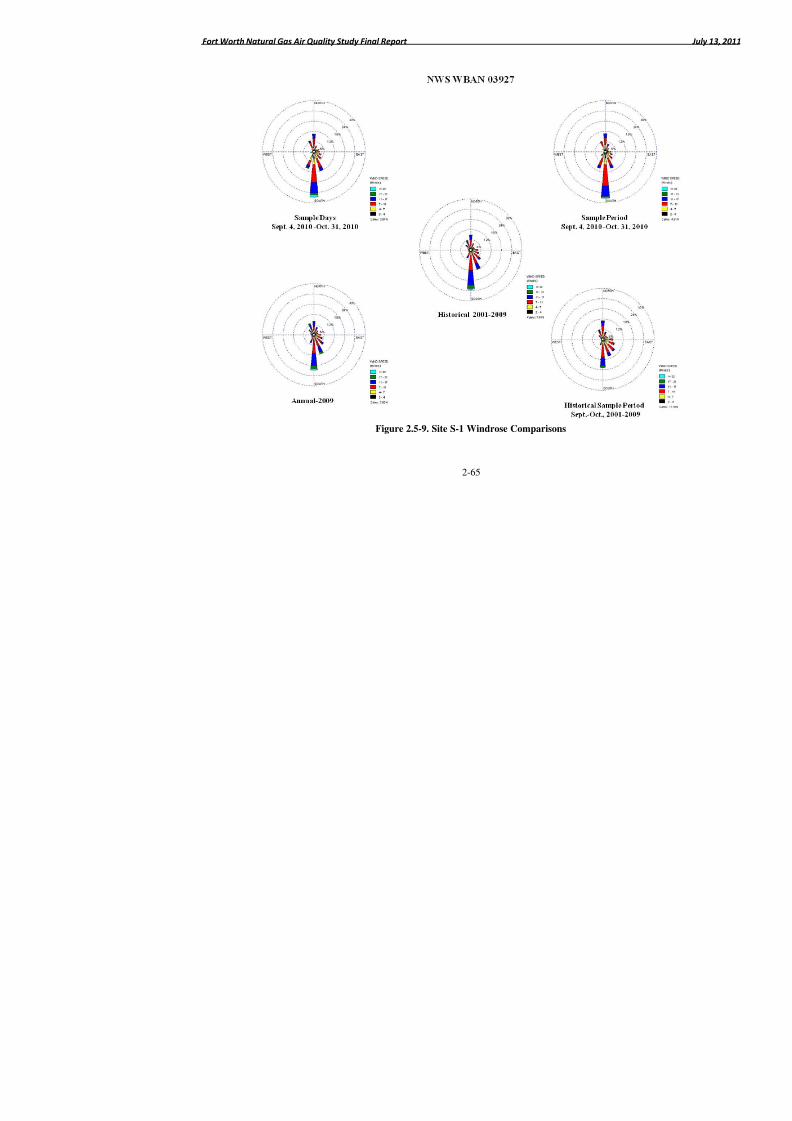
8/6/2019 Air Quality Study Final
http://slidepdf.com/reader/full/air-quality-study-final 82/320
Fort Worth Natural Gas Air Quality Study Final Report
2-65
Figure 2.5-9. Site S-1 Windrose Comparisons
8/6/2019 Air Quality Study Final
http://slidepdf.com/reader/full/air-quality-study-final 83/320
Fort Worth Natural Gas Air Quality Study Final Report
2-66
Figure 2.5-10. Site S-2 Windrose Comparisons
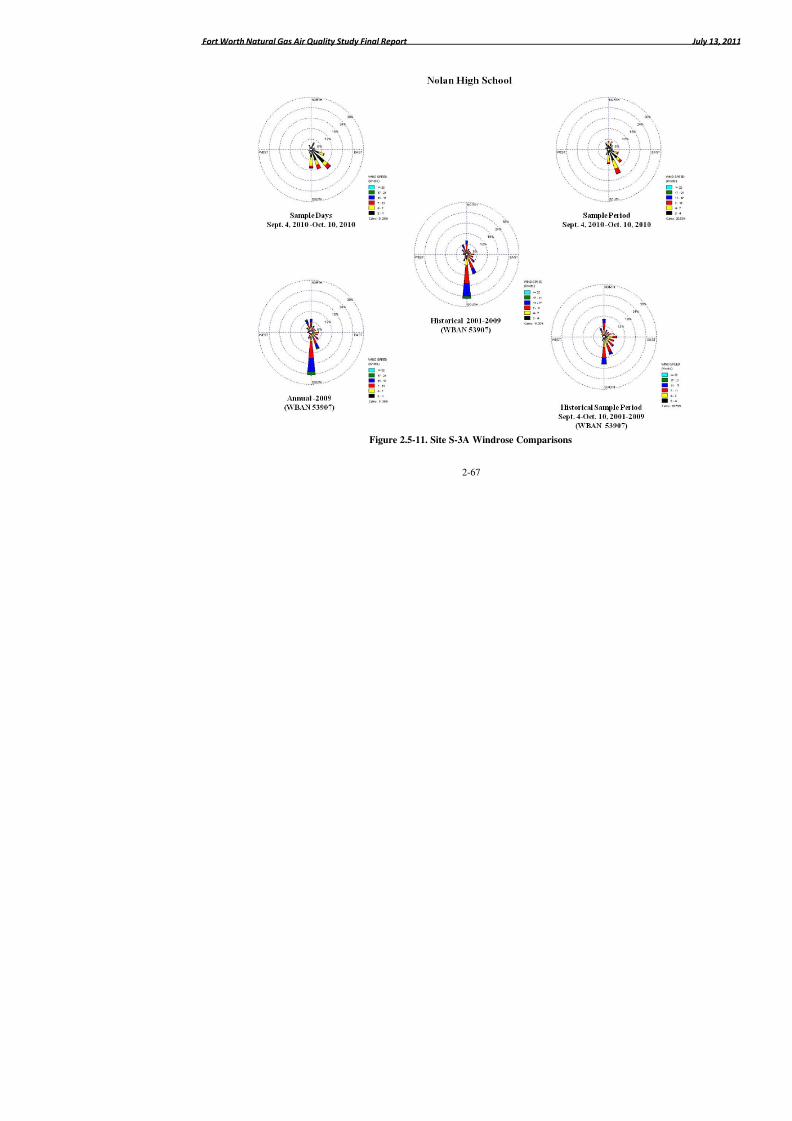
8/6/2019 Air Quality Study Final
http://slidepdf.com/reader/full/air-quality-study-final 84/320
Fort Worth Natural Gas Air Quality Study Final Report
2-67
Figure 2.5-11. Site S-3A Windrose Comparisons
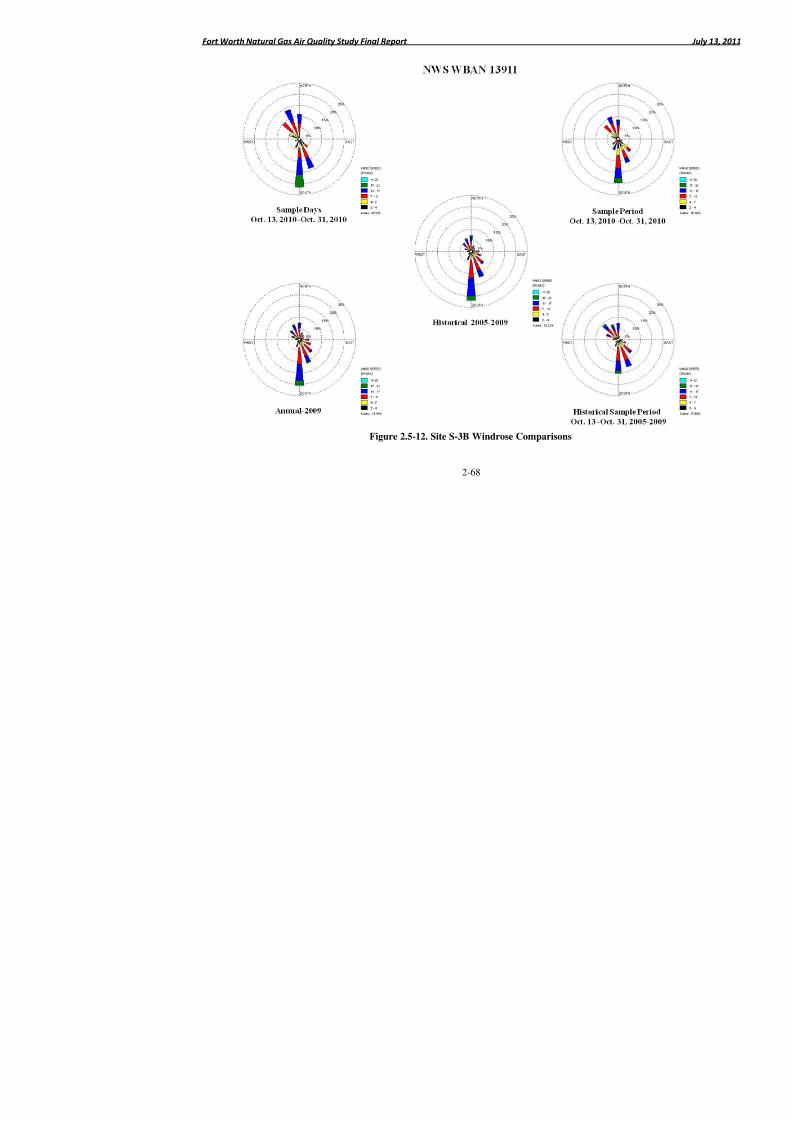
8/6/2019 Air Quality Study Final
http://slidepdf.com/reader/full/air-quality-study-final 85/320
Fort Worth Natural Gas Air Quality Study Final Report
2-68
Figure 2.5-12. Site S-3B Windrose Comparisons
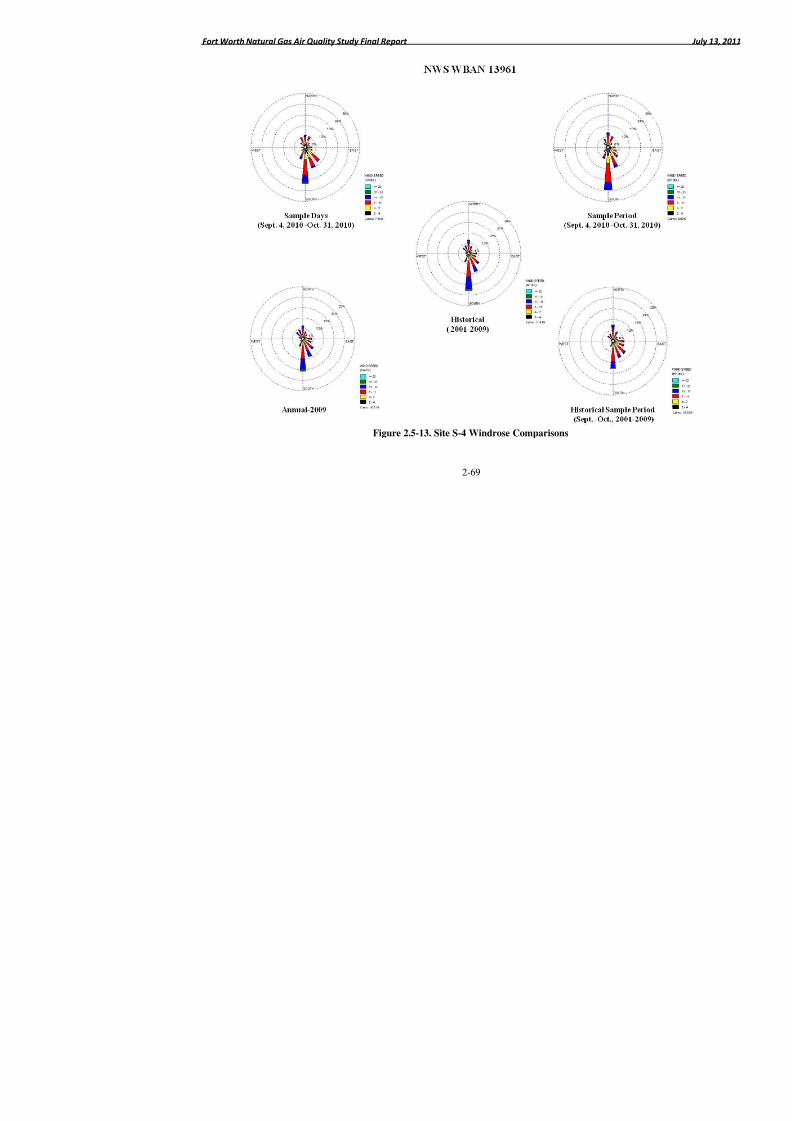
8/6/2019 Air Quality Study Final
http://slidepdf.com/reader/full/air-quality-study-final 86/320
Fort Worth Natural Gas Air Quality Study Final Report
2-69
Figure 2.5-13. Site S-4 Windrose Comparisons
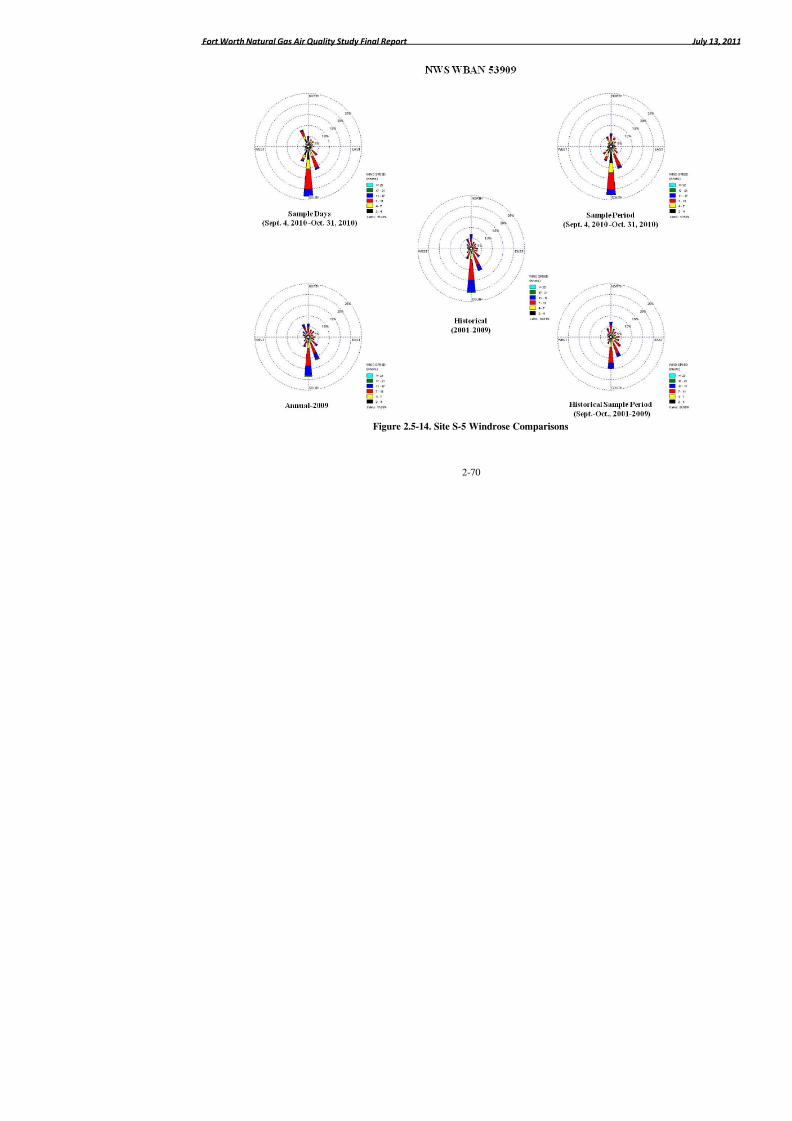
8/6/2019 Air Quality Study Final
http://slidepdf.com/reader/full/air-quality-study-final 87/320
Fort Worth Natural Gas Air Quality Study Final Report
2-70
Figure 2.5-14. Site S-5 Windrose Comparisons
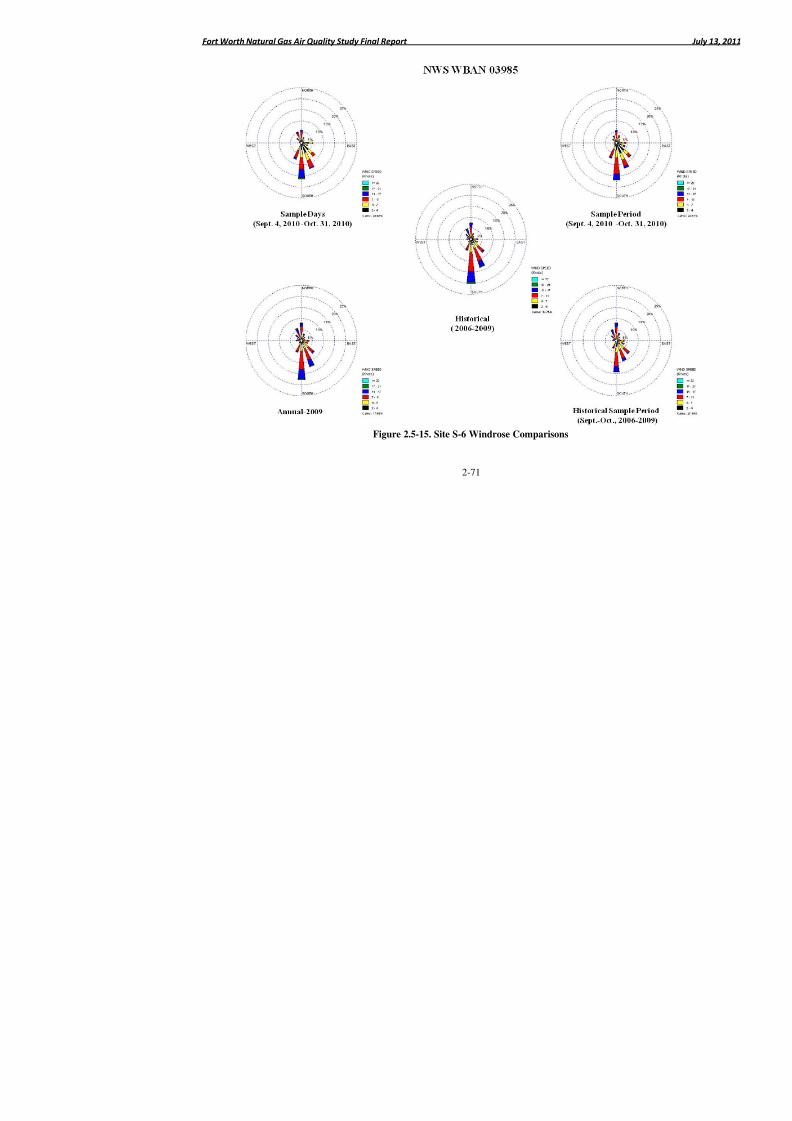
8/6/2019 Air Quality Study Final
http://slidepdf.com/reader/full/air-quality-study-final 88/320
Fort Worth Natural Gas Air Quality Study Final Report
2-71
Figure 2.5-15. Site S-6 Windrose Comparisons
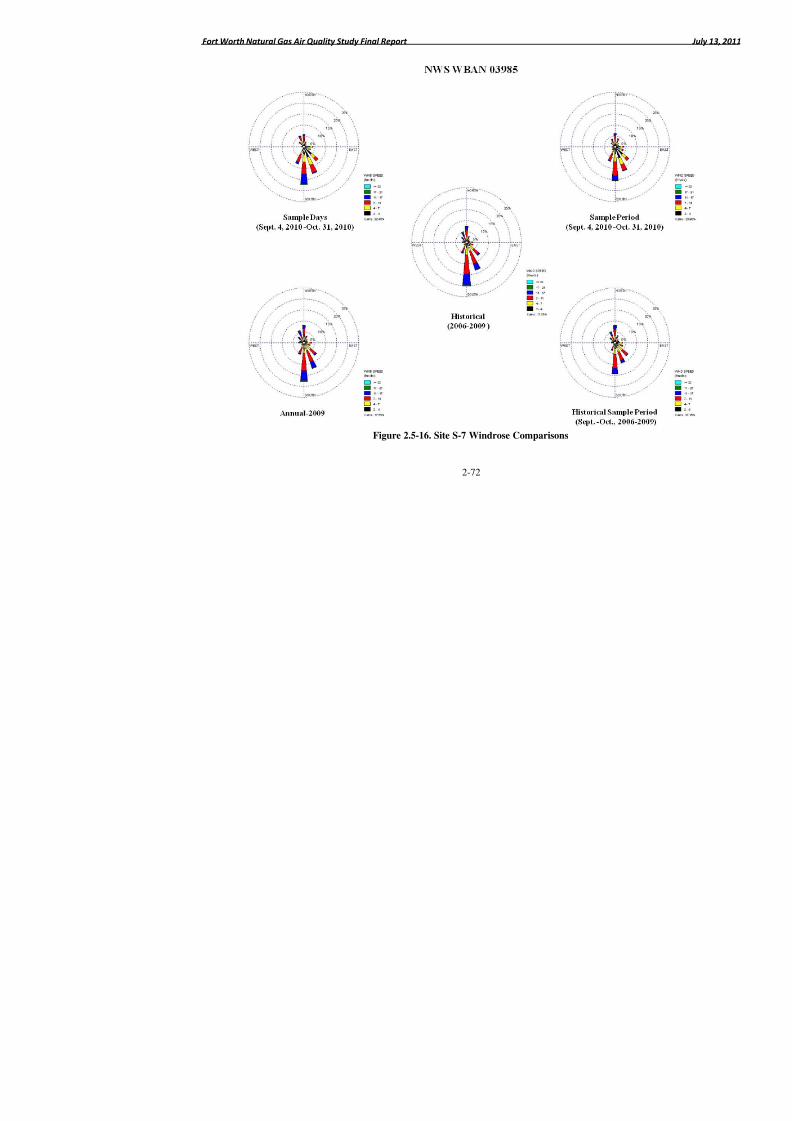
8/6/2019 Air Quality Study Final
http://slidepdf.com/reader/full/air-quality-study-final 89/320
Fort Worth Natural Gas Air Quality Study Final Report
2-72
Figure 2.5-16. Site S-7 Windrose Comparisons
8/6/2019 Air Quality Study Final
http://slidepdf.com/reader/full/air-quality-study-final 90/320
Fort Worth Natural Gas Air Quality Study Final Report July 13, 2011
2-73
2.6 Ambient Air Monitoring Conclusions
Ambient air monitoring sampling at eight monitoring sites for nearly 140 pollutantsyielded over 15,000 data points for this study. The ambient monitoring data presented in thisreport is based on air samples collected during a two-month timeframe at eight locations. The
data should not be used to make inferences about air quality during times when, and locationswhere, samples were not collected. Insights from the dispersion modeling analysis have beenused to help address this inherent limitation of the ambient air monitoring program, and a fulldiscussion of the health implications of this study are presented in Section 5 of this report.
Key findings from the ambient monitoring study are as follows:
• 169 ambient air samples from 8 locations in Fort Worth were collected and analyzed,resulting in over 15,000 ambient air data points generated for this study.
• ERG found little variability across the sampling network for certain pollutants, suchas carbon tetrachloride, chloroform, chloromethane, crotonaldehyde,
dichlorodifluoromethane, dichlorotetrafluoroethane, ethylene, 1-hexene, isoprene,propylene, trichlorotrifluoromethane, and trichlorotrifluoroethane. The low variabilityacross the entire network suggests that these pollutants are not affected by localized,anthropogenic sources, but rather exist as background pollutants.
• Benzene and carbon tetrachloride were identified as key VOCs at each site.
• Acetaldehyde and formaldehyde were identified as key carbonyls at Sites S-4 and S-5.
• No SNMOCs were identified as key pollutants.
• Concentrations measured at Site S-4 (located in a high-level activity area nearcompressor stations, well pads, and mobile sources) were generally higher than atother sites. For some of the key pollutants (acetaldehyde and benzene), concentrations
at this site were considerably higher.
• Pollutant concentrations at Sites S-6 and S-7 (located in a medium-level activity area)were surprisingly low relative to other sites, especially given their close proximity toactive well pad locations.
• Concentrations at Site S-1 (“background” site with no nearby natural gas well padsupwind) were generally similar to Site S-2 (“mobile sources” site). Concentrations atthese two sites were slightly higher than Sites S-6 and S-7.
• Concentrations at the two “preproduction” sites did not display higher pollutantconcentrations than the two monitoring stations designated as “background” and“mobile source” sites.
• Wind patterns observed during the sampling period were consistent with historicalwind patterns, indicating proper placement of the ambient air monitors.
8/6/2019 Air Quality Study Final
http://slidepdf.com/reader/full/air-quality-study-final 91/320
Fort Worth Natural Gas Air Quality Study Final Report July 13, 2011
3-1
3.0 Point Source Testing
ERG subcontracted the point source testing task to Sage Environmental Consulting LP(Sage). This section discusses how the point source testing task was conducted and the resultsthat were obtained.
This section has seven sub-sections:
• 3.1 Introduction – Provides a summary of the purpose of the point source study, thescope of work, and the project timeline.
• 3.2 Point Source Survey Sampling Equipment – This section describes the fieldinstrumentation.
• 3.3 Point Source Survey and Sampling Procedures – This section discusses surveyprocedures, documentation of emission points, the collection of emission data,canister sampling, and data archival procedures.
• 3.4 Emissions Calculation Procedures – The development of canister-derivedemissions, the application of correlation equations, the creation of surrogate tank andnon-tank emissions profiles, the use of EPA default-zero emissions factors, the use of engine emissions tables, and the calculation of Screening Emissions Factors arediscussed in this section.
• 3.5 Point Source Emissions Results – The results of the point source study areprovided in the charts and tables of this section.
• 3.6 Quality Control (QC) Results – This section contains the results of the QCprocedures specified in the Final Point Source Test Plan including instrumentcalibration checks, canister sample collection procedures, and laboratory analyticalchecks.
• 3.7 Point Source Testing Conclusions – This section presents conclusions of the pointsource testing task.
• Appendix 3-A: Emissions summary for each point source site surveyed.
• Appendix 3-B: Two DVD discs containing the emissions calculation workbook,“MASTER - Well Char Emission Data 2011-07-13_FINAL” together with the datacollected for each point source site.
• Appendix 3-C: One DVD containing the canister sample logbooks and the canisteranalytical results, the laboratory quality control results and the canister chain-of custody documentation.
3.1 Introduction
The purpose of the point source emissions study was to characterize emissions fromnatural gas-related point sources located within the Fort Worth city limits. These sources arecategorized in seven groups:
• Well Pads – Comprising the largest group of sites visited, natural gas well padstypically contained several active wells, produced water storage tanks, separators, and
8/6/2019 Air Quality Study Final
http://slidepdf.com/reader/full/air-quality-study-final 92/320
Fort Worth Natural Gas Air Quality Study Final Report July 13, 2011
3-2
metering runs (piping). Approximately one-third (123) of the well pads also had liftcompressors used to increase a well’s gas production rate. Emission sources typicallyrelated with well pads include equipment leaks, produced water and condensatestorage and loading, and lift compressors. The amount of condensate production andrelated emissions are usually dependant on whether the produced gas is wet or dry gas.
• Compressor Stations – Compressor stations contain one or more large (generally 250horsepower (hp) or greater) line compressors which provide the necessary pressure tomove the natural gas through many miles of transmission lines. The most significantemissions from compressors stations are usually from combustion at the compressorengines or turbines. Other emissions sources may include equipment leaks, storagetanks, glycol dehydrators, flares, and condensate and/or wastewater loading. None of the compressor stations visited included turbines.
• Processing Facilities – Processing facilities generally remove impurities from thenatural gas, such as carbon dioxide, water, and hydrogen sulfide. These facilities mayalso be designed to remove ethane, propane, and butane fractions from the natural gas
for downstream marketing. Processing facilities are usually the largest emittingnatural gas-related point sources including multiple emission sources such as, but notlimited to equipment leaks, storage tanks, separator vents, glycol dehydrators, flares,condensate and wastewater loading, compressors, amine treatment and sulfurrecovery units. The Processing Plant visited included most of these sources except forsulfur recovery units.
• Saltwater Treatment Facility – The single saltwater treatment facility permitted foroperation within the City’s boundaries uses underground injection to dispose of wellproduction liquids such as oilfield brine, drilling mud, fracture materials, and welltreatment fluids. Emission sources typically related with salt water treatment facilitiesinclude equipment leaks, storage tanks, and generators.
• Drilling Operation – Drilling of a new well is typically a two to three week processfrom start to finish and involves several large diesel-fueled generators. Otheremission sources related to drilling operations may include equipment leaks andwaste storage.
• Fracking Operation – Fracking is the high pressure injection of water mixed withsand and a variety of chemical additives into the well to fracture the shale andstimulate natural gas production from the well. Fracking operations can last forseveral weeks and involve many large diesel-fueled generators. Other emissionsources related to fracking operations may include equipment leaks and waste storage.
• Flowback – Flowback is a well completion activity that occurs following theconclusion of a fracking operation. Flowback thus entails the removal of frackingfluids from the well in preparation either for a subsequent phase of treatment or forcleanup and returning the well to production. Similar to fracking operations, otherrelated emission sources may include equipment leaks and waste storage.
8/6/2019 Air Quality Study Final
http://slidepdf.com/reader/full/air-quality-study-final 93/320
Fort Worth Natural Gas Air Quality Study Final Report July 13, 2011
3-3
The point source teams surveyed a total of 388sites (including repeat visits at two sites). The sites areidentified by owner and type in Table 3.1-1. Figure3.1-1 locates each site on an overlay map of FortWorth. Figure 3.1-2 indicates which well pads were
considered to be wet gas, and which were consideredto be dry gas. For purposes of this study, a site wasconsidered to be a wet gas site if it produced morethan 1 barrel of condensate/day as indicated by the Texas Railroad Commission records.
The point source emissions survey occurred in two phases. Phase I was completed in thefall of 2010 (August 30 – October 21, 2010). Phase II took place during the beginning months of 2011 (January 4 – February 16, 2011). There were no significant differences in methodology orscope between the two phases. Any slight differences between the methodologies are discussedbelow. During Phase I, 199 point source sites were surveyed and are identified using PointSource ID’s PS-001 through PS-201. An additional 189 sites were completed in Phase II and are
identified as Point Source ID’s 6 through 487.
Quality Control results indicate that the field and the laboratory equipment were in a stateof control during the point source survey and that project quality control checks were followed.Site-by-site emission summaries are provided in Appendix 3-A of this report. Appendix 3-Bprovides the field data and emission calculation workbook on two DVD discs. Appendix 3-Ccontains the canister analytical data on one DVD disc.
3.2 Point Source Emissions Survey Sampling Equipment
The point source surveys were carried out by two teams of two persons each. In Phase I
each team was staffed by a Sage employee and an employee from Hicks & Co. Environmental(Hicks). This changed in Phase II to one team of two Sage employees while the other teamremained a Sage and a Hicks employee. The point source teams were equipped with thefollowing test equipment:
• FLIR™ Infrared (IR) Camera.
• Thermo Environmental ™ Toxic Vapor Analyzer.
• Bacharach™ Hi Flow Sampler.
• Summa Passivated Stainless Steel Canisters from TestAmerica™.
• Miscellaneous Support Equipment (Global Positioning System (GPS) Finder, Laser
Distance Finder, Weather meter, Digital Camera).
Key Point: Sites Surveyed This study included surveying a totalof 388 sites comprised of well pads,compressor stations, processingfacilities, a salt water treatment
facility, drilling operations, frackingoperations, and completion operations.
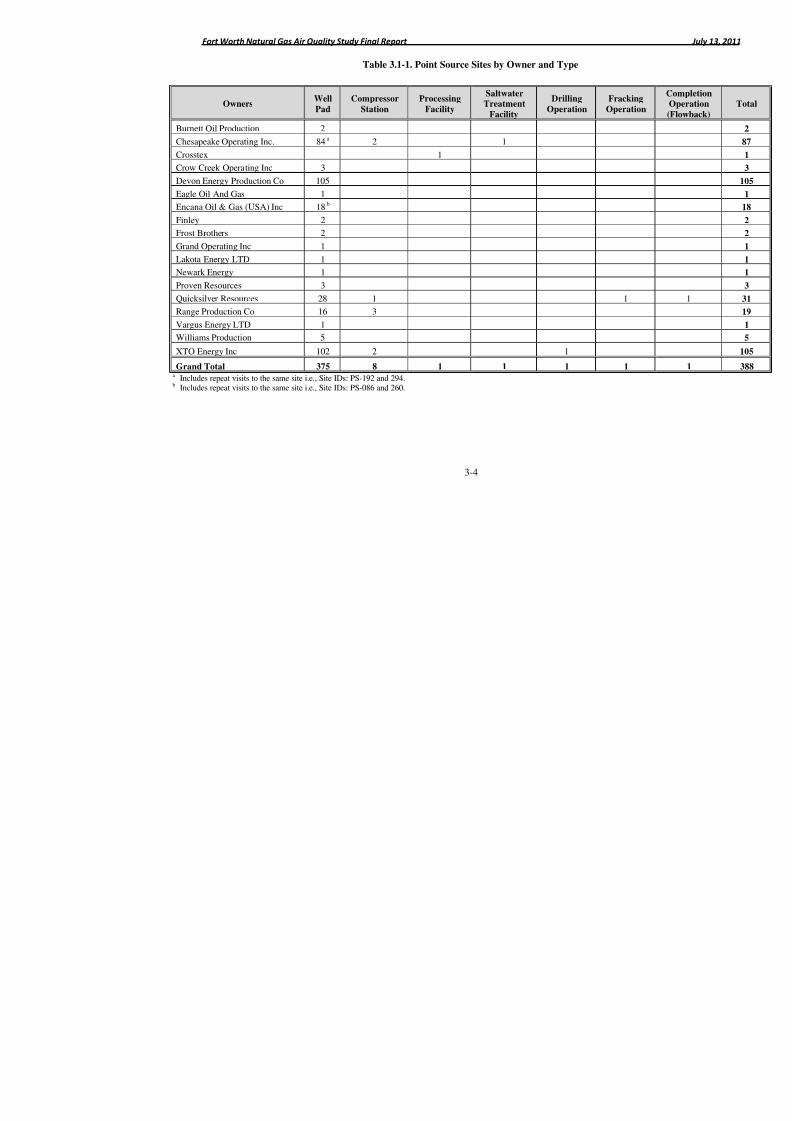
8/6/2019 Air Quality Study Final
http://slidepdf.com/reader/full/air-quality-study-final 94/320
Fort Worth Natural Gas Air Quality Study Final Report
3-4
a
Includes repeat visits to the same site i.e., Site IDs: PS-192 and 294.b Includes repeat visits to the same site i.e., Site IDs: PS-086 and 260.
Table 3.1-1. Point Source Sites by Owner and Type
OwnersWell
Pad
Compressor
Station
Processing
Facility
SaltwaterTreatment
Facility
Drilling
Operation
Fra
Op
Burnett Oil Production 2
Chesapeake Operating Inc. 84 a 2 1
Crosstex 1
Crow Creek Operating Inc 3
Devon Energy Production Co 105
Eagle Oil And Gas 1
Encana Oil & Gas (USA) Inc 18 b
Finley 2
Frost Brothers 2
Grand Operating Inc 1
Lakota Energy LTD 1
Newark Energy 1
Proven Resources 3
Quicksilver Resources 28 1
Range Production Co 16 3
Vargus Energy LTD 1
Williams Production 5
XTO Energy Inc 102 2 1
Grand Total 375 8 1 1 1
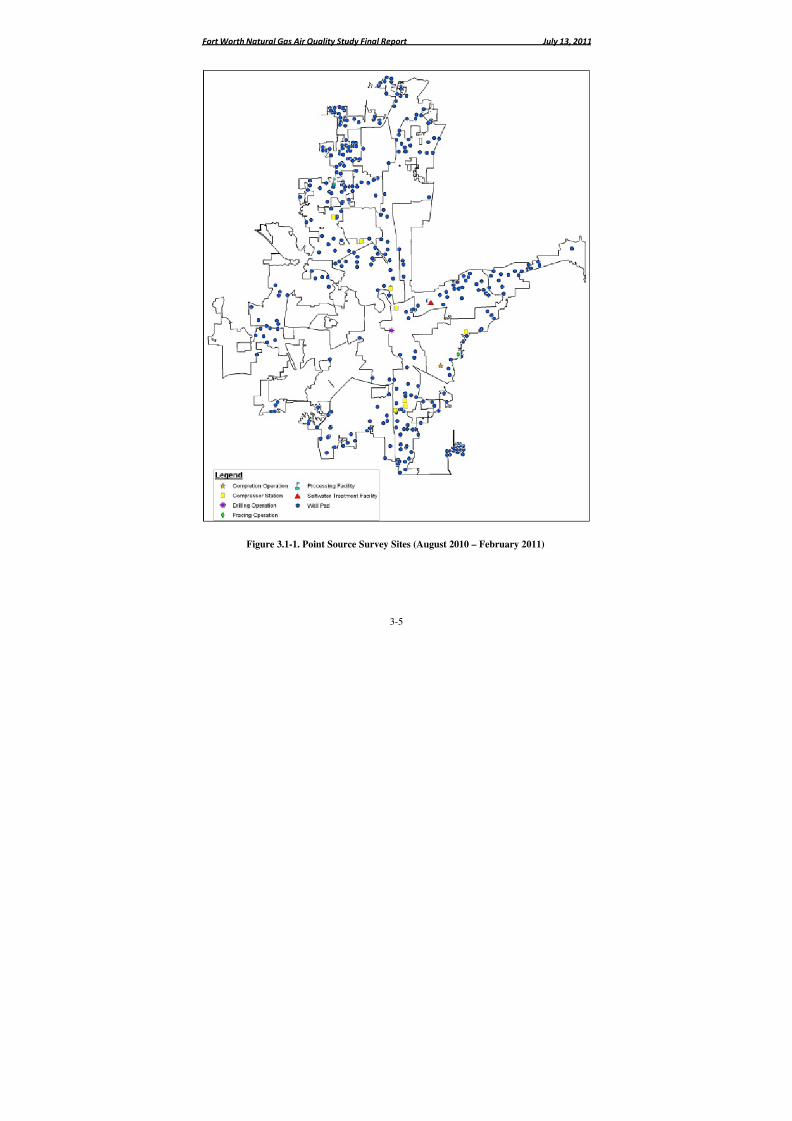
8/6/2019 Air Quality Study Final
http://slidepdf.com/reader/full/air-quality-study-final 95/320
Fort Worth Natural Gas Air Quality Study Final Report July 13, 2011
3-5
Figure 3.1-1. Point Source Survey Sites (August 2010 – February 2011)
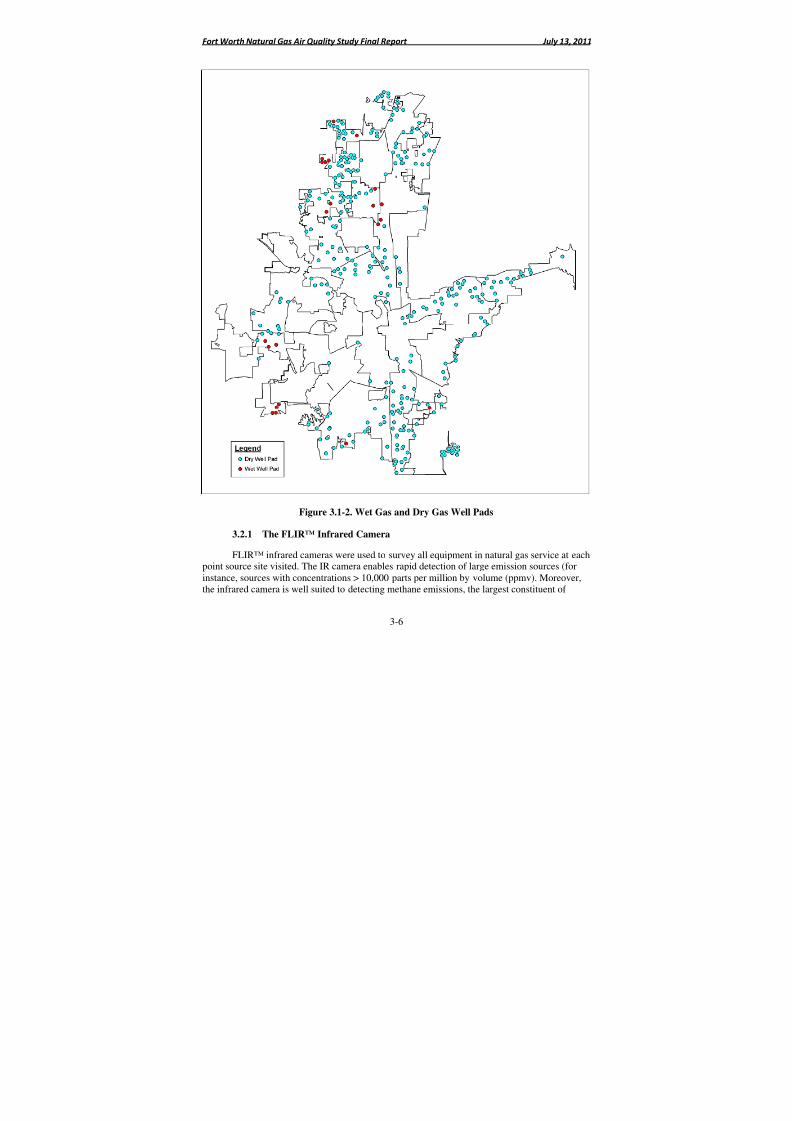
8/6/2019 Air Quality Study Final
http://slidepdf.com/reader/full/air-quality-study-final 96/320
Fort Worth Natural Gas Air Quality Study Final Report July 13, 2011
3-6
Figure 3.1-2. Wet Gas and Dry Gas Well Pads
3.2.1 The FLIR™ Infrared Camera
FLIR™ infrared cameras were used to survey all equipment in natural gas service at eachpoint source site visited. The IR camera enables rapid detection of large emission sources (forinstance, sources with concentrations > 10,000 parts per million by volume (ppmv). Moreover,the infrared camera is well suited to detecting methane emissions, the largest constituent of
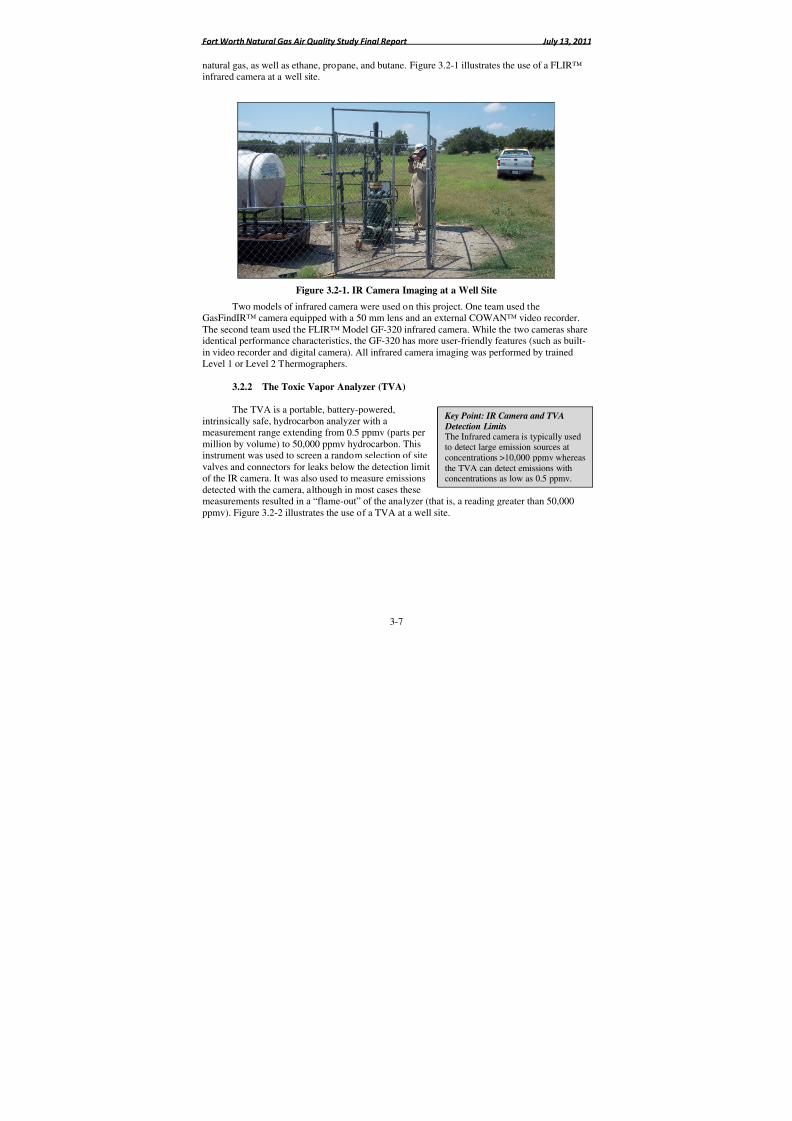
8/6/2019 Air Quality Study Final
http://slidepdf.com/reader/full/air-quality-study-final 97/320
Fort Worth Natural Gas Air Quality Study Final Report July 13, 2011
3-7
natural gas, as well as ethane, propane, and butane. Figure 3.2-1 illustrates the use of a FLIR™infrared camera at a well site.
Figure 3.2-1. IR Camera Imaging at a Well Site
Two models of infrared camera were used on this project. One team used theGasFindIR™ camera equipped with a 50 mm lens and an external COWAN™ video recorder.The second team used the FLIR™ Model GF-320 infrared camera. While the two cameras shareidentical performance characteristics, the GF-320 has more user-friendly features (such as built-in video recorder and digital camera). All infrared camera imaging was performed by trainedLevel 1 or Level 2 Thermographers.
3.2.2 The Toxic Vapor Analyzer (TVA)
The TVA is a portable, battery-powered,intrinsically safe, hydrocarbon analyzer with ameasurement range extending from 0.5 ppmv (parts permillion by volume) to 50,000 ppmv hydrocarbon. Thisinstrument was used to screen a random selection of sitevalves and connectors for leaks below the detection limitof the IR camera. It was also used to measure emissionsdetected with the camera, although in most cases thesemeasurements resulted in a “flame-out” of the analyzer (that is, a reading greater than 50,000ppmv). Figure 3.2-2 illustrates the use of a TVA at a well site.
Key Point: IR Camera and TVA
Detection LimitsThe Infrared camera is typically usedto detect large emission sources atconcentrations >10,000 ppmv whereasthe TVA can detect emissions withconcentrations as low as 0.5 ppmv.
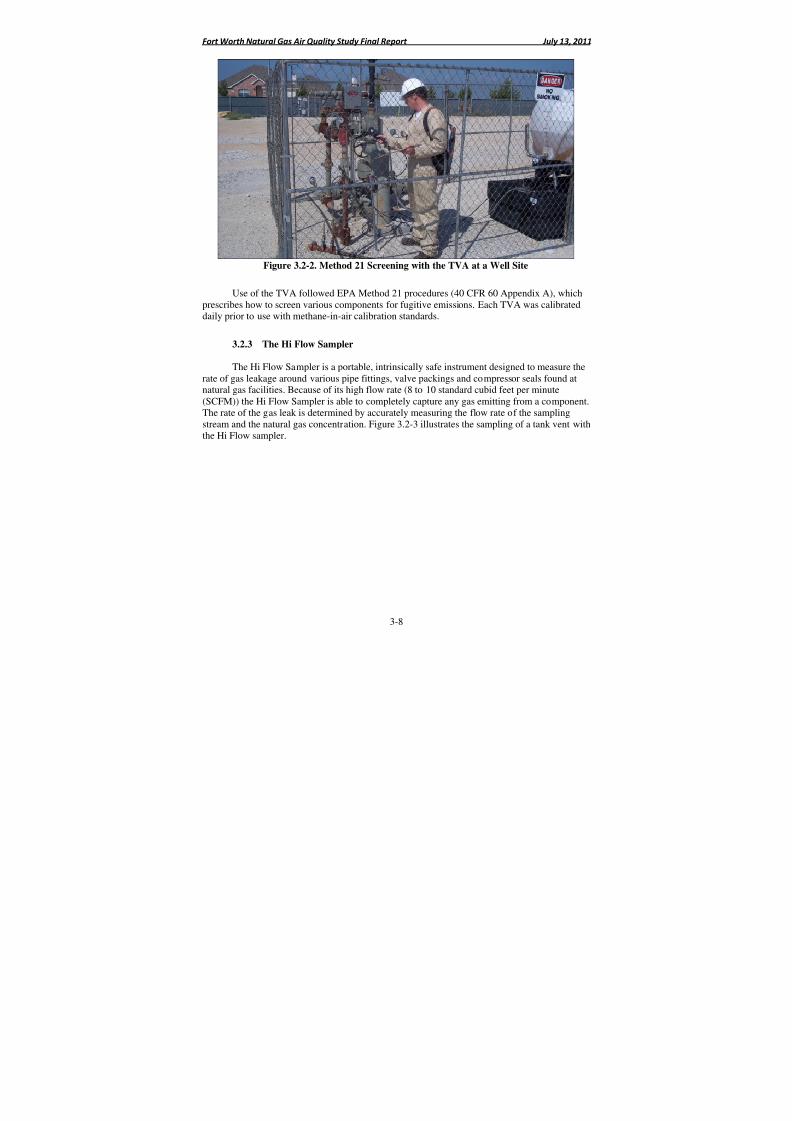
8/6/2019 Air Quality Study Final
http://slidepdf.com/reader/full/air-quality-study-final 98/320
Fort Worth Natural Gas Air Quality Study Final Report July 13, 2011
3-8
Figure 3.2-2. Method 21 Screening with the TVA at a Well Site
Use of the TVA followed EPA Method 21 procedures (40 CFR 60 Appendix A), whichprescribes how to screen various components for fugitive emissions. Each TVA was calibrateddaily prior to use with methane-in-air calibration standards.
3.2.3 The Hi Flow Sampler
The Hi Flow Sampler is a portable, intrinsically safe instrument designed to measure the
rate of gas leakage around various pipe fittings, valve packings and compressor seals found atnatural gas facilities. Because of its high flow rate (8 to 10 standard cubid feet per minute(SCFM)) the Hi Flow Sampler is able to completely capture any gas emitting from a component.The rate of the gas leak is determined by accurately measuring the flow rate of the samplingstream and the natural gas concentration. Figure 3.2-3 illustrates the sampling of a tank vent withthe Hi Flow sampler.
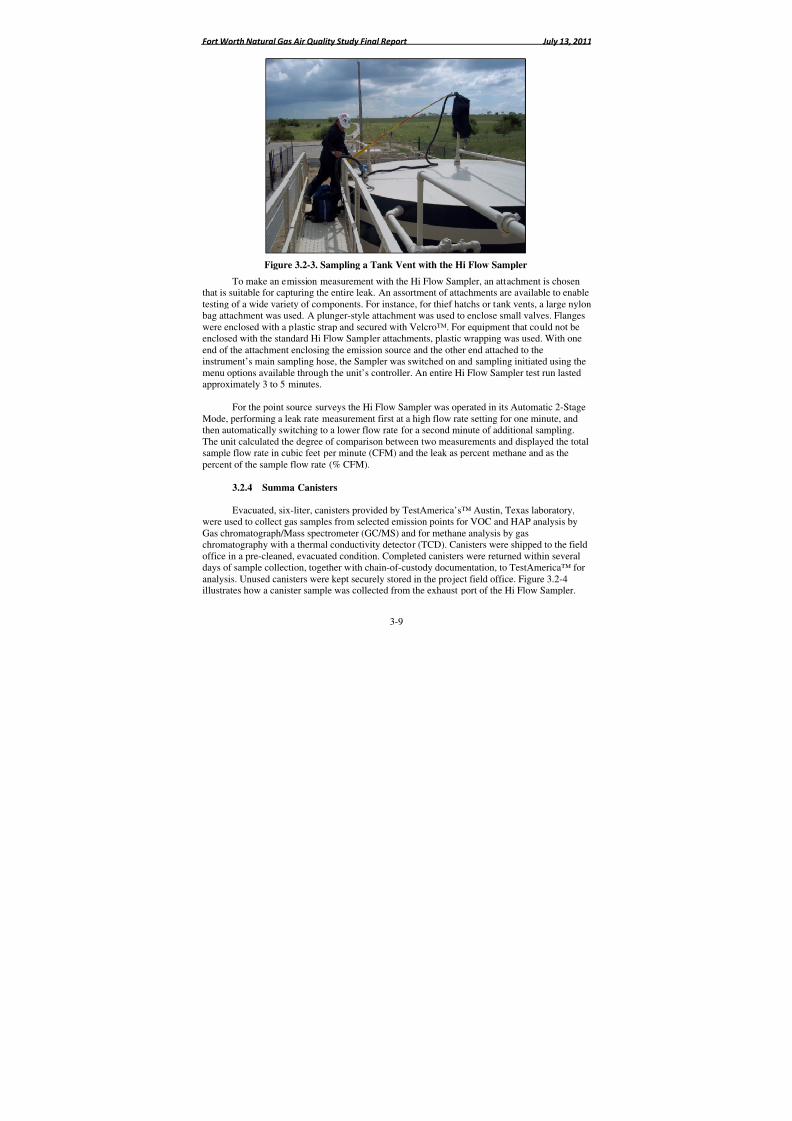
8/6/2019 Air Quality Study Final
http://slidepdf.com/reader/full/air-quality-study-final 99/320
Fort Worth Natural Gas Air Quality Study Final Report July 13, 2011
3-9
Figure 3.2-3. Sampling a Tank Vent with the Hi Flow Sampler
To make an emission measurement with the Hi Flow Sampler, an attachment is chosenthat is suitable for capturing the entire leak. An assortment of attachments are available to enabletesting of a wide variety of components. For instance, for thief hatchs or tank vents, a large nylonbag attachment was used. A plunger-style attachment was used to enclose small valves. Flangeswere enclosed with a plastic strap and secured with Velcro™. For equipment that could not beenclosed with the standard Hi Flow Sampler attachments, plastic wrapping was used. With oneend of the attachment enclosing the emission source and the other end attached to theinstrument’s main sampling hose, the Sampler was switched on and sampling initiated using themenu options available through the unit’s controller. An entire Hi Flow Sampler test run lastedapproximately 3 to 5 minutes.
For the point source surveys the Hi Flow Sampler was operated in its Automatic 2-StageMode, performing a leak rate measurement first at a high flow rate setting for one minute, andthen automatically switching to a lower flow rate for a second minute of additional sampling.The unit calculated the degree of comparison between two measurements and displayed the totalsample flow rate in cubic feet per minute (CFM) and the leak as percent methane and as thepercent of the sample flow rate (% CFM).
3.2.4 Summa Canisters
Evacuated, six-liter, canisters provided by TestAmerica’s™ Austin, Texas laboratory,were used to collect gas samples from selected emission points for VOC and HAP analysis byGas chromatograph/Mass spectrometer (GC/MS) and for methane analysis by gaschromatography with a thermal conductivity detector (TCD). Canisters were shipped to the fieldoffice in a pre-cleaned, evacuated condition. Completed canisters were returned within severaldays of sample collection, together with chain-of-custody documentation, to TestAmerica™ foranalysis. Unused canisters were kept securely stored in the project field office. Figure 3.2-4illustrates how a canister sample was collected from the exhaust port of the Hi Flow Sampler.
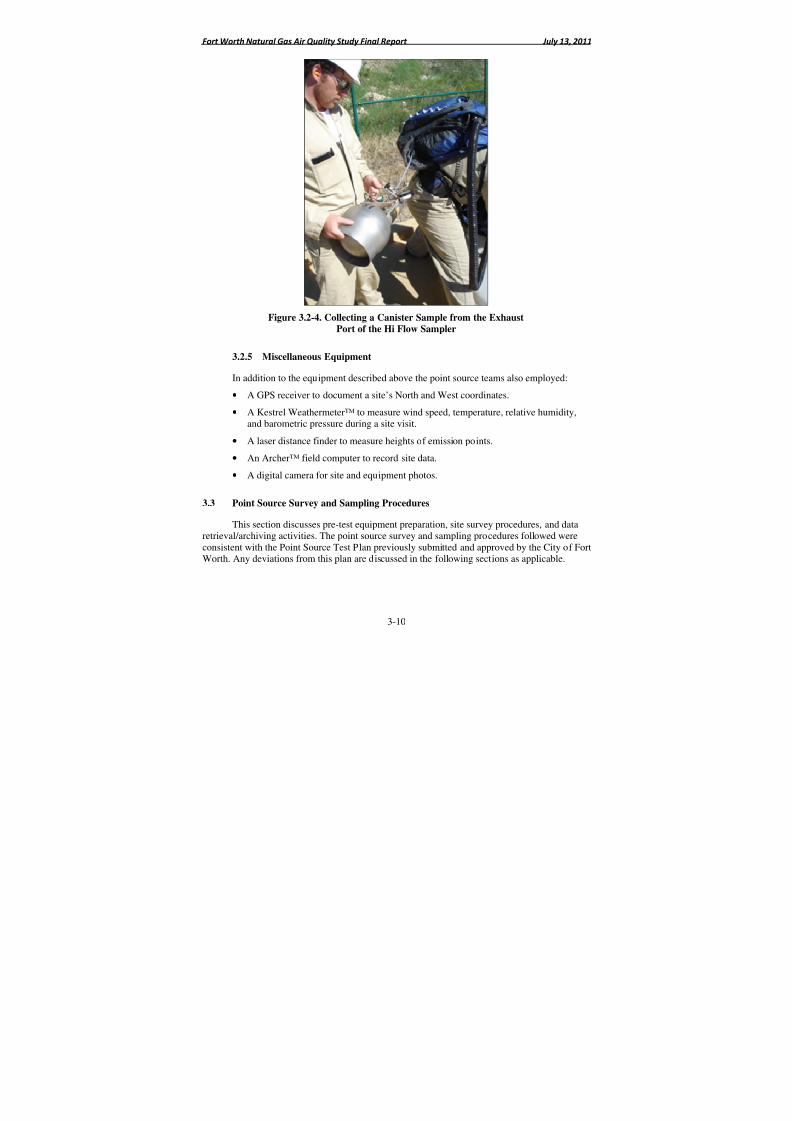
8/6/2019 Air Quality Study Final
http://slidepdf.com/reader/full/air-quality-study-final 100/320
Fort Worth Natural Gas Air Quality Study Final Report July 13, 2011
3-10
Figure 3.2-4. Collecting a Canister Sample from the ExhaustPort of the Hi Flow Sampler
3.2.5 Miscellaneous Equipment
In addition to the equipment described above the point source teams also employed:• A GPS receiver to document a site’s North and West coordinates.
• A Kestrel Weathermeter™ to measure wind speed, temperature, relative humidity,and barometric pressure during a site visit.
• A laser distance finder to measure heights of emission points.
• An Archer™ field computer to record site data.
• A digital camera for site and equipment photos.
3.3 Point Source Survey and Sampling Procedures
This section discusses pre-test equipment preparation, site survey procedures, and dataretrieval/archiving activities. The point source survey and sampling procedures followed wereconsistent with the Point Source Test Plan previously submitted and approved by the City of FortWorth. Any deviations from this plan are discussed in the following sections as applicable.
8/6/2019 Air Quality Study Final
http://slidepdf.com/reader/full/air-quality-study-final 101/320
Fort Worth Natural Gas Air Quality Study Final Report July 13, 2011
3-11
3.3.1 Pre-Test Equipment Preparation
Equipment was prepared for use each morning prior to the first site visit. Preparationsincluded:
• The IR Camera Daily Demo.
• A calibration check of the Hi Flow Sampler.
• A multipoint calibration of the TVA.
IR Camera Daily Demo Quality Assurance Check
The IR Camera Daily Demo provides a validation of the camera’s operation by releasinga known mass emission rate of gas (100% propane) and measuring the distance from which therelease can be reliably viewed. This validation was performed first thing each morning with bothcameras at two mass emission rates: a low emission rate of 10 grams/hour propane and a higheremission rate of 31 grams/hour propane. The distance from which each emission rate could be
detected (i.e. sighting distance) was recorded, together with wind direction, wind speed,temperature, relative humidity, barometric pressure, and percent cloud cover information. Theequipment used to perform the daily demo included a steel compressed gas cylinder of 100%propane gas, a single stage gas regulator, a calibrated rotameter, flow control valves and tubingto position the emission flow at eye-level. The results of the daily demos are provided in Section3.6 of this report and further documented in the field log notes included in Appendix 3-B.
Calibration Check of the Hi Flow Samplers
The Hi Flow Sampler contains two sensors – a background sensor and a leak sensor. Bothsensors were calibrated at the start of Phase I and at the start of Phase II using certified standards
of 2.5% methane-in-air and 100% methane. On a daily basis, prior to testing, the background andleak sensors of each Sampler were calibration-checked with the 2.5% methane standard. If anerror greater than 10% resulted, the instrument was re-calibrated. Each Monday, the backgroundand leak sensors of both instruments were calibration-checked with both the 2.5% and the 100%methane standards. Again, errors above 10% required re-calibration of the instrument.
The results of the Hi Flow Sampler daily calibration checks are provided in Section 3.6 of this report and further documented in the field log notes included in Appendix 3-B.
Multipoint Calibration of the TVAs
A multipoint calibration of each TVA was performed daily prior to testing with thefollowing gases:
• Zero gas (<0.1 ppmv total hydrocarbon).
• Low Level Span gas (nominally 500 ppmv methane-in-air).
• Mid Level Span gas (nominally 1,000 ppmv methane-in-air).
• High Level Span gas (nominally 10,000 ppmv methane-in-air).
8/6/2019 Air Quality Study Final
http://slidepdf.com/reader/full/air-quality-study-final 102/320
Fort Worth Natural Gas Air Quality Study Final Report July 13, 2011
3-12
Following the calibration, each TVA would be re-checked with the same gases. Theinstrument was considered to be in a state of control if its response to each gas was accurate towithin +/- 10%. Failure to meet this criterion required recalibration, repair, or replacement of theinstrument.
3.3.2 Final Preparations
Following the instrument performance checks,data from the previous day would be reviewed forcompleteness and accuracy, the City Chief GasInspector would be called with the addresses of the firstsites to be visited, and the vans would be loaded withthe instrumentation and canisters. There would be abrief group safety discussion, the field office would then be locked, and the each team woulddepart to the first of their assigned sites for the day.
Sites were selected for surveying on a random basis. During the day, City Gas Inspectorswere only told of the next scheduled site upon departure. These procedures were followed toavoid the possibility of site owners learning of the survey schedule in advance.
3.3.3 Site Arrival
Upon arrival at the designated point source site, the survey team met with the City GasInspector who unlocked the site gate to allow entrance to the site. On no occasion did the teamenter a site without the City Gas Inspector also being present. Customarily at this time, a picturewas taken of the front gate signage as part of the site documentation (Figure 3.3-1 shows anexample of front gate signage).
KeyPoint: Random Site SelectionTo reduce bias in the survey relativeto owner, operator, location, or anyother variable, sites were selected forsurveying on a random basis.
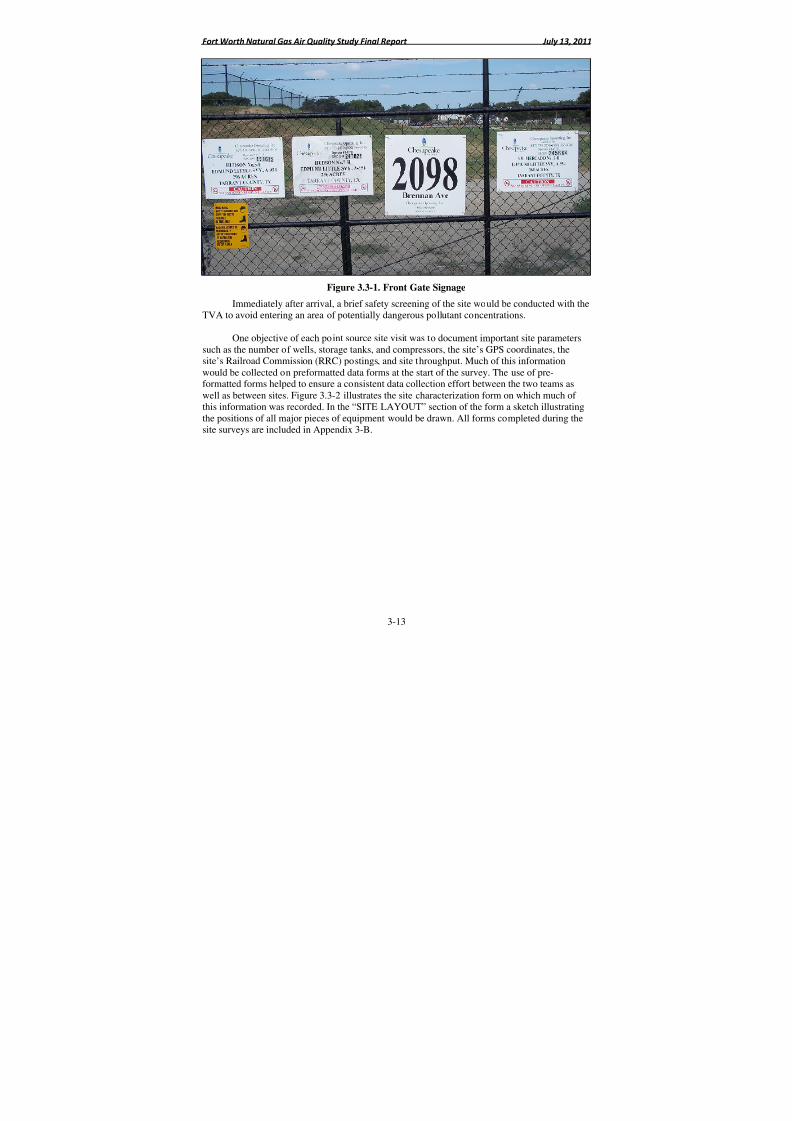
8/6/2019 Air Quality Study Final
http://slidepdf.com/reader/full/air-quality-study-final 103/320
Fort Worth Natural Gas Air Quality Study Final Report July 13, 2011
3-13
Figure 3.3-1. Front Gate Signage
Immediately after arrival, a brief safety screening of the site would be conducted with theTVA to avoid entering an area of potentially dangerous pollutant concentrations.
One objective of each point source site visit was to document important site parameterssuch as the number of wells, storage tanks, and compressors, the site’s GPS coordinates, thesite’s Railroad Commission (RRC) postings, and site throughput. Much of this informationwould be collected on preformatted data forms at the start of the survey. The use of pre-
formatted forms helped to ensure a consistent data collection effort between the two teams aswell as between sites. Figure 3.3-2 illustrates the site characterization form on which much of this information was recorded. In the “SITE LAYOUT” section of the form a sketch illustratingthe positions of all major pieces of equipment would be drawn. All forms completed during thesite surveys are included in Appendix 3-B.
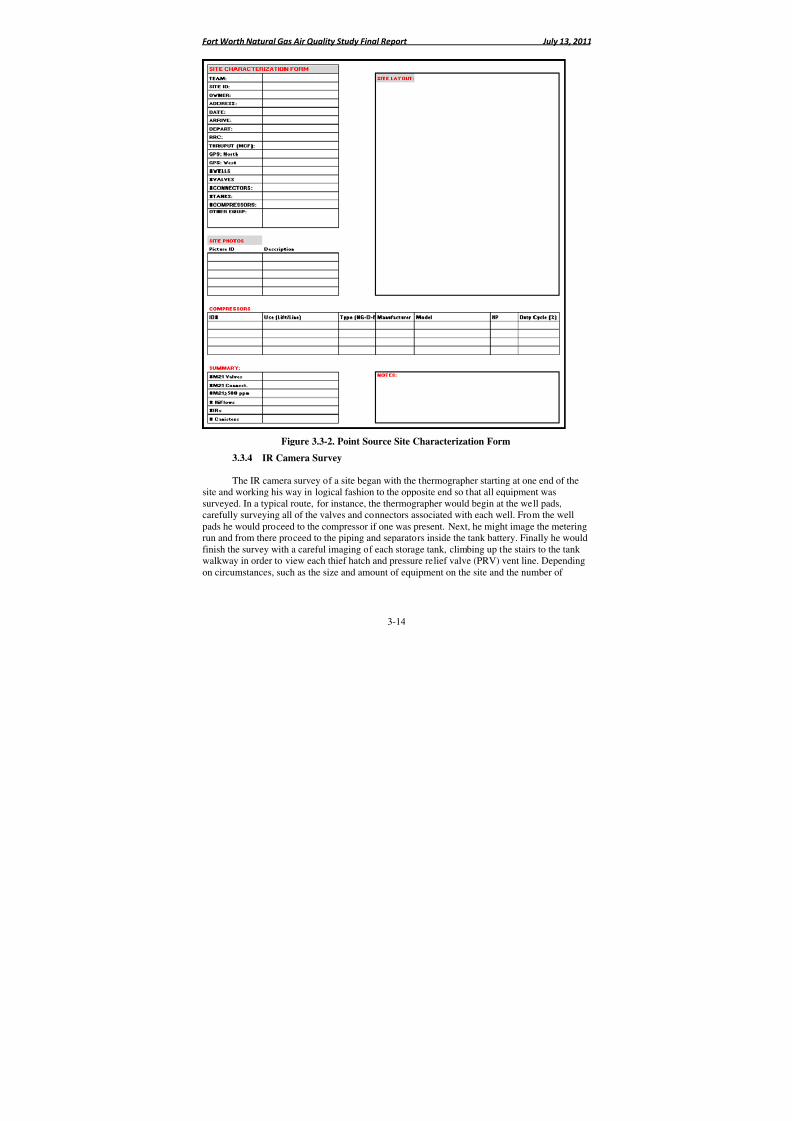
8/6/2019 Air Quality Study Final
http://slidepdf.com/reader/full/air-quality-study-final 104/320
Fort Worth Natural Gas Air Quality Study Final Report July 13, 2011
3-14
Figure 3.3-2. Point Source Site Characterization Form
3.3.4 IR Camera Survey
The IR camera survey of a site began with the thermographer starting at one end of thesite and working his way in logical fashion to the opposite end so that all equipment was
surveyed. In a typical route, for instance, the thermographer would begin at the well pads,carefully surveying all of the valves and connectors associated with each well. From the wellpads he would proceed to the compressor if one was present. Next, he might image the meteringrun and from there proceed to the piping and separators inside the tank battery. Finally he wouldfinish the survey with a careful imaging of each storage tank, climbing up the stairs to the tank walkway in order to view each thief hatch and pressure relief valve (PRV) vent line. Dependingon circumstances, such as the size and amount of equipment on the site and the number of
8/6/2019 Air Quality Study Final
http://slidepdf.com/reader/full/air-quality-study-final 105/320
Fort Worth Natural Gas Air Quality Study Final Report July 13, 2011
3-15
detected emission points, an IR camera site survey of a typical well pad might last from one toseveral hours.
When an emission was detected with the IR camera, a video recording of the IR imagingwould be made, a photograph of the emission source would be taken and the following data
documented:
• Date and time.
• Equipment description and size.
• Emission point height above ground (feet).
• GPS coordinates of emission point (Phase II only).
• Sighting distance (feet).
• TVA reading of emission (ppmv).
• Tank height and radius if tank emission (feet).
• Video file name.
• Maximum sighting distance (feet) – The maximum sighting distance is the distancefrom which the emission can be reliably detected with the IR camera and provides ameasure of the emission’s magnitude (i.e. large emissions can be detected fromfurther away).
• Weather conditions (Wind Direction, Wind Speed, Temperature, Relative Humidity,Barometric Pressure, and Cloud Cover).
As standard practice, the thermographer would image equipment from different angles.
This is necessary since environmental conditions such as sunlight, wind, and background (i.e. air,piping, concrete or heat profiles) can cause an emission stream to be difficult to see from oneangle, but easily detected from another.
With the GasFindIR™ camera integration settings would be switched to enable viewingof very hot surfaces (typically found at compressors), manual mode would be used on occasionto verify the absence or presence of a subtle emission, and “nuking” would be employed asrequired to eliminate optical background noise. Nuking adjusts the GasFindIR’s background sothat a more uniform pixel response is obtained.
With the GF-320 camera the thermographer would frequently shift to High Sensitivity
mode to confirm or detect a more subtle emission that was hard to see. All field data forms,digital photographs and videos are provided in electronic form in Appendix 3-B.
3.3.5 Method 21 Site Survey with the Toxic Vapor Analyzer
While one team member conducted the IR camera site survey, the second membercalculated the total number of site valves and connectors. This was done by first determining thevalve count and then applying a multiplying factor to arrive at the number of connectors. For this
8/6/2019 Air Quality Study Final
http://slidepdf.com/reader/full/air-quality-study-final 106/320
Fort Worth Natural Gas Air Quality Study Final Report July 13, 2011
3-16
project, a connector multiplier of 7 was conservatively used, based upon detailed connectorcounts performed at the beginning of both Phase I and Phase II. Thus if it was determined that asite contained 245 valves, then a connector count of 1,715 (7 x 245) was assumed. The 7:1connector to valve ratio held true for all equipment except at compressor skids where a higherratio was often noted. Consequently the number of connectors at compressor skids was estimated
separately by multiplying the number of compressor valves by factors ranging from 10 to 15,depending on the size and complexity of the compressor.
These component counts were necessary sinceone objective of the point source testing was toestimate low level emissions (i.e. emissions below thedetection limits of the IR camera) from fugitiveequipment leaks. This objective was accomplished byscreening at least ten percent of the valve andconnector population at each point source site with the TVA. Thus while the IR camera surveywas in progress, Method 21 screening of the site’s valves and connectors was performed with the
TVA on one of every ten valves and one of every ten connectors until ten percent of the totalvalve and connector counts was reached. This procedure ensured that the required number of components was screened and that the screening population was evenly distributed across allareas of the site. This screening was conducted independent of the IR camera survey. Once it wascompleted, the TVA was then used to screen any emission points identified by the IR camera.
Following Method 21 procedures, valves were screened at their three primary leak areas:the stem, the packing, and the bonnet flange. Method 21 screening entails placing the TVA’sprobe at the various leak interfaces and sampling the complete circumference. Flanges werescreened by placing the TVA probe at the edge of the flange-gasket interface. Connectors werescreened by sampling the circumference of the threaded sections. All other components weremonitored through a peripheral traverse of the seal interface. Whenever an elevated reading wasobtained the sample probe was left at this elevated point for at least twice the instrument’sresponse time (i.e. at least for 8 seconds) to ensure that the maximum concentration wasmeasured.
When an emission at or above 500 ppmv was detected with the TVA the following datawould be recorded:
• Date and time.
• Screening concentration (ppmv).
• Equipment Description.
• Equipment Location (GPS coordinates in Phase II only).
Key Point: Method 21 ScreeningTo estimate low level emissions fromfugitive equipment leaks, at least 10%of the valve and connector populationat each site surveyed was screened.
8/6/2019 Air Quality Study Final
http://slidepdf.com/reader/full/air-quality-study-final 107/320
Fort Worth Natural Gas Air Quality Study Final Report July 13, 2011
3-17
3.3.6 Hi Flow Sampler Emissions Testing
The Hi Flow Sampler, as discussed previously, provides a quick and effective means of quantifying emissions by sampling at a high enough flow rate to capture all the emissionsescaping from a component. By accurately measuring the flow rate of the sample stream and the
natural gas concentration within the stream, the instrument is able to determine the gas leak rateexpressed both as percent methane and percent CFM. When this data is combined with canisteranalytical data, mass emission rates for individual compounds can be calculated as explained inSection 3.4.
Hi Flow Sampler testing was conducted at all emission points identified with the IRCamera (high level emissions) as well as at each emission point identified through Method 21screening with a concentration >500 ppmv (low level emissions). A number of low levelemissions in Phase I were below the detection capability of the Hi Flow Sampler. Emissionsfrom these points have had to be subsequently estimated. In Phase II this was remedied bysampling the exhaust stream of the Hi Flow Sampler with the TVA and using the resulting TVA
concentration to calculate the low level emission rate.
The following data was documented for each Hi Flow Sampler test:
• Date and time.
• The percent difference in leak rate between the sample flow rates.
• Total sample flow (CFM).
• Background concentration (%).
• Leak rate as % methane (% CH4).
• Leak rate as % of total sample flow (% CFM).
3.3.7 Canister Sampling
As documented in the Point SourceTest Plan, it was originally intended that acanister sample be collected at each emissionpoint identified by the IR camera. However,as Phase I testing commenced, it becameapparent that the sampling teams were
observing an unexpectedly high frequency of camera-detected emission points. Therefore,an alternative canister sampling strategy was needed; neither the project budget nor laboratoryresources would be able to keep up with the canister demand otherwise. A revised canistersampling plan was developed and subsequently approved by the City of Fort Worth. The revisedcanister sampling plan was based upon three criteria.
Key Point: Canister Sampling164 canister samples were collected throughoutFort Worth during the study. Data obtained fromthe 164 canister samples were used to developsurrogate canister emission profiles andcorrelation equations to characterize emissions
from those points not directly sampled.
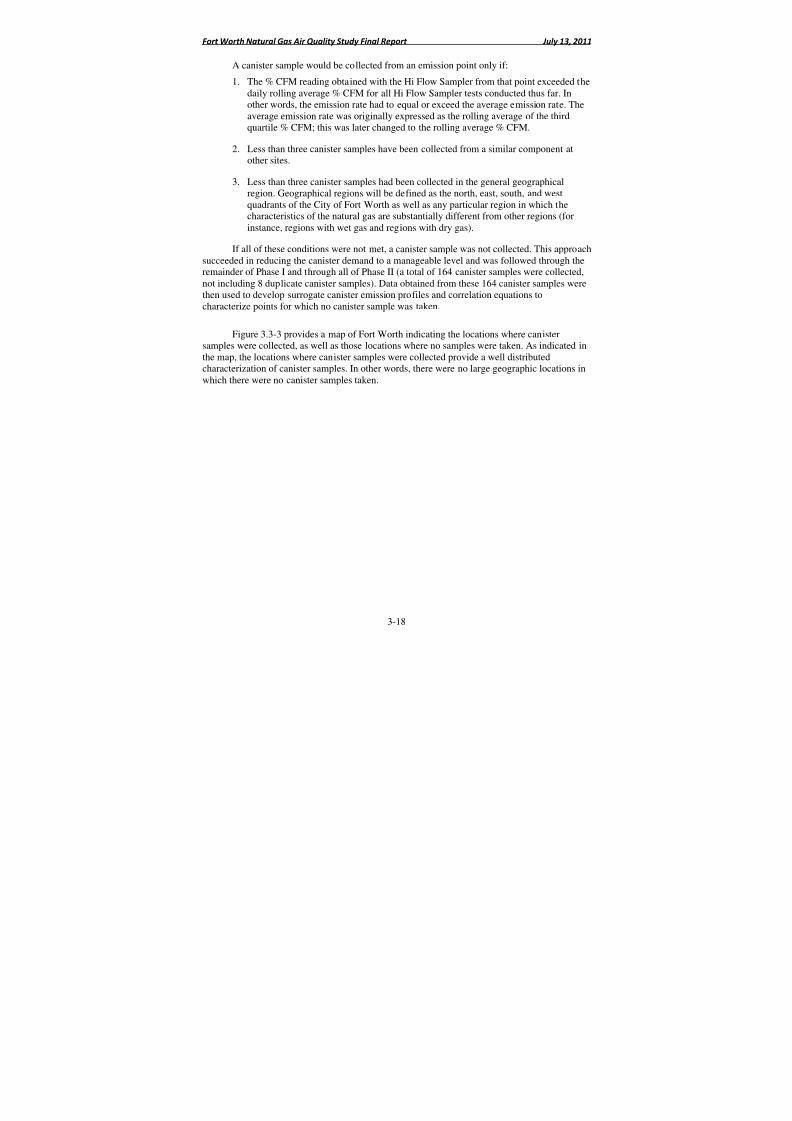
8/6/2019 Air Quality Study Final
http://slidepdf.com/reader/full/air-quality-study-final 108/320
Fort Worth Natural Gas Air Quality Study Final Report July 13, 2011
3-18
A canister sample would be collected from an emission point only if:
1. The % CFM reading obtained with the Hi Flow Sampler from that point exceeded thedaily rolling average % CFM for all Hi Flow Sampler tests conducted thus far. Inother words, the emission rate had to equal or exceed the average emission rate. Theaverage emission rate was originally expressed as the rolling average of the third
quartile % CFM; this was later changed to the rolling average % CFM.
2. Less than three canister samples have been collected from a similar component atother sites.
3. Less than three canister samples had been collected in the general geographicalregion. Geographical regions will be defined as the north, east, south, and westquadrants of the City of Fort Worth as well as any particular region in which thecharacteristics of the natural gas are substantially different from other regions (forinstance, regions with wet gas and regions with dry gas).
If all of these conditions were not met, a canister sample was not collected. This approachsucceeded in reducing the canister demand to a manageable level and was followed through theremainder of Phase I and through all of Phase II (a total of 164 canister samples were collected,not including 8 duplicate canister samples). Data obtained from these 164 canister samples werethen used to develop surrogate canister emission profiles and correlation equations tocharacterize points for which no canister sample was taken.
Figure 3.3-3 provides a map of Fort Worth indicating the locations where canistersamples were collected, as well as those locations where no samples were taken. As indicated inthe map, the locations where canister samples were collected provide a well distributedcharacterization of canister samples. In other words, there were no large geographic locations in
which there were no canister samples taken.
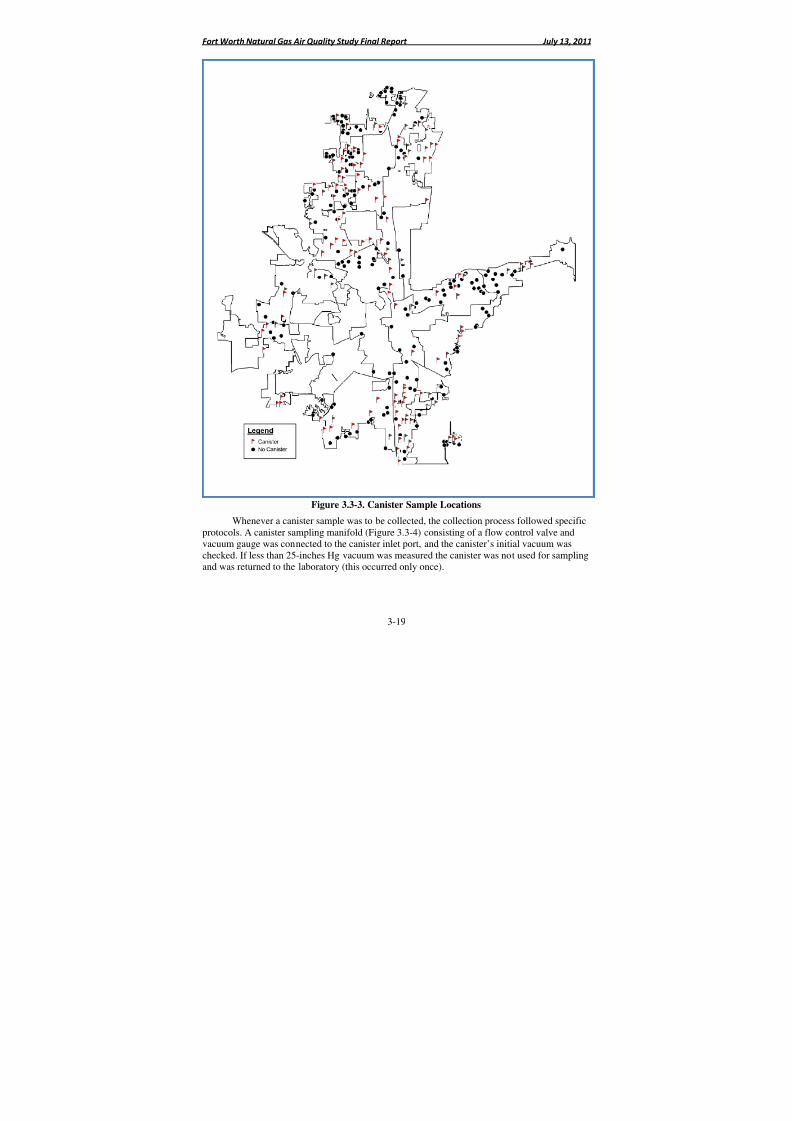
8/6/2019 Air Quality Study Final
http://slidepdf.com/reader/full/air-quality-study-final 109/320
Fort Worth Natural Gas Air Quality Study Final Report July 13, 2011
3-19
Figure 3.3-3. Canister Sample LocationsWhenever a canister sample was to be collected, the collection process followed specific
protocols. A canister sampling manifold (Figure 3.3-4) consisting of a flow control valve andvacuum gauge was connected to the canister inlet port, and the canister’s initial vacuum waschecked. If less than 25-inches Hg vacuum was measured the canister was not used for samplingand was returned to the laboratory (this occurred only once).
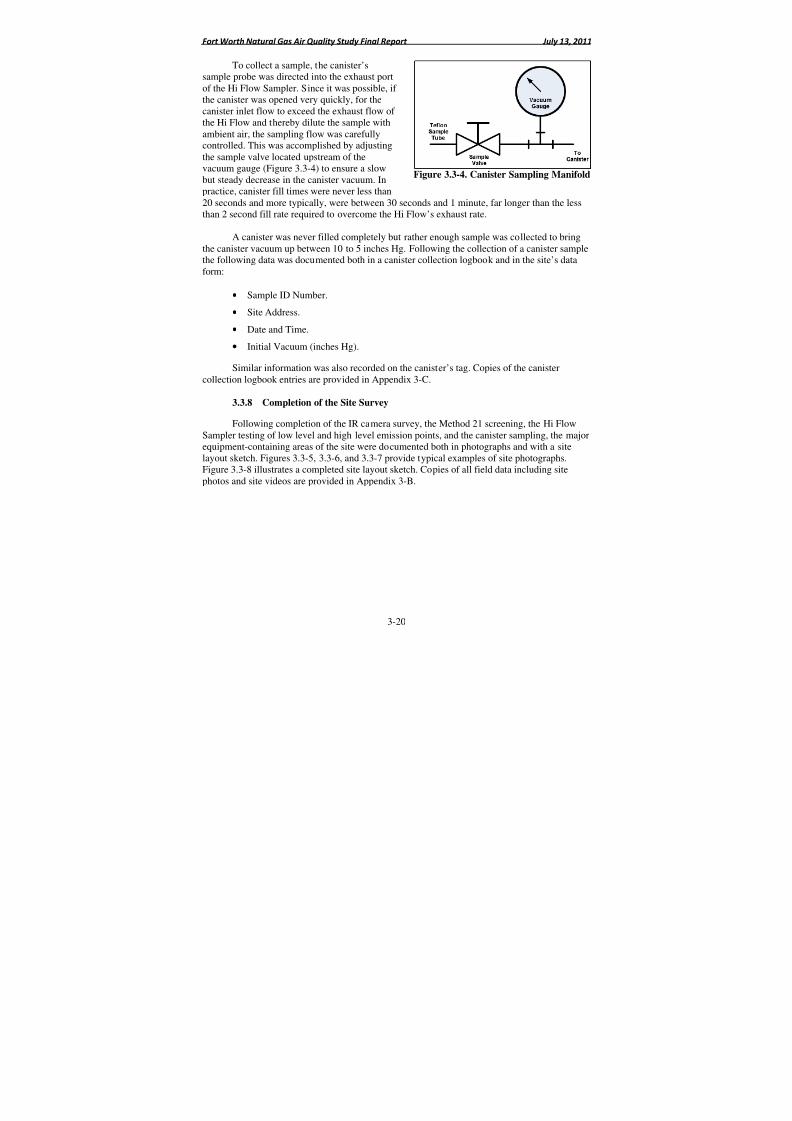
8/6/2019 Air Quality Study Final
http://slidepdf.com/reader/full/air-quality-study-final 110/320
Fort Worth Natural Gas Air Quality Study Final Report July 13, 2011
3-20
Figure 3.3-4. Canister Sampling Manifold
To collect a sample, the canister’ssample probe was directed into the exhaust portof the Hi Flow Sampler. Since it was possible, if the canister was opened very quickly, for thecanister inlet flow to exceed the exhaust flow of
the Hi Flow and thereby dilute the sample withambient air, the sampling flow was carefullycontrolled. This was accomplished by adjustingthe sample valve located upstream of thevacuum gauge (Figure 3.3-4) to ensure a slowbut steady decrease in the canister vacuum. Inpractice, canister fill times were never less than20 seconds and more typically, were between 30 seconds and 1 minute, far longer than the lessthan 2 second fill rate required to overcome the Hi Flow’s exhaust rate.
A canister was never filled completely but rather enough sample was collected to bring
the canister vacuum up between 10 to 5 inches Hg. Following the collection of a canister samplethe following data was documented both in a canister collection logbook and in the site’s dataform:
• Sample ID Number.
• Site Address.
• Date and Time.
• Initial Vacuum (inches Hg).
Similar information was also recorded on the canister’s tag. Copies of the canister
collection logbook entries are provided in Appendix 3-C.
3.3.8 Completion of the Site Survey
Following completion of the IR camera survey, the Method 21 screening, the Hi FlowSampler testing of low level and high level emission points, and the canister sampling, the majorequipment-containing areas of the site were documented both in photographs and with a sitelayout sketch. Figures 3.3-5, 3.3-6, and 3.3-7 provide typical examples of site photographs.Figure 3.3-8 illustrates a completed site layout sketch. Copies of all field data including sitephotos and site videos are provided in Appendix 3-B.
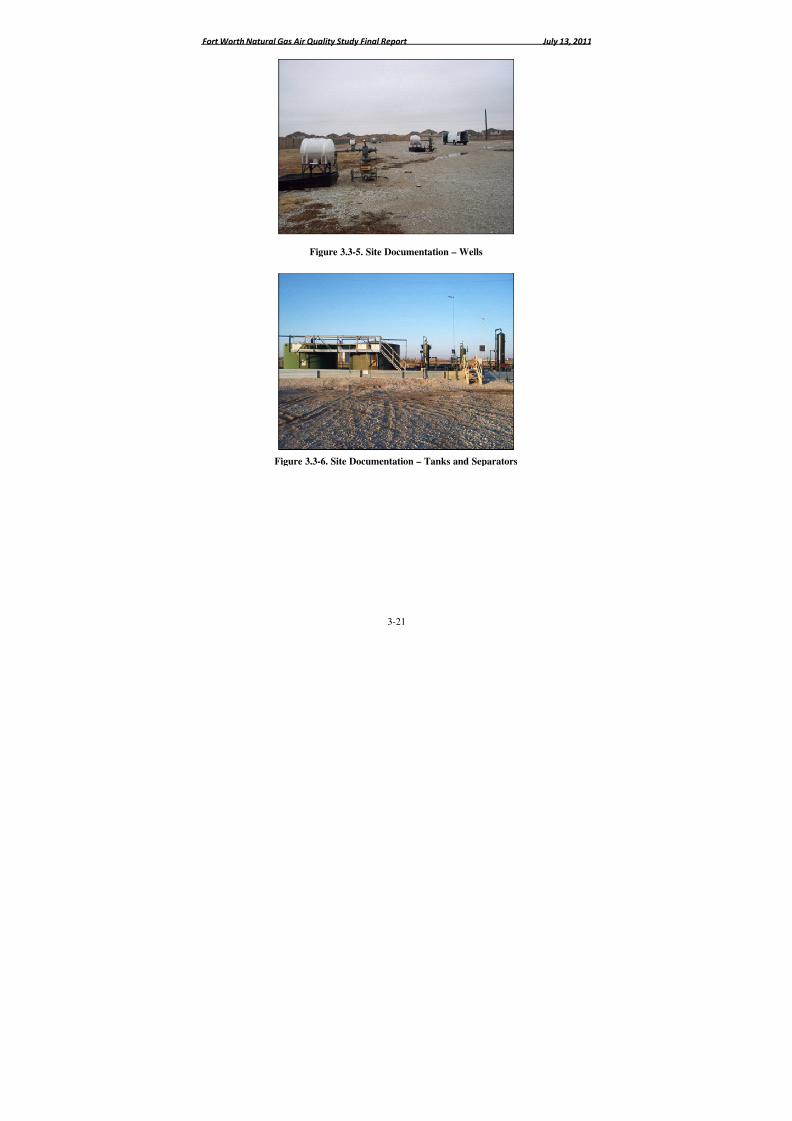
8/6/2019 Air Quality Study Final
http://slidepdf.com/reader/full/air-quality-study-final 111/320
Fort Worth Natural Gas Air Quality Study Final Report July 13, 2011
3-21
Figure 3.3-5. Site Documentation – Wells
Figure 3.3-6. Site Documentation – Tanks and Separators
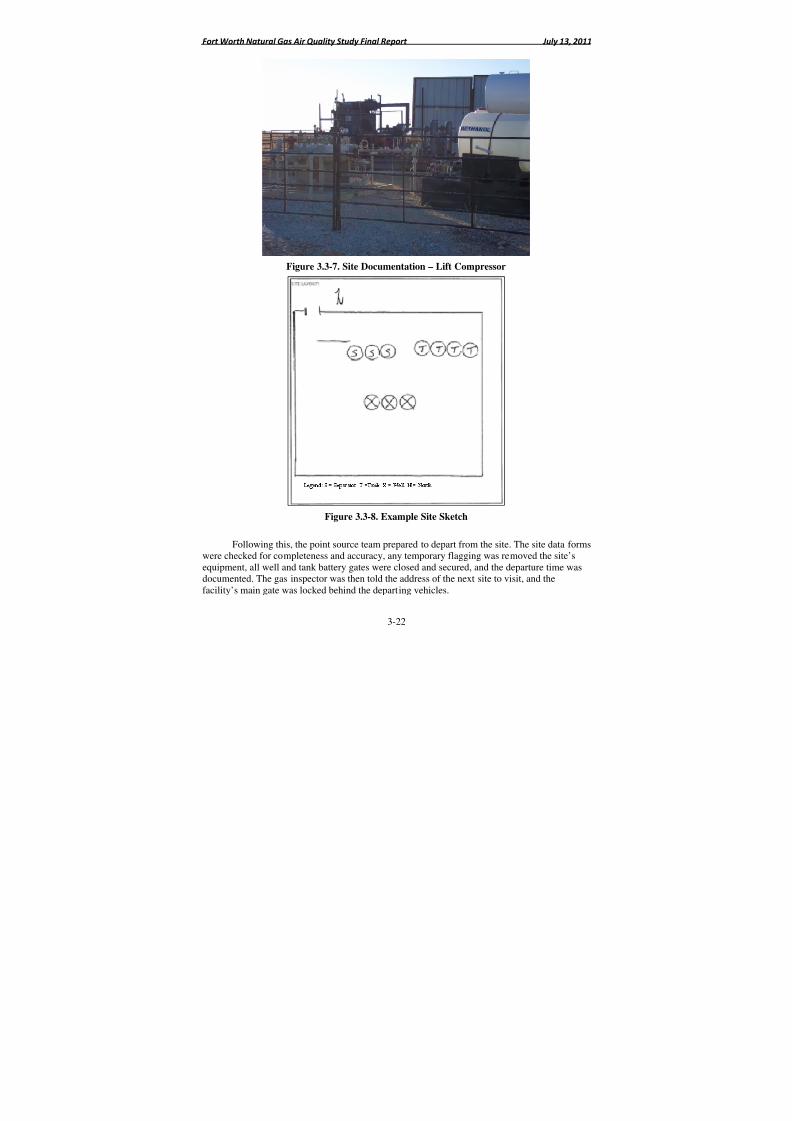
8/6/2019 Air Quality Study Final
http://slidepdf.com/reader/full/air-quality-study-final 112/320
Fort Worth Natural Gas Air Quality Study Final Report July 13, 2011
3-22
Figure 3.3-7. Site Documentation – Lift Compressor
Figure 3.3-8. Example Site Sketch
Following this, the point source team prepared to depart from the site. The site data formswere checked for completeness and accuracy, any temporary flagging was removed the site’sequipment, all well and tank battery gates were closed and secured, and the departure time wasdocumented. The gas inspector was then told the address of the next site to visit, and thefacility’s main gate was locked behind the departing vehicles.
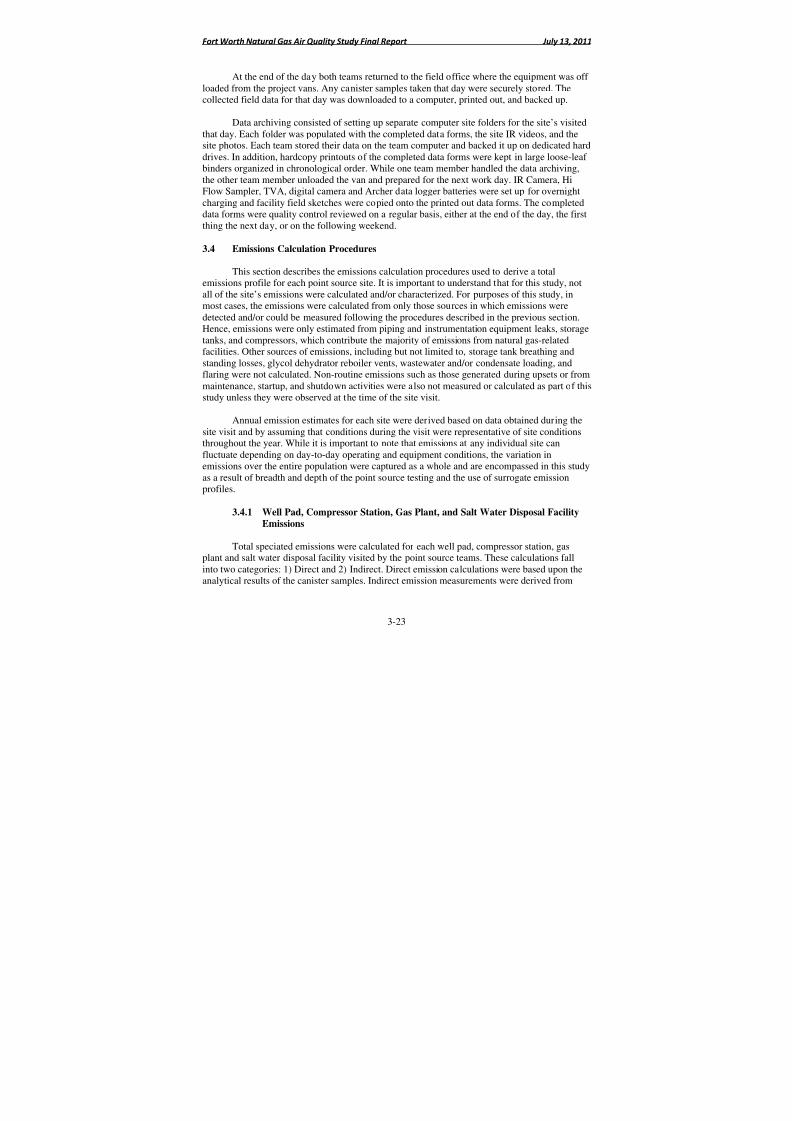
8/6/2019 Air Quality Study Final
http://slidepdf.com/reader/full/air-quality-study-final 113/320
Fort Worth Natural Gas Air Quality Study Final Report July 13, 2011
3-23
At the end of the day both teams returned to the field office where the equipment was off loaded from the project vans. Any canister samples taken that day were securely stored. Thecollected field data for that day was downloaded to a computer, printed out, and backed up.
Data archiving consisted of setting up separate computer site folders for the site’s visitedthat day. Each folder was populated with the completed data forms, the site IR videos, and thesite photos. Each team stored their data on the team computer and backed it up on dedicated harddrives. In addition, hardcopy printouts of the completed data forms were kept in large loose-leaf binders organized in chronological order. While one team member handled the data archiving,the other team member unloaded the van and prepared for the next work day. IR Camera, HiFlow Sampler, TVA, digital camera and Archer data logger batteries were set up for overnightcharging and facility field sketches were copied onto the printed out data forms. The completeddata forms were quality control reviewed on a regular basis, either at the end of the day, the firstthing the next day, or on the following weekend.
3.4 Emissions Calculation Procedures
This section describes the emissions calculation procedures used to derive a totalemissions profile for each point source site. It is important to understand that for this study, notall of the site’s emissions were calculated and/or characterized. For purposes of this study, inmost cases, the emissions were calculated from only those sources in which emissions weredetected and/or could be measured following the procedures described in the previous section.Hence, emissions were only estimated from piping and instrumentation equipment leaks, storagetanks, and compressors, which contribute the majority of emissions from natural gas-relatedfacilities. Other sources of emissions, including but not limited to, storage tank breathing andstanding losses, glycol dehydrator reboiler vents, wastewater and/or condensate loading, andflaring were not calculated. Non-routine emissions such as those generated during upsets or frommaintenance, startup, and shutdown activities were also not measured or calculated as part of thisstudy unless they were observed at the time of the site visit.
Annual emission estimates for each site were derived based on data obtained during thesite visit and by assuming that conditions during the visit were representative of site conditionsthroughout the year. While it is important to note that emissions at any individual site canfluctuate depending on day-to-day operating and equipment conditions, the variation inemissions over the entire population were captured as a whole and are encompassed in this studyas a result of breadth and depth of the point source testing and the use of surrogate emissionprofiles.
3.4.1 Well Pad, Compressor Station, Gas Plant, and Salt Water Disposal Facility
Emissions
Total speciated emissions were calculated for each well pad, compressor station, gasplant and salt water disposal facility visited by the point source teams. These calculations fallinto two categories: 1) Direct and 2) Indirect. Direct emission calculations were based upon theanalytical results of the canister samples. Indirect emission measurements were derived from
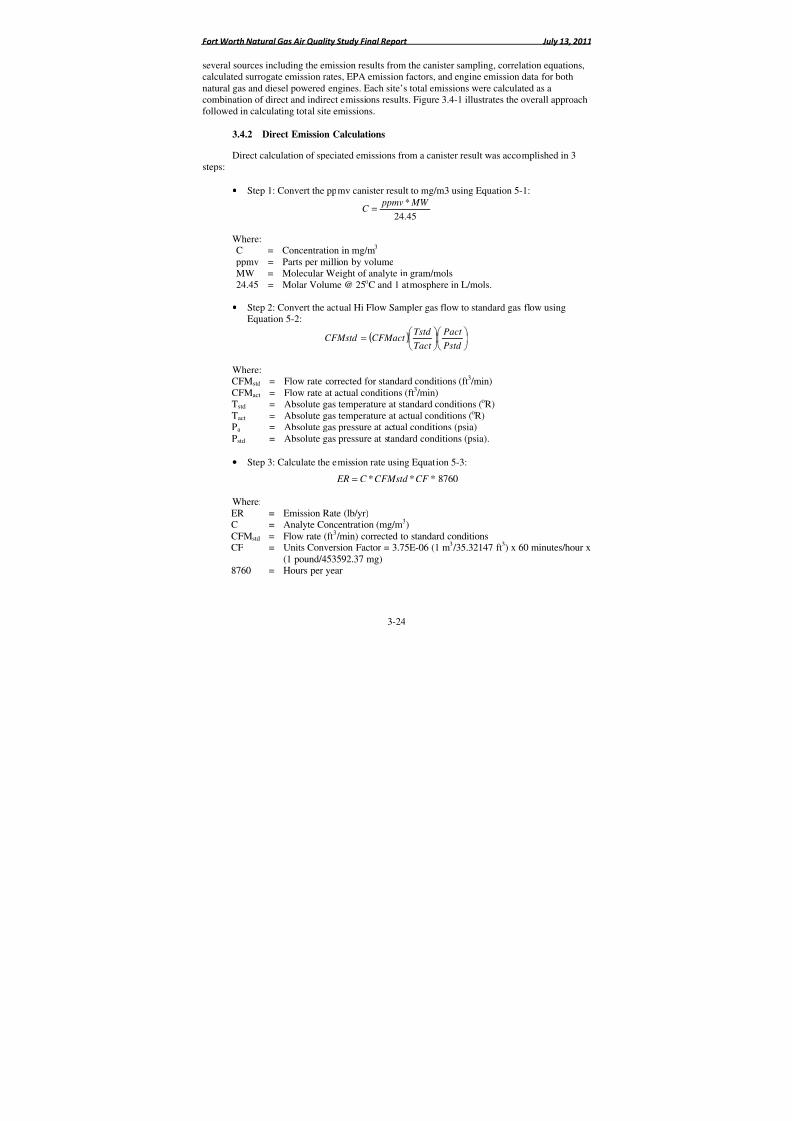
8/6/2019 Air Quality Study Final
http://slidepdf.com/reader/full/air-quality-study-final 114/320
Fort Worth Natural Gas Air Quality Study Final Report July 13, 2011
3-24
several sources including the emission results from the canister sampling, correlation equations,calculated surrogate emission rates, EPA emission factors, and engine emission data for bothnatural gas and diesel powered engines. Each site’s total emissions were calculated as acombination of direct and indirect emissions results. Figure 3.4-1 illustrates the overall approachfollowed in calculating total site emissions.
3.4.2 Direct Emission Calculations
Direct calculation of speciated emissions from a canister result was accomplished in 3steps:
• Step 1: Convert the ppmv canister result to mg/m3 using Equation 5-1:
45.24
* MW ppmvC =
Where:
C = Concentration in mg/m3
ppmv = Parts per million by volumeMW = Molecular Weight of analyte in gram/mols24.45 = Molar Volume @ 25oC and 1 atmosphere in L/mols.
• Step 2: Convert the actual Hi Flow Sampler gas flow to standard gas flow usingEquation 5-2:
( )
=
Pstd
Pact
Tact
Tstd CFMact CFMstd
Where:
CFMstd = Flow rate corrected for standard conditions (ft3 /min)CFMact = Flow rate at actual conditions (ft3 /min)Tstd = Absolute gas temperature at standard conditions (oR)Tact = Absolute gas temperature at actual conditions (oR)Pa = Absolute gas pressure at actual conditions (psia)Pstd = Absolute gas pressure at standard conditions (psia).
• Step 3: Calculate the emission rate using Equation 5-3:
CF CFMstd C ER **= * 8760
Where:ER = Emission Rate (lb/yr)C = Analyte Concentration (mg/m3)CFMstd = Flow rate (ft3 /min) corrected to standard conditionsCF = Units Conversion Factor = 3.75E-06 (1 m3 /35.32147 ft3) x 60 minutes/hour x
(1 pound/453592.37 mg)8760 = Hours per year
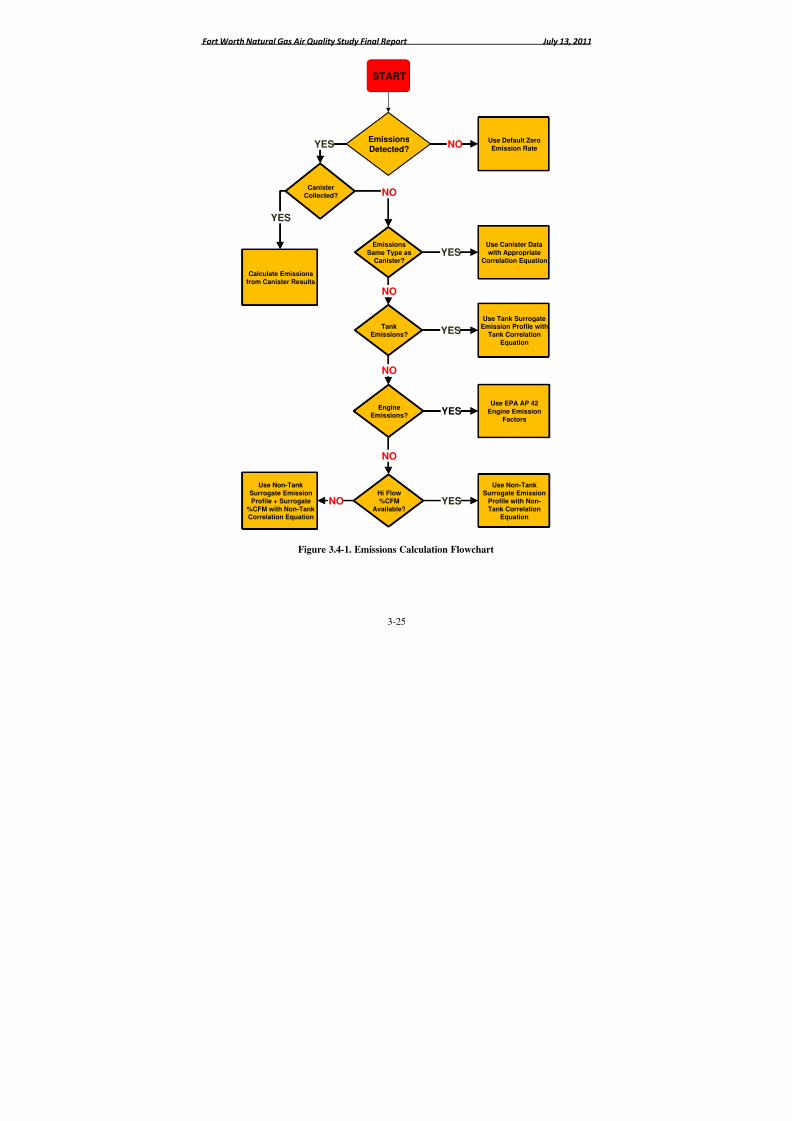
8/6/2019 Air Quality Study Final
http://slidepdf.com/reader/full/air-quality-study-final 115/320
Fort Worth Natural Gas Air Quality Study Final Report July 13, 2011
3-25
EmissionsDetected?
Use Default ZeroEmission RateNO
CanisterCollected?
YES
Calculate Emissionsfrom Canister Results
YES
Emissions
Same Type asCanister?
NO
Use Canister Data
with AppropriateCorrelation EquationYES
TankEmissions?
NO
Use Tank SurrogateEmission Profile with
Tank CorrelationEquation
YES
Use Non-TankSurrogate Emission
Profile with Non-
Tank CorrelationEquation
Hi Flow%CFM
Available?YESNO
NO
START
EngineEmissions?
Use EPA AP 42
Engine EmissionFactors
YES
NO
Use Non-TankSurrogate EmissionProfile + Surrogate
%CFM with Non-TankCorrelation Equation
Figure 3.4-1. Emissions Calculation Flowchart
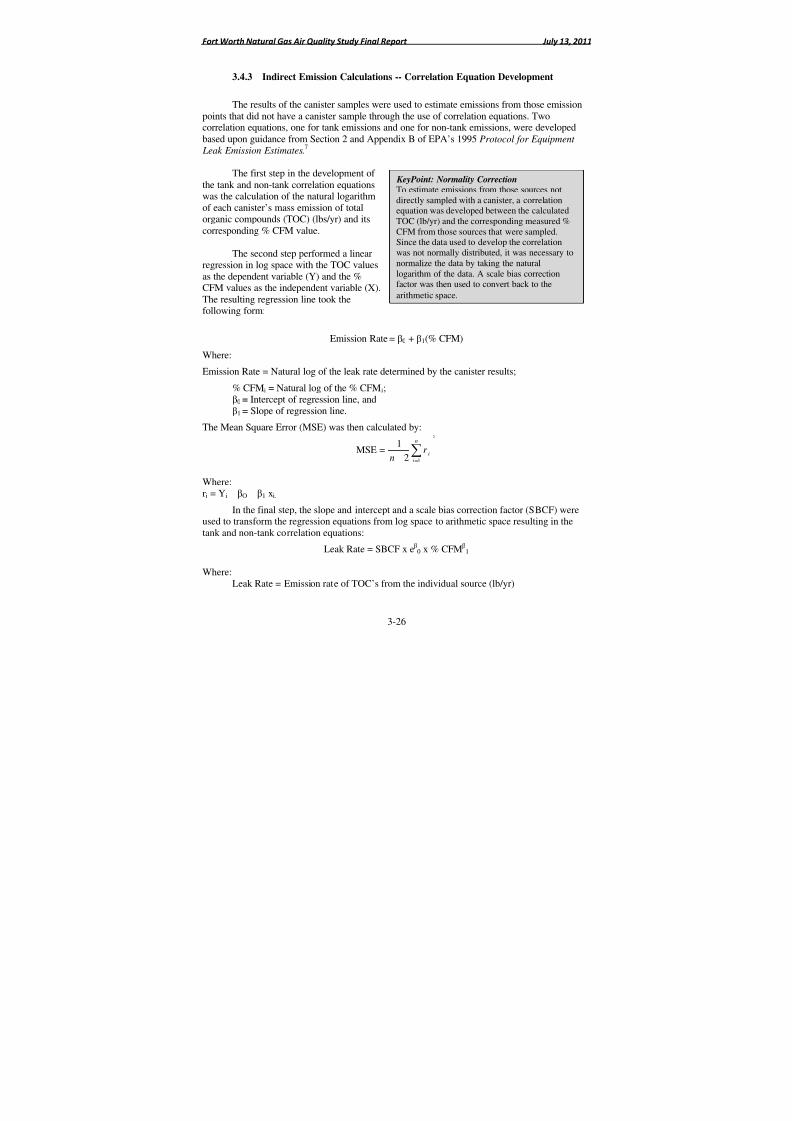
8/6/2019 Air Quality Study Final
http://slidepdf.com/reader/full/air-quality-study-final 116/320
Fort Worth Natural Gas Air Quality Study Final Report July 13, 2011
3-26
3.4.3 Indirect Emission Calculations -- Correlation Equation Development
The results of the canister samples were used to estimate emissions from those emissionpoints that did not have a canister sample through the use of correlation equations. Two
correlation equations, one for tank emissions and one for non-tank emissions, were developedbased upon guidance from Section 2 and Appendix B of EPA’s 1995 Protocol for Equipment
Leak Emission Estimates.7
The first step in the development of the tank and non-tank correlation equationswas the calculation of the natural logarithmof each canister’s mass emission of totalorganic compounds (TOC) (lbs/yr) and itscorresponding % CFM value.
The second step performed a linearregression in log space with the TOC valuesas the dependent variable (Y) and the %CFM values as the independent variable (X).The resulting regression line took thefollowing form:
Emission Rate = β0 + β1(% CFM)
Where:
Emission Rate = Natural log of the leak rate determined by the canister results;
% CFMi = Natural log of the % CFMi;β0 = Intercept of regression line, andβ1 = Slope of regression line.
The Mean Square Error (MSE) was then calculated by:
MSE =
2
12
1∑=−
n
i
ir
n
Where:ri = Yi – βO – β1 xi.
In the final step, the slope and intercept and a scale bias correction factor (SBCF) wereused to transform the regression equations from log space to arithmetic space resulting in thetank and non-tank correlation equations:
Leak Rate = SBCF x eβ0 x % CFMβ1
Where:Leak Rate = Emission rate of TOC’s from the individual source (lb/yr)
KeyPoint: Normality CorrectionTo estimate emissions from those sources notdirectly sampled with a canister, a correlationequation was developed between the calculatedTOC (lb/yr) and the corresponding measured %CFM from those sources that were sampled.Since the data used to develop the correlation
was not normally distributed, it was necessary tonormalize the data by taking the naturallogarithm of the data. A scale bias correctionfactor was then used to convert back to the
arithmetic space.

8/6/2019 Air Quality Study Final
http://slidepdf.com/reader/full/air-quality-study-final 117/320
Fort Worth Natural Gas Air Quality Study Final Report July 13, 2011
3-27
SBCF = Scale Bias Correction Factorβ0, β1 = Regression constants, and% CFM = Cubic feet per minute measured by the Hi Flow Sampler.
The SBCF corrects for the variability of the log space data. It was calculated by summing 15significant numbers of the terms from the infinite series:
.....)3(*)1!*(3*
*)1(
)1!*(2*
*)1(*)1(1
3
35
2
23
+
++
−+
+
−+
−+=
mmm
T m
mm
T m
m
T mSBCF
Where:T = MSE/2.MSE = mean square error from the regression.m = number of data pairs.
3.4.4 Applying Canister Results to Non-Canister Emission Points
Canister-derived emission profiles were used to characterize non-canister emission pointsif 1) the non canister emission point was from the same site as the canister sample and 2) if theemission source types were the same (i.e. tank or non-tank).
For instance, if non-canister emissions were detected from a tank source, and if a canisterhad been collected at that site from another tank source, then that canister’s data would be usedto characterize the non-canister emission point. If the reverse was true, if the emissions werefrom a non-tank component, then a surrogate non-tank canister profile was used.
The distinction between tank and non-tank emission sources was made due to thedifferences in emissions characteristics observed between these two emission types. Tank
emissions develop from the volatilization of heavier hydrocarbons entrained in the liquidsproduced by the facility separators, whereas non-tank emissions (i.e., particularly fugitiveequipment leaks) are generally lighter gas emissions. Consequently, the chemical profile of eachis somewhat different. For example, Table 3.4-1 provides a comparison of the average TOC,VOC, and HAP emissions resulting from a tank and non-tank canister sample collected duringthe study.
Table 3.4-1. Comparison of Emissions Between
Tank and Non-Tank Emission Sources
Source Type
(Canister Site ID)
TOC
(tons/yr)
VOC
(tons/yr)
HAP
(tons/yr)
Non-Tank (PS-126) 6.65 0.01 0.00
Tank (295) 18.18 0.21 0.19
As indicated by the above comparison, tank emissions commonly exceed fugitive gasemissions.
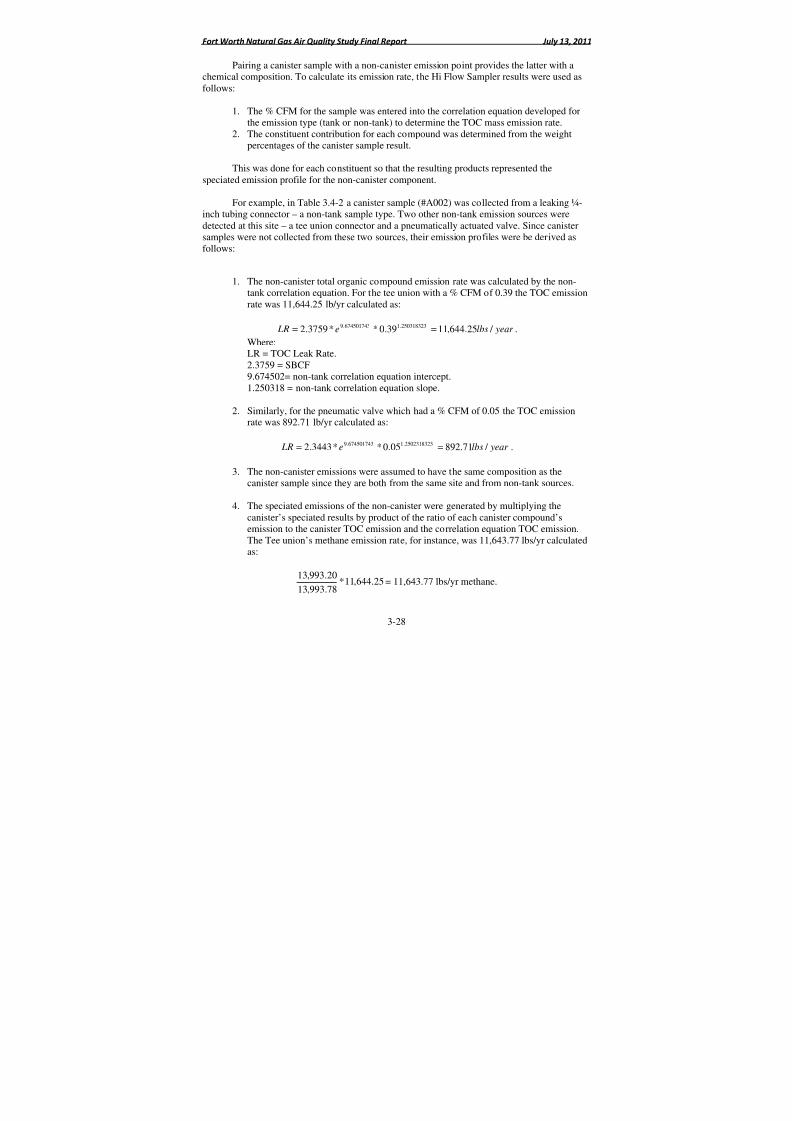
8/6/2019 Air Quality Study Final
http://slidepdf.com/reader/full/air-quality-study-final 118/320
Fort Worth Natural Gas Air Quality Study Final Report July 13, 2011
3-28
Pairing a canister sample with a non-canister emission point provides the latter with achemical composition. To calculate its emission rate, the Hi Flow Sampler results were used asfollows:
1. The % CFM for the sample was entered into the correlation equation developed for
the emission type (tank or non-tank) to determine the TOC mass emission rate.2. The constituent contribution for each compound was determined from the weightpercentages of the canister sample result.
This was done for each constituent so that the resulting products represented thespeciated emission profile for the non-canister component.
For example, in Table 3.4-2 a canister sample (#A002) was collected from a leaking ¼-inch tubing connector – a non-tank sample type. Two other non-tank emission sources weredetected at this site – a tee union connector and a pneumatically actuated valve. Since canistersamples were not collected from these two sources, their emission profiles were be derived as
follows:
1. The non-canister total organic compound emission rate was calculated by the non-tank correlation equation. For the tee union with a % CFM of 0.39 the TOC emissionrate was 11,644.25 lb/yr calculated as:
year lbse LR / 25.644,1139.0**3759.2 250318323.1674501743.9== .
Where:LR = TOC Leak Rate.2.3759 = SBCF
9.674502= non-tank correlation equation intercept.1.250318 = non-tank correlation equation slope.
2. Similarly, for the pneumatic valve which had a % CFM of 0.05 the TOC emissionrate was 892.71 lb/yr calculated as:
year lbse LR / 71.89205.0**3443.2 2502318323.1674501743.9== .
3. The non-canister emissions were assumed to have the same composition as thecanister sample since they are both from the same site and from non-tank sources.
4. The speciated emissions of the non-canister were generated by multiplying thecanister’s speciated results by product of the ratio of each canister compound’semission to the canister TOC emission and the correlation equation TOC emission.The Tee union’s methane emission rate, for instance, was 11,643.77 lbs/yr calculatedas:
25.644,11*78.993,13
20.993,13= 11,643.77 lbs/yr methane.
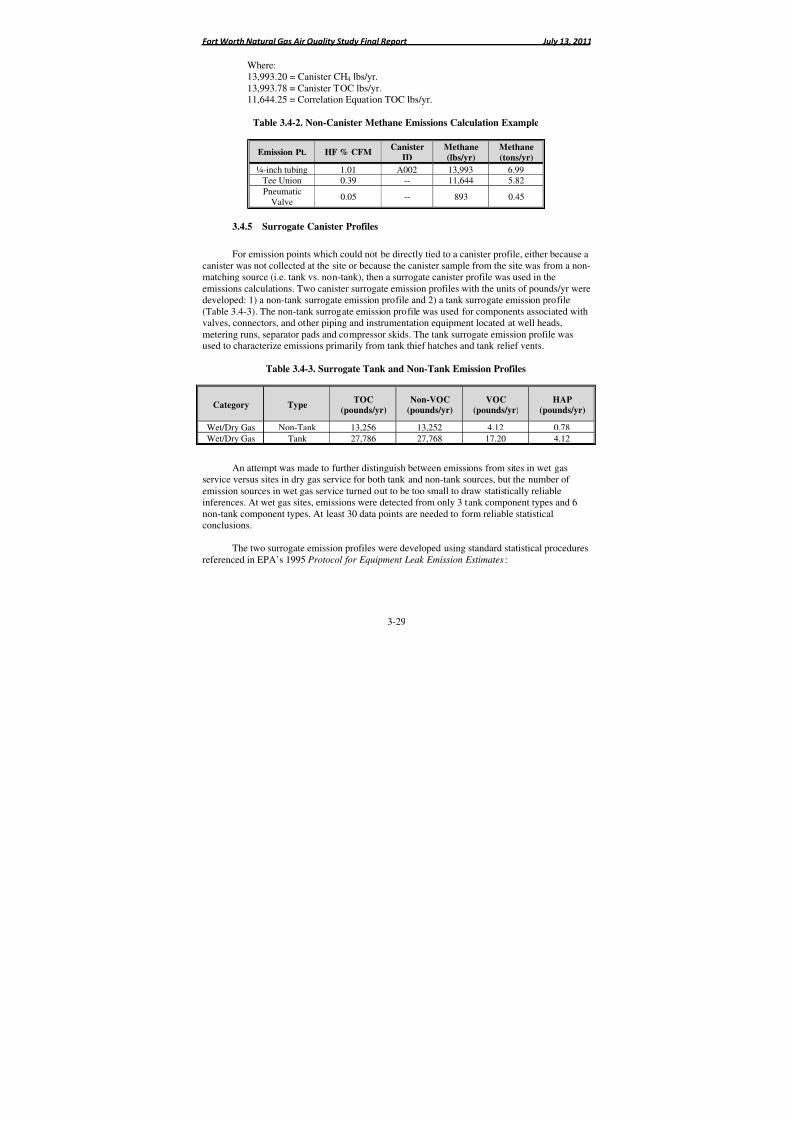
8/6/2019 Air Quality Study Final
http://slidepdf.com/reader/full/air-quality-study-final 119/320
Fort Worth Natural Gas Air Quality Study Final Report July 13, 2011
3-29
Where:13,993.20 = Canister CH4 lbs/yr.13,993.78 = Canister TOC lbs/yr.11,644.25 = Correlation Equation TOC lbs/yr.
Table 3.4-2. Non-Canister Methane Emissions Calculation Example
Emission Pt. HF % CFMCanister
ID
Methane
(lbs/yr)
Methane
(tons/yr)
¼-inch tubing 1.01 A002 13,993 6.99Tee Union 0.39 -- 11,644 5.82
PneumaticValve
0.05 -- 893 0.45
3.4.5 Surrogate Canister Profiles
For emission points which could not be directly tied to a canister profile, either because acanister was not collected at the site or because the canister sample from the site was from a non-matching source (i.e. tank vs. non-tank), then a surrogate canister profile was used in theemissions calculations. Two canister surrogate emission profiles with the units of pounds/yr weredeveloped: 1) a non-tank surrogate emission profile and 2) a tank surrogate emission profile(Table 3.4-3). The non-tank surrogate emission profile was used for components associated withvalves, connectors, and other piping and instrumentation equipment located at well heads,metering runs, separator pads and compressor skids. The tank surrogate emission profile wasused to characterize emissions primarily from tank thief hatches and tank relief vents.
Table 3.4-3. Surrogate Tank and Non-Tank Emission Profiles
Category TypeTOC
(pounds/yr)
Non-VOC
(pounds/yr)
VOC
(pounds/yr)
HAP
(pounds/yr)
Wet/Dry Gas Non-Tank 13,256 13,252 4.12 0.78
Wet/Dry Gas Tank 27,786 27,768 17.20 4.12
An attempt was made to further distinguish between emissions from sites in wet gasservice versus sites in dry gas service for both tank and non-tank sources, but the number of emission sources in wet gas service turned out to be too small to draw statistically reliable
inferences. At wet gas sites, emissions were detected from only 3 tank component types and 6non-tank component types. At least 30 data points are needed to form reliable statisticalconclusions.
The two surrogate emission profiles were developed using standard statistical proceduresreferenced in EPA’s 1995 Protocol for Equipment Leak Emission Estimates:
8/6/2019 Air Quality Study Final
http://slidepdf.com/reader/full/air-quality-study-final 120/320
Fort Worth Natural Gas Air Quality Study Final Report July 13, 2011
3-30
1. The canister data for each emission type was checked for normality using probabilityplots to evaluate the correlation between the data and a normal distribution.
2. Since, in both cases, the data turned out to be non-normal, a natural logarithmictransformation of both sets of canister data was performed.
3. The normality of the transformed data was again checked using probability plots and
found to be sufficiently linear.4. The surrogate compositions were determined as the anti-logarithmic mean of thetransformed data.
For summary purposes, Table 3.4-2 indicates the surrogate emission profiles only forcategories of compounds (i.e. TOC, VOC, etc.). It is important to note that each surrogate profilealso contains the emission rates for all of the individual compounds found in the aggregatecanister samples used to generate the surrogate emission profiles.
Once the use of a surrogate canister profile was applied to an emission point, theemission calculation was performed according to the procedures described above in
Section 3.4.3.
In Phase I there were several instances in which a low level emission fell below thedetection limit of the Hi Flow Sampler (this limitation was overcome in Phase II by measuringthe hydrocarbon concentration of the Hi Flow Sampler’s exhaust stream with the TVA). Forthese occasions a surrogate % CFM was derived as the anti-log mean value of the normalized %CFM readings recorded in Phase II with the TVA.
3.4.6 Calculation of Non-Sampled Low Level Emission Points
While all site piping and instrumentation equipment was surveyed with the IR camera for
high level emissions, only ten percent of the components at a site were sampled for low levelemissions using a TVA following Method 21 screening procedures. Two separate emissioncalculations were used to arrive at emission rate estimates for the ninety percent not screenedwith the TVA:
1. The percent of components found leaking in the Method 21 screening was applied tothe total non-sampled population of valves and connectors at the site and the non-tank correlation equation was used to estimate their emissions.
2. The remaining components were assumed to be non-leaking and their emissions werecalculated using the Synthetic Organic Chemical Manufacturing Industry (SOCMI)
default zero values listed in EPA's 1995 Protocol for Equipment Leak Emission Estimates (Figure 3.4-2). Studies by EPA have demonstrated that non-leakingequipment actually have low level emissions. These emission values are termed“default zeros” and are routinely used across the petroleum industry in the calculationof emission inventories.
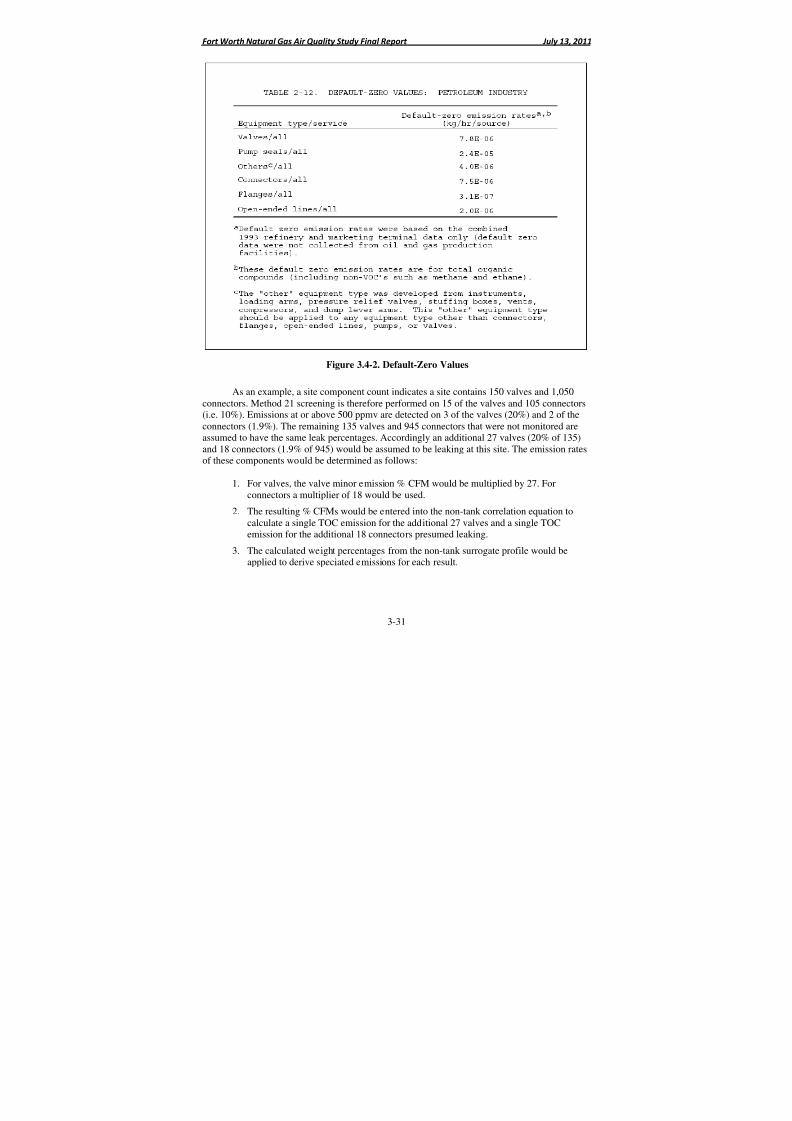
8/6/2019 Air Quality Study Final
http://slidepdf.com/reader/full/air-quality-study-final 121/320
Fort Worth Natural Gas Air Quality Study Final Report July 13, 2011
3-31
As an example, a site component count indicates a site contains 150 valves and 1,050connectors. Method 21 screening is therefore performed on 15 of the valves and 105 connectors(i.e. 10%). Emissions at or above 500 ppmv are detected on 3 of the valves (20%) and 2 of theconnectors (1.9%). The remaining 135 valves and 945 connectors that were not monitored areassumed to have the same leak percentages. Accordingly an additional 27 valves (20% of 135)and 18 connectors (1.9% of 945) would be assumed to be leaking at this site. The emission ratesof these components would be determined as follows:
1. For valves, the valve minor emission % CFM would be multiplied by 27. Forconnectors a multiplier of 18 would be used.
2. The resulting % CFMs would be entered into the non-tank correlation equation tocalculate a single TOC emission for the additional 27 valves and a single TOCemission for the additional 18 connectors presumed leaking.
3. The calculated weight percentages from the non-tank surrogate profile would beapplied to derive speciated emissions for each result.
Figure 3.4-2. Default-Zero Values
8/6/2019 Air Quality Study Final
http://slidepdf.com/reader/full/air-quality-study-final 122/320
Fort Worth Natural Gas Air Quality Study Final Report July 13, 2011
3-32
The remaining 108 valves (135-27) and 927 connectors (945-18) would have the valveand connector default zero emission rates applied to them. This would be done by converting thedefault zero kg/hr emission rates to % CFM as methane. The resulting value would be thenentered into the non-tank correlation equation to calculate TOC emissions. Speciated resultswould be obtained using the calculated weight percentages from the non-tank surrogate profile.
3.4.7 Compressor Engine Emissions
A total of 186 natural gas compressor engines were encountered during the site surveys.Of these, 150 were located at 123 well pad sites, 12 were located at the gas processing facility, 1was located at the salt water treatment facility, and 23 were located at the eight line compressorstations. The majority of the compressor engines located on well pads functioned as liftcompressors.
Emissions from compressor engines werederived from field data collected during the site
surveys, vendor specification sheets and publishedemission factors. In calculating emissions forcompressor engines, a 100% compressor duty cyclewas conservatively assumed (i.e. 24 hours/day/ for365 days/year). In addition, it was conservativelyassumed that these engines were uncontrolled.Multiple XTO facilities were noted as havingcatalyst controls on their engines, but as stack testingof the exhaust from compressor engines was not included in the scope of this study, the controlefficiency of these engines is unknown.
3.4.8 Well Drilling and Fracking Engine Emissions
Criteria pollutant, VOC and HAP emissions from natural gas and diesel engines used inwell drilling and fracking operations were conservatively estimated based upon vendorspecifications and published emission factors. Engine emissions from well drilling assume504 hours of continuous operation (3 weeks, 7 days/week, 24 hours/day). Engine emissionsassociated with a fracking operation are based upon 120 hours of non-continuous operation(3 weeks, 5 days/week, 8 hours/day).
3.4.9 Calculation of Method 21 TOC Screening Emission Factors
Method 21 screening results were used to calculate VOC emission factors for non-tank equipment in natural gas service so that emissions due to future build out can be predicted basedupon Method 21 monitoring results. Emission factors were calculated for the followingequipment /screening categories:
• Valves: 500 ppmv to 999 ppmv and 1,000 ppmv to 10,000 ppmv.
• Connectors: 500 ppmv to 999 ppmv and 1,000 ppmv to 10,000 ppmv
Key Point: Compressor Engine ControlsEmissions from compressor engines were
estimated using the best available datacollected during the point source testing.Where data was limited, conservativeassumptions were used including but notlimited to, the use of uncontrolledemission factors where controls whereknown to be present but no controlefficiency data was readily available.
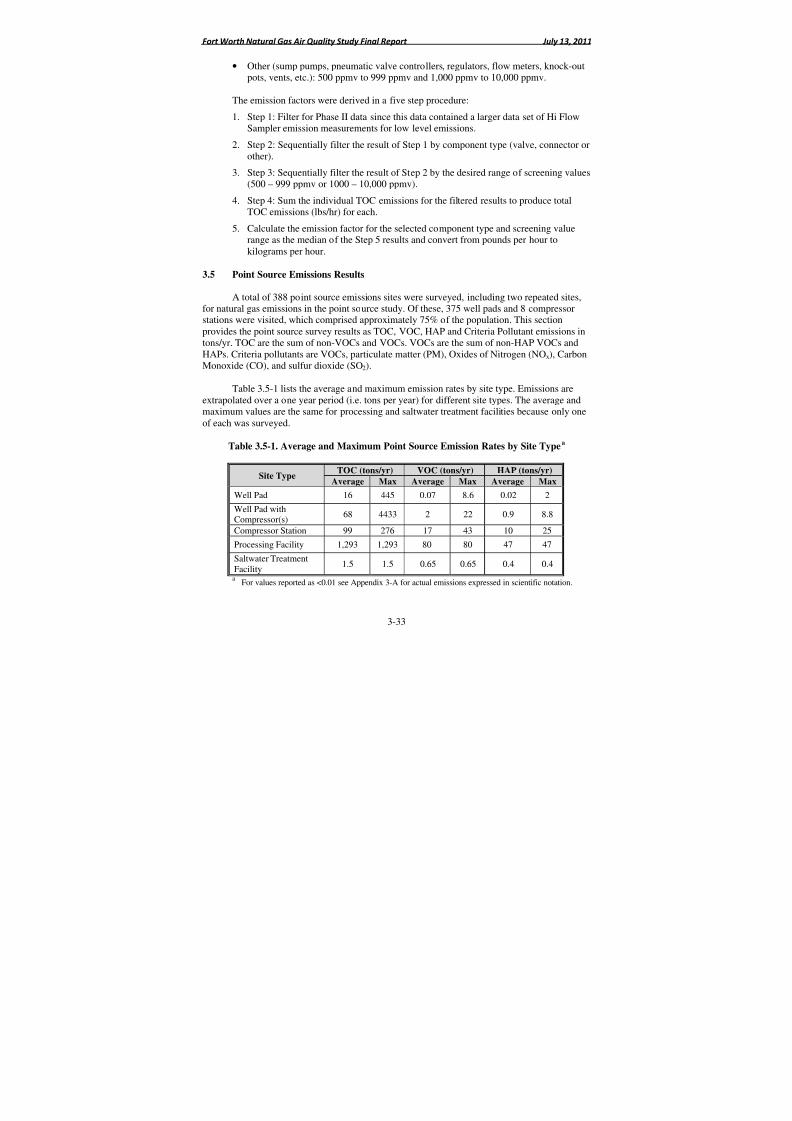
8/6/2019 Air Quality Study Final
http://slidepdf.com/reader/full/air-quality-study-final 123/320
Fort Worth Natural Gas Air Quality Study Final Report July 13, 2011
3-33
• Other (sump pumps, pneumatic valve controllers, regulators, flow meters, knock-outpots, vents, etc.): 500 ppmv to 999 ppmv and 1,000 ppmv to 10,000 ppmv.
The emission factors were derived in a five step procedure:
1. Step 1: Filter for Phase II data since this data contained a larger data set of Hi Flow
Sampler emission measurements for low level emissions.
2. Step 2: Sequentially filter the result of Step 1 by component type (valve, connector orother).
3. Step 3: Sequentially filter the result of Step 2 by the desired range of screening values(500 – 999 ppmv or 1000 – 10,000 ppmv).
4. Step 4: Sum the individual TOC emissions for the filtered results to produce totalTOC emissions (lbs/hr) for each.
5. Calculate the emission factor for the selected component type and screening valuerange as the median of the Step 5 results and convert from pounds per hour to
kilograms per hour.
3.5 Point Source Emissions Results
A total of 388 point source emissions sites were surveyed, including two repeated sites,for natural gas emissions in the point source study. Of these, 375 well pads and 8 compressorstations were visited, which comprised approximately 75% of the population. This sectionprovides the point source survey results as TOC, VOC, HAP and Criteria Pollutant emissions intons/yr. TOC are the sum of non-VOCs and VOCs. VOCs are the sum of non-HAP VOCs andHAPs. Criteria pollutants are VOCs, particulate matter (PM), Oxides of Nitrogen (NOx), CarbonMonoxide (CO), and sulfur dioxide (SO2).
Table 3.5-1 lists the average and maximum emission rates by site type. Emissions areextrapolated over a one year period (i.e. tons per year) for different site types. The average andmaximum values are the same for processing and saltwater treatment facilities because only oneof each was surveyed.
Table 3.5-1. Average and Maximum Point Source Emission Rates by Site Typea
Site TypeTOC (tons/yr) VOC (tons/yr) HAP (tons/yr)
Average Max Average Max Average Max
Well Pad 16 445 0.07 8.6 0.02 2
Well Pad withCompressor(s)
68 4433 2 22 0.9 8.8
Compressor Station 99 276 17 43 10 25
Processing Facility 1,293 1,293 80 80 47 47
Saltwater TreatmentFacility
1.5 1.5 0.65 0.65 0.4 0.4
aFor values reported as <0.01 see Appendix 3-A for actual emissions expressed in scientific notation.
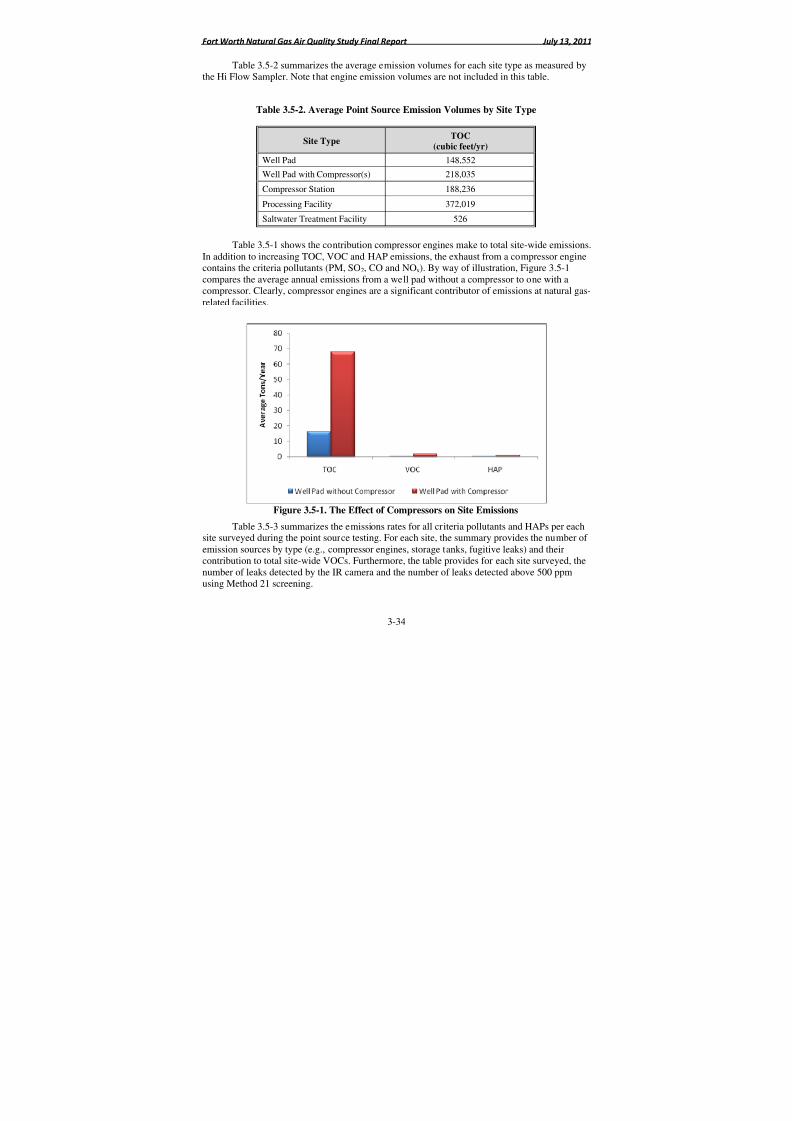
8/6/2019 Air Quality Study Final
http://slidepdf.com/reader/full/air-quality-study-final 124/320
Fort Worth Natural Gas Air Quality Study Final Report July 13, 2011
3-34
Table 3.5-2 summarizes the average emission volumes for each site type as measured bythe Hi Flow Sampler. Note that engine emission volumes are not included in this table.
Table 3.5-2. Average Point Source Emission Volumes by Site Type
Site TypeTOC
(cubic feet/yr)
Well Pad 148,552
Well Pad with Compressor(s) 218,035
Compressor Station 188,236
Processing Facility 372,019
Saltwater Treatment Facility 526
Table 3.5-1 shows the contribution compressor engines make to total site-wide emissions.
In addition to increasing TOC, VOC and HAP emissions, the exhaust from a compressor enginecontains the criteria pollutants (PM, SO2, CO and NOx). By way of illustration, Figure 3.5-1compares the average annual emissions from a well pad without a compressor to one with acompressor. Clearly, compressor engines are a significant contributor of emissions at natural gas-related facilities.
Figure 3.5-1. The Effect of Compressors on Site Emissions
Table 3.5-3 summarizes the emissions rates for all criteria pollutants and HAPs per eachsite surveyed during the point source testing. For each site, the summary provides the number of emission sources by type (e.g., compressor engines, storage tanks, fugitive leaks) and theircontribution to total site-wide VOCs. Furthermore, the table provides for each site surveyed, thenumber of leaks detected by the IR camera and the number of leaks detected above 500 ppmusing Method 21 screening.
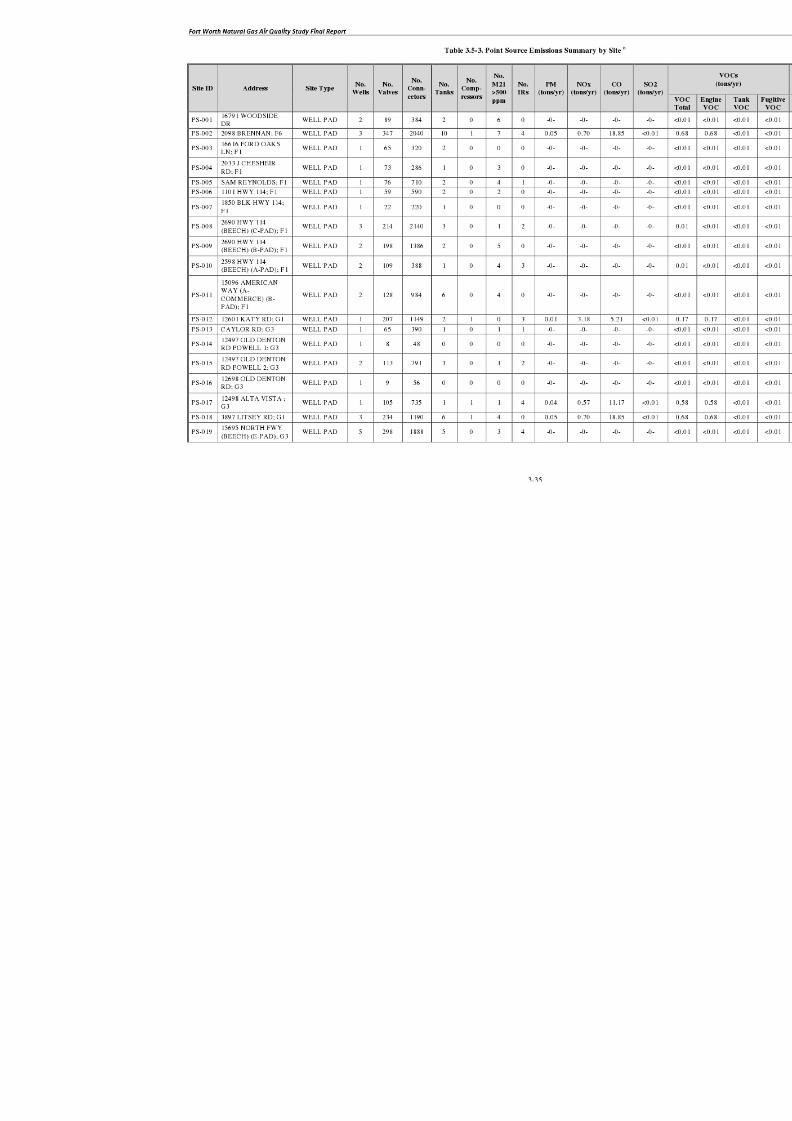
8/6/2019 Air Quality Study Final
http://slidepdf.com/reader/full/air-quality-study-final 125/320
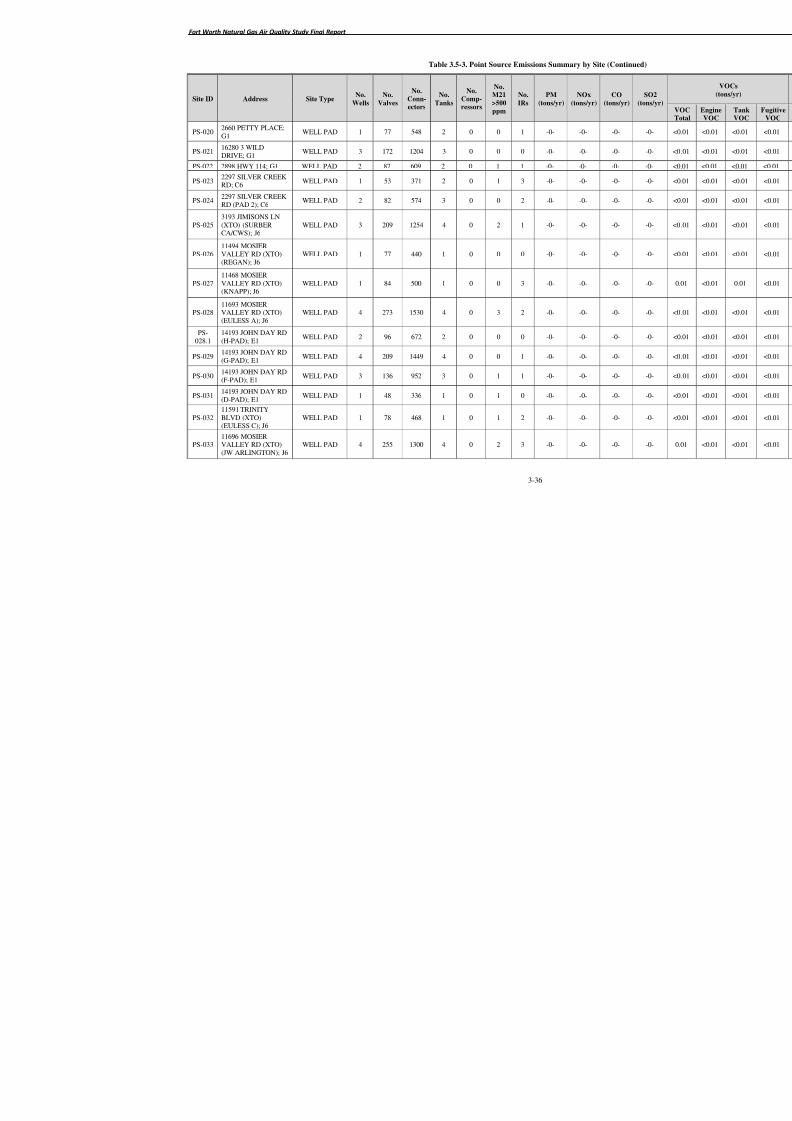
8/6/2019 Air Quality Study Final
http://slidepdf.com/reader/full/air-quality-study-final 126/320
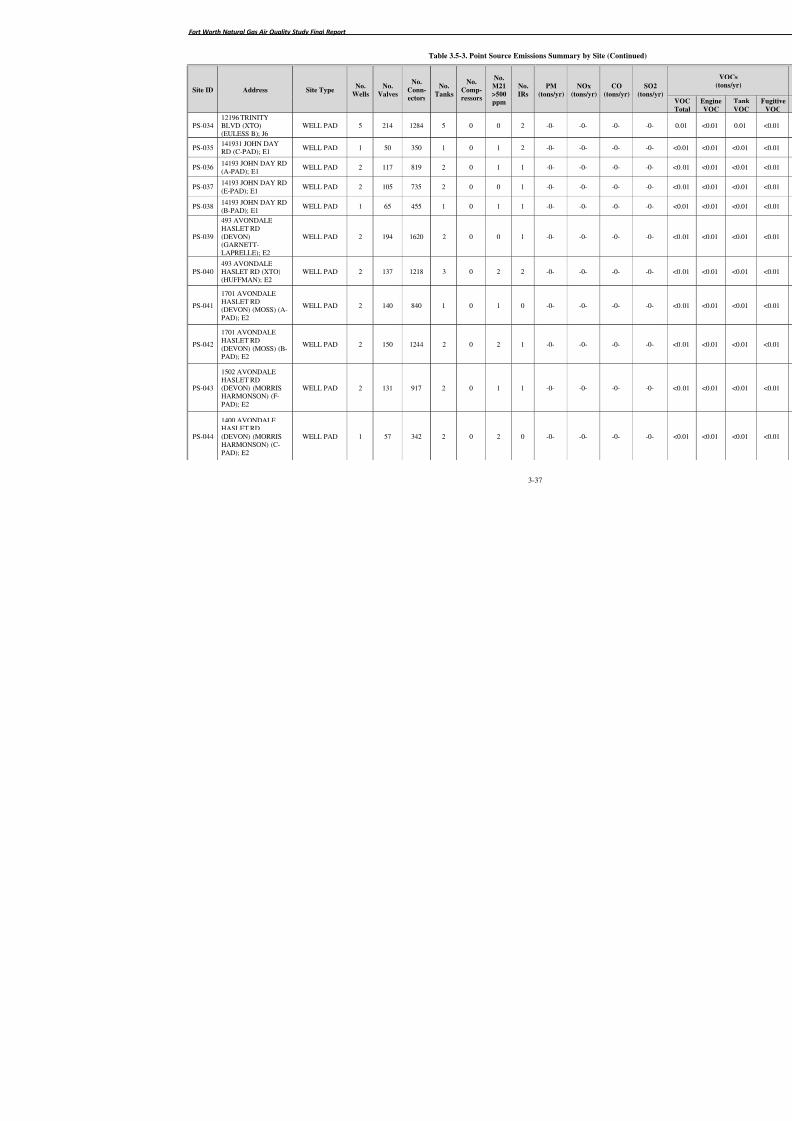
8/6/2019 Air Quality Study Final
http://slidepdf.com/reader/full/air-quality-study-final 127/320
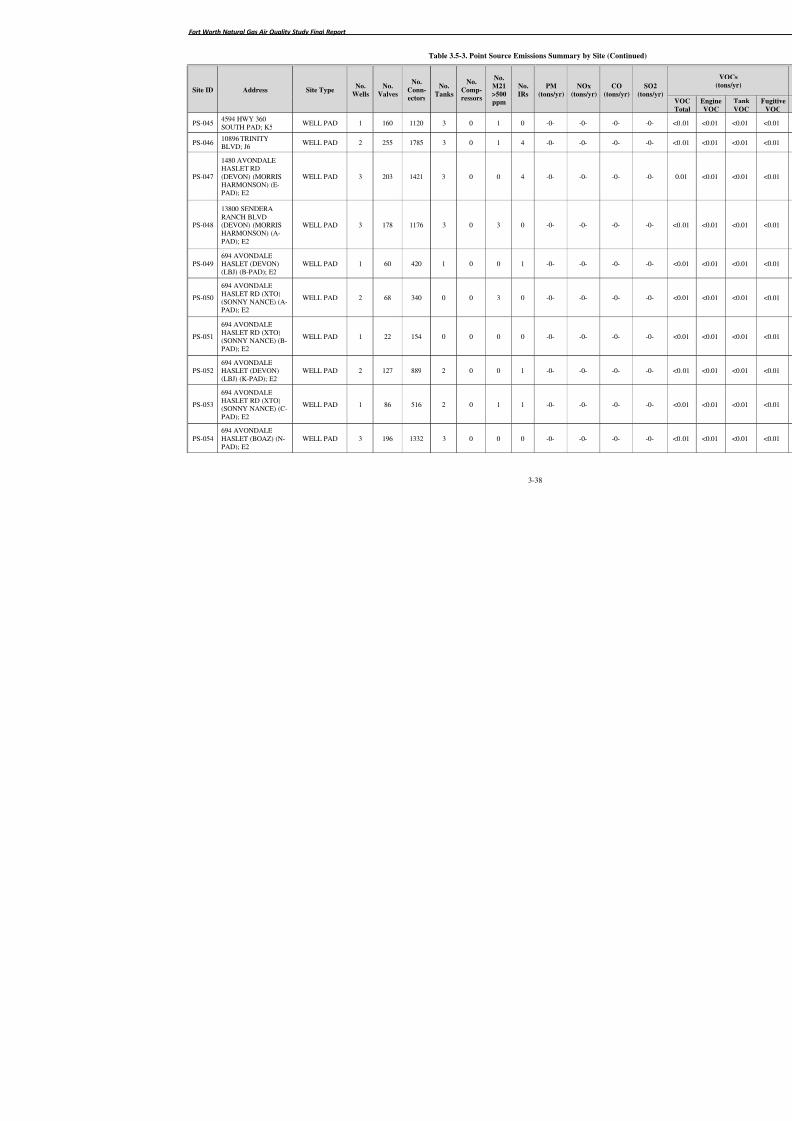
8/6/2019 Air Quality Study Final
http://slidepdf.com/reader/full/air-quality-study-final 128/320
Fort Worth Natural Gas Air Quality Study Final Report
3-38
Table 3.5-3. Point Source Emissions Summary by Site (Co
Site ID Address Site TypeNo.
Wells
No.
Valves
No.
Conn-
ectors
No.
Tanks
No.
Comp-
ressors
No.
M21
>500ppm
No.
IRs
PM
(tons/yr)
NOx
(tons/yr)
CO
(tons
PS-045
4594 HWY 360
SOUTH PAD; K5 WELL PAD 1 160 1120 3 0 1 0 -0- -0- -0
PS-04610896 TRINITYBLVD; J6
WELL PAD 2 255 1785 3 0 1 4 -0- -0- -0
PS-047
1480 AVONDALEHASLET RD(DEVON) (MORRISHARMONSON) (E-PAD); E2
WELL PAD 3 203 1421 3 0 0 4 -0- -0- -0
PS-048
13800 SENDERARANCH BLVD(DEVON) (MORRISHARMONSON) (A-PAD); E2
WELL PAD 3 178 1176 3 0 3 0 -0- -0- -0
PS-049694 AVONDALEHASLET (DEVON)(LBJ) (B-PAD); E2
WELL PAD 1 60 420 1 0 0 1 -0- -0- -0
PS-050
694 AVONDALEHASLET RD (XTO)(SONNY NANCE) (A-PAD); E2
WELL PAD 2 68 340 0 0 3 0 -0- -0- -0
PS-051
694 AVONDALEHASLET RD (XTO)(SONNY NANCE) (B-PAD); E2
WELL PAD 1 22 154 0 0 0 0 -0- -0- -0
PS-052694 AVONDALEHASLET (DEVON)
(LBJ) (K-PAD); E2
WELL PAD 2 127 889 2 0 0 1 -0- -0- -0
PS-053
694 AVONDALEHASLET RD (XTO)(SONNY NANCE) (C-PAD); E2
WELL PAD 1 86 516 2 0 1 1 -0- -0- -0
PS-054694 AVONDALEHASLET (BOAZ) (N-PAD); E2
WELL PAD 3 196 1332 3 0 0 0 -0- -0- -0
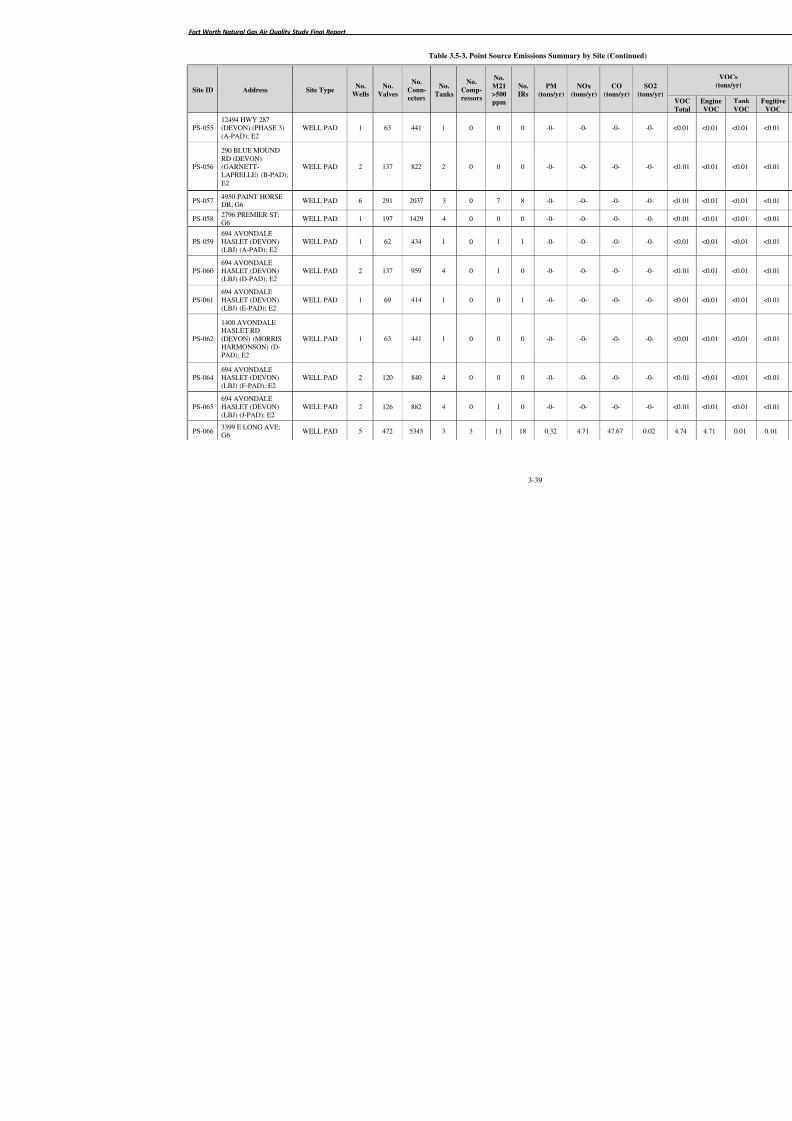
8/6/2019 Air Quality Study Final
http://slidepdf.com/reader/full/air-quality-study-final 129/320
Fort Worth Natural Gas Air Quality Study Final Report
3-39
Table 3.5-3. Point Source Emissions Summary by Site (Co
Site ID Address Site TypeNo.
Wells
No.
Valves
No.
Conn-
ectors
No.
Tanks
No.
Comp-
ressors
No.
M21
>500ppm
No.
IRs
PM
(tons/yr)
NOx
(tons/yr)
CO
(tons
PS-055
12494 HWY 287
(DEVON) (PHASE 3)(A-PAD); E2
WELL PAD 1 63 441 1 0 0 0 -0- -0- -0
PS-056
290 BLUE MOUNDRD (DEVON)(GARNETT-LAPRELLE) (B-PAD);E2
WELL PAD 2 137 822 2 0 0 0 -0- -0- -0
PS-0574950 PAINT HORSEDR; G6
WELL PAD 6 291 2037 3 0 7 8 -0- -0- -0
PS-0582796 PREMIER ST;G6
WELL PAD 1 197 1429 4 0 0 0 -0- -0- -0
PS-059694 AVONDALEHASLET (DEVON)
(LBJ) (A-PAD); E2
WELL PAD 1 62 434 1 0 1 1 -0- -0- -0
PS-060694 AVONDALEHASLET (DEVON)(LBJ) (D-PAD); E2
WELL PAD 2 137 959 4 0 1 0 -0- -0- -0
PS-061694 AVONDALEHASLET (DEVON)(LBJ) (E-PAD); E2
WELL PAD 1 69 414 1 0 0 1 -0- -0- -0
PS-062
1400 AVONDALEHASLET RD(DEVON) (MORRISHARMONSON) (D-PAD); E2
WELL PAD 1 63 441 1 0 0 0 -0- -0- -0
PS-064
694 AVONDALE
HASLET (DEVON)(LBJ) (F-PAD); E2
WELL PAD 2 120 840 4 0 0 0 -0- -0- -0
PS-065694 AVONDALEHASLET (DEVON)(LBJ) (J-PAD); E2
WELL PAD 2 126 882 4 0 1 0 -0- -0- -0
PS-0663399 E LONG AVE;G6
WELL PAD 5 472 5345 3 3 11 18 0.32 4.71 47.6
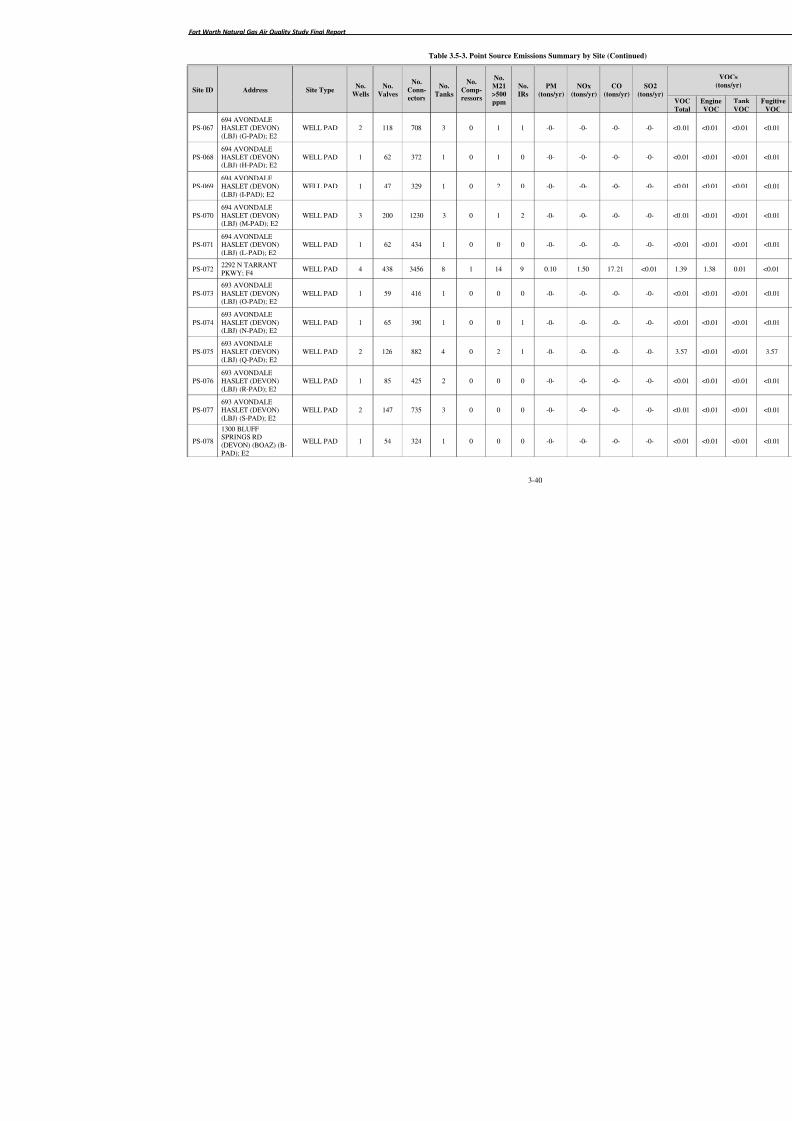
8/6/2019 Air Quality Study Final
http://slidepdf.com/reader/full/air-quality-study-final 130/320
Fort Worth Natural Gas Air Quality Study Final Report
3-40
Table 3.5-3. Point Source Emissions Summary by Site (Co
Site ID Address Site TypeNo.
Wells
No.
Valves
No.
Conn-
ectors
No.
Tanks
No.
Comp-
ressors
No.
M21
>500ppm
No.
IRs
PM
(tons/yr)
NOx
(tons/yr)
CO
(tons
PS-067
694 AVONDALE
HASLET (DEVON)(LBJ) (G-PAD); E2
WELL PAD 2 118 708 3 0 1 1 -0- -0- -0
PS-068694 AVONDALEHASLET (DEVON)(LBJ) (H-PAD); E2
WELL PAD 1 62 372 1 0 1 0 -0- -0- -0
PS-069694 AVONDALEHASLET (DEVON)(LBJ) (I-PAD); E2
WELL PAD 1 47 329 1 0 2 0 -0- -0- -0
PS-070694 AVONDALEHASLET (DEVON)(LBJ) (M-PAD); E2
WELL PAD 3 200 1230 3 0 1 2 -0- -0- -0
PS-071694 AVONDALEHASLET (DEVON)
(LBJ) (L-PAD); E2
WELL PAD 1 62 434 1 0 0 0 -0- -0- -0
PS-0722292 N TARRANTPKWY; F4
WELL PAD 4 438 3456 8 1 14 9 0.10 1.50 17.2
PS-073693 AVONDALEHASLET (DEVON)(LBJ) (O-PAD); E2
WELL PAD 1 59 416 1 0 0 0 -0- -0- -0
PS-074693 AVONDALEHASLET (DEVON)(LBJ) (N-PAD); E2
WELL PAD 1 65 390 1 0 0 1 -0- -0- -0
PS-075693 AVONDALEHASLET (DEVON)(LBJ) (Q-PAD); E2
WELL PAD 2 126 882 4 0 2 1 -0- -0- -0
PS-076
693 AVONDALE
HASLET (DEVON)(LBJ) (R-PAD); E2
WELL PAD 1 85 425 2 0 0 0 -0- -0- -0
PS-077693 AVONDALEHASLET (DEVON)(LBJ) (S-PAD); E2
WELL PAD 2 147 735 3 0 0 0 -0- -0- -0
PS-078
1300 BLUFFSPRINGS RD(DEVON) (BOAZ) (B-PAD); E2
WELL PAD 1 54 324 1 0 0 0 -0- -0- -0
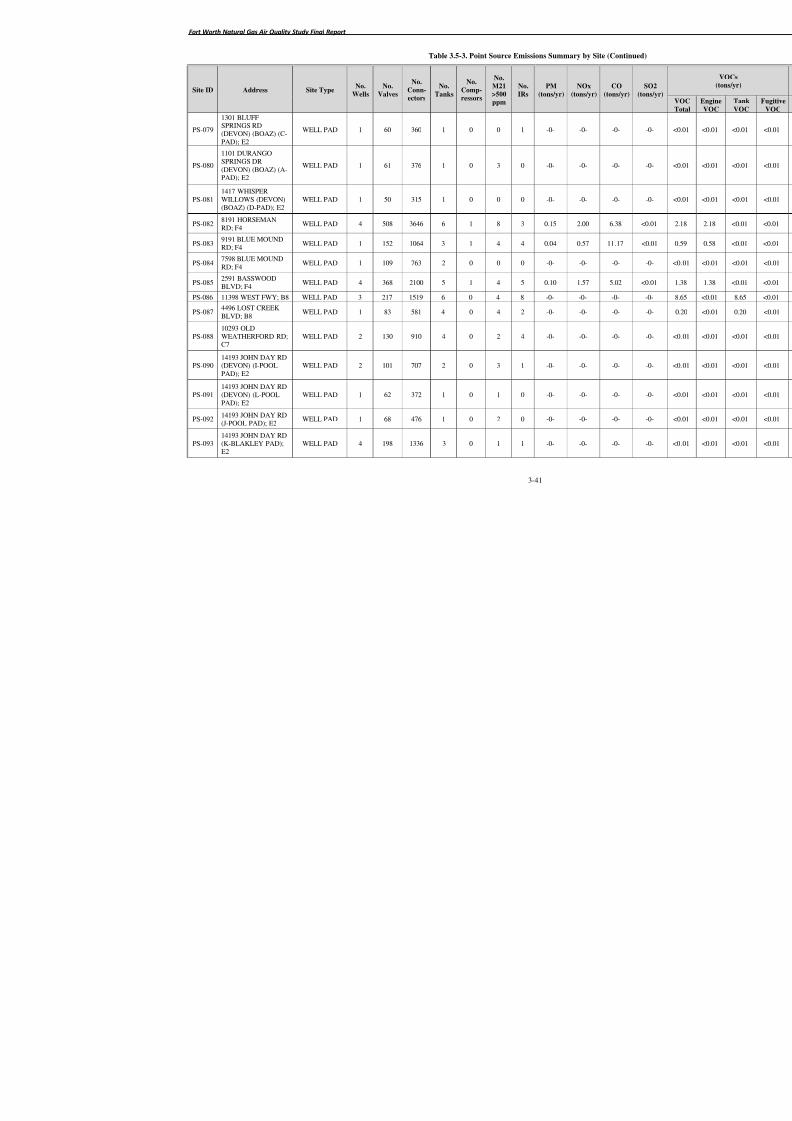
8/6/2019 Air Quality Study Final
http://slidepdf.com/reader/full/air-quality-study-final 131/320
Fort Worth Natural Gas Air Quality Study Final Report
3-41
Table 3.5-3. Point Source Emissions Summary by Site (Co
Site ID Address Site TypeNo.
Wells
No.
Valves
No.
Conn-
ectors
No.
Tanks
No.
Comp-
ressors
No.
M21
>500ppm
No.
IRs
PM
(tons/yr)
NOx
(tons/yr)
CO
(tons
PS-079
1301 BLUFF
SPRINGS RD(DEVON) (BOAZ) (C-PAD); E2
WELL PAD 1 60 360 1 0 0 1 -0- -0- -0
PS-080
1101 DURANGOSPRINGS DR(DEVON) (BOAZ) (A-PAD); E2
WELL PAD 1 61 376 1 0 3 0 -0- -0- -0
PS-0811417 WHISPERWILLOWS (DEVON)(BOAZ) (D-PAD); E2
WELL PAD 1 50 315 1 0 0 0 -0- -0- -0
PS-0828191 HORSEMANRD; F4
WELL PAD 4 508 3646 6 1 8 3 0.15 2.00 6.3
PS-0839191 BLUE MOUNDRD; F4
WELL PAD 1 152 1064 3 1 4 4 0.04 0.57 11.
PS-0847598 BLUE MOUNDRD; F4
WELL PAD 1 109 763 2 0 0 0 -0- -0- -0
PS-0852591 BASSWOODBLVD; F4
WELL PAD 4 368 2100 5 1 4 5 0.10 1.57 5.0
PS-086 11398 WEST FWY; B8 WELL PAD 3 217 1519 6 0 4 8 -0- -0- -0
PS-0874496 LOST CREEKBLVD; B8
WELL PAD 1 83 581 4 0 4 2 -0- -0- -0
PS-08810293 OLDWEATHERFORD RD;C7
WELL PAD 2 130 910 4 0 2 4 -0- -0- -0
PS-09014193 JOHN DAY RD(DEVON) (I-POOLPAD); E2
WELL PAD 2 101 707 2 0 3 1 -0- -0- -0
PS-09114193 JOHN DAY RD(DEVON) (L-POOLPAD); E2
WELL PAD 1 62 372 1 0 1 0 -0- -0- -0
PS-09214193 JOHN DAY RD(J-POOL PAD); E2
WELL PAD 1 68 476 1 0 2 0 -0- -0- -0
PS-09314193 JOHN DAY RD(K-BLAKLEY PAD);E2
WELL PAD 4 198 1336 3 0 1 1 -0- -0- -0
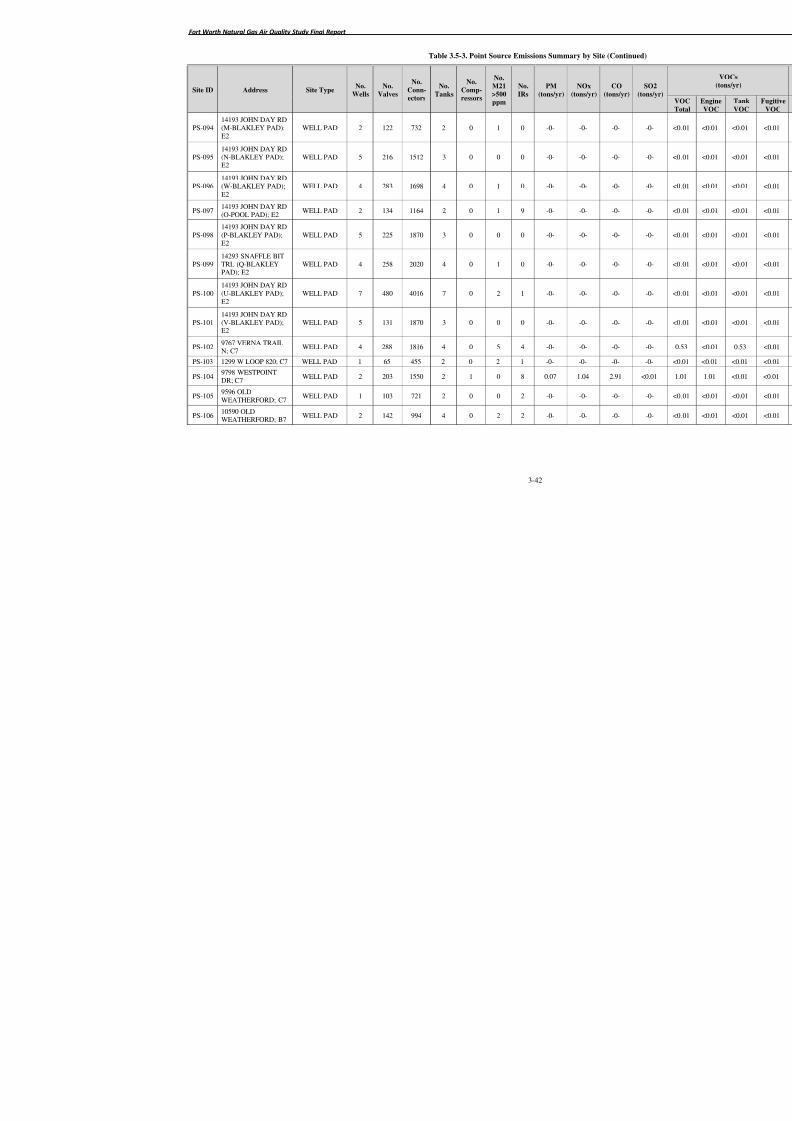
8/6/2019 Air Quality Study Final
http://slidepdf.com/reader/full/air-quality-study-final 132/320
Fort Worth Natural Gas Air Quality Study Final Report
3-42
Table 3.5-3. Point Source Emissions Summary by Site (Co
Site ID Address Site TypeNo.
Wells
No.
Valves
No.
Conn-
ectors
No.
Tanks
No.
Comp-
ressors
No.
M21
>500ppm
No.
IRs
PM
(tons/yr)
NOx
(tons/yr)
CO
(tons
PS-094
14193 JOHN DAY RD
(M-BLAKLEY PAD);E2
WELL PAD 2 122 732 2 0 1 0 -0- -0- -0
PS-09514193 JOHN DAY RD(N-BLAKLEY PAD);E2
WELL PAD 5 216 1512 3 0 0 0 -0- -0- -0
PS-09614193 JOHN DAY RD(W-BLAKLEY PAD);E2
WELL PAD 4 283 1698 4 0 1 0 -0- -0- -0
PS-09714193 JOHN DAY RD(O-POOL PAD); E2
WELL PAD 2 134 1164 2 0 1 9 -0- -0- -0
PS-09814193 JOHN DAY RD(P-BLAKLEY PAD);E2
WELL PAD 5 225 1870 3 0 0 0 -0- -0- -0
PS-09914293 SNAFFLE BITTRL (Q-BLAKLEYPAD); E2
WELL PAD 4 258 2020 4 0 1 0 -0- -0- -0
PS-10014193 JOHN DAY RD(U-BLAKLEY PAD);E2
WELL PAD 7 480 4016 7 0 2 1 -0- -0- -0
PS-10114193 JOHN DAY RD(V-BLAKLEY PAD);E2
WELL PAD 5 131 1870 3 0 0 0 -0- -0- -0
PS-1029767 VERNA TRAILN; C7
WELL PAD 4 288 1816 4 0 5 4 -0- -0- -0
PS-103 1299 W LOOP 820; C7 WELL PAD 1 65 455 2 0 2 1 -0- -0- -0
PS-104
9798 WESTPOINT
DR; C7 WELL PAD 2 203 1550 2 1 0 8 0.07 1.04 2.9
PS-1059596 OLDWEATHERFORD; C7
WELL PAD 1 103 721 2 0 0 2 -0- -0- -0
PS-10610590 OLDWEATHERFORD; B7
WELL PAD 2 142 994 4 0 2 2 -0- -0- -0
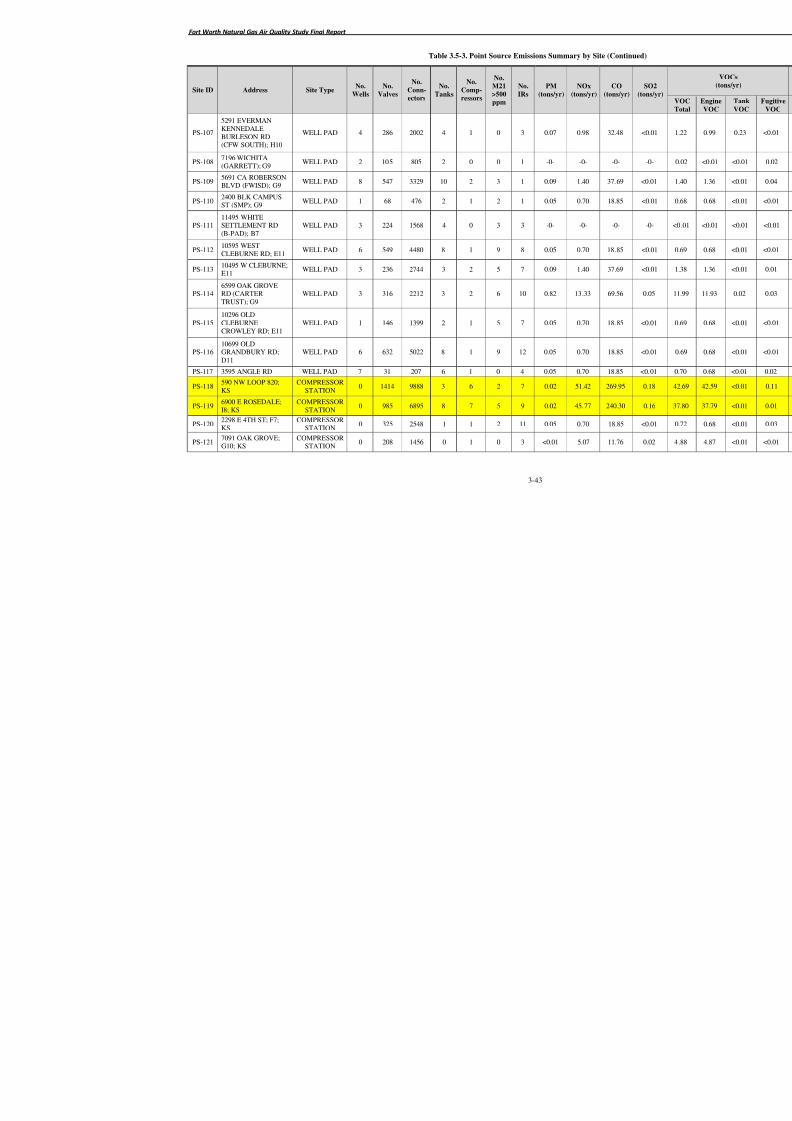
8/6/2019 Air Quality Study Final
http://slidepdf.com/reader/full/air-quality-study-final 133/320
Fort Worth Natural Gas Air Quality Study Final Report
3-43
Table 3.5-3. Point Source Emissions Summary by Site (Co
Site ID Address Site TypeNo.
Wells
No.
Valves
No.
Conn-
ectors
No.
Tanks
No.
Comp-
ressors
No.
M21
>500ppm
No.
IRs
PM
(tons/yr)
NOx
(tons/yr)
CO
(tons
PS-107
5291 EVERMAN
KENNEDALEBURLESON RD(CFW SOUTH); H10
WELL PAD 4 286 2002 4 1 0 3 0.07 0.98 32.4
PS-1087196 WICHITA(GARRETT); G9
WELL PAD 2 105 805 2 0 0 1 -0- -0- -0
PS-1095691 CA ROBERSONBLVD (FWISD); G9
WELL PAD 8 547 3329 10 2 3 1 0.09 1.40 37.6
PS-1102400 BLK CAMPUSST (SMP); G9
WELL PAD 1 68 476 2 1 2 1 0.05 0.70 18.8
PS-11111495 WHITESETTLEMENT RD(B-PAD); B7
WELL PAD 3 224 1568 4 0 3 3 -0- -0- -0
PS-112
10595 WEST
CLEBURNE RD; E11 WELL PAD 6 549 4480 8 1 9 8 0.05 0.70 18.8
PS-11310495 W CLEBURNE;E11
WELL PAD 3 236 2744 3 2 5 7 0.09 1.40 37.6
PS-1146599 OAK GROVERD (CARTERTRUST); G9
WELL PAD 3 316 2212 3 2 6 10 0.82 13.33 69.5
PS-11510296 OLDCLEBURNECROWLEY RD; E11
WELL PAD 1 146 1399 2 1 5 7 0.05 0.70 18.8
PS-11610699 OLDGRANDBURY RD;D11
WELL PAD 6 632 5022 8 1 9 12 0.05 0.70 18.8
PS-117 3595 ANGLE RD WELL PAD 7 31 207 6 1 0 4 0.05 0.70 18.8
PS-118590 NW LOOP 820;KS
COMPRESSORSTATION
0 1414 9888 3 6 2 7 0.02 51.42 269.
PS-1196900 E ROSEDALE;I8; KS
COMPRESSORSTATION
0 985 6895 8 7 5 9 0.02 45.77 240.
PS-1202298 E 4TH ST; F7;KS
COMPRESSORSTATION
0 325 2548 1 1 2 11 0.05 0.70 18.
PS-1217091 OAK GROVE;G10; KS
COMPRESSORSTATION
0 208 1456 0 1 0 3 <0.01 5.07 11.7
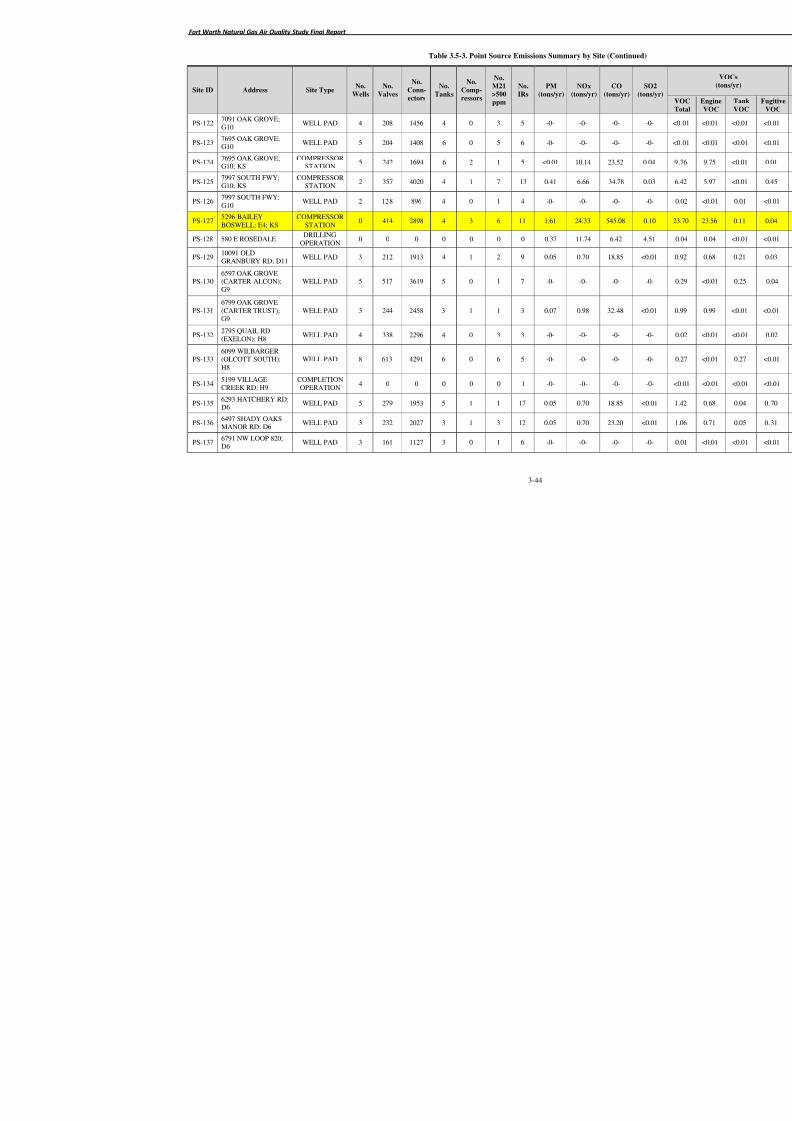
8/6/2019 Air Quality Study Final
http://slidepdf.com/reader/full/air-quality-study-final 134/320
Fort Worth Natural Gas Air Quality Study Final Report
3-44
Table 3.5-3. Point Source Emissions Summary by Site (Co
Site ID Address Site TypeNo.
Wells
No.
Valves
No.
Conn-
ectors
No.
Tanks
No.
Comp-
ressors
No.
M21
>500ppm
No.
IRs
PM
(tons/yr)
NOx
(tons/yr)
CO
(tons
PS-122
7091 OAK GROVE;
G10 WELL PAD 4 208 1456 4 0 3 5 -0- -0- -0
PS-1237695 OAK GROVE;G10
WELL PAD 5 204 1408 6 0 5 6 -0- -0- -0
PS-1247695 OAK GROVE;G10; KS
COMPRESSORSTATION
5 242 1694 6 2 1 5 <0.01 10.14 23.5
PS-1257997 SOUTH FWY;G10; KS
COMPRESSORSTATION
2 357 4020 4 1 7 13 0.41 6.66 34.
PS-1267997 SOUTH FWY;G10
WELL PAD 2 128 896 4 0 1 4 -0- -0- -0
PS-1275296 BAILEYBOSWELL; E4; KS
COMPRESSORSTATION
0 414 2898 4 3 6 11 1.61 24.33 545.
PS-128 580 E ROSEDALEDRILLING
OPERATION0 0 0 0 0 0 0 0.37 11.74 6.4
PS-129 10091 OLDGRANBURY RD; D11
WELL PAD 3 212 1913 4 1 2 9 0.05 0.70 18.8
PS-1306597 OAK GROVE(CARTER ALCON);G9
WELL PAD 5 517 3619 5 0 1 7 -0- -0- -0
PS-1316799 OAK GROVE(CARTER TRUST);G9
WELL PAD 3 244 2458 3 1 1 3 0.07 0.98 32.4
PS-1322795 QUAIL RD(EXELON); H8
WELL PAD 4 338 2296 4 0 3 3 -0- -0- -0
PS-1336099 WILBARGER(OLCOTT SOUTH);H8
WELL PAD 8 613 4291 6 0 6 5 -0- -0- -0
PS-134 5199 VILLAGECREEK RD; H9
COMPLETIONOPERATION
4 0 0 0 0 0 1 -0- -0- -0
PS-1356293 HATCHERY RD;D6
WELL PAD 5 279 1953 5 1 1 17 0.05 0.70 18.8
PS-1366497 SHADY OAKSMANOR RD; D6
WELL PAD 3 232 2027 3 1 3 12 0.05 0.70 23.2
PS-1376791 NW LOOP 820;D6
WELL PAD 3 161 1127 3 0 1 6 -0- -0- -0
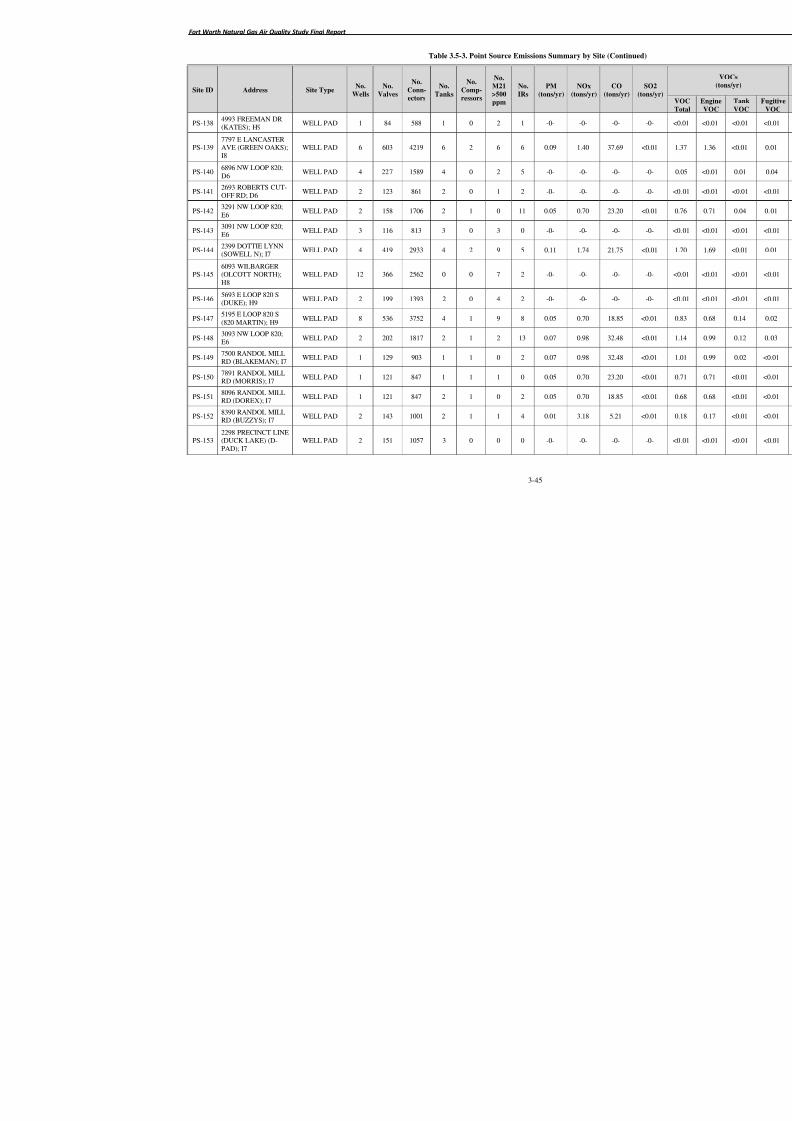
8/6/2019 Air Quality Study Final
http://slidepdf.com/reader/full/air-quality-study-final 135/320
Fort Worth Natural Gas Air Quality Study Final Report
3-45
Table 3.5-3. Point Source Emissions Summary by Site (Co
Site ID Address Site TypeNo.
Wells
No.
Valves
No.
Conn-
ectors
No.
Tanks
No.
Comp-
ressors
No.
M21
>500ppm
No.
IRs
PM
(tons/yr)
NOx
(tons/yr)
CO
(tons
PS-138
4993 FREEMAN DR
(KATES); H9 WELL PAD 1 84 588 1 0 2 1 -0- -0- -0
PS-1397797 E LANCASTERAVE (GREEN OAKS);I8
WELL PAD 6 603 4219 6 2 6 6 0.09 1.40 37.6
PS-1406896 NW LOOP 820;D6
WELL PAD 4 227 1589 4 0 2 5 -0- -0- -0
PS-1412693 ROBERTS CUT-OFF RD; D6
WELL PAD 2 123 861 2 0 1 2 -0- -0- -0
PS-1423291 NW LOOP 820;E6
WELL PAD 2 158 1706 2 1 0 11 0.05 0.70 23.2
PS-1433091 NW LOOP 820;E6
WELL PAD 3 116 813 3 0 3 0 -0- -0- -0
PS-144
2399 DOTTIE LYNN
(SOWELL N); I7 WELL PAD 4 419 2933 4 2 9 5 0.11 1.74 21.7
PS-1456093 WILBARGER(OLCOTT NORTH);H8
WELL PAD 12 366 2562 0 0 7 2 -0- -0- -0
PS-1465693 E LOOP 820 S(DUKE); H9
WELL PAD 2 199 1393 2 0 4 2 -0- -0- -0
PS-1475195 E LOOP 820 S(820 MARTIN); H9
WELL PAD 8 536 3752 4 1 9 8 0.05 0.70 18.8
PS-1483093 NW LOOP 820;E6
WELL PAD 2 202 1817 2 1 2 13 0.07 0.98 32.4
PS-1497500 RANDOL MILLRD (BLAKEMAN); I7
WELL PAD 1 129 903 1 1 0 2 0.07 0.98 32.4
PS-150
7891 RANDOL MILL
RD (MORRIS); I7 WELL PAD 1 121 847 1 1 1 0 0.05 0.70 23.2
PS-1518096 RANDOL MILLRD (DOREX); I7
WELL PAD 1 121 847 2 1 0 2 0.05 0.70 18.8
PS-1528390 RANDOL MILLRD (BUZZYS); I7
WELL PAD 2 143 1001 2 1 1 4 0.01 3.18 5.2
PS-1532298 PRECINCT LINE(DUCK LAKE) (D-PAD); I7
WELL PAD 2 151 1057 3 0 0 0 -0- -0- -0
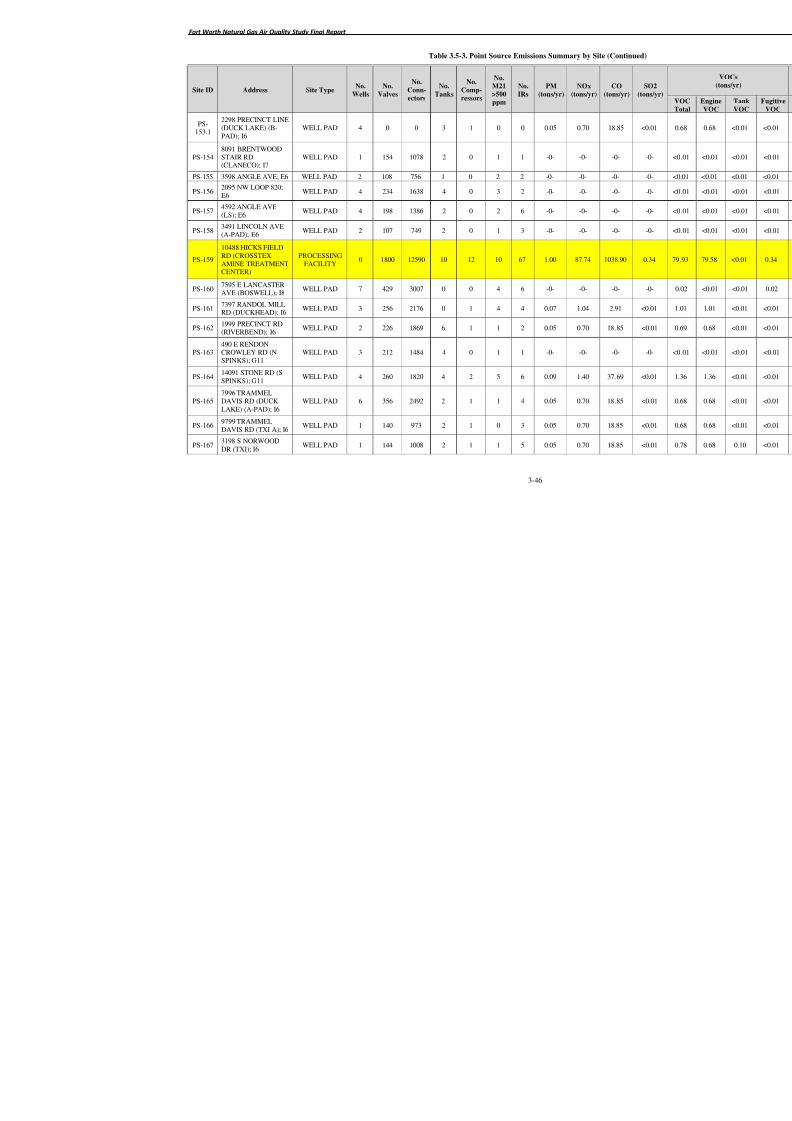
8/6/2019 Air Quality Study Final
http://slidepdf.com/reader/full/air-quality-study-final 136/320
Fort Worth Natural Gas Air Quality Study Final Report
3-46
Table 3.5-3. Point Source Emissions Summary by Site (Co
Site ID Address Site TypeNo.
Wells
No.
Valves
No.
Conn-
ectors
No.
Tanks
No.
Comp-
ressors
No.
M21
>500ppm
No.
IRs
PM
(tons/yr)
NOx
(tons/yr)
CO
(tons
PS-153.1
2298 PRECINCT LINE
(DUCK LAKE) (B-PAD); I6
WELL PAD 4 0 0 3 1 0 0 0.05 0.70 18.
PS-1548091 BRENTWOODSTAIR RD(CLANECO); I7
WELL PAD 1 154 1078 2 0 1 1 -0- -0- -0
PS-155 3598 ANGLE AVE; E6 WELL PAD 2 108 756 1 0 2 2 -0- -0- -0
PS-1562095 NW LOOP 820;E6
WELL PAD 4 234 1638 4 0 3 2 -0- -0- -0
PS-1574592 ANGLE AVE(LS); E6
WELL PAD 4 198 1386 2 0 2 6 -0- -0- -0
PS-1583491 LINCOLN AVE(A-PAD); E6
WELL PAD 2 107 749 2 0 1 3 -0- -0- -0
PS-159
10488 HICKS FIELDRD (CROSSTEXAMINE TREATMENTCENTER)
PROCESSINGFACILITY
0 1800 12590 10 12 10 67 1.00 87.74 1038
PS-1607595 E LANCASTERAVE (BOSWELL); I8
WELL PAD 7 429 3007 0 0 4 6 -0- -0- -0
PS-1617397 RANDOL MILLRD (DUCKHEAD); I6
WELL PAD 3 256 2176 0 1 4 4 0.07 1.04 2.9
PS-1621999 PRECINCT RD(RIVERBEND); I6
WELL PAD 2 226 1869 6 1 1 2 0.05 0.70 18.8
PS-163490 E RENDONCROWLEY RD (NSPINKS); G11
WELL PAD 3 212 1484 4 0 1 1 -0- -0- -0
PS-164
14091 STONE RD (S
SPINKS); G11 WELL PAD 4 260 1820 4 2 5 6 0.09 1.40 37.6
PS-1657996 TRAMMELDAVIS RD (DUCKLAKE) (A-PAD); I6
WELL PAD 6 356 2492 2 1 1 4 0.05 0.70 18.8
PS-1669799 TRAMMELDAVIS RD (TXI A); I6
WELL PAD 1 140 973 2 1 0 3 0.05 0.70 18.8
PS-1673198 S NORWOODDR (TXI); I6
WELL PAD 1 144 1008 2 1 1 5 0.05 0.70 18.8
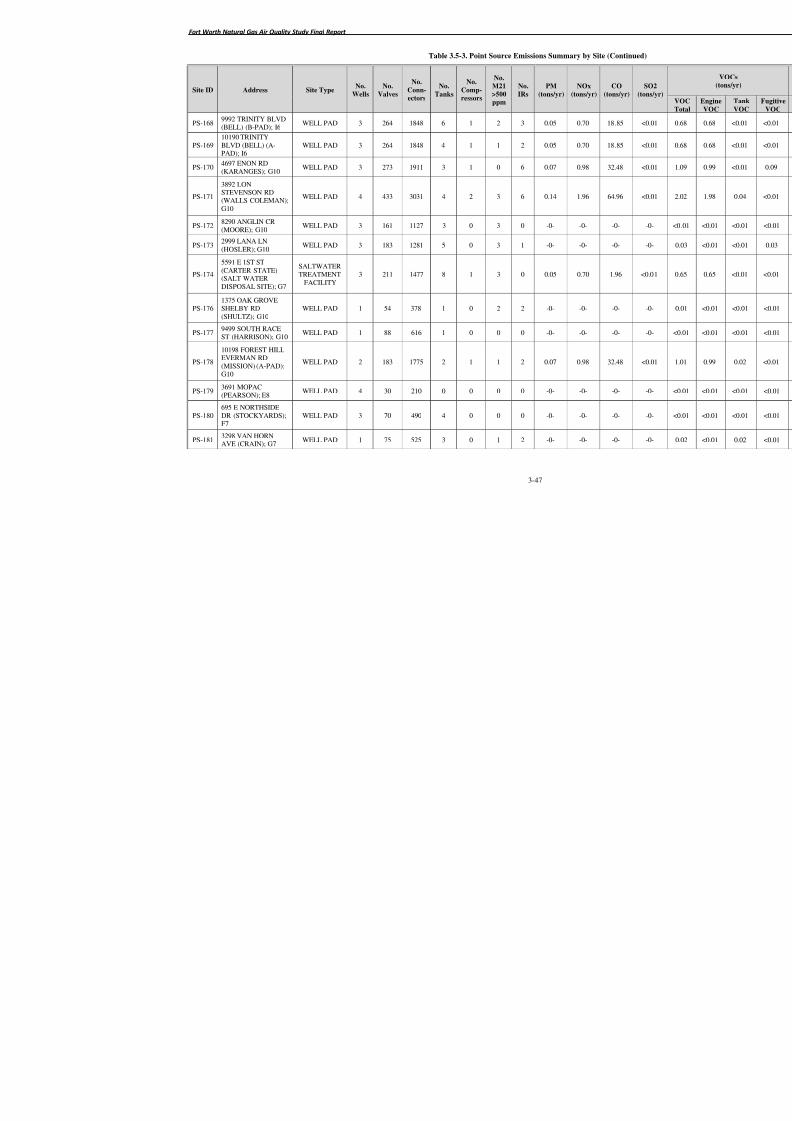
8/6/2019 Air Quality Study Final
http://slidepdf.com/reader/full/air-quality-study-final 137/320
Fort Worth Natural Gas Air Quality Study Final Report
3-47
Table 3.5-3. Point Source Emissions Summary by Site (Co
Site ID Address Site TypeNo.
Wells
No.
Valves
No.
Conn-
ectors
No.
Tanks
No.
Comp-
ressors
No.
M21
>500ppm
No.
IRs
PM
(tons/yr)
NOx
(tons/yr)
CO
(tons
PS-168
9992 TRINITY BLVD
(BELL) (B-PAD); I6 WELL PAD 3 264 1848 6 1 2 3 0.05 0.70 18.8
PS-16910190 TRINITYBLVD (BELL) (A-PAD); I6
WELL PAD 3 264 1848 4 1 1 2 0.05 0.70 18.8
PS-1704697 ENON RD(KARANGES); G10
WELL PAD 3 273 1911 3 1 0 6 0.07 0.98 32.4
PS-171
3892 LONSTEVENSON RD(WALLS COLEMAN);G10
WELL PAD 4 433 3031 4 2 3 6 0.14 1.96 64.9
PS-1728290 ANGLIN CR(MOORE); G10
WELL PAD 3 161 1127 3 0 3 0 -0- -0- -0
PS-1732999 LANA LN
(HOSLER); G10
WELL PAD 3 183 1281 5 0 3 1 -0- -0- -0
PS-174
5591 E 1ST ST(CARTER STATE)(SALT WATERDISPOSAL SITE); G7
SALTWATERTREATMENT
FACILITY3 211 1477 8 1 3 0 0.05 0.70 1.9
PS-1761375 OAK GROVESHELBY RD(SHULTZ); G10
WELL PAD 1 54 378 1 0 2 2 -0- -0- -0
PS-1779499 SOUTH RACEST (HARRISON); G10
WELL PAD 1 88 616 1 0 0 0 -0- -0- -0
PS-178
10198 FOREST HILLEVERMAN RD(MISSION) (A-PAD);G10
WELL PAD 2 183 1775 2 1 1 2 0.07 0.98 32.4
PS-1793691 MOPAC(PEARSON); E8
WELL PAD 4 30 210 0 0 0 0 -0- -0- -0
PS-180695 E NORTHSIDEDR (STOCKYARDS);F7
WELL PAD 3 70 490 4 0 0 0 -0- -0- -0
PS-1813298 VAN HORNAVE (CRAIN); G7
WELL PAD 1 75 525 3 0 1 2 -0- -0- -0
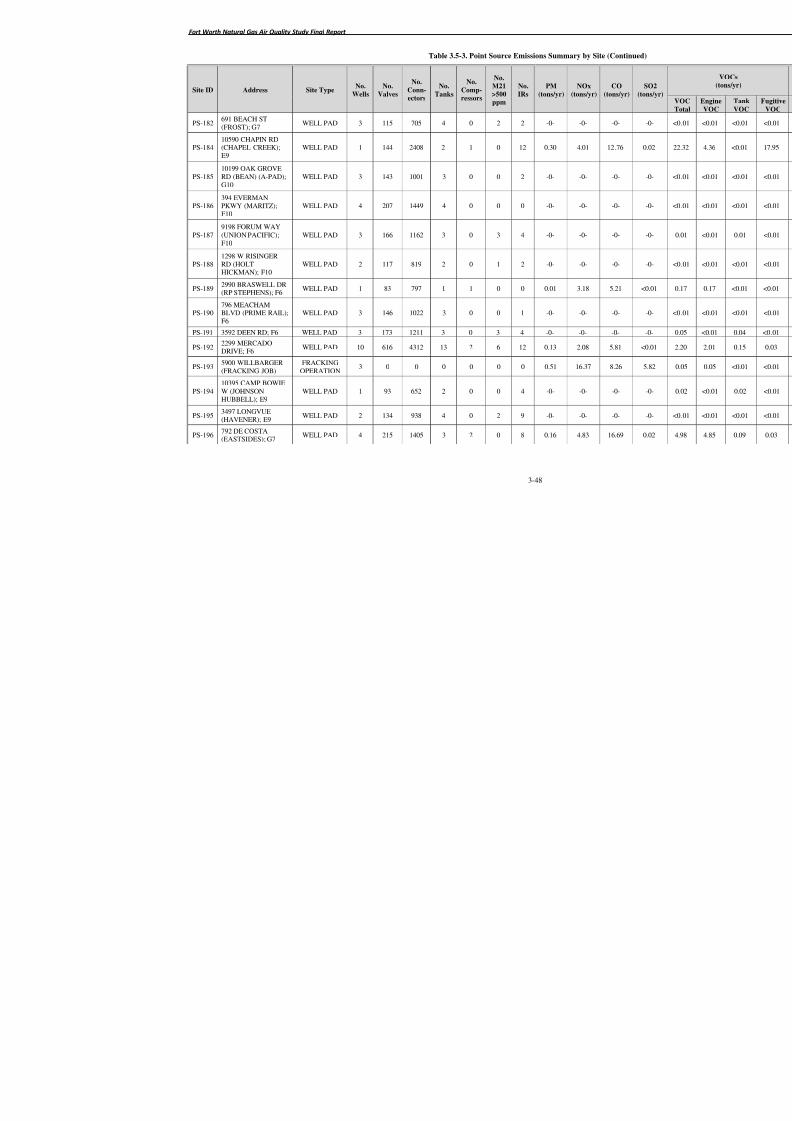
8/6/2019 Air Quality Study Final
http://slidepdf.com/reader/full/air-quality-study-final 138/320
Fort Worth Natural Gas Air Quality Study Final Report
3-48
Table 3.5-3. Point Source Emissions Summary by Site (Co
Site ID Address Site TypeNo.
Wells
No.
Valves
No.
Conn-
ectors
No.
Tanks
No.
Comp-
ressors
No.
M21
>500ppm
No.
IRs
PM
(tons/yr)
NOx
(tons/yr)
CO
(tons
PS-182
691 BEACH ST
(FROST); G7 WELL PAD 3 115 705 4 0 2 2 -0- -0- -0
PS-18410590 CHAPIN RD(CHAPEL CREEK);E9
WELL PAD 1 144 2408 2 1 0 12 0.30 4.01 12.7
PS-18510199 OAK GROVERD (BEAN) (A-PAD);G10
WELL PAD 3 143 1001 3 0 0 2 -0- -0- -0
PS-186394 EVERMANPKWY (MARITZ);F10
WELL PAD 4 207 1449 4 0 0 0 -0- -0- -0
PS-1879198 FORUM WAY(UNION PACIFIC);F10
WELL PAD 3 166 1162 3 0 3 4 -0- -0- -0
PS-1881298 W RISINGERRD (HOLTHICKMAN); F10
WELL PAD 2 117 819 2 0 1 2 -0- -0- -0
PS-1892990 BRASWELL DR(RP STEPHENS); F6
WELL PAD 1 83 797 1 1 0 0 0.01 3.18 5.2
PS-190796 MEACHAMBLVD (PRIME RAIL);F6
WELL PAD 3 146 1022 3 0 0 1 -0- -0- -0
PS-191 3592 DEEN RD; F6 WELL PAD 3 173 1211 3 0 3 4 -0- -0- -0
PS-1922299 MERCADODRIVE; F6
WELL PAD 10 616 4312 13 2 6 12 0.13 2.08 5.8
PS-1935900 WILLBARGER(FRACKING JOB)
FRACKINGOPERATION
3 0 0 0 0 0 0 0.51 16.37 8.2
PS-19410395 CAMP BOWIEW (JOHNSONHUBBELL); E9
WELL PAD 1 93 652 2 0 0 4 -0- -0- -0
PS-1953497 LONGVUE(HAVENER); E9
WELL PAD 2 134 938 4 0 2 9 -0- -0- -0
PS-196792 DE COSTA(EASTSIDES); G7
WELL PAD 4 215 1405 3 2 0 8 0.16 4.83 16.6

8/6/2019 Air Quality Study Final
http://slidepdf.com/reader/full/air-quality-study-final 139/320
Fort Worth Natural Gas Air Quality Study Final Report
3-49
Table 3.5-3. Point Source Emissions Summary by Site (Co
Site ID Address Site TypeNo.
Wells
No.
Valves
No.
Conn-
ectors
No.
Tanks
No.
Comp-
ressors
No.
M21
>500ppm
No.
IRs
PM
(tons/yr)
NOx
(tons/yr)
CO
(tons
PS-197
692 BEACH ST
(FROST); G7 WELL PAD 1 228 1596 3 1 2 7 0.07 1.04 2.9
PS-1985699 RANDOL MILLRD (GOODMAN); H7
WELL PAD 3 260 1824 4 1 4 2 0.05 0.70 1.9
PS-1997094 JACK NEWELLBLVD S (TRIMBLE);H7
WELL PAD 2 118 826 4 0 2 2 -0- -0- -0
PS-2007092 ENTERPRISEAVE (PARROT) (B-PAD); H7
WELL PAD 2 41 294 0 0 1 1 -0- -0- -0
PS-201
5895 MARINECREEK PKWY(MARINE CREEK)(A-PAD); E5
WELL PAD 2 183 1645 3 1 2 6 -0- -0- -0
6 HWY 114 WELL PAD 1 62 134 1 0 1 1 -0- -0- -0
20 4190 LITSEY RD WELL PAD 2 103 960 8 0 5 2 -0- -0- -0
23 4192 LITSEY RD WELL PAD 6 448 3584 0 1 2 6 0.05 0.70 1.9
243596ELIZABETHTOWNCEMETERY RD
WELL PAD 6 434 2738 6 1 3 2 0.05 0.70 1.9
2514797ELIZABETHTOWNCEMETERY RD
WELL PAD 5 206 1650 4 1 4 6 0.05 0.70 1.9
2614798ELIZABETHTOWNCEMETERY RD
WELL PAD 6 463 4270 6 1 3 9 0.05 0.70 1.9
274791 HENRIETTACREEK RD
WELL PAD 1 99 996 2 1 3 4 0.05 0.70 1.9
284794 HENRIETTACREEK RD
WELL PAD 1 76 768 2 1 3 5 0.05 0.70 1.9
29 14404 CHAPARRAL WELL PAD 2 154 1482 4 1 2 3 0.05 0.70 1.9
32 13794 NORTH FWY WELL PAD 8 506 3542 8 1 1 8 0.05 0.70 1.9
33 13593 NORTH FWY WELL PAD 8 539 4672 6 2 6 8 0.09 1.40 3.9
352890 WESTPORTPKWY
WELL PAD 1 68 476 2 0 0 0 -0- -0- -0
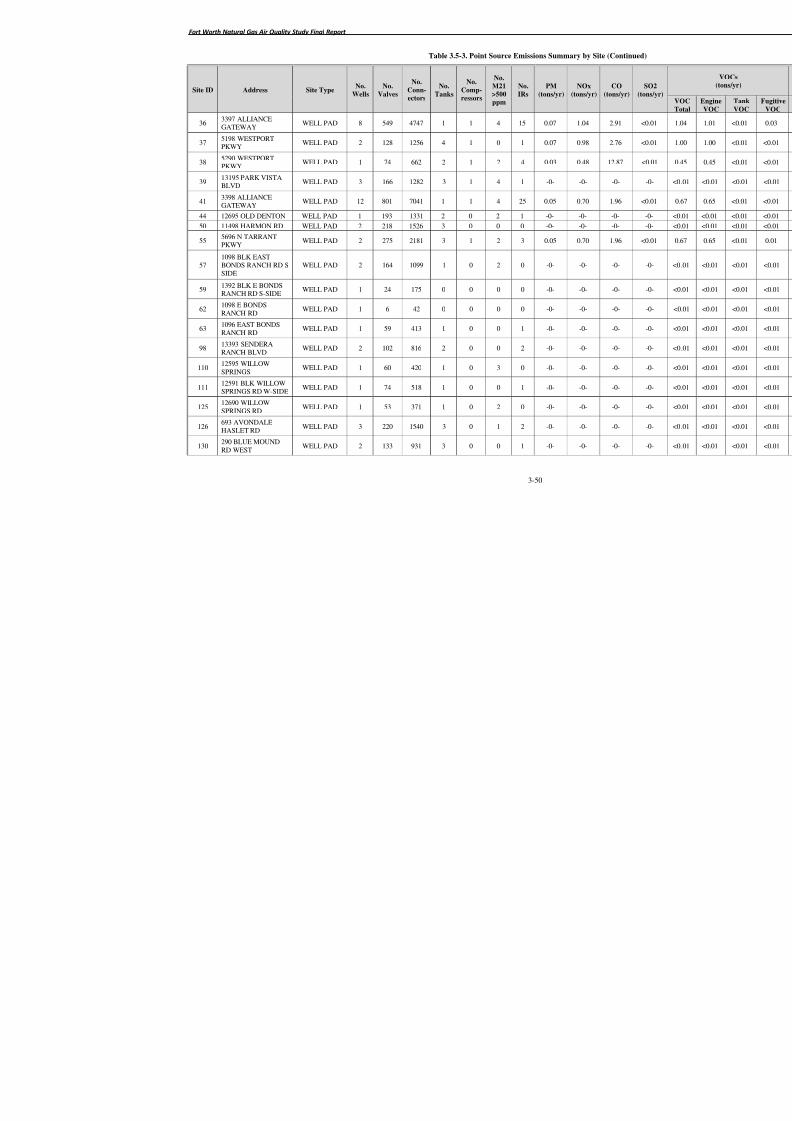
8/6/2019 Air Quality Study Final
http://slidepdf.com/reader/full/air-quality-study-final 140/320
Fort Worth Natural Gas Air Quality Study Final Report
3-50
Table 3.5-3. Point Source Emissions Summary by Site (Co
Site ID Address Site TypeNo.
Wells
No.
Valves
No.
Conn-
ectors
No.
Tanks
No.
Comp-
ressors
No.
M21
>500ppm
No.
IRs
PM
(tons/yr)
NOx
(tons/yr)
CO
(tons
36
3397 ALLIANCE
GATEWAY WELL PAD 8 549 4747 1 1 4 15 0.07 1.04 2.9
375198 WESTPORTPKWY
WELL PAD 2 128 1256 4 1 0 1 0.07 0.98 2.7
385290 WESTPORTPKWY
WELL PAD 1 74 662 2 1 2 4 0.03 0.48 12.8
3913195 PARK VISTABLVD
WELL PAD 3 166 1282 3 1 4 1 -0- -0- -0
413398 ALLIANCEGATEWAY
WELL PAD 12 801 7041 1 1 4 25 0.05 0.70 1.9
44 12695 OLD DENTON WELL PAD 1 193 1331 2 0 2 1 -0- -0- -0
50 11498 HARMON RD WELL PAD 2 218 1526 3 0 0 0 -0- -0- -0
555696 N TARRANTPKWY
WELL PAD 2 275 2181 3 1 2 3 0.05 0.70 1.9
571098 BLK EASTBONDS RANCH RD SSIDE
WELL PAD 2 164 1099 1 0 2 0 -0- -0- -0
591392 BLK E BONDSRANCH RD S-SIDE
WELL PAD 1 24 175 0 0 0 0 -0- -0- -0
621098 E BONDSRANCH RD
WELL PAD 1 6 42 0 0 0 0 -0- -0- -0
631096 EAST BONDSRANCH RD
WELL PAD 1 59 413 1 0 0 1 -0- -0- -0
9813393 SENDERARANCH BLVD
WELL PAD 2 102 816 2 0 0 2 -0- -0- -0
11012595 WILLOWSPRINGS
WELL PAD 1 60 420 1 0 3 0 -0- -0- -0
11112591 BLK WILLOWSPRINGS RD W-SIDE
WELL PAD 1 74 518 1 0 0 1 -0- -0- -0
12512690 WILLOWSPRINGS RD
WELL PAD 1 53 371 1 0 2 0 -0- -0- -0
126693 AVONDALEHASLET RD
WELL PAD 3 220 1540 3 0 1 2 -0- -0- -0
130290 BLUE MOUNDRD WEST
WELL PAD 2 133 931 3 0 0 1 -0- -0- -0

8/6/2019 Air Quality Study Final
http://slidepdf.com/reader/full/air-quality-study-final 141/320
Fort Worth Natural Gas Air Quality Study Final Report
3-51
Table 3.5-3. Point Source Emissions Summary by Site (Co
Site ID Address Site TypeNo.
Wells
No.
Valves
No.
Conn-
ectors
No.
Tanks
No.
Comp-
ressors
No.
M21
>500ppm
No.
IRs
PM
(tons/yr)
NOx
(tons/yr)
CO
(tons
132
12294 NW HWY 287
CFW WELL PAD 2 151 1057 2 0 2 1 -0- -0- -0
134 12290 NW HWY 287 WELL PAD 2 75 525 1 0 2 0 -0- -0- -0
136998 BLUE MOUNDRD WEST
WELL PAD 7 421 2947 3 0 6 0 -0- -0- -0
1381096 BLK W BLUEMOUND AT HWY-287 N-SIDE
WELL PAD 3 245 1855 3 0 2 2 -0- -0- -0
1391099 BLUE MOUNDRD W
WELL PAD 2 160 1120 2 0 1 1 -0- -0- -0
141692 BLUE MOUNDRD
WELL PAD 1 60 420 2 0 2 1 -0- -0- -0
142392 BLUE MOUNDRD WEST
WELL PAD 3 191 1337 3 0 3 1 -0- -0- -0
143893 BLUE MOUNDRD W
WELL PAD 2 167 1169 3 0 1 2 -0- -0- -0
14712890 BLKSAGINAW BLVD
WELL PAD 2 162 1079 3 1 2 0 0.05 0.70 1.9
147A12700 BLK HWY 287& 81 S-SIDE
WELL PAD 1 60 420 1 0 0 0 -0- -0- -0
149 12700 SAGINAW RD WELL PAD 1 38 266 1 0 0 0 -0- -0- -0
150 12700 SAGINAW RD WELL PAD 1 42 294 1 0 1 0 -0- -0- -0
1532492 BLUE MOUNDRD W
WELL PAD 2 128 896 3 0 5 0 -0- -0- -0
15411996 WILLOWSPRINGS RD
WELL PAD 1 87 609 1 0 2 0 -0- -0- -0
15511693 WILLOWSPRINGS RD WELL PAD 4 315 2205 4 0 1 4 -0- -0- -0
15611498 WILLOWSPRINGS RD
WELL PAD 3 217 1519 3 0 0 3 -0- -0- -0
159LPA BONDS RANCHRD
WELL PAD 4 314 2198 3 0 5 1 -0- -0- -0
1601892 W BONDSRANCH RD
WELL PAD 5 377 2639 4 0 1 7 -0- -0- -0
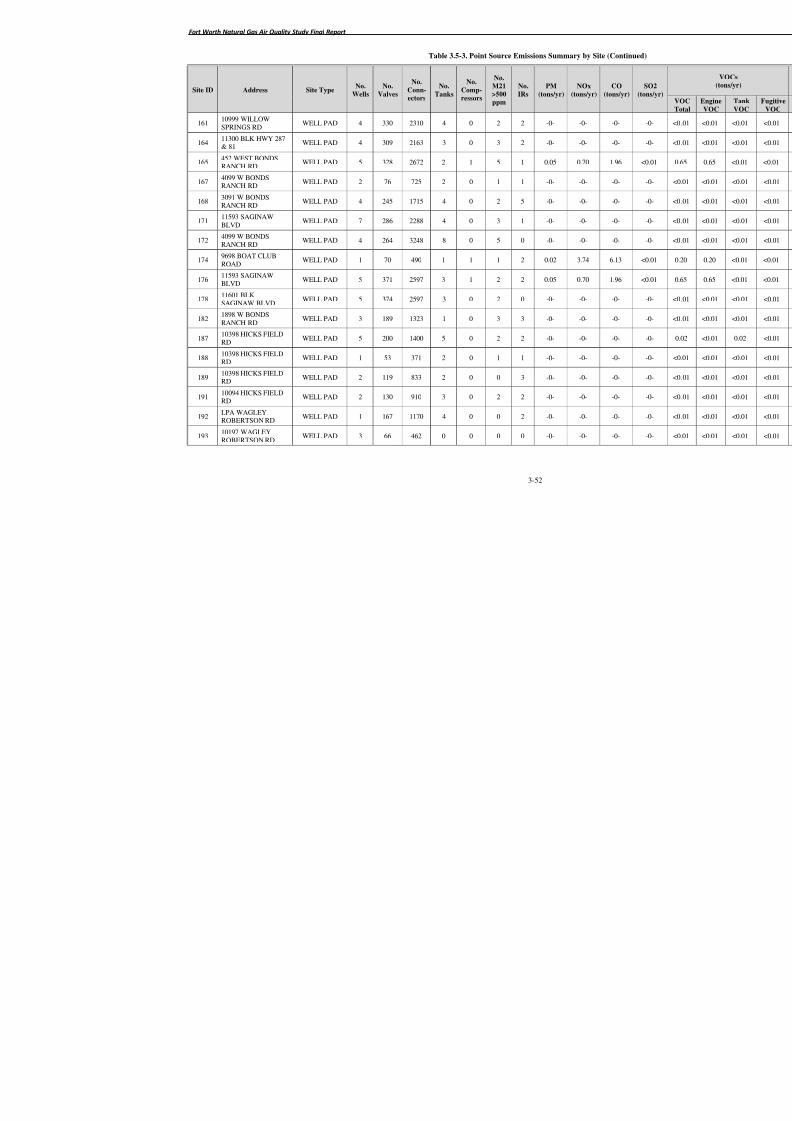
8/6/2019 Air Quality Study Final
http://slidepdf.com/reader/full/air-quality-study-final 142/320
Fort Worth Natural Gas Air Quality Study Final Report
3-52
Table 3.5-3. Point Source Emissions Summary by Site (Co
Site ID Address Site TypeNo.
Wells
No.
Valves
No.
Conn-
ectors
No.
Tanks
No.
Comp-
ressors
No.
M21
>500ppm
No.
IRs
PM
(tons/yr)
NOx
(tons/yr)
CO
(tons
161
10999 WILLOW
SPRINGS RD WELL PAD 4 330 2310 4 0 2 2 -0- -0- -0
16411300 BLK HWY 287& 81
WELL PAD 4 309 2163 3 0 3 2 -0- -0- -0
165452 WEST BONDSRANCH RD
WELL PAD 5 328 2672 2 1 5 1 0.05 0.70 1.9
1674099 W BONDSRANCH RD
WELL PAD 2 76 725 2 0 1 1 -0- -0- -0
1683091 W BONDSRANCH RD
WELL PAD 4 245 1715 4 0 2 5 -0- -0- -0
17111593 SAGINAWBLVD
WELL PAD 7 286 2288 4 0 3 1 -0- -0- -0
1724099 W BONDSRANCH RD
WELL PAD 4 264 3248 8 0 5 0 -0- -0- -0
1749698 BOAT CLUBROAD
WELL PAD 1 70 490 1 1 1 2 0.02 3.74 6.1
17611593 SAGINAWBLVD
WELL PAD 5 371 2597 3 1 2 2 0.05 0.70 1.9
17811601 BLKSAGINAW BLVD
WELL PAD 5 374 2597 3 0 2 0 -0- -0- -0
1821898 W BONDSRANCH RD
WELL PAD 3 189 1323 1 0 3 3 -0- -0- -0
18710398 HICKS FIELDRD
WELL PAD 5 200 1400 5 0 2 2 -0- -0- -0
18810398 HICKS FIELDRD
WELL PAD 1 53 371 2 0 1 1 -0- -0- -0
189
10398 HICKS FIELD
RD WELL PAD 2 119 833 2 0 0 3 -0- -0- -0
19110094 HICKS FIELDRD
WELL PAD 2 130 910 3 0 2 2 -0- -0- -0
192LPA WAGLEYROBERTSON RD
WELL PAD 1 167 1170 4 0 0 2 -0- -0- -0
19310197 WAGLEYROBERTSON RD
WELL PAD 3 66 462 0 0 0 0 -0- -0- -0
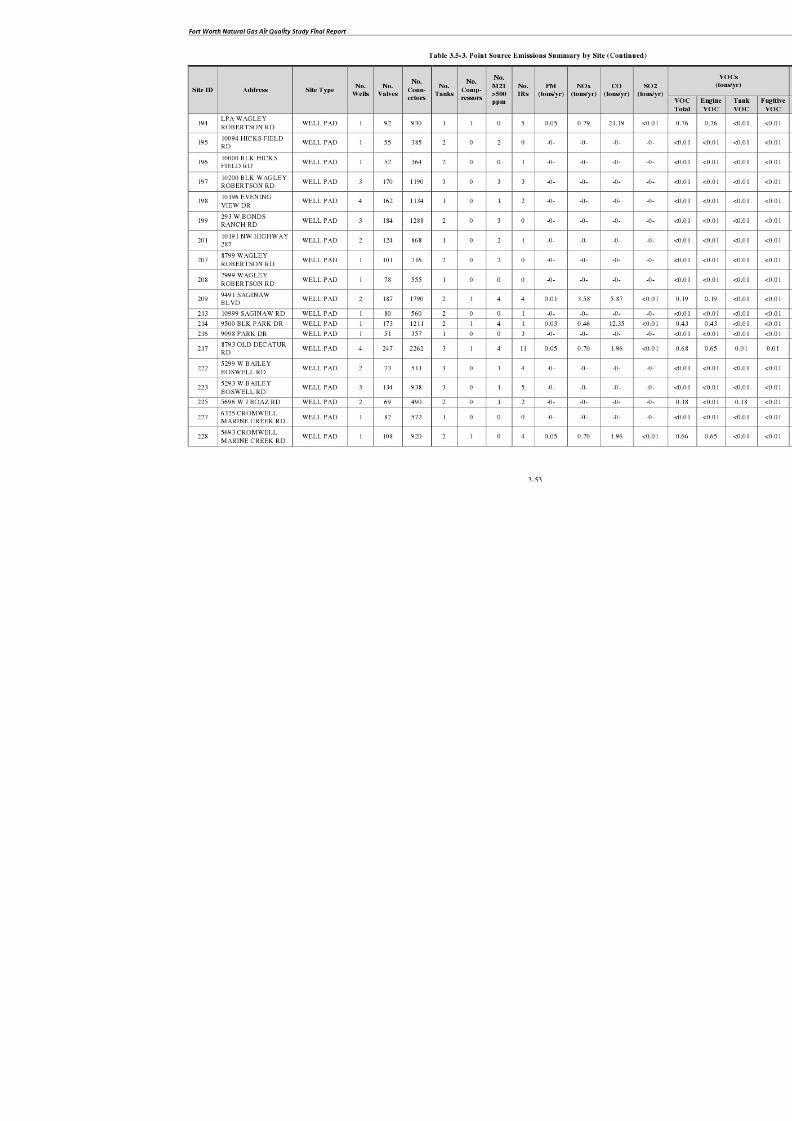
8/6/2019 Air Quality Study Final
http://slidepdf.com/reader/full/air-quality-study-final 143/320
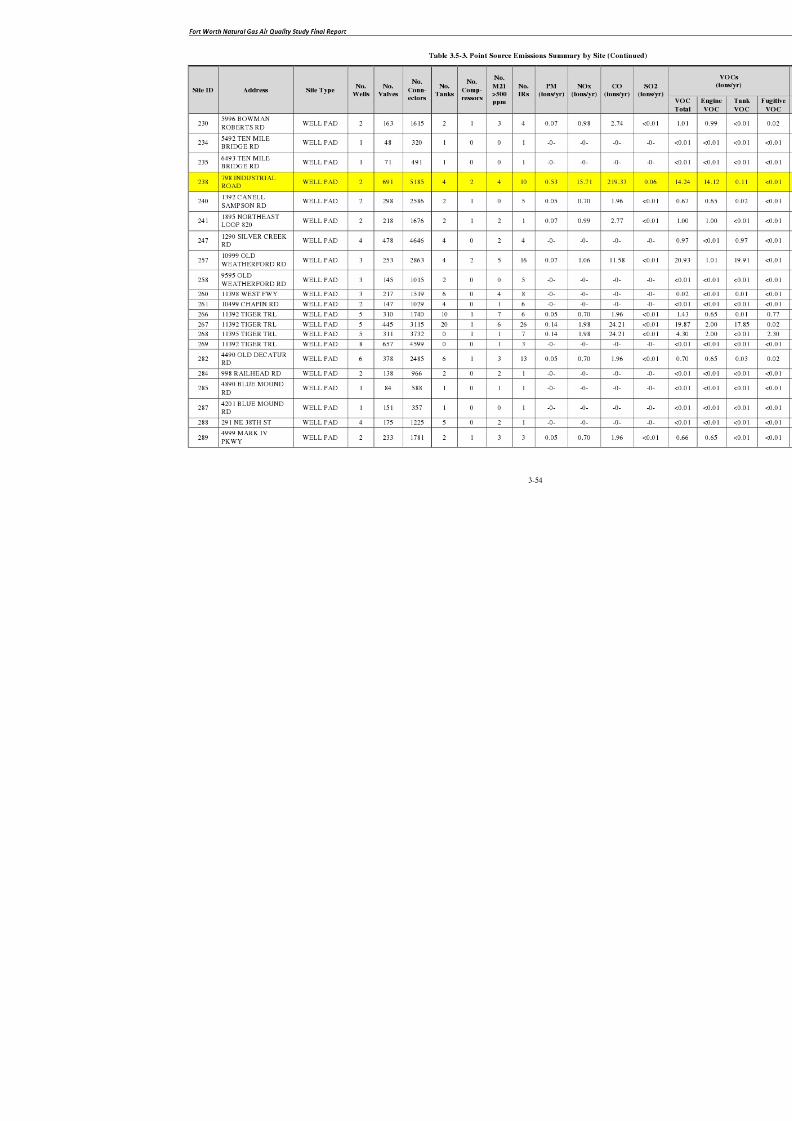
8/6/2019 Air Quality Study Final
http://slidepdf.com/reader/full/air-quality-study-final 144/320
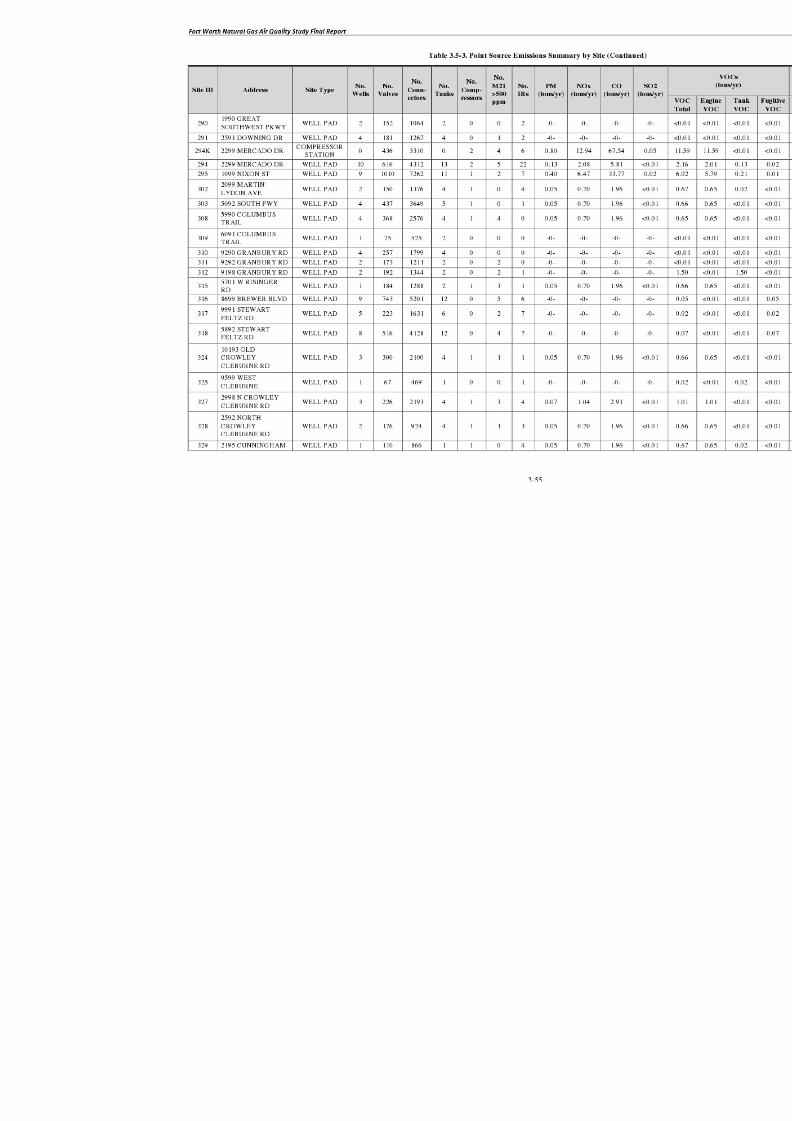
8/6/2019 Air Quality Study Final
http://slidepdf.com/reader/full/air-quality-study-final 145/320

8/6/2019 Air Quality Study Final
http://slidepdf.com/reader/full/air-quality-study-final 146/320
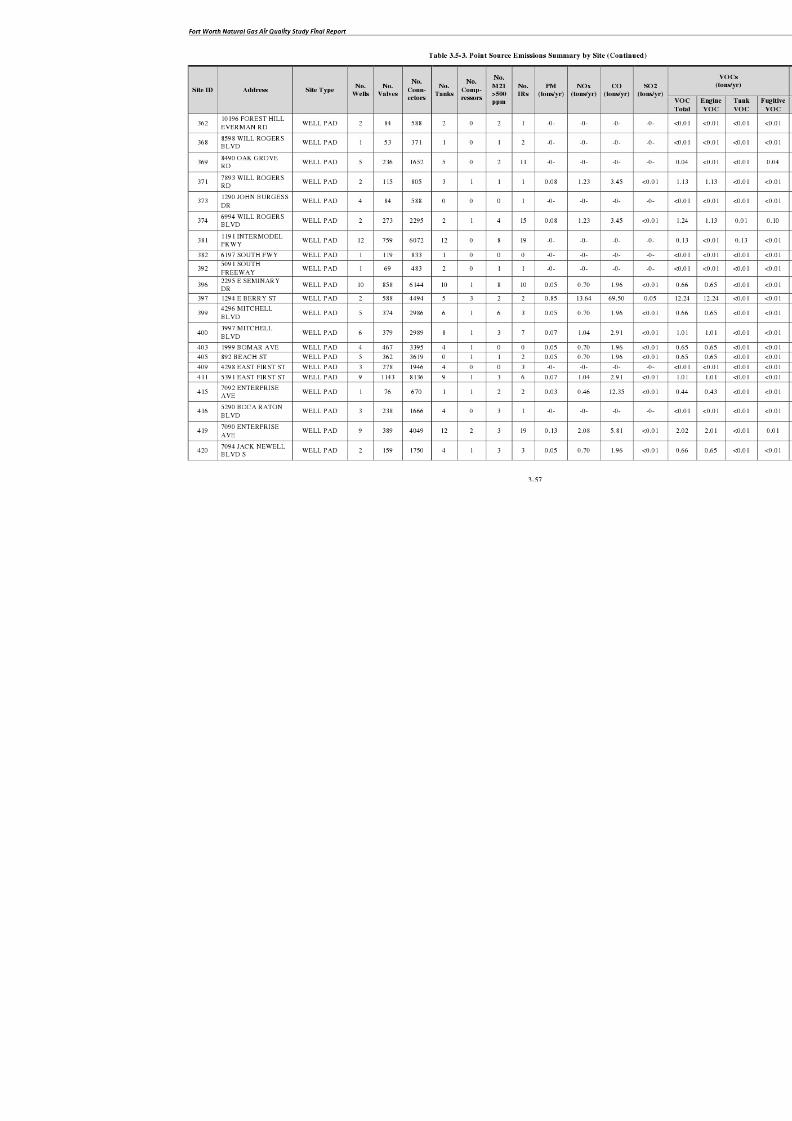
8/6/2019 Air Quality Study Final
http://slidepdf.com/reader/full/air-quality-study-final 147/320
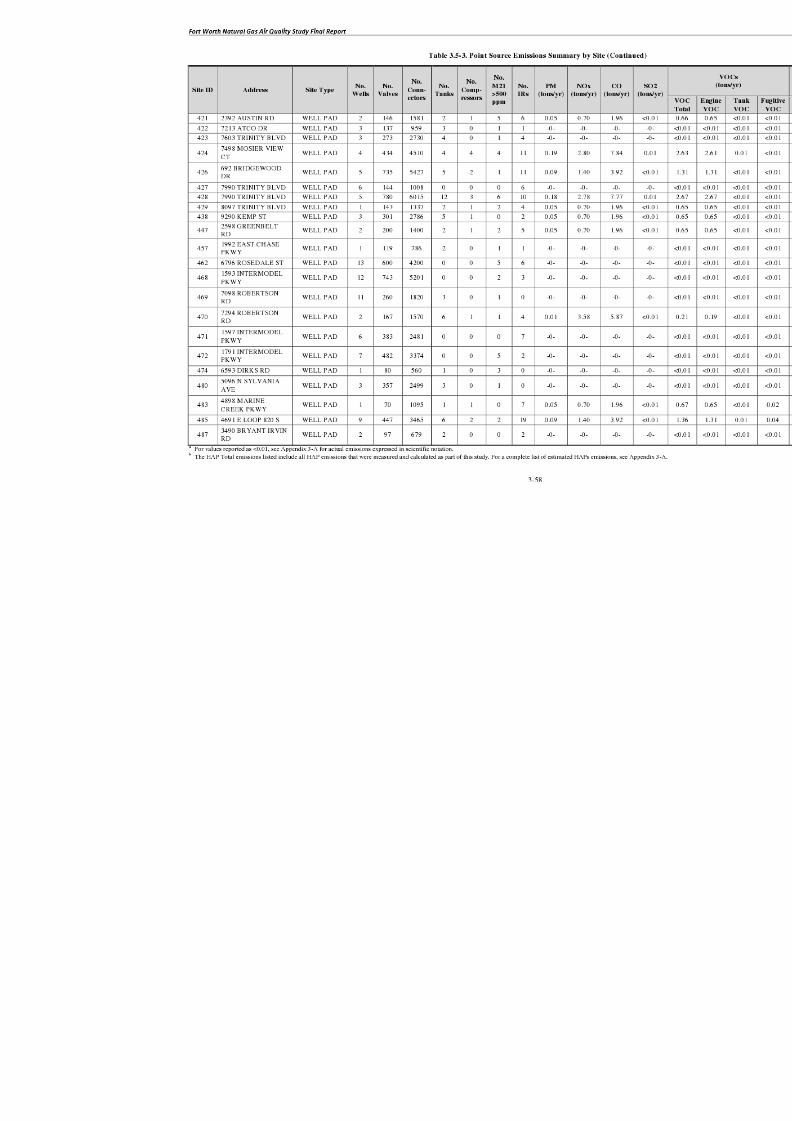
8/6/2019 Air Quality Study Final
http://slidepdf.com/reader/full/air-quality-study-final 148/320
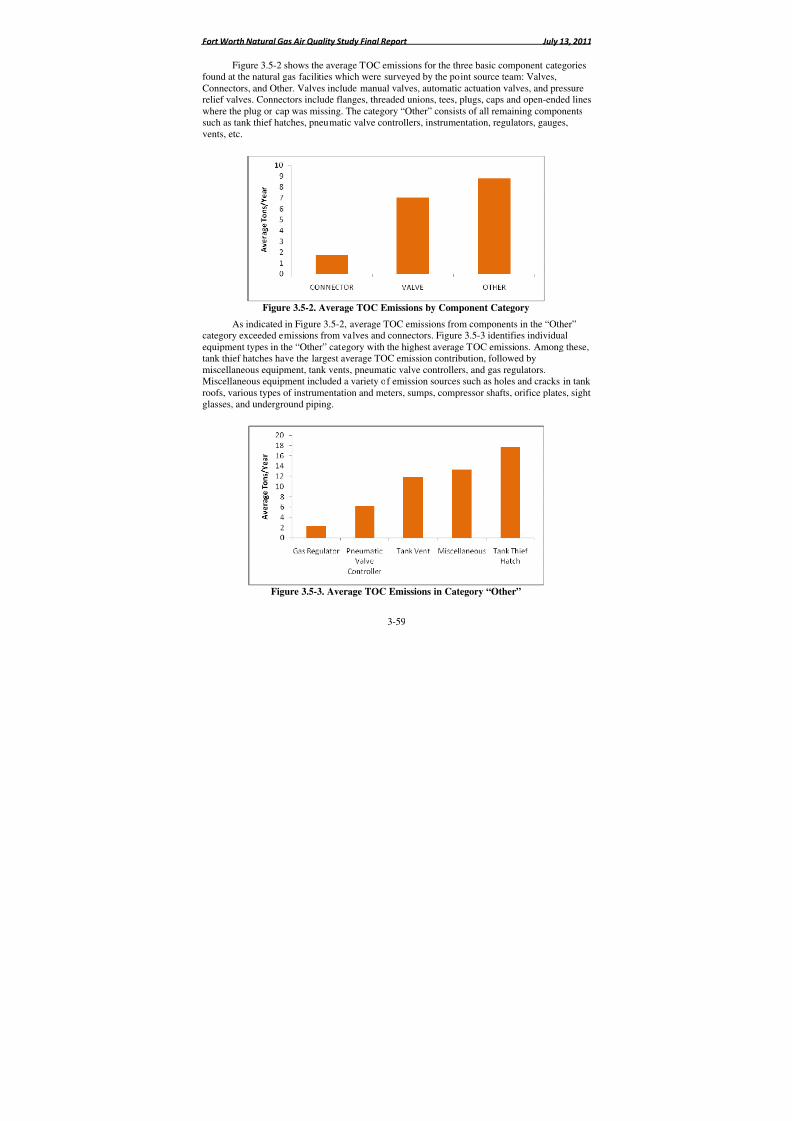
8/6/2019 Air Quality Study Final
http://slidepdf.com/reader/full/air-quality-study-final 149/320
Fort Worth Natural Gas Air Quality Study Final Report July 13, 2011
3-59
Figure 3.5-2 shows the average TOC emissions for the three basic component categoriesfound at the natural gas facilities which were surveyed by the point source team: Valves,Connectors, and Other. Valves include manual valves, automatic actuation valves, and pressurerelief valves. Connectors include flanges, threaded unions, tees, plugs, caps and open-ended lineswhere the plug or cap was missing. The category “Other” consists of all remaining components
such as tank thief hatches, pneumatic valve controllers, instrumentation, regulators, gauges,vents, etc.
Figure 3.5-2. Average TOC Emissions by Component Category
As indicated in Figure 3.5-2, average TOC emissions from components in the “Other”category exceeded emissions from valves and connectors. Figure 3.5-3 identifies individualequipment types in the “Other” category with the highest average TOC emissions. Among these,tank thief hatches have the largest average TOC emission contribution, followed bymiscellaneous equipment, tank vents, pneumatic valve controllers, and gas regulators.
Miscellaneous equipment included a variety of emission sources such as holes and cracks in tank roofs, various types of instrumentation and meters, sumps, compressor shafts, orifice plates, sightglasses, and underground piping.
Figure 3.5-3. Average TOC Emissions in Category “Other”
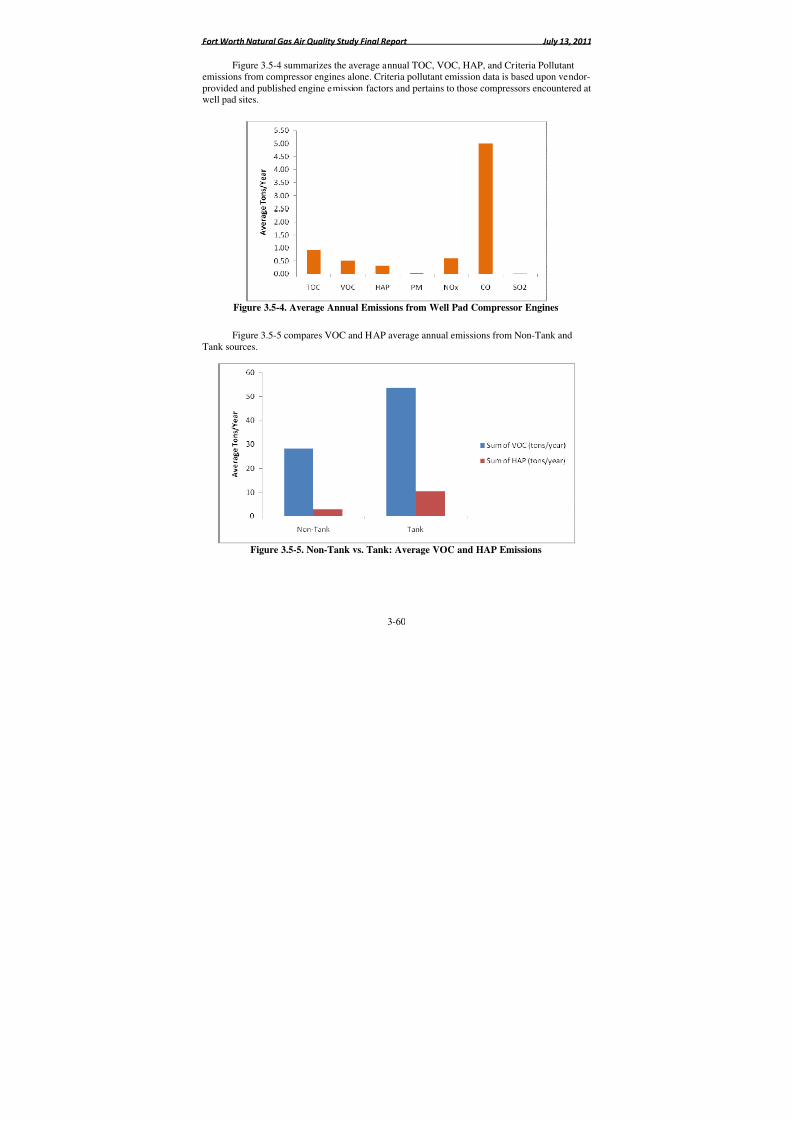
8/6/2019 Air Quality Study Final
http://slidepdf.com/reader/full/air-quality-study-final 150/320
Fort Worth Natural Gas Air Quality Study Final Report July 13, 2011
3-60
Figure 3.5-4 summarizes the average annual TOC, VOC, HAP, and Criteria Pollutantemissions from compressor engines alone. Criteria pollutant emission data is based upon vendor-provided and published engine emission factors and pertains to those compressors encountered atwell pad sites.
Figure 3.5-4. Average Annual Emissions from Well Pad Compressor Engines
Figure 3.5-5 compares VOC and HAP average annual emissions from Non-Tank andTank sources.
Figure 3.5-5. Non-Tank vs. Tank: Average VOC and HAP Emissions
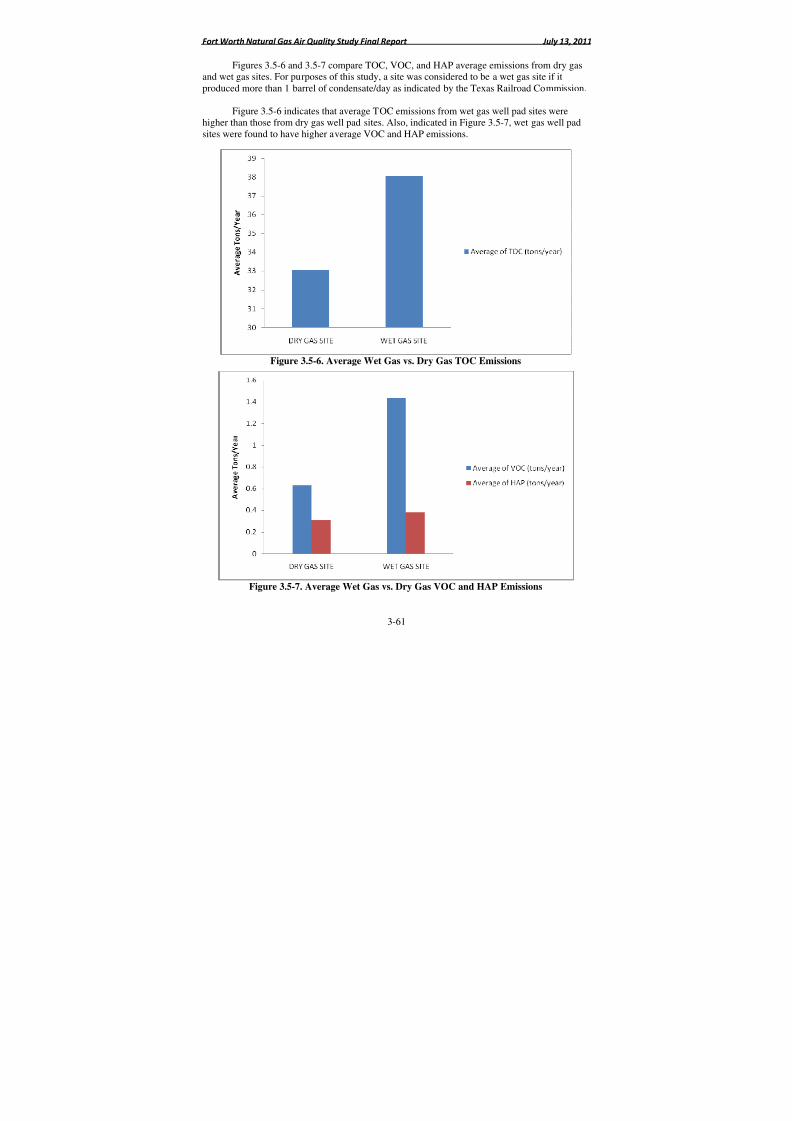
8/6/2019 Air Quality Study Final
http://slidepdf.com/reader/full/air-quality-study-final 151/320
Fort Worth Natural Gas Air Quality Study Final Report July 13, 2011
3-61
Figures 3.5-6 and 3.5-7 compare TOC, VOC, and HAP average emissions from dry gasand wet gas sites. For purposes of this study, a site was considered to be a wet gas site if itproduced more than 1 barrel of condensate/day as indicated by the Texas Railroad Commission.
Figure 3.5-6 indicates that average TOC emissions from wet gas well pad sites were
higher than those from dry gas well pad sites. Also, indicated in Figure 3.5-7, wet gas well padsites were found to have higher average VOC and HAP emissions.
Figure 3.5-6. Average Wet Gas vs. Dry Gas TOC Emissions
Figure 3.5-7. Average Wet Gas vs. Dry Gas VOC and HAP Emissions
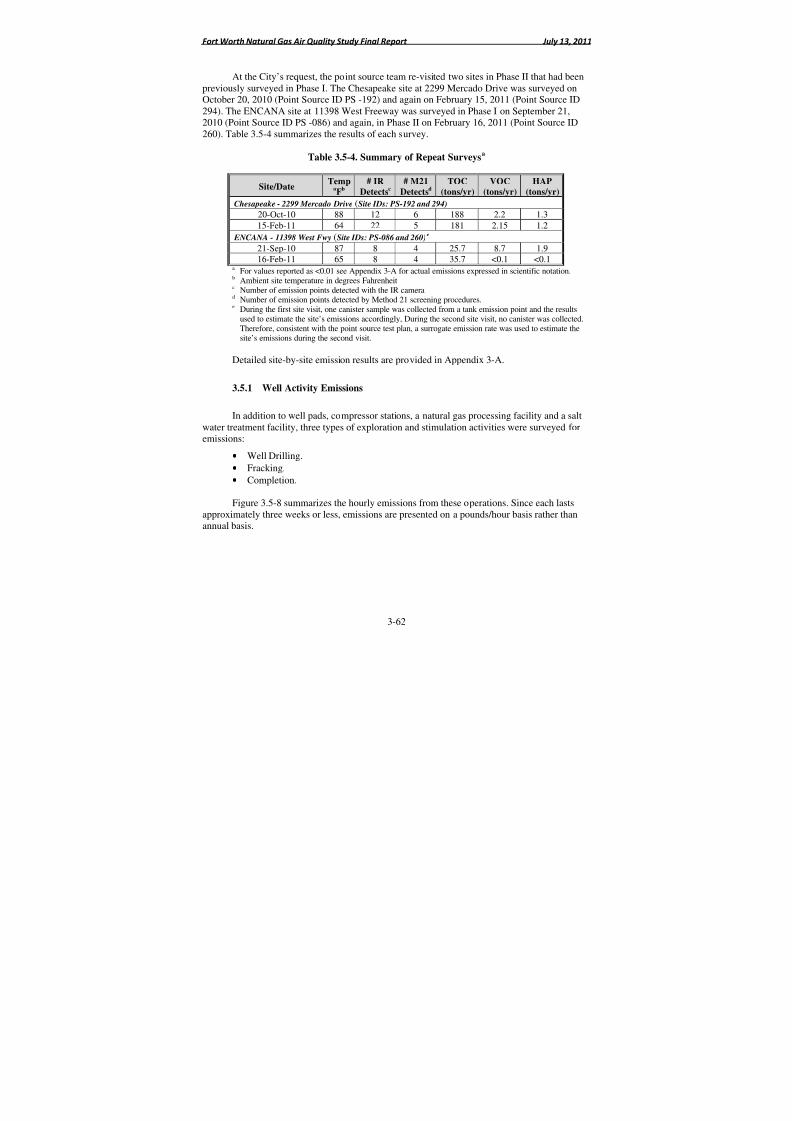
8/6/2019 Air Quality Study Final
http://slidepdf.com/reader/full/air-quality-study-final 152/320
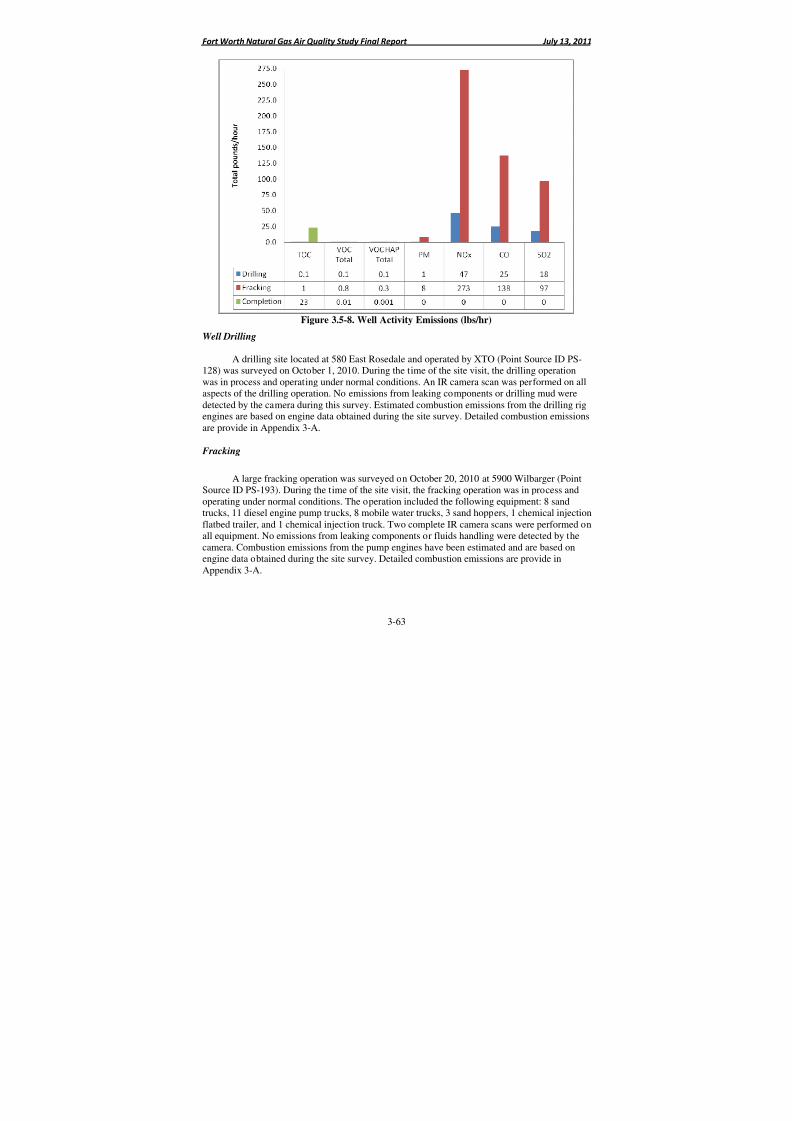
8/6/2019 Air Quality Study Final
http://slidepdf.com/reader/full/air-quality-study-final 153/320
Fort Worth Natural Gas Air Quality Study Final Report July 13, 2011
3-63
Figure 3.5-8. Well Activity Emissions (lbs/hr)
Well Drilling
A drilling site located at 580 East Rosedale and operated by XTO (Point Source ID PS-128) was surveyed on October 1, 2010. During the time of the site visit, the drilling operation
was in process and operating under normal conditions. An IR camera scan was performed on allaspects of the drilling operation. No emissions from leaking components or drilling mud weredetected by the camera during this survey. Estimated combustion emissions from the drilling rigengines are based on engine data obtained during the site survey. Detailed combustion emissionsare provide in Appendix 3-A.
Fracking
A large fracking operation was surveyed on October 20, 2010 at 5900 Wilbarger (PointSource ID PS-193). During the time of the site visit, the fracking operation was in process andoperating under normal conditions. The operation included the following equipment: 8 sandtrucks, 11 diesel engine pump trucks, 8 mobile water trucks, 3 sand hoppers, 1 chemical injectionflatbed trailer, and 1 chemical injection truck. Two complete IR camera scans were performed onall equipment. No emissions from leaking components or fluids handling were detected by thecamera. Combustion emissions from the pump engines have been estimated and are based onengine data obtained during the site survey. Detailed combustion emissions are provide inAppendix 3-A.
8/6/2019 Air Quality Study Final
http://slidepdf.com/reader/full/air-quality-study-final 154/320
Fort Worth Natural Gas Air Quality Study Final Report July 13, 2011
3-64
Well Completion
A flowback operation was surveyed by the point source team on October 5, 2010 at 5199Village Creek Road (Point Source ID PS-134). One emission point was detected with the IRcamera and five low level emission points were identified with the TVA during Method 21
screening while the flowback operation was in progress. Detailed emissions are provide inAppendix 3-A.
3.5.2 Method 21 TOC Screening Emission Factors
Emission factors for the Method 21 screening ranges 500-999 ppmv and 1,000 to10,000 ppmv were calculated for the equipment categories valves, connectors, and othersaccording to the procedures explained in Section 3.4.2. Unfortunately, an insufficient number of valves and other equipment were found with emissions in the 500 – 999 ppmv category (two andfour respectively) to derive reliable emission factors for this screening range. The remainingcategories however were sufficiently populated to enable the derivation of the emission factorsprovided in Table 3.5-5 below.
Table 3.5-5. TOC Screening Emission Factors
ConcentrationRange
Valves Connectors Other
500 – 999 ppmv __2.17E-04 kg/hr4.78E-04 lbs/hr
__
1000 – 10,000 ppmv1.10E-03 kg/hr2.43E-03 lbs/hr
4.70 E-04 kg/hr1.04E-03 lbs/hr
1.60E-02 kg/hr3.52E-02 lbs/hr
3.6 Quality Control Results
Point Source project Quality Assurance/Quality Control (QA\QC) was ensured throughboth field and analytical quality control procedures. Field QC procedures included:
• IR Camera Daily Demo.
• Hi Flow Sampler Daily Calibration Verification.
• TVA Daily Calibration and Drift Checks.
• Regular review of completed field data forms.
• Canister sampling protocols.
• Duplicate canister sample collection.
Analytical QC procedures included:
• Method Blanks.
• Surrogate Recoveries.
• Laboratory Control Samples and Control Sample Duplicates.
• Continuing Calibration Verification.
8/6/2019 Air Quality Study Final
http://slidepdf.com/reader/full/air-quality-study-final 155/320
Fort Worth Natural Gas Air Quality Study Final Report July 13, 2011
3-65
The results of the field QC checks are provided in the tables following. The results of theanalytical QC are provided with the TestAmerica™ laboratory reports in the Appendix 3-C.
3.6.1 IR Camera Daily Demo Results
Three IR cameras were used during this project. IR cameras “GasFindIR” and “GF-320were used continuously throughout the project. IR camera “Dexter” was used only for one day asa temporary replacement. The sensitivity of each IR camera was evaluated daily prior to testing(i.e. Daily Demo). The Daily Demo was performed at two flow rates: ~10 grams/hour propaneand ~30 grams/hour propane. The maximum distance from which the two flow rates could beobserved with the cameras was recorded together with current weather data. The results of the IRcamera daily demos are provided in Tables 3.6-1 through 3.6-5.
3.6.2 Hi Flow Sampler Calibration Verification
Three Hi Flow Samplers were used during the project. Hi Flow Samplers #QS1002 was used in
both Phase I and II. Hi Flow Sampler #QS 1005 was used in Phase I and was replaced in Phase IIwith Hi Flow Sampler #QX 1007. Each Hi Flow Sampler was calibrated at the start of Phase Iand Phase II testing using certified gas cylinders of 2.5% and 99% methane. A calibrationverification check of both background and sample sensors was performed daily prior to testingwith the 2.5% methane standard. Once each week the calibration verification check of bothsensors was performed with the 2.5% and the 99% methane gas standards with an acceptancecriterion of +/- 10% agreement. The results of Hi Flow Sampler daily calibration verificationchecks are summarized in Tables 3.6-6 through 3.6-9.
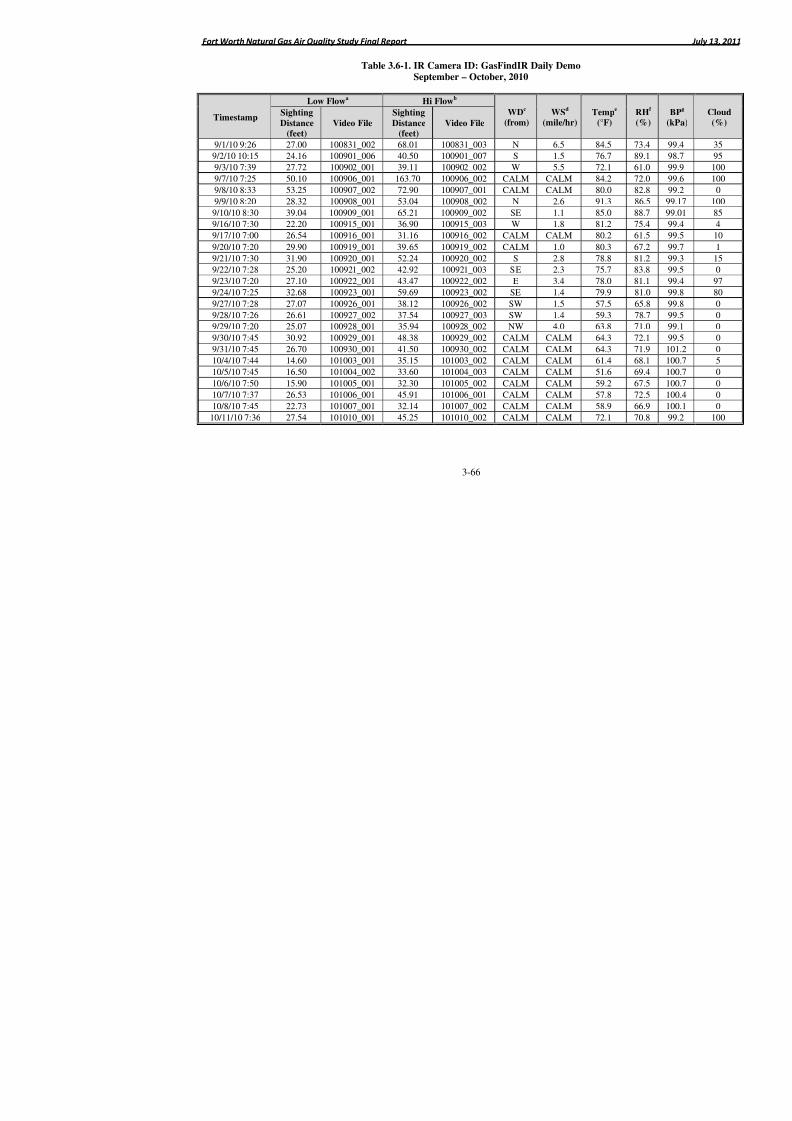
8/6/2019 Air Quality Study Final
http://slidepdf.com/reader/full/air-quality-study-final 156/320
Fort Worth Natural Gas Air Quality Study Final Report
3-66
Table 3.6-1. IR Camera ID: GasFindIR Daily DemoSeptember – October, 2010
Timestamp
Low Flowa
Hi Flowb
WDc
(from)
WSd
(mile/hr)
Tempe
(°F)
Sighting
Distance(feet) Video File
Sighting
Distance(feet) Video File
9/1/10 9:26 27.00 100831_002 68.01 100831_003 N 6.5 84.5
9/2/10 10:15 24.16 100901_006 40.50 100901_007 S 1.5 76.7
9/3/10 7:39 27.72 100902_001 39.11 100902_002 W 5.5 72.1
9/7/10 7:25 50.10 100906_001 163.70 100906_002 CALM CALM 84.2
9/8/10 8:33 53.25 100907_002 72.90 100907_001 CALM CALM 80.0
9/9/10 8:20 28.32 100908_001 53.04 100908_002 N 2.6 91.3
9/10/10 8:30 39.04 100909_001 65.21 100909_002 SE 1.1 85.0
9/16/10 7:30 22.20 100915_001 36.90 100915_003 W 1.8 81.2
9/17/10 7:00 26.54 100916_001 31.16 100916_002 CALM CALM 80.2
9/20/10 7:20 29.90 100919_001 39.65 100919_002 CALM 1.0 80.3
9/21/10 7:30 31.90 100920_001 52.24 100920_002 S 2.8 78.8
9/22/10 7:28 25.20 100921_002 42.92 100921_003 SE 2.3 75.7
9/23/10 7:20 27.10 100922_001 43.47 100922_002 E 3.4 78.0
9/24/10 7:25 32.68 100923_001 59.69 100923_002 SE 1.4 79.9
9/27/10 7:28 27.07 100926_001 38.12 100926_002 SW 1.5 57.5
9/28/10 7:26 26.61 100927_002 37.54 100927_003 SW 1.4 59.3
9/29/10 7:20 25.07 100928_001 35.94 100928_002 NW 4.0 63.8
9/30/10 7:45 30.92 100929_001 48.38 100929_002 CALM CALM 64.3
9/31/10 7:45 26.70 100930_001 41.50 100930_002 CALM CALM 64.3
10/4/10 7:44 14.60 101003_001 35.15 101003_002 CALM CALM 61.4
10/5/10 7:45 16.50 101004_002 33.60 101004_003 CALM CALM 51.6
10/6/10 7:50 15.90 101005_001 32.30 101005_002 CALM CALM 59.2
10/7/10 7:37 26.53 101006_001 45.91 101006_001 CALM CALM 57.8
10/8/10 7:45 22.73 101007_001 32.14 101007_002 CALM CALM 58.9
10/11/10 7:36 27.54 101010_001 45.25 101010_002 CALM CALM 72.1
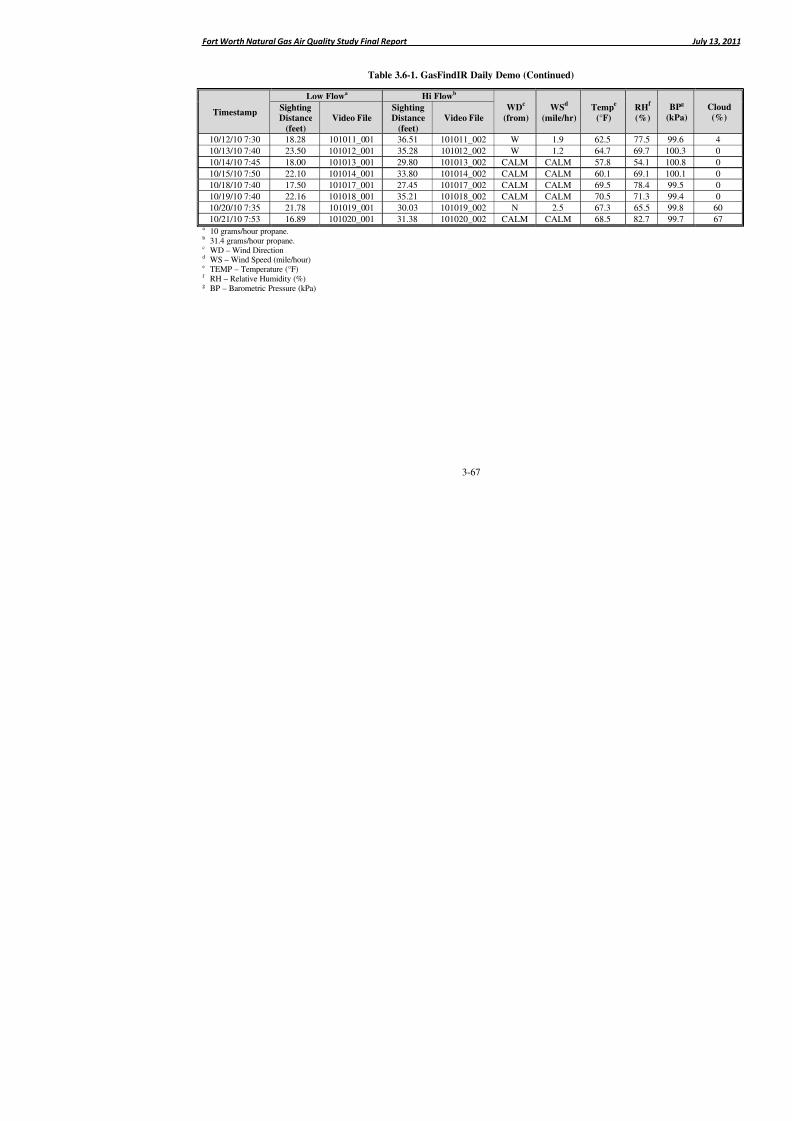
8/6/2019 Air Quality Study Final
http://slidepdf.com/reader/full/air-quality-study-final 157/320
Fort Worth Natural Gas Air Quality Study Final Report
3-67
Table 3.6-1. GasFindIR Daily Demo (Continued)
Timestamp
Low Flowa
Hi Flowb
WDc
(from)
WSd
(mile/hr)
Tempe
(°F)SightingDistance
(feet)
Video FileSightingDistance
(feet)
Video File
10/12/10 7:30 18.28 101011_001 36.51 101011_002 W 1.9 62.5
10/13/10 7:40 23.50 101012_001 35.28 101012_002 W 1.2 64.7
10/14/10 7:45 18.00 101013_001 29.80 101013_002 CALM CALM 57.8
10/15/10 7:50 22.10 101014_001 33.80 101014_002 CALM CALM 60.1
10/18/10 7:40 17.50 101017_001 27.45 101017_002 CALM CALM 69.5
10/19/10 7:40 22.16 101018_001 35.21 101018_002 CALM CALM 70.5
10/20/10 7:35 21.78 101019_001 30.03 101019_002 N 2.5 67.3
10/21/10 7:53 16.89 101020_001 31.38 101020_002 CALM CALM 68.5 a 10 grams/hour propane.b 31.4 grams/hour propane.c
WD – Wind Directiond WS – Wind Speed (mile/hour)e TEMP – Temperature (°F)f RH – Relative Humidity (%)g BP – Barometric Pressure (kPa)
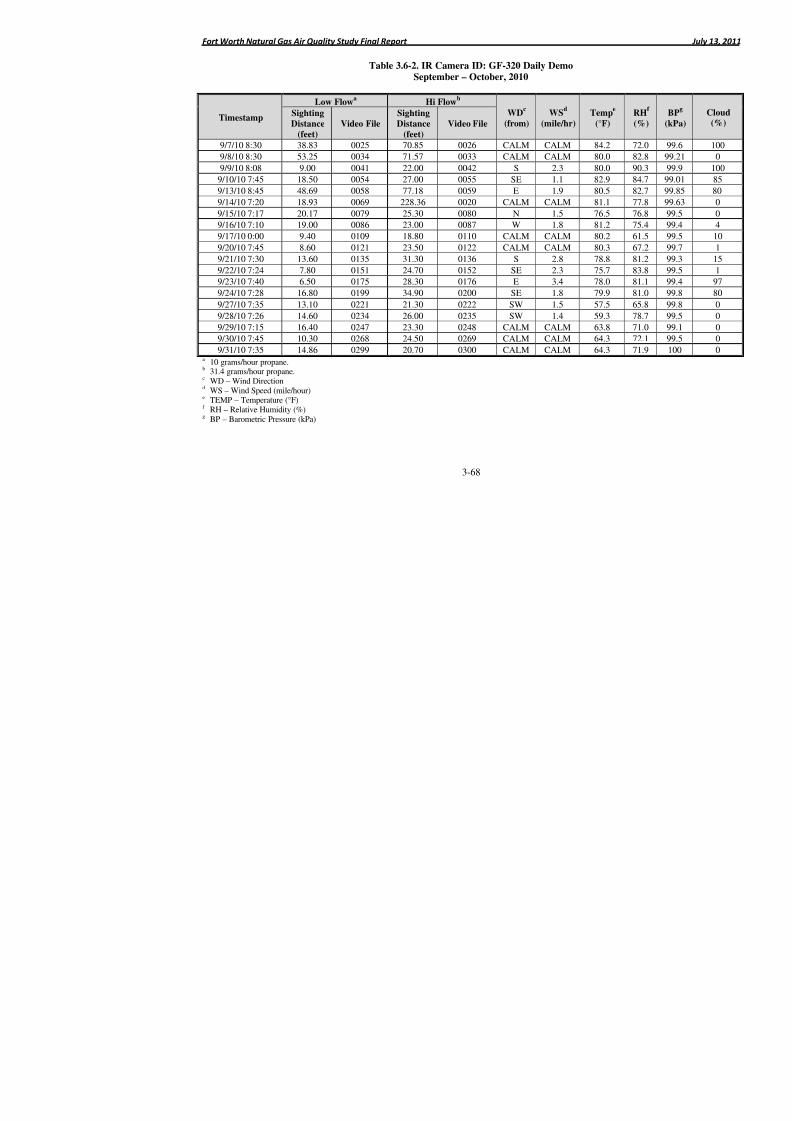
8/6/2019 Air Quality Study Final
http://slidepdf.com/reader/full/air-quality-study-final 158/320
Fort Worth Natural Gas Air Quality Study Final Report
3-68
Table 3.6-2. IR Camera ID: GF-320 Daily DemoSeptember – October, 2010
Timestamp
Low Flowa
Hi Flowb
WDc
(from)
WSd
(mile/hr)
Tempe
(°F)
Sighting
Distance(feet)
Video File
Sighting
Distance(feet)
Video File
9/7/10 8:30 38.83 0025 70.85 0026 CALM CALM 84.2
9/8/10 8:30 53.25 0034 71.57 0033 CALM CALM 80.0
9/9/10 8:08 9.00 0041 22.00 0042 S 2.3 80.0
9/10/10 7:45 18.50 0054 27.00 0055 SE 1.1 82.9
9/13/10 8:45 48.69 0058 77.18 0059 E 1.9 80.5
9/14/10 7:20 18.93 0069 228.36 0020 CALM CALM 81.1
9/15/10 7:17 20.17 0079 25.30 0080 N 1.5 76.5
9/16/10 7:10 19.00 0086 23.00 0087 W 1.8 81.2
9/17/10 0:00 9.40 0109 18.80 0110 CALM CALM 80.2
9/20/10 7:45 8.60 0121 23.50 0122 CALM CALM 80.3
9/21/10 7:30 13.60 0135 31.30 0136 S 2.8 78.8
9/22/10 7:24 7.80 0151 24.70 0152 SE 2.3 75.7
9/23/10 7:40 6.50 0175 28.30 0176 E 3.4 78.0
9/24/10 7:28 16.80 0199 34.90 0200 SE 1.8 79.9
9/27/10 7:35 13.10 0221 21.30 0222 SW 1.5 57.5
9/28/10 7:26 14.60 0234 26.00 0235 SW 1.4 59.3
9/29/10 7:15 16.40 0247 23.30 0248 CALM CALM 63.8
9/30/10 7:45 10.30 0268 24.50 0269 CALM CALM 64.3
9/31/10 7:35 14.86 0299 20.70 0300 CALM CALM 64.3 a 10 grams/hour propane.b 31.4 grams/hour propane.c WD – Wind Directiond WS – Wind Speed (mile/hour)e TEMP – Temperature (°F)f RH – Relative Humidity (%)g BP – Barometric Pressure (kPa)

8/6/2019 Air Quality Study Final
http://slidepdf.com/reader/full/air-quality-study-final 159/320
Fort Worth Natural Gas Air Quality Study Final Report
3-69
Table 3.6-2. GF-320 Daily Demo (Continued)
Timestamp
Low Flowa
Hi Flowb
WDc
(from)
WSd
(mile/hr)
Tempe
(°F)SightingDistance
(feet)
Video FileSightingDistance
(feet)
Video File
10/4/10 7:35 17.57 0313 30.80 0314 CALM CALM 61.4
10/5/10 7:35 13.42 0325 24.80 0326 CALM CALM 51.6
10/6/10 7:58 12.44 0345 21.00 0346 CALM CALM 59.2
10/7/10 7:32 29.78 0368 36.25 0372 CALM CALM 57.8
10/12/10 7:36 18.20 0423 24.20 0424 W 1.9 62.5
10/13/10 7:40 23.00 0436 31.00 0437 W 1.2 64.7
10/14/10 7:50 18.10 0460 26.60 0461 CALM CALM 57.4
10/15/10 7:50 17.00 0504 25.80 0505 CALM CALM 60.4
10/18/10 7:50 7.80 0506 14.60 0507 CALM CALM 69.5
10/18/10 7:55 12.02 0511 19.17 0512 CALM CALM 70.5
10/20/10 7:49 12.30 0529 24.60 0530 N 2.5 67.3
10/21/10 7:55 13.7 0549 23.9 0550 CALM CALM 68.5

8/6/2019 Air Quality Study Final
http://slidepdf.com/reader/full/air-quality-study-final 160/320
Fort Worth Natural Gas Air Quality Study Final Report
3-70
Table 3.6-3. IR Camera ID: Dexter Daily DemoSeptember – October, 2010
Timestamp
Low Flowa
Hi Flowb
WDc
(from)
WSd
(mile/hr)
Tempe
(°F)
Sighting
Distance(feet)
Video File
Sighting
Distance(feet)
Video File
9/15/10 7:45 3.00 VID0016 4.00 VID0015 N 1.5 76.5 a 10 grams/hour propane.b 31.4 grams/hour propane.c WD – Wind Directiond WS – Wind Speed (mile/hour)e TEMP – Temperature (°F)f RH – Relative Humidity (%)g BP – Barometric Pressure (kPa)
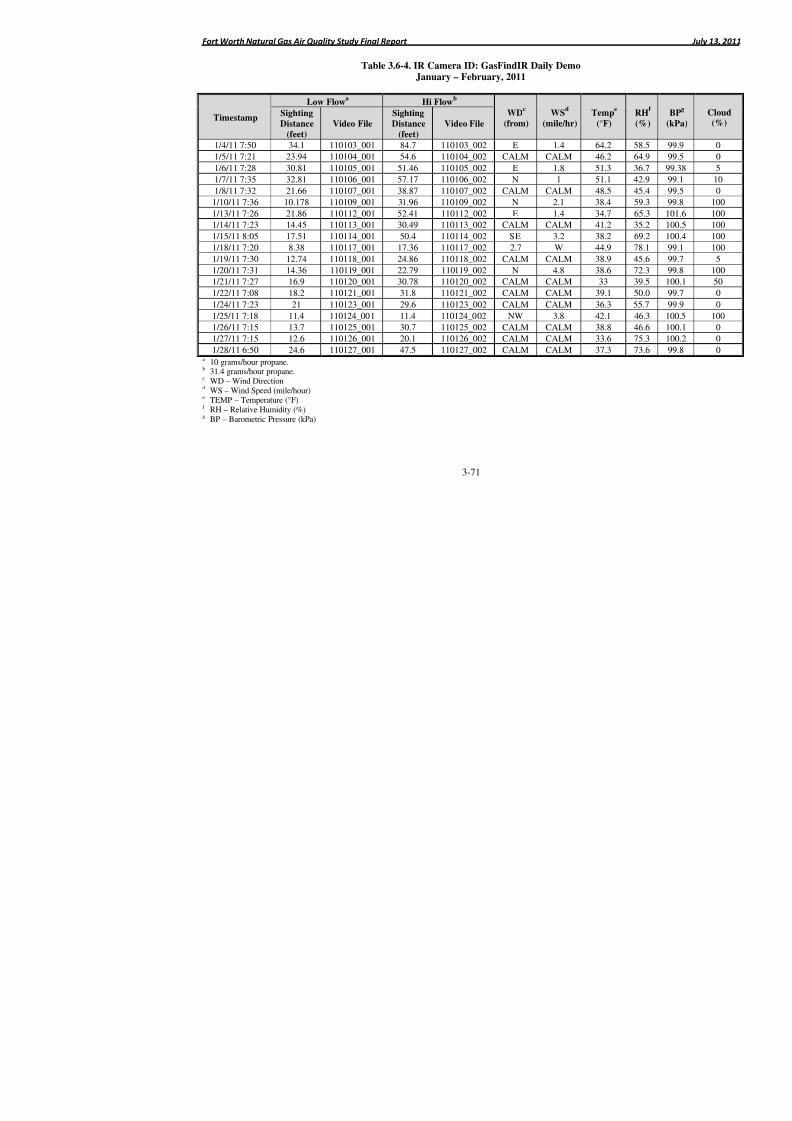
8/6/2019 Air Quality Study Final
http://slidepdf.com/reader/full/air-quality-study-final 161/320
Fort Worth Natural Gas Air Quality Study Final Report
3-71
Table 3.6-4. IR Camera ID: GasFindIR Daily DemoJanuary – February, 2011
Timestamp
Low Flowa
Hi Flowb
WDc
(from)
WSd
(mile/hr)
Tempe
(°F)
Sighting
Distance(feet)
Video File
Sighting
Distance(feet)
Video File
1/4/11 7:50 34.1 110103_001 84.7 110103_002 E 1.4 64.2
1/5/11 7:21 23.94 110104_001 54.6 110104_002 CALM CALM 46.2
1/6/11 7:28 30.81 110105_001 51.46 110105_002 E 1.8 51.3
1/7/11 7:35 32.81 110106_001 57.17 110106_002 N 1 51.1
1/8/11 7:32 21.66 110107_001 38.87 110107_002 CALM CALM 48.5
1/10/11 7:36 10.178 110109_001 31.96 110109_002 N 2.1 38.4
1/13/11 7:26 21.86 110112_001 52.41 110112_002 E 1.4 34.7
1/14/11 7:23 14.45 110113_001 30.49 110113_002 CALM CALM 41.2
1/15/11 8:05 17.51 110114_001 50.4 110114_002 SE 3.2 38.2
1/18/11 7:20 8.38 110117_001 17.36 110117_002 2.7 W 44.9
1/19/11 7:30 12.74 110118_001 24.86 110118_002 CALM CALM 38.9
1/20/11 7:31 14.36 110119_001 22.79 110119_002 N 4.8 38.6
1/21/11 7:27 16.9 110120_001 30.78 110120_002 CALM CALM 33
1/22/11 7:08 18.2 110121_001 31.8 110121_002 CALM CALM 39.1
1/24/11 7:23 21 110123_001 29.6 110123_002 CALM CALM 36.3
1/25/11 7:18 11.4 110124_001 11.4 110124_002 NW 3.8 42.1
1/26/11 7:15 13.7 110125_001 30.7 110125_002 CALM CALM 38.8
1/27/11 7:15 12.6 110126_001 20.1 110126_002 CALM CALM 33.6
1/28/11 6:50 24.6 110127_001 47.5 110127_002 CALM CALM 37.3 a 10 grams/hour propane.b 31.4 grams/hour propane.c WD – Wind Directiond WS – Wind Speed (mile/hour)e TEMP – Temperature (°F)f RH – Relative Humidity (%)g BP – Barometric Pressure (kPa)

8/6/2019 Air Quality Study Final
http://slidepdf.com/reader/full/air-quality-study-final 162/320
Fort Worth Natural Gas Air Quality Study Final Report
3-72
Table 3.6-4. GasFindIR Daily Demo (Continued)
Timestamp
Low Flowa
Hi Flowb
WDc
(from)
WSd
(mile/hr)
Tempe
(°F)Sighting
Distance
(feet)
Video File
Sighting
Distance
(feet)
Video File
1/31/11 7:25 39.7 110130_002 62.4 110130_003 NW 2.4 44.5
2/3/11 10:35 20.9 110202_001 44.1 110202_002 NW 5.2 20.5
2/5/11 11:15 41.3 110204_001 78.4 110204_002 W 2.4 51.5
2/6/11 8:14 26.5 110105_001 79.4 110205_002 CALM CALM 44.1
2/7/11 8:41 8 110206_001 21.3 110206_002 W 7.1 40.1
2/8/11 7:28 20.8 110207_001 35 110207_002 E 4.2 37.3
2/10/11 10:05 30.1 110209_001 52.7 110209_002 N 4.1 26.1
2/11/11 7:10 11.6 110210_001 20.6 110210_002 CALM CALM 30.6
2/14/11 7:17 51.3 110213_001 79.4 110213_002 CALM CALM 49.4
2/15/11 7:25 60 110214_001 130.9 110214_002 SE 2.3 59.8
2/16/11 7:28 41.1 110215_001 109.9 110215_002 S 6.8 64.3
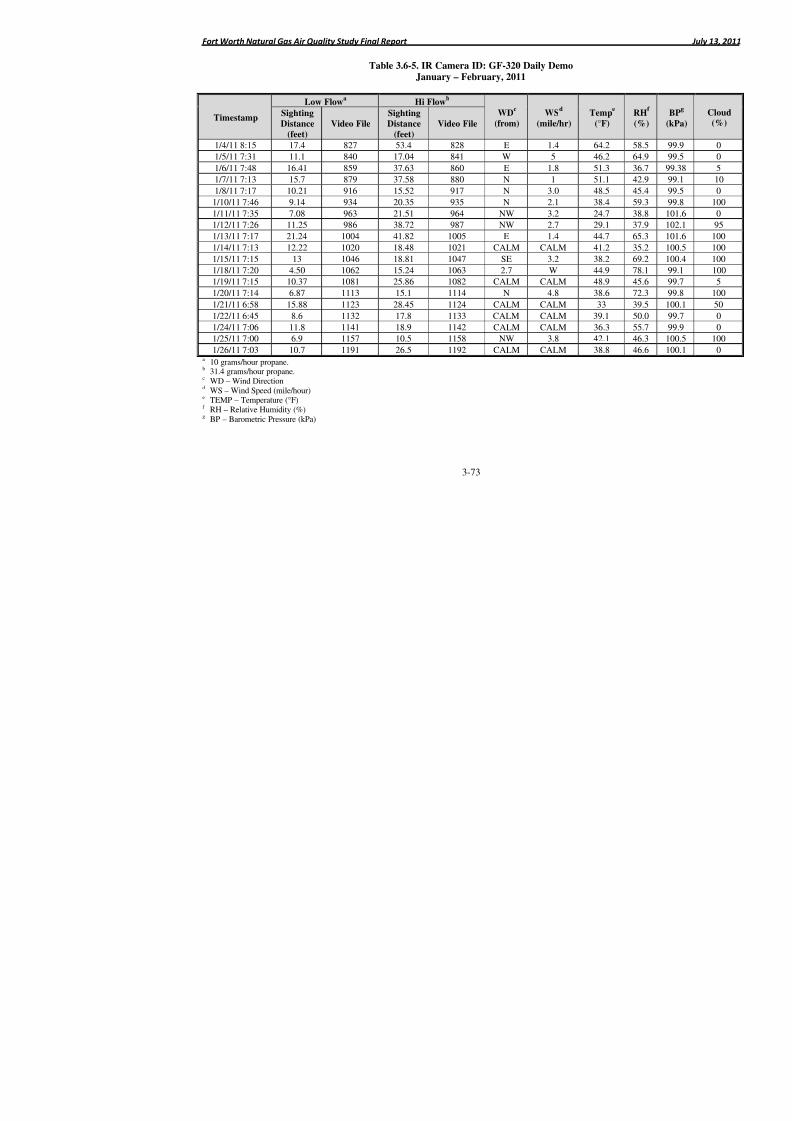
8/6/2019 Air Quality Study Final
http://slidepdf.com/reader/full/air-quality-study-final 163/320
Fort Worth Natural Gas Air Quality Study Final Report
3-73
Table 3.6-5. IR Camera ID: GF-320 Daily DemoJanuary – February, 2011
Timestamp
Low Flowa
Hi Flowb
WDc
(from)
WSd
(mile/hr)
Tempe
(°F)
Sighting
Distance(feet)
Video File
Sighting
Distance(feet)
Video File
1/4/11 8:15 17.4 827 53.4 828 E 1.4 64.2
1/5/11 7:31 11.1 840 17.04 841 W 5 46.2
1/6/11 7:48 16.41 859 37.63 860 E 1.8 51.3
1/7/11 7:13 15.7 879 37.58 880 N 1 51.1
1/8/11 7:17 10.21 916 15.52 917 N 3.0 48.5
1/10/11 7:46 9.14 934 20.35 935 N 2.1 38.4
1/11/11 7:35 7.08 963 21.51 964 NW 3.2 24.7
1/12/11 7:26 11.25 986 38.72 987 NW 2.7 29.1
1/13/11 7:17 21.24 1004 41.82 1005 E 1.4 44.7
1/14/11 7:13 12.22 1020 18.48 1021 CALM CALM 41.2
1/15/11 7:15 13 1046 18.81 1047 SE 3.2 38.2
1/18/11 7:20 4.50 1062 15.24 1063 2.7 W 44.9
1/19/11 7:15 10.37 1081 25.86 1082 CALM CALM 48.9
1/20/11 7:14 6.87 1113 15.1 1114 N 4.8 38.6
1/21/11 6:58 15.88 1123 28.45 1124 CALM CALM 33
1/22/11 6:45 8.6 1132 17.8 1133 CALM CALM 39.1
1/24/11 7:06 11.8 1141 18.9 1142 CALM CALM 36.3
1/25/11 7:00 6.9 1157 10.5 1158 NW 3.8 42.1
1/26/11 7:03 10.7 1191 26.5 1192 CALM CALM 38.8 a 10 grams/hour propane.b 31.4 grams/hour propane.c WD – Wind Directiond WS – Wind Speed (mile/hour)e TEMP – Temperature (°F)f RH – Relative Humidity (%)g BP – Barometric Pressure (kPa)

8/6/2019 Air Quality Study Final
http://slidepdf.com/reader/full/air-quality-study-final 164/320
Fort Worth Natural Gas Air Quality Study Final Report
3-74
Table 3.6-5. GF-320 Daily Demo (Continued)
Timestamp
Low Flowa
Hi Flowb
WDc
(from)
WSd
(mile/hr)
Temp
(°F)SightingDistance
(feet) Video File
SightingDistance
(feet)
Video File
1/27/11 7:07 8.8 1209 16 1210 CALM CALM 33.6
1/28/11 6:50 11.1 1223 22.4 1224 W 4.0 37.3
1/31/11 7:15 22.9 1247 53.6 1248 NW 2.4 44.5
2/3/11 10:17 14.4 1270 50.7 1271 NW 5.2 20.5
2/5/11 11:05 16.5 1283 35.9 1284 W 2.4 51.5
2/6/11 8:24 16.5 1287 32.4 1288 CALM CALM 44.1
2/7/11 8:30 5 1300 16.6 1301 W 7.1 40.1
2/8/11 7:15 12 1316 17.6 1317 E 4.2 37.3
2/10/11 9:57 10.5 1333 39.5 1334 N 4.1 26.1
2/11/11 7:00 12.7 1354 18.1 1355 CALM CALM 30.6
2/14/11 7:05 15.1 1370 51.2 1371 CALM CALM 49.4
2/15/11 7:08 10 1398 19.2 1399 SE 2.3 59.82/16/11 7:15 10.4 1413 19.3 1414 S 6.8 64.3
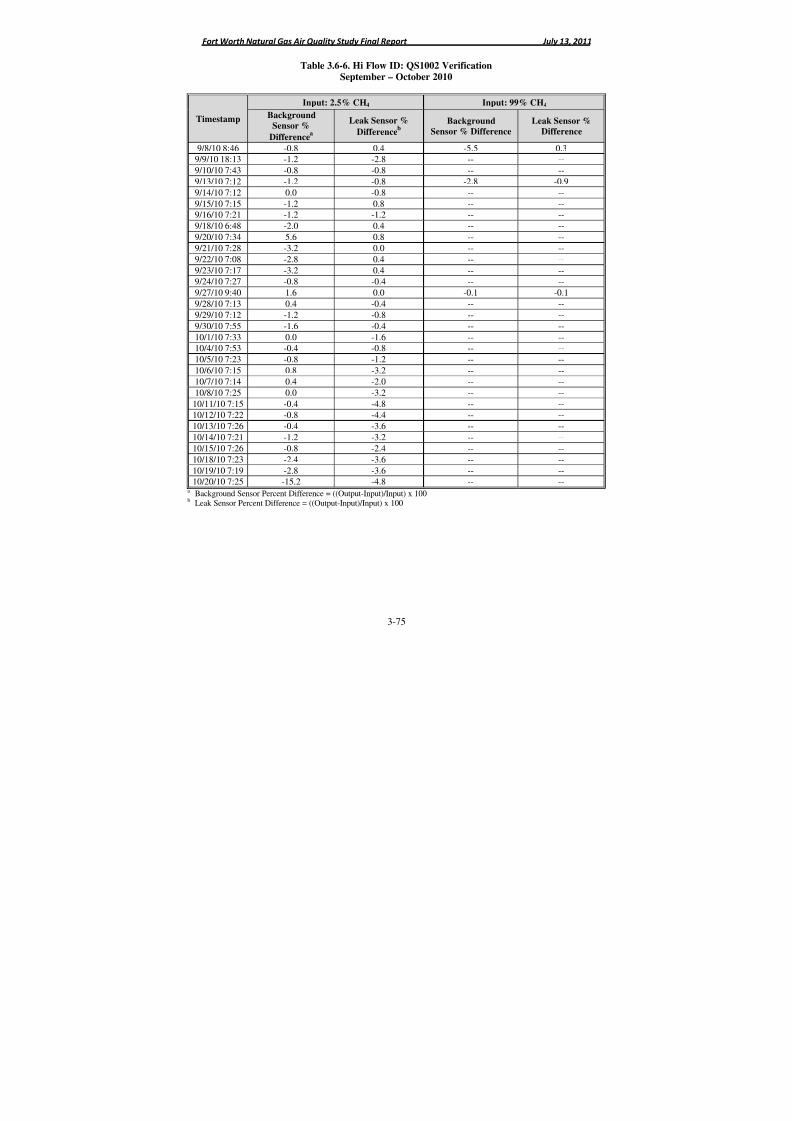
8/6/2019 Air Quality Study Final
http://slidepdf.com/reader/full/air-quality-study-final 165/320
Fort Worth Natural Gas Air Quality Study Final Report July 13, 2011
3-75
Table 3.6-6. Hi Flow ID: QS1002 VerificationSeptember – October 2010
Timestamp
Input: 2.5% CH4 Input: 99% CH4
Background
Sensor %Difference
a
Leak Sensor %
Differenceb
Background
Sensor % Difference
Leak Sensor %
Difference
9/8/10 8:46 -0.8 0.4 -5.5 0.3
9/9/10 18:13 -1.2 -2.8 -- --
9/10/10 7:43 -0.8 -0.8 -- --
9/13/10 7:12 -1.2 -0.8 -2.8 -0.9
9/14/10 7:12 0.0 -0.8 -- --
9/15/10 7:15 -1.2 0.8 -- --
9/16/10 7:21 -1.2 -1.2 -- --
9/18/10 6:48 -2.0 0.4 -- --
9/20/10 7:34 5.6 0.8 -- --
9/21/10 7:28 -3.2 0.0 -- --
9/22/10 7:08 -2.8 0.4 -- --
9/23/10 7:17 -3.2 0.4 -- --
9/24/10 7:27 -0.8 -0.4 -- --
9/27/10 9:40 1.6 0.0 -0.1 -0.1
9/28/10 7:13 0.4 -0.4 -- --
9/29/10 7:12 -1.2 -0.8 -- --
9/30/10 7:55 -1.6 -0.4 -- --
10/1/10 7:33 0.0 -1.6 -- --
10/4/10 7:53 -0.4 -0.8 -- --
10/5/10 7:23 -0.8 -1.2 -- --
10/6/10 7:15 0.8 -3.2 -- --
10/7/10 7:14 0.4 -2.0 -- --10/8/10 7:25 0.0 -3.2 -- --
10/11/10 7:15 -0.4 -4.8 -- --
10/12/10 7:22 -0.8 -4.4 -- --
10/13/10 7:26 -0.4 -3.6 -- --
10/14/10 7:21 -1.2 -3.2 -- --
10/15/10 7:26 -0.8 -2.4 -- --
10/18/10 7:23 -2.4 -3.6 -- --
10/19/10 7:19 -2.8 -3.6 -- --
10/20/10 7:25 -15.2 -4.8 -- --a Background Sensor Percent Difference = ((Output-Input)/Input) x 100b
Leak Sensor Percent Difference = ((Output-Input)/Input) x 100
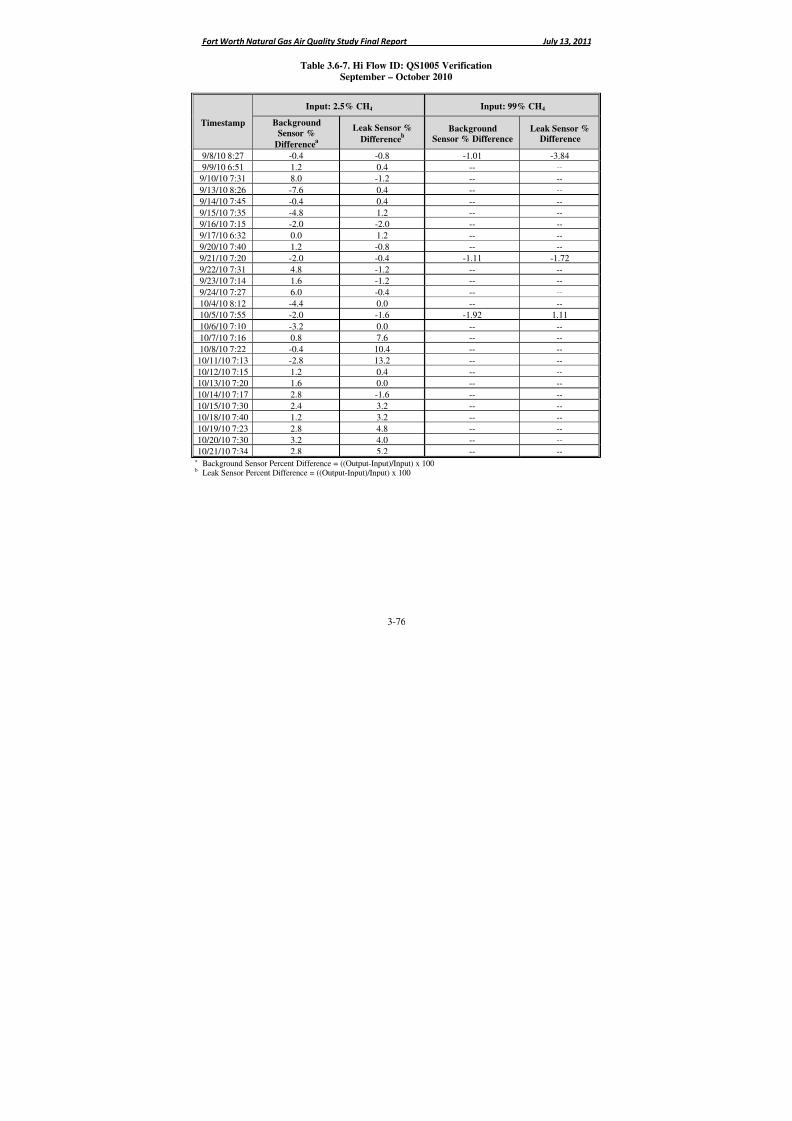
8/6/2019 Air Quality Study Final
http://slidepdf.com/reader/full/air-quality-study-final 166/320
Fort Worth Natural Gas Air Quality Study Final Report July 13, 2011
3-76
Table 3.6-7. Hi Flow ID: QS1005 VerificationSeptember – October 2010
Timestamp
Input: 2.5% CH4 Input: 99% CH4
BackgroundSensor %
Differencea
Leak Sensor %Difference
b
BackgroundSensor % Difference
Leak Sensor %Difference
9/8/10 8:27 -0.4 -0.8 -1.01 -3.84
9/9/10 6:51 1.2 0.4 -- --
9/10/10 7:31 8.0 -1.2 -- --
9/13/10 8:26 -7.6 0.4 -- --
9/14/10 7:45 -0.4 0.4 -- --
9/15/10 7:35 -4.8 1.2 -- --
9/16/10 7:15 -2.0 -2.0 -- --
9/17/10 6:32 0.0 1.2 -- --
9/20/10 7:40 1.2 -0.8 -- --
9/21/10 7:20 -2.0 -0.4 -1.11 -1.72
9/22/10 7:31 4.8 -1.2 -- --
9/23/10 7:14 1.6 -1.2 -- --
9/24/10 7:27 6.0 -0.4 -- --
10/4/10 8:12 -4.4 0.0 -- --
10/5/10 7:55 -2.0 -1.6 -1.92 1.11
10/6/10 7:10 -3.2 0.0 -- --
10/7/10 7:16 0.8 7.6 -- --
10/8/10 7:22 -0.4 10.4 -- --
10/11/10 7:13 -2.8 13.2 -- --
10/12/10 7:15 1.2 0.4 -- --
10/13/10 7:20 1.6 0.0 -- --10/14/10 7:17 2.8 -1.6 -- --
10/15/10 7:30 2.4 3.2 -- --
10/18/10 7:40 1.2 3.2 -- --
10/19/10 7:23 2.8 4.8 -- --
10/20/10 7:30 3.2 4.0 -- --
10/21/10 7:34 2.8 5.2 -- --a Background Sensor Percent Difference = ((Output-Input)/Input) x 100b Leak Sensor Percent Difference = ((Output-Input)/Input) x 100
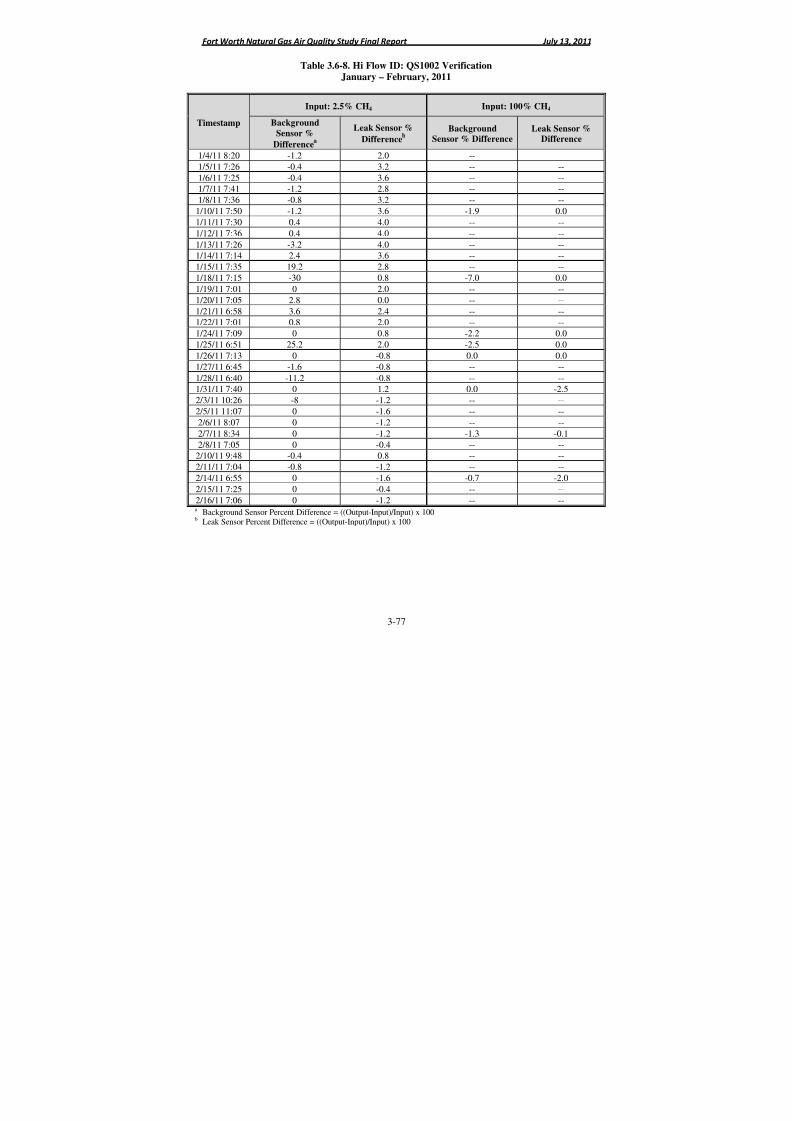
8/6/2019 Air Quality Study Final
http://slidepdf.com/reader/full/air-quality-study-final 167/320
Fort Worth Natural Gas Air Quality Study Final Report July 13, 2011
3-77
Table 3.6-8. Hi Flow ID: QS1002 VerificationJanuary – February, 2011
Timestamp
Input: 2.5% CH4 Input: 100% CH4
BackgroundSensor %
Differencea
Leak Sensor %Difference
b
BackgroundSensor % Difference
Leak Sensor %Difference
1/4/11 8:20 -1.2 2.0 -- --
1/5/11 7:26 -0.4 3.2 -- --
1/6/11 7:25 -0.4 3.6 -- --
1/7/11 7:41 -1.2 2.8 -- --
1/8/11 7:36 -0.8 3.2 -- --
1/10/11 7:50 -1.2 3.6 -1.9 0.0
1/11/11 7:30 0.4 4.0 -- --
1/12/11 7:36 0.4 4.0 -- --
1/13/11 7:26 -3.2 4.0 -- --
1/14/11 7:14 2.4 3.6 -- --1/15/11 7:35 19.2 2.8 -- --
1/18/11 7:15 -30 0.8 -7.0 0.0
1/19/11 7:01 0 2.0 -- --
1/20/11 7:05 2.8 0.0 -- --
1/21/11 6:58 3.6 2.4 -- --
1/22/11 7:01 0.8 2.0 -- --
1/24/11 7:09 0 0.8 -2.2 0.0
1/25/11 6:51 25.2 2.0 -2.5 0.0
1/26/11 7:13 0 -0.8 0.0 0.0
1/27/11 6:45 -1.6 -0.8 -- --
1/28/11 6:40 -11.2 -0.8 -- --1/31/11 7:40 0 1.2 0.0 -2.5
2/3/11 10:26 -8 -1.2 -- --
2/5/11 11:07 0 -1.6 -- --
2/6/11 8:07 0 -1.2 -- --
2/7/11 8:34 0 -1.2 -1.3 -0.1
2/8/11 7:05 0 -0.4 -- --
2/10/11 9:48 -0.4 0.8 -- --
2/11/11 7:04 -0.8 -1.2 -- --
2/14/11 6:55 0 -1.6 -0.7 -2.0
2/15/11 7:25 0 -0.4 -- --
2/16/11 7:06 0 -1.2 -- --a Background Sensor Percent Difference = ((Output-Input)/Input) x 100b Leak Sensor Percent Difference = ((Output-Input)/Input) x 100
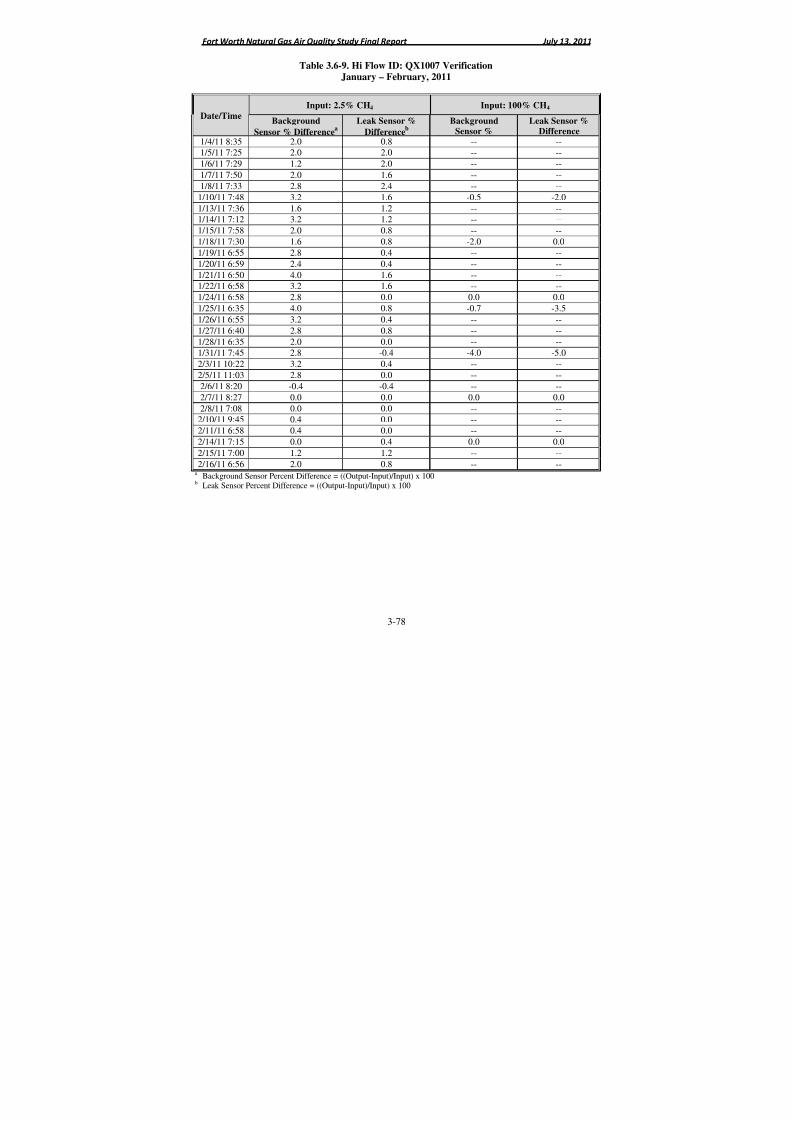
8/6/2019 Air Quality Study Final
http://slidepdf.com/reader/full/air-quality-study-final 168/320
Fort Worth Natural Gas Air Quality Study Final Report July 13, 2011
3-78
Table 3.6-9. Hi Flow ID: QX1007 VerificationJanuary – February, 2011
Date/Time
Input: 2.5% CH4 Input: 100% CH4
Background
Sensor % Differencea
Leak Sensor %
Differenceb
BackgroundSensor %
Leak Sensor %Difference
1/4/11 8:35 2.0 0.8 -- --
1/5/11 7:25 2.0 2.0 -- --
1/6/11 7:29 1.2 2.0 -- --
1/7/11 7:50 2.0 1.6 -- --
1/8/11 7:33 2.8 2.4 -- --
1/10/11 7:48 3.2 1.6 -0.5 -2.0
1/13/11 7:36 1.6 1.2 -- --
1/14/11 7:12 3.2 1.2 -- --
1/15/11 7:58 2.0 0.8 -- --
1/18/11 7:30 1.6 0.8 -2.0 0.0
1/19/11 6:55 2.8 0.4 -- --1/20/11 6:59 2.4 0.4 -- --
1/21/11 6:50 4.0 1.6 -- --
1/22/11 6:58 3.2 1.6 -- --
1/24/11 6:58 2.8 0.0 0.0 0.0
1/25/11 6:35 4.0 0.8 -0.7 -3.5
1/26/11 6:55 3.2 0.4 -- --
1/27/11 6:40 2.8 0.8 -- --
1/28/11 6:35 2.0 0.0 -- --
1/31/11 7:45 2.8 -0.4 -4.0 -5.0
2/3/11 10:22 3.2 0.4 -- --
2/5/11 11:03 2.8 0.0 -- --
2/6/11 8:20 -0.4 -0.4 -- --
2/7/11 8:27 0.0 0.0 0.0 0.0
2/8/11 7:08 0.0 0.0 -- --
2/10/11 9:45 0.4 0.0 -- --
2/11/11 6:58 0.4 0.0 -- --
2/14/11 7:15 0.0 0.4 0.0 0.0
2/15/11 7:00 1.2 1.2 -- --
2/16/11 6:56 2.0 0.8 -- --a Background Sensor Percent Difference = ((Output-Input)/Input) x 100b Leak Sensor Percent Difference = ((Output-Input)/Input) x 100
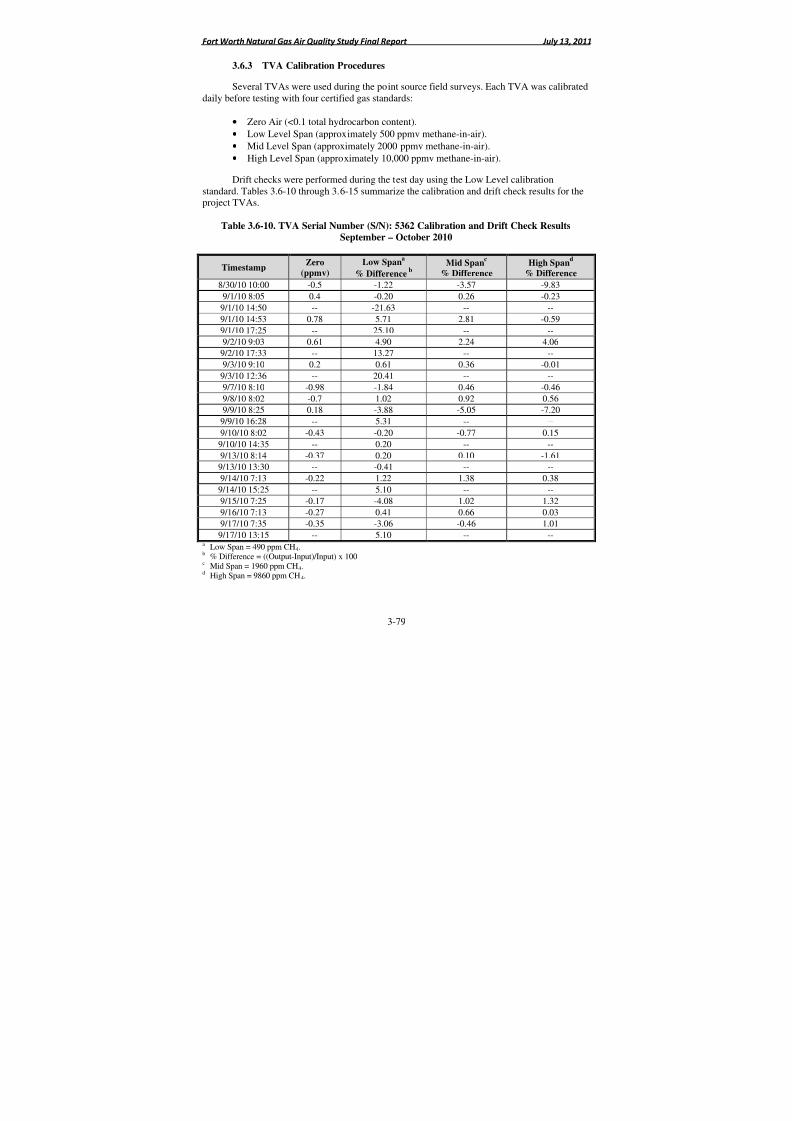
8/6/2019 Air Quality Study Final
http://slidepdf.com/reader/full/air-quality-study-final 169/320
Fort Worth Natural Gas Air Quality Study Final Report July 13, 2011
3-79
3.6.3 TVA Calibration Procedures
Several TVAs were used during the point source field surveys. Each TVA was calibrateddaily before testing with four certified gas standards:
• Zero Air (<0.1 total hydrocarbon content).
• Low Level Span (approximately 500 ppmv methane-in-air).
• Mid Level Span (approximately 2000 ppmv methane-in-air).
• High Level Span (approximately 10,000 ppmv methane-in-air).
Drift checks were performed during the test day using the Low Level calibrationstandard. Tables 3.6-10 through 3.6-15 summarize the calibration and drift check results for theproject TVAs.
Table 3.6-10. TVA Serial Number (S/N): 5362 Calibration and Drift Check Results
September – October 2010
TimestampZero
(ppmv)
Low Spana
% Differenceb
Mid Spanc
% Difference
High Spand
% Difference
8/30/10 10:00 -0.5 -1.22 -3.57 -9.83
9/1/10 8:05 0.4 -0.20 0.26 -0.23
9/1/10 14:50 -- -21.63 -- --
9/1/10 14:53 0.78 5.71 2.81 -0.59
9/1/10 17:25 -- 25.10 -- --
9/2/10 9:03 0.61 4.90 2.24 4.06
9/2/10 17:33 -- 13.27 -- --
9/3/10 9:10 0.2 0.61 0.36 -0.01
9/3/10 12:36 -- 20.41 -- --9/7/10 8:10 -0.98 -1.84 0.46 -0.46
9/8/10 8:02 -0.7 1.02 0.92 0.56
9/9/10 8:25 0.18 -3.88 -5.05 -7.20
9/9/10 16:28 -- 5.31 -- --
9/10/10 8:02 -0.43 -0.20 -0.77 0.15
9/10/10 14:35 -- 0.20 -- --
9/13/10 8:14 -0.37 0.20 0.10 -1.61
9/13/10 13:30 -- -0.41 -- --
9/14/10 7:13 -0.22 1.22 1.38 0.38
9/14/10 15:25 -- 5.10 -- --
9/15/10 7:25 -0.17 -4.08 1.02 1.32
9/16/10 7:13 -0.27 0.41 0.66 0.03
9/17/10 7:35 -0.35 -3.06 -0.46 1.01
9/17/10 13:15 -- 5.10 -- --a Low Span = 490 ppm CH4.b % Difference = ((Output-Input)/Input) x 100c Mid Span = 1960 ppm CH4.d High Span = 9860 ppm CH4.
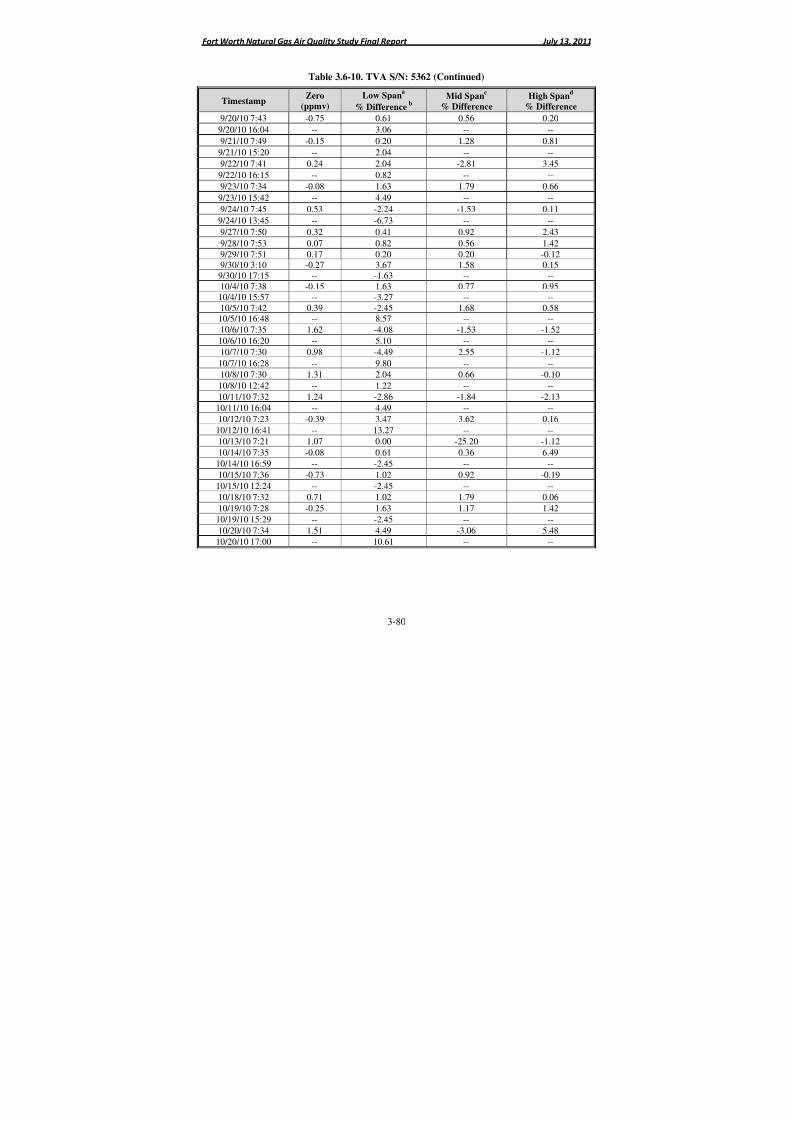
8/6/2019 Air Quality Study Final
http://slidepdf.com/reader/full/air-quality-study-final 170/320
Fort Worth Natural Gas Air Quality Study Final Report July 13, 2011
3-80
Table 3.6-10. TVA S/N: 5362 (Continued)
TimestampZero
(ppmv)
Low Spana
% Differenceb
Mid Spanc
% Difference
High Spand
% Difference
9/20/10 7:43 -0.75 0.61 0.56 0.20
9/20/10 16:04 -- 3.06 -- --9/21/10 7:49 -0.15 0.20 1.28 0.81
9/21/10 15:20 -- 2.04 -- --
9/22/10 7:41 0.24 2.04 -2.81 3.45
9/22/10 16:15 -- 0.82 -- --
9/23/10 7:34 -0.08 1.63 1.79 0.66
9/23/10 15:42 -- 4.49 -- --
9/24/10 7:45 0.53 -2.24 -1.53 0.11
9/24/10 13:45 -- -6.73 -- --
9/27/10 7:50 0.32 0.41 0.92 2.43
9/28/10 7:53 0.07 0.82 0.56 1.42
9/29/10 7:51 0.17 0.20 0.20 -0.129/30/10 3:10 -0.27 3.67 1.58 0.159/30/10 17:15 -- -1.63 -- --10/4/10 7:38 -0.15 1.63 0.77 0.9510/4/10 15:57 -- -3.27 -- --10/5/10 7:42 0.39 -2.45 1.68 0.5810/5/10 16:48 -- 8.57 -- --
10/6/10 7:35 1.62 -4.08 -1.53 -1.52
10/6/10 16:20 -- 5.10 -- --
10/7/10 7:30 0.98 -4.49 2.55 -1.12
10/7/10 16:28 -- 9.80 -- --
10/8/10 7:30 1.31 2.04 0.66 -0.10
10/8/10 12:42 -- 1.22 -- --
10/11/10 7:32 1.24 -2.86 -1.84 -2.13
10/11/10 16:04 -- 4.49 -- --
10/12/10 7:23 -0.39 3.47 3.62 0.16
10/12/10 16:41 -- 13.27 -- --
10/13/10 7:21 1.07 0.00 -25.20 -1.12
10/14/10 7:35 -0.08 0.61 0.36 6.49
10/14/10 16:59 -- -2.45 -- --
10/15/10 7:36 -0.73 1.02 0.92 -0.19
10/15/10 12:24 -- -2.45 -- --
10/18/10 7:32 0.71 1.02 1.79 0.06
10/19/10 7:28 -0.25 1.63 1.17 1.4210/19/10 15:29 -- -2.45 -- --
10/20/10 7:34 1.51 4.49 -3.06 5.48
10/20/10 17:00 -- 10.61 -- --

8/6/2019 Air Quality Study Final
http://slidepdf.com/reader/full/air-quality-study-final 171/320
Fort Worth Natural Gas Air Quality Study Final Report July 13, 2011
3-81
Table 3.6-11. TVA S/N: K10419 Calibration and Drift Check ResultsSeptember – October 2010
TimestampZero
(ppmv)
Low Spana
% Differenceb
Mid Spanc
% Difference
High Spand
% Difference
9/1/10 8:10 0.85 0.0 -0.3 -0.99/2/10 8:59 1.8 -0.6 -1.3 2.4
9/3/10 9:10 -0.46 1.8 1.1 1.4
9/3/10 12:36 -- -6.5 -- --
9/7/10 8:10 -0.63 -0.2 0.3 0.1
9/8/10 7:54 -0.26 0.8 -0.6 -0.2
9/9/10 7:34 1.9 0.6 0.2 0.3
9/10/10 8:10 1.13 1.0 1.0 0.4
9/13/10 7:23 0.47 -0.4 0.3 --
9/13/10 7:23 -1.33 -0.6 -0.3 1.0
9/14/10 7:25 -0.19 -1.0 1.2 0.2a Low Span = 490 ppm CH4.b % Difference = ((Output-Input)/Input) x 100c Mid Span = 1960 ppm CH4.d High Span = 9860 ppm CH4.
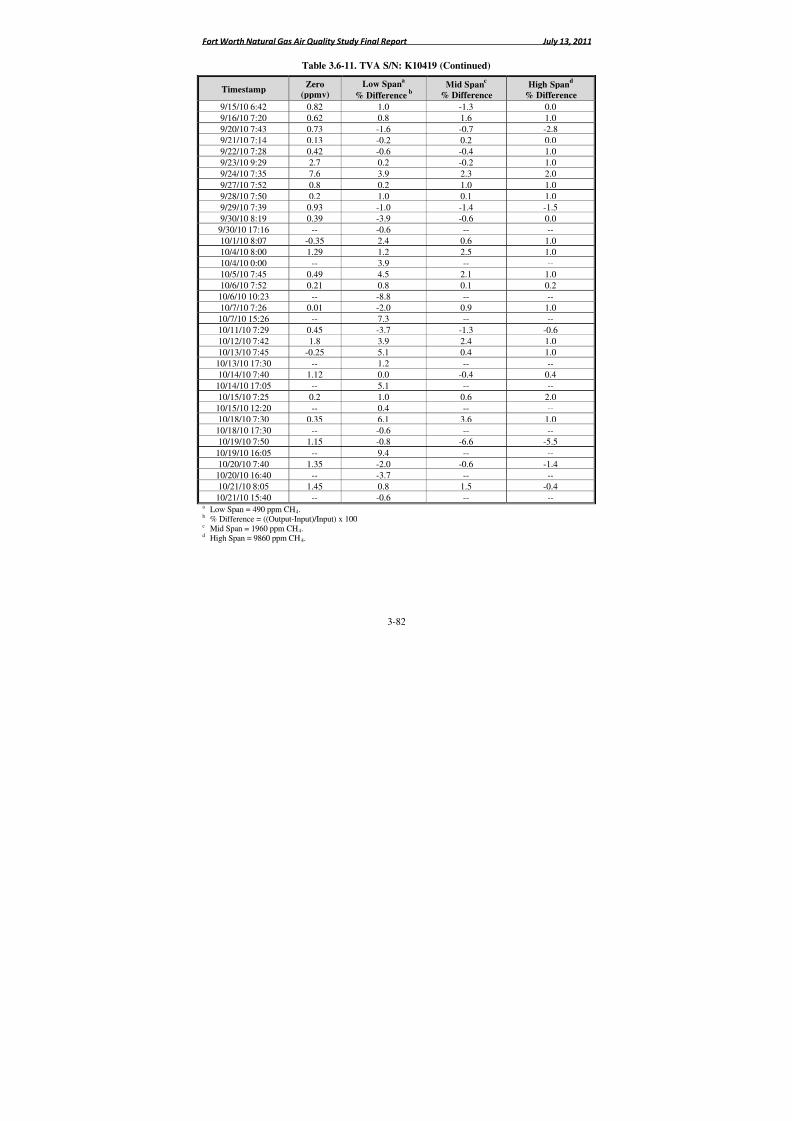
8/6/2019 Air Quality Study Final
http://slidepdf.com/reader/full/air-quality-study-final 172/320
Fort Worth Natural Gas Air Quality Study Final Report July 13, 2011
3-82
Table 3.6-11. TVA S/N: K10419 (Continued)
TimestampZero
(ppmv)
Low Spana
% Differenceb
Mid Spanc
% Difference
High Spand
% Difference
9/15/10 6:42 0.82 1.0 -1.3 0.0
9/16/10 7:20 0.62 0.8 1.6 1.0
9/20/10 7:43 0.73 -1.6 -0.7 -2.89/21/10 7:14 0.13 -0.2 0.2 0.0
9/22/10 7:28 0.42 -0.6 -0.4 1.0
9/23/10 9:29 2.7 0.2 -0.2 1.0
9/24/10 7:35 7.6 3.9 2.3 2.0
9/27/10 7:52 0.8 0.2 1.0 1.0
9/28/10 7:50 0.2 1.0 0.1 1.0
9/29/10 7:39 0.93 -1.0 -1.4 -1.5
9/30/10 8:19 0.39 -3.9 -0.6 0.0
9/30/10 17:16 -- -0.6 -- --
10/1/10 8:07 -0.35 2.4 0.6 1.0
10/4/10 8:00 1.29 1.2 2.5 1.010/4/10 0:00 -- 3.9 -- --
10/5/10 7:45 0.49 4.5 2.1 1.0
10/6/10 7:52 0.21 0.8 0.1 0.2
10/6/10 10:23 -- -8.8 -- --
10/7/10 7:26 0.01 -2.0 0.9 1.0
10/7/10 15:26 -- 7.3 -- --
10/11/10 7:29 0.45 -3.7 -1.3 -0.6
10/12/10 7:42 1.8 3.9 2.4 1.0
10/13/10 7:45 -0.25 5.1 0.4 1.0
10/13/10 17:30 -- 1.2 -- --
10/14/10 7:40 1.12 0.0 -0.4 0.4
10/14/10 17:05 -- 5.1 -- --
10/15/10 7:25 0.2 1.0 0.6 2.0
10/15/10 12:20 -- 0.4 -- --
10/18/10 7:30 0.35 6.1 3.6 1.0
10/18/10 17:30 -- -0.6 -- --
10/19/10 7:50 1.15 -0.8 -6.6 -5.5
10/19/10 16:05 -- 9.4 -- --
10/20/10 7:40 1.35 -2.0 -0.6 -1.4
10/20/10 16:40 -- -3.7 -- --
10/21/10 8:05 1.45 0.8 1.5 -0.4
10/21/10 15:40 -- -0.6 -- --a Low Span = 490 ppm CH4.b % Difference = ((Output-Input)/Input) x 100c Mid Span = 1960 ppm CH4.d High Span = 9860 ppm CH4.
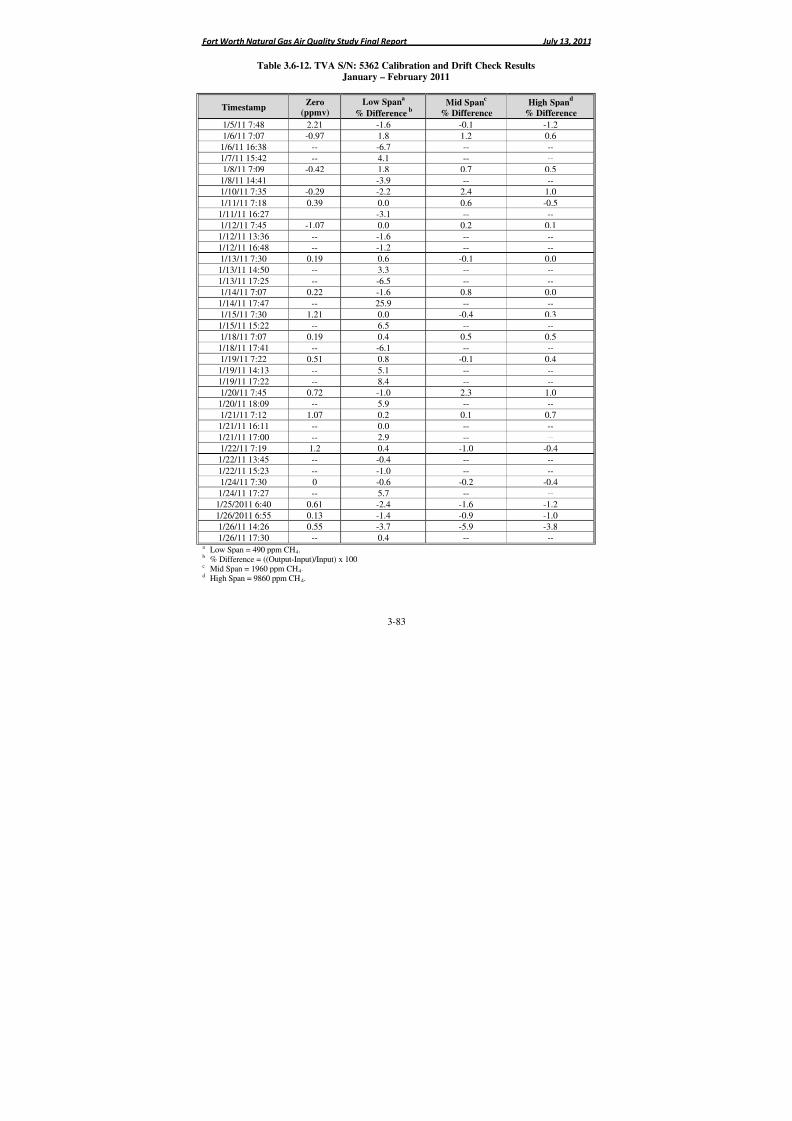
8/6/2019 Air Quality Study Final
http://slidepdf.com/reader/full/air-quality-study-final 173/320
Fort Worth Natural Gas Air Quality Study Final Report July 13, 2011
3-83
Table 3.6-12. TVA S/N: 5362 Calibration and Drift Check ResultsJanuary – February 2011
TimestampZero
(ppmv)
Low Spana
% Differenceb
Mid Spanc
% Difference
High Spand
% Difference
1/5/11 7:48 2.21 -1.6 -0.1 -1.21/6/11 7:07 -0.97 1.8 1.2 0.6
1/6/11 16:38 -- -6.7 -- --
1/7/11 15:42 -- 4.1 -- --
1/8/11 7:09 -0.42 1.8 0.7 0.5
1/8/11 14:41 -3.9 -- --
1/10/11 7:35 -0.29 -2.2 2.4 1.0
1/11/11 7:18 0.39 0.0 0.6 -0.5
1/11/11 16:27 -3.1 -- --
1/12/11 7:45 -1.07 0.0 0.2 0.1
1/12/11 13:36 -- -1.6 -- --
1/12/11 16:48 -- -1.2 -- --
1/13/11 7:30 0.19 0.6 -0.1 0.0
1/13/11 14:50 -- 3.3 -- --
1/13/11 17:25 -- -6.5 -- --
1/14/11 7:07 0.22 -1.6 0.8 0.0
1/14/11 17:47 -- 25.9 -- --
1/15/11 7:30 1.21 0.0 -0.4 0.3
1/15/11 15:22 -- 6.5 -- --
1/18/11 7:07 0.19 0.4 0.5 0.5
1/18/11 17:41 -- -6.1 -- --
1/19/11 7:22 0.51 0.8 -0.1 0.4
1/19/11 14:13 -- 5.1 -- --
1/19/11 17:22 -- 8.4 -- --1/20/11 7:45 0.72 -1.0 2.3 1.0
1/20/11 18:09 -- 5.9 -- --
1/21/11 7:12 1.07 0.2 0.1 0.7
1/21/11 16:11 -- 0.0 -- --
1/21/11 17:00 -- 2.9 -- --
1/22/11 7:19 1.2 0.4 -1.0 -0.4
1/22/11 13:45 -- -0.4 -- --
1/22/11 15:23 -- -1.0 -- --
1/24/11 7:30 0 -0.6 -0.2 -0.4
1/24/11 17:27 -- 5.7 -- --
1/25/2011 6:40 0.61 -2.4 -1.6 -1.21/26/2011 6:55 0.13 -1.4 -0.9 -1.0
1/26/11 14:26 0.55 -3.7 -5.9 -3.8
1/26/11 17:30 -- 0.4 -- --a Low Span = 490 ppm CH4.b % Difference = ((Output-Input)/Input) x 100c Mid Span = 1960 ppm CH4.d High Span = 9860 ppm CH4.
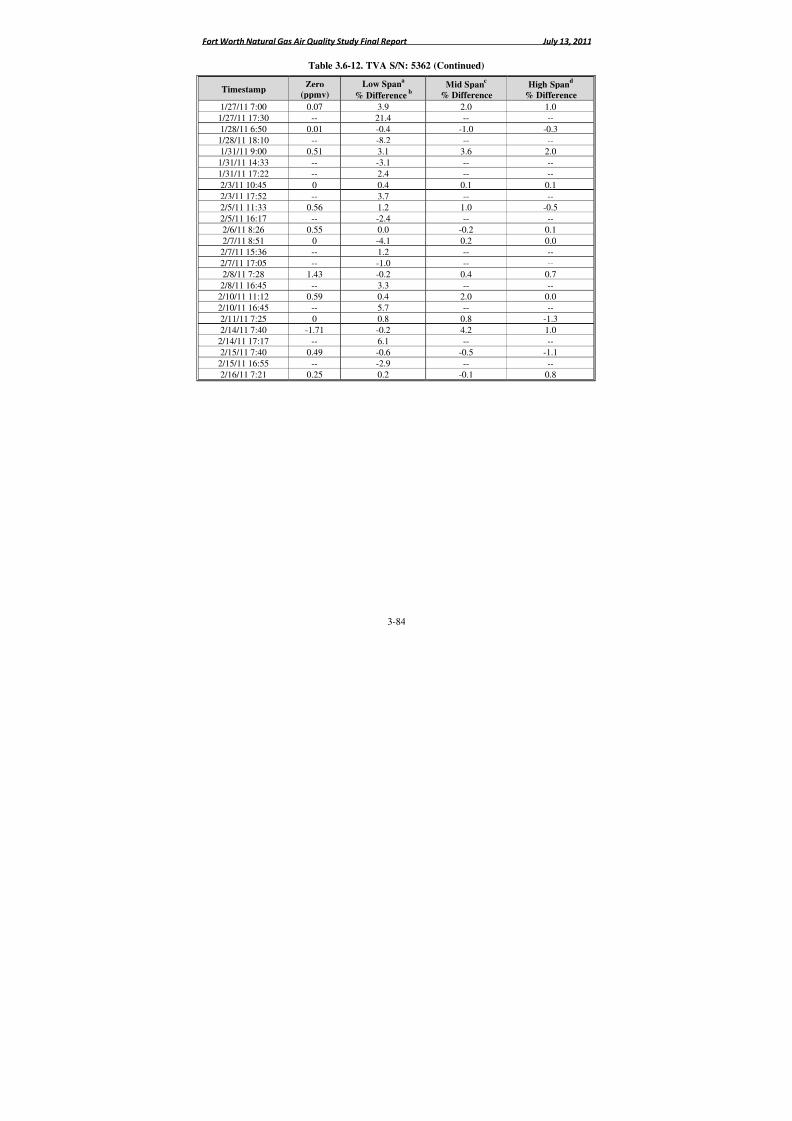
8/6/2019 Air Quality Study Final
http://slidepdf.com/reader/full/air-quality-study-final 174/320
Fort Worth Natural Gas Air Quality Study Final Report July 13, 2011
3-84
Table 3.6-12. TVA S/N: 5362 (Continued)
TimestampZero
(ppmv)
Low Spana
% Differenceb
Mid Spanc
% Difference
High Spand
% Difference
1/27/11 7:00 0.07 3.9 2.0 1.0
1/27/11 17:30 -- 21.4 -- --
1/28/11 6:50 0.01 -0.4 -1.0 -0.31/28/11 18:10 -- -8.2 -- --
1/31/11 9:00 0.51 3.1 3.6 2.0
1/31/11 14:33 -- -3.1 -- --
1/31/11 17:22 -- 2.4 -- --
2/3/11 10:45 0 0.4 0.1 0.1
2/3/11 17:52 -- 3.7 -- --
2/5/11 11:33 0.56 1.2 1.0 -0.5
2/5/11 16:17 -- -2.4 -- --
2/6/11 8:26 0.55 0.0 -0.2 0.1
2/7/11 8:51 0 -4.1 0.2 0.0
2/7/11 15:36 -- 1.2 -- --2/7/11 17:05 -- -1.0 -- --
2/8/11 7:28 1.43 -0.2 0.4 0.7
2/8/11 16:45 -- 3.3 -- --
2/10/11 11:12 0.59 0.4 2.0 0.0
2/10/11 16:45 -- 5.7 -- --
2/11/11 7:25 0 0.8 0.8 -1.3
2/14/11 7:40 -1.71 -0.2 4.2 1.0
2/14/11 17:17 -- 6.1 -- --
2/15/11 7:40 0.49 -0.6 -0.5 -1.1
2/15/11 16:55 -- -2.9 -- --
2/16/11 7:21 0.25 0.2 -0.1 0.8
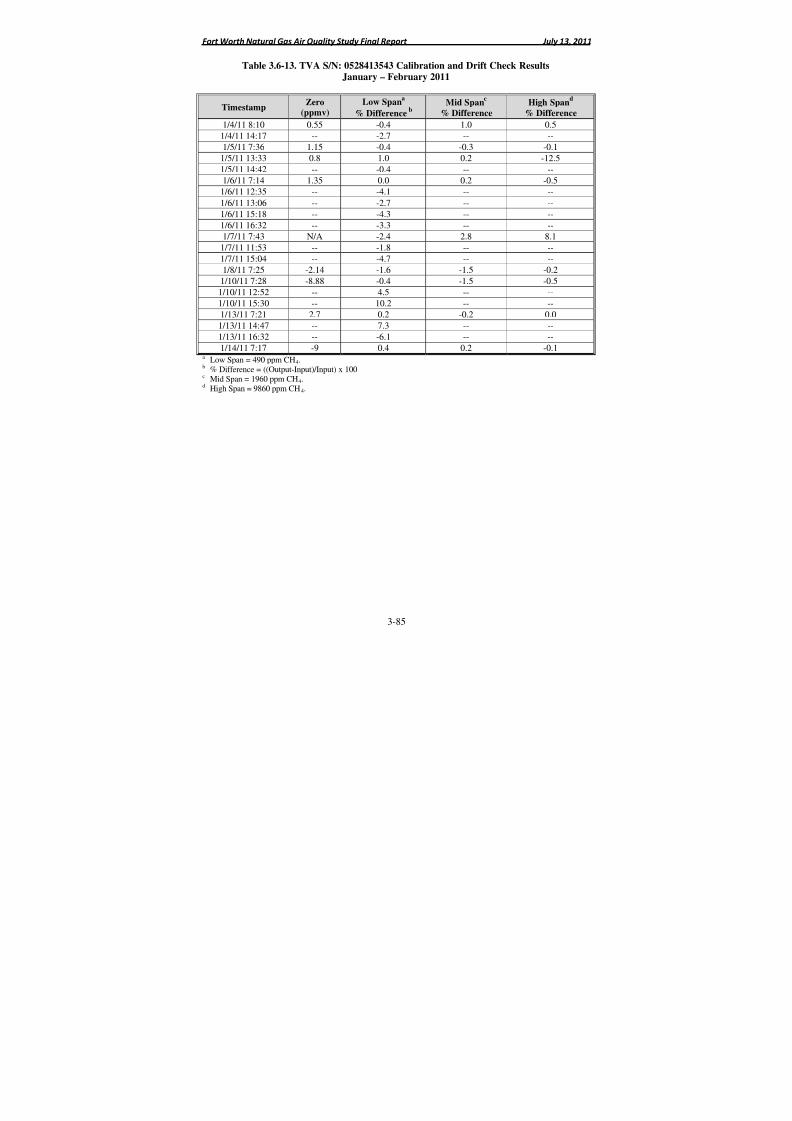
8/6/2019 Air Quality Study Final
http://slidepdf.com/reader/full/air-quality-study-final 175/320
Fort Worth Natural Gas Air Quality Study Final Report July 13, 2011
3-85
Table 3.6-13. TVA S/N: 0528413543 Calibration and Drift Check ResultsJanuary – February 2011
TimestampZero
(ppmv)
Low Spana
% Differenceb
Mid Spanc
% Difference
High Spand
% Difference
1/4/11 8:10 0.55 -0.4 1.0 0.51/4/11 14:17 -- -2.7 -- --
1/5/11 7:36 1.15 -0.4 -0.3 -0.1
1/5/11 13:33 0.8 1.0 0.2 -12.5
1/5/11 14:42 -- -0.4 -- --
1/6/11 7:14 1.35 0.0 0.2 -0.5
1/6/11 12:35 -- -4.1 -- --
1/6/11 13:06 -- -2.7 -- --
1/6/11 15:18 -- -4.3 -- --
1/6/11 16:32 -- -3.3 -- --
1/7/11 7:43 N/A -2.4 2.8 8.1
1/7/11 11:53 -- -1.8 -- --
1/7/11 15:04 -- -4.7 -- --
1/8/11 7:25 -2.14 -1.6 -1.5 -0.2
1/10/11 7:28 -8.88 -0.4 -1.5 -0.5
1/10/11 12:52 -- 4.5 -- --
1/10/11 15:30 -- 10.2 -- --
1/13/11 7:21 2.7 0.2 -0.2 0.0
1/13/11 14:47 -- 7.3 -- --
1/13/11 16:32 -- -6.1 -- --
1/14/11 7:17 -9 0.4 0.2 -0.1a Low Span = 490 ppm CH4.b % Difference = ((Output-Input)/Input) x 100c
Mid Span = 1960 ppm CH4.d High Span = 9860 ppm CH4.
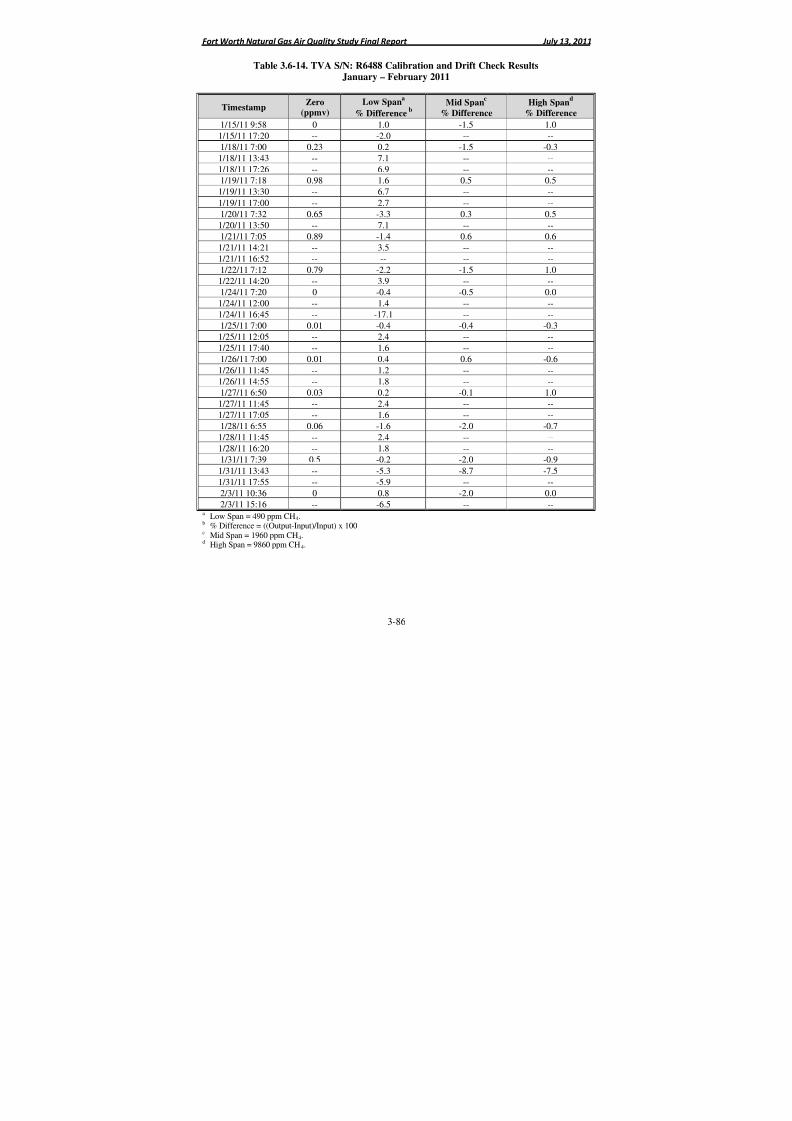
8/6/2019 Air Quality Study Final
http://slidepdf.com/reader/full/air-quality-study-final 176/320
Fort Worth Natural Gas Air Quality Study Final Report July 13, 2011
3-86
Table 3.6-14. TVA S/N: R6488 Calibration and Drift Check ResultsJanuary – February 2011
TimestampZero
(ppmv)
Low Spana
% Differenceb
Mid Spanc
% Difference
High Spand
% Difference
1/15/11 9:58 0 1.0 -1.5 1.01/15/11 17:20 -- -2.0 -- --
1/18/11 7:00 0.23 0.2 -1.5 -0.3
1/18/11 13:43 -- 7.1 -- --
1/18/11 17:26 -- 6.9 -- --
1/19/11 7:18 0.98 1.6 0.5 0.5
1/19/11 13:30 -- 6.7 -- --
1/19/11 17:00 -- 2.7 -- --
1/20/11 7:32 0.65 -3.3 0.3 0.5
1/20/11 13:50 -- 7.1 -- --
1/21/11 7:05 0.89 -1.4 0.6 0.6
1/21/11 14:21 -- 3.5 -- --
1/21/11 16:52 -- -- -- --
1/22/11 7:12 0.79 -2.2 -1.5 1.0
1/22/11 14:20 -- 3.9 -- --
1/24/11 7:20 0 -0.4 -0.5 0.0
1/24/11 12:00 -- 1.4 -- --
1/24/11 16:45 -- -17.1 -- --
1/25/11 7:00 0.01 -0.4 -0.4 -0.3
1/25/11 12:05 -- 2.4 -- --
1/25/11 17:40 -- 1.6 -- --
1/26/11 7:00 0.01 0.4 0.6 -0.6
1/26/11 11:45 -- 1.2 -- --
1/26/11 14:55 -- 1.8 -- --1/27/11 6:50 0.03 0.2 -0.1 1.0
1/27/11 11:45 -- 2.4 -- --
1/27/11 17:05 -- 1.6 -- --
1/28/11 6:55 0.06 -1.6 -2.0 -0.7
1/28/11 11:45 -- 2.4 -- --
1/28/11 16:20 -- 1.8 -- --
1/31/11 7:39 0.5 -0.2 -2.0 -0.9
1/31/11 13:43 -- -5.3 -8.7 -7.5
1/31/11 17:55 -- -5.9 -- --
2/3/11 10:36 0 0.8 -2.0 0.0
2/3/11 15:16 -- -6.5 -- --a Low Span = 490 ppm CH4.b % Difference = ((Output-Input)/Input) x 100c Mid Span = 1960 ppm CH4.d High Span = 9860 ppm CH4.

8/6/2019 Air Quality Study Final
http://slidepdf.com/reader/full/air-quality-study-final 177/320
Fort Worth Natural Gas Air Quality Study Final Report July 13, 2011
3-87
Table 3.6-14. TVA S/N: R6488 (Continued)
TimestampZero
(ppmv)
Low Spana
% Differenceb
Mid Spanc
% Difference
High Spand
% Difference
2/5/11 11:25 1.03 -1.6 -1.1 0.3
2/5/11 14:56 -- -3.7 -- --
2/5/11 16:30 -- -6.5 -- --2/6/11 8:20 0.12 2.4 -1.1 0.3
2/6/11 11:45 -- -0.8 -- --
2/7/11 8:39 0 0.0 0.4 0.7

8/6/2019 Air Quality Study Final
http://slidepdf.com/reader/full/air-quality-study-final 178/320
Fort Worth Natural Gas Air Quality Study Final Report July 13, 2011
3-88
Table 3.6-15. TVA S/N: R1376 Calibration and Drift Check ResultsJanuary – February 2011
TimestampZero
(ppmv)
Low Spana
% Differenceb
Mid Spanc
% Difference
High Spand
% Difference
2/8/11 10:18 0.61 -0.8 -0.2 0.22/8/11 13:51 -- -1.4 -- --
2/8/11 16:47 -- -2.7 -- --
2/10/11 10:59 0.23 -0.6 -0.7 -0.1
2/10/11 14:05 -- -0.8 -- --
2/11/11 7:15 0 0.4 0.6 1.0
2/11/11 16:35 -- -3.9 -- --
2/11/11 16:35 -- 3.7 -- --
2/14/11 7:43 0.12 0.6 1.5 0.0
2/14/11 16:52 -- 3.1 -- --
2/15/11 7:32 0.93 -0.6 -0.8 0.1
2/15/11 15:07 -- 8.2 -- --
2/16/11 7:15 0.5 -0.8 -0.3 0.2
2/16/11 13:00 -- 1.0 -- --
2/16/11 17:03 -- -1.0 -- --a Low Span = 490 ppm CH4.b % Difference = ((Output-Input)/Input) x 100c Mid Span = 1960 ppm CH4.d High Span = 9860 ppm CH4.
8/6/2019 Air Quality Study Final
http://slidepdf.com/reader/full/air-quality-study-final 179/320
Fort Worth Natural Gas Air Quality Study Final Report July 13, 2011
3-89
3.6.4 Field Data Review
Field data was reviewed each week in Phase I by the acting QA|QC Officer. In Phase II,this role was divided between the two field team leaders. Each team leader checked the otherteam's field data for completeness and accuracy on a daily basis. The team leaders also checked
periodically for consistency in sampling procedures and data recording between the two teams.
3.6.5 Canister Sample Collection QC
A strict canister sampling protocol was followed to ensure quality sampling results:
1. All canisters were vacuum checked prior to sampling. Canisters with vacuums lessthan 25 inches Hg were rejected.
2. Residual vacuums of 2 to 10 inches Hg were left in canisters following samplecollection.
3. Canister collection data was recorded on data forms as well as in canister logbooks(one per team).
4. Standard canister Chain-of-Custody procedures were observed.
5. Between use and prior to shipping, canisters were kept securely in the project fieldoffice.
6. Five percent of the canister samples were collected in duplicate to provide a measureof total sampling and analytical variability.
Eight duplicate canister samples were collected. Comparisons of the analytical results foreach duplicate pair are provided in Table 3.6-16 as the relative percent differences (% RPD)
between analytes. Since each canister sample was analyzed by EPA Method TO-15 for VOCsand by ASTM D1946 for methane, Table 3.6-16 includes the results for both analyticaltechniques. The average percent relative differences for the duplicate canisters range between 11to 61 percent. This is considered an acceptable result for field samples.
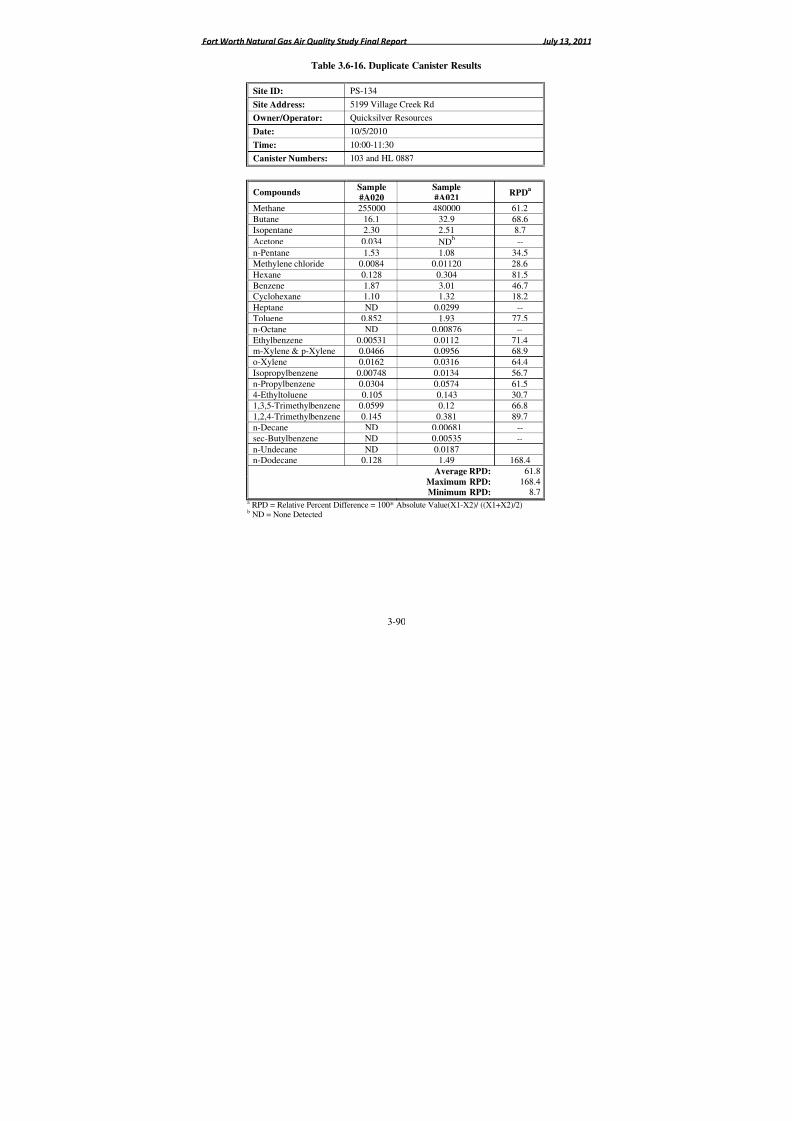
8/6/2019 Air Quality Study Final
http://slidepdf.com/reader/full/air-quality-study-final 180/320
Fort Worth Natural Gas Air Quality Study Final Report July 13, 2011
3-90
Table 3.6-16. Duplicate Canister Results
Site ID: PS-134
Site Address: 5199 Village Creek Rd
Owner/Operator: Quicksilver Resources
Date: 10/5/2010
Time: 10:00-11:30
Canister Numbers: 103 and HL 0887
CompoundsSample
#A020
Sample
#A021RPD
a
Methane 255000 480000 61.2
Butane 16.1 32.9 68.6
Isopentane 2.30 2.51 8.7
Acetone 0.034 NDb --
n-Pentane 1.53 1.08 34.5Methylene chloride 0.0084 0.01120 28.6
Hexane 0.128 0.304 81.5
Benzene 1.87 3.01 46.7Cyclohexane 1.10 1.32 18.2
Heptane ND 0.0299 --
Toluene 0.852 1.93 77.5
n-Octane ND 0.00876 --
Ethylbenzene 0.00531 0.0112 71.4m-Xylene & p-Xylene 0.0466 0.0956 68.9
o-Xylene 0.0162 0.0316 64.4
Isopropylbenzene 0.00748 0.0134 56.7
n-Propylbenzene 0.0304 0.0574 61.54-Ethyltoluene 0.105 0.143 30.71,3,5-Trimethylbenzene 0.0599 0.12 66.8
1,2,4-Trimethylbenzene 0.145 0.381 89.7
n-Decane ND 0.00681 --
sec-Butylbenzene ND 0.00535 --
n-Undecane ND 0.0187 --n-Dodecane 0.128 1.49 168.4
Average RPD: 61.8Maximum RPD: 168.4Minimum RPD: 8.7
a
RPD = Relative Percent Difference = 100* Absolute Value(X1-X2)/ ((X1+X2)/2)b ND = None Detected
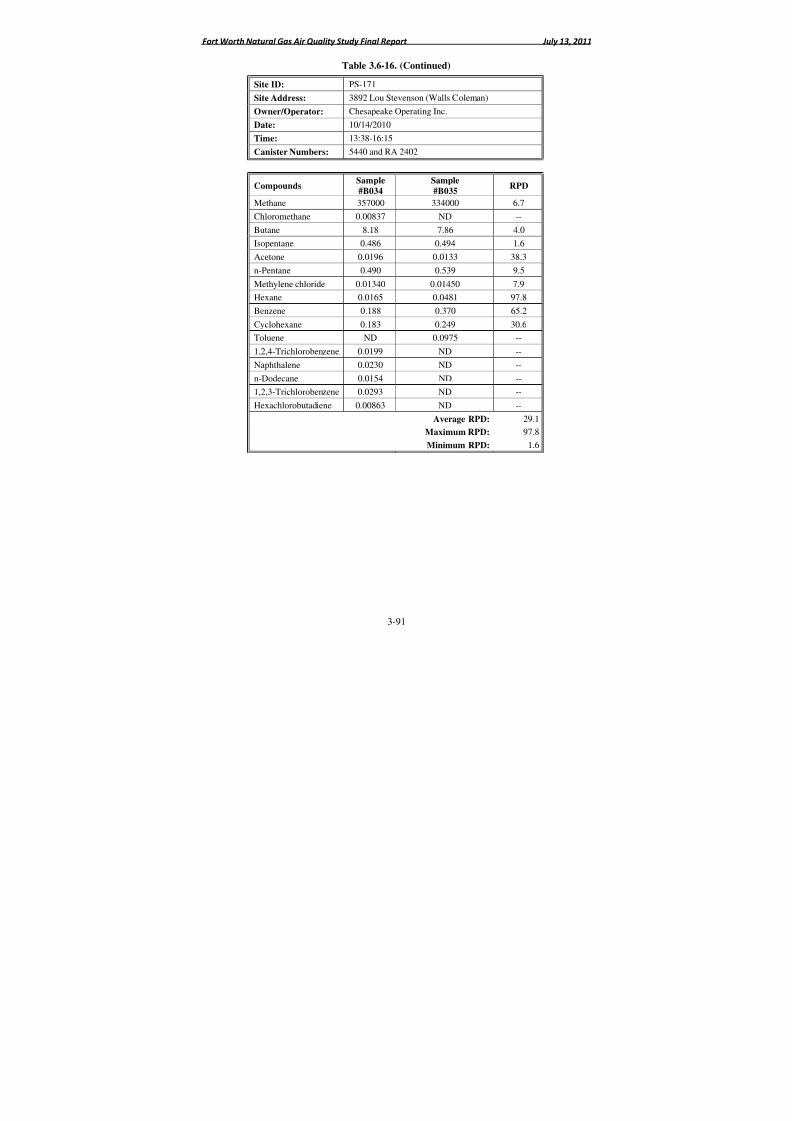
8/6/2019 Air Quality Study Final
http://slidepdf.com/reader/full/air-quality-study-final 181/320
Fort Worth Natural Gas Air Quality Study Final Report July 13, 2011
3-91
Table 3.6-16. (Continued)
Site ID: PS-171
Site Address: 3892 Lou Stevenson (Walls Coleman)
Owner/Operator: Chesapeake Operating Inc.
Date: 10/14/2010Time: 13:38-16:15
Canister Numbers: 5440 and RA 2402
CompoundsSample
#B034
Sample
#B035RPD
Methane 357000 334000 6.7
Chloromethane 0.00837 ND --
Butane 8.18 7.86 4.0
Isopentane 0.486 0.494 1.6
Acetone 0.0196 0.0133 38.3
n-Pentane 0.490 0.539 9.5
Methylene chloride 0.01340 0.01450 7.9
Hexane 0.0165 0.0481 97.8
Benzene 0.188 0.370 65.2
Cyclohexane 0.183 0.249 30.6
Toluene ND 0.0975 --
1,2,4-Trichlorobenzene 0.0199 ND --
Naphthalene 0.0230 ND --
n-Dodecane 0.0154 ND --1,2,3-Trichlorobenzene 0.0293 ND --
Hexachlorobutadiene 0.00863 ND --
Average RPD: 29.1
Maximum RPD: 97.8
Minimum RPD: 1.6
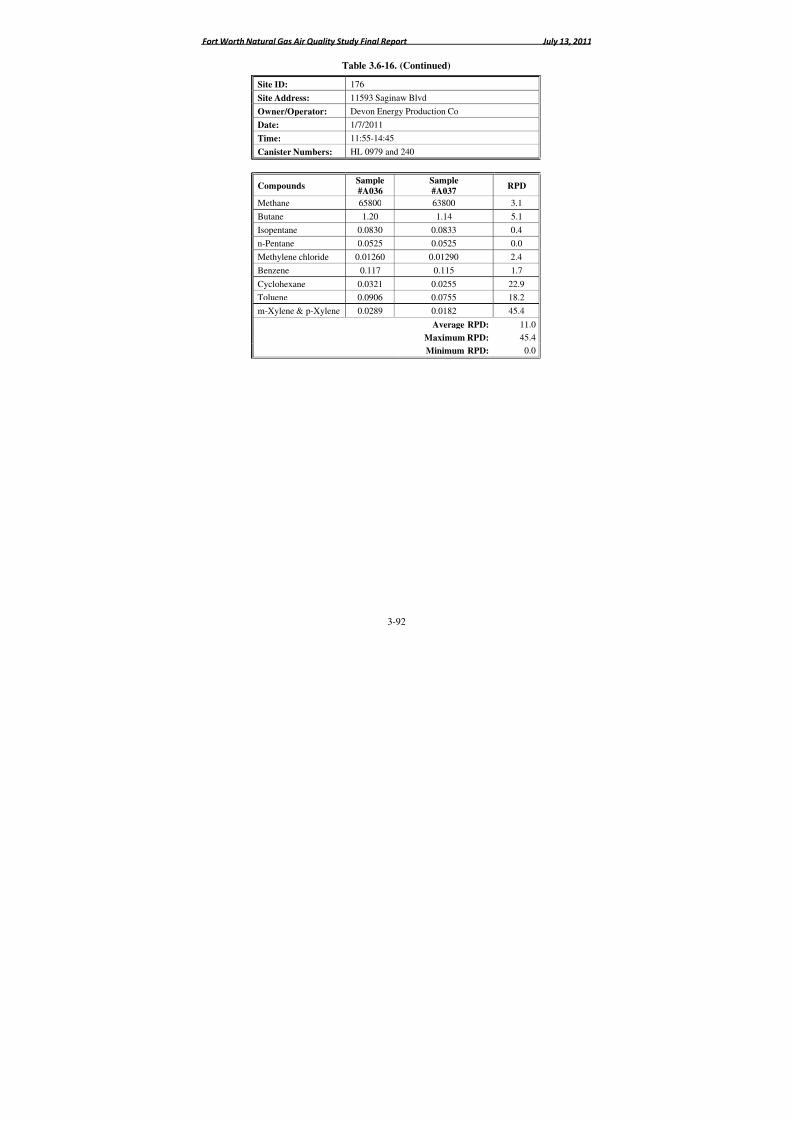
8/6/2019 Air Quality Study Final
http://slidepdf.com/reader/full/air-quality-study-final 182/320
Fort Worth Natural Gas Air Quality Study Final Report July 13, 2011
3-92
Table 3.6-16. (Continued)
Site ID: 176
Site Address: 11593 Saginaw Blvd
Owner/Operator: Devon Energy Production Co
Date: 1/7/2011Time: 11:55-14:45
Canister Numbers: HL 0979 and 240
CompoundsSample
#A036
Sample
#A037RPD
Methane 65800 63800 3.1
Butane 1.20 1.14 5.1
Isopentane 0.0830 0.0833 0.4
n-Pentane 0.0525 0.0525 0.0
Methylene chloride 0.01260 0.01290 2.4
Benzene 0.117 0.115 1.7
Cyclohexane 0.0321 0.0255 22.9
Toluene 0.0906 0.0755 18.2
m-Xylene & p-Xylene 0.0289 0.0182 45.4
Average RPD: 11.0
Maximum RPD: 45.4
Minimum RPD: 0.0
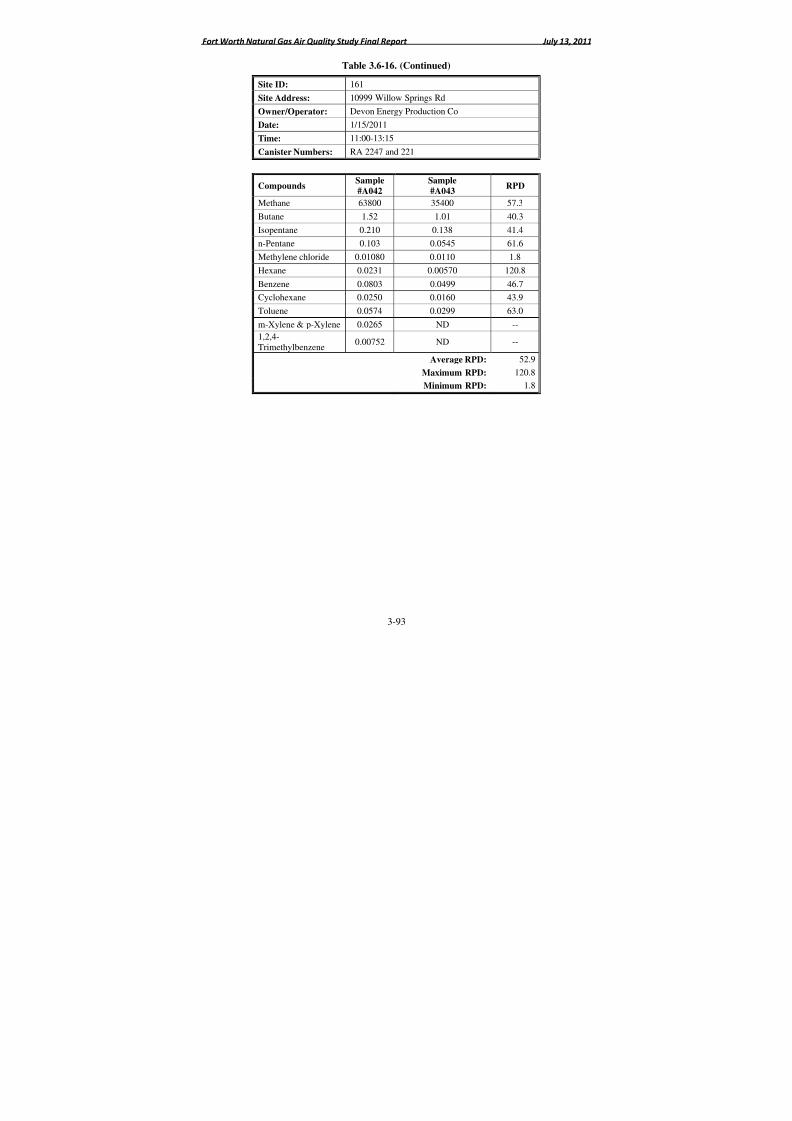
8/6/2019 Air Quality Study Final
http://slidepdf.com/reader/full/air-quality-study-final 183/320
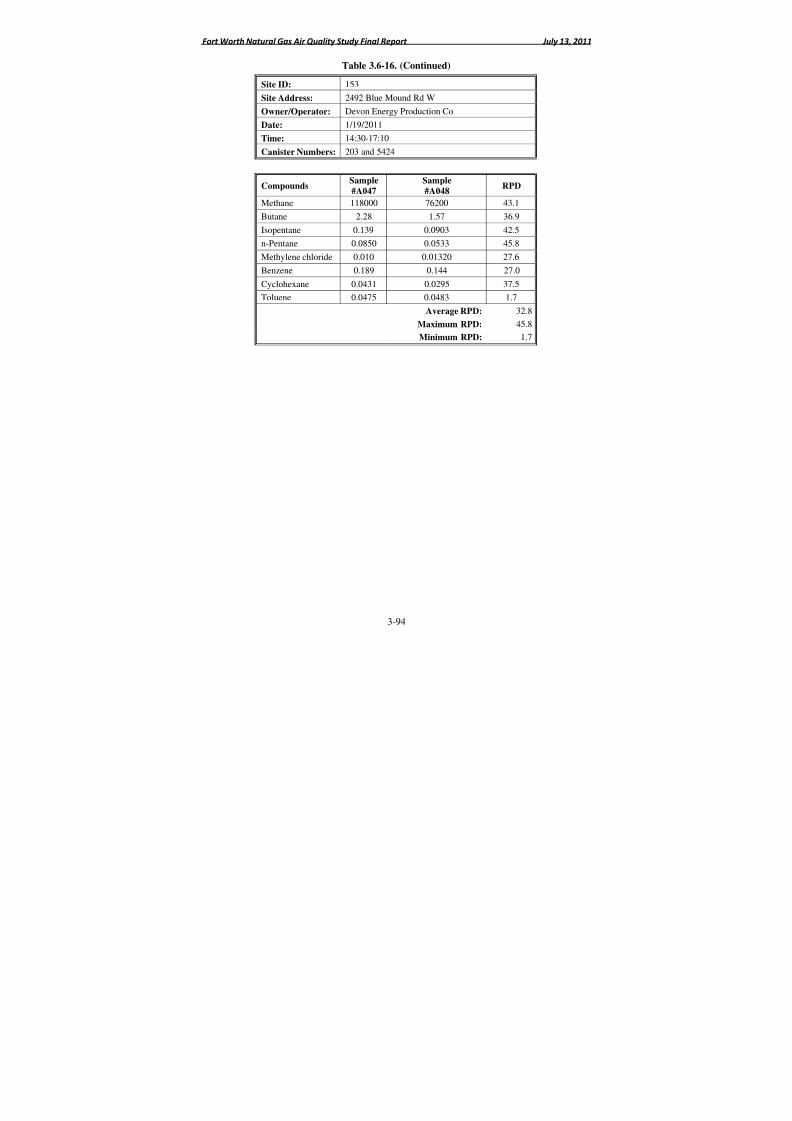
8/6/2019 Air Quality Study Final
http://slidepdf.com/reader/full/air-quality-study-final 184/320
Fort Worth Natural Gas Air Quality Study Final Report July 13, 2011
3-94
Table 3.6-16. (Continued)
Site ID: 153
Site Address: 2492 Blue Mound Rd W
Owner/Operator: Devon Energy Production Co
Date: 1/19/2011Time: 14:30-17:10
Canister Numbers: 203 and 5424
CompoundsSample
#A047
Sample
#A048RPD
Methane 118000 76200 43.1
Butane 2.28 1.57 36.9
Isopentane 0.139 0.0903 42.5
n-Pentane 0.0850 0.0533 45.8
Methylene chloride 0.010 0.01320 27.6
Benzene 0.189 0.144 27.0
Cyclohexane 0.0431 0.0295 37.5
Toluene 0.0475 0.0483 1.7
Average RPD: 32.8
Maximum RPD: 45.8
Minimum RPD: 1.7
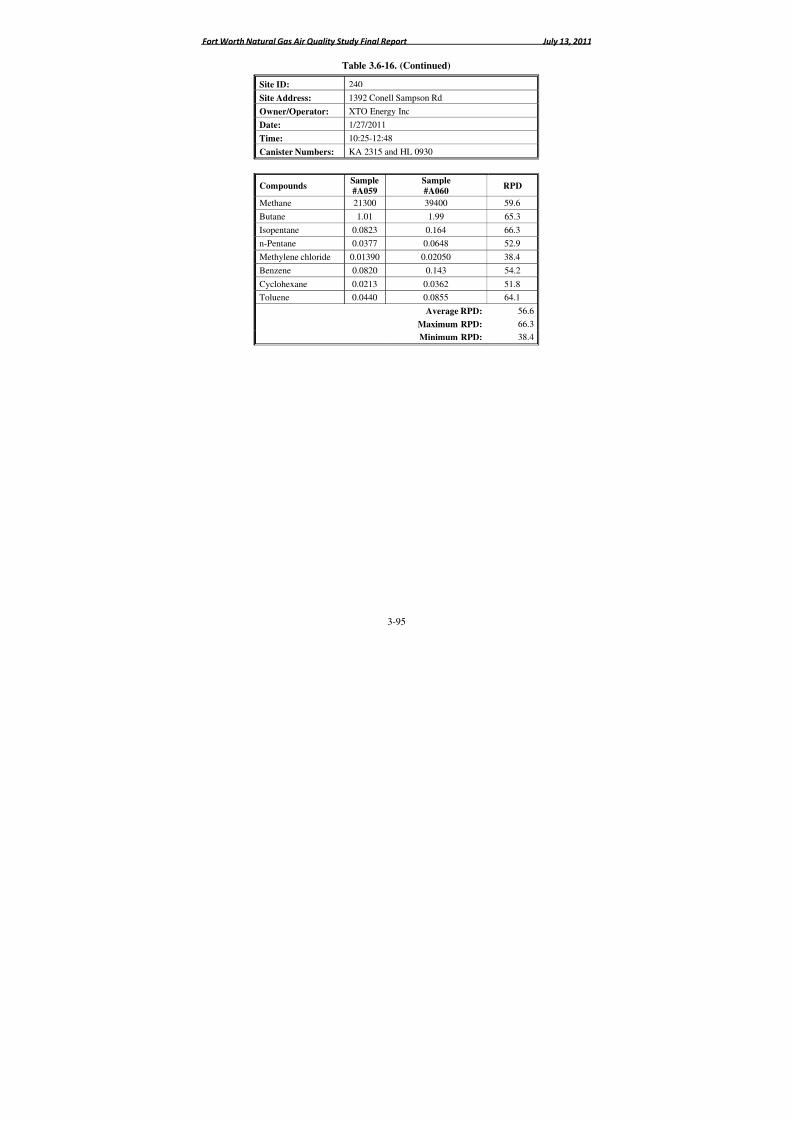
8/6/2019 Air Quality Study Final
http://slidepdf.com/reader/full/air-quality-study-final 185/320
Fort Worth Natural Gas Air Quality Study Final Report July 13, 2011
3-95
Table 3.6-16. (Continued)
Site ID: 240
Site Address: 1392 Conell Sampson Rd
Owner/Operator: XTO Energy Inc
Date: 1/27/2011Time: 10:25-12:48
Canister Numbers: KA 2315 and HL 0930
CompoundsSample
#A059
Sample
#A060RPD
Methane 21300 39400 59.6
Butane 1.01 1.99 65.3
Isopentane 0.0823 0.164 66.3
n-Pentane 0.0377 0.0648 52.9
Methylene chloride 0.01390 0.02050 38.4
Benzene 0.0820 0.143 54.2
Cyclohexane 0.0213 0.0362 51.8
Toluene 0.0440 0.0855 64.1
Average RPD: 56.6
Maximum RPD: 66.3
Minimum RPD: 38.4
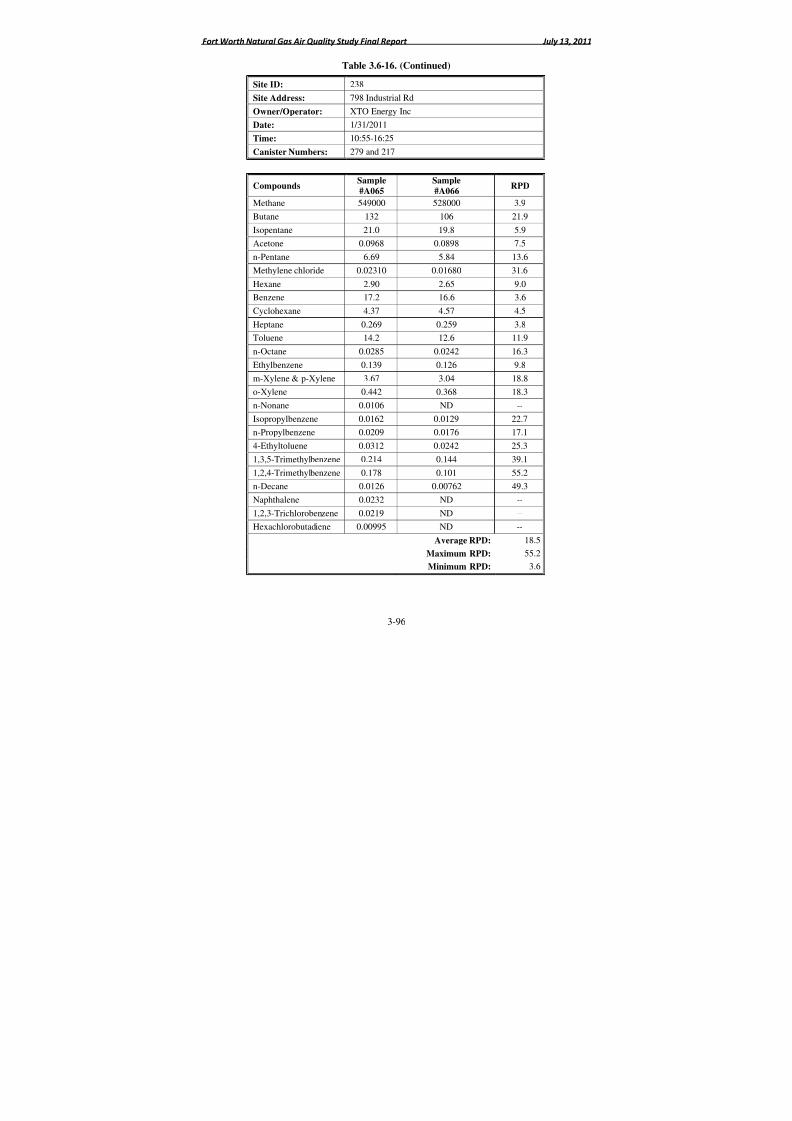
8/6/2019 Air Quality Study Final
http://slidepdf.com/reader/full/air-quality-study-final 186/320
Fort Worth Natural Gas Air Quality Study Final Report July 13, 2011
3-96
Table 3.6-16. (Continued)
Site ID: 238
Site Address: 798 Industrial Rd
Owner/Operator: XTO Energy Inc
Date: 1/31/2011Time: 10:55-16:25
Canister Numbers: 279 and 217
CompoundsSample
#A065
Sample
#A066RPD
Methane 549000 528000 3.9
Butane 132 106 21.9
Isopentane 21.0 19.8 5.9
Acetone 0.0968 0.0898 7.5
n-Pentane 6.69 5.84 13.6
Methylene chloride 0.02310 0.01680 31.6
Hexane 2.90 2.65 9.0
Benzene 17.2 16.6 3.6
Cyclohexane 4.37 4.57 4.5
Heptane 0.269 0.259 3.8
Toluene 14.2 12.6 11.9
n-Octane 0.0285 0.0242 16.3
Ethylbenzene 0.139 0.126 9.8
m-Xylene & p-Xylene 3.67 3.04 18.8o-Xylene 0.442 0.368 18.3
n-Nonane 0.0106 ND --
Isopropylbenzene 0.0162 0.0129 22.7
n-Propylbenzene 0.0209 0.0176 17.1
4-Ethyltoluene 0.0312 0.0242 25.3
1,3,5-Trimethylbenzene 0.214 0.144 39.1
1,2,4-Trimethylbenzene 0.178 0.101 55.2
n-Decane 0.0126 0.00762 49.3
Naphthalene 0.0232 ND --
1,2,3-Trichlorobenzene 0.0219 ND --
Hexachlorobutadiene 0.00995 ND --
Average RPD: 18.5
Maximum RPD: 55.2
Minimum RPD: 3.6
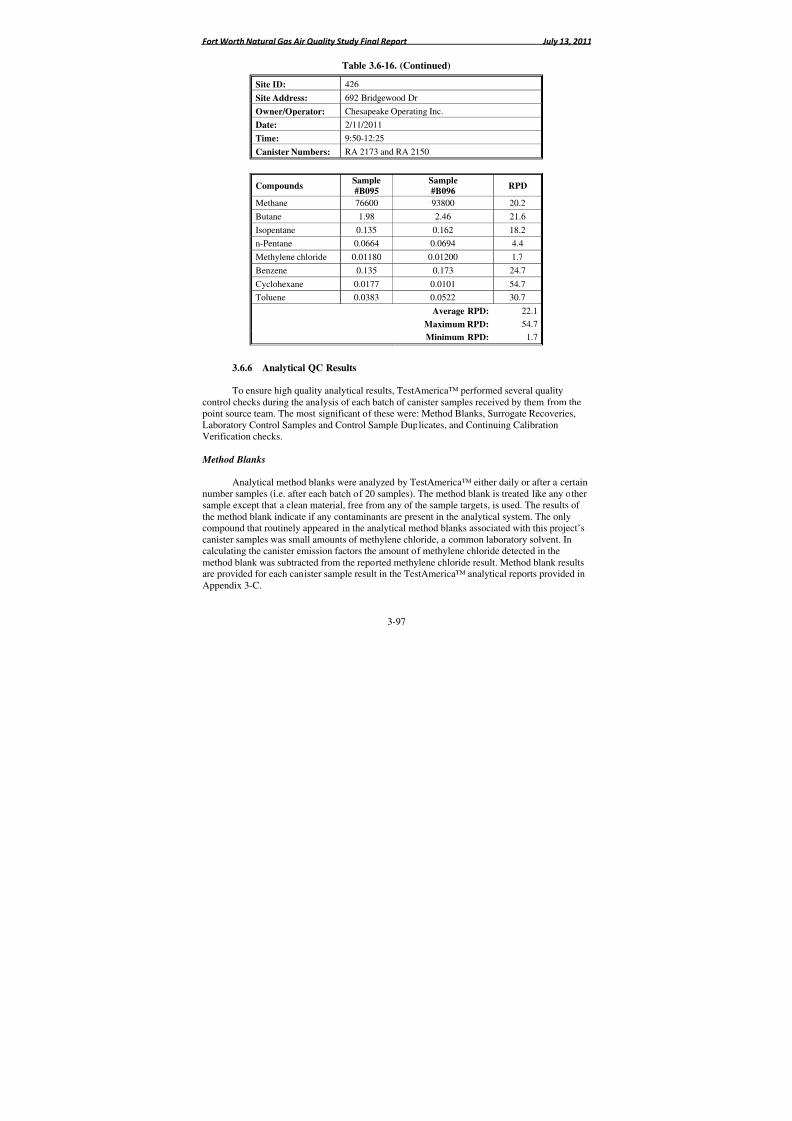
8/6/2019 Air Quality Study Final
http://slidepdf.com/reader/full/air-quality-study-final 187/320
Fort Worth Natural Gas Air Quality Study Final Report July 13, 2011
3-97
Table 3.6-16. (Continued)
Site ID: 426
Site Address: 692 Bridgewood Dr
Owner/Operator: Chesapeake Operating Inc.
Date: 2/11/2011Time: 9:50-12:25
Canister Numbers: RA 2173 and RA 2150
CompoundsSample
#B095
Sample
#B096RPD
Methane 76600 93800 20.2
Butane 1.98 2.46 21.6
Isopentane 0.135 0.162 18.2
n-Pentane 0.0664 0.0694 4.4
Methylene chloride 0.01180 0.01200 1.7
Benzene 0.135 0.173 24.7
Cyclohexane 0.0177 0.0101 54.7
Toluene 0.0383 0.0522 30.7
Average RPD: 22.1
Maximum RPD: 54.7
Minimum RPD: 1.7
3.6.6 Analytical QC Results
To ensure high quality analytical results, TestAmerica™ performed several qualitycontrol checks during the analysis of each batch of canister samples received by them from thepoint source team. The most significant of these were: Method Blanks, Surrogate Recoveries,Laboratory Control Samples and Control Sample Duplicates, and Continuing CalibrationVerification checks.
Method Blanks
Analytical method blanks were analyzed by TestAmerica™ either daily or after a certainnumber samples (i.e. after each batch of 20 samples). The method blank is treated like any other
sample except that a clean material, free from any of the sample targets, is used. The results of the method blank indicate if any contaminants are present in the analytical system. The onlycompound that routinely appeared in the analytical method blanks associated with this project’scanister samples was small amounts of methylene chloride, a common laboratory solvent. Incalculating the canister emission factors the amount of methylene chloride detected in themethod blank was subtracted from the reported methylene chloride result. Method blank resultsare provided for each canister sample result in the TestAmerica™ analytical reports provided inAppendix 3-C.
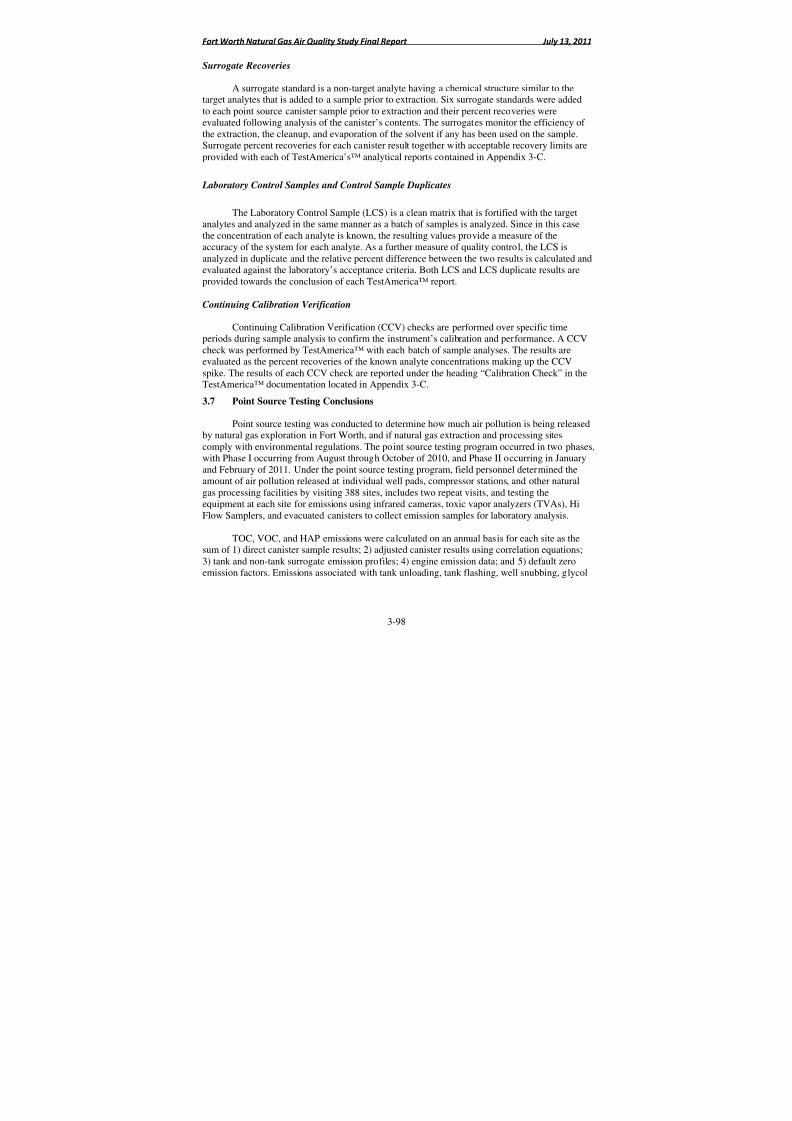
8/6/2019 Air Quality Study Final
http://slidepdf.com/reader/full/air-quality-study-final 188/320
Fort Worth Natural Gas Air Quality Study Final Report July 13, 2011
3-98
Surrogate Recoveries
A surrogate standard is a non-target analyte having a chemical structure similar to thetarget analytes that is added to a sample prior to extraction. Six surrogate standards were addedto each point source canister sample prior to extraction and their percent recoveries were
evaluated following analysis of the canister’s contents. The surrogates monitor the efficiency of the extraction, the cleanup, and evaporation of the solvent if any has been used on the sample.Surrogate percent recoveries for each canister result together with acceptable recovery limits areprovided with each of TestAmerica’s™ analytical reports contained in Appendix 3-C.
Laboratory Control Samples and Control Sample Duplicates
The Laboratory Control Sample (LCS) is a clean matrix that is fortified with the targetanalytes and analyzed in the same manner as a batch of samples is analyzed. Since in this casethe concentration of each analyte is known, the resulting values provide a measure of theaccuracy of the system for each analyte. As a further measure of quality control, the LCS isanalyzed in duplicate and the relative percent difference between the two results is calculated andevaluated against the laboratory’s acceptance criteria. Both LCS and LCS duplicate results areprovided towards the conclusion of each TestAmerica™ report.
Continuing Calibration Verification
Continuing Calibration Verification (CCV) checks are performed over specific timeperiods during sample analysis to confirm the instrument’s calibration and performance. A CCVcheck was performed by TestAmerica™ with each batch of sample analyses. The results areevaluated as the percent recoveries of the known analyte concentrations making up the CCVspike. The results of each CCV check are reported under the heading “Calibration Check” in theTestAmerica™ documentation located in Appendix 3-C.
3.7 Point Source Testing Conclusions
Point source testing was conducted to determine how much air pollution is being releasedby natural gas exploration in Fort Worth, and if natural gas extraction and processing sitescomply with environmental regulations. The point source testing program occurred in two phases,with Phase I occurring from August through October of 2010, and Phase II occurring in Januaryand February of 2011. Under the point source testing program, field personnel determined theamount of air pollution released at individual well pads, compressor stations, and other naturalgas processing facilities by visiting 388 sites, includes two repeat visits, and testing the
equipment at each site for emissions using infrared cameras, toxic vapor analyzers (TVAs), HiFlow Samplers, and evacuated canisters to collect emission samples for laboratory analysis.
TOC, VOC, and HAP emissions were calculated on an annual basis for each site as thesum of 1) direct canister sample results; 2) adjusted canister results using correlation equations;3) tank and non-tank surrogate emission profiles; 4) engine emission data; and 5) default zeroemission factors. Emissions associated with tank unloading, tank flashing, well snubbing, glycol
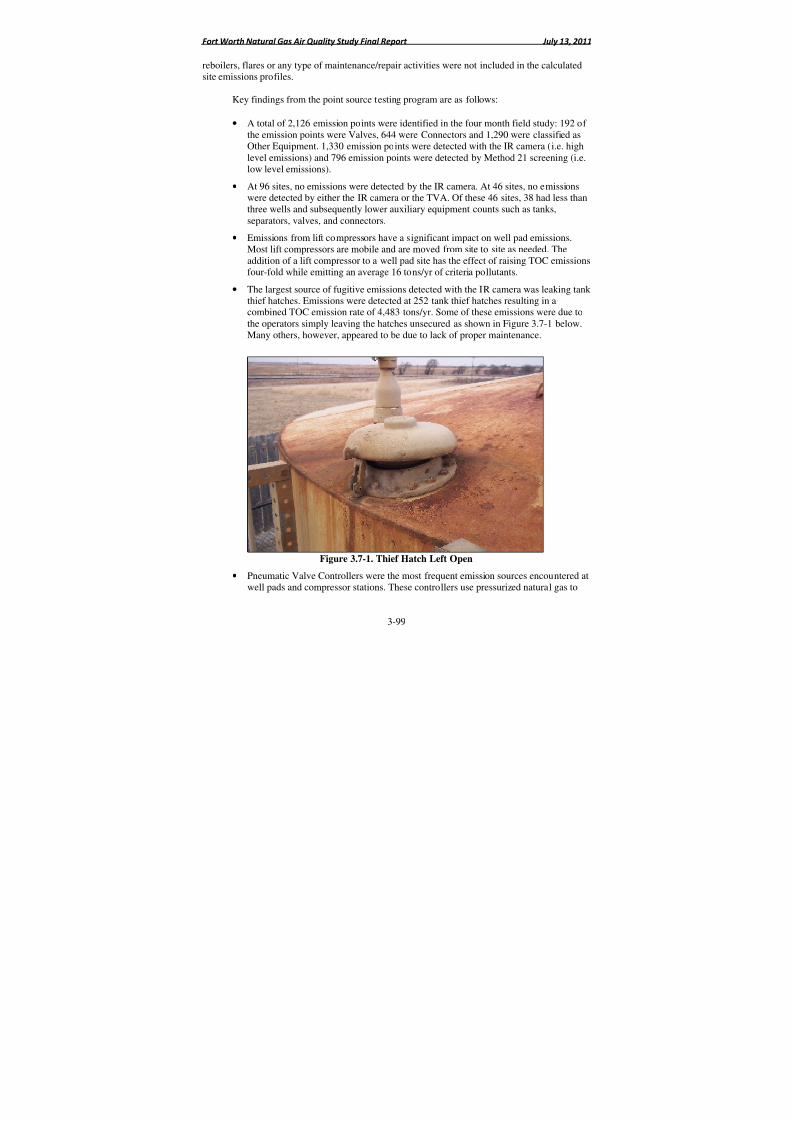
8/6/2019 Air Quality Study Final
http://slidepdf.com/reader/full/air-quality-study-final 189/320
Fort Worth Natural Gas Air Quality Study Final Report July 13, 2011
3-99
reboilers, flares or any type of maintenance/repair activities were not included in the calculatedsite emissions profiles.
Key findings from the point source testing program are as follows:
•
A total of 2,126 emission points were identified in the four month field study: 192 of the emission points were Valves, 644 were Connectors and 1,290 were classified asOther Equipment. 1,330 emission points were detected with the IR camera (i.e. highlevel emissions) and 796 emission points were detected by Method 21 screening (i.e.low level emissions).
• At 96 sites, no emissions were detected by the IR camera. At 46 sites, no emissionswere detected by either the IR camera or the TVA. Of these 46 sites, 38 had less thanthree wells and subsequently lower auxiliary equipment counts such as tanks,separators, valves, and connectors.
• Emissions from lift compressors have a significant impact on well pad emissions.
Most lift compressors are mobile and are moved from site to site as needed. Theaddition of a lift compressor to a well pad site has the effect of raising TOC emissionsfour-fold while emitting an average 16 tons/yr of criteria pollutants.
• The largest source of fugitive emissions detected with the IR camera was leaking tank thief hatches. Emissions were detected at 252 tank thief hatches resulting in acombined TOC emission rate of 4,483 tons/yr. Some of these emissions were due tothe operators simply leaving the hatches unsecured as shown in Figure 3.7-1 below.Many others, however, appeared to be due to lack of proper maintenance.
Figure 3.7-1. Thief Hatch Left Open
• Pneumatic Valve Controllers were the most frequent emission sources encountered atwell pads and compressor stations. These controllers use pressurized natural gas to
8/6/2019 Air Quality Study Final
http://slidepdf.com/reader/full/air-quality-study-final 190/320
Fort Worth Natural Gas Air Quality Study Final Report July 13, 2011
3-100
actuate separator unloading valves. Under normal operation a pneumatic valvecontroller is designed to release a small amount of natural gas to the atmosphereduring each unloading event. Due to contaminants in the natural gas stream, however,these controllers eventually fail (often within six months of installation) and beginleaking natural gas continually. The emissions from the 489 failed pneumatic valve
controllers detected by the point source team result in a combined TOC emission rateof 3,003 tons per year.
Figure 3.7-2. Pneumatic Valve Controller on Separator
• Emissions from 175 storage tank vents were detected by the IR camera accounting for
a combined total of 2,076 tons of TOC per year. In numerous instances several tankswould be manifolded to one vent controlled by a pressure relief valve. In these cases,vent emissions detected with the IR camera indicated a failure of the pressure relief valve.
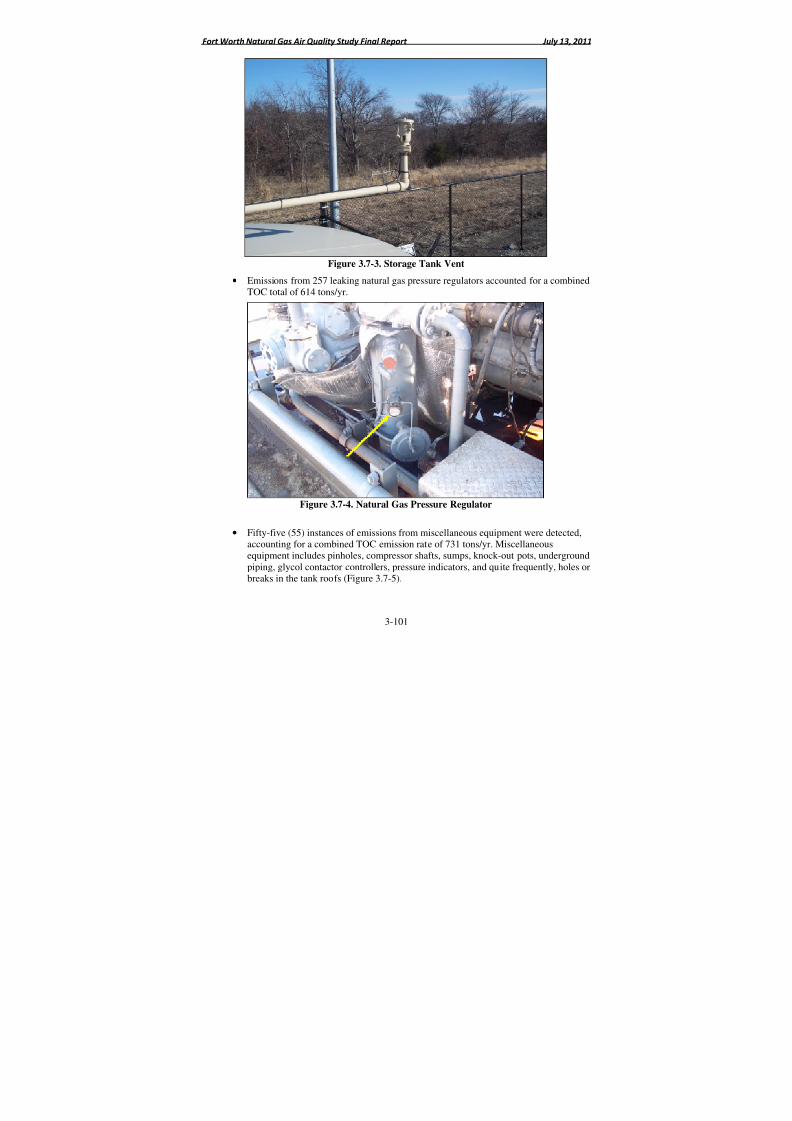
8/6/2019 Air Quality Study Final
http://slidepdf.com/reader/full/air-quality-study-final 191/320
Fort Worth Natural Gas Air Quality Study Final Report July 13, 2011
3-101
Figure 3.7-3. Storage Tank Vent
• Emissions from 257 leaking natural gas pressure regulators accounted for a combinedTOC total of 614 tons/yr.
Figure 3.7-4. Natural Gas Pressure Regulator
• Fifty-five (55) instances of emissions from miscellaneous equipment were detected,accounting for a combined TOC emission rate of 731 tons/yr. Miscellaneousequipment includes pinholes, compressor shafts, sumps, knock-out pots, undergroundpiping, glycol contactor controllers, pressure indicators, and quite frequently, holes orbreaks in the tank roofs (Figure 3.7-5).
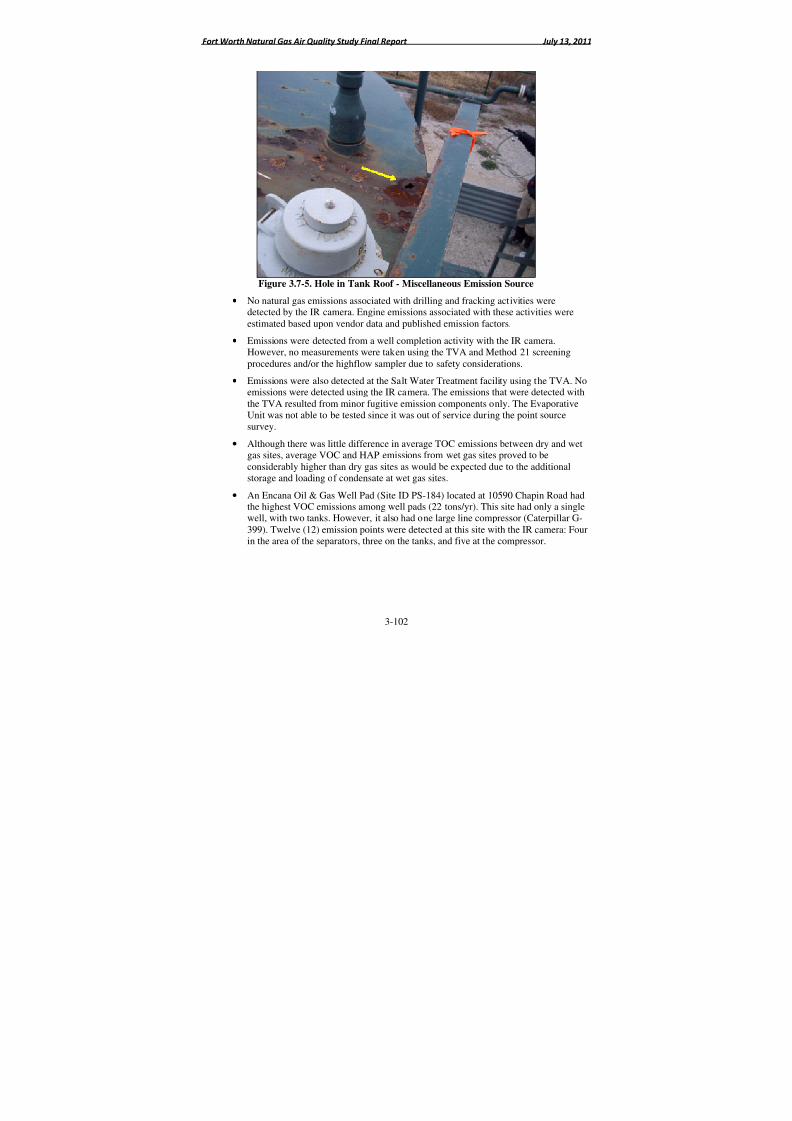
8/6/2019 Air Quality Study Final
http://slidepdf.com/reader/full/air-quality-study-final 192/320
Fort Worth Natural Gas Air Quality Study Final Report July 13, 2011
3-102
Figure 3.7-5. Hole in Tank Roof - Miscellaneous Emission Source
• No natural gas emissions associated with drilling and fracking activities weredetected by the IR camera. Engine emissions associated with these activities wereestimated based upon vendor data and published emission factors.
• Emissions were detected from a well completion activity with the IR camera.However, no measurements were taken using the TVA and Method 21 screeningprocedures and/or the highflow sampler due to safety considerations.
• Emissions were also detected at the Salt Water Treatment facility using the TVA. Noemissions were detected using the IR camera. The emissions that were detected withthe TVA resulted from minor fugitive emission components only. The EvaporativeUnit was not able to be tested since it was out of service during the point sourcesurvey.
• Although there was little difference in average TOC emissions between dry and wetgas sites, average VOC and HAP emissions from wet gas sites proved to beconsiderably higher than dry gas sites as would be expected due to the additionalstorage and loading of condensate at wet gas sites.
• An Encana Oil & Gas Well Pad (Site ID PS-184) located at 10590 Chapin Road had
the highest VOC emissions among well pads (22 tons/yr). This site had only a singlewell, with two tanks. However, it also had one large line compressor (Caterpillar G-399). Twelve (12) emission points were detected at this site with the IR camera: Fourin the area of the separators, three on the tanks, and five at the compressor.
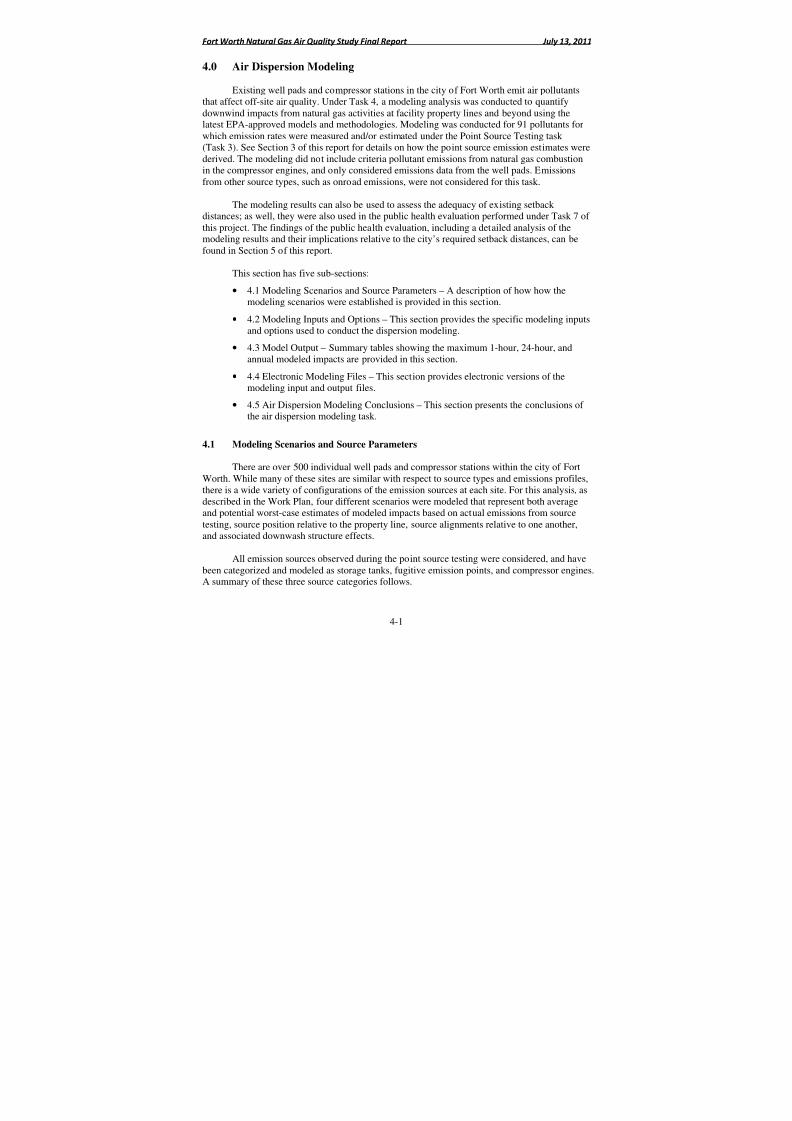
8/6/2019 Air Quality Study Final
http://slidepdf.com/reader/full/air-quality-study-final 193/320
Fort Worth Natural Gas Air Quality Study Final Report July 13, 2011
4-1
4.0 Air Dispersion Modeling
Existing well pads and compressor stations in the city of Fort Worth emit air pollutantsthat affect off-site air quality. Under Task 4, a modeling analysis was conducted to quantifydownwind impacts from natural gas activities at facility property lines and beyond using the
latest EPA-approved models and methodologies. Modeling was conducted for 91 pollutants forwhich emission rates were measured and/or estimated under the Point Source Testing task (Task 3). See Section 3 of this report for details on how the point source emission estimates werederived. The modeling did not include criteria pollutant emissions from natural gas combustionin the compressor engines, and only considered emissions data from the well pads. Emissionsfrom other source types, such as onroad emissions, were not considered for this task.
The modeling results can also be used to assess the adequacy of existing setback distances; as well, they were also used in the public health evaluation performed under Task 7 of this project. The findings of the public health evaluation, including a detailed analysis of themodeling results and their implications relative to the city’s required setback distances, can be
found in Section 5 of this report.
This section has five sub-sections:
• 4.1 Modeling Scenarios and Source Parameters – A description of how how themodeling scenarios were established is provided in this section.
• 4.2 Modeling Inputs and Options – This section provides the specific modeling inputsand options used to conduct the dispersion modeling.
• 4.3 Model Output – Summary tables showing the maximum 1-hour, 24-hour, andannual modeled impacts are provided in this section.
• 4.4 Electronic Modeling Files – This section provides electronic versions of themodeling input and output files.
• 4.5 Air Dispersion Modeling Conclusions – This section presents the conclusions of the air dispersion modeling task.
4.1 Modeling Scenarios and Source Parameters
There are over 500 individual well pads and compressor stations within the city of FortWorth. While many of these sites are similar with respect to source types and emissions profiles,there is a wide variety of configurations of the emission sources at each site. For this analysis, asdescribed in the Work Plan, four different scenarios were modeled that represent both averageand potential worst-case estimates of modeled impacts based on actual emissions from sourcetesting, source position relative to the property line, source alignments relative to one another,and associated downwash structure effects.
All emission sources observed during the point source testing were considered, and havebeen categorized and modeled as storage tanks, fugitive emission points, and compressor engines.A summary of these three source categories follows.
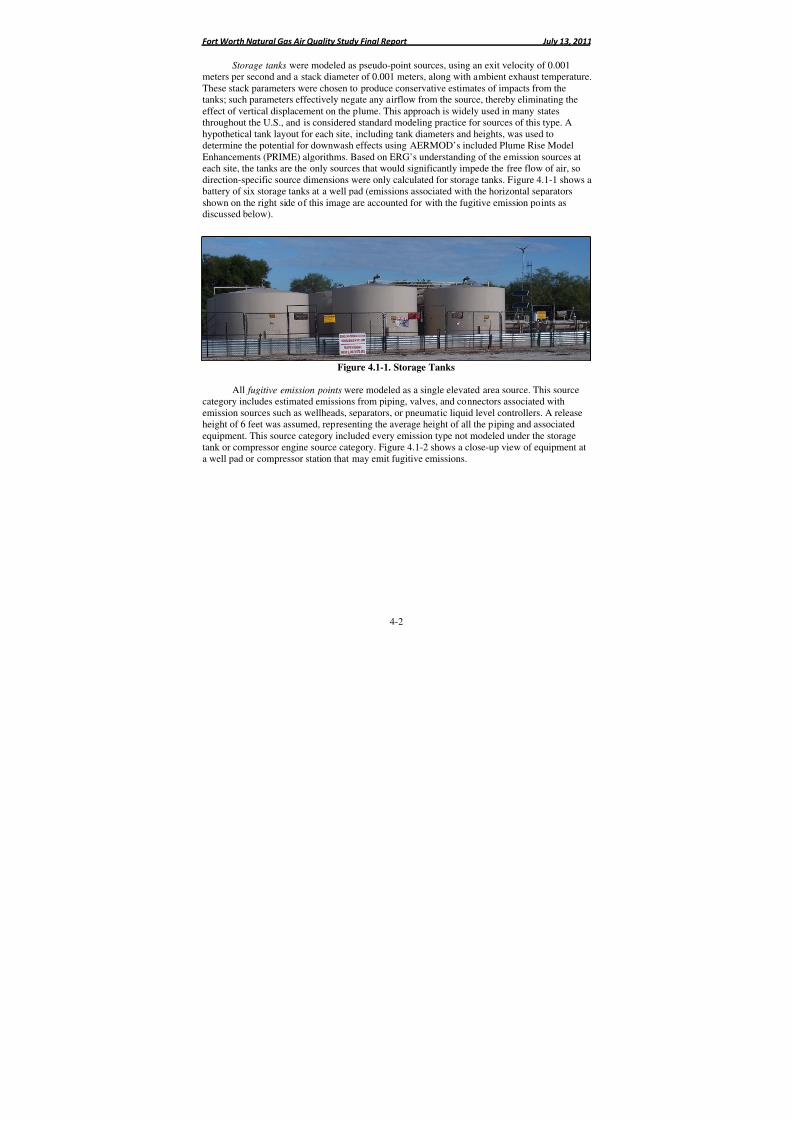
8/6/2019 Air Quality Study Final
http://slidepdf.com/reader/full/air-quality-study-final 194/320
Fort Worth Natural Gas Air Quality Study Final Report July 13, 2011
4-2
Storage tanks were modeled as pseudo-point sources, using an exit velocity of 0.001meters per second and a stack diameter of 0.001 meters, along with ambient exhaust temperature.These stack parameters were chosen to produce conservative estimates of impacts from thetanks; such parameters effectively negate any airflow from the source, thereby eliminating theeffect of vertical displacement on the plume. This approach is widely used in many states
throughout the U.S., and is considered standard modeling practice for sources of this type. Ahypothetical tank layout for each site, including tank diameters and heights, was used todetermine the potential for downwash effects using AERMOD’s included Plume Rise ModelEnhancements (PRIME) algorithms. Based on ERG’s understanding of the emission sources ateach site, the tanks are the only sources that would significantly impede the free flow of air, sodirection-specific source dimensions were only calculated for storage tanks. Figure 4.1-1 shows abattery of six storage tanks at a well pad (emissions associated with the horizontal separatorsshown on the right side of this image are accounted for with the fugitive emission points asdiscussed below).
Figure 4.1-1. Storage Tanks
All fugitive emission points were modeled as a single elevated area source. This sourcecategory includes estimated emissions from piping, valves, and connectors associated withemission sources such as wellheads, separators, or pneumatic liquid level controllers. A releaseheight of 6 feet was assumed, representing the average height of all the piping and associatedequipment. This source category included every emission type not modeled under the storagetank or compressor engine source category. Figure 4.1-2 shows a close-up view of equipment ata well pad or compressor station that may emit fugitive emissions.
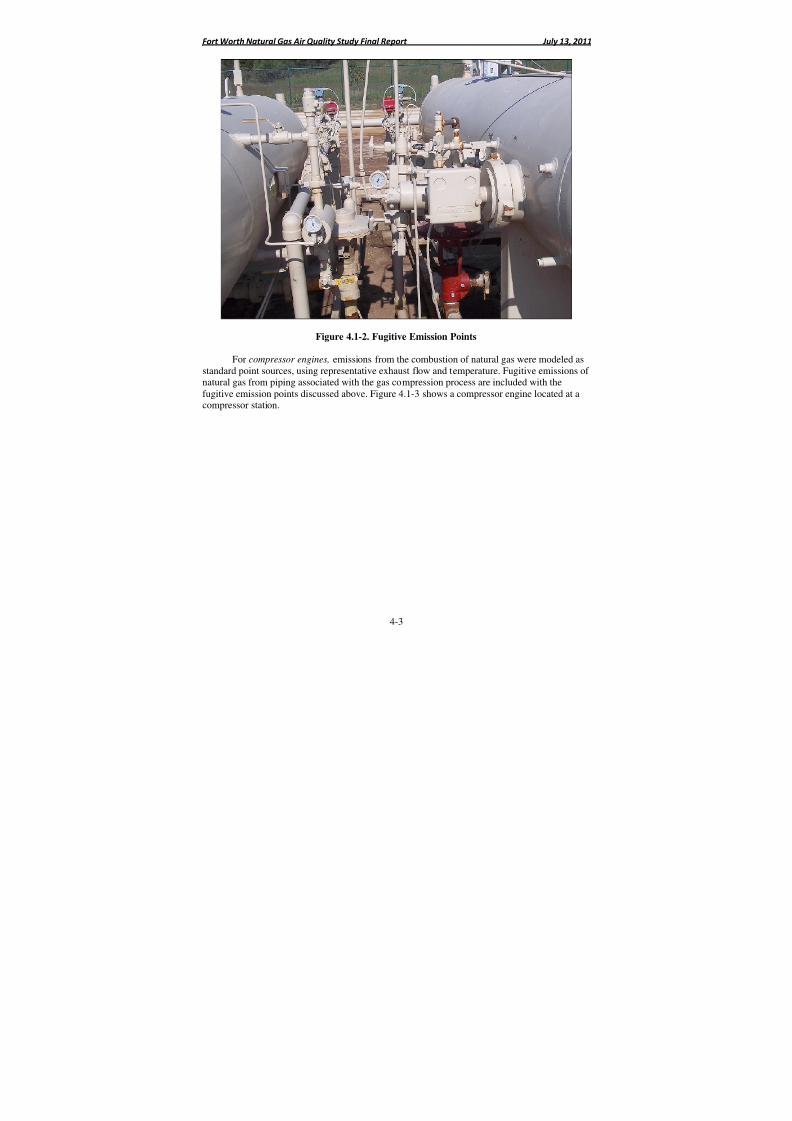
8/6/2019 Air Quality Study Final
http://slidepdf.com/reader/full/air-quality-study-final 195/320
Fort Worth Natural Gas Air Quality Study Final Report July 13, 2011
4-3
Figure 4.1-2. Fugitive Emission Points
For compressor engines, emissions from the combustion of natural gas were modeled asstandard point sources, using representative exhaust flow and temperature. Fugitive emissions of
natural gas from piping associated with the gas compression process are included with thefugitive emission points discussed above. Figure 4.1-3 shows a compressor engine located at acompressor station.
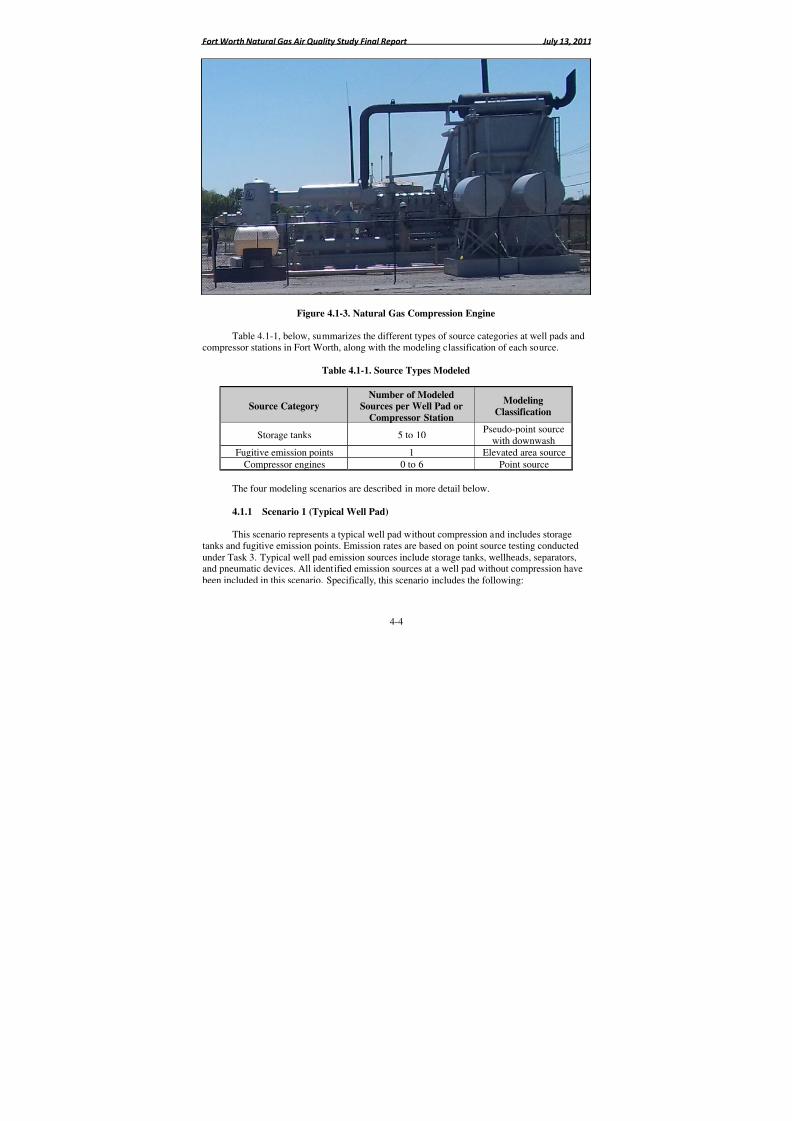
8/6/2019 Air Quality Study Final
http://slidepdf.com/reader/full/air-quality-study-final 196/320
Fort Worth Natural Gas Air Quality Study Final Report July 13, 2011
4-4
Figure 4.1-3. Natural Gas Compression Engine
Table 4.1-1, below, summarizes the different types of source categories at well pads andcompressor stations in Fort Worth, along with the modeling classification of each source.
Table 4.1-1. Source Types Modeled
Source CategoryNumber of Modeled
Sources per Well Pad or
Compressor Station
Modeling
Classification
Storage tanks 5 to 10Pseudo-point source
with downwashFugitive emission points 1 Elevated area source
Compressor engines 0 to 6 Point source
The four modeling scenarios are described in more detail below.
4.1.1 Scenario 1 (Typical Well Pad)
This scenario represents a typical well pad without compression and includes storagetanks and fugitive emission points. Emission rates are based on point source testing conductedunder Task 3. Typical well pad emission sources include storage tanks, wellheads, separators,and pneumatic devices. All identified emission sources at a well pad without compression havebeen included in this scenario. Specifically, this scenario includes the following:
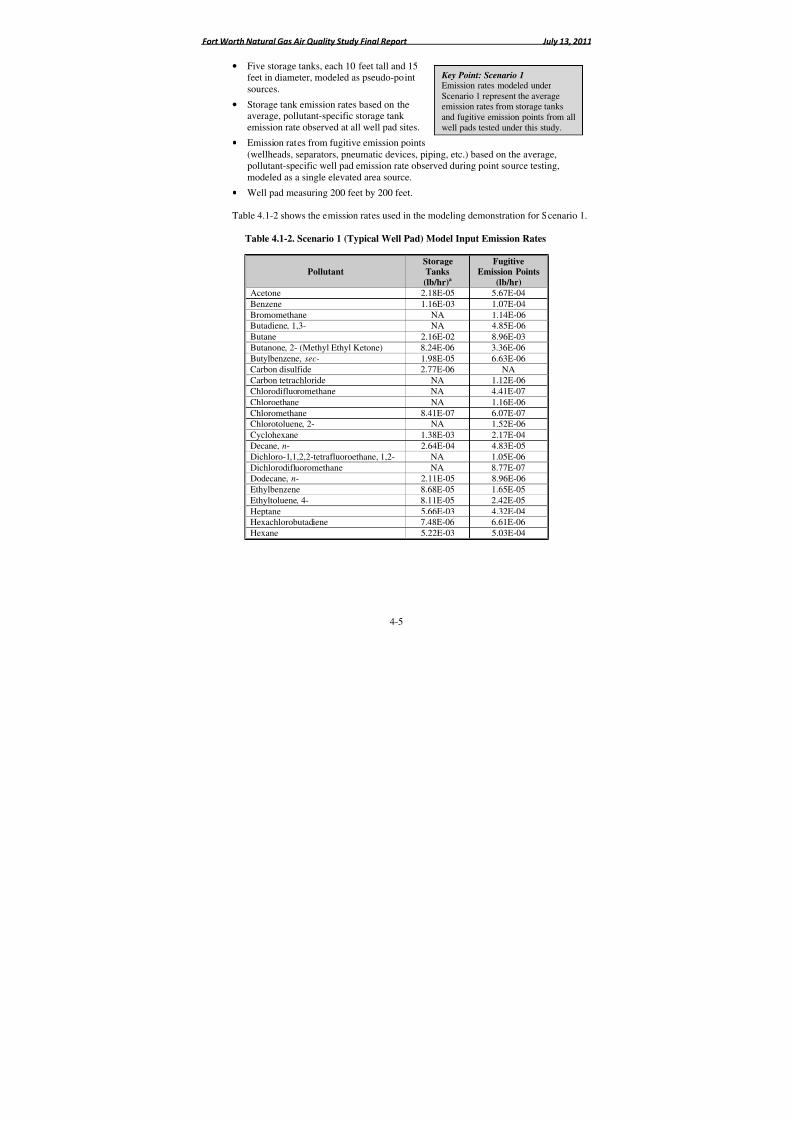
8/6/2019 Air Quality Study Final
http://slidepdf.com/reader/full/air-quality-study-final 197/320
Fort Worth Natural Gas Air Quality Study Final Report July 13, 2011
4-5
• Five storage tanks, each 10 feet tall and 15feet in diameter, modeled as pseudo-pointsources.
• Storage tank emission rates based on theaverage, pollutant-specific storage tank
emission rate observed at all well pad sites.
• Emission rates from fugitive emission points(wellheads, separators, pneumatic devices, piping, etc.) based on the average,pollutant-specific well pad emission rate observed during point source testing,modeled as a single elevated area source.
• Well pad measuring 200 feet by 200 feet.
Table 4.1-2 shows the emission rates used in the modeling demonstration for Scenario 1.
Table 4.1-2. Scenario 1 (Typical Well Pad) Model Input Emission Rates
PollutantStorageTanks
(lb/hr)a
FugitiveEmission Points
(lb/hr)
Acetone 2.18E-05 5.67E-04
Benzene 1.16E-03 1.07E-04
Bromomethane NA 1.14E-06Butadiene, 1,3- NA 4.85E-06
Butane 2.16E-02 8.96E-03
Butanone, 2- (Methyl Ethyl Ketone) 8.24E-06 3.36E-06
Butylbenzene, sec- 1.98E-05 6.63E-06Carbon disulfide 2.77E-06 NA
Carbon tetrachloride NA 1.12E-06Chlorodifluoromethane NA 4.41E-07
Chloroethane NA 1.16E-06
Chloromethane 8.41E-07 6.07E-07Chlorotoluene, 2- NA 1.52E-06
Cyclohexane 1.38E-03 2.17E-04
Decane, n- 2.64E-04 4.83E-05
Dichloro-1,1,2,2-tetrafluoroethane, 1,2- NA 1.05E-06
Dichlorodifluoromethane NA 8.77E-07Dodecane, n- 2.11E-05 8.96E-06
Ethylbenzene 8.68E-05 1.65E-05
Ethyltoluene, 4- 8.11E-05 2.42E-05
Heptane 5.66E-03 4.32E-04Hexachlorobutadiene 7.48E-06 6.61E-06
Hexane 5.22E-03 5.03E-04
Key Point: Scenario 1Emission rates modeled underScenario 1 represent the averageemission rates from storage tanksand fugitive emission points from all
well pads tested under this study.
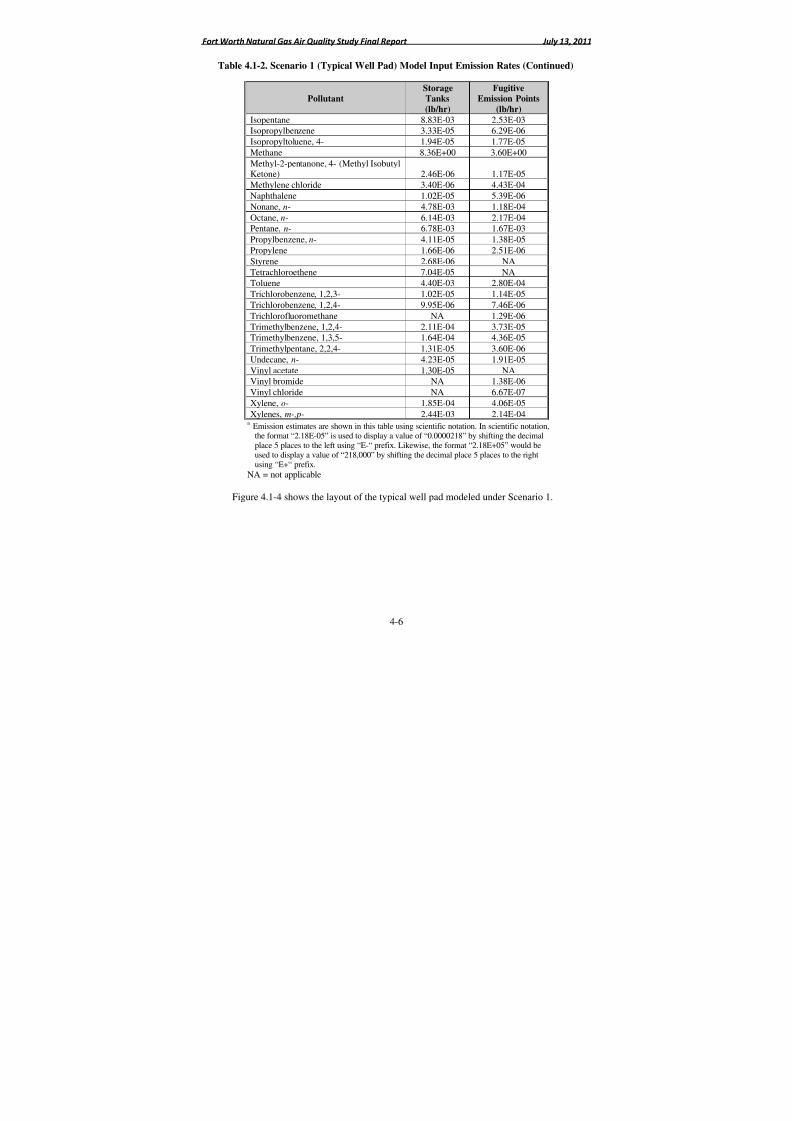
8/6/2019 Air Quality Study Final
http://slidepdf.com/reader/full/air-quality-study-final 198/320
Fort Worth Natural Gas Air Quality Study Final Report July 13, 2011
4-6
Table 4.1-2. Scenario 1 (Typical Well Pad) Model Input Emission Rates (Continued)
Pollutant
Storage
Tanks
(lb/hr)
Fugitive
Emission Points
(lb/hr)
Isopentane 8.83E-03 2.53E-03Isopropylbenzene 3.33E-05 6.29E-06
Isopropyltoluene, 4- 1.94E-05 1.77E-05
Methane 8.36E+00 3.60E+00
Methyl-2-pentanone, 4- (Methyl IsobutylKetone) 2.46E-06 1.17E-05
Methylene chloride 3.40E-06 4.43E-04
Naphthalene 1.02E-05 5.39E-06
Nonane, n- 4.78E-03 1.18E-04
Octane, n- 6.14E-03 2.17E-04Pentane, n- 6.78E-03 1.67E-03
Propylbenzene, n- 4.11E-05 1.38E-05
Propylene 1.66E-06 2.51E-06Styrene 2.68E-06 NA
Tetrachloroethene 7.04E-05 NAToluene 4.40E-03 2.80E-04
Trichlorobenzene, 1,2,3- 1.02E-05 1.14E-05
Trichlorobenzene, 1,2,4- 9.95E-06 7.46E-06
Trichlorofluoromethane NA 1.29E-06
Trimethylbenzene, 1,2,4- 2.11E-04 3.73E-05Trimethylbenzene, 1,3,5- 1.64E-04 4.36E-05
Trimethylpentane, 2,2,4- 1.31E-05 3.60E-06
Undecane, n- 4.23E-05 1.91E-05
Vinyl acetate 1.30E-05 NA
Vinyl bromide NA 1.38E-06Vinyl chloride NA 6.67E-07
Xylene, o- 1.85E-04 4.06E-05
Xylenes, m-,p- 2.44E-03 2.14E-04a Emission estimates are shown in this table using scientific notation. In scientific notation,
the format “2.18E-05” is used to display a value of “0.0000218” by shifting the decimalplace 5 places to the left using “E-“ prefix. Likewise, the format “2.18E+05” would beused to display a value of “218,000” by shifting the decimal place 5 places to the rightusing “E+“ prefix.
NA = not applicable
Figure 4.1-4 shows the layout of the typical well pad modeled under Scenario 1.
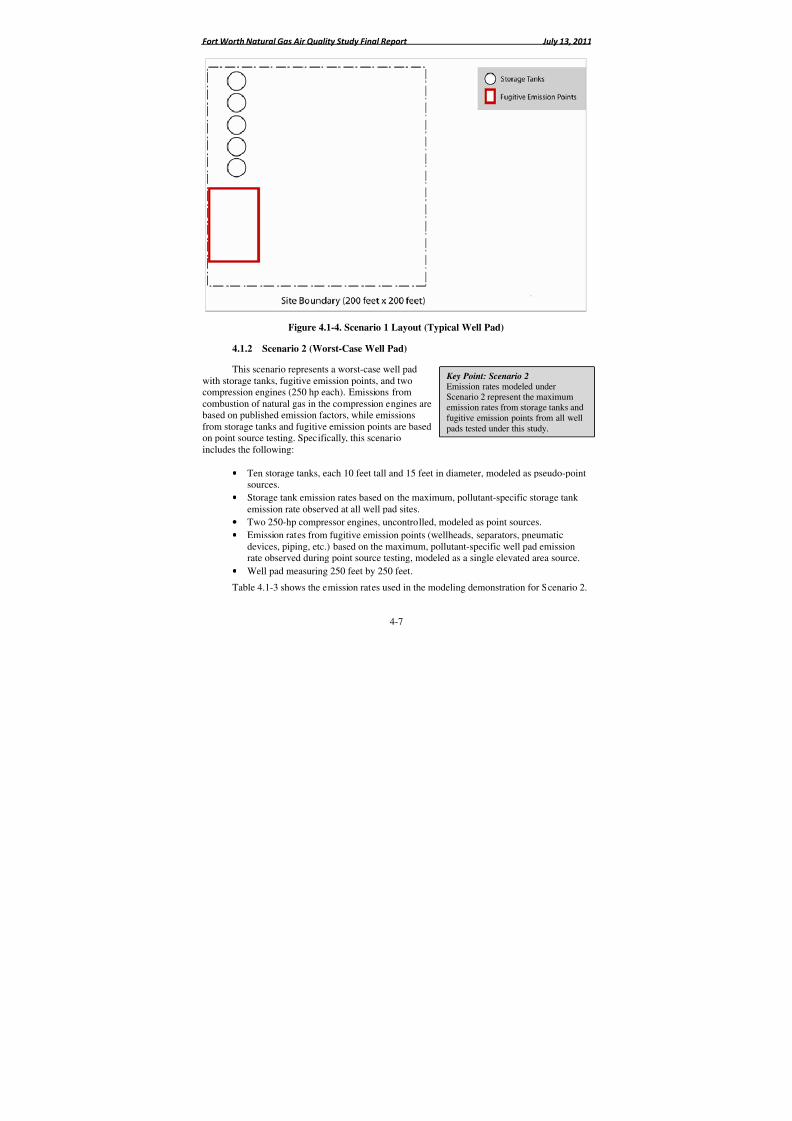
8/6/2019 Air Quality Study Final
http://slidepdf.com/reader/full/air-quality-study-final 199/320
Fort Worth Natural Gas Air Quality Study Final Report July 13, 2011
4-7
Figure 4.1-4. Scenario 1 Layout (Typical Well Pad)
4.1.2 Scenario 2 (Worst-Case Well Pad)
This scenario represents a worst-case well pad
with storage tanks, fugitive emission points, and twocompression engines (250 hp each). Emissions fromcombustion of natural gas in the compression engines arebased on published emission factors, while emissionsfrom storage tanks and fugitive emission points are basedon point source testing. Specifically, this scenarioincludes the following:
• Ten storage tanks, each 10 feet tall and 15 feet in diameter, modeled as pseudo-pointsources.
• Storage tank emission rates based on the maximum, pollutant-specific storage tank
emission rate observed at all well pad sites.• Two 250-hp compressor engines, uncontrolled, modeled as point sources.
• Emission rates from fugitive emission points (wellheads, separators, pneumaticdevices, piping, etc.) based on the maximum, pollutant-specific well pad emissionrate observed during point source testing, modeled as a single elevated area source.
• Well pad measuring 250 feet by 250 feet.
Table 4.1-3 shows the emission rates used in the modeling demonstration for Scenario 2.
Key Point: Scenario 2Emission rates modeled underScenario 2 represent the maximumemission rates from storage tanks andfugitive emission points from all wellpads tested under this study.
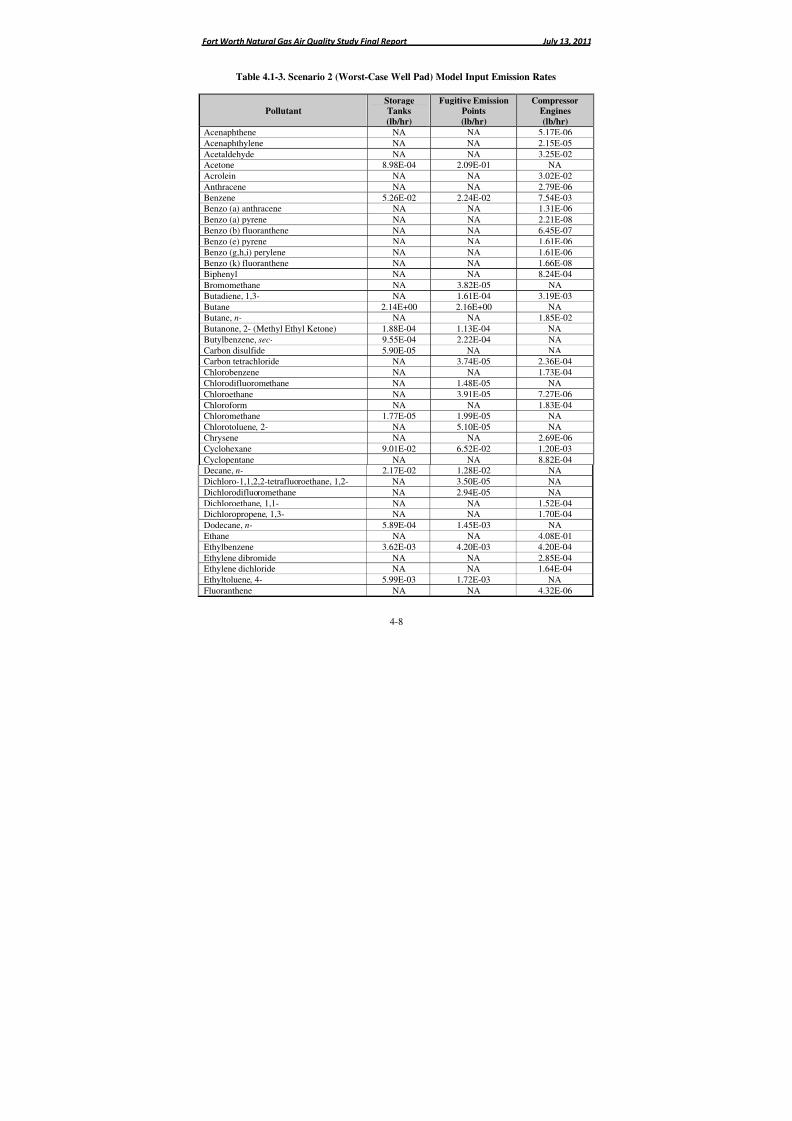
8/6/2019 Air Quality Study Final
http://slidepdf.com/reader/full/air-quality-study-final 200/320
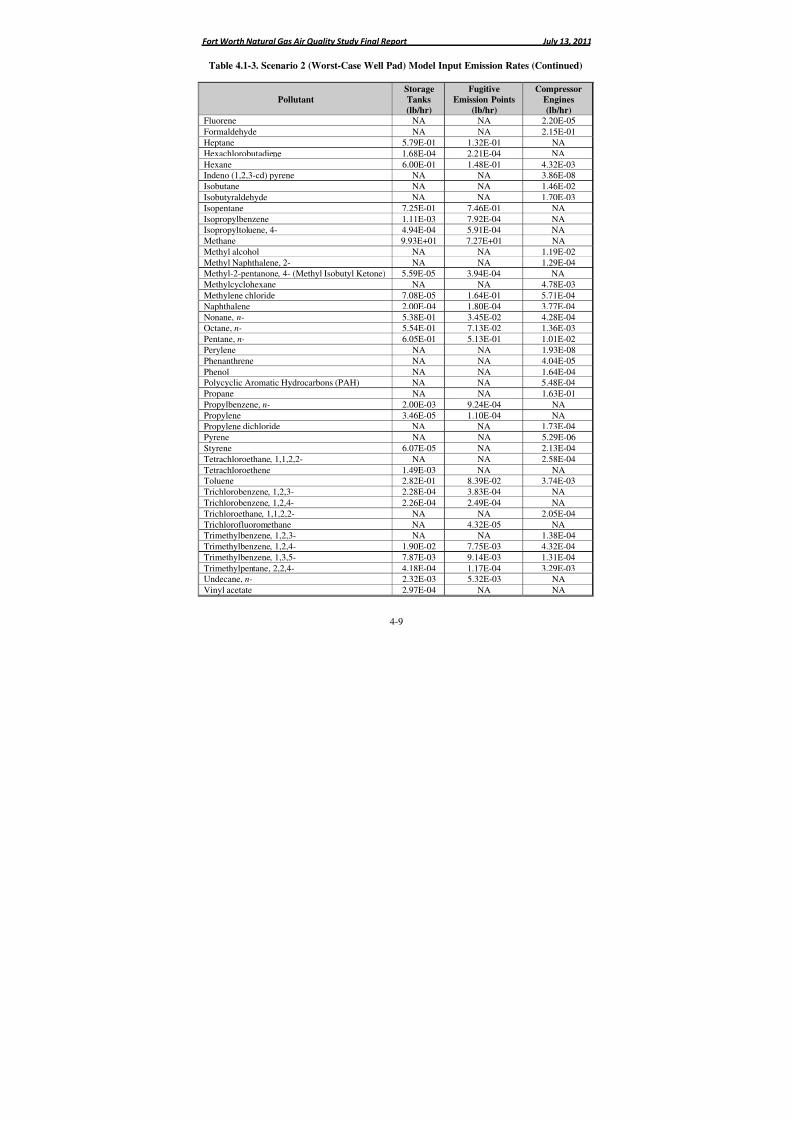
8/6/2019 Air Quality Study Final
http://slidepdf.com/reader/full/air-quality-study-final 201/320
Fort Worth Natural Gas Air Quality Study Final Report July 13, 2011
4-9
Table 4.1-3. Scenario 2 (Worst-Case Well Pad) Model Input Emission Rates (Continued)
Pollutant
Storage
Tanks
(lb/hr)
Fugitive
Emission Points
(lb/hr)
Compressor
Engines
(lb/hr)
Fluorene NA NA 2.20E-05
Formaldehyde NA NA 2.15E-01
Heptane 5.79E-01 1.32E-01 NA
Hexachlorobutadiene 1.68E-04 2.21E-04 NA
Hexane 6.00E-01 1.48E-01 4.32E-03Indeno (1,2,3-cd) pyrene NA NA 3.86E-08
Isobutane NA NA 1.46E-02
Isobutyraldehyde NA NA 1.70E-03
Isopentane 7.25E-01 7.46E-01 NA
Isopropylbenzene 1.11E-03 7.92E-04 NAIsopropyltoluene, 4- 4.94E-04 5.91E-04 NA
Methane 9.93E+01 7.27E+01 NA
Methyl alcohol NA NA 1.19E-02Methyl Naphthalene, 2- NA NA 1.29E-04Methyl-2-pentanone, 4- (Methyl Isobutyl Ketone) 5.59E-05 3.94E-04 NA
Methylcyclohexane NA NA 4.78E-03
Methylene chloride 7.08E-05 1.64E-01 5.71E-04
Naphthalene 2.00E-04 1.80E-04 3.77E-04
Nonane, n- 5.38E-01 3.45E-02 4.28E-04Octane, n- 5.54E-01 7.13E-02 1.36E-03
Pentane, n- 6.05E-01 5.13E-01 1.01E-02
Perylene NA NA 1.93E-08
Phenanthrene NA NA 4.04E-05
Phenol NA NA 1.64E-04
Polycyclic Aromatic Hydrocarbons (PAH) NA NA 5.48E-04Propane NA NA 1.63E-01
Propylbenzene, n- 2.00E-03 9.24E-04 NA
Propylene 3.46E-05 1.10E-04 NAPropylene dichloride NA NA 1.73E-04
Pyrene NA NA 5.29E-06
Styrene 6.07E-05 NA 2.13E-04
Tetrachloroethane, 1,1,2,2- NA NA 2.58E-04
Tetrachloroethene 1.49E-03 NA NAToluene 2.82E-01 8.39E-02 3.74E-03
Trichlorobenzene, 1,2,3- 2.28E-04 3.83E-04 NA
Trichlorobenzene, 1,2,4- 2.26E-04 2.49E-04 NATrichloroethane, 1,1,2,2- NA NA 2.05E-04
Trichlorofluoromethane NA 4.32E-05 NATrimethylbenzene, 1,2,3- NA NA 1.38E-04
Trimethylbenzene, 1,2,4- 1.90E-02 7.75E-03 4.32E-04
Trimethylbenzene, 1,3,5- 7.87E-03 9.14E-03 1.31E-04
Trimethylpentane, 2,2,4- 4.18E-04 1.17E-04 3.29E-03Undecane, n- 2.32E-03 5.32E-03 NA
Vinyl acetate 2.97E-04 NA NA
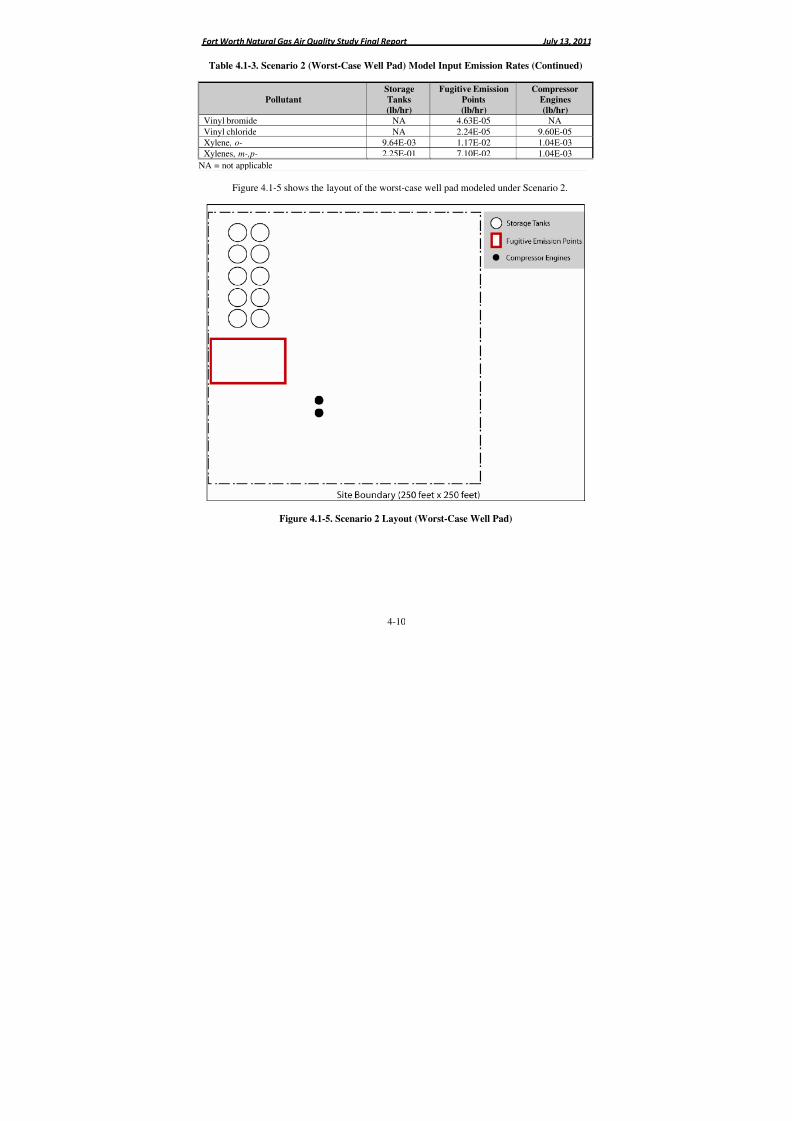
8/6/2019 Air Quality Study Final
http://slidepdf.com/reader/full/air-quality-study-final 202/320
Fort Worth Natural Gas Air Quality Study Final Report July 13, 2011
4-10
Table 4.1-3. Scenario 2 (Worst-Case Well Pad) Model Input Emission Rates (Continued)
Pollutant
Storage
Tanks
(lb/hr)
Fugitive Emission
Points
(lb/hr)
Compressor
Engines
(lb/hr)
Vinyl bromide NA 4.63E-05 NA
Vinyl chloride NA 2.24E-05 9.60E-05
Xylene, o- 9.64E-03 1.17E-02 1.04E-03
Xylenes, m-,p- 2.25E-01 7.10E-02 1.04E-03
NA = not applicable
Figure 4.1-5 shows the layout of the worst-case well pad modeled under Scenario 2.
Figure 4.1-5. Scenario 2 Layout (Worst-Case Well Pad)
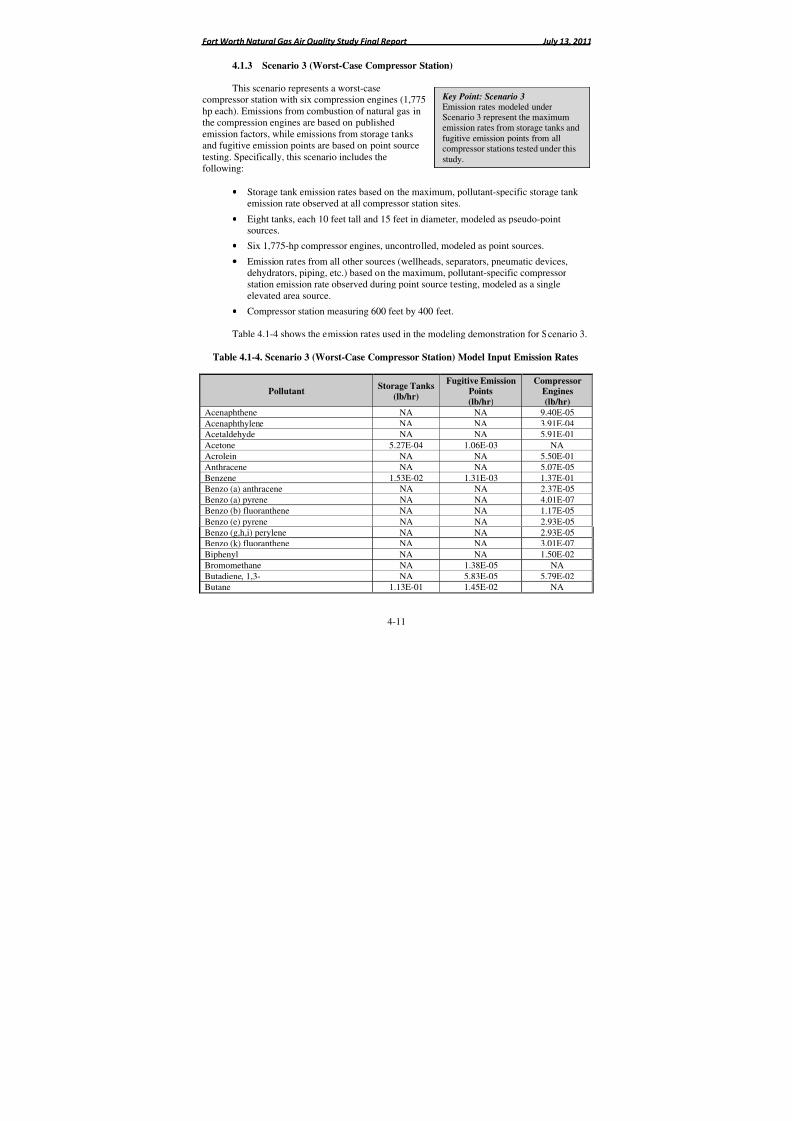
8/6/2019 Air Quality Study Final
http://slidepdf.com/reader/full/air-quality-study-final 203/320
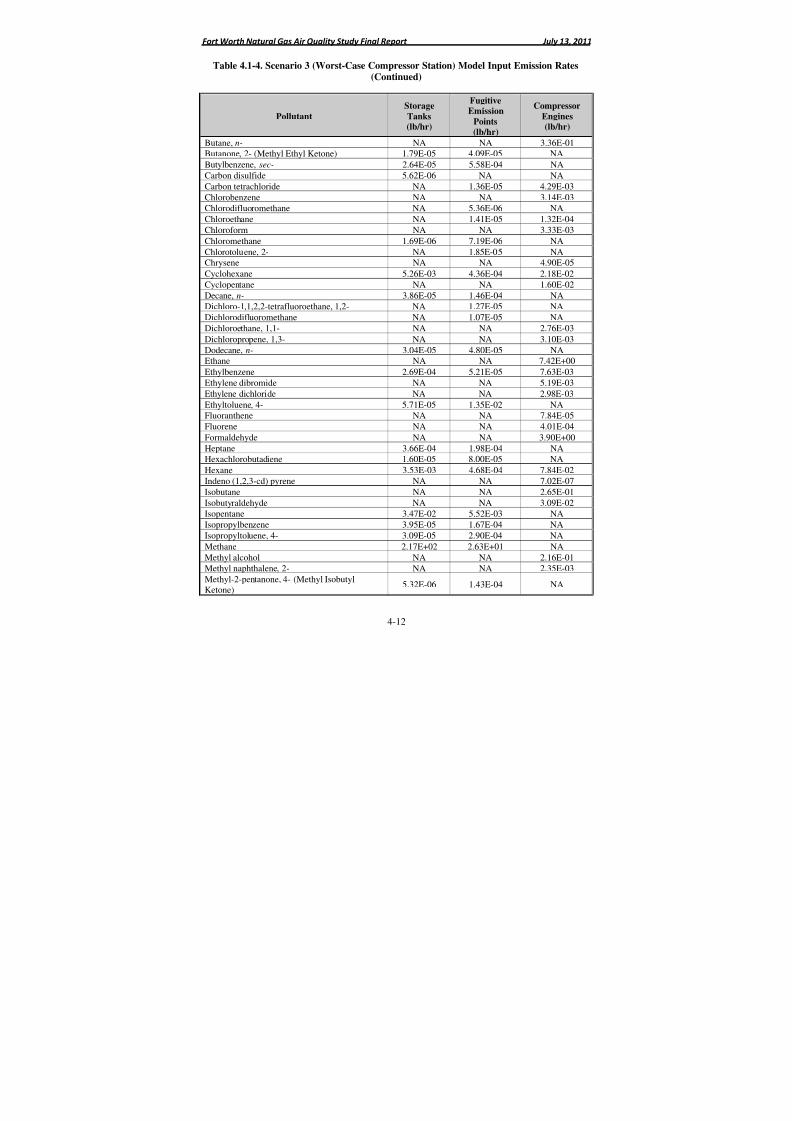
8/6/2019 Air Quality Study Final
http://slidepdf.com/reader/full/air-quality-study-final 204/320
Fort Worth Natural Gas Air Quality Study Final Report July 13, 2011
4-12
Table 4.1-4. Scenario 3 (Worst-Case Compressor Station) Model Input Emission Rates(Continued)
Pollutant
Storage
Tanks
(lb/hr)
FugitiveEmission
Points
(lb/hr)
Compressor
Engines
(lb/hr)
Butane, n- NA NA 3.36E-01Butanone, 2- (Methyl Ethyl Ketone) 1.79E-05 4.09E-05 NA
Butylbenzene, sec- 2.64E-05 5.58E-04 NA
Carbon disulfide 5.62E-06 NA NA
Carbon tetrachloride NA 1.36E-05 4.29E-03
Chlorobenzene NA NA 3.14E-03Chlorodifluoromethane NA 5.36E-06 NA
Chloroethane NA 1.41E-05 1.32E-04
Chloroform NA NA 3.33E-03
Chloromethane 1.69E-06 7.19E-06 NA
Chlorotoluene, 2- NA 1.85E-05 NAChrysene NA NA 4.90E-05
Cyclohexane 5.26E-03 4.36E-04 2.18E-02
Cyclopentane NA NA 1.60E-02
Decane, n- 3.86E-05 1.46E-04 NADichloro-1,1,2,2-tetrafluoroethane, 1,2- NA 1.27E-05 NA
Dichlorodifluoromethane NA 1.07E-05 NA
Dichloroethane, 1,1- NA NA 2.76E-03
Dichloropropene, 1,3- NA NA 3.10E-03
Dodecane, n- 3.04E-05 4.80E-05 NAEthane NA NA 7.42E+00
Ethylbenzene 2.69E-04 5.21E-05 7.63E-03
Ethylene dibromide NA NA 5.19E-03Ethylene dichloride NA NA 2.98E-03
Ethyltoluene, 4- 5.71E-05 1.35E-02 NAFluoranthene NA NA 7.84E-05
Fluorene NA NA 4.01E-04
Formaldehyde NA NA 3.90E+00
Heptane 3.66E-04 1.98E-04 NAHexachlorobutadiene 1.60E-05 8.00E-05 NA
Hexane 3.53E-03 4.68E-04 7.84E-02
Indeno (1,2,3-cd) pyrene NA NA 7.02E-07
Isobutane NA NA 2.65E-01
Isobutyraldehyde NA NA 3.09E-02Isopentane 3.47E-02 5.52E-03 NA
Isopropylbenzene 3.95E-05 1.67E-04 NA
Isopropyltoluene, 4- 3.09E-05 2.90E-04 NA
Methane 2.17E+02 2.63E+01 NA
Methyl alcohol NA NA 2.16E-01Methyl naphthalene, 2- NA NA 2.35E-03
Methyl-2-pentanone, 4- (Methyl IsobutylKetone)
5.32E-06 1.43E-04 NA
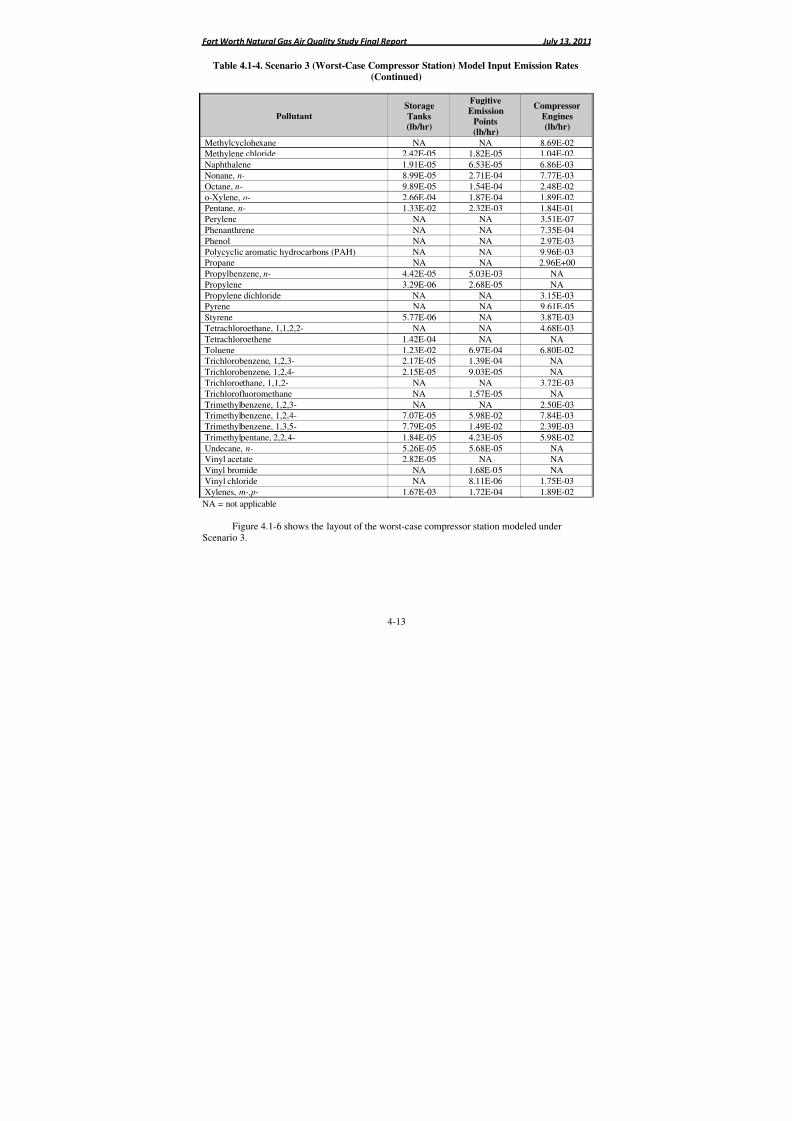
8/6/2019 Air Quality Study Final
http://slidepdf.com/reader/full/air-quality-study-final 205/320
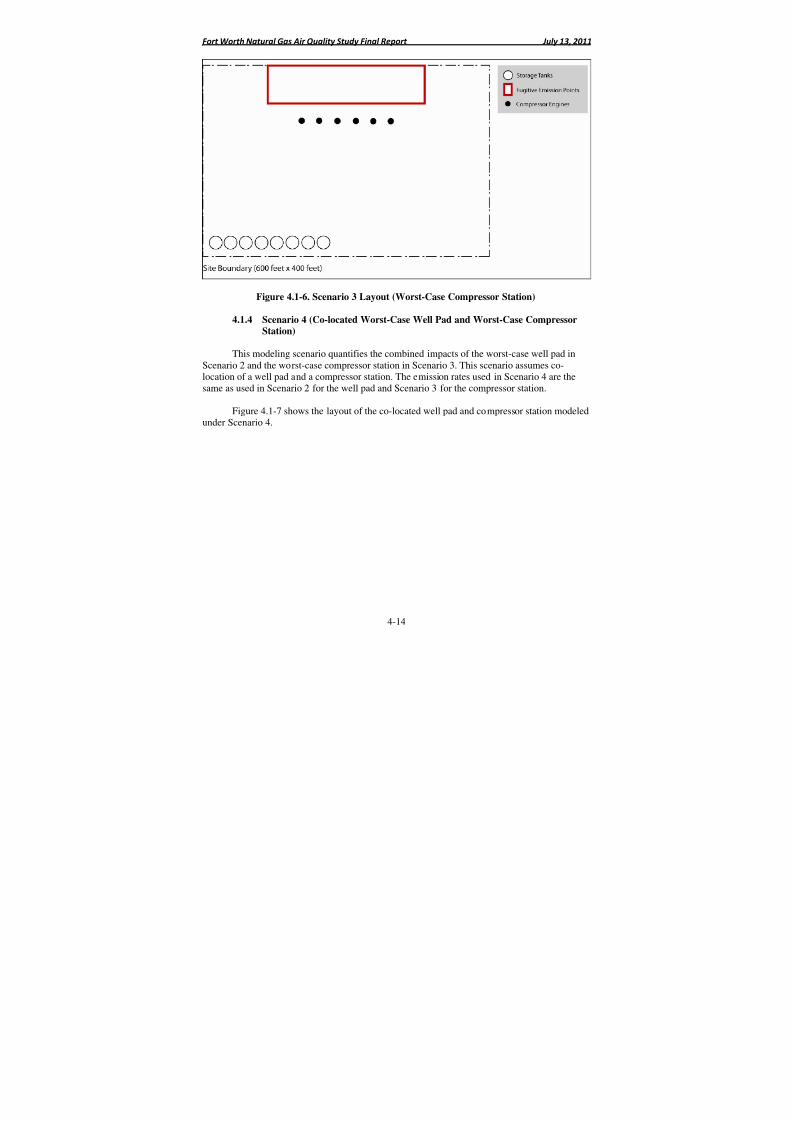
8/6/2019 Air Quality Study Final
http://slidepdf.com/reader/full/air-quality-study-final 206/320
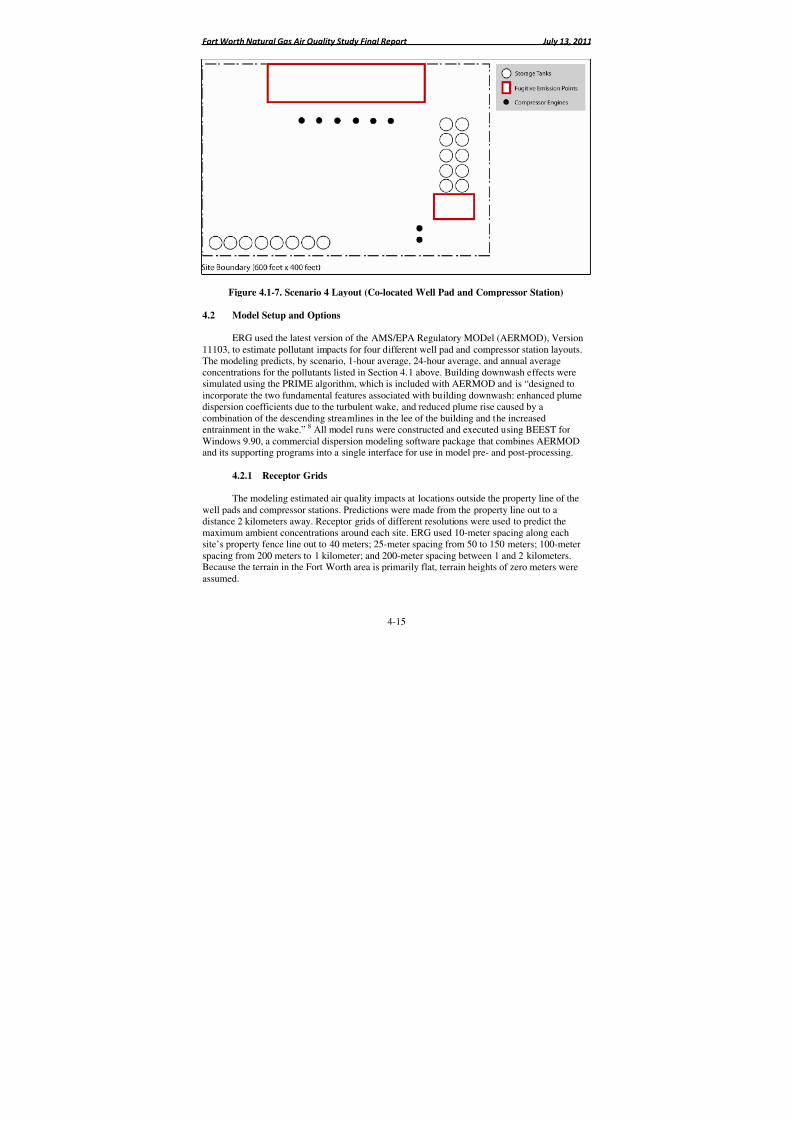
8/6/2019 Air Quality Study Final
http://slidepdf.com/reader/full/air-quality-study-final 207/320
Fort Worth Natural Gas Air Quality Study Final Report July 13, 2011
4-15
Figure 4.1-7. Scenario 4 Layout (Co-located Well Pad and Compressor Station)
4.2 Model Setup and Options
ERG used the latest version of the AMS/EPA Regulatory MODel (AERMOD), Version11103, to estimate pollutant impacts for four different well pad and compressor station layouts.The modeling predicts, by scenario, 1-hour average, 24-hour average, and annual averageconcentrations for the pollutants listed in Section 4.1 above. Building downwash effects were
simulated using the PRIME algorithm, which is included with AERMOD and is “designed toincorporate the two fundamental features associated with building downwash: enhanced plumedispersion coefficients due to the turbulent wake, and reduced plume rise caused by acombination of the descending streamlines in the lee of the building and the increasedentrainment in the wake.” 8 All model runs were constructed and executed using BEEST forWindows 9.90, a commercial dispersion modeling software package that combines AERMODand its supporting programs into a single interface for use in model pre- and post-processing.
4.2.1 Receptor Grids
The modeling estimated air quality impacts at locations outside the property line of the
well pads and compressor stations. Predictions were made from the property line out to adistance 2 kilometers away. Receptor grids of different resolutions were used to predict themaximum ambient concentrations around each site. ERG used 10-meter spacing along eachsite’s property fence line out to 40 meters; 25-meter spacing from 50 to 150 meters; 100-meterspacing from 200 meters to 1 kilometer; and 200-meter spacing between 1 and 2 kilometers.Because the terrain in the Fort Worth area is primarily flat, terrain heights of zero meters wereassumed.
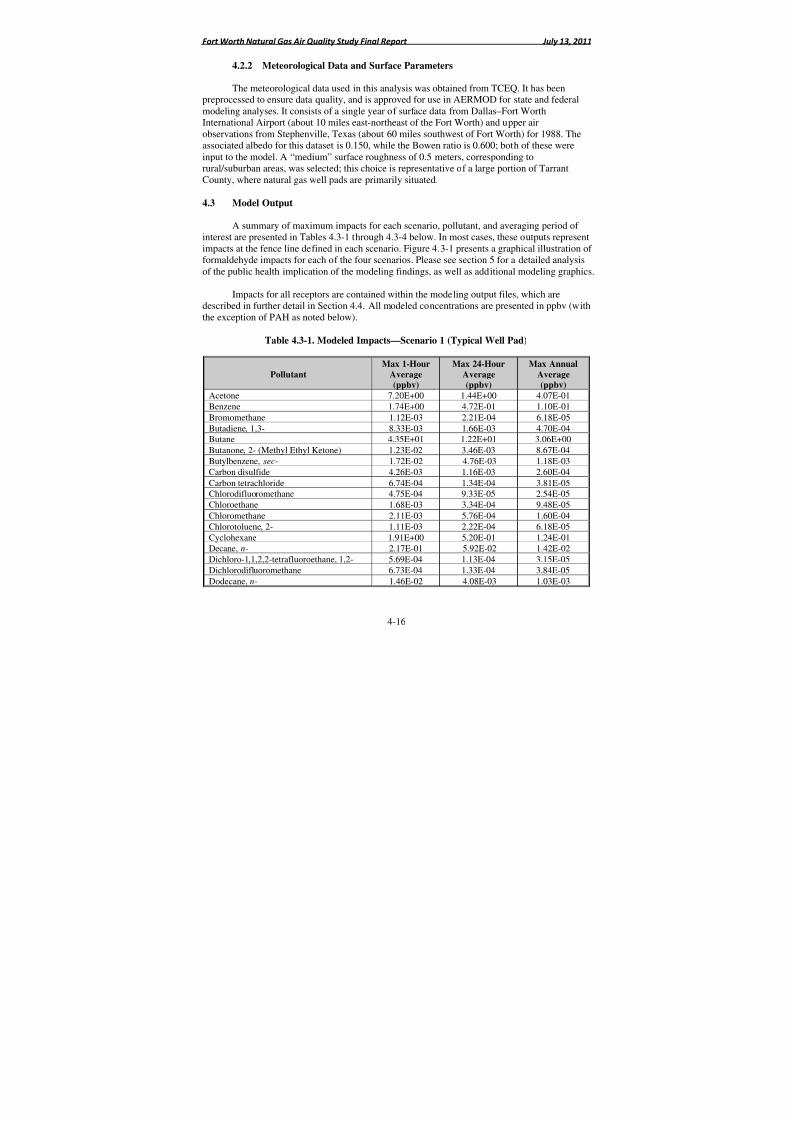
8/6/2019 Air Quality Study Final
http://slidepdf.com/reader/full/air-quality-study-final 208/320
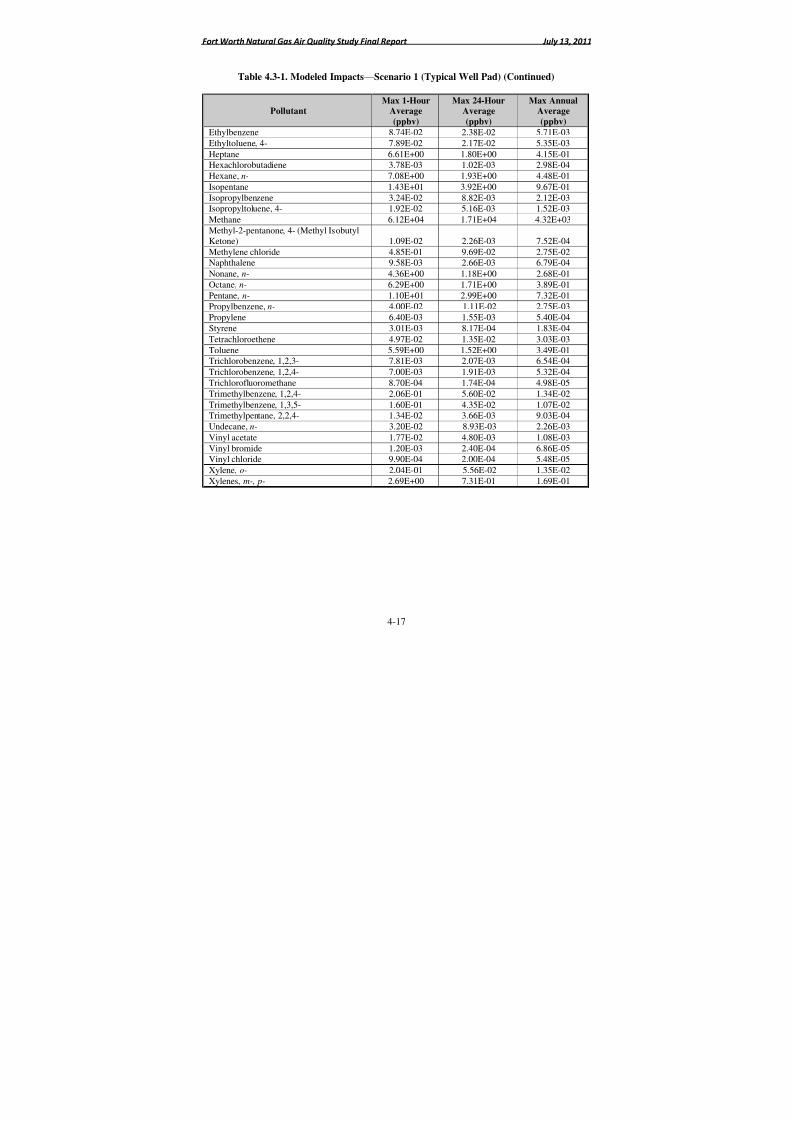
8/6/2019 Air Quality Study Final
http://slidepdf.com/reader/full/air-quality-study-final 209/320
Fort Worth Natural Gas Air Quality Study Final Report July 13, 2011
4-17
Table 4.3-1. Modeled Impacts—Scenario 1 (Typical Well Pad) (Continued)
PollutantMax 1-Hour
Average
(ppbv)
Max 24-HourAverage
(ppbv)
Max AnnualAverage
(ppbv)
Ethylbenzene 8.74E-02 2.38E-02 5.71E-03
Ethyltoluene, 4- 7.89E-02 2.17E-02 5.35E-03
Heptane 6.61E+00 1.80E+00 4.15E-01Hexachlorobutadiene 3.78E-03 1.02E-03 2.98E-04
Hexane, n- 7.08E+00 1.93E+00 4.48E-01
Isopentane 1.43E+01 3.92E+00 9.67E-01
Isopropylbenzene 3.24E-02 8.82E-03 2.12E-03Isopropyltoluene, 4- 1.92E-02 5.16E-03 1.52E-03
Methane 6.12E+04 1.71E+04 4.32E+03
Methyl-2-pentanone, 4- (Methyl IsobutylKetone) 1.09E-02 2.26E-03 7.52E-04
Methylene chloride 4.85E-01 9.69E-02 2.75E-02Naphthalene 9.58E-03 2.66E-03 6.79E-04
Nonane, n- 4.36E+00 1.18E+00 2.68E-01
Octane, n- 6.29E+00 1.71E+00 3.89E-01
Pentane, n- 1.10E+01 2.99E+00 7.32E-01Propylbenzene, n- 4.00E-02 1.11E-02 2.75E-03
Propylene 6.40E-03 1.55E-03 5.40E-04
Styrene 3.01E-03 8.17E-04 1.83E-04
Tetrachloroethene 4.97E-02 1.35E-02 3.03E-03
Toluene 5.59E+00 1.52E+00 3.49E-01Trichlorobenzene, 1,2,3- 7.81E-03 2.07E-03 6.54E-04
Trichlorobenzene, 1,2,4- 7.00E-03 1.91E-03 5.32E-04
Trichlorofluoromethane 8.70E-04 1.74E-04 4.98E-05Trimethylbenzene, 1,2,4- 2.06E-01 5.60E-02 1.34E-02
Trimethylbenzene, 1,3,5- 1.60E-01 4.35E-02 1.07E-02Trimethylpentane, 2,2,4- 1.34E-02 3.66E-03 9.03E-04
Undecane, n- 3.20E-02 8.93E-03 2.26E-03
Vinyl acetate 1.77E-02 4.80E-03 1.08E-03
Vinyl bromide 1.20E-03 2.40E-04 6.86E-05Vinyl chloride 9.90E-04 2.00E-04 5.48E-05
Xylene, o- 2.04E-01 5.56E-02 1.35E-02
Xylenes, m-, p- 2.69E+00 7.31E-01 1.69E-01

8/6/2019 Air Quality Study Final
http://slidepdf.com/reader/full/air-quality-study-final 210/320

8/6/2019 Air Quality Study Final
http://slidepdf.com/reader/full/air-quality-study-final 211/320

8/6/2019 Air Quality Study Final
http://slidepdf.com/reader/full/air-quality-study-final 212/320
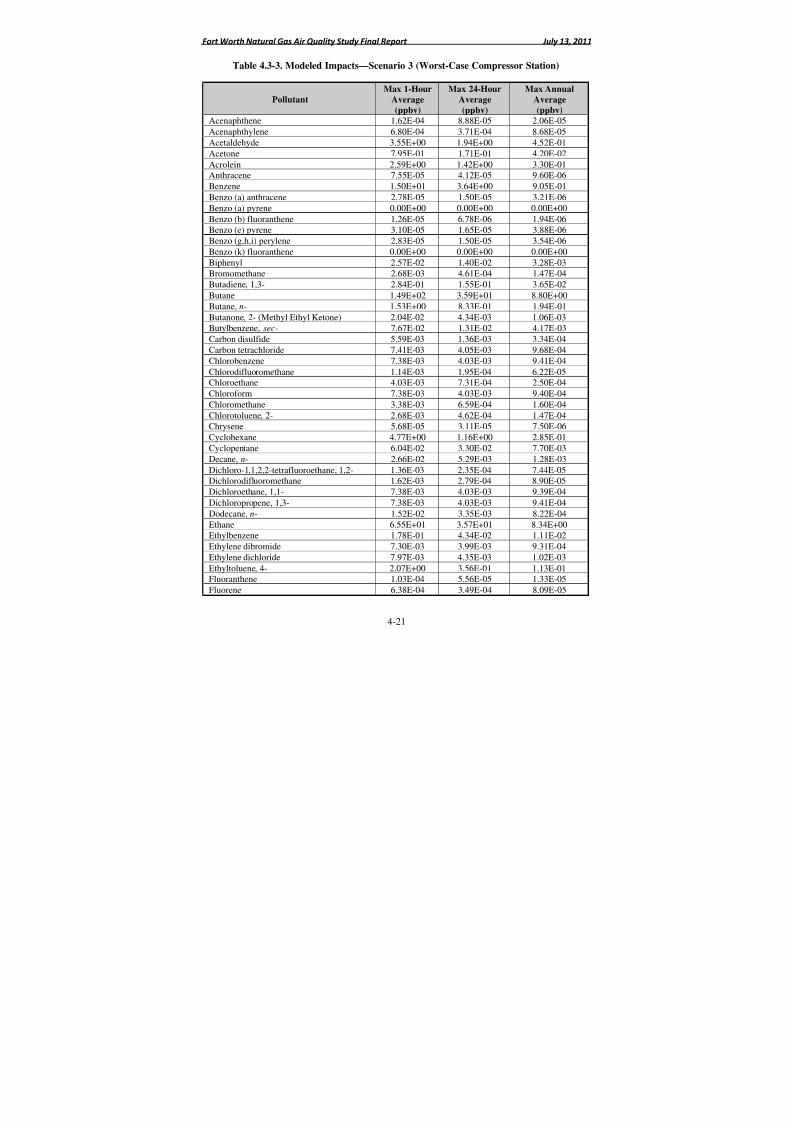
8/6/2019 Air Quality Study Final
http://slidepdf.com/reader/full/air-quality-study-final 213/320
Fort Worth Natural Gas Air Quality Study Final Report July 13, 2011
4-21
Table 4.3-3. Modeled Impacts—Scenario 3 (Worst-Case Compressor Station)
Pollutant
Max 1-Hour
Average
(ppbv)
Max 24-Hour
Average
(ppbv)
Max Annual
Average
(ppbv)
Acenaphthene 1.62E-04 8.88E-05 2.06E-05
Acenaphthylene 6.80E-04 3.71E-04 8.68E-05
Acetaldehyde 3.55E+00 1.94E+00 4.52E-01
Acetone 7.95E-01 1.71E-01 4.20E-02
Acrolein 2.59E+00 1.42E+00 3.30E-01Anthracene 7.55E-05 4.12E-05 9.60E-06
Benzene 1.50E+01 3.64E+00 9.05E-01
Benzo (a) anthracene 2.78E-05 1.50E-05 3.21E-06
Benzo (a) pyrene 0.00E+00 0.00E+00 0.00E+00
Benzo (b) fluoranthene 1.26E-05 6.78E-06 1.94E-06Benzo (e) pyrene 3.10E-05 1.65E-05 3.88E-06
Benzo (g,h,i) perylene 2.83E-05 1.50E-05 3.54E-06
Benzo (k) fluoranthene 0.00E+00 0.00E+00 0.00E+00Biphenyl 2.57E-02 1.40E-02 3.28E-03Bromomethane 2.68E-03 4.61E-04 1.47E-04
Butadiene, 1,3- 2.84E-01 1.55E-01 3.65E-02
Butane 1.49E+02 3.59E+01 8.80E+00
Butane, n- 1.53E+00 8.33E-01 1.94E-01
Butanone, 2- (Methyl Ethyl Ketone) 2.04E-02 4.34E-03 1.06E-03Butylbenzene, sec- 7.67E-02 1.31E-02 4.17E-03
Carbon disulfide 5.59E-03 1.36E-03 3.34E-04
Carbon tetrachloride 7.41E-03 4.05E-03 9.68E-04
Chlorobenzene 7.38E-03 4.03E-03 9.41E-04
Chlorodifluoromethane 1.14E-03 1.95E-04 6.22E-05
Chloroethane 4.03E-03 7.31E-04 2.50E-04Chloroform 7.38E-03 4.03E-03 9.40E-04
Chloromethane 3.38E-03 6.59E-04 1.60E-04
Chlorotoluene, 2- 2.68E-03 4.62E-04 1.47E-04Chrysene 5.68E-05 3.11E-05 7.50E-06
Cyclohexane 4.77E+00 1.16E+00 2.85E-01
Cyclopentane 6.04E-02 3.30E-02 7.70E-03
Decane, n- 2.66E-02 5.29E-03 1.28E-03
Dichloro-1,1,2,2-tetrafluoroethane, 1,2- 1.36E-03 2.35E-04 7.44E-05Dichlorodifluoromethane 1.62E-03 2.79E-04 8.90E-05
Dichloroethane, 1,1- 7.38E-03 4.03E-03 9.39E-04
Dichloropropene, 1,3- 7.38E-03 4.03E-03 9.41E-04Dodecane, n- 1.52E-02 3.35E-03 8.22E-04
Ethane 6.55E+01 3.57E+01 8.34E+00Ethylbenzene 1.78E-01 4.34E-02 1.11E-02
Ethylene dibromide 7.30E-03 3.99E-03 9.31E-04
Ethylene dichloride 7.97E-03 4.35E-03 1.02E-03
Ethyltoluene, 4- 2.07E+00 3.56E-01 1.13E-01Fluoranthene 1.03E-04 5.56E-05 1.33E-05
Fluorene 6.38E-04 3.49E-04 8.09E-05
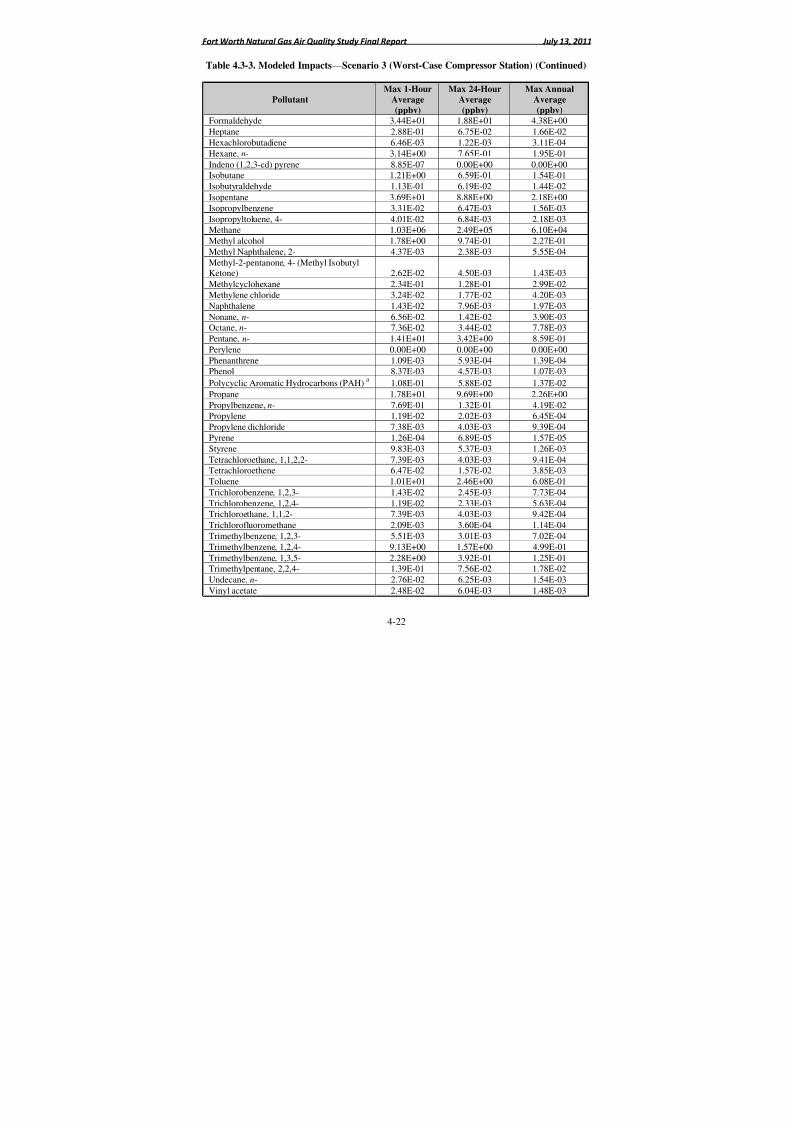
8/6/2019 Air Quality Study Final
http://slidepdf.com/reader/full/air-quality-study-final 214/320
Fort Worth Natural Gas Air Quality Study Final Report July 13, 2011
4-22
Table 4.3-3. Modeled Impacts—Scenario 3 (Worst-Case Compressor Station) (Continued)
Pollutant
Max 1-Hour
Average
(ppbv)
Max 24-Hour
Average
(ppbv)
Max Annual
Average
(ppbv)
Formaldehyde 3.44E+01 1.88E+01 4.38E+00
Heptane 2.88E-01 6.75E-02 1.66E-02
Hexachlorobutadiene 6.46E-03 1.22E-03 3.11E-04
Hexane, n- 3.14E+00 7.65E-01 1.95E-01
Indeno (1,2,3-cd) pyrene 8.85E-07 0.00E+00 0.00E+00Isobutane 1.21E+00 6.59E-01 1.54E-01
Isobutyraldehyde 1.13E-01 6.19E-02 1.44E-02
Isopentane 3.69E+01 8.88E+00 2.18E+00
Isopropylbenzene 3.31E-02 6.47E-03 1.56E-03
Isopropyltoluene, 4- 4.01E-02 6.84E-03 2.18E-03Methane 1.03E+06 2.49E+05 6.10E+04
Methyl alcohol 1.78E+00 9.74E-01 2.27E-01
Methyl Naphthalene, 2- 4.37E-03 2.38E-03 5.55E-04Methyl-2-pentanone, 4- (Methyl IsobutylKetone) 2.62E-02 4.50E-03 1.43E-03
Methylcyclohexane 2.34E-01 1.28E-01 2.99E-02
Methylene chloride 3.24E-02 1.77E-02 4.20E-03
Naphthalene 1.43E-02 7.96E-03 1.97E-03
Nonane, n- 6.56E-02 1.42E-02 3.90E-03Octane, n- 7.36E-02 3.44E-02 7.78E-03
Pentane, n- 1.41E+01 3.42E+00 8.59E-01
Perylene 0.00E+00 0.00E+00 0.00E+00
Phenanthrene 1.09E-03 5.93E-04 1.39E-04Phenol 8.37E-03 4.57E-03 1.07E-03
Polycyclic Aromatic Hydrocarbons (PAH) a 1.08E-01 5.88E-02 1.37E-02Propane 1.78E+01 9.69E+00 2.26E+00
Propylbenzene, n- 7.69E-01 1.32E-01 4.19E-02Propylene 1.19E-02 2.02E-03 6.45E-04
Propylene dichloride 7.38E-03 4.03E-03 9.39E-04
Pyrene 1.26E-04 6.89E-05 1.57E-05
Styrene 9.83E-03 5.37E-03 1.26E-03
Tetrachloroethane, 1,1,2,2- 7.39E-03 4.03E-03 9.41E-04Tetrachloroethene 6.47E-02 1.57E-02 3.85E-03
Toluene 1.01E+01 2.46E+00 6.08E-01
Trichlorobenzene, 1,2,3- 1.43E-02 2.45E-03 7.73E-04
Trichlorobenzene, 1,2,4- 1.19E-02 2.33E-03 5.63E-04Trichloroethane, 1,1,2- 7.39E-03 4.03E-03 9.42E-04
Trichlorofluoromethane 2.09E-03 3.60E-04 1.14E-04
Trimethylbenzene, 1,2,3- 5.51E-03 3.01E-03 7.02E-04
Trimethylbenzene, 1,2,4- 9.13E+00 1.57E+00 4.99E-01
Trimethylbenzene, 1,3,5- 2.28E+00 3.92E-01 1.25E-01Trimethylpentane, 2,2,4- 1.39E-01 7.56E-02 1.78E-02
Undecane, n- 2.76E-02 6.25E-03 1.54E-03
Vinyl acetate 2.48E-02 6.04E-03 1.48E-03

8/6/2019 Air Quality Study Final
http://slidepdf.com/reader/full/air-quality-study-final 215/320
Fort Worth Natural Gas Air Quality Study Final Report July 13, 2011
4-23
Table 4.3-3. Modeled Impacts—Scenario 3 (Worst-Case Compressor Station) (Continued)
Pollutant
Max 1-Hour
Average
(ppbv)
Max 24-Hour
Average
(ppbv)
Max Annual
Average
(ppbv)
Vinyl bromide 2.88E-03 4.96E-04 1.58E-04
Vinyl Chloride 7.43E-03 4.08E-03 9.82E-04
Xylene, o- 2.00E-01 4.81E-02 1.32E-02
Xylenes, m-,p- 1.20E+00 2.92E-01 7.29E-02a
Concentration in (µg/m3).
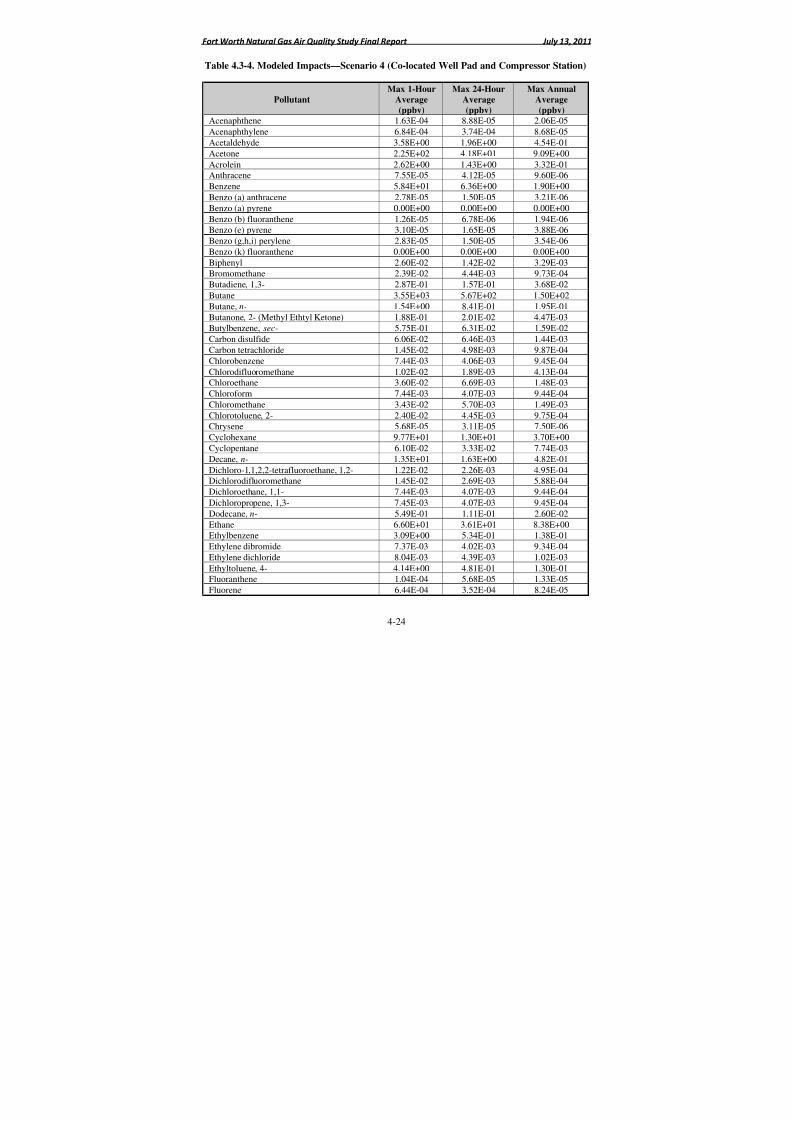
8/6/2019 Air Quality Study Final
http://slidepdf.com/reader/full/air-quality-study-final 216/320
Fort Worth Natural Gas Air Quality Study Final Report July 13, 2011
4-24
Table 4.3-4. Modeled Impacts—Scenario 4 (Co-located Well Pad and Compressor Station)
Pollutant
Max 1-Hour
Average
(ppbv)
Max 24-Hour
Average
(ppbv)
Max Annual
Average
(ppbv)
Acenaphthene 1.63E-04 8.88E-05 2.06E-05
Acenaphthylene 6.84E-04 3.74E-04 8.68E-05
Acetaldehyde 3.58E+00 1.96E+00 4.54E-01
Acetone 2.25E+02 4.18E+01 9.09E+00
Acrolein 2.62E+00 1.43E+00 3.32E-01Anthracene 7.55E-05 4.12E-05 9.60E-06
Benzene 5.84E+01 6.36E+00 1.90E+00
Benzo (a) anthracene 2.78E-05 1.50E-05 3.21E-06
Benzo (a) pyrene 0.00E+00 0.00E+00 0.00E+00
Benzo (b) fluoranthene 1.26E-05 6.78E-06 1.94E-06Benzo (e) pyrene 3.10E-05 1.65E-05 3.88E-06
Benzo (g,h,i) perylene 2.83E-05 1.50E-05 3.54E-06
Benzo (k) fluoranthene 0.00E+00 0.00E+00 0.00E+00Biphenyl 2.60E-02 1.42E-02 3.29E-03Bromomethane 2.39E-02 4.44E-03 9.73E-04
Butadiene, 1,3- 2.87E-01 1.57E-01 3.68E-02
Butane 3.55E+03 5.67E+02 1.50E+02
Butane, n- 1.54E+00 8.41E-01 1.95E-01
Butanone, 2- (Methyl Ethtyl Ketone) 1.88E-01 2.01E-02 4.47E-03Butylbenzene, sec- 5.75E-01 6.31E-02 1.59E-02
Carbon disulfide 6.06E-02 6.46E-03 1.44E-03
Carbon tetrachloride 1.45E-02 4.98E-03 9.87E-04
Chlorobenzene 7.44E-03 4.06E-03 9.45E-04
Chlorodifluoromethane 1.02E-02 1.89E-03 4.13E-04
Chloroethane 3.60E-02 6.69E-03 1.48E-03Chloroform 7.44E-03 4.07E-03 9.44E-04
Chloromethane 3.43E-02 5.70E-03 1.49E-03
Chlorotoluene, 2- 2.40E-02 4.45E-03 9.75E-04Chrysene 5.68E-05 3.11E-05 7.50E-06
Cyclohexane 9.77E+01 1.30E+01 3.70E+00
Cyclopentane 6.10E-02 3.33E-02 7.74E-03
Decane, n- 1.35E+01 1.63E+00 4.82E-01
Dichloro-1,1,2,2-tetrafluoroethane, 1,2- 1.22E-02 2.26E-03 4.95E-04Dichlorodifluoromethane 1.45E-02 2.69E-03 5.88E-04
Dichloroethane, 1,1- 7.44E-03 4.07E-03 9.44E-04
Dichloropropene, 1,3- 7.45E-03 4.07E-03 9.45E-04Dodecane, n- 5.49E-01 1.11E-01 2.60E-02
Ethane 6.60E+01 3.61E+01 8.38E+00Ethylbenzene 3.09E+00 5.34E-01 1.38E-01
Ethylene dibromide 7.37E-03 4.02E-03 9.34E-04
Ethylene dichloride 8.04E-03 4.39E-03 1.02E-03
Ethyltoluene, 4- 4.14E+00 4.81E-01 1.30E-01Fluoranthene 1.04E-04 5.68E-05 1.33E-05
Fluorene 6.44E-04 3.52E-04 8.24E-05
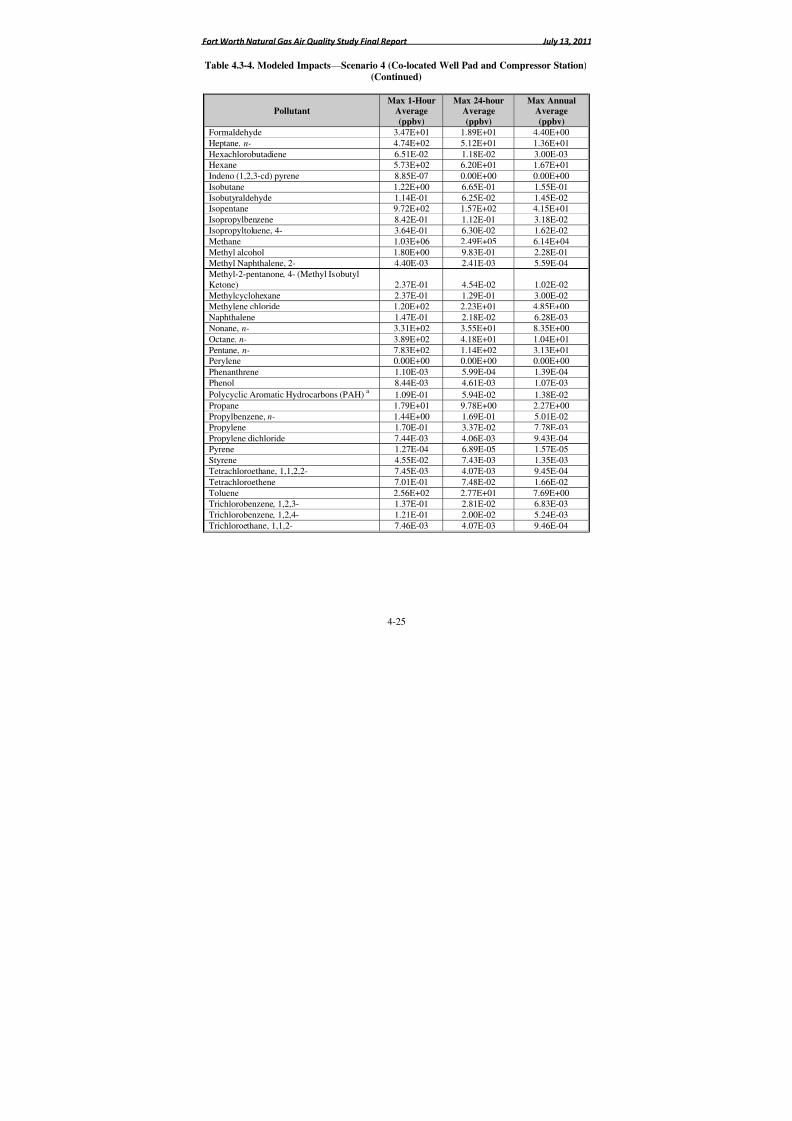
8/6/2019 Air Quality Study Final
http://slidepdf.com/reader/full/air-quality-study-final 217/320

8/6/2019 Air Quality Study Final
http://slidepdf.com/reader/full/air-quality-study-final 218/320
Fort Worth Natural Gas Air Quality Study Final Report July 13, 2011
4-26
Table 4.3-4. Modeled Impacts—Scenario 4 (Co-located Well Pad and Compressor Station)
(Continued)
PollutantMax 1-Hour
Average
(ppbv)
Max 24-HourAverage
(ppbv)
Max AnnualAverage
(ppbv)
Trichlorofluoromethane 1.87E-02 3.48E-03 7.62E-04
Trimethylbenzene, 1,2,3- 5.56E-03 3.04E-03 7.06E-04
Trimethylbenzene, 1,2,4- 1.35E+01 1.64E+00 5.14E-01Trimethylbenzene, 1,3,5- 6.49E+00 1.16E+00 2.97E-01
Trimethylpentane, 2,2,4- 3.03E-01 8.17E-02 1.82E-02
Undecane, n- 2.19E+00 4.47E-01 1.05E-01
Vinyl acetate 2.69E-01 2.87E-02 6.37E-03Vinyl bromide 2.57E-02 4.78E-03 1.05E-03
Vinyl chloride 7.46E-03 4.07E-03 9.47E-04
Xylene, o- 9.08E+00 1.61E+00 4.13E-01
Xylenes, m-,p- 1.78E+02 1.93E+01 5.41E+00
a Concentration in (µg/m3).
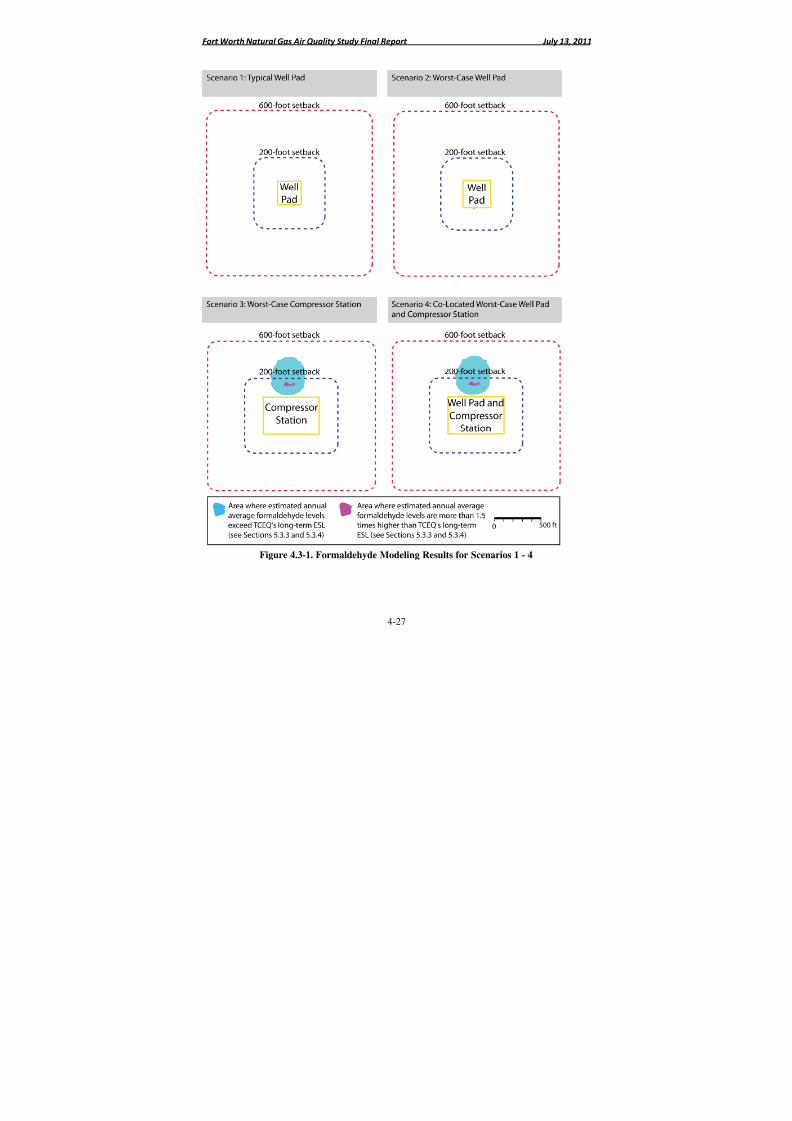
8/6/2019 Air Quality Study Final
http://slidepdf.com/reader/full/air-quality-study-final 219/320
Fort Worth Natural Gas Air Quality Study Final Report July 13, 2011
4-27
Figure 4.3-1. Formaldehyde Modeling Results for Scenarios 1 - 4
8/6/2019 Air Quality Study Final
http://slidepdf.com/reader/full/air-quality-study-final 220/320
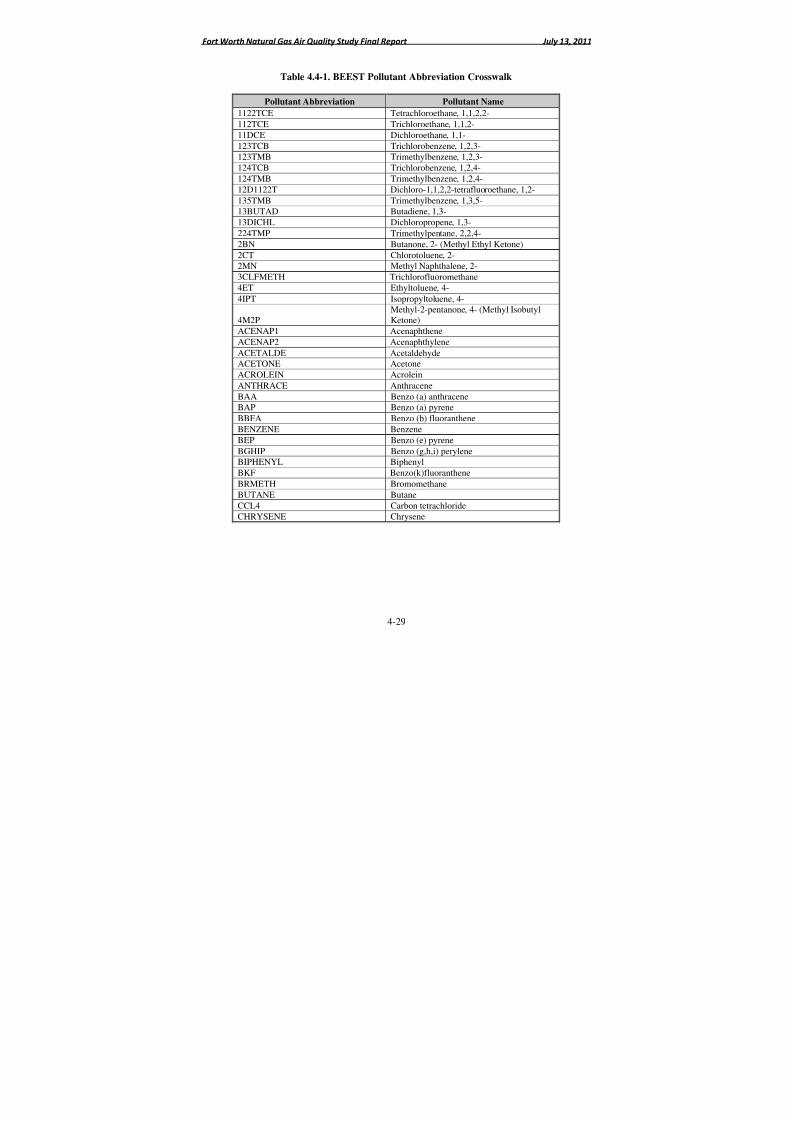
8/6/2019 Air Quality Study Final
http://slidepdf.com/reader/full/air-quality-study-final 221/320
Fort Worth Natural Gas Air Quality Study Final Report July 13, 2011
4-29
Table 4.4-1. BEEST Pollutant Abbreviation Crosswalk
Pollutant Abbreviation Pollutant Name
1122TCE Tetrachloroethane, 1,1,2,2-
112TCE Trichloroethane, 1,1,2-11DCE Dichloroethane, 1,1-
123TCB Trichlorobenzene, 1,2,3-123TMB Trimethylbenzene, 1,2,3-
124TCB Trichlorobenzene, 1,2,4-
124TMB Trimethylbenzene, 1,2,4-
12D1122T Dichloro-1,1,2,2-tetrafluoroethane, 1,2-
135TMB Trimethylbenzene, 1,3,5-13BUTAD Butadiene, 1,3-
13DICHL Dichloropropene, 1,3-
224TMP Trimethylpentane, 2,2,4-
2BN Butanone, 2- (Methyl Ethyl Ketone)
2CT Chlorotoluene, 2-2MN Methyl Naphthalene, 2-
3CLFMETH Trichlorofluoromethane
4ET Ethyltoluene, 4-
4IPT Isopropyltoluene, 4-
4M2PMethyl-2-pentanone, 4- (Methyl IsobutylKetone)
ACENAP1 Acenaphthene
ACENAP2 Acenaphthylene
ACETALDE AcetaldehydeACETONE Acetone
ACROLEIN Acrolein
ANTHRACE Anthracene
BAA Benzo (a) anthraceneBAP Benzo (a) pyrene
BBFA Benzo (b) fluoranthene
BENZENE Benzene
BEP Benzo (e) pyrene
BGHIP Benzo (g,h,i) peryleneBIPHENYL Biphenyl
BKF Benzo(k)fluoranthene
BRMETH Bromomethane
BUTANE Butane
CCL4 Carbon tetrachlorideCHRYSENE Chrysene
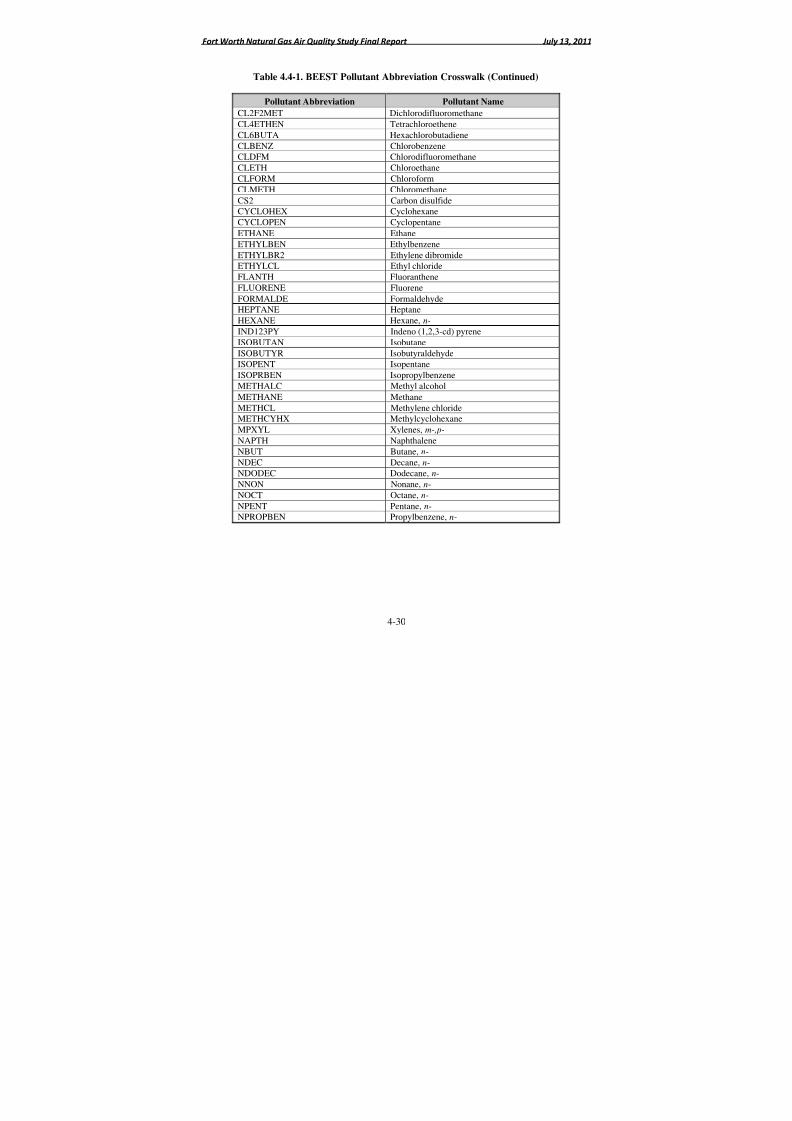
8/6/2019 Air Quality Study Final
http://slidepdf.com/reader/full/air-quality-study-final 222/320
Fort Worth Natural Gas Air Quality Study Final Report July 13, 2011
4-30
Table 4.4-1. BEEST Pollutant Abbreviation Crosswalk (Continued)
Pollutant Abbreviation Pollutant Name
CL2F2MET Dichlorodifluoromethane
CL4ETHEN TetrachloroetheneCL6BUTA Hexachlorobutadiene
CLBENZ ChlorobenzeneCLDFM Chlorodifluoromethane
CLETH Chloroethane
CLFORM Chloroform
CLMETH Chloromethane
CS2 Carbon disulfideCYCLOHEX Cyclohexane
CYCLOPEN Cyclopentane
ETHANE Ethane
ETHYLBEN Ethylbenzene
ETHYLBR2 Ethylene dibromideETHYLCL Ethyl chloride
FLANTH Fluoranthene
FLUORENE Fluorene
FORMALDE FormaldehydeHEPTANE Heptane
HEXANE Hexane, n-
IND123PY Indeno (1,2,3-cd) pyrene
ISOBUTAN Isobutane
ISOBUTYR IsobutyraldehydeISOPENT Isopentane
ISOPRBEN Isopropylbenzene
METHALC Methyl alcohol
METHANE Methane
METHCL Methylene chlorideMETHCYHX Methylcyclohexane
MPXYL Xylenes, m-,p-
NAPTH Naphthalene
NBUT Butane, n-
NDEC Decane, n-NDODEC Dodecane, n-
NNON Nonane, n-
NOCT Octane, n-
NPENT Pentane, n-NPROPBEN Propylbenzene, n-
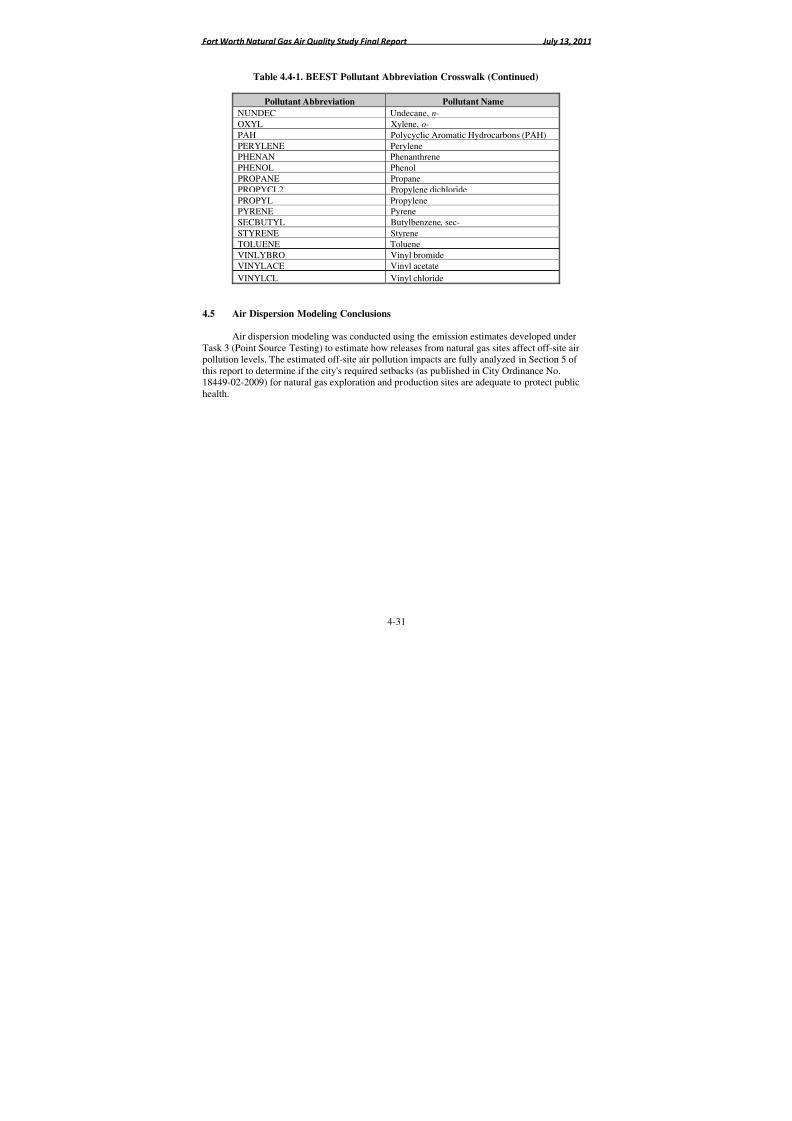
8/6/2019 Air Quality Study Final
http://slidepdf.com/reader/full/air-quality-study-final 223/320
Fort Worth Natural Gas Air Quality Study Final Report July 13, 2011
4-31
Table 4.4-1. BEEST Pollutant Abbreviation Crosswalk (Continued)
Pollutant Abbreviation Pollutant Name
NUNDEC Undecane, n-
OXYL Xylene, o-PAH Polycyclic Aromatic Hydrocarbons (PAH)
PERYLENE PerylenePHENAN Phenanthrene
PHENOL Phenol
PROPANE Propane
PROPYCL2 Propylene dichloride
PROPYL PropylenePYRENE Pyrene
SECBUTYL Butylbenzene, sec-
STYRENE Styrene
TOLUENE Toluene
VINLYBRO Vinyl bromideVINYLACE Vinyl acetate
VINYLCL Vinyl chloride
4.5 Air Dispersion Modeling Conclusions
Air dispersion modeling was conducted using the emission estimates developed underTask 3 (Point Source Testing) to estimate how releases from natural gas sites affect off-site airpollution levels. The estimated off-site air pollution impacts are fully analyzed in Section 5 of this report to determine if the city's required setbacks (as published in City Ordinance No.
18449-02-2009) for natural gas exploration and production sites are adequate to protect publichealth.
8/6/2019 Air Quality Study Final
http://slidepdf.com/reader/full/air-quality-study-final 224/320
8/6/2019 Air Quality Study Final
http://slidepdf.com/reader/full/air-quality-study-final 225/320
Fort Worth Natural Gas Air Quality Study Final Report July 13, 2011
5-2
concentrations found to have been associated with adverse health effects. This means thatresidents are generally not expected to experience health effects when exposed to air pollutionlevels that are lower than health-based screening levels—but also that the levels are notthresholds for toxicity. Measured or modeled air pollution levels above a health-based screeninglevel are not necessarily harmful, but they do require a more detailed evaluation to assess public
health implications. Broadly speaking, this document uses the health-based screening levels toidentify the subset of pollutants that require more thorough health evaluations.
This report primarily relies on screening levels published by TCEQ for evaluating theimplications of inhalation exposure to outdoor air pollution, considering both measured andestimated air pollution levels. TCEQ has published two sets of screening levels for use inevaluating outdoor air quality issues:
• Effects Screening Levels (ESLs). For many years, TCEQ has published and updatedits ESLs. These values are primarily used in the permitting process, particularly whenreviewing dispersion modeling data. TCEQ has developed separate ESLs for short-
term and long-term exposure durations, where short-term values are typically used forassessing 1-hour average concentrations and long-term values are typically used forassessing annual average concentrations. Most of TCEQ’s ESLs were developedbased on health effects, but some were developed to protect vegetation or based onodor detection. The ESLs are not regulatory standards, but are used to interpretpotential exposures to air pollution, primarily pollution levels predicted by models.
TCEQ advises that estimated air quality impacts and ESLs should be interpreted asfollows: “If predicted airborne levels of a constituent do not exceed the screeninglevel, adverse health or welfare effects are not expected. If predicted ambient levelsof constituents in air exceed the screening levels, it does not necessarily indicate a
problem but rather triggers a review in more depth.” The complete set of ESLs isavailable at http://www.tceq.texas.gov/toxicology/esl.
• Air Monitoring Comparison Values (AMCVs). In addition to ESLs, TCEQ has morerecently developed AMCVs, which are pollutant-specific ambient air concentrationsthat the agency has established to protect human health and welfare. In contrast toESLs, which are primarily used when evaluating air pollution levels predicted bymodels, AMCVs are used when conducting health screening evaluations of airmonitoring data. The complete set of AMCVs is also available online athttp://www.tceq.texas.gov/toxicology/AirToxics.html#amcv.
In this section, the modeled and measured air pollution levels are presented alongside thecorresponding health-based ESLs and AMCVs. For pollutants with air concentrations above theTCEQ screening levels, additional context is provided in Section 5.4 by presenting screeninglevels published by ATSDR and EPA. All screening values used in this report were accessedfrom agency publications in March 2011.
8/6/2019 Air Quality Study Final
http://slidepdf.com/reader/full/air-quality-study-final 226/320
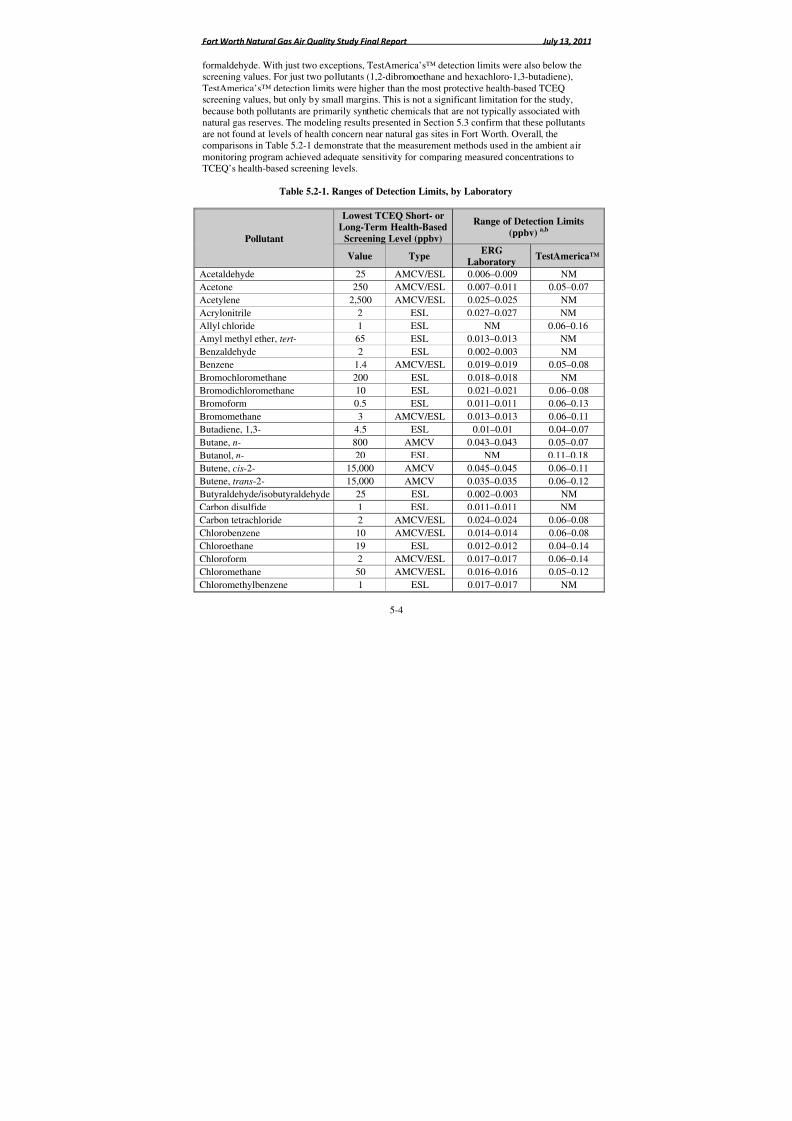
8/6/2019 Air Quality Study Final
http://slidepdf.com/reader/full/air-quality-study-final 227/320
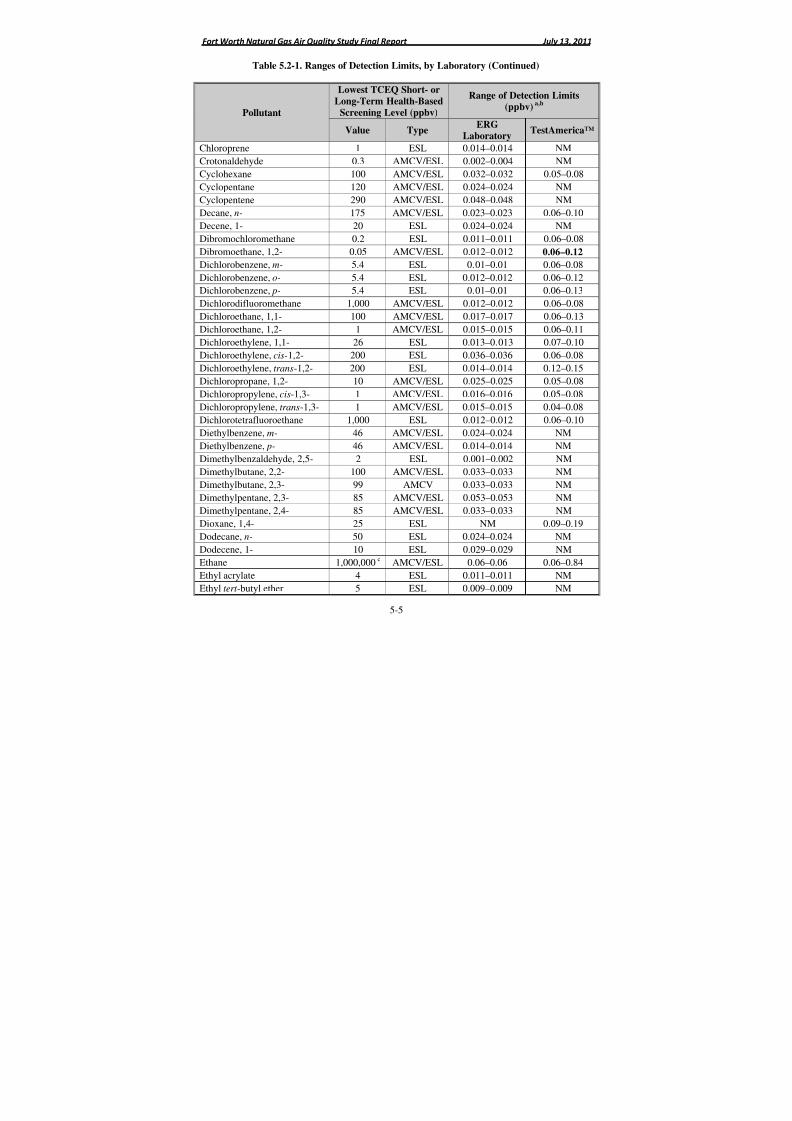
8/6/2019 Air Quality Study Final
http://slidepdf.com/reader/full/air-quality-study-final 228/320
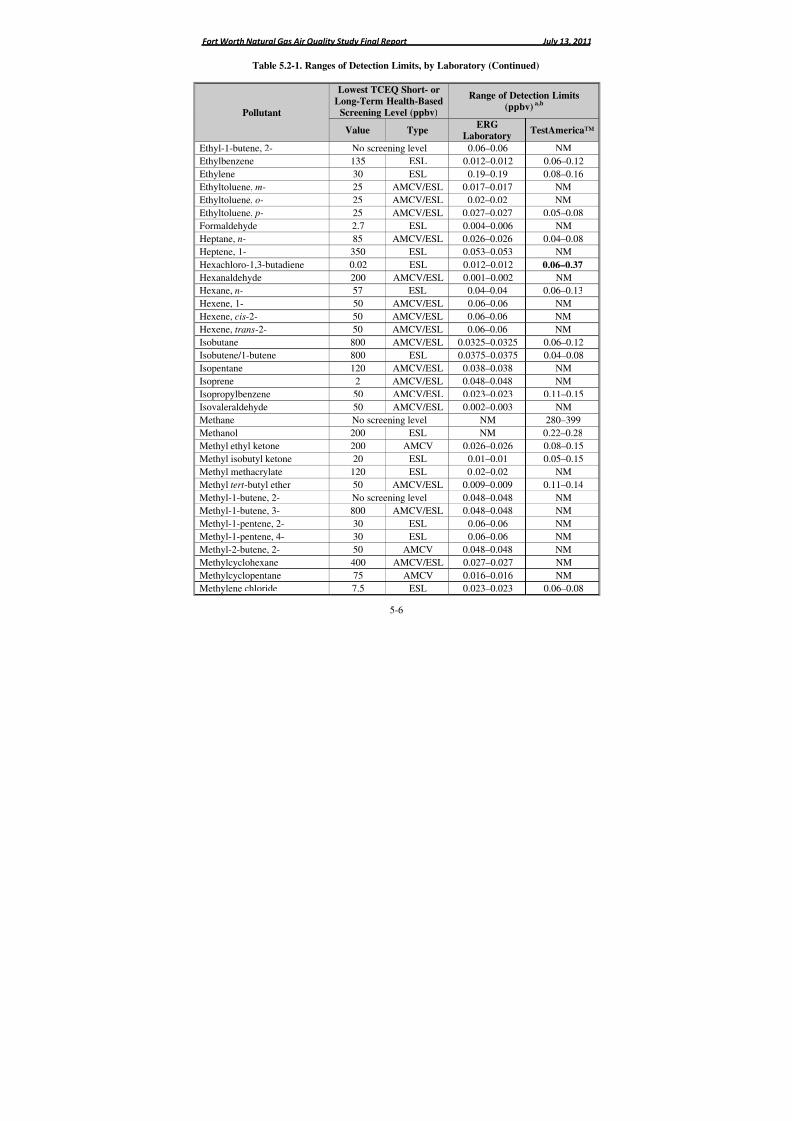
8/6/2019 Air Quality Study Final
http://slidepdf.com/reader/full/air-quality-study-final 229/320
Fort Worth Natural Gas Air Quality Study Final Report July 13, 2011
5-6
Table 5.2-1. Ranges of Detection Limits, by Laboratory (Continued)
Pollutant
Lowest TCEQ Short- or
Long-Term Health-BasedScreening Level (ppbv)
Range of Detection Limits(ppbv)
a,b
Value Type ERGLaboratory
TestAmerica™
Ethyl-1-butene, 2- No screening level 0.06–0.06 NM
Ethylbenzene 135 ESL 0.012–0.012 0.06–0.12
Ethylene 30 ESL 0.19–0.19 0.08–0.16
Ethyltoluene, m- 25 AMCV/ESL 0.017–0.017 NM
Ethyltoluene, o- 25 AMCV/ESL 0.02–0.02 NM
Ethyltoluene, p- 25 AMCV/ESL 0.027–0.027 0.05–0.08
Formaldehyde 2.7 ESL 0.004–0.006 NM
Heptane, n- 85 AMCV/ESL 0.026–0.026 0.04–0.08
Heptene, 1- 350 ESL 0.053–0.053 NMHexachloro-1,3-butadiene 0.02 ESL 0.012–0.012 0.06–0.37
Hexanaldehyde 200 AMCV/ESL 0.001–0.002 NM
Hexane, n- 57 ESL 0.04–0.04 0.06–0.13
Hexene, 1- 50 AMCV/ESL 0.06–0.06 NM
Hexene, cis-2- 50 AMCV/ESL 0.06–0.06 NM
Hexene, trans-2- 50 AMCV/ESL 0.06–0.06 NM
Isobutane 800 AMCV/ESL 0.0325–0.0325 0.06–0.12
Isobutene/1-butene 800 ESL 0.0375–0.0375 0.04–0.08
Isopentane 120 AMCV/ESL 0.038–0.038 NM
Isoprene 2 AMCV/ESL 0.048–0.048 NMIsopropylbenzene 50 AMCV/ESL 0.023–0.023 0.11–0.15
Isovaleraldehyde 50 AMCV/ESL 0.002–0.003 NM
Methane No screening level NM 280–399
Methanol 200 ESL NM 0.22–0.28
Methyl ethyl ketone 200 AMCV 0.026–0.026 0.08–0.15
Methyl isobutyl ketone 20 ESL 0.01–0.01 0.05–0.15
Methyl methacrylate 120 ESL 0.02–0.02 NM
Methyl tert -butyl ether 50 AMCV/ESL 0.009–0.009 0.11–0.14
Methyl-1-butene, 2- No screening level 0.048–0.048 NM
Methyl-1-butene, 3- 800 AMCV/ESL 0.048–0.048 NM
Methyl-1-pentene, 2- 30 ESL 0.06–0.06 NM
Methyl-1-pentene, 4- 30 ESL 0.06–0.06 NM
Methyl-2-butene, 2- 50 AMCV 0.048–0.048 NM
Methylcyclohexane 400 AMCV/ESL 0.027–0.027 NM
Methylcyclopentane 75 AMCV 0.016–0.016 NM
Methylene chloride 7.5 ESL 0.023–0.023 0.06–0.08
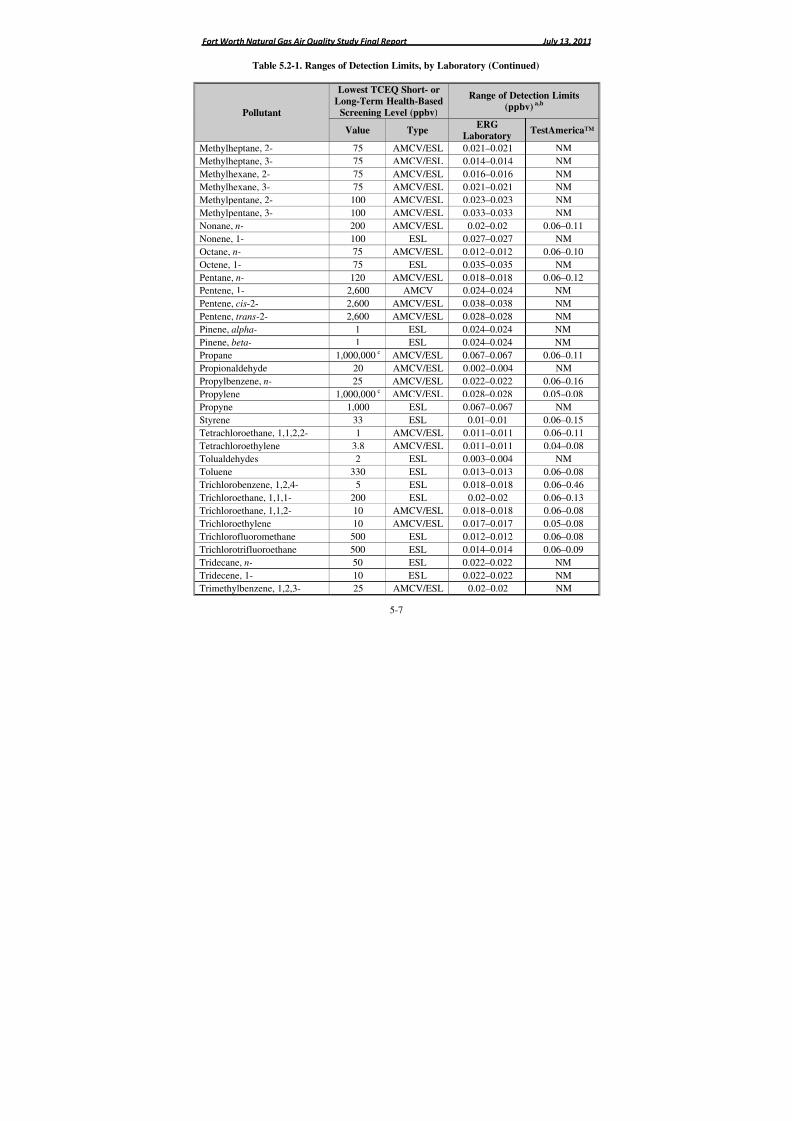
8/6/2019 Air Quality Study Final
http://slidepdf.com/reader/full/air-quality-study-final 230/320
Fort Worth Natural Gas Air Quality Study Final Report July 13, 2011
5-7
Table 5.2-1. Ranges of Detection Limits, by Laboratory (Continued)
Pollutant
Lowest TCEQ Short- or
Long-Term Health-BasedScreening Level (ppbv)
Range of Detection Limits(ppbv)
a,b
Value Type ERGLaboratory
TestAmerica™
Methylheptane, 2- 75 AMCV/ESL 0.021–0.021 NM
Methylheptane, 3- 75 AMCV/ESL 0.014–0.014 NM
Methylhexane, 2- 75 AMCV/ESL 0.016–0.016 NM
Methylhexane, 3- 75 AMCV/ESL 0.021–0.021 NM
Methylpentane, 2- 100 AMCV/ESL 0.023–0.023 NM
Methylpentane, 3- 100 AMCV/ESL 0.033–0.033 NM
Nonane, n- 200 AMCV/ESL 0.02–0.02 0.06–0.11
Nonene, 1- 100 ESL 0.027–0.027 NM
Octane, n- 75 AMCV/ESL 0.012–0.012 0.06–0.10Octene, 1- 75 ESL 0.035–0.035 NM
Pentane, n- 120 AMCV/ESL 0.018–0.018 0.06–0.12
Pentene, 1- 2,600 AMCV 0.024–0.024 NM
Pentene, cis-2- 2,600 AMCV/ESL 0.038–0.038 NM
Pentene, trans-2- 2,600 AMCV/ESL 0.028–0.028 NM
Pinene, alpha- 1 ESL 0.024–0.024 NM
Pinene, beta- 1 ESL 0.024–0.024 NM
Propane 1,000,000 c AMCV/ESL 0.067–0.067 0.06–0.11
Propionaldehyde 20 AMCV/ESL 0.002–0.004 NM
Propylbenzene, n- 25 AMCV/ESL 0.022–0.022 0.06–0.16Propylene 1,000,000 c AMCV/ESL 0.028–0.028 0.05–0.08
Propyne 1,000 ESL 0.067–0.067 NM
Styrene 33 ESL 0.01–0.01 0.06–0.15
Tetrachloroethane, 1,1,2,2- 1 AMCV/ESL 0.011–0.011 0.06–0.11
Tetrachloroethylene 3.8 AMCV/ESL 0.011–0.011 0.04–0.08
Tolualdehydes 2 ESL 0.003–0.004 NM
Toluene 330 ESL 0.013–0.013 0.06–0.08
Trichlorobenzene, 1,2,4- 5 ESL 0.018–0.018 0.06–0.46
Trichloroethane, 1,1,1- 200 ESL 0.02–0.02 0.06–0.13
Trichloroethane, 1,1,2- 10 AMCV/ESL 0.018–0.018 0.06–0.08
Trichloroethylene 10 AMCV/ESL 0.017–0.017 0.05–0.08
Trichlorofluoromethane 500 ESL 0.012–0.012 0.06–0.08
Trichlorotrifluoroethane 500 ESL 0.014–0.014 0.06–0.09
Tridecane, n- 50 ESL 0.022–0.022 NM
Tridecene, 1- 10 ESL 0.022–0.022 NM
Trimethylbenzene, 1,2,3- 25 AMCV/ESL 0.02–0.02 NM
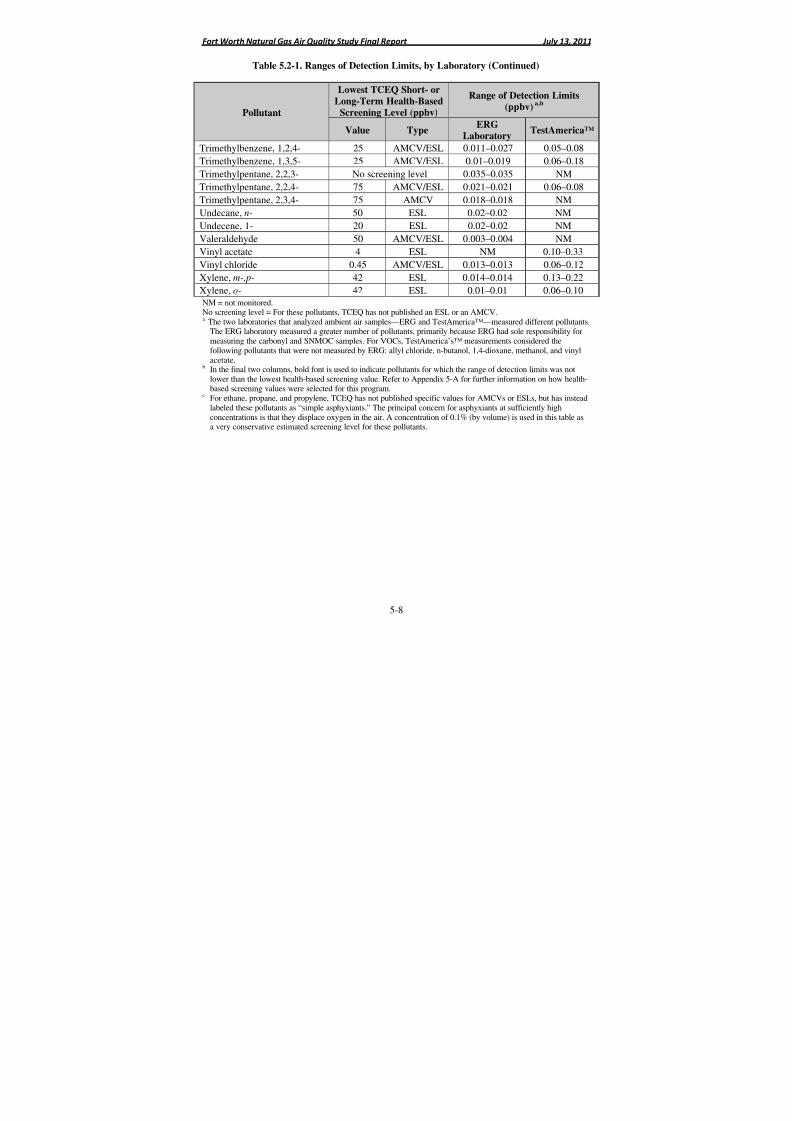
8/6/2019 Air Quality Study Final
http://slidepdf.com/reader/full/air-quality-study-final 231/320
Fort Worth Natural Gas Air Quality Study Final Report July 13, 2011
5-8
Table 5.2-1. Ranges of Detection Limits, by Laboratory (Continued)
Pollutant
Lowest TCEQ Short- or
Long-Term Health-BasedScreening Level (ppbv)
Range of Detection Limits(ppbv)
a,b
Value Type ERGLaboratory
TestAmerica™
Trimethylbenzene, 1,2,4- 25 AMCV/ESL 0.011–0.027 0.05–0.08
Trimethylbenzene, 1,3,5- 25 AMCV/ESL 0.01–0.019 0.06–0.18
Trimethylpentane, 2,2,3- No screening level 0.035–0.035 NM
Trimethylpentane, 2,2,4- 75 AMCV/ESL 0.021–0.021 0.06–0.08
Trimethylpentane, 2,3,4- 75 AMCV 0.018–0.018 NM
Undecane, n- 50 ESL 0.02–0.02 NM
Undecene, 1- 20 ESL 0.02–0.02 NM
Valeraldehyde 50 AMCV/ESL 0.003–0.004 NM
Vinyl acetate 4 ESL NM 0.10–0.33Vinyl chloride 0.45 AMCV/ESL 0.013–0.013 0.06–0.12
Xylene, m-,p- 42 ESL 0.014–0.014 0.13–0.22
Xylene, o- 42 ESL 0.01–0.01 0.06–0.10NM = not monitored.No screening level = For these pollutants, TCEQ has not published an ESL or an AMCV.a The two laboratories that analyzed ambient air samples—ERG and TestAmerica™—measured different pollutants.
The ERG laboratory measured a greater number of pollutants, primarily because ERG had sole responsibility formeasuring the carbonyl and SNMOC samples. For VOCs, TestAmerica’s™ measurements considered thefollowing pollutants that were not measured by ERG: allyl chloride, n-butanol, 1,4-dioxane, methanol, and vinylacetate.
b In the final two columns, bold font is used to indicate pollutants for which the range of detection limits was not
lower than the lowest health-based screening value. Refer to Appendix 5-A for further information on how health-based screening values were selected for this program.
c For ethane, propane, and propylene, TCEQ has not published specific values for AMCVs or ESLs, but has insteadlabeled these pollutants as “simple asphyxiants.” The principal concern for asphyxiants at sufficiently highconcentrations is that they displace oxygen in the air. A concentration of 0.1% (by volume) is used in this table asa very conservative estimated screening level for these pollutants.
8/6/2019 Air Quality Study Final
http://slidepdf.com/reader/full/air-quality-study-final 232/320
Fort Worth Natural Gas Air Quality Study Final Report July 13, 2011
5-9
5.2.2 Health Evaluation for Measured 24-Hour Average Concentrations
As described previously, ambient air monitoringoccurred for two months at eight locations throughout thecity of Fort Worth, and concentrations were measured fornearly 150 pollutants. All measurements were based on24-hour average samples, and more than 15,000observations were recorded over the course of theprogram.
When evaluating the monitoring data, ERG firstconsidered whether the highest measured 24-hour averageconcentrations exceeded TCEQ’s short-term health-basedscreening levels. Throughout the monitoring program in2010, ERG made these comparisons in order to promptlyidentify any indications of imminent health hazards, but none occurred. Comparing 24-houraverage measurements to long-term health-based screening values is scientifically inappropriateand is not done in this report. For every pollutant considered in the ambient monitoring program,Table 5.2-2 lists the highest 24-hour average concentration detected during the program, thelocation where this value was detected, and the lowest short-term, health-based screening levelpublished by TCEQ. For this evaluation, the hierarchy for selecting screening levels follows:First, if a pollutant has a short-term health-based AMCV, that value was used in Table 5.2-1,even if a different ESL is available. The preference for AMCVs over ESLs was applied herebecause this is an evaluation of ambient air monitoring data, not modeling data. Next, if apollutant does not have a health-based AMCV, the table displays the pollutant’s short-termhealth-based ESL. If neither value is available for the pollutant, short-term odor-based ESLs areused, if available. The table also indicates which pollutants have no TCEQ screening values.Shading is used in the table to identify pollutants that had at least one measured 24-hour averageconcentration higher than the TCEQ short-term screening level.
Key Point: Short-Term Air Pollution
Measurements
The ambient air monitoring dataprovide no evidence of 24-houraverage concentrations reaching levelsof health concern. Out of more than15,000 air pollution measurements,only one exceeded a TCEQ health-based screening level for short-termexposures; but that one measurementwas of questionable quality and wasfor a pollutant not typically associatedwith natural gas activity.
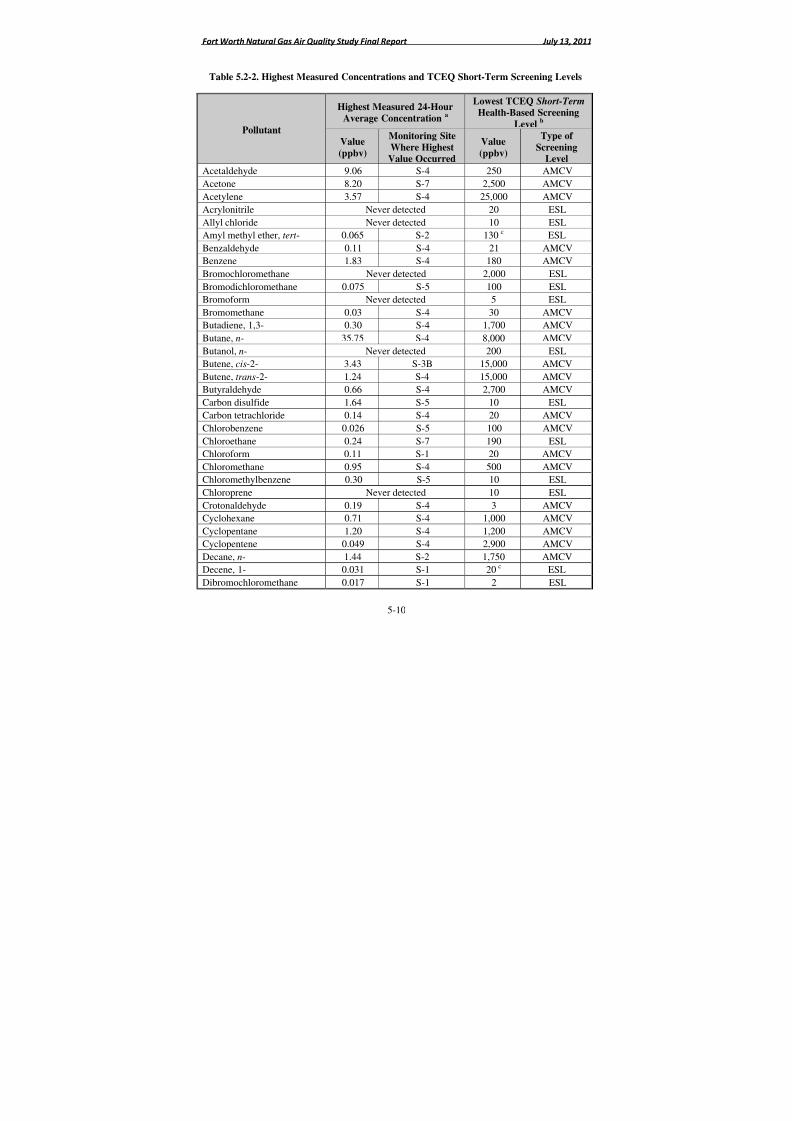
8/6/2019 Air Quality Study Final
http://slidepdf.com/reader/full/air-quality-study-final 233/320
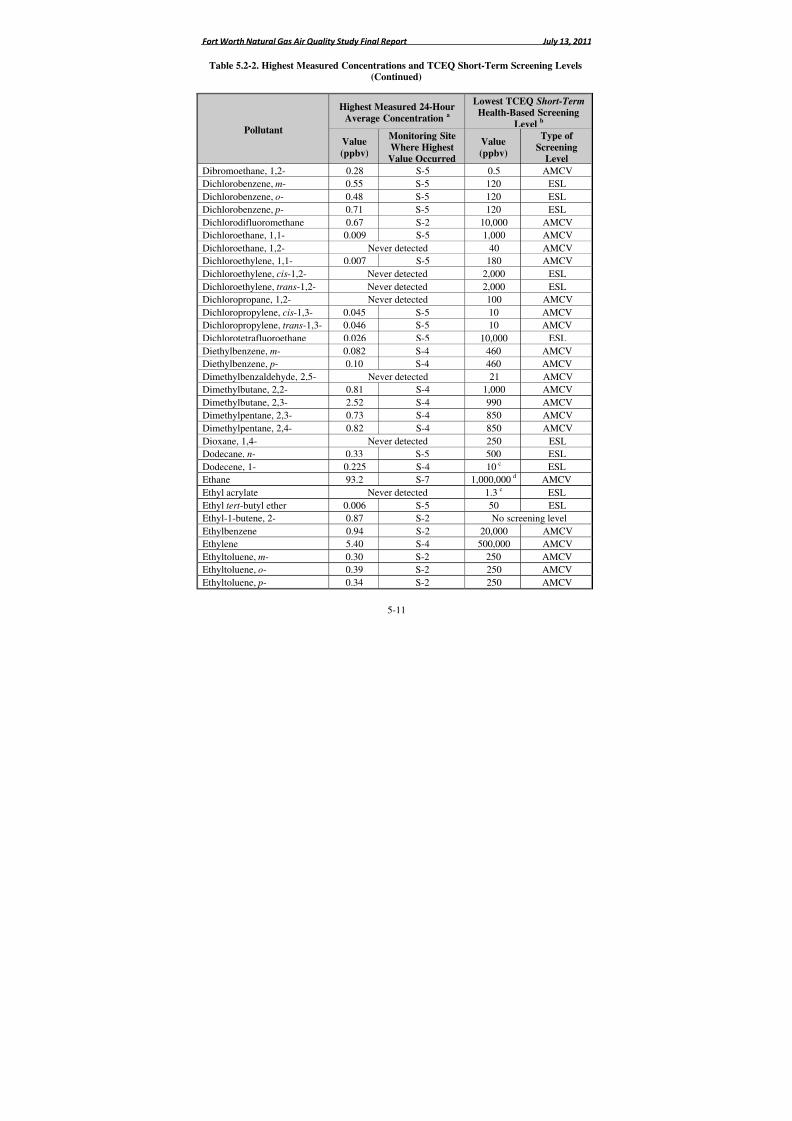
8/6/2019 Air Quality Study Final
http://slidepdf.com/reader/full/air-quality-study-final 234/320
Fort Worth Natural Gas Air Quality Study Final Report July 13, 2011
5-11
Table 5.2-2. Highest Measured Concentrations and TCEQ Short-Term Screening Levels(Continued)
Pollutant
Highest Measured 24-Hour
Average Concentrationa
Lowest TCEQ Short-Term Health-Based Screening
Levelb
Value
(ppbv)
Monitoring Site
Where HighestValue Occurred
Value
(ppbv)
Type of
ScreeningLevel
Dibromoethane, 1,2- 0.28 S-5 0.5 AMCV
Dichlorobenzene, m- 0.55 S-5 120 ESL
Dichlorobenzene, o- 0.48 S-5 120 ESL
Dichlorobenzene, p- 0.71 S-5 120 ESL
Dichlorodifluoromethane 0.67 S-2 10,000 AMCV
Dichloroethane, 1,1- 0.009 S-5 1,000 AMCV
Dichloroethane, 1,2- Never detected 40 AMCVDichloroethylene, 1,1- 0.007 S-5 180 AMCV
Dichloroethylene, cis-1,2- Never detected 2,000 ESL
Dichloroethylene, trans-1,2- Never detected 2,000 ESL
Dichloropropane, 1,2- Never detected 100 AMCV
Dichloropropylene, cis-1,3- 0.045 S-5 10 AMCV
Dichloropropylene, trans-1,3- 0.046 S-5 10 AMCV
Dichlorotetrafluoroethane 0.026 S-5 10,000 ESL
Diethylbenzene, m- 0.082 S-4 460 AMCV
Diethylbenzene, p- 0.10 S-4 460 AMCV
Dimethylbenzaldehyde, 2,5- Never detected 21 AMCVDimethylbutane, 2,2- 0.81 S-4 1,000 AMCV
Dimethylbutane, 2,3- 2.52 S-4 990 AMCV
Dimethylpentane, 2,3- 0.73 S-4 850 AMCV
Dimethylpentane, 2,4- 0.82 S-4 850 AMCV
Dioxane, 1,4- Never detected 250 ESL
Dodecane, n- 0.33 S-5 500 ESL
Dodecene, 1- 0.225 S-4 10 c ESL
Ethane 93.2 S-7 1,000,000 d AMCV
Ethyl acrylate Never detected 1.3 c ESL
Ethyl tert -butyl ether 0.006 S-5 50 ESLEthyl-1-butene, 2- 0.87 S-2 No screening level
Ethylbenzene 0.94 S-2 20,000 AMCV
Ethylene 5.40 S-4 500,000 AMCV
Ethyltoluene, m- 0.30 S-2 250 AMCV
Ethyltoluene, o- 0.39 S-2 250 AMCV
Ethyltoluene, p- 0.34 S-2 250 AMCV
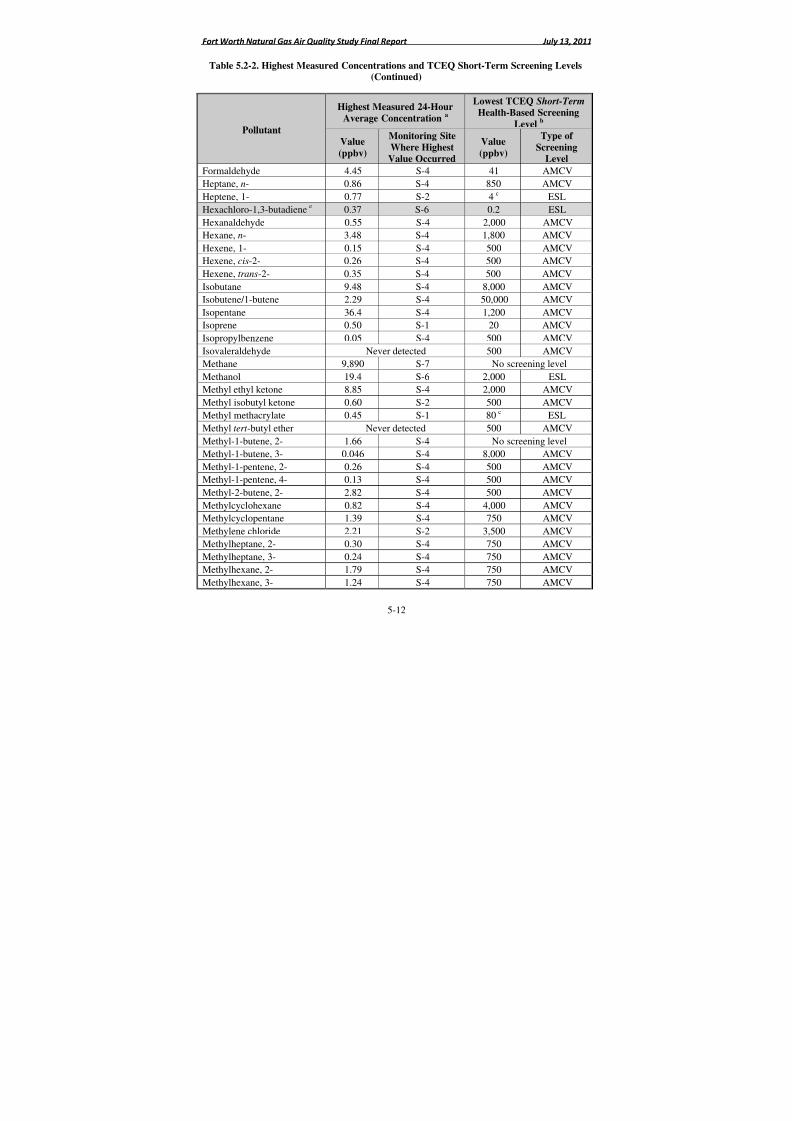
8/6/2019 Air Quality Study Final
http://slidepdf.com/reader/full/air-quality-study-final 235/320

8/6/2019 Air Quality Study Final
http://slidepdf.com/reader/full/air-quality-study-final 236/320
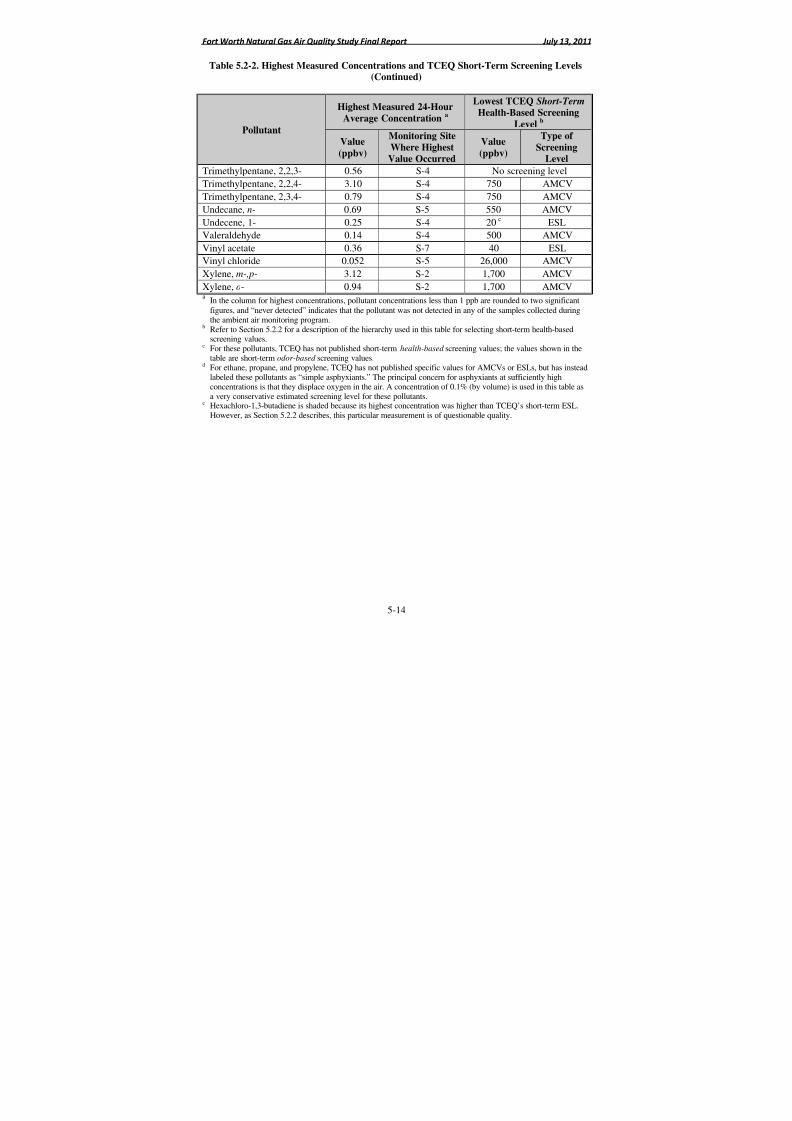
8/6/2019 Air Quality Study Final
http://slidepdf.com/reader/full/air-quality-study-final 237/320
Fort Worth Natural Gas Air Quality Study Final Report July 13, 2011
5-14
Table 5.2-2. Highest Measured Concentrations and TCEQ Short-Term Screening Levels(Continued)
Pollutant
Highest Measured 24-Hour
Average Concentrationa
Lowest TCEQ Short-Term Health-Based Screening
Levelb
Value
(ppbv)
Monitoring Site
Where HighestValue Occurred
Value
(ppbv)
Type of
ScreeningLevel
Trimethylpentane, 2,2,3- 0.56 S-4 No screening level
Trimethylpentane, 2,2,4- 3.10 S-4 750 AMCV
Trimethylpentane, 2,3,4- 0.79 S-4 750 AMCV
Undecane, n- 0.69 S-5 550 AMCV
Undecene, 1- 0.25 S-4 20 c ESL
Valeraldehyde 0.14 S-4 500 AMCV
Vinyl acetate 0.36 S-7 40 ESLVinyl chloride 0.052 S-5 26,000 AMCV
Xylene, m-,p- 3.12 S-2 1,700 AMCV
Xylene, o- 0.94 S-2 1,700 AMCVa
In the column for highest concentrations, pollutant concentrations less than 1 ppb are rounded to two significantfigures, and “never detected” indicates that the pollutant was not detected in any of the samples collected duringthe ambient air monitoring program.
b Refer to Section 5.2.2 for a description of the hierarchy used in this table for selecting short-term health-basedscreening values.
c For these pollutants, TCEQ has not published short-term health-based screening values; the values shown in thetable are short-term odor-based screening values.
d For ethane, propane, and propylene, TCEQ has not published specific values for AMCVs or ESLs, but has instead
labeled these pollutants as “simple asphyxiants.” The principal concern for asphyxiants at sufficiently highconcentrations is that they displace oxygen in the air. A concentration of 0.1% (by volume) is used in this table asa very conservative estimated screening level for these pollutants.
e Hexachloro-1,3-butadiene is shaded because its highest concentration was higher than TCEQ’s short-term ESL.However, as Section 5.2.2 describes, this particular measurement is of questionable quality.
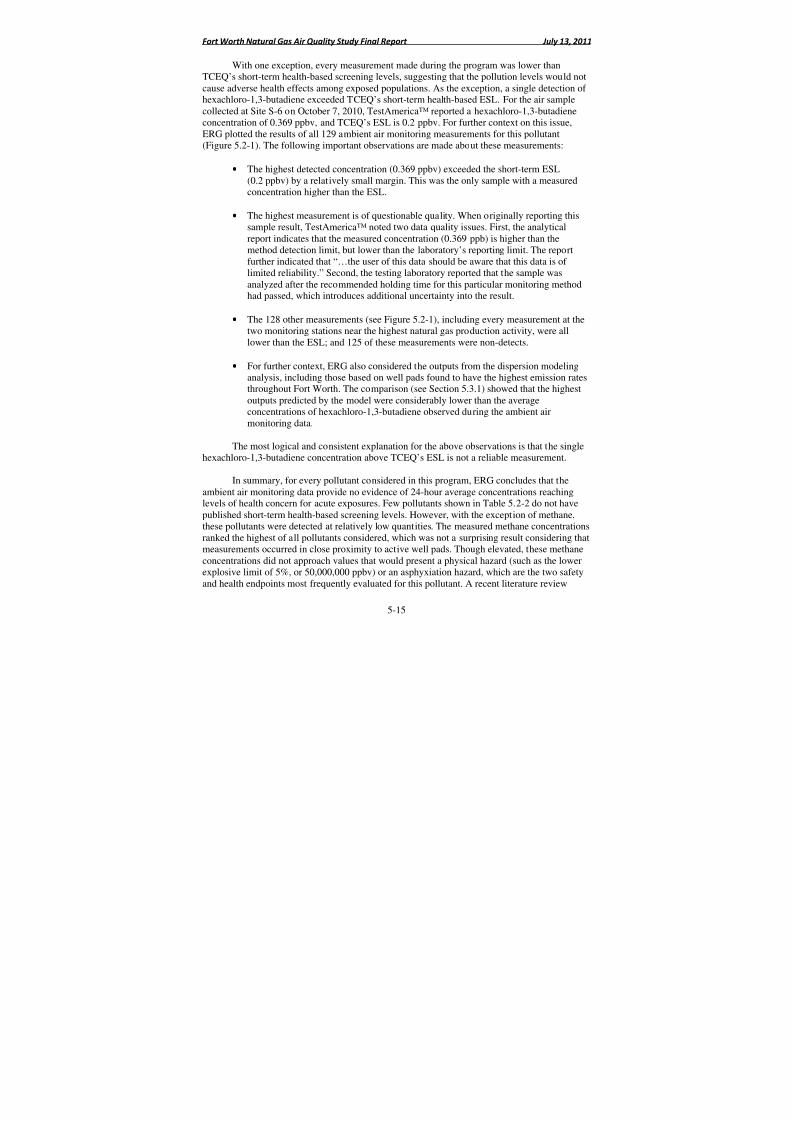
8/6/2019 Air Quality Study Final
http://slidepdf.com/reader/full/air-quality-study-final 238/320
Fort Worth Natural Gas Air Quality Study Final Report July 13, 2011
5-15
With one exception, every measurement made during the program was lower thanTCEQ’s short-term health-based screening levels, suggesting that the pollution levels would notcause adverse health effects among exposed populations. As the exception, a single detection of hexachloro-1,3-butadiene exceeded TCEQ’s short-term health-based ESL. For the air samplecollected at Site S-6 on October 7, 2010, TestAmerica™ reported a hexachloro-1,3-butadiene
concentration of 0.369 ppbv, and TCEQ’s ESL is 0.2 ppbv. For further context on this issue,ERG plotted the results of all 129 ambient air monitoring measurements for this pollutant(Figure 5.2-1). The following important observations are made about these measurements:
• The highest detected concentration (0.369 ppbv) exceeded the short-term ESL(0.2 ppbv) by a relatively small margin. This was the only sample with a measuredconcentration higher than the ESL.
• The highest measurement is of questionable quality. When originally reporting thissample result, TestAmerica™ noted two data quality issues. First, the analyticalreport indicates that the measured concentration (0.369 ppb) is higher than the
method detection limit, but lower than the laboratory’s reporting limit. The reportfurther indicated that “…the user of this data should be aware that this data is of limited reliability.” Second, the testing laboratory reported that the sample wasanalyzed after the recommended holding time for this particular monitoring methodhad passed, which introduces additional uncertainty into the result.
• The 128 other measurements (see Figure 5.2-1), including every measurement at thetwo monitoring stations near the highest natural gas production activity, were alllower than the ESL; and 125 of these measurements were non-detects.
• For further context, ERG also considered the outputs from the dispersion modeling
analysis, including those based on well pads found to have the highest emission ratesthroughout Fort Worth. The comparison (see Section 5.3.1) showed that the highestoutputs predicted by the model were considerably lower than the averageconcentrations of hexachloro-1,3-butadiene observed during the ambient airmonitoring data.
The most logical and consistent explanation for the above observations is that the singlehexachloro-1,3-butadiene concentration above TCEQ’s ESL is not a reliable measurement.
In summary, for every pollutant considered in this program, ERG concludes that theambient air monitoring data provide no evidence of 24-hour average concentrations reaching
levels of health concern for acute exposures. Few pollutants shown in Table 5.2-2 do not havepublished short-term health-based screening levels. However, with the exception of methane,these pollutants were detected at relatively low quantities. The measured methane concentrationsranked the highest of all pollutants considered, which was not a surprising result considering thatmeasurements occurred in close proximity to active well pads. Though elevated, these methaneconcentrations did not approach values that would present a physical hazard (such as the lowerexplosive limit of 5%, or 50,000,000 ppbv) or an asphyxiation hazard, which are the two safetyand health endpoints most frequently evaluated for this pollutant. A recent literature review
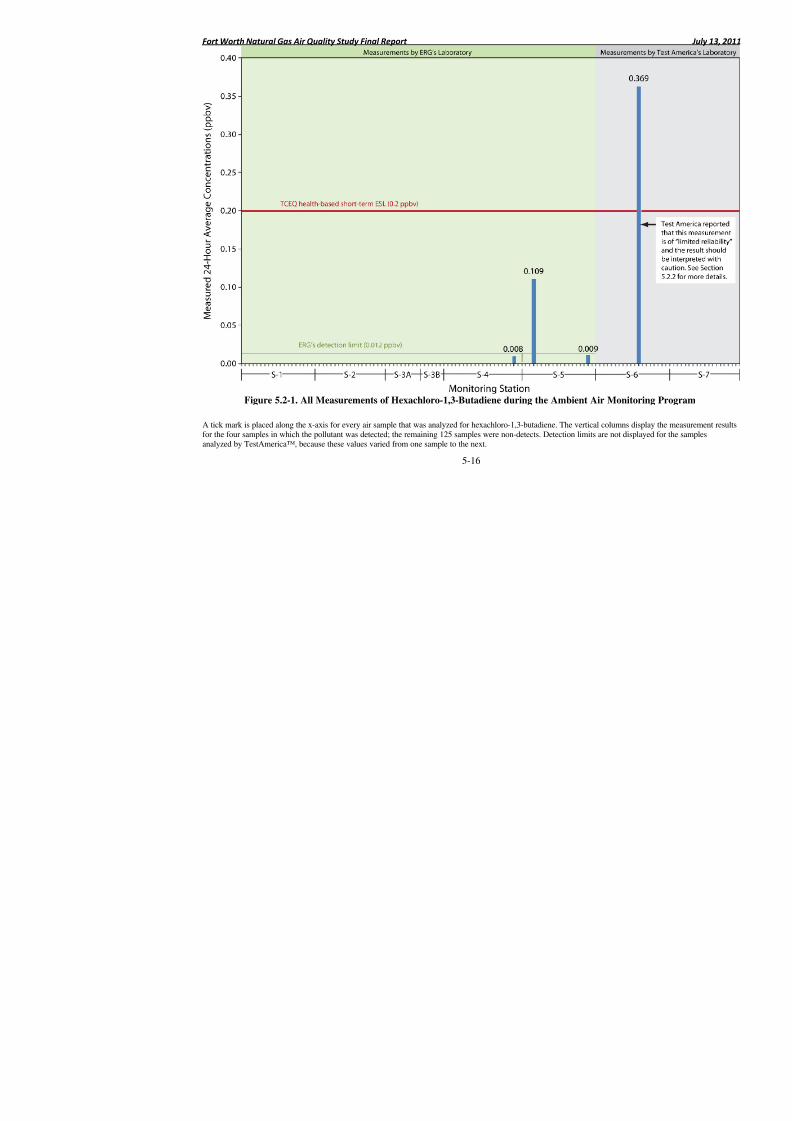
8/6/2019 Air Quality Study Final
http://slidepdf.com/reader/full/air-quality-study-final 239/320
8/6/2019 Air Quality Study Final
http://slidepdf.com/reader/full/air-quality-study-final 240/320
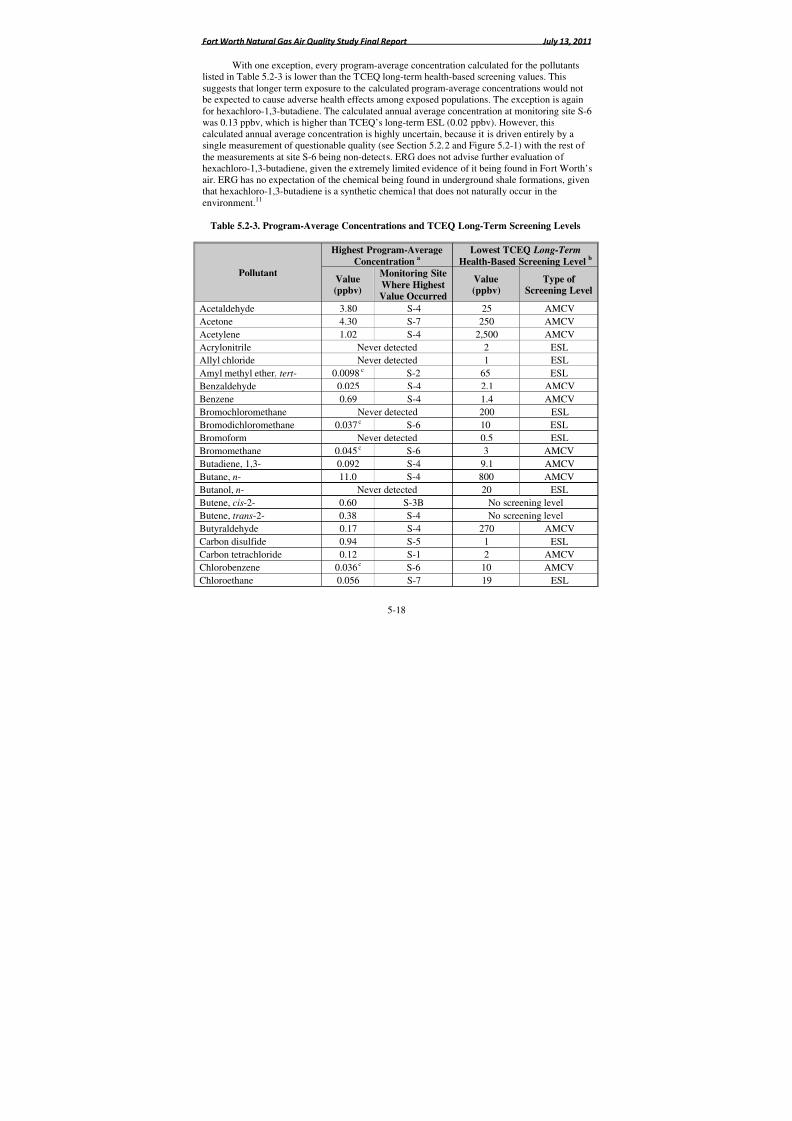
8/6/2019 Air Quality Study Final
http://slidepdf.com/reader/full/air-quality-study-final 241/320
Fort Worth Natural Gas Air Quality Study Final Report July 13, 2011
5-18
With one exception, every program-average concentration calculated for the pollutantslisted in Table 5.2-3 is lower than the TCEQ long-term health-based screening values. Thissuggests that longer term exposure to the calculated program-average concentrations would notbe expected to cause adverse health effects among exposed populations. The exception is againfor hexachloro-1,3-butadiene. The calculated annual average concentration at monitoring site S-6
was 0.13 ppbv, which is higher than TCEQ’s long-term ESL (0.02 ppbv). However, thiscalculated annual average concentration is highly uncertain, because it is driven entirely by asingle measurement of questionable quality (see Section 5.2.2 and Figure 5.2-1) with the rest of the measurements at site S-6 being non-detects. ERG does not advise further evaluation of hexachloro-1,3-butadiene, given the extremely limited evidence of it being found in Fort Worth’sair. ERG has no expectation of the chemical being found in underground shale formations, giventhat hexachloro-1,3-butadiene is a synthetic chemical that does not naturally occur in theenvironment.11
Table 5.2-3. Program-Average Concentrations and TCEQ Long-Term Screening Levels
Pollutant
Highest Program-AverageConcentrationa Lowest TCEQ Long-Term Health-Based Screening Level
b
Value(ppbv)
Monitoring Site
Where HighestValue Occurred
Value(ppbv)
Type of Screening Level
Acetaldehyde 3.80 S-4 25 AMCV
Acetone 4.30 S-7 250 AMCV
Acetylene 1.02 S-4 2,500 AMCV
Acrylonitrile Never detected 2 ESL
Allyl chloride Never detected 1 ESL
Amyl methyl ether, tert - 0.0098 c S-2 65 ESL
Benzaldehyde 0.025 S-4 2.1 AMCV
Benzene 0.69 S-4 1.4 AMCV
Bromochloromethane Never detected 200 ESL
Bromodichloromethane 0.037 c S-6 10 ESL
Bromoform Never detected 0.5 ESL
Bromomethane 0.045 c S-6 3 AMCV
Butadiene, 1,3- 0.092 S-4 9.1 AMCV
Butane, n- 11.0 S-4 800 AMCV
Butanol, n- Never detected 20 ESL
Butene, cis-2- 0.60 S-3B No screening levelButene, trans-2- 0.38 S-4 No screening level
Butyraldehyde 0.17 S-4 270 AMCV
Carbon disulfide 0.94 S-5 1 ESL
Carbon tetrachloride 0.12 S-1 2 AMCV
Chlorobenzene 0.036 c S-6 10 AMCV
Chloroethane 0.056 S-7 19 ESL
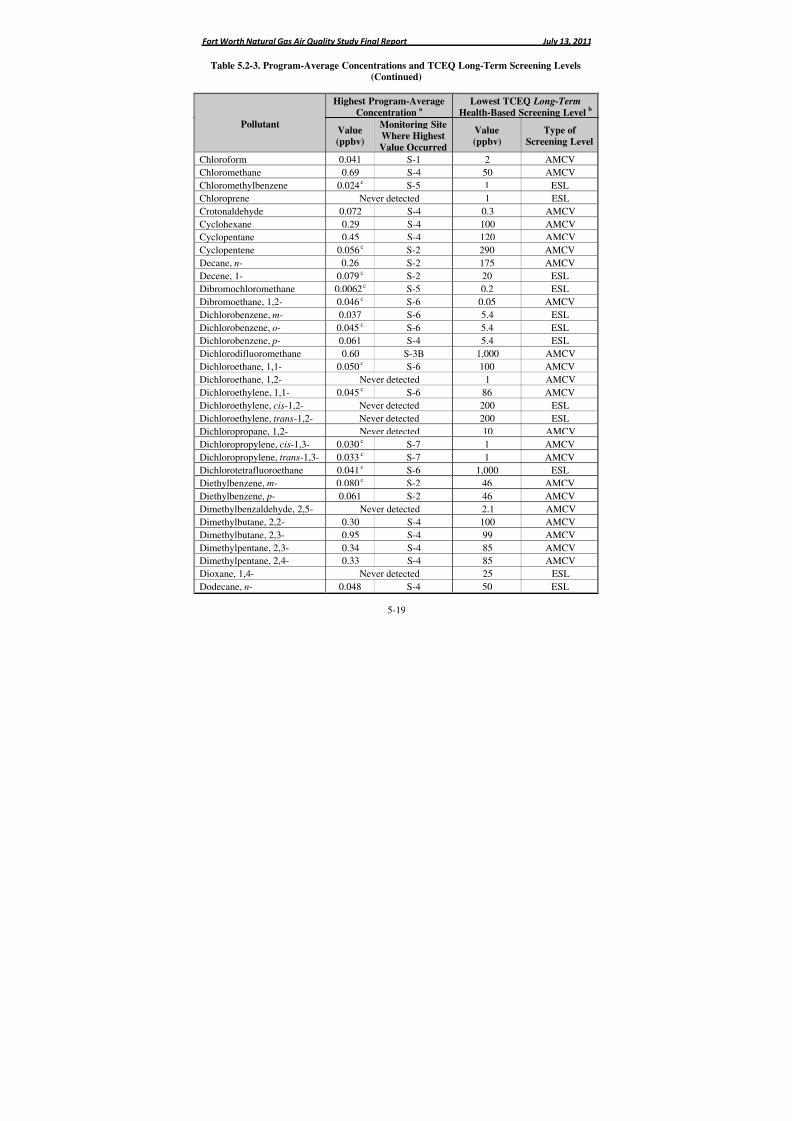
8/6/2019 Air Quality Study Final
http://slidepdf.com/reader/full/air-quality-study-final 242/320
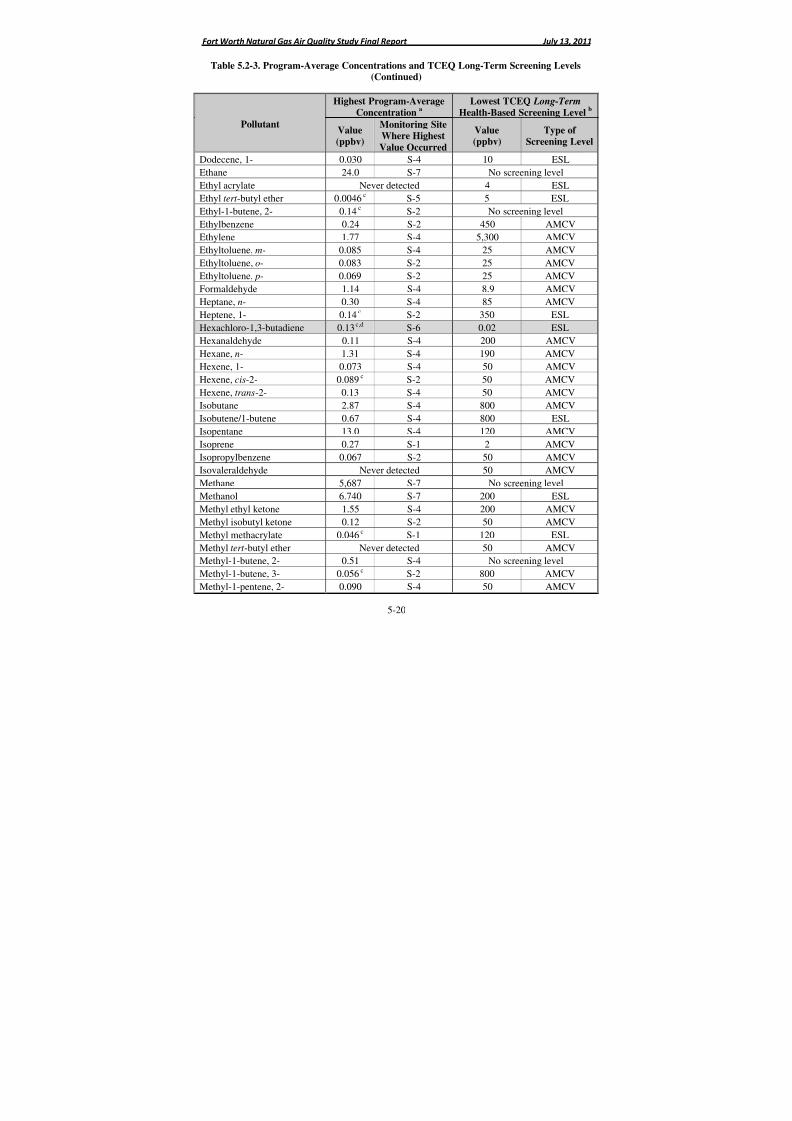
8/6/2019 Air Quality Study Final
http://slidepdf.com/reader/full/air-quality-study-final 243/320
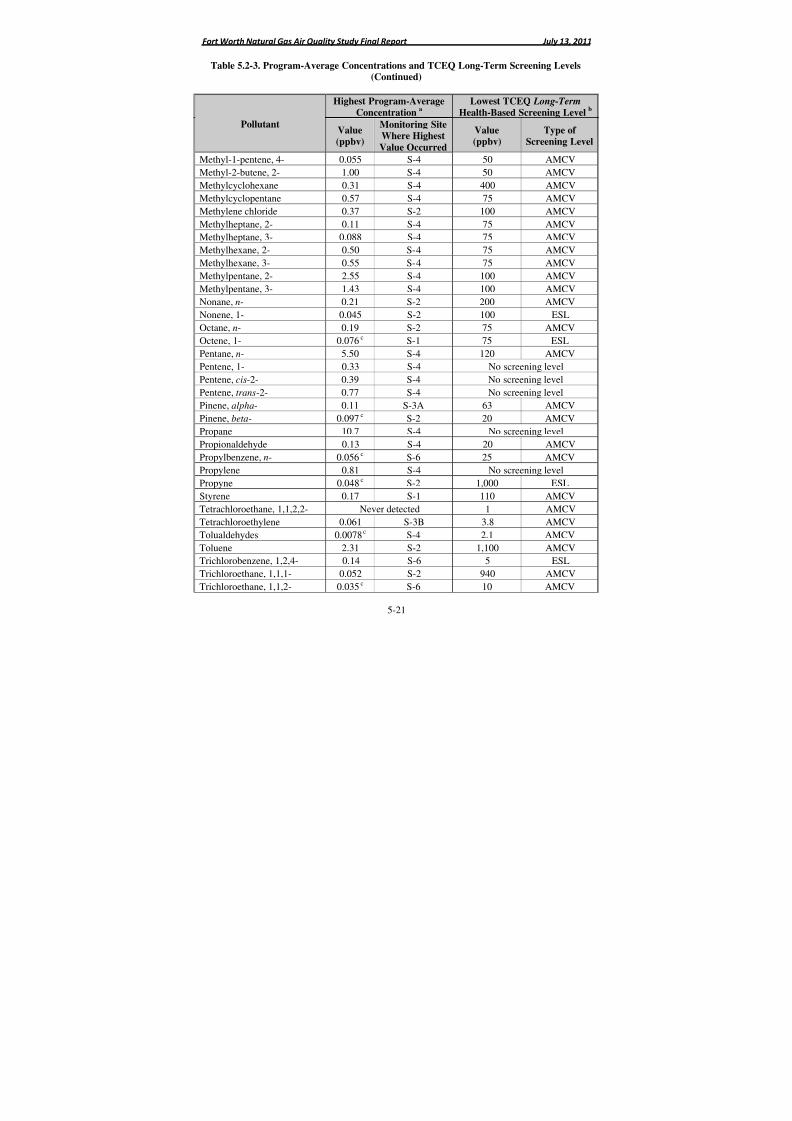
8/6/2019 Air Quality Study Final
http://slidepdf.com/reader/full/air-quality-study-final 244/320
Fort Worth Natural Gas Air Quality Study Final Report July 13, 2011
5-21
Table 5.2-3. Program-Average Concentrations and TCEQ Long-Term Screening Levels(Continued)
Pollutant
Highest Program-AverageConcentration
a
Lowest TCEQ Long-Term Health-Based Screening Level
b
Value(ppbv)
Monitoring SiteWhere Highest
Value Occurred
Value(ppbv)
Type of Screening Level
Methyl-1-pentene, 4- 0.055 S-4 50 AMCV
Methyl-2-butene, 2- 1.00 S-4 50 AMCV
Methylcyclohexane 0.31 S-4 400 AMCV
Methylcyclopentane 0.57 S-4 75 AMCV
Methylene chloride 0.37 S-2 100 AMCV
Methylheptane, 2- 0.11 S-4 75 AMCV
Methylheptane, 3- 0.088 S-4 75 AMCV
Methylhexane, 2- 0.50 S-4 75 AMCVMethylhexane, 3- 0.55 S-4 75 AMCV
Methylpentane, 2- 2.55 S-4 100 AMCV
Methylpentane, 3- 1.43 S-4 100 AMCV
Nonane, n- 0.21 S-2 200 AMCV
Nonene, 1- 0.045 S-2 100 ESL
Octane, n- 0.19 S-2 75 AMCV
Octene, 1- 0.076 c S-1 75 ESL
Pentane, n- 5.50 S-4 120 AMCV
Pentene, 1- 0.33 S-4 No screening level
Pentene, cis-2- 0.39 S-4 No screening levelPentene, trans-2- 0.77 S-4 No screening level
Pinene, alpha- 0.11 S-3A 63 AMCV
Pinene, beta- 0.097 c S-2 20 AMCV
Propane 10.7 S-4 No screening level
Propionaldehyde 0.13 S-4 20 AMCV
Propylbenzene, n- 0.056 c S-6 25 AMCV
Propylene 0.81 S-4 No screening level
Propyne 0.048 c S-2 1,000 ESL
Styrene 0.17 S-1 110 AMCV
Tetrachloroethane, 1,1,2,2- Never detected 1 AMCVTetrachloroethylene 0.061 S-3B 3.8 AMCV
Tolualdehydes 0.0078 c S-4 2.1 AMCV
Toluene 2.31 S-2 1,100 AMCV
Trichlorobenzene, 1,2,4- 0.14 S-6 5 ESL
Trichloroethane, 1,1,1- 0.052 S-2 940 AMCV
Trichloroethane, 1,1,2- 0.035 c S-6 10 AMCV
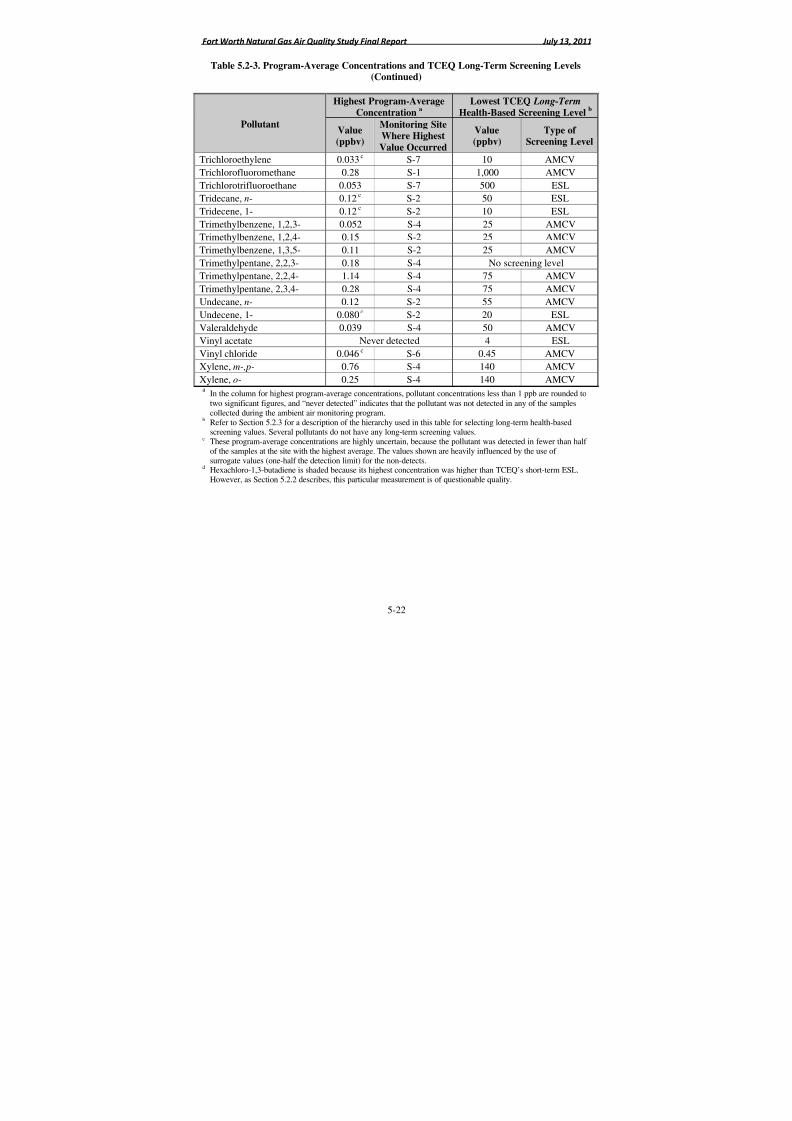
8/6/2019 Air Quality Study Final
http://slidepdf.com/reader/full/air-quality-study-final 245/320
8/6/2019 Air Quality Study Final
http://slidepdf.com/reader/full/air-quality-study-final 246/320
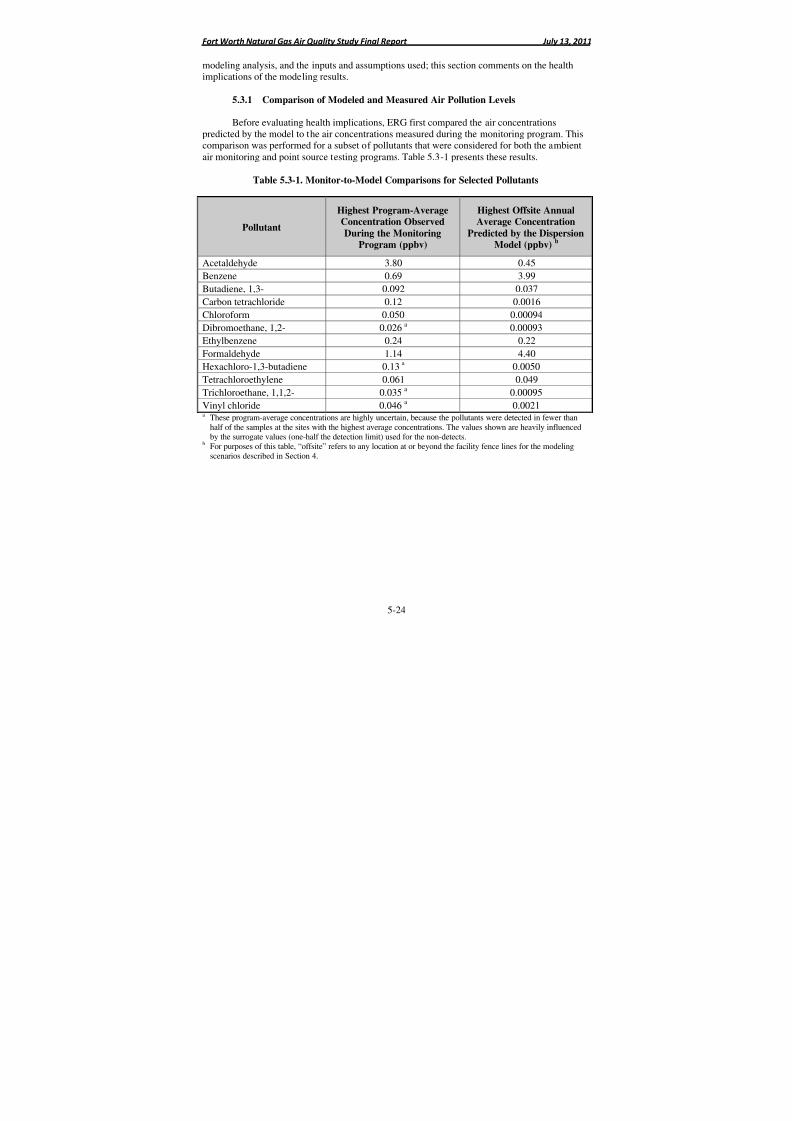
8/6/2019 Air Quality Study Final
http://slidepdf.com/reader/full/air-quality-study-final 247/320
Fort Worth Natural Gas Air Quality Study Final Report July 13, 2011
5-24
modeling analysis, and the inputs and assumptions used; this section comments on the healthimplications of the modeling results.
5.3.1 Comparison of Modeled and Measured Air Pollution Levels
Before evaluating health implications, ERG first compared the air concentrationspredicted by the model to the air concentrations measured during the monitoring program. Thiscomparison was performed for a subset of pollutants that were considered for both the ambientair monitoring and point source testing programs. Table 5.3-1 presents these results.
Table 5.3-1. Monitor-to-Model Comparisons for Selected Pollutants
Pollutant
Highest Program-AverageConcentration Observed
During the MonitoringProgram (ppbv)
Highest Offsite AnnualAverage Concentration
Predicted by the DispersionModel (ppbv)
b
Acetaldehyde 3.80 0.45
Benzene 0.69 3.99
Butadiene, 1,3- 0.092 0.037
Carbon tetrachloride 0.12 0.0016
Chloroform 0.050 0.00094
Dibromoethane, 1,2- 0.026 a 0.00093
Ethylbenzene 0.24 0.22
Formaldehyde 1.14 4.40
Hexachloro-1,3-butadiene 0.13 a 0.0050
Tetrachloroethylene 0.061 0.049Trichloroethane, 1,1,2- 0.035 a 0.00095
Vinyl chloride 0.046 a 0.0021a These program-average concentrations are highly uncertain, because the pollutants were detected in fewer than
half of the samples at the sites with the highest average concentrations. The values shown are heavily influencedby the surrogate values (one-half the detection limit) used for the non-detects.
b For purposes of this table, “offsite” refers to any location at or beyond the facility fence lines for the modelingscenarios described in Section 4.
8/6/2019 Air Quality Study Final
http://slidepdf.com/reader/full/air-quality-study-final 248/320
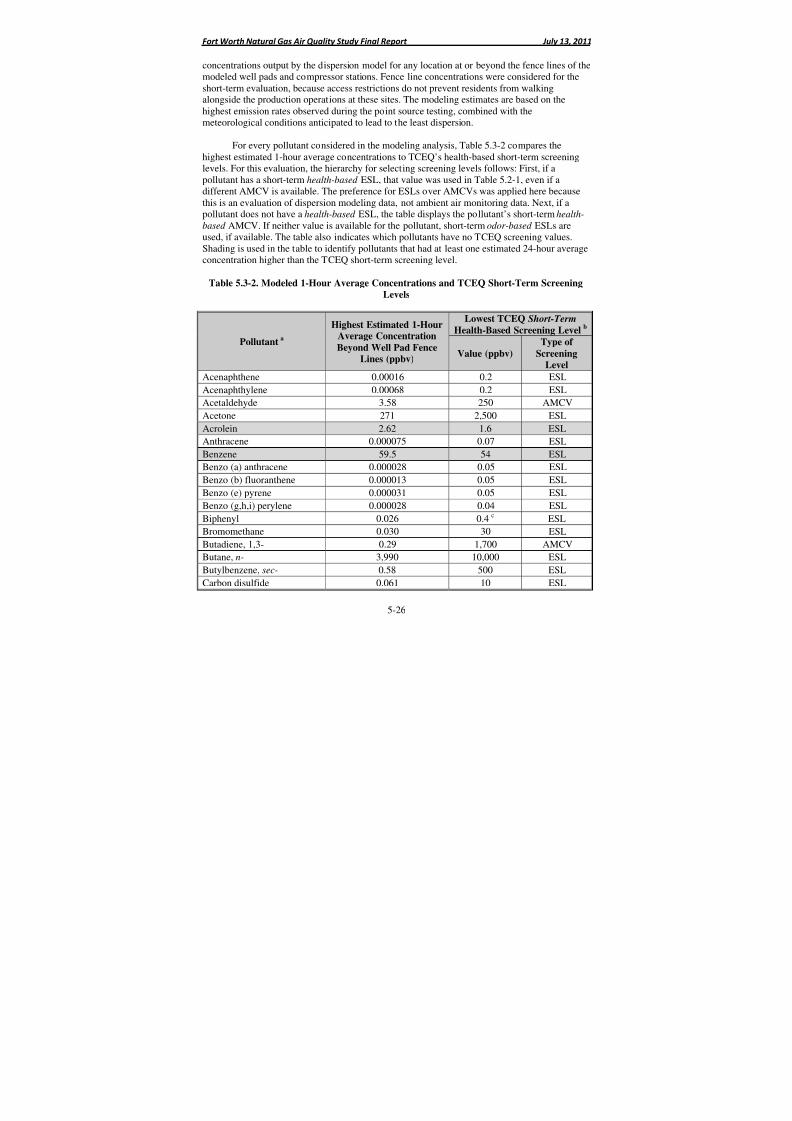
8/6/2019 Air Quality Study Final
http://slidepdf.com/reader/full/air-quality-study-final 249/320
Fort Worth Natural Gas Air Quality Study Final Report July 13, 2011
5-26
concentrations output by the dispersion model for any location at or beyond the fence lines of themodeled well pads and compressor stations. Fence line concentrations were considered for theshort-term evaluation, because access restrictions do not prevent residents from walkingalongside the production operations at these sites. The modeling estimates are based on thehighest emission rates observed during the point source testing, combined with the
meteorological conditions anticipated to lead to the least dispersion.
For every pollutant considered in the modeling analysis, Table 5.3-2 compares thehighest estimated 1-hour average concentrations to TCEQ’s health-based short-term screeninglevels. For this evaluation, the hierarchy for selecting screening levels follows: First, if apollutant has a short-term health-based ESL, that value was used in Table 5.2-1, even if adifferent AMCV is available. The preference for ESLs over AMCVs was applied here becausethis is an evaluation of dispersion modeling data, not ambient air monitoring data. Next, if apollutant does not have a health-based ESL, the table displays the pollutant’s short-term health-
based AMCV. If neither value is available for the pollutant, short-term odor-based ESLs areused, if available. The table also indicates which pollutants have no TCEQ screening values.
Shading is used in the table to identify pollutants that had at least one estimated 24-hour averageconcentration higher than the TCEQ short-term screening level.
Table 5.3-2. Modeled 1-Hour Average Concentrations and TCEQ Short-Term Screening
Levels
Pollutanta
Highest Estimated 1-HourAverage Concentration
Beyond Well Pad FenceLines (ppbv)
Lowest TCEQ Short-Term
Health-Based Screening Levelb
Value (ppbv)
Type of
ScreeningLevel
Acenaphthene 0.00016 0.2 ESLAcenaphthylene 0.00068 0.2 ESL
Acetaldehyde 3.58 250 AMCV
Acetone 271 2,500 ESL
Acrolein 2.62 1.6 ESL
Anthracene 0.000075 0.07 ESL
Benzene 59.5 54 ESL
Benzo (a) anthracene 0.000028 0.05 ESL
Benzo (b) fluoranthene 0.000013 0.05 ESL
Benzo (e) pyrene 0.000031 0.05 ESL
Benzo (g,h,i) perylene 0.000028 0.04 ESLBiphenyl 0.026 0.4 c ESL
Bromomethane 0.030 30 ESL
Butadiene, 1,3- 0.29 1,700 AMCV
Butane, n- 3,990 10,000 ESL
Butylbenzene, sec- 0.58 500 ESL
Carbon disulfide 0.061 10 ESL
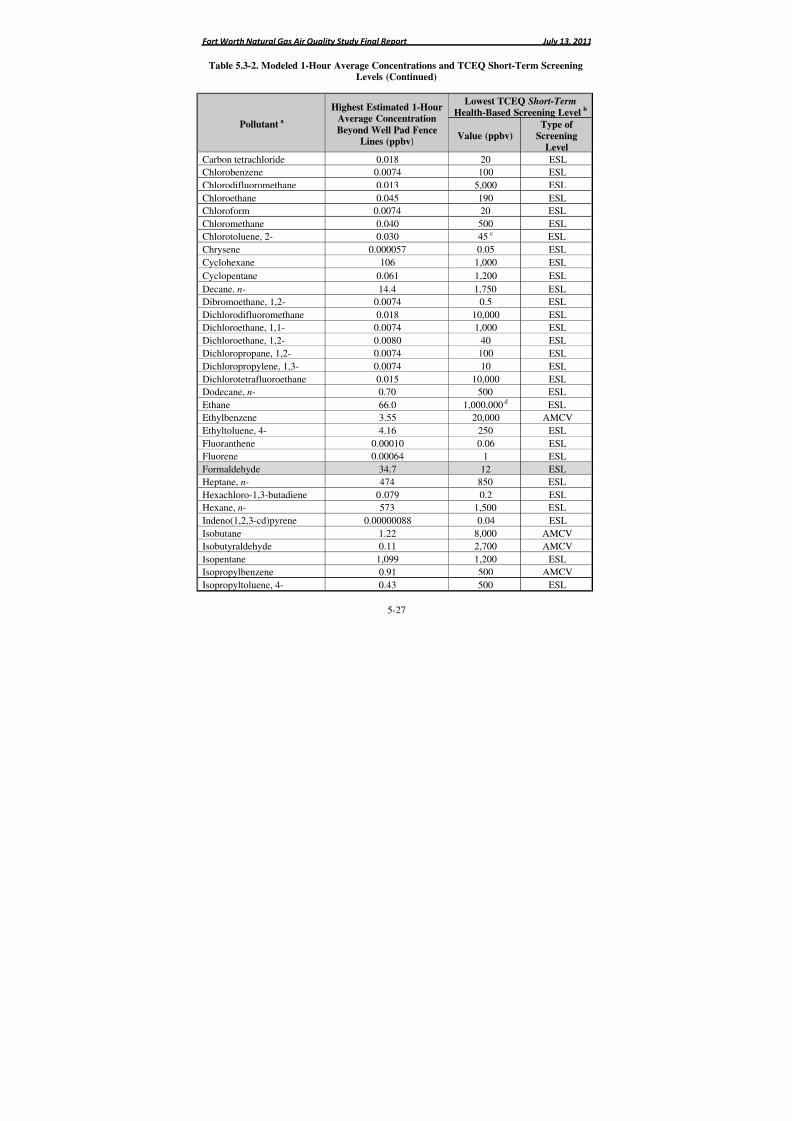
8/6/2019 Air Quality Study Final
http://slidepdf.com/reader/full/air-quality-study-final 250/320
Fort Worth Natural Gas Air Quality Study Final Report July 13, 2011
5-27
Table 5.3-2. Modeled 1-Hour Average Concentrations and TCEQ Short-Term ScreeningLevels (Continued)
Pollutanta
Highest Estimated 1-HourAverage Concentration
Beyond Well Pad FenceLines (ppbv)
Lowest TCEQ Short-Term Health-Based Screening Level
b
Value (ppbv)Type of
Screening
Level
Carbon tetrachloride 0.018 20 ESL
Chlorobenzene 0.0074 100 ESL
Chlorodifluoromethane 0.013 5,000 ESL
Chloroethane 0.045 190 ESL
Chloroform 0.0074 20 ESL
Chloromethane 0.040 500 ESL
Chlorotoluene, 2- 0.030 45 c ESL
Chrysene 0.000057 0.05 ESLCyclohexane 106 1,000 ESL
Cyclopentane 0.061 1,200 ESL
Decane, n- 14.4 1,750 ESL
Dibromoethane, 1,2- 0.0074 0.5 ESL
Dichlorodifluoromethane 0.018 10,000 ESL
Dichloroethane, 1,1- 0.0074 1,000 ESL
Dichloroethane, 1,2- 0.0080 40 ESL
Dichloropropane, 1,2- 0.0074 100 ESL
Dichloropropylene, 1,3- 0.0074 10 ESL
Dichlorotetrafluoroethane 0.015 10,000 ESLDodecane, n- 0.70 500 ESL
Ethane 66.0 1,000,000 d ESL
Ethylbenzene 3.55 20,000 AMCV
Ethyltoluene, 4- 4.16 250 ESL
Fluoranthene 0.00010 0.06 ESL
Fluorene 0.00064 1 ESL
Formaldehyde 34.7 12 ESL
Heptane, n- 474 850 ESL
Hexachloro-1,3-butadiene 0.079 0.2 ESL
Hexane, n- 573 1,500 ESLIndeno(1,2,3-cd)pyrene 0.00000088 0.04 ESL
Isobutane 1.22 8,000 AMCV
Isobutyraldehyde 0.11 2,700 AMCV
Isopentane 1,099 1,200 ESL
Isopropylbenzene 0.91 500 AMCV
Isopropyltoluene, 4- 0.43 500 ESL
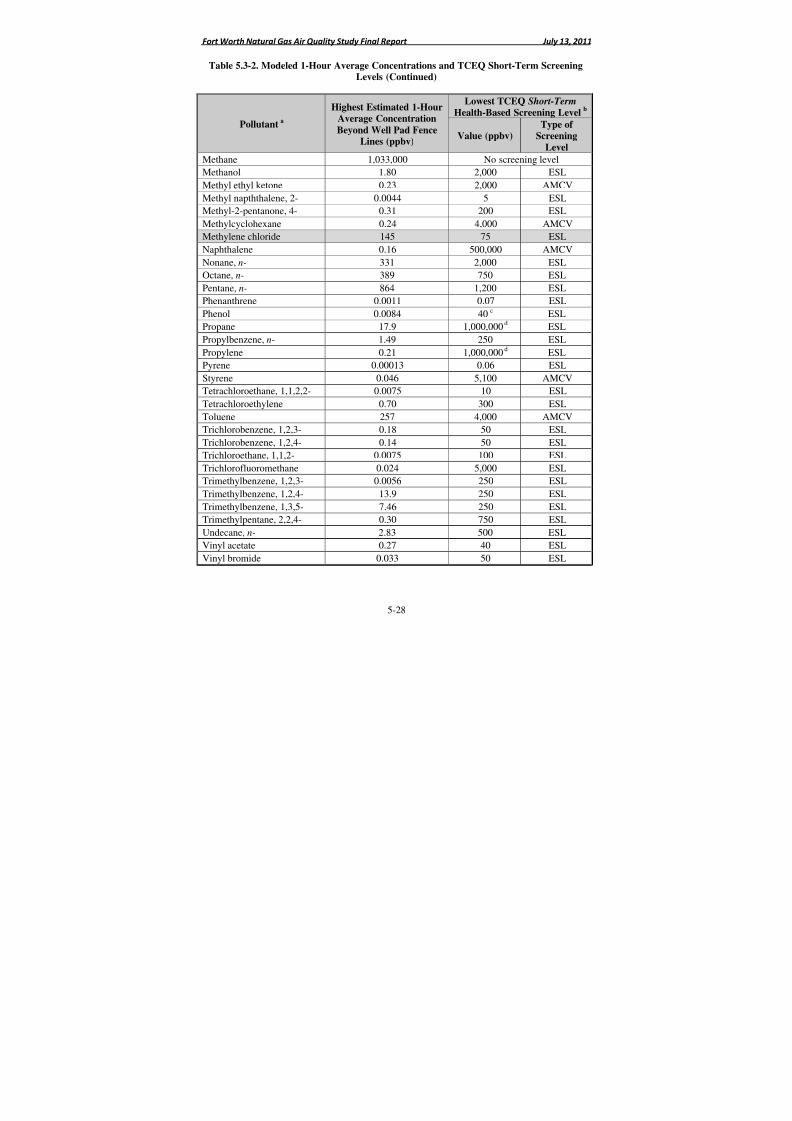
8/6/2019 Air Quality Study Final
http://slidepdf.com/reader/full/air-quality-study-final 251/320

8/6/2019 Air Quality Study Final
http://slidepdf.com/reader/full/air-quality-study-final 252/320
8/6/2019 Air Quality Study Final
http://slidepdf.com/reader/full/air-quality-study-final 253/320
8/6/2019 Air Quality Study Final
http://slidepdf.com/reader/full/air-quality-study-final 254/320
Fort Worth Natural Gas Air Quality Study Final Report July 13, 2011
5-31
250 hp. For this scenario, highest 1-hour average concentrations of acrolein andformaldehyde exceeded TCEQ’s short-term ESL, but this only occurred at fence linelocations for acrolein and at receptors within 100 feet of fence lines for formaldehyde.On the other hand, Scenarios 3 and 4 considered the larger “line engines,” whichoperate at roughly 1,500 hp. For these scenarios, 1-hour average concentrations of
acrolein greater than TCEQ’s short-term ESL extended approximately 400 feet fromthe fence lines, and 1-hour average concentrations of formaldehyde greater thanTCEQ’s ESL were estimated to occur up to 750 feet beyond the fence lines. In thecase of formaldehyde, the highest offsite 1-hour average concentration was estimatedto be nearly 3 times higher than TCEQ’s short-term ESL. Section 5.4 presents furtherinformation on the health implications of the estimated concentrations for thesepollutants.
• Methylene chloride. As Table 5.3-2 shows, the highest estimated 1-hour averageconcentration of methylene chloride (145 ppbv) is higher than TCEQ’s short-termESL (75 ppbv). However, the modeling output for methylene chloride is based on an
emissions measurement of suspect quality. Specifically, the emission rate used in themodeling analysis is based on a sample (#B015) collected on September 20, 2010, ata well pad (Site #PS-075). However, the analytical report for this sample includes twoqualifiers. First, the laboratory reported a “B” qualifier, which indicates thatmethylene chloride was also detected in the method blank, raising questions aboutcontamination of the sampling equipment. Second, the laboratory reported a “J”qualifier, which means the measured concentration was higher than the MDL butlower than the laboratory’s reporting limit; the analytical report further states that“…the user of [J-qualified] data should be aware that this data is of limitedreliability.” For these reasons, ERG concludes that the highest estimated methylenechloride concentration shown in Table 5.3-2 is of questionable quality. If this one
sample were omitted from the emissions estimation analysis, the next highest 1-houraverage concentrations of methylene chloride predicted by the model would besubstantially lower than TCEQ’s short-term ESL. Accordingly, ERG does notrecommend further evaluation of this pollutant.
Overall, the highest estimated 1-hour average concentrations predicted by the dispersionmodel are below TCEQ’s health-based short-term screening levels for nearly every pollutantconsidered. For reasons stated above, ERG concludes that further evaluation is warranted for theair quality impacts of acrolein and formaldehyde, which had 1-hour concentrations abovescreening levels beyond the fence line of any site with operating lift engines or line engines.Section 5.4 provides further insights on these two pollutants.
8/6/2019 Air Quality Study Final
http://slidepdf.com/reader/full/air-quality-study-final 255/320
Fort Worth Natural Gas Air Quality Study Final Report July 13, 2011
5-32
Key Point: Long-Term ModelingA model was used to estimate annual average
air quality impacts caused by emissions fromwell pads and compressor stations. Of allpollutants considered, only acrolein andformaldehyde had estimated annual averageconcentrations at locations at least 200 feetfrom fence lines greater than TCEQscreening levels. These air quality impactsare greatest for well pads and compressorstations with large line engines.
5.3.3 Health Evaluation for Modeled Annual Average Concentrations
ERG assessed potential long-termexposures to site-related pollutants by evaluating
the highest annual average concentrations outputby the dispersion model. This comparisonconsidered all locations more than 200 feet fromfence lines of well pads and compressor stations.This downwind distance was selected because,although most gas well must be at least 600 feetfrom residences, city variances allow setback distances as low as 200 feet. The comparisonspresented here represent a worst-case scenario: afull-time resident living just 200 feet from thehighest-emitting well pads and compressor stations.
For every pollutant considered in the modeling analysis, Table 5.3-3 compares thehighest estimated annual average concentrations to TCEQ’s health-based, long-term screeninglevels. For this evaluation, the hierarchy for selecting screening levels follows: If a pollutant hasa long-term health-based ESL, that value is used in Table 5.3-3, even if a different AMCV isavailable for the pollutant. This preference again reflects the fact that TCEQ specifically derivedESLs for evaluating dispersion modeling data, whereas AMCVs are the screening levels of choice when assessing ambient air monitoring data. The few pollutants that do not have long-term ESLs do not have any TCEQ health-based screening values, as indicated in the table.Shading is used in the table to identify pollutants that had at least one estimated annual averageconcentration at distances more than 200 feet from the fence lines higher than the TCEQ long-term screening level.
As Table 5.3-3 shows, only two pollutants considered in the modeling analysis—acroleinand formaldehyde—had estimated annual average concentrations greater than TCEQ’s health-based, long-term ESLs. Across all pollutants, the highest annual average concentrations reportedin the table were all observed for modeling Scenarios 2, 3, or 4. In contrast, Scenario 1, whichwas based on typical well pad emissions, had considerably lower estimated air quality impacts—and no annual average concentrations greater than long-term screening levels at any locationsbeyond the fence lines. Further information follows for the two pollutants with estimated annualaverage concentrations greater than screening levels:
• Acrolein. The highest annual average concentration of acrolein at locations atleast 200 feet from fence lines predicted by the model (0.33 ppbv) was higherthan TCEQ’s health-based, long-term ESL (0.066 ppbv). However, consideringreceptors at least 200 feet from fence lines, only Scenarios 3 and 4 had at leastone estimated annual average concentration of acrolein greater than TCEQ’s ESL.This suggests that emissions from the larger line engines account for the onlyinstances where estimated acrolein levels exceeded TCEQ’s long-term ESL.
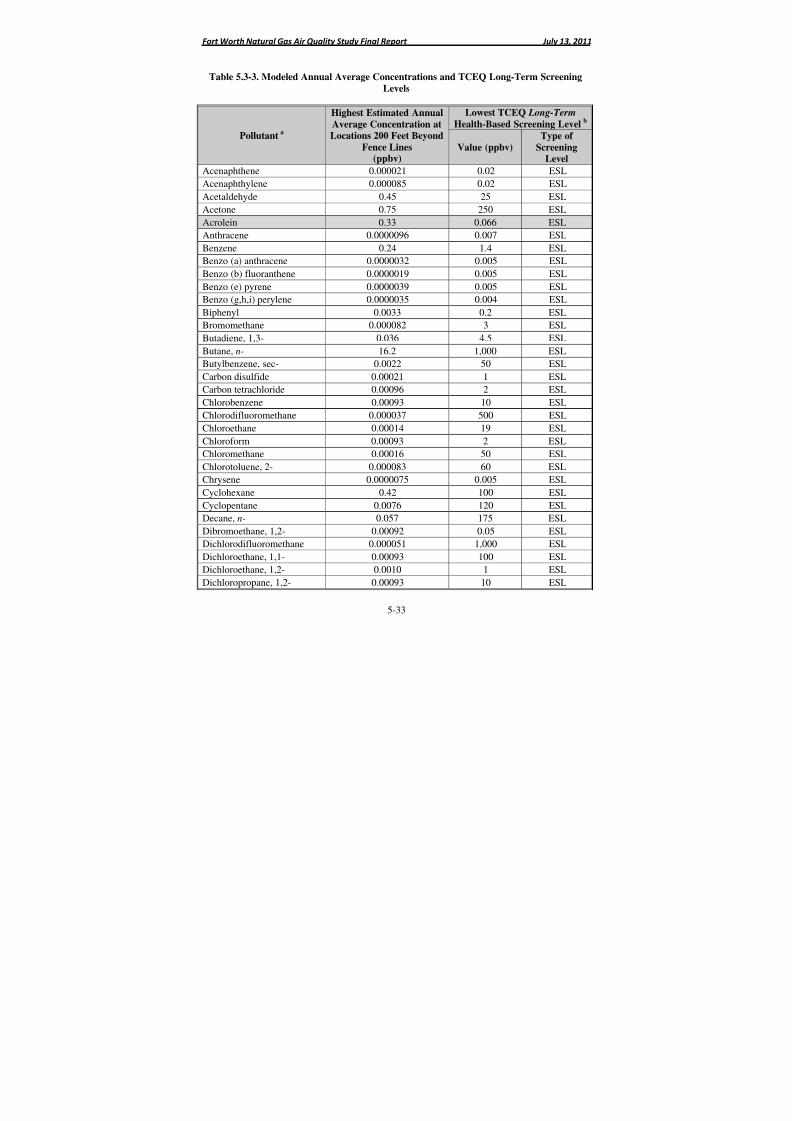
8/6/2019 Air Quality Study Final
http://slidepdf.com/reader/full/air-quality-study-final 256/320
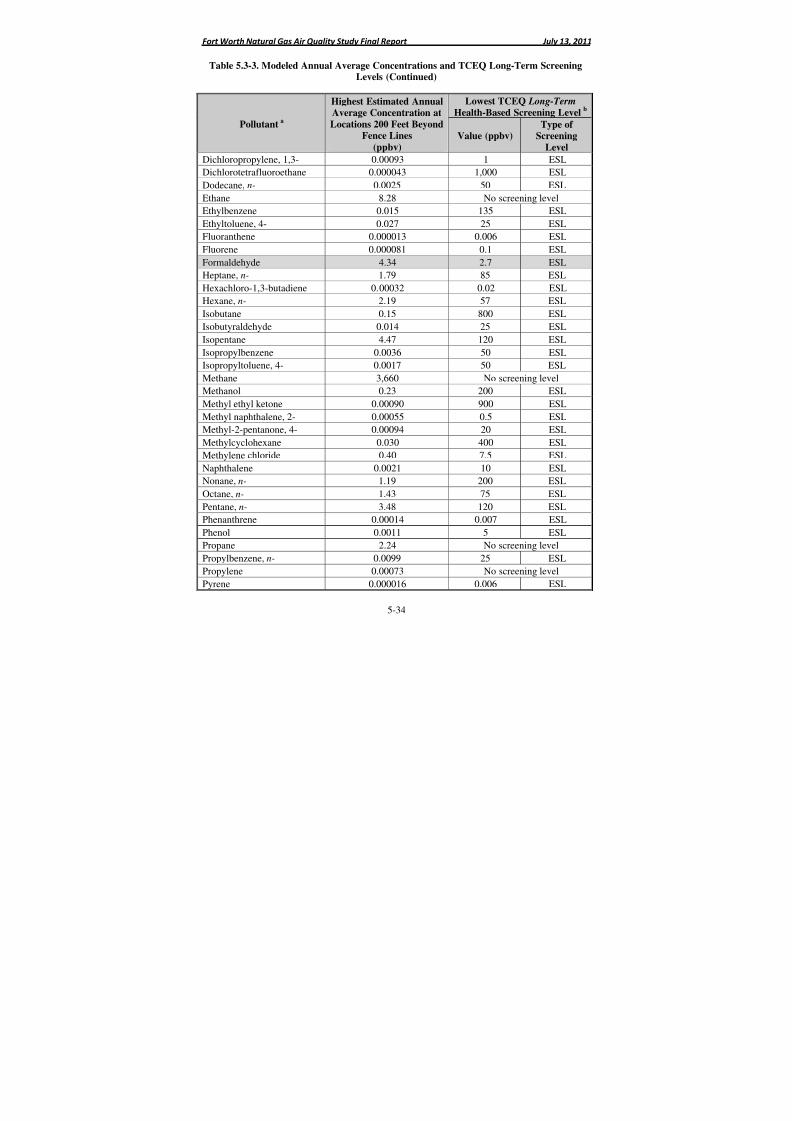
8/6/2019 Air Quality Study Final
http://slidepdf.com/reader/full/air-quality-study-final 257/320
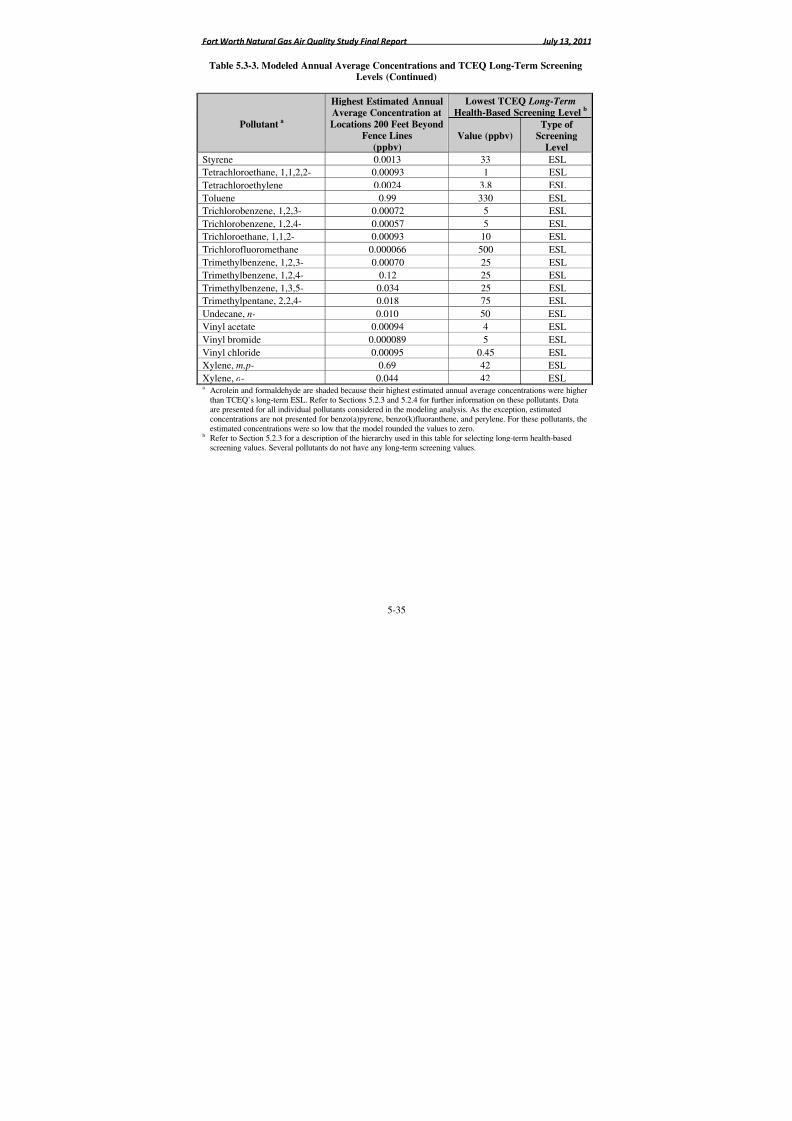
8/6/2019 Air Quality Study Final
http://slidepdf.com/reader/full/air-quality-study-final 258/320
8/6/2019 Air Quality Study Final
http://slidepdf.com/reader/full/air-quality-study-final 259/320
8/6/2019 Air Quality Study Final
http://slidepdf.com/reader/full/air-quality-study-final 260/320
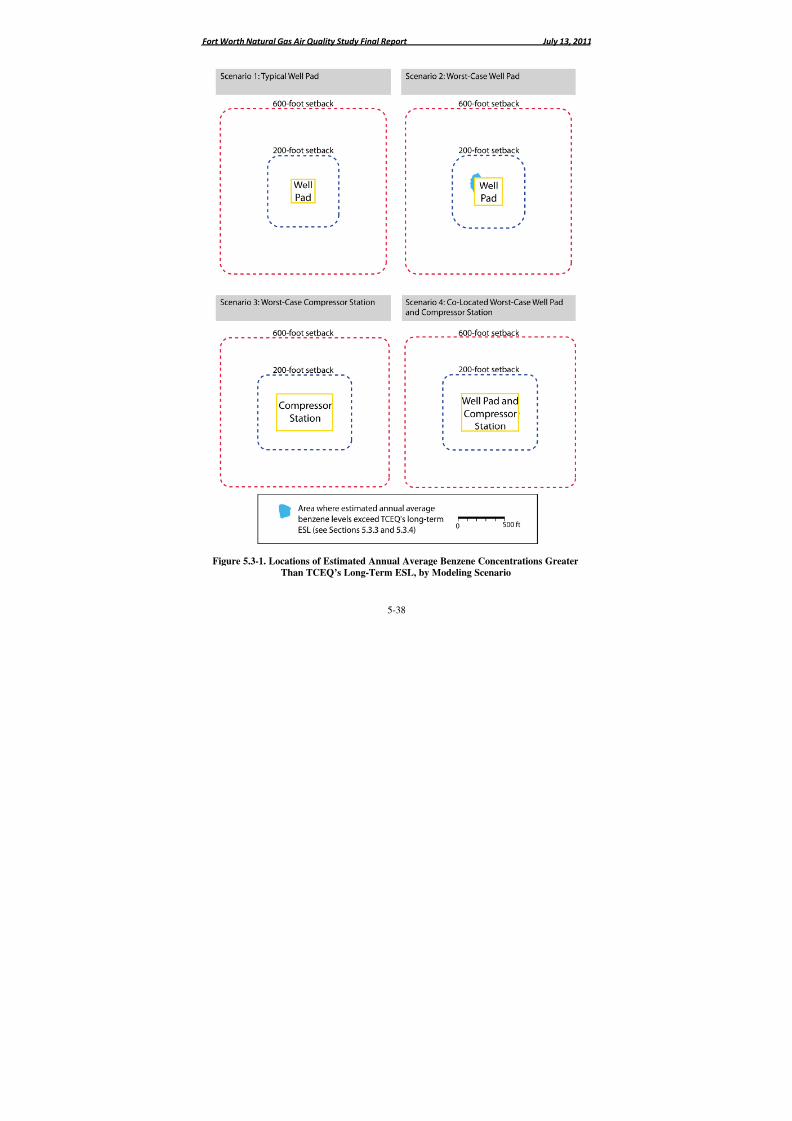
8/6/2019 Air Quality Study Final
http://slidepdf.com/reader/full/air-quality-study-final 261/320
Fort Worth Natural Gas Air Quality Study Final Report July 13, 2011
5-38
Figure 5.3-1. Locations of Estimated Annual Average Benzene Concentrations Greater
Than TCEQ’s Long-Term ESL, by Modeling Scenario
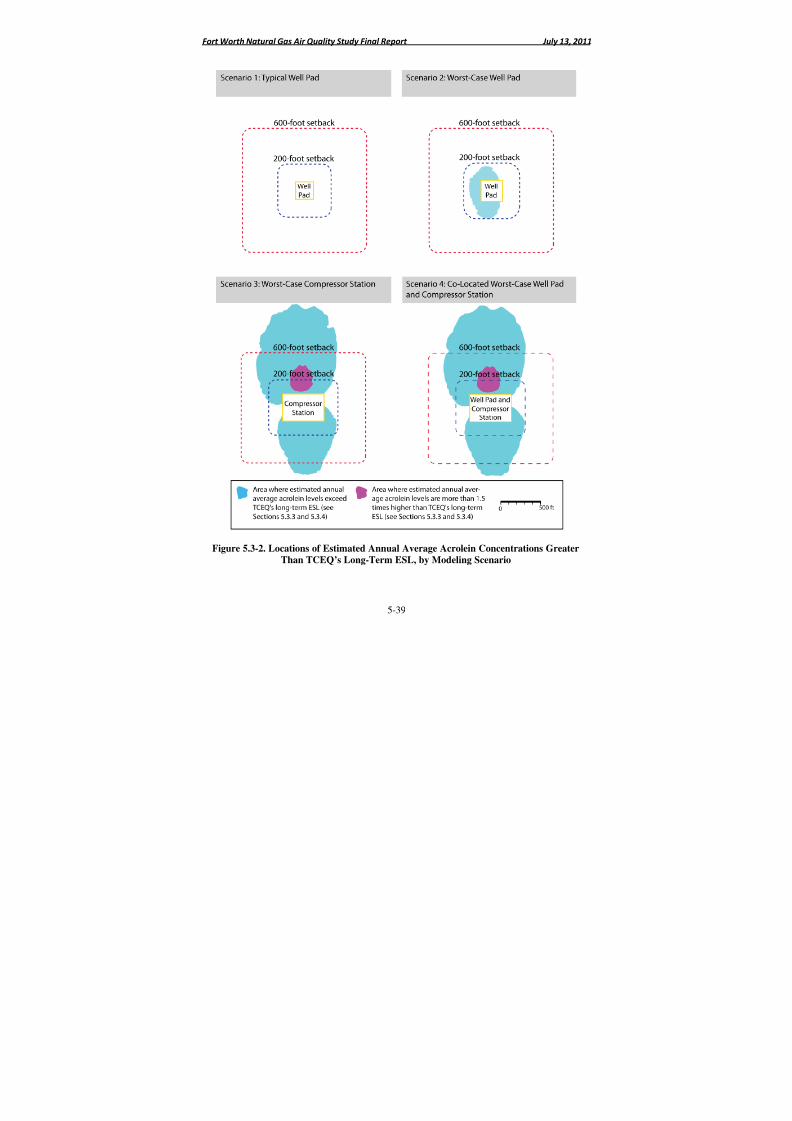
8/6/2019 Air Quality Study Final
http://slidepdf.com/reader/full/air-quality-study-final 262/320
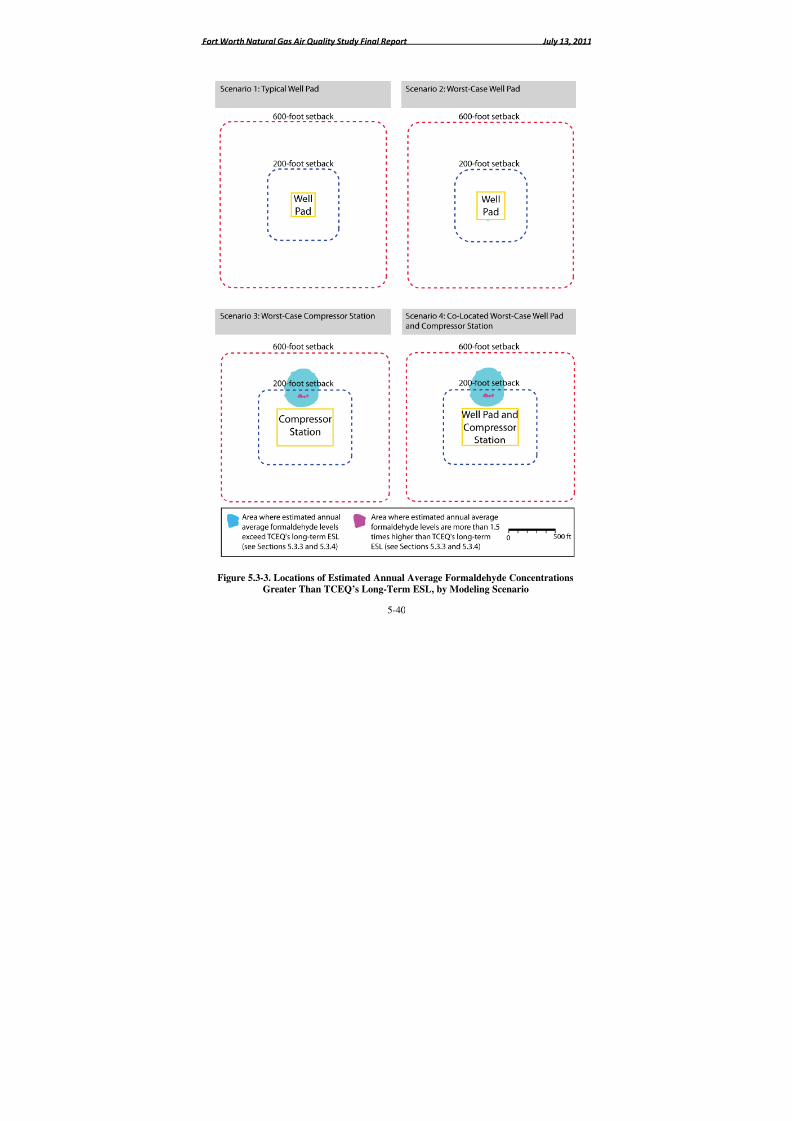
8/6/2019 Air Quality Study Final
http://slidepdf.com/reader/full/air-quality-study-final 263/320
Fort Worth Natural Gas Air Quality Study Final Report July 13, 2011
5-40
Figure 5.3-3. Locations of Estimated Annual Average Formaldehyde ConcentrationsGreater Than TCEQ’s Long-Term ESL, by Modeling Scenario
8/6/2019 Air Quality Study Final
http://slidepdf.com/reader/full/air-quality-study-final 264/320
Fort Worth Natural Gas Air Quality Study Final Report July 13, 2011
5-41
In summary, for the overwhelming majority of sites considered in this study, themodeling analysis indicates that Fort Worth’s 600-foot setback distance is adequate. For therelatively few sites with multiple, large line engines, the modeling analysis found some areasbeyond the setbacks to have estimated acrolein and formaldehyde concentrations greater thanTCEQ’s ESLs. For both pollutants, ERG’s modeling is based entirely on estimated emission
rates, and not measured values. This underscores the value of obtaining more detailed acroleinand formaldehyde emissions data for line engines and focused ambient air monitoring to validatethese findings. Such studies would provide greater confidence in the adequacy andprotectiveness of the city’s setbacks.
5.3.5 Modeled Concentrations: Main Findings, Limitations, and Uncertainties
The information presented throughout Section 5.3 is based entirely on the dispersionmodeling analysis. Unlike ambient air monitoring data, which are direct measurements of airpollution levels, models provide estimates of ambient air concentrations. The accuracy of themodeling outputs depends on many factors, but especially on the representativeness of the
emissions data input to the model. Emission rates for this study were based on measured andestimated data: emissions from tanks and fugitive sources were directly measured during thepoint source testing program, and emissions from lift engines and line engines were estimatedusing standard computational algorithms and EPA-published emission factors. For somepollutants, most notably acrolein and formaldehyde, the estimated offsite ambient airconcentrations from the model are based entirely on the estimated emissions from lift enginesand line engines. While these estimates were generated using the best information available toERG, the methodologies may not adequately represent the types of engines typically used at wellpads and compressor stations in Fort Worth. Because acrolein and formaldehyde are twopollutants of concern for this study, consideration should be given to reducing uncertaintiesassociated with the estimated concentrations. This could be achieved by either additional pointsource testing at sites with line engines or air monitoring for these compounds downwind from aline engine site known to burn the largest quantities of natural gas.
Additionally, the modeling conducted for this study only evaluated dispersion, or themovement of the pollutants through the air from their sources to offsite receptors. Many of thepollutants emitted at the well pads and compressor stations are known to react in the air and formother pollutants, and this was not considered in the modeling analysis. Supplemental analysesusing photochemical models might be warranted to more fully investigate the full range of airquality impacts on local air quality (e.g., consideration of contributions to ozone formation andother processes).
5.4 Additional Context for Selected Pollutants
The earlier analyses in this section identified acrolein and formaldehyde as the pollutantsthat are most likely to have site-related air quality impacts greater than TCEQ health-basedscreening levels at locations beyond the 600-foot setbacks. Additionally, estimated ambient airconcentrations of benzene were found to exceed short-term screening levels in the immediatevicinity of the highest-emitting tanks. This section presents additional context for thesepollutants, which includes comparisons to air pollution levels measured elsewhere in Texas and
8/6/2019 Air Quality Study Final
http://slidepdf.com/reader/full/air-quality-study-final 265/320
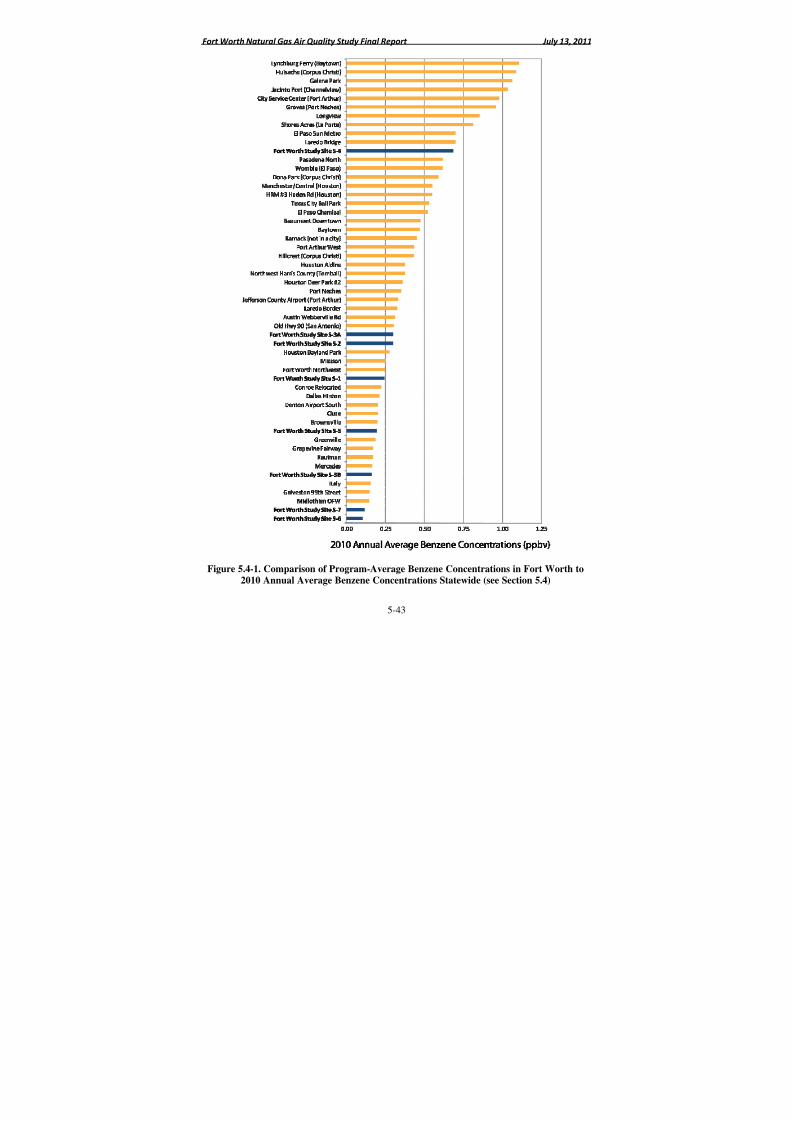
8/6/2019 Air Quality Study Final
http://slidepdf.com/reader/full/air-quality-study-final 266/320
Fort Worth Natural Gas Air Quality Study Final Report July 13, 2011
5-43
Figure 5.4-1. Comparison of Program-Average Benzene Concentrations in Fort Worth to2010 Annual Average Benzene Concentrations Statewide (see Section 5.4)
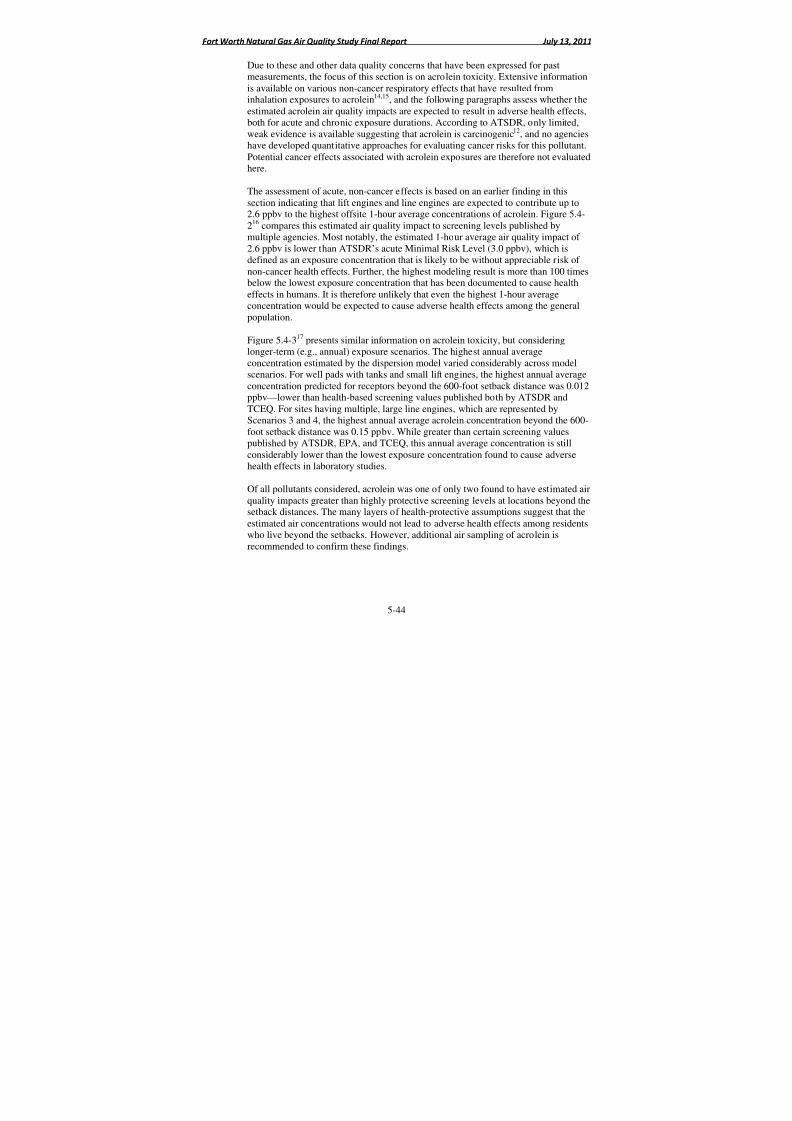
8/6/2019 Air Quality Study Final
http://slidepdf.com/reader/full/air-quality-study-final 267/320
Fort Worth Natural Gas Air Quality Study Final Report July 13, 2011
5-44
Due to these and other data quality concerns that have been expressed for pastmeasurements, the focus of this section is on acrolein toxicity. Extensive informationis available on various non-cancer respiratory effects that have resulted frominhalation exposures to acrolein14,15, and the following paragraphs assess whether theestimated acrolein air quality impacts are expected to result in adverse health effects,
both for acute and chronic exposure durations. According to ATSDR, only limited,weak evidence is available suggesting that acrolein is carcinogenic12, and no agencieshave developed quantitative approaches for evaluating cancer risks for this pollutant.Potential cancer effects associated with acrolein exposures are therefore not evaluatedhere.
The assessment of acute, non-cancer effects is based on an earlier finding in thissection indicating that lift engines and line engines are expected to contribute up to2.6 ppbv to the highest offsite 1-hour average concentrations of acrolein. Figure 5.4-216 compares this estimated air quality impact to screening levels published bymultiple agencies. Most notably, the estimated 1-hour average air quality impact of
2.6 ppbv is lower than ATSDR’s acute Minimal Risk Level (3.0 ppbv), which isdefined as an exposure concentration that is likely to be without appreciable risk of non-cancer health effects. Further, the highest modeling result is more than 100 timesbelow the lowest exposure concentration that has been documented to cause healtheffects in humans. It is therefore unlikely that even the highest 1-hour averageconcentration would be expected to cause adverse health effects among the generalpopulation.
Figure 5.4-317 presents similar information on acrolein toxicity, but consideringlonger-term (e.g., annual) exposure scenarios. The highest annual averageconcentration estimated by the dispersion model varied considerably across modelscenarios. For well pads with tanks and small lift engines, the highest annual averageconcentration predicted for receptors beyond the 600-foot setback distance was 0.012ppbv—lower than health-based screening values published both by ATSDR andTCEQ. For sites having multiple, large line engines, which are represented byScenarios 3 and 4, the highest annual average acrolein concentration beyond the 600-foot setback distance was 0.15 ppbv. While greater than certain screening valuespublished by ATSDR, EPA, and TCEQ, this annual average concentration is stillconsiderably lower than the lowest exposure concentration found to cause adversehealth effects in laboratory studies.
Of all pollutants considered, acrolein was one of only two found to have estimated airquality impacts greater than highly protective screening levels at locations beyond thesetback distances. The many layers of health-protective assumptions suggest that theestimated air concentrations would not lead to adverse health effects among residentswho live beyond the setbacks. However, additional air sampling of acrolein isrecommended to confirm these findings.
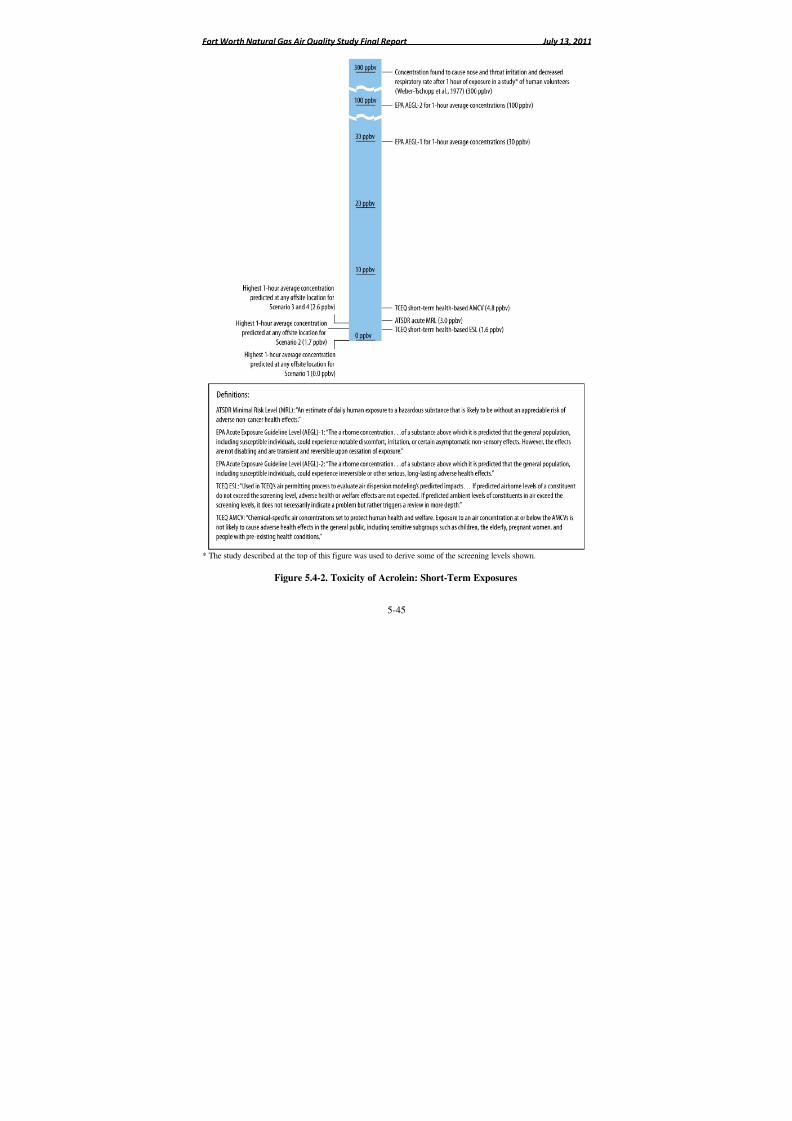
8/6/2019 Air Quality Study Final
http://slidepdf.com/reader/full/air-quality-study-final 268/320
8/6/2019 Air Quality Study Final
http://slidepdf.com/reader/full/air-quality-study-final 269/320
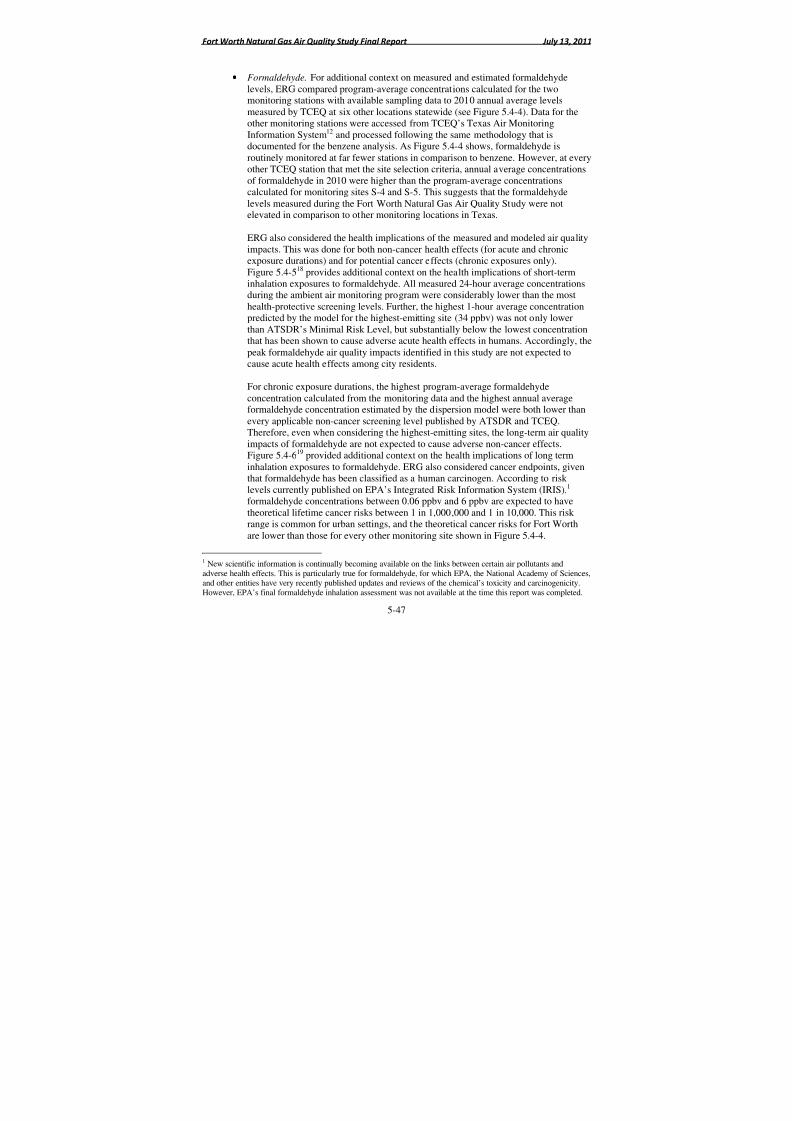
8/6/2019 Air Quality Study Final
http://slidepdf.com/reader/full/air-quality-study-final 270/320
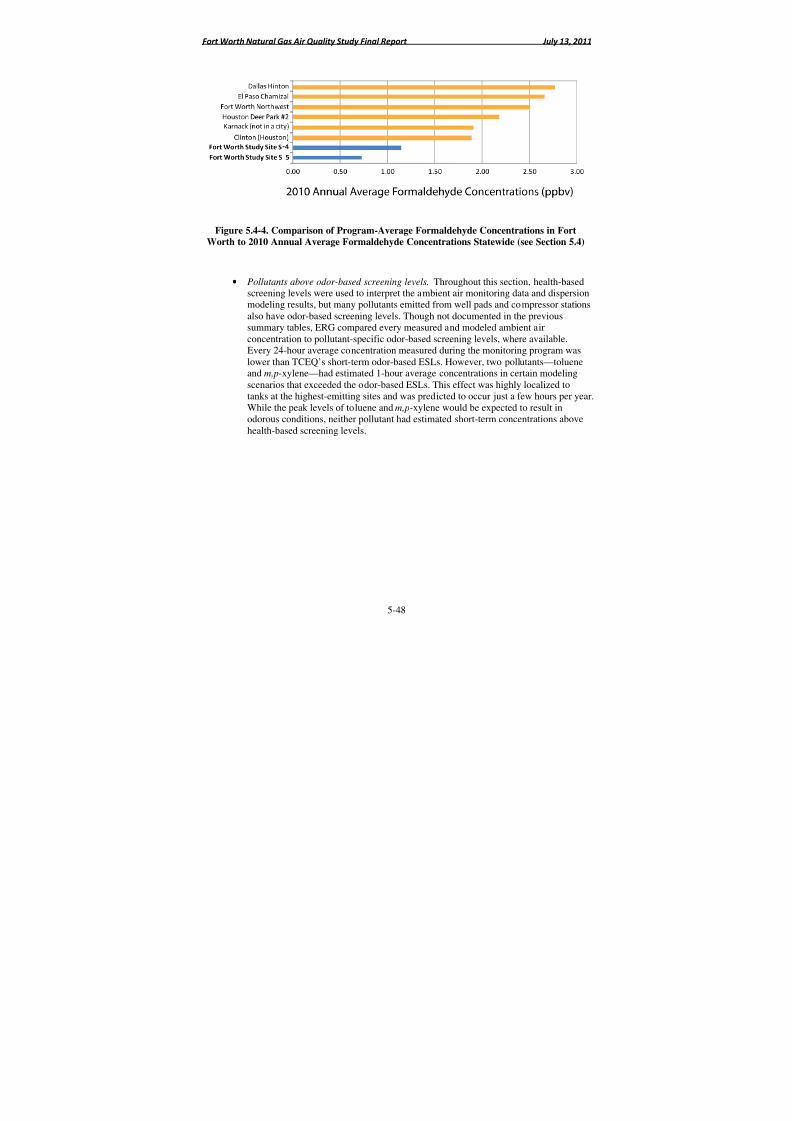
8/6/2019 Air Quality Study Final
http://slidepdf.com/reader/full/air-quality-study-final 271/320
Fort Worth Natural Gas Air Quality Study Final Report July 13, 2011
5-48
Figure 5.4-4. Comparison of Program-Average Formaldehyde Concentrations in FortWorth to 2010 Annual Average Formaldehyde Concentrations Statewide (see Section 5.4)
• Pollutants above odor-based screening levels. Throughout this section, health-basedscreening levels were used to interpret the ambient air monitoring data and dispersionmodeling results, but many pollutants emitted from well pads and compressor stationsalso have odor-based screening levels. Though not documented in the previoussummary tables, ERG compared every measured and modeled ambient airconcentration to pollutant-specific odor-based screening levels, where available.Every 24-hour average concentration measured during the monitoring program waslower than TCEQ’s short-term odor-based ESLs. However, two pollutants—tolueneand m,p-xylene—had estimated 1-hour average concentrations in certain modelingscenarios that exceeded the odor-based ESLs. This effect was highly localized totanks at the highest-emitting sites and was predicted to occur just a few hours per year.While the peak levels of toluene and m,p-xylene would be expected to result inodorous conditions, neither pollutant had estimated short-term concentrations abovehealth-based screening levels.
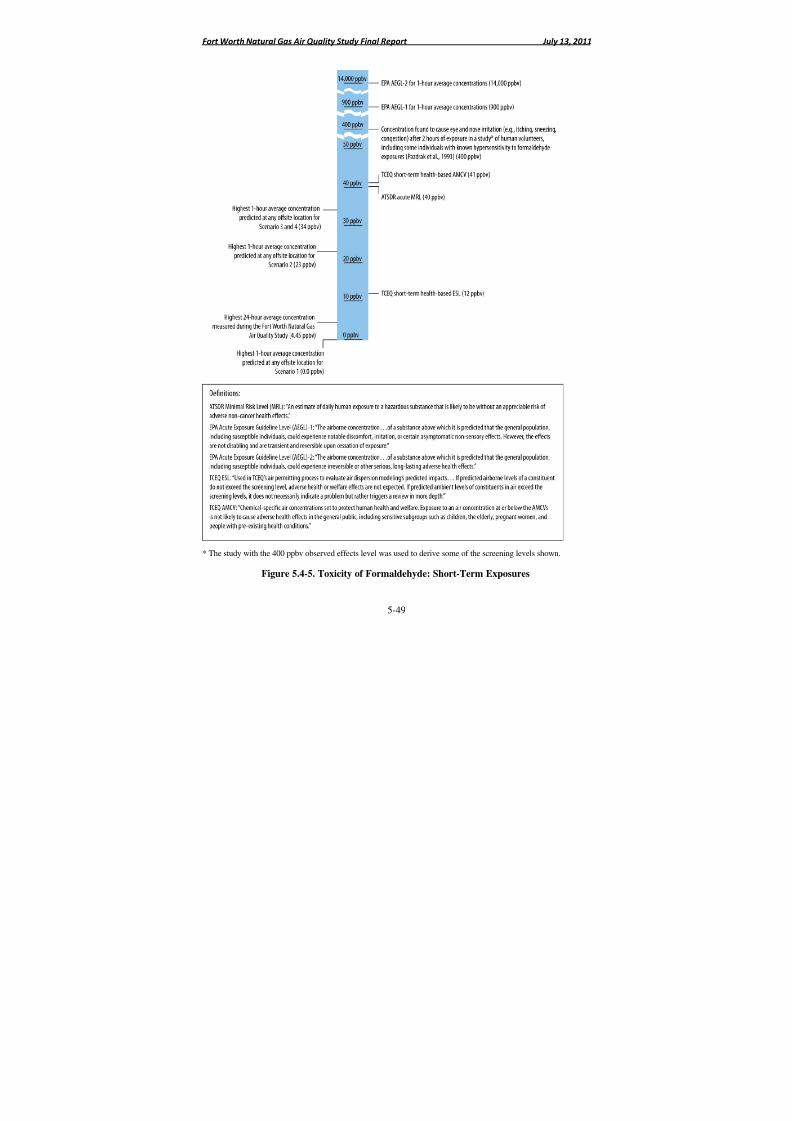
8/6/2019 Air Quality Study Final
http://slidepdf.com/reader/full/air-quality-study-final 272/320
Fort Worth Natural Gas Air Quality Study Final Report July 13, 2011
5-49
* The study with the 400 ppbv observed effects level was used to derive some of the screening levels shown.
Figure 5.4-5. Toxicity of Formaldehyde: Short-Term Exposures
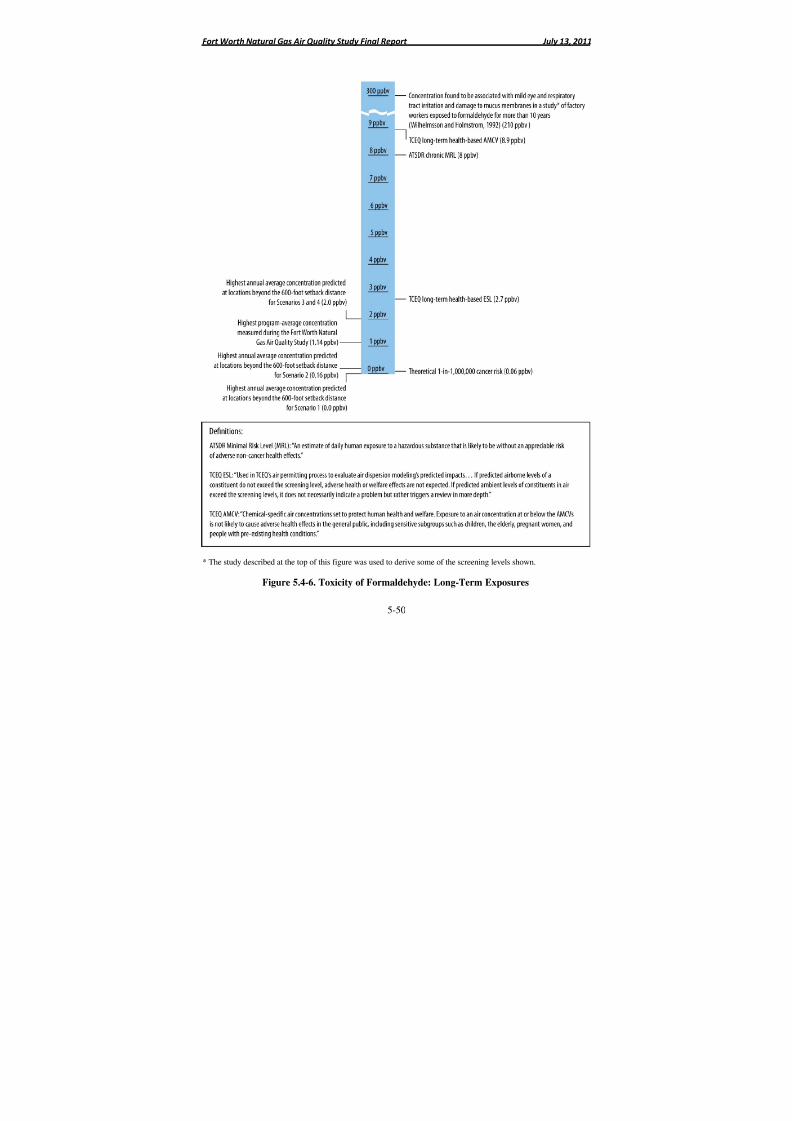
8/6/2019 Air Quality Study Final
http://slidepdf.com/reader/full/air-quality-study-final 273/320
Fort Worth Natural Gas Air Quality Study Final Report July 13, 2011
5-50
* The study described at the top of this figure was used to derive some of the screening levels shown.
Figure 5.4-6. Toxicity of Formaldehyde: Long-Term Exposures
8/6/2019 Air Quality Study Final
http://slidepdf.com/reader/full/air-quality-study-final 274/320

8/6/2019 Air Quality Study Final
http://slidepdf.com/reader/full/air-quality-study-final 275/320
Fort Worth Natural Gas Air Quality Study Final Report July 13, 2011
5-52
near sites with multiple, large line engines, especially when variances to the 600-foot setbacksare being considered for these higher-emitting facilities. TCEQ has recently completed anambient air monitoring study that considered acrolein and formaldehyde levels in Fort Worth.20 The week-long monitoring effort found no evidence of acrolein and formaldehyde exceedingshort-term health-based screening levels, but that study was limited in scope and duration.
Routine monitoring over a longer duration near a site with multiple, large lift engines isencouraged.
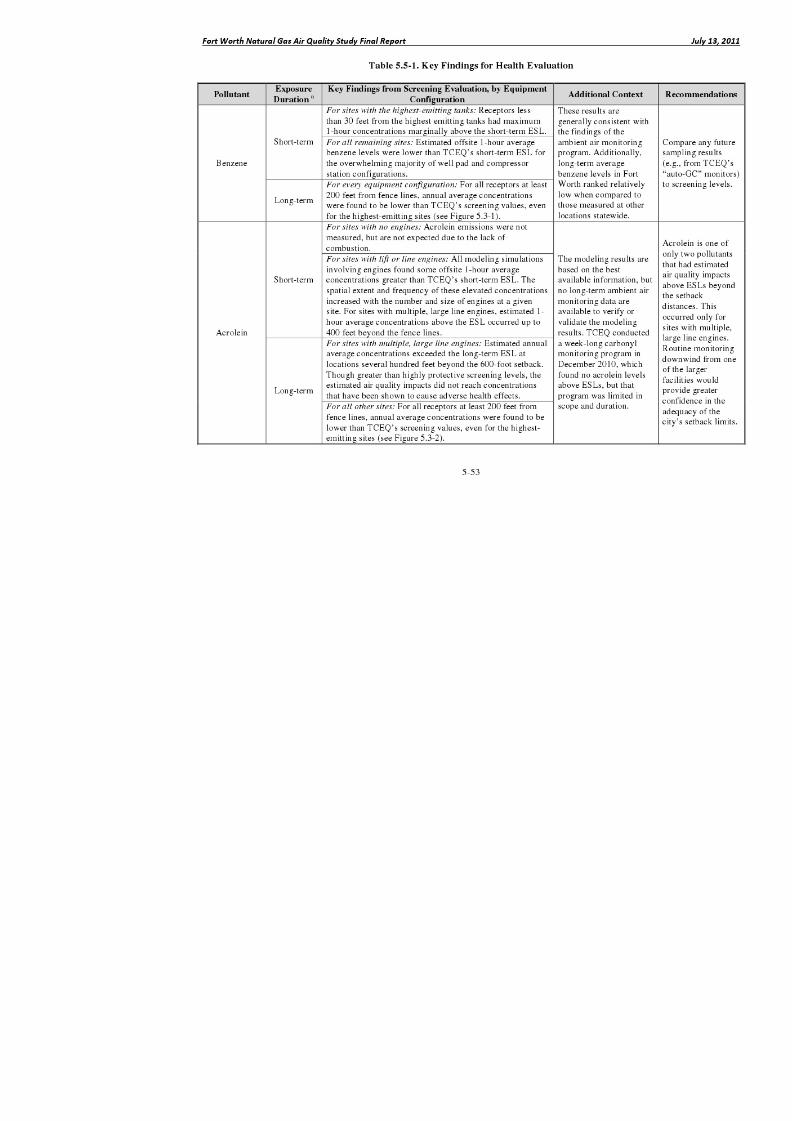
8/6/2019 Air Quality Study Final
http://slidepdf.com/reader/full/air-quality-study-final 276/320
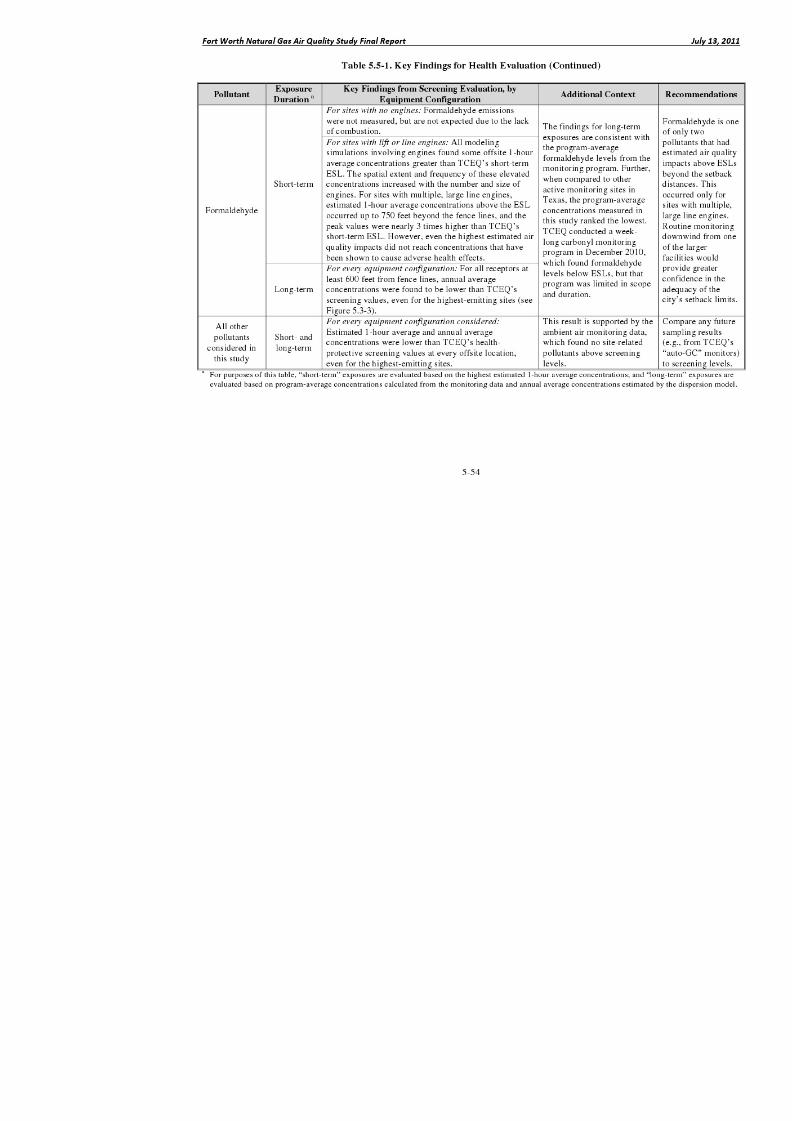
8/6/2019 Air Quality Study Final
http://slidepdf.com/reader/full/air-quality-study-final 277/320
8/6/2019 Air Quality Study Final
http://slidepdf.com/reader/full/air-quality-study-final 278/320
Fort Worth Natural Gas Air Quality Study Final Report July 13, 2011
6-1
6.0 Regulatory Assessment
Under this task, facility-level emission estimates developed under Task 3 (point sourcetesting) for well pads, compressor stations, and natural gas processing and treatment plants wereevaluated against various federal and state air quality regulatory thresholds and standards
applicable to these types of facilities. Regulatory standards considered include EPA’s operatingand construction permit rules, National Emissions Standard for Hazardous Air Pollutants(NESHAPs), and New Source Performance Standards (NSPS); TCEQ’s permit-by-rule, standardpermit, and other regulations applicable to upstream oil and gas facilities; and the city of FortWorth’s Gas Well Drilling Ordinance.
This section has four sub-sections:
• 6.1 Federal Air Quality Rules – A description of potentially applicable U.S. EPA airquality rules are provided here.
• 6.2 Texas Commission on Environmental Quality Air Quality Rules – This section
provides a discussion of potentially applicable TCEQ air quality rules.• 6.3 City of Fort Worth Air Quality Rules – The city of Fort Worth’s Gas Well
Drilling Ordinance (Ordinance No. 18449-02-2009) is discussed in this section.
• 6.4 Regulatory Assessment Conclusions – Provides a summary of the results of theregulatory assessment.
6.1 Federal Air Quality Rules
EPA regulates air emissions from stationary sources such as well pads and compressorstations through a variety of regulatory mechanisms. In brief, these are:
• Operating permit rules
• Construction permit rules
• NSPS
• NESHAPs
• The Greenhouse Gas Reporting Program
These air quality regulations are discussed individually in Sections 6.1.1 through 6.1.5.
6.1.1 Operating Permits
Operating permits are legally enforceable documents that permitting authorities issue toair pollution sources after the sources begin to operate. Depending on the magnitude of emissions from a facility, there are different types of operating permits available, with the largestsources (typically those emitting over 100 tons per year (tpy) of a regulated pollutant such asVOCs) required to obtain a Title V Operating permit. In Texas, these permits are issued byTCEQ as discussed below in Section 6.2.
8/6/2019 Air Quality Study Final
http://slidepdf.com/reader/full/air-quality-study-final 279/320
8/6/2019 Air Quality Study Final
http://slidepdf.com/reader/full/air-quality-study-final 280/320
8/6/2019 Air Quality Study Final
http://slidepdf.com/reader/full/air-quality-study-final 281/320
Fort Worth Natural Gas Air Quality Study Final Report July 13, 2011
6-4
may apply to engines used at natural gas well pads and compressor stations in Fort Worth, noapplicability or compliance determination can be made at this time.
Subpart KKKK—Stationary Combustion Turbines. This regulation applies to stationarycombustion turbines constructed, modified, or reconstructed after February 18, 2005. This rule
limits NOx and SO2 emissions from subject facilities. ERG did not identify any gas turbinesunder Task 3.
6.1.4 National Emission Standards for Hazardous Air Pollutants
NESHAPs regulate HAPs from new and existing stationary sources. For the oil and gasindustry, the potentially applicable NESHAPs include the following:
• Subpart H—Organic Hazardous Air Pollutants for Equipment Leaks
• Subpart V—Equipment Leaks (Fugitive Emission Sources)
• Subpart HH—Oil and Natural Gas Production Facilities
• Subpart VV—Oil-Water Separators and Organic-Water Separators
• Subpart HHH—Natural Gas Transmission and Storage Facilities
• Subpart YYYY—Stationary Combustion Turbines
• Subpart ZZZZ—Stationary Reciprocating Internal Combustion Engines
A brief discussion of each of these rules follows. Where possible, a preliminarydetermination of compliance and applicability status with respect to the sites visited under thepoint source task has been made. However, a formal and comprehensive compliance andapplicability assessment is not possible for each facility without a complete record of
construction, monitoring, and recordkeeping activities.
Many of the NESHAP regulations apply only to major HAP sources, those defined asemitting greater than 10 tpy of any single HAP, or 25 tpy of all HAPs combined. As a result of the point source testing task, three potential major HAP sources were identified, including twocompressor stations (Site IDs PS-118 and PS-119) and the gas processing plant (Site ID PS-159).All of these facilities were determined to be major HAP sources due to formaldehyde emissionsfrom their compressor engines. Due to the conservative nature of the emissions estimationapproach used for these engines (24-hour-per-day, 365-day-per-year operation of all the enginesat the facility without controls), a full compliance evaluation would need to be made todefinitively conclude whether or not these facilities are major sources of HAP.
Subpart H—Organic Hazardous Air Pollutants for Equipment Leaks. This regulationapplies to sources subject to other NESHAP rules under 40 CFR Part 63 that specifically pointback to this rule. As such, any applicability under Subpart H would be referenced in the rulesdiscussed below.
Subpart V—Equipment Leaks (Fugitive Emission Sources). This regulation applies topumps, compressors, pressure relief devices, sampling connection systems, open-ended valves or
8/6/2019 Air Quality Study Final
http://slidepdf.com/reader/full/air-quality-study-final 282/320
8/6/2019 Air Quality Study Final
http://slidepdf.com/reader/full/air-quality-study-final 283/320
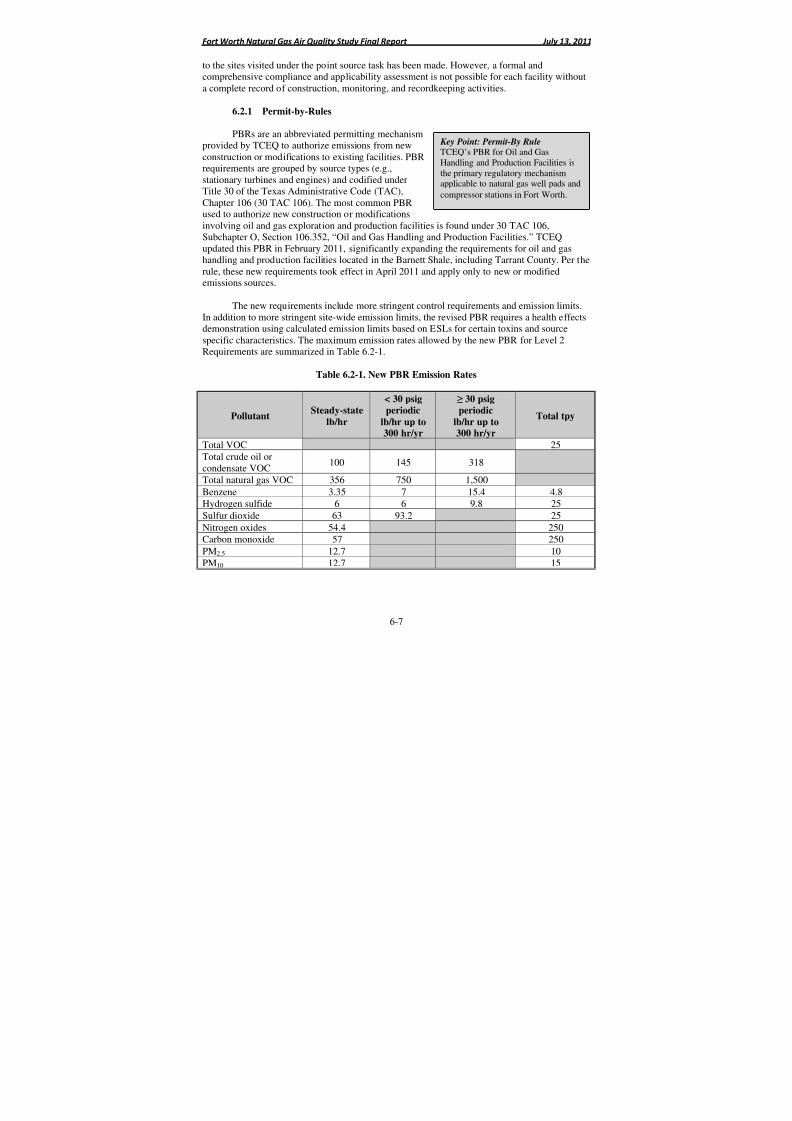
8/6/2019 Air Quality Study Final
http://slidepdf.com/reader/full/air-quality-study-final 284/320
Fort Worth Natural Gas Air Quality Study Final Report July 13, 2011
6-7
Key Point: Permit-By RuleTCEQ’s PBR for Oil and GasHandling and Production Facilities isthe primary regulatory mechanismapplicable to natural gas well pads and
compressor stations in Fort Worth.
to the sites visited under the point source task has been made. However, a formal andcomprehensive compliance and applicability assessment is not possible for each facility withouta complete record of construction, monitoring, and recordkeeping activities.
6.2.1 Permit-by-Rules
PBRs are an abbreviated permitting mechanismprovided by TCEQ to authorize emissions from newconstruction or modifications to existing facilities. PBRrequirements are grouped by source types (e.g.,stationary turbines and engines) and codified underTitle 30 of the Texas Administrative Code (TAC),Chapter 106 (30 TAC 106). The most common PBRused to authorize new construction or modificationsinvolving oil and gas exploration and production facilities is found under 30 TAC 106,Subchapter O, Section 106.352, “Oil and Gas Handling and Production Facilities.” TCEQ
updated this PBR in February 2011, significantly expanding the requirements for oil and gashandling and production facilities located in the Barnett Shale, including Tarrant County. Per therule, these new requirements took effect in April 2011 and apply only to new or modifiedemissions sources.
The new requirements include more stringent control requirements and emission limits.In addition to more stringent site-wide emission limits, the revised PBR requires a health effectsdemonstration using calculated emission limits based on ESLs for certain toxins and sourcespecific characteristics. The maximum emission rates allowed by the new PBR for Level 2Requirements are summarized in Table 6.2-1.
Table 6.2-1. New PBR Emission Rates
PollutantSteady-state
lb/hr
< 30 psigperiodic
lb/hr up to300 hr/yr
≥ 30 psigperiodic
lb/hr up to300 hr/yr
Total tpy
Total VOC 25
Total crude oil orcondensate VOC
100 145 318
Total natural gas VOC 356 750 1,500
Benzene 3.35 7 15.4 4.8
Hydrogen sulfide 6 6 9.8 25Sulfur dioxide 63 93.2 25
Nitrogen oxides 54.4 250Carbon monoxide 57 250
PM2.5 12.7 10PM10 12.7 15
8/6/2019 Air Quality Study Final
http://slidepdf.com/reader/full/air-quality-study-final 285/320
8/6/2019 Air Quality Study Final
http://slidepdf.com/reader/full/air-quality-study-final 286/320
8/6/2019 Air Quality Study Final
http://slidepdf.com/reader/full/air-quality-study-final 287/320
Fort Worth Natural Gas Air Quality Study Final Report July 13, 2011
6-10
Compliance with the ground-level concentration requirements under this rule cannot bedetermined using the data obtained at the time of the survey. As mentioned previously, thenatural gas in the Barnett Shale is not considered to be sour natural gas, so this rule does notappear to apply to any facilities in Fort Worth.
6.2.6 Standards of Performance for Hazardous Air Pollutants and for DesignatedFacilities and Pollutants
This rule simply incorporates, by reference, all of the federal NESHAPs that regulateHAPs from new and existing stationary sources. Section 6.1.4 lists and briefly describes thepotentially applicable NESHAPs for the oil and gas industry.
6.2.7 Control of Air Pollution from Volatile Organic Compounds
This rule regulates the amount of VOCs that are permissible from sources operated inTexas. The rule requirements are organized by source type under 30 TAC Chapter 115 and only
apply to sources located in non-attainment areas specified in the rule. Those parts of the rule thatare potentially subject to upstream oil and gas facilities are Subchapter B, Division 1, “Storage of VOCs”; Subchapter C, Division 1, “Loading and Unloading of VOCs”; and Subchapter D,Division 3, “Fugitive Emission Control in Petroleum Refining, Natural Gas/Gasoline Processing,and Petrochemical Processes in Ozone Non-attainment Areas.” Storage tanks containing VOCsincluding, but not limited to, crude or condensate must control emissions using controltechnologies specified in the rule. Control options vary depending on the size of the tank and itsconfiguration. Loading of certain VOC materials must be controlled by a vapor control systemthat maintains a control efficiency of at least 90%, a vapor balance system, or pressurizedloading. This rule also requires VOC leak detection and repair at natural gas/gasoline processingoperations. Site PS-159 (the Crosstex Amine Treatment Center) could be subject to this rule.
Compliance status with the control and monitoring requirements under this rule cannot bedetermined using the data obtained at the time of the survey.
6.2.8 Control of Air Pollution from Nitrogen Compounds
This rule regulates the amount of nitrogen compounds that are permissible from sourcesoperated in Texas. Similar to 30 TAC Chapter 115, the rule requirements for this chapter areorganized by source type under 30 TAC Chapter 117 and only apply to sources located in non-attainment areas specified in the rule. Those parts of the rule that are most commonly subject toupstream oil and gas facilities are found under Subchapter D, “Combustion Control at MinorSources in Ozone Non-attainment Areas.” For the Dallas–Fort Worth area, including TarrantCounty, NOx emissions from stationary internal combustion engines at any minor stationarysource of NOx (a source that emits less than 250 tpy) are limited, depending on engine type andconstruction date. Most engines at sites visited under Task 3 would be subject to a limit of 0.50 grams of NOx per hp per hour.
Compliance with the emission specification requirements under this rule cannot bedetermined using the data obtained at the time of the survey. Records of manufacturing dates and
8/6/2019 Air Quality Study Final
http://slidepdf.com/reader/full/air-quality-study-final 288/320
Fort Worth Natural Gas Air Quality Study Final Report July 13, 2011
6-11
the dates in which existing sources were last modified would be required to complete a fullcompliance assessment for any individual engine.
6.2.9 Federal Operating Permits
The Title V Federal Operating Permit Program is regulated under 30 TAC Chapter 122.Title V operating permits are required for any site that is a major source. A major source is a sitewhich that emits, or has the potential to emit, 100 tpy or more of any air pollutant. A site is alsoconsidered a major source if it emits or has the potential to emit, in the aggregate, 10 tpy or moreof any single hazardous air pollutant listed under the federal Clean Air Act or 25 tpy or more of any combination of hazardous air pollutants listed under the Act. One of the primary objectivesof the Title V operating program is to assimilate in one document all of the requirements towhich a facility is subject. The Title V permit serves as the key verification and documentationof a facility’s compliance with all applicable requirements of the Texas and federal Clean AirActs. Permit holders must annually certify compliance with the permit terms and conditions andsubmit semi-annual deviation reports in which they self-disclose known non-compliance
activities during the reporting period.
Five potential major sources were identified, including three compressor stations (SiteIDs PS-118, PS-119, PS-127), the gas processing plant (Site ID PS-159), and one well pad (SiteID 238). All of these facilities were determined to be major sources due to formaldehyde and/orCO emissions from their compressor engines. However, due to the conservative nature of theemissions estimation approach used for these engines (24-hour-per-day, 365-day-per-yearoperation of all the engines at the facility without controls), a full compliance evaluation wouldneed to be made to definitively conclude whether or not these facilities are major sources andsubject to the Title V Federal Operating Program.
6.3 City of Fort Worth Air Quality Rules
The city of Fort Worth’s Gas Well Drilling Ordinance (Ordinance No. 18449-02-2009)has one provision that requires air emissions control. Under Section 15-42 of this ordinance, tank batteries with a rolling annual aggregate emissions rate of 25 tpy or more of VOC must usevapor recovery equipment with a 95% recovery efficiency. Based on the results of the pointsource testing under Task 3, two compressor stations (Site IDs PS-118 and PS-119) and the gasprocessing plant (Site ID PS-159) have facility-wide VOC emissions greater than 25 tpy.However, the majority of the VOC emissions at these sites come from non-tank emission pointsand the natural-gas-fired compression engines, and none of these facilities have VOC emissionsfrom their storage tank batteries exceeding 25 tpy. Therefore, based on the results of Task 3, thisrule does not appear to apply to any of the tested facilities.
6.4 Regulatory Assessment Conclusions
A regulatory assessment was conducted based on the results of the point source testing todetermine if any facilities exceeded regulatory thresholds. For many of the rules potentiallyapplicable to oil and gas sources in Fort Worth, we were unable to make a definitivedetermination on whether the source was subject to the rule, and/or whether the source was in

8/6/2019 Air Quality Study Final
http://slidepdf.com/reader/full/air-quality-study-final 289/320
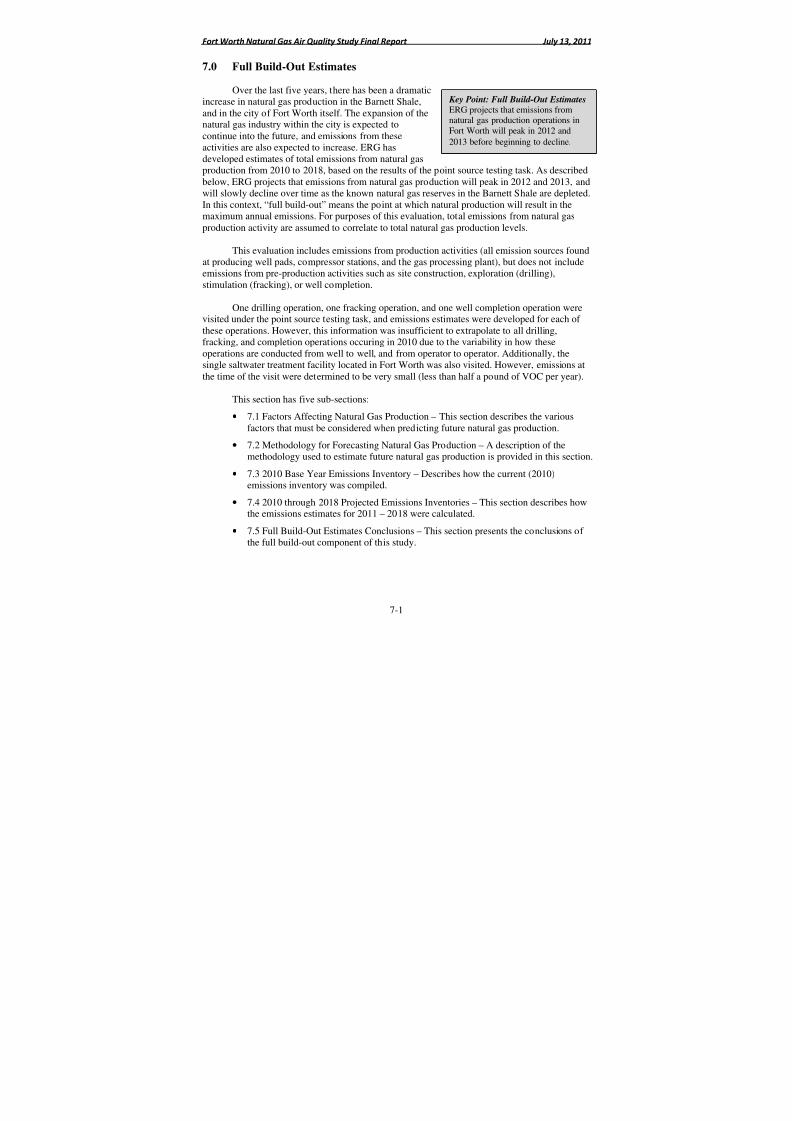
8/6/2019 Air Quality Study Final
http://slidepdf.com/reader/full/air-quality-study-final 290/320
Fort Worth Natural Gas Air Quality Study Final Report July 13, 2011
7-1
Key Point: Full Build-Out EstimatesERG projects that emissions fromnatural gas production operations inFort Worth will peak in 2012 and
2013 before beginning to decline.
7.0 Full Build-Out Estimates
Over the last five years, there has been a dramaticincrease in natural gas production in the Barnett Shale,and in the city of Fort Worth itself. The expansion of the
natural gas industry within the city is expected tocontinue into the future, and emissions from theseactivities are also expected to increase. ERG hasdeveloped estimates of total emissions from natural gasproduction from 2010 to 2018, based on the results of the point source testing task. As describedbelow, ERG projects that emissions from natural gas production will peak in 2012 and 2013, andwill slowly decline over time as the known natural gas reserves in the Barnett Shale are depleted.In this context, “full build-out” means the point at which natural production will result in themaximum annual emissions. For purposes of this evaluation, total emissions from natural gasproduction activity are assumed to correlate to total natural gas production levels.
This evaluation includes emissions from production activities (all emission sources foundat producing well pads, compressor stations, and the gas processing plant), but does not includeemissions from pre-production activities such as site construction, exploration (drilling),stimulation (fracking), or well completion.
One drilling operation, one fracking operation, and one well completion operation werevisited under the point source testing task, and emissions estimates were developed for each of these operations. However, this information was insufficient to extrapolate to all drilling,fracking, and completion operations occuring in 2010 due to the variability in how theseoperations are conducted from well to well, and from operator to operator. Additionally, thesingle saltwater treatment facility located in Fort Worth was also visited. However, emissions at
the time of the visit were determined to be very small (less than half a pound of VOC per year).
This section has five sub-sections:
• 7.1 Factors Affecting Natural Gas Production – This section describes the variousfactors that must be considered when predicting future natural gas production.
• 7.2 Methodology for Forecasting Natural Gas Production – A description of themethodology used to estimate future natural gas production is provided in this section.
• 7.3 2010 Base Year Emissions Inventory – Describes how the current (2010)emissions inventory was compiled.
• 7.4 2010 through 2018 Projected Emissions Inventories – This section describes howthe emissions estimates for 2011 – 2018 were calculated.
• 7.5 Full Build-Out Estimates Conclusions – This section presents the conclusions of the full build-out component of this study.
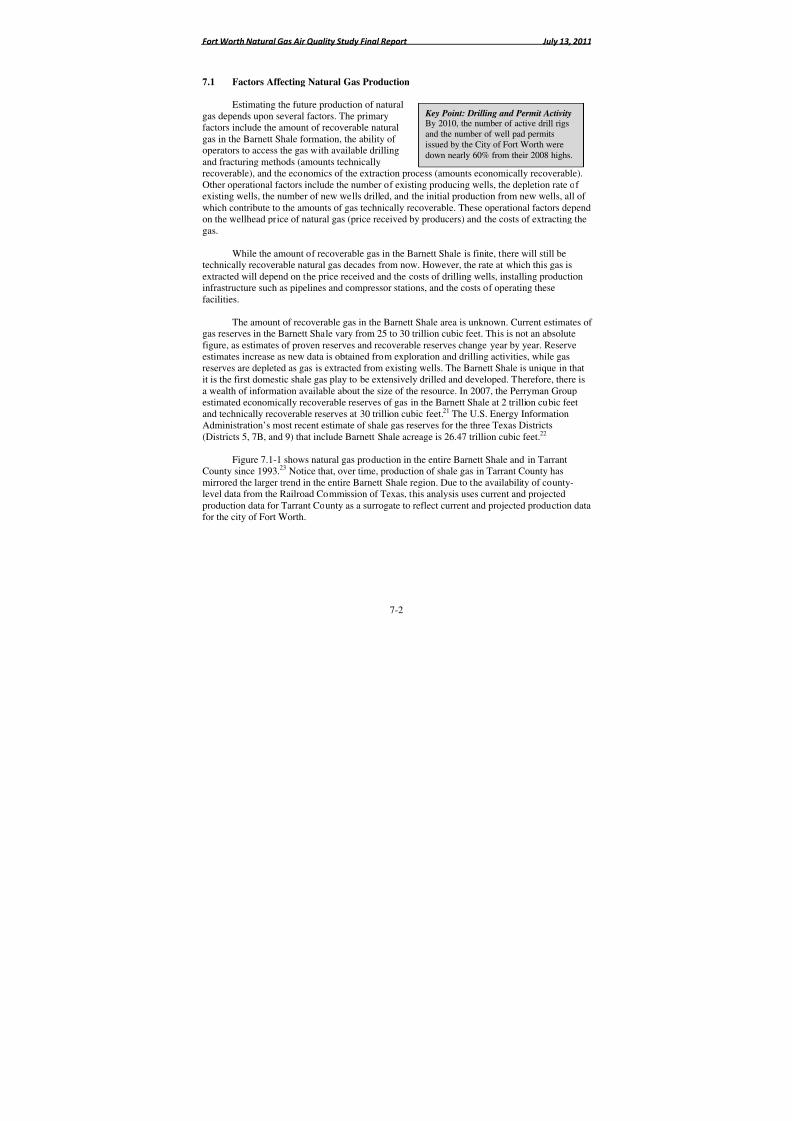
8/6/2019 Air Quality Study Final
http://slidepdf.com/reader/full/air-quality-study-final 291/320
Fort Worth Natural Gas Air Quality Study Final Report July 13, 2011
7-2
Key Point: Drilling and Permit Activity
By 2010, the number of active drill rigsand the number of well pad permitsissued by the City of Fort Worth weredown nearly 60% from their 2008 highs.
7.1 Factors Affecting Natural Gas Production
Estimating the future production of naturalgas depends upon several factors. The primary
factors include the amount of recoverable naturalgas in the Barnett Shale formation, the ability of operators to access the gas with available drillingand fracturing methods (amounts technicallyrecoverable), and the economics of the extraction process (amounts economically recoverable).Other operational factors include the number of existing producing wells, the depletion rate of existing wells, the number of new wells drilled, and the initial production from new wells, all of which contribute to the amounts of gas technically recoverable. These operational factors dependon the wellhead price of natural gas (price received by producers) and the costs of extracting thegas.
While the amount of recoverable gas in the Barnett Shale is finite, there will still betechnically recoverable natural gas decades from now. However, the rate at which this gas isextracted will depend on the price received and the costs of drilling wells, installing productioninfrastructure such as pipelines and compressor stations, and the costs of operating thesefacilities.
The amount of recoverable gas in the Barnett Shale area is unknown. Current estimates of gas reserves in the Barnett Shale vary from 25 to 30 trillion cubic feet. This is not an absolutefigure, as estimates of proven reserves and recoverable reserves change year by year. Reserveestimates increase as new data is obtained from exploration and drilling activities, while gasreserves are depleted as gas is extracted from existing wells. The Barnett Shale is unique in that
it is the first domestic shale gas play to be extensively drilled and developed. Therefore, there isa wealth of information available about the size of the resource. In 2007, the Perryman Groupestimated economically recoverable reserves of gas in the Barnett Shale at 2 trillion cubic feetand technically recoverable reserves at 30 trillion cubic feet.21 The U.S. Energy InformationAdministration’s most recent estimate of shale gas reserves for the three Texas Districts(Districts 5, 7B, and 9) that include Barnett Shale acreage is 26.47 trillion cubic feet.22
Figure 7.1-1 shows natural gas production in the entire Barnett Shale and in TarrantCounty since 1993.23 Notice that, over time, production of shale gas in Tarrant County hasmirrored the larger trend in the entire Barnett Shale region. Due to the availability of county-level data from the Railroad Commission of Texas, this analysis uses current and projected
production data for Tarrant County as a surrogate to reflect current and projected production datafor the city of Fort Worth.
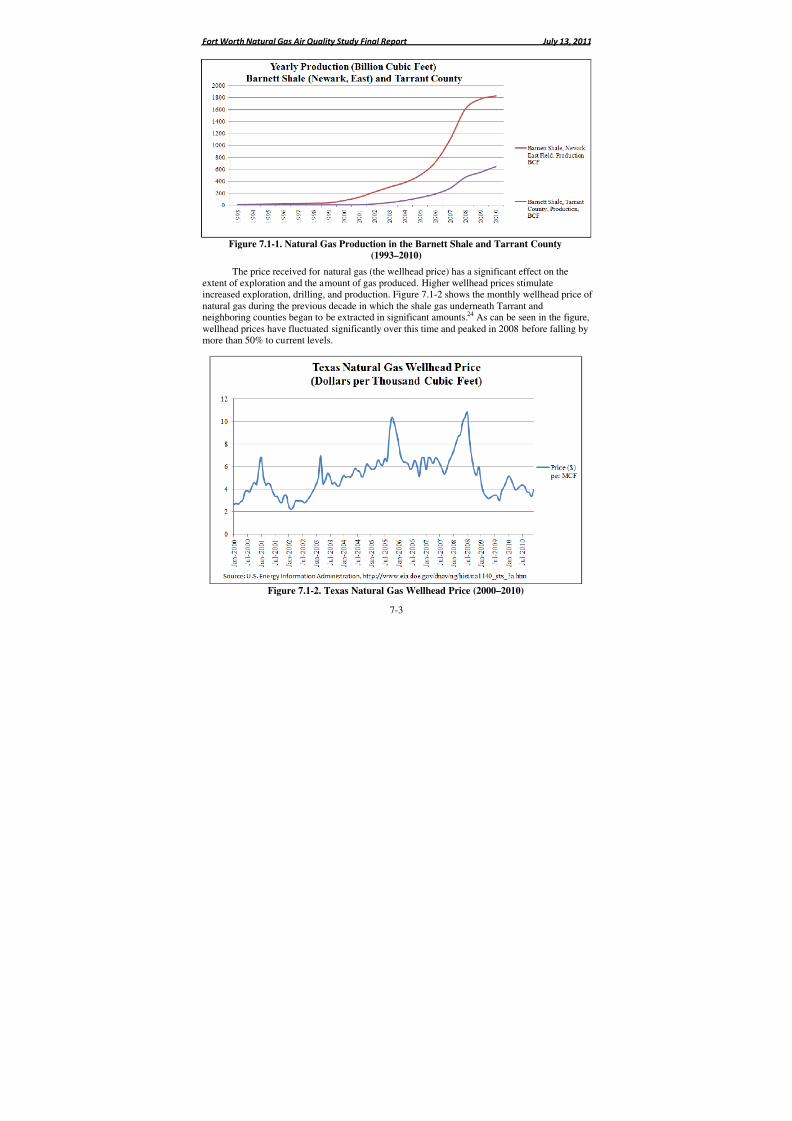
8/6/2019 Air Quality Study Final
http://slidepdf.com/reader/full/air-quality-study-final 292/320
Fort Worth Natural Gas Air Quality Study Final Report July 13, 2011
7-3
Figure 7.1-1. Natural Gas Production in the Barnett Shale and Tarrant County
(1993–2010)
The price received for natural gas (the wellhead price) has a significant effect on theextent of exploration and the amount of gas produced. Higher wellhead prices stimulateincreased exploration, drilling, and production. Figure 7.1-2 shows the monthly wellhead price of natural gas during the previous decade in which the shale gas underneath Tarrant andneighboring counties began to be extracted in significant amounts.24 As can be seen in the figure,wellhead prices have fluctuated significantly over this time and peaked in 2008 before falling bymore than 50% to current levels.
Figure 7.1-2. Texas Natural Gas Wellhead Price (2000–2010)
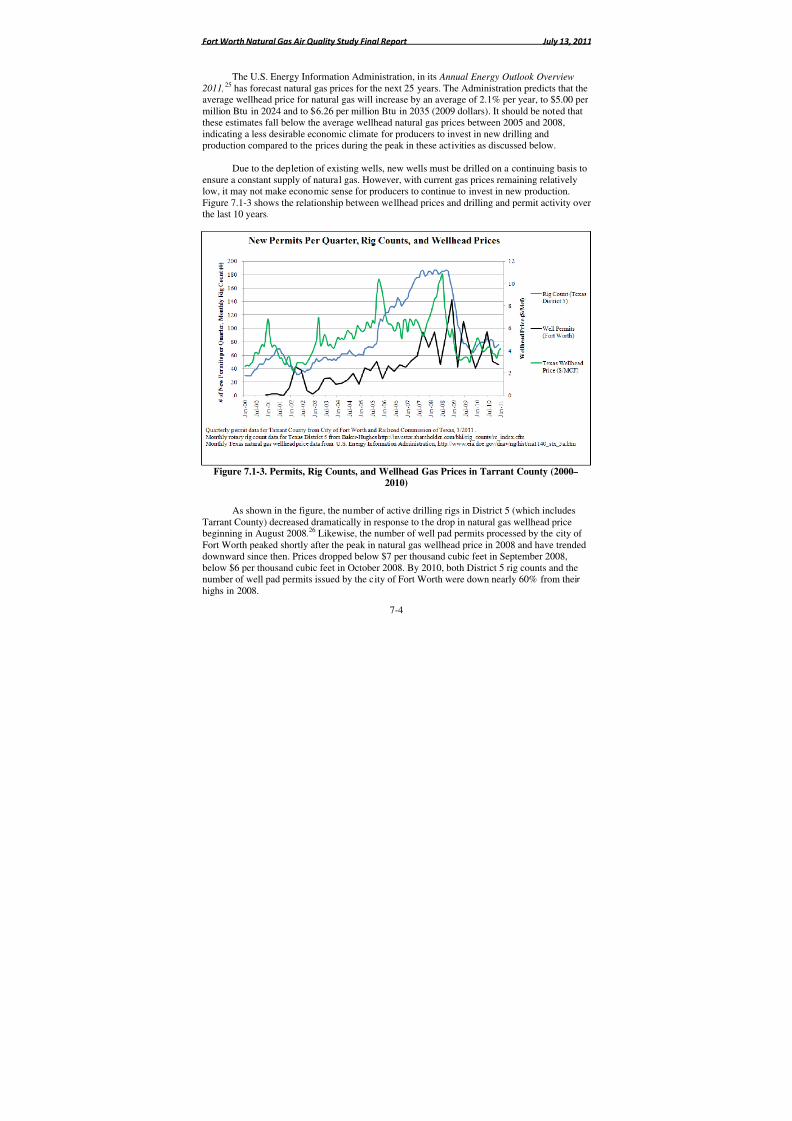
8/6/2019 Air Quality Study Final
http://slidepdf.com/reader/full/air-quality-study-final 293/320
Fort Worth Natural Gas Air Quality Study Final Report July 13, 2011
7-4
The U.S. Energy Information Administration, in its Annual Energy Outlook Overview
2011,25 has forecast natural gas prices for the next 25 years. The Administration predicts that the
average wellhead price for natural gas will increase by an average of 2.1% per year, to $5.00 permillion Btu in 2024 and to $6.26 per million Btu in 2035 (2009 dollars). It should be noted that
these estimates fall below the average wellhead natural gas prices between 2005 and 2008,indicating a less desirable economic climate for producers to invest in new drilling andproduction compared to the prices during the peak in these activities as discussed below.
Due to the depletion of existing wells, new wells must be drilled on a continuing basis toensure a constant supply of natural gas. However, with current gas prices remaining relativelylow, it may not make economic sense for producers to continue to invest in new production.Figure 7.1-3 shows the relationship between wellhead prices and drilling and permit activity overthe last 10 years.
Figure 7.1-3. Permits, Rig Counts, and Wellhead Gas Prices in Tarrant County (2000–2010)
As shown in the figure, the number of active drilling rigs in District 5 (which includesTarrant County) decreased dramatically in response to the drop in natural gas wellhead pricebeginning in August 2008.26 Likewise, the number of well pad permits processed by the city of Fort Worth peaked shortly after the peak in natural gas wellhead price in 2008 and have trendeddownward since then. Prices dropped below $7 per thousand cubic feet in September 2008,below $6 per thousand cubic feet in October 2008. By 2010, both District 5 rig counts and thenumber of well pad permits issued by the city of Fort Worth were down nearly 60% from theirhighs in 2008.
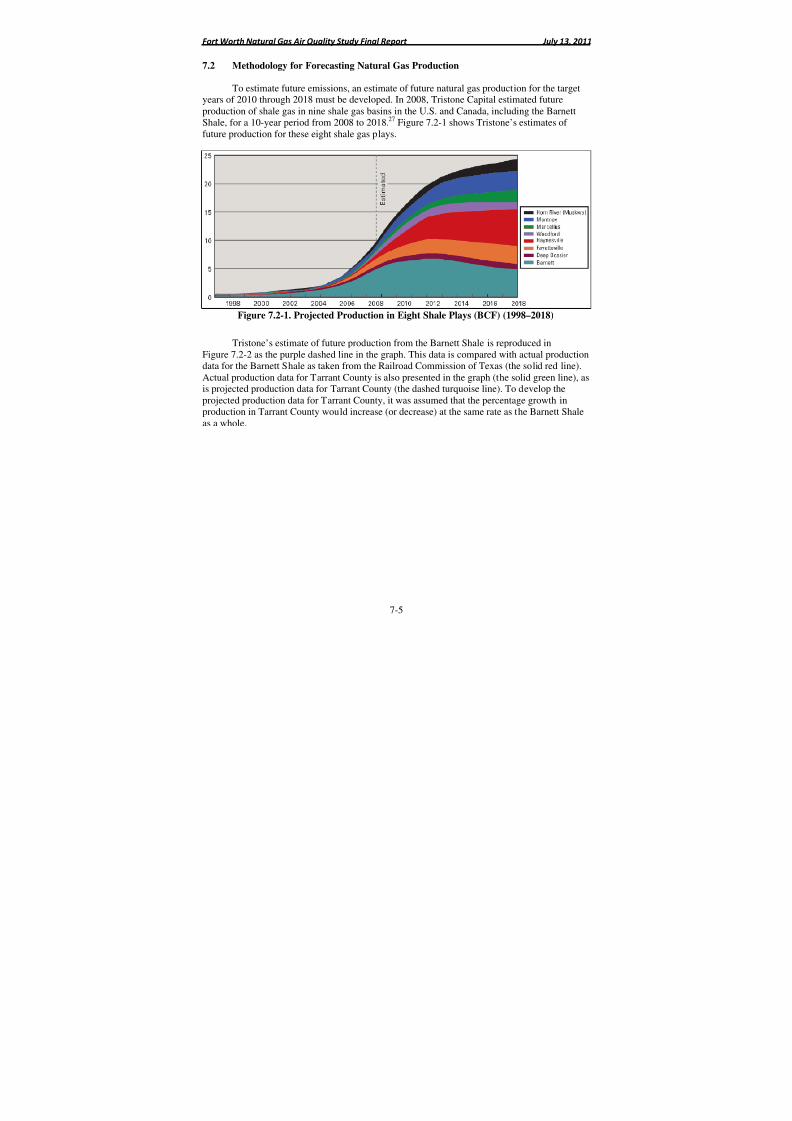
8/6/2019 Air Quality Study Final
http://slidepdf.com/reader/full/air-quality-study-final 294/320
Fort Worth Natural Gas Air Quality Study Final Report July 13, 2011
7-5
7.2 Methodology for Forecasting Natural Gas Production
To estimate future emissions, an estimate of future natural gas production for the targetyears of 2010 through 2018 must be developed. In 2008, Tristone Capital estimated futureproduction of shale gas in nine shale gas basins in the U.S. and Canada, including the Barnett
Shale, for a 10-year period from 2008 to 2018.
27
Figure 7.2-1 shows Tristone’s estimates of future production for these eight shale gas plays.
Figure 7.2-1. Projected Production in Eight Shale Plays (BCF) (1998–2018)
Tristone’s estimate of future production from the Barnett Shale is reproduced inFigure 7.2-2 as the purple dashed line in the graph. This data is compared with actual productiondata for the Barnett Shale as taken from the Railroad Commission of Texas (the solid red line).
Actual production data for Tarrant County is also presented in the graph (the solid green line), asis projected production data for Tarrant County (the dashed turquoise line). To develop theprojected production data for Tarrant County, it was assumed that the percentage growth inproduction in Tarrant County would increase (or decrease) at the same rate as the Barnett Shaleas a whole.
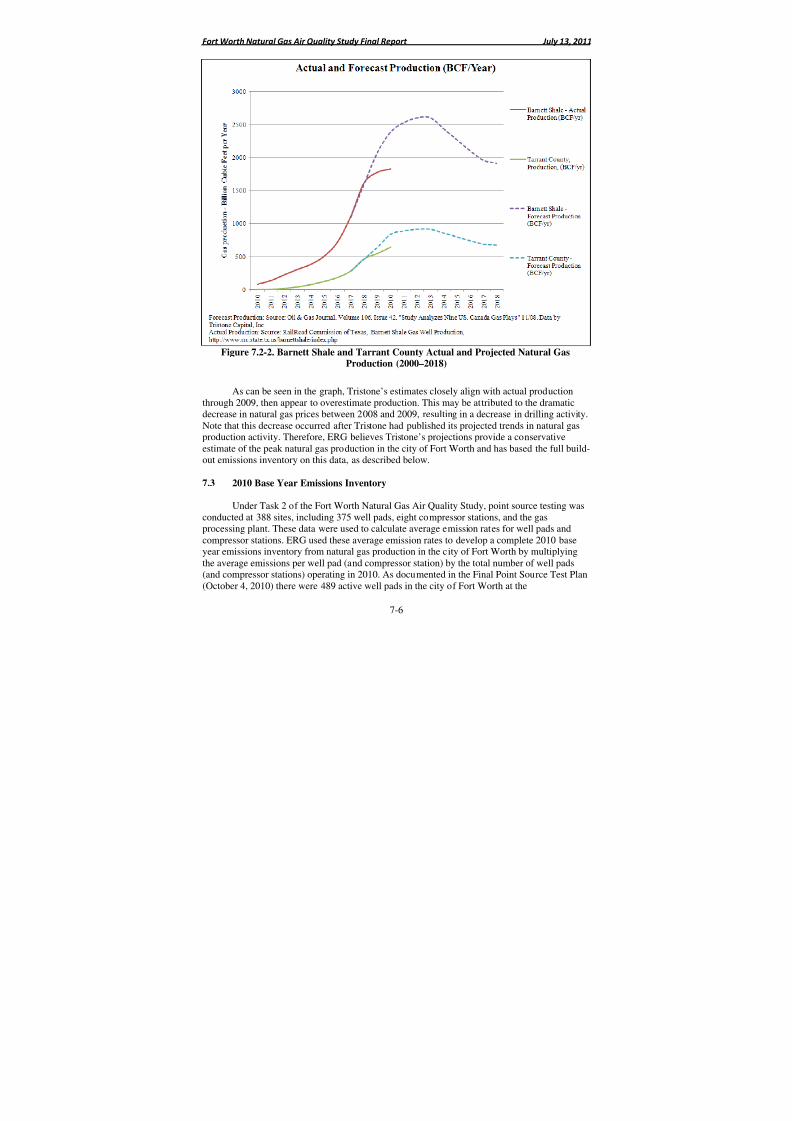
8/6/2019 Air Quality Study Final
http://slidepdf.com/reader/full/air-quality-study-final 295/320
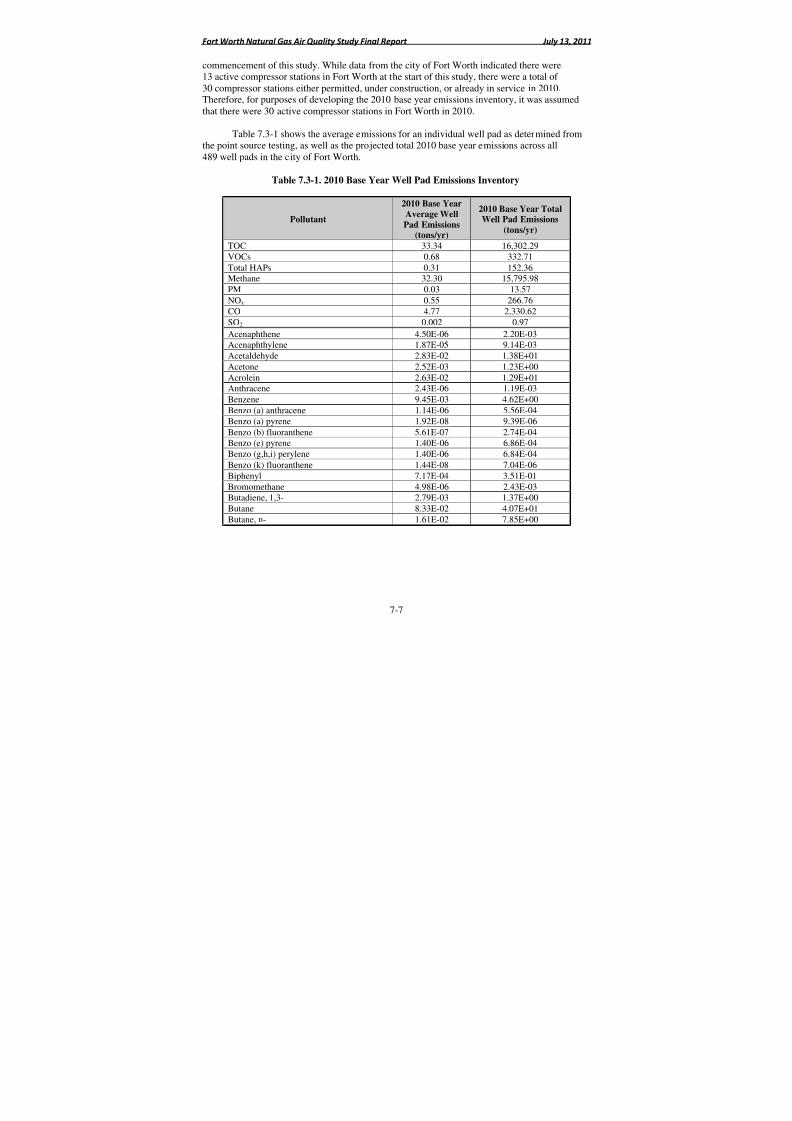
8/6/2019 Air Quality Study Final
http://slidepdf.com/reader/full/air-quality-study-final 296/320
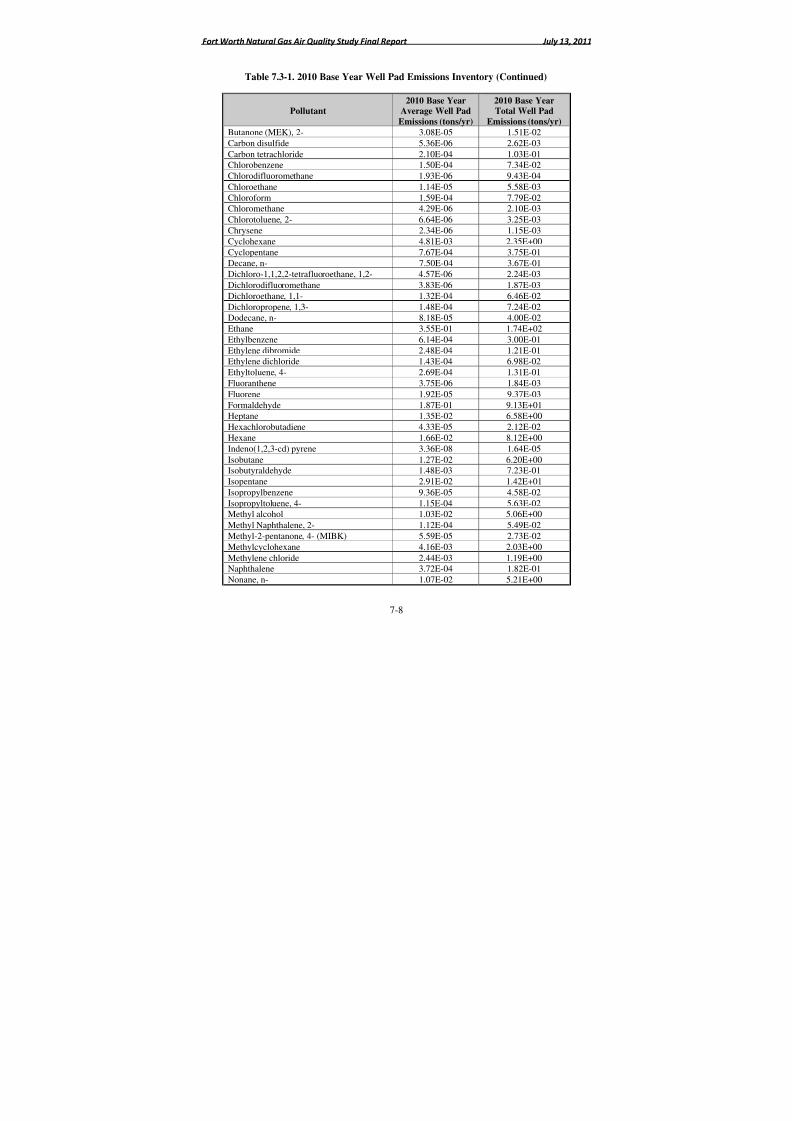
8/6/2019 Air Quality Study Final
http://slidepdf.com/reader/full/air-quality-study-final 297/320
Fort Worth Natural Gas Air Quality Study Final Report July 13, 2011
7-8
Table 7.3-1. 2010 Base Year Well Pad Emissions Inventory (Continued)
Pollutant2010 Base Year
Average Well Pad
Emissions (tons/yr)
2010 Base YearTotal Well Pad
Emissions (tons/yr)
Butanone (MEK), 2- 3.08E-05 1.51E-02
Carbon disulfide 5.36E-06 2.62E-03
Carbon tetrachloride 2.10E-04 1.03E-01Chlorobenzene 1.50E-04 7.34E-02
Chlorodifluoromethane 1.93E-06 9.43E-04
Chloroethane 1.14E-05 5.58E-03
Chloroform 1.59E-04 7.79E-02Chloromethane 4.29E-06 2.10E-03
Chlorotoluene, 2- 6.64E-06 3.25E-03
Chrysene 2.34E-06 1.15E-03
Cyclohexane 4.81E-03 2.35E+00
Cyclopentane 7.67E-04 3.75E-01Decane, n- 7.50E-04 3.67E-01
Dichloro-1,1,2,2-tetrafluoroethane, 1,2- 4.57E-06 2.24E-03
Dichlorodifluoromethane 3.83E-06 1.87E-03
Dichloroethane, 1,1- 1.32E-04 6.46E-02
Dichloropropene, 1,3- 1.48E-04 7.24E-02Dodecane, n- 8.18E-05 4.00E-02
Ethane 3.55E-01 1.74E+02
Ethylbenzene 6.14E-04 3.00E-01
Ethylene dibromide 2.48E-04 1.21E-01Ethylene dichloride 1.43E-04 6.98E-02
Ethyltoluene, 4- 2.69E-04 1.31E-01
Fluoranthene 3.75E-06 1.84E-03Fluorene 1.92E-05 9.37E-03
Formaldehyde 1.87E-01 9.13E+01Heptane 1.35E-02 6.58E+00
Hexachlorobutadiene 4.33E-05 2.12E-02
Hexane 1.66E-02 8.12E+00
Indeno(1,2,3-cd) pyrene 3.36E-08 1.64E-05
Isobutane 1.27E-02 6.20E+00Isobutyraldehyde 1.48E-03 7.23E-01
Isopentane 2.91E-02 1.42E+01
Isopropylbenzene 9.36E-05 4.58E-02
Isopropyltoluene, 4- 1.15E-04 5.63E-02Methyl alcohol 1.03E-02 5.06E+00
Methyl Naphthalene, 2- 1.12E-04 5.49E-02
Methyl-2-pentanone, 4- (MIBK) 5.59E-05 2.73E-02
Methylcyclohexane 4.16E-03 2.03E+00
Methylene chloride 2.44E-03 1.19E+00Naphthalene 3.72E-04 1.82E-01
Nonane, n- 1.07E-02 5.21E+00
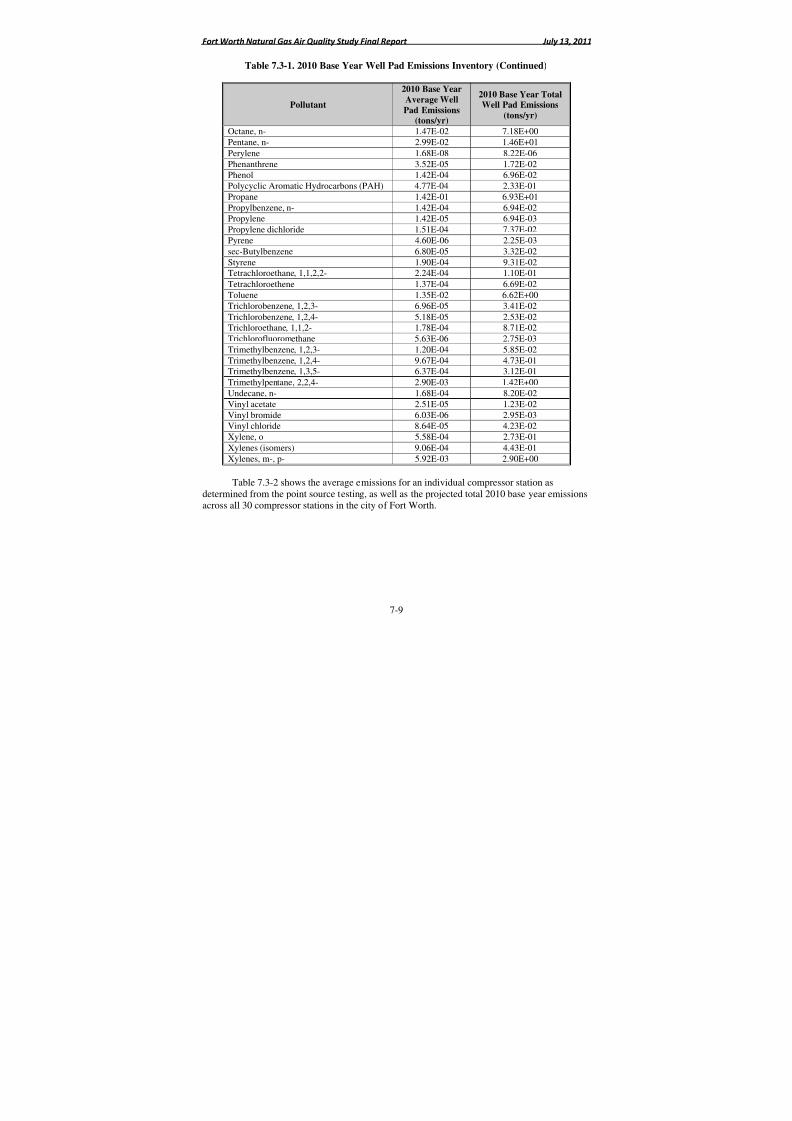
8/6/2019 Air Quality Study Final
http://slidepdf.com/reader/full/air-quality-study-final 298/320
Fort Worth Natural Gas Air Quality Study Final Report July 13, 2011
7-9
Table 7.3-1. 2010 Base Year Well Pad Emissions Inventory (Continued)
Pollutant
2010 Base Year
Average Well
Pad Emissions(tons/yr)
2010 Base Year TotalWell Pad Emissions
(tons/yr)
Octane, n- 1.47E-02 7.18E+00
Pentane, n- 2.99E-02 1.46E+01
Perylene 1.68E-08 8.22E-06
Phenanthrene 3.52E-05 1.72E-02Phenol 1.42E-04 6.96E-02
Polycyclic Aromatic Hydrocarbons (PAH) 4.77E-04 2.33E-01
Propane 1.42E-01 6.93E+01
Propylbenzene, n- 1.42E-04 6.94E-02Propylene 1.42E-05 6.94E-03
Propylene dichloride 1.51E-04 7.37E-02
Pyrene 4.60E-06 2.25E-03
sec-Butylbenzene 6.80E-05 3.32E-02Styrene 1.90E-04 9.31E-02Tetrachloroethane, 1,1,2,2- 2.24E-04 1.10E-01
Tetrachloroethene 1.37E-04 6.69E-02
Toluene 1.35E-02 6.62E+00
Trichlorobenzene, 1,2,3- 6.96E-05 3.41E-02
Trichlorobenzene, 1,2,4- 5.18E-05 2.53E-02Trichloroethane, 1,1,2- 1.78E-04 8.71E-02
Trichlorofluoromethane 5.63E-06 2.75E-03
Trimethylbenzene, 1,2,3- 1.20E-04 5.85E-02
Trimethylbenzene, 1,2,4- 9.67E-04 4.73E-01Trimethylbenzene, 1,3,5- 6.37E-04 3.12E-01
Trimethylpentane, 2,2,4- 2.90E-03 1.42E+00Undecane, n- 1.68E-04 8.20E-02
Vinyl acetate 2.51E-05 1.23E-02
Vinyl bromide 6.03E-06 2.95E-03Vinyl chloride 8.64E-05 4.23E-02
Xylene, o 5.58E-04 2.73E-01
Xylenes (isomers) 9.06E-04 4.43E-01
Xylenes, m-, p- 5.92E-03 2.90E+00
Table 7.3-2 shows the average emissions for an individual compressor station asdetermined from the point source testing, as well as the projected total 2010 base year emissions
across all 30 compressor stations in the city of Fort Worth.
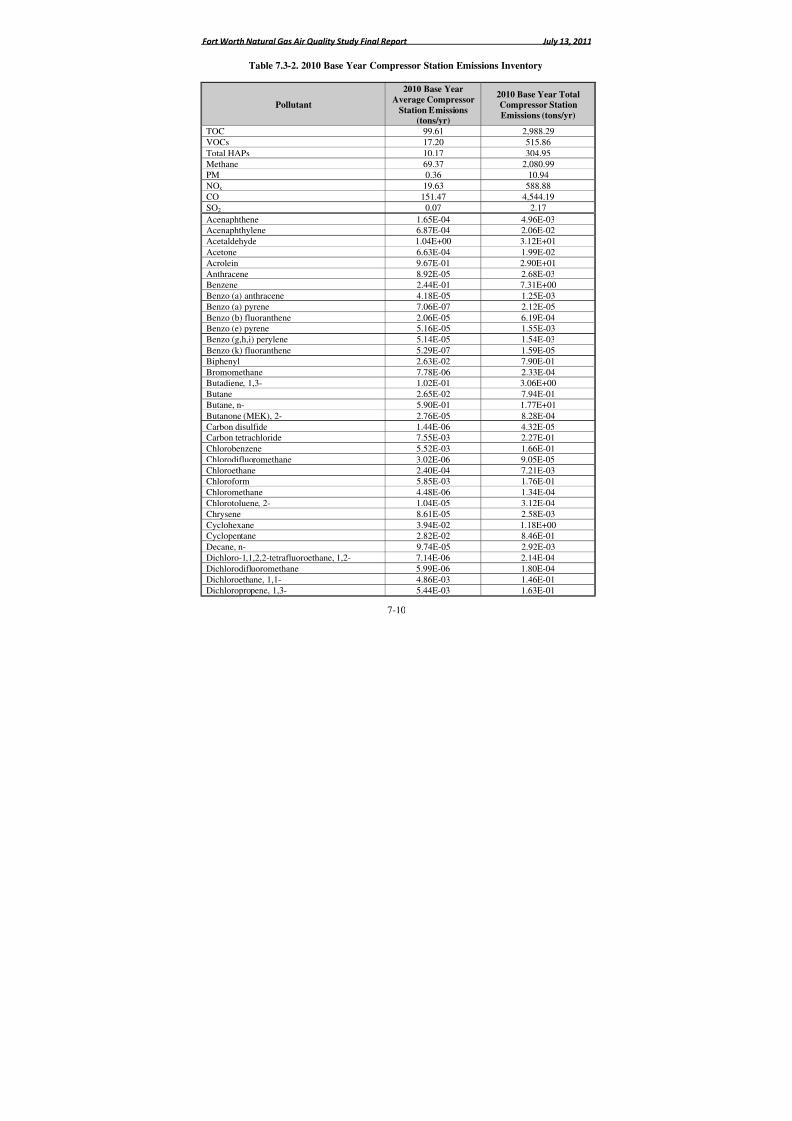
8/6/2019 Air Quality Study Final
http://slidepdf.com/reader/full/air-quality-study-final 299/320
Fort Worth Natural Gas Air Quality Study Final Report July 13, 2011
7-10
Table 7.3-2. 2010 Base Year Compressor Station Emissions Inventory
Pollutant
2010 Base Year
Average Compressor
Station Emissions(tons/yr)
2010 Base Year TotalCompressor Station
Emissions (tons/yr)
TOC 99.61 2,988.29
VOCs 17.20 515.86
Total HAPs 10.17 304.95
Methane 69.37 2,080.99PM 0.36 10.94
NOx 19.63 588.88
CO 151.47 4,544.19
SO2 0.07 2.17
Acenaphthene 1.65E-04 4.96E-03Acenaphthylene 6.87E-04 2.06E-02
Acetaldehyde 1.04E+00 3.12E+01
Acetone 6.63E-04 1.99E-02Acrolein 9.67E-01 2.90E+01
Anthracene 8.92E-05 2.68E-03Benzene 2.44E-01 7.31E+00
Benzo (a) anthracene 4.18E-05 1.25E-03
Benzo (a) pyrene 7.06E-07 2.12E-05
Benzo (b) fluoranthene 2.06E-05 6.19E-04Benzo (e) pyrene 5.16E-05 1.55E-03
Benzo (g,h,i) perylene 5.14E-05 1.54E-03
Benzo (k) fluoranthene 5.29E-07 1.59E-05
Biphenyl 2.63E-02 7.90E-01
Bromomethane 7.78E-06 2.33E-04
Butadiene, 1,3- 1.02E-01 3.06E+00Butane 2.65E-02 7.94E-01
Butane, n- 5.90E-01 1.77E+01
Butanone (MEK), 2- 2.76E-05 8.28E-04
Carbon disulfide 1.44E-06 4.32E-05Carbon tetrachloride 7.55E-03 2.27E-01
Chlorobenzene 5.52E-03 1.66E-01
Chlorodifluoromethane 3.02E-06 9.05E-05
Chloroethane 2.40E-04 7.21E-03Chloroform 5.85E-03 1.76E-01
Chloromethane 4.48E-06 1.34E-04
Chlorotoluene, 2- 1.04E-05 3.12E-04Chrysene 8.61E-05 2.58E-03
Cyclohexane 3.94E-02 1.18E+00Cyclopentane 2.82E-02 8.46E-01
Decane, n- 9.74E-05 2.92E-03
Dichloro-1,1,2,2-tetrafluoroethane, 1,2- 7.14E-06 2.14E-04
Dichlorodifluoromethane 5.99E-06 1.80E-04
Dichloroethane, 1,1- 4.86E-03 1.46E-01Dichloropropene, 1,3- 5.44E-03 1.63E-01
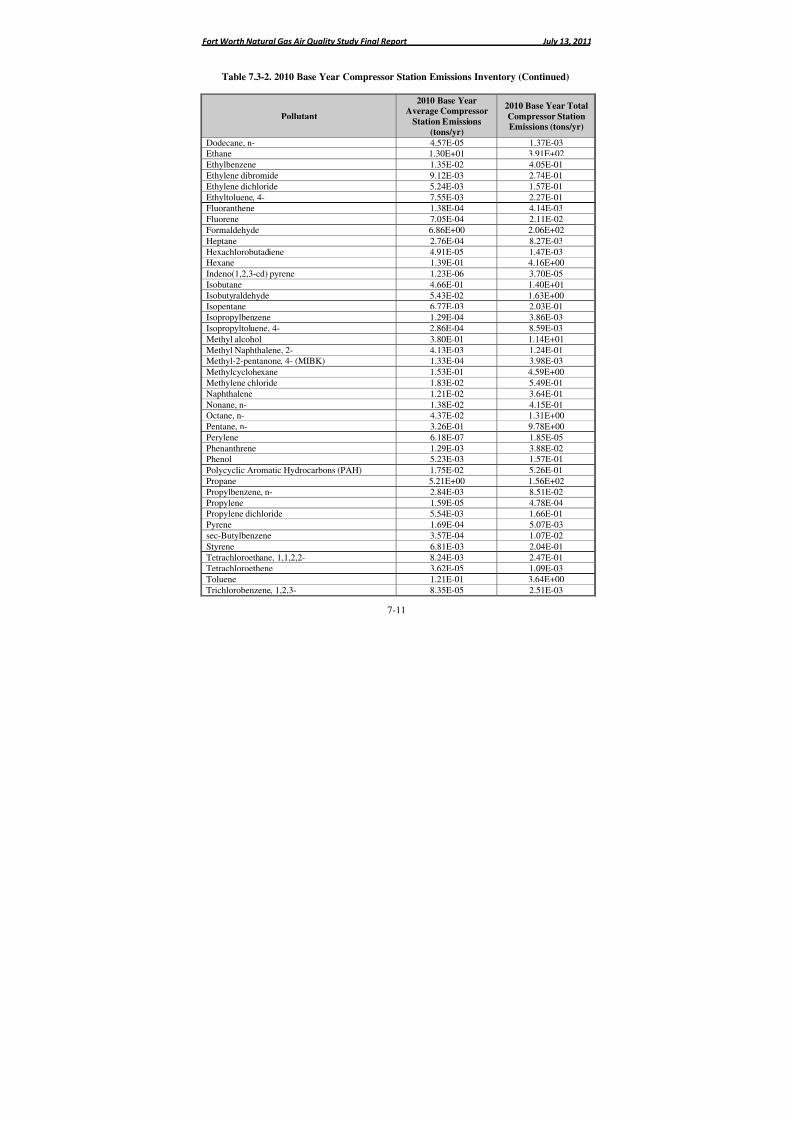
8/6/2019 Air Quality Study Final
http://slidepdf.com/reader/full/air-quality-study-final 300/320
Fort Worth Natural Gas Air Quality Study Final Report July 13, 2011
7-11
Table 7.3-2. 2010 Base Year Compressor Station Emissions Inventory (Continued)
Pollutant
2010 Base YearAverage Compressor
Station Emissions
(tons/yr)
2010 Base Year Total
Compressor Station
Emissions (tons/yr)
Dodecane, n- 4.57E-05 1.37E-03Ethane 1.30E+01 3.91E+02
Ethylbenzene 1.35E-02 4.05E-01
Ethylene dibromide 9.12E-03 2.74E-01
Ethylene dichloride 5.24E-03 1.57E-01
Ethyltoluene, 4- 7.55E-03 2.27E-01Fluoranthene 1.38E-04 4.14E-03
Fluorene 7.05E-04 2.11E-02
Formaldehyde 6.86E+00 2.06E+02
Heptane 2.76E-04 8.27E-03
Hexachlorobutadiene 4.91E-05 1.47E-03Hexane 1.39E-01 4.16E+00
Indeno(1,2,3-cd) pyrene 1.23E-06 3.70E-05
Isobutane 4.66E-01 1.40E+01
Isobutyraldehyde 5.43E-02 1.63E+00Isopentane 6.77E-03 2.03E-01
Isopropylbenzene 1.29E-04 3.86E-03
Isopropyltoluene, 4- 2.86E-04 8.59E-03
Methyl alcohol 3.80E-01 1.14E+01
Methyl Naphthalene, 2- 4.13E-03 1.24E-01Methyl-2-pentanone, 4- (MIBK) 1.33E-04 3.98E-03
Methylcyclohexane 1.53E-01 4.59E+00
Methylene chloride 1.83E-02 5.49E-01Naphthalene 1.21E-02 3.64E-01
Nonane, n- 1.38E-02 4.15E-01Octane, n- 4.37E-02 1.31E+00
Pentane, n- 3.26E-01 9.78E+00
Perylene 6.18E-07 1.85E-05
Phenanthrene 1.29E-03 3.88E-02Phenol 5.23E-03 1.57E-01
Polycyclic Aromatic Hydrocarbons (PAH) 1.75E-02 5.26E-01
Propane 5.21E+00 1.56E+02
Propylbenzene, n- 2.84E-03 8.51E-02
Propylene 1.59E-05 4.78E-04Propylene dichloride 5.54E-03 1.66E-01
Pyrene 1.69E-04 5.07E-03
sec-Butylbenzene 3.57E-04 1.07E-02
Styrene 6.81E-03 2.04E-01
Tetrachloroethane, 1,1,2,2- 8.24E-03 2.47E-01Tetrachloroethene 3.62E-05 1.09E-03
Toluene 1.21E-01 3.64E+00
Trichlorobenzene, 1,2,3- 8.35E-05 2.51E-03

8/6/2019 Air Quality Study Final
http://slidepdf.com/reader/full/air-quality-study-final 301/320
Fort Worth Natural Gas Air Quality Study Final Report July 13, 2011
7-12
Table 7.3-2. 2010 Base Year Compressor Station Emissions Inventory (Continued)
Pollutant
2010 Base Year
Average Compressor
Station Emissions(tons/yr)
2010 Base Year TotalCompressor Station
Emissions (tons/yr)
Trichlorobenzene, 1,2,4- 5.63E-05 1.69E-03
Trichloroethane, 1,1,2- 6.55E-03 1.96E-01
Trichlorofluoromethane 8.81E-06 2.64E-04
Trimethylbenzene, 1,2,3- 4.40E-03 1.32E-01Trimethylbenzene, 1,2,4- 4.66E-02 1.40E+00
Trimethylbenzene, 1,3,5- 1.25E-02 3.75E-01
Trimethylpentane, 2,2,4- 1.05E-01 3.15E+00
Undecane, n- 4.54E-05 1.36E-03Vinyl acetate 7.23E-06 2.17E-04
Vinyl bromide 9.43E-06 2.83E-04
Vinyl chloride 3.07E-03 9.22E-02
Xylene, o 1.89E-04 5.68E-03Xylenes (isomers) 3.33E-02 9.99E-01Xylenes, m-, p- 3.30E-04 9.89E-03
Table 7.3-3 shows the cumulative 2010 base year emissions from all compressor stations,well pads, and the gas processing plant in the city of Fort Worth, combined.
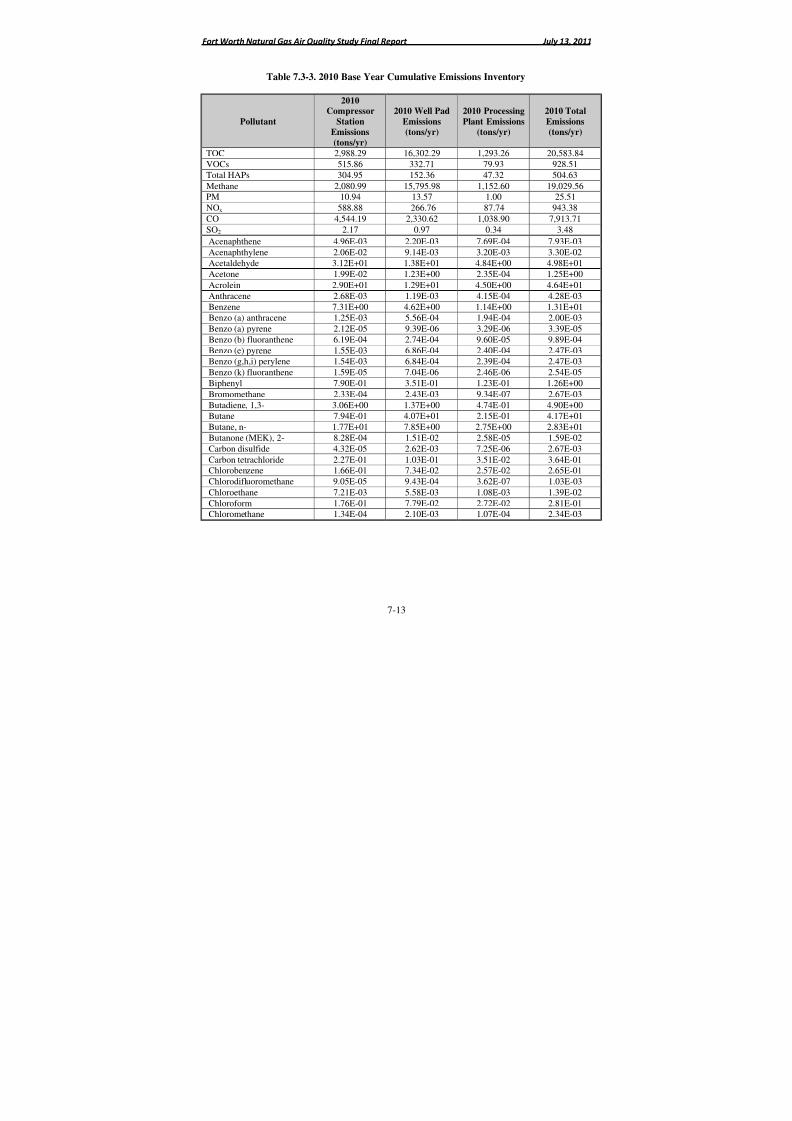
8/6/2019 Air Quality Study Final
http://slidepdf.com/reader/full/air-quality-study-final 302/320
Fort Worth Natural Gas Air Quality Study Final Report July 13, 2011
7-13
Table 7.3-3. 2010 Base Year Cumulative Emissions Inventory
Pollutant
2010Compressor
Station
Emissions
(tons/yr)
2010 Well Pad
Emissions
(tons/yr)
2010 Processing
Plant Emissions
(tons/yr)
2010 Total
Emissions
(tons/yr)
TOC 2,988.29 16,302.29 1,293.26 20,583.84
VOCs 515.86 332.71 79.93 928.51
Total HAPs 304.95 152.36 47.32 504.63
Methane 2,080.99 15,795.98 1,152.60 19,029.56PM 10.94 13.57 1.00 25.51
NOx 588.88 266.76 87.74 943.38
CO 4,544.19 2,330.62 1,038.90 7,913.71
SO2 2.17 0.97 0.34 3.48
Acenaphthene 4.96E-03 2.20E-03 7.69E-04 7.93E-03
Acenaphthylene 2.06E-02 9.14E-03 3.20E-03 3.30E-02Acetaldehyde 3.12E+01 1.38E+01 4.84E+00 4.98E+01
Acetone 1.99E-02 1.23E+00 2.35E-04 1.25E+00
Acrolein 2.90E+01 1.29E+01 4.50E+00 4.64E+01
Anthracene 2.68E-03 1.19E-03 4.15E-04 4.28E-03
Benzene 7.31E+00 4.62E+00 1.14E+00 1.31E+01Benzo (a) anthracene 1.25E-03 5.56E-04 1.94E-04 2.00E-03
Benzo (a) pyrene 2.12E-05 9.39E-06 3.29E-06 3.39E-05
Benzo (b) fluoranthene 6.19E-04 2.74E-04 9.60E-05 9.89E-04
Benzo (e) pyrene 1.55E-03 6.86E-04 2.40E-04 2.47E-03Benzo (g,h,i) perylene 1.54E-03 6.84E-04 2.39E-04 2.47E-03
Benzo (k) fluoranthene 1.59E-05 7.04E-06 2.46E-06 2.54E-05
Biphenyl 7.90E-01 3.51E-01 1.23E-01 1.26E+00Bromomethane 2.33E-04 2.43E-03 9.34E-07 2.67E-03
Butadiene, 1,3- 3.06E+00 1.37E+00 4.74E-01 4.90E+00Butane 7.94E-01 4.07E+01 2.15E-01 4.17E+01
Butane, n- 1.77E+01 7.85E+00 2.75E+00 2.83E+01
Butanone (MEK), 2- 8.28E-04 1.51E-02 2.58E-05 1.59E-02
Carbon disulfide 4.32E-05 2.62E-03 7.25E-06 2.67E-03
Carbon tetrachloride 2.27E-01 1.03E-01 3.51E-02 3.64E-01Chlorobenzene 1.66E-01 7.34E-02 2.57E-02 2.65E-01
Chlorodifluoromethane 9.05E-05 9.43E-04 3.62E-07 1.03E-03
Chloroethane 7.21E-03 5.58E-03 1.08E-03 1.39E-02
Chloroform 1.76E-01 7.79E-02 2.72E-02 2.81E-01Chloromethane 1.34E-04 2.10E-03 1.07E-04 2.34E-03
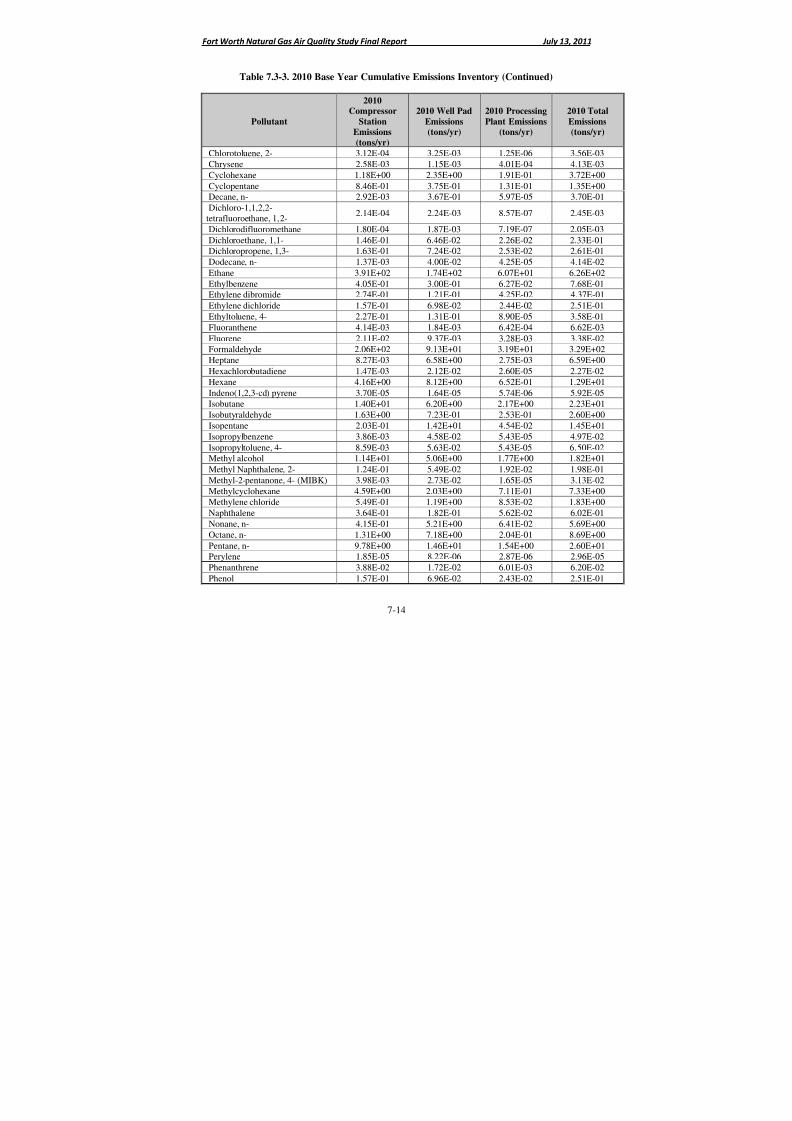
8/6/2019 Air Quality Study Final
http://slidepdf.com/reader/full/air-quality-study-final 303/320
Fort Worth Natural Gas Air Quality Study Final Report July 13, 2011
7-14
Table 7.3-3. 2010 Base Year Cumulative Emissions Inventory (Continued)
Pollutant
2010Compressor
Station
Emissions
(tons/yr)
2010 Well Pad
Emissions
(tons/yr)
2010 Processing
Plant Emissions
(tons/yr)
2010 Total
Emissions
(tons/yr)
Chlorotoluene, 2- 3.12E-04 3.25E-03 1.25E-06 3.56E-03
Chrysene 2.58E-03 1.15E-03 4.01E-04 4.13E-03
Cyclohexane 1.18E+00 2.35E+00 1.91E-01 3.72E+00
Cyclopentane 8.46E-01 3.75E-01 1.31E-01 1.35E+00Decane, n- 2.92E-03 3.67E-01 5.97E-05 3.70E-01
Dichloro-1,1,2,2-tetrafluoroethane, 1,2-
2.14E-04 2.24E-03 8.57E-07 2.45E-03
Dichlorodifluoromethane 1.80E-04 1.87E-03 7.19E-07 2.05E-03
Dichloroethane, 1,1- 1.46E-01 6.46E-02 2.26E-02 2.33E-01
Dichloropropene, 1,3- 1.63E-01 7.24E-02 2.53E-02 2.61E-01Dodecane, n- 1.37E-03 4.00E-02 4.25E-05 4.14E-02
Ethane 3.91E+02 1.74E+02 6.07E+01 6.26E+02
Ethylbenzene 4.05E-01 3.00E-01 6.27E-02 7.68E-01Ethylene dibromide 2.74E-01 1.21E-01 4.25E-02 4.37E-01
Ethylene dichloride 1.57E-01 6.98E-02 2.44E-02 2.51E-01
Ethyltoluene, 4- 2.27E-01 1.31E-01 8.90E-05 3.58E-01
Fluoranthene 4.14E-03 1.84E-03 6.42E-04 6.62E-03
Fluorene 2.11E-02 9.37E-03 3.28E-03 3.38E-02Formaldehyde 2.06E+02 9.13E+01 3.19E+01 3.29E+02
Heptane 8.27E-03 6.58E+00 2.75E-03 6.59E+00
Hexachlorobutadiene 1.47E-03 2.12E-02 2.60E-05 2.27E-02
Hexane 4.16E+00 8.12E+00 6.52E-01 1.29E+01Indeno(1,2,3-cd) pyrene 3.70E-05 1.64E-05 5.74E-06 5.92E-05Isobutane 1.40E+01 6.20E+00 2.17E+00 2.23E+01
Isobutyraldehyde 1.63E+00 7.23E-01 2.53E-01 2.60E+00
Isopentane 2.03E-01 1.42E+01 4.54E-02 1.45E+01
Isopropylbenzene 3.86E-03 4.58E-02 5.43E-05 4.97E-02
Isopropyltoluene, 4- 8.59E-03 5.63E-02 5.43E-05 6.50E-02Methyl alcohol 1.14E+01 5.06E+00 1.77E+00 1.82E+01
Methyl Naphthalene, 2- 1.24E-01 5.49E-02 1.92E-02 1.98E-01
Methyl-2-pentanone, 4- (MIBK) 3.98E-03 2.73E-02 1.65E-05 3.13E-02
Methylcyclohexane 4.59E+00 2.03E+00 7.11E-01 7.33E+00Methylene chloride 5.49E-01 1.19E+00 8.53E-02 1.83E+00
Naphthalene 3.64E-01 1.82E-01 5.62E-02 6.02E-01
Nonane, n- 4.15E-01 5.21E+00 6.41E-02 5.69E+00
Octane, n- 1.31E+00 7.18E+00 2.04E-01 8.69E+00
Pentane, n- 9.78E+00 1.46E+01 1.54E+00 2.60E+01Perylene 1.85E-05 8.22E-06 2.87E-06 2.96E-05
Phenanthrene 3.88E-02 1.72E-02 6.01E-03 6.20E-02
Phenol 1.57E-01 6.96E-02 2.43E-02 2.51E-01
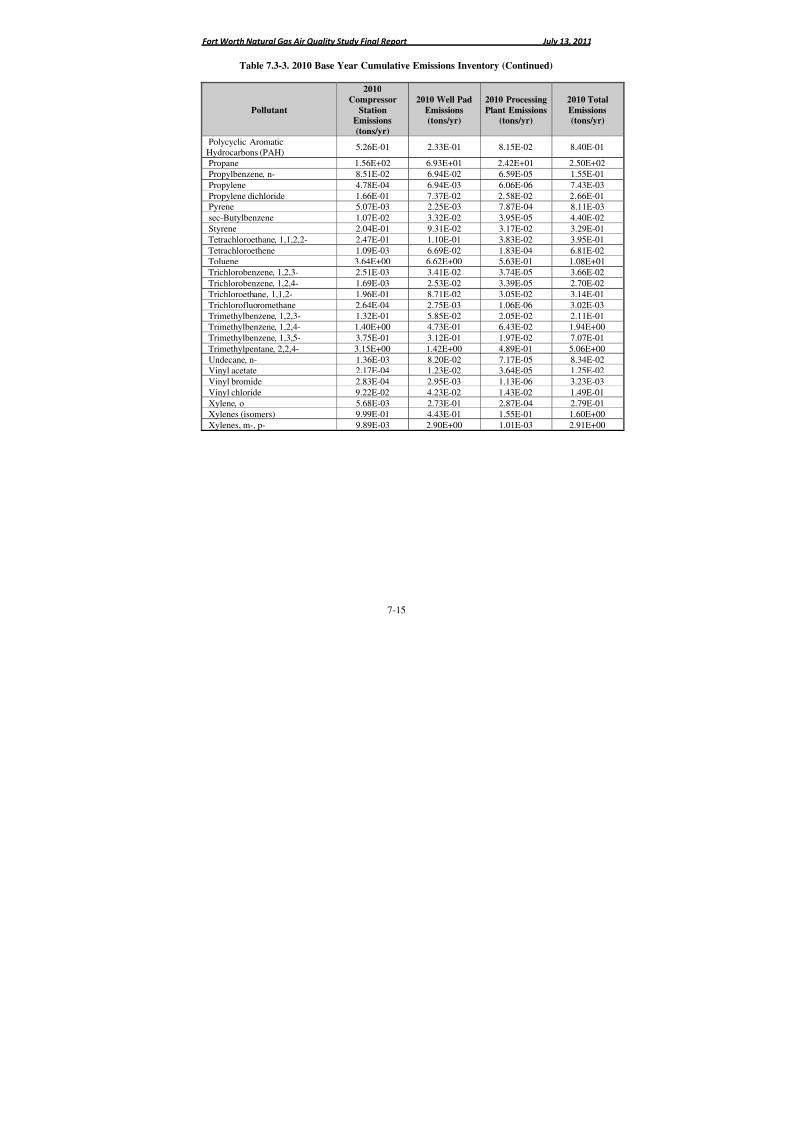
8/6/2019 Air Quality Study Final
http://slidepdf.com/reader/full/air-quality-study-final 304/320
Fort Worth Natural Gas Air Quality Study Final Report July 13, 2011
7-15
Table 7.3-3. 2010 Base Year Cumulative Emissions Inventory (Continued)
Pollutant
2010
Compressor
StationEmissions
(tons/yr)
2010 Well Pad
Emissions(tons/yr)
2010 Processing
Plant Emissions(tons/yr)
2010 Total
Emissions(tons/yr)
Polycyclic AromaticHydrocarbons (PAH)
5.26E-01 2.33E-01 8.15E-02 8.40E-01
Propane 1.56E+02 6.93E+01 2.42E+01 2.50E+02
Propylbenzene, n- 8.51E-02 6.94E-02 6.59E-05 1.55E-01
Propylene 4.78E-04 6.94E-03 6.06E-06 7.43E-03
Propylene dichloride 1.66E-01 7.37E-02 2.58E-02 2.66E-01Pyrene 5.07E-03 2.25E-03 7.87E-04 8.11E-03
sec-Butylbenzene 1.07E-02 3.32E-02 3.95E-05 4.40E-02
Styrene 2.04E-01 9.31E-02 3.17E-02 3.29E-01
Tetrachloroethane, 1,1,2,2- 2.47E-01 1.10E-01 3.83E-02 3.95E-01
Tetrachloroethene 1.09E-03 6.69E-02 1.83E-04 6.81E-02Toluene 3.64E+00 6.62E+00 5.63E-01 1.08E+01
Trichlorobenzene, 1,2,3- 2.51E-03 3.41E-02 3.74E-05 3.66E-02
Trichlorobenzene, 1,2,4- 1.69E-03 2.53E-02 3.39E-05 2.70E-02
Trichloroethane, 1,1,2- 1.96E-01 8.71E-02 3.05E-02 3.14E-01
Trichlorofluoromethane 2.64E-04 2.75E-03 1.06E-06 3.02E-03Trimethylbenzene, 1,2,3- 1.32E-01 5.85E-02 2.05E-02 2.11E-01
Trimethylbenzene, 1,2,4- 1.40E+00 4.73E-01 6.43E-02 1.94E+00
Trimethylbenzene, 1,3,5- 3.75E-01 3.12E-01 1.97E-02 7.07E-01
Trimethylpentane, 2,2,4- 3.15E+00 1.42E+00 4.89E-01 5.06E+00
Undecane, n- 1.36E-03 8.20E-02 7.17E-05 8.34E-02Vinyl acetate 2.17E-04 1.23E-02 3.64E-05 1.25E-02
Vinyl bromide 2.83E-04 2.95E-03 1.13E-06 3.23E-03Vinyl chloride 9.22E-02 4.23E-02 1.43E-02 1.49E-01
Xylene, o 5.68E-03 2.73E-01 2.87E-04 2.79E-01Xylenes (isomers) 9.99E-01 4.43E-01 1.55E-01 1.60E+00
Xylenes, m-, p- 9.89E-03 2.90E+00 1.01E-03 2.91E+00

8/6/2019 Air Quality Study Final
http://slidepdf.com/reader/full/air-quality-study-final 305/320
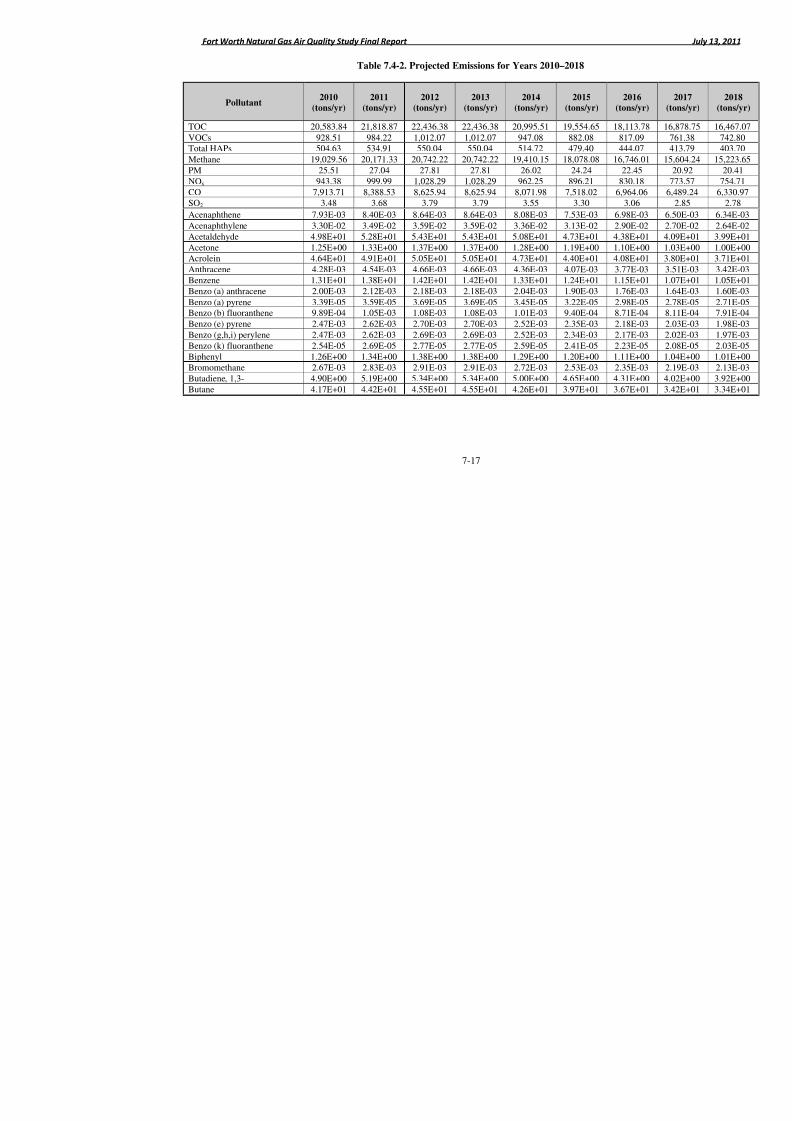
8/6/2019 Air Quality Study Final
http://slidepdf.com/reader/full/air-quality-study-final 306/320
Fort Worth Natural Gas Air Quality Study Final Report
7-17
Table 7.4-2. Projected Emissions for Years 2010–2018
Pollutant2010
(tons/yr)
2011
(tons/yr)
2012
(tons/yr)
2013
(tons/yr)
2014
(tons/yr)
2015
(tons/yr) (
TOC 20,583.84 21,818.87 22,436.38 22,436.38 20,995.51 19,554.65 1VOCs 928.51 984.22 1,012.07 1,012.07 947.08 882.08 Total HAPs 504.63 534.91 550.04 550.04 514.72 479.40
Methane 19,029.56 20,171.33 20,742.22 20,742.22 19,410.15 18,078.08 1
PM 25.51 27.04 27.81 27.81 26.02 24.24
NOx 943.38 999.99 1,028.29 1,028.29 962.25 896.21
CO 7,913.71 8,388.53 8,625.94 8,625.94 8,071.98 7,518.02 6SO2 3.48 3.68 3.79 3.79 3.55 3.30
Acenaphthene 7.93E-03 8.40E-03 8.64E-03 8.64E-03 8.08E-03 7.53E-03 6
Acenaphthylene 3.30E-02 3.49E-02 3.59E-02 3.59E-02 3.36E-02 3.13E-02 2
Acetaldehyde 4.98E+01 5.28E+01 5.43E+01 5.43E+01 5.08E+01 4.73E+01 4
Acetone 1.25E+00 1.33E+00 1.37E+00 1.37E+00 1.28E+00 1.19E+00 1Acrolein 4.64E+01 4.91E+01 5.05E+01 5.05E+01 4.73E+01 4.40E+01 4
Anthracene 4.28E-03 4.54E-03 4.66E-03 4.66E-03 4.36E-03 4.07E-03 3
Benzene 1.31E+01 1.38E+01 1.42E+01 1.42E+01 1.33E+01 1.24E+01 1
Benzo (a) anthracene 2.00E-03 2.12E-03 2.18E-03 2.18E-03 2.04E-03 1.90E-03 1
Benzo (a) pyrene 3.39E-05 3.59E-05 3.69E-05 3.69E-05 3.45E-05 3.22E-05 2Benzo (b) fluoranthene 9.89E-04 1.05E-03 1.08E-03 1.08E-03 1.01E-03 9.40E-04 8
Benzo (e) pyrene 2.47E-03 2.62E-03 2.70E-03 2.70E-03 2.52E-03 2.35E-03 2
Benzo (g,h,i) perylene 2.47E-03 2.62E-03 2.69E-03 2.69E-03 2.52E-03 2.34E-03 2
Benzo (k) fluoranthene 2.54E-05 2.69E-05 2.77E-05 2.77E-05 2.59E-05 2.41E-05 2
Biphenyl 1.26E+00 1.34E+00 1.38E+00 1.38E+00 1.29E+00 1.20E+00 1Bromomethane 2.67E-03 2.83E-03 2.91E-03 2.91E-03 2.72E-03 2.53E-03 2
Butadiene, 1,3- 4.90E+00 5.19E+00 5.34E+00 5.34E+00 5.00E+00 4.65E+00 4Butane 4.17E+01 4.42E+01 4.55E+01 4.55E+01 4.26E+01 3.97E+01 3
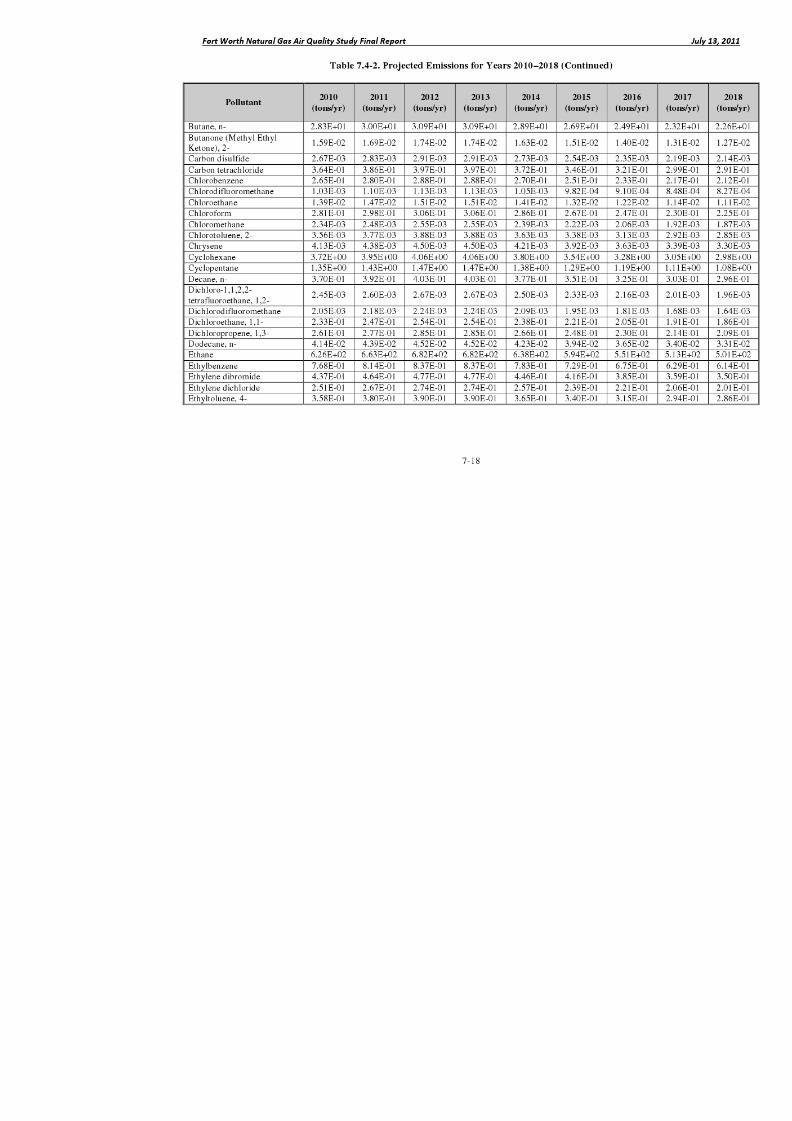
8/6/2019 Air Quality Study Final
http://slidepdf.com/reader/full/air-quality-study-final 307/320
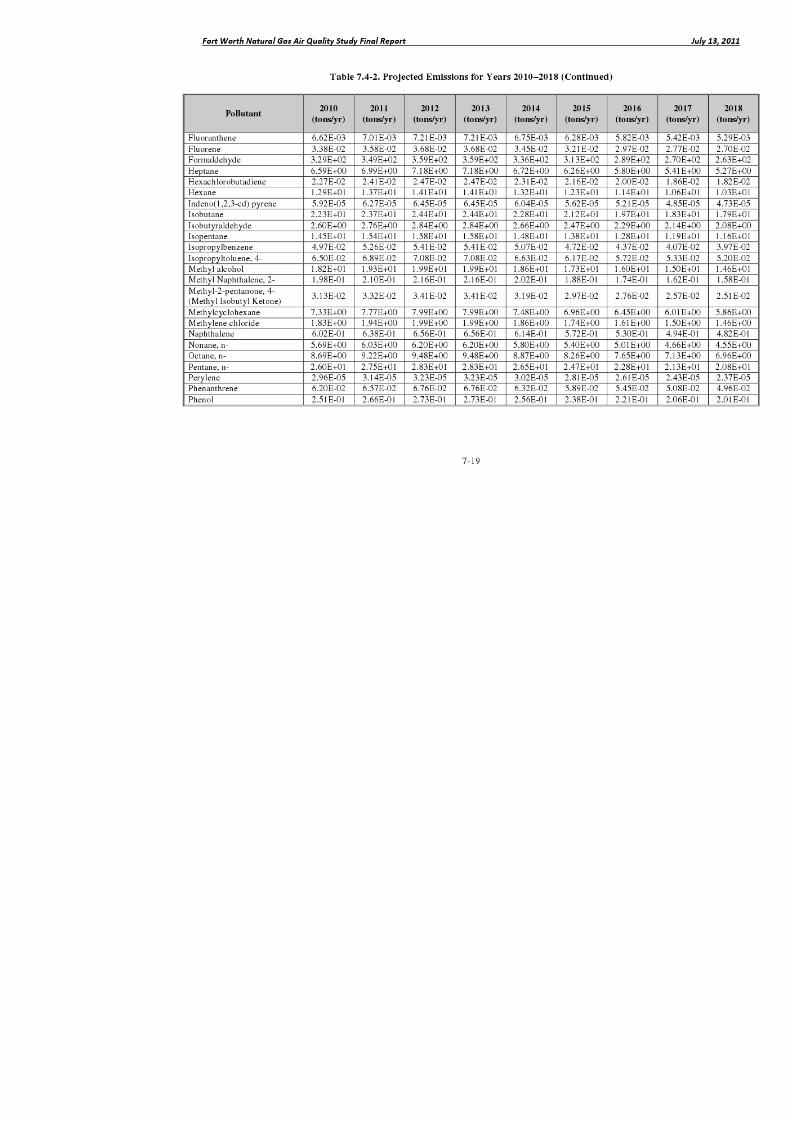
8/6/2019 Air Quality Study Final
http://slidepdf.com/reader/full/air-quality-study-final 308/320
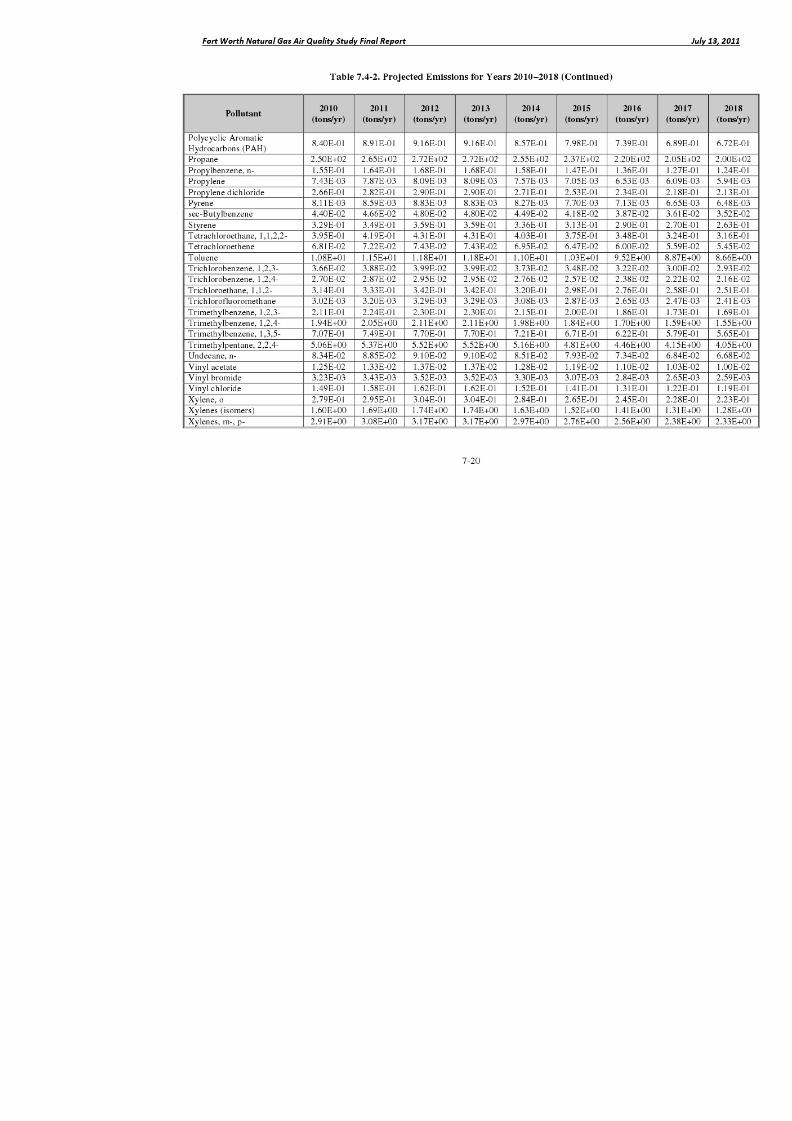
8/6/2019 Air Quality Study Final
http://slidepdf.com/reader/full/air-quality-study-final 309/320
8/6/2019 Air Quality Study Final
http://slidepdf.com/reader/full/air-quality-study-final 310/320
Fort Worth Natural Gas Air Quality Study Final Report July 13, 2011
7-21
Key Point: Barnett Shale
Based on a reserve estimate of 30trillion cubic feet of natural gas, over75% of the available natural gas in theBarnett Shale is projected to be
recovered by the end of 2018.
7.5 Full Build-Out Estimates Conclusions
Emissions from the production of natural gas in the city of Fort Worth are projected topeak in 2012 and 2013, and in 2015 are projected to decrease to below 2010 levels. Theprojected peak emission levels occurring in 2012 and 2013 are expected to be 9% higher than
emissions during the 2010 baseline year.
As discussed above, natural gas production is primarily dependent on the price thatproducers will receive. This concept is reflected in the demonstrated relationship betweendrilling rig and permit activity and natural gas prices. If the wellhead price for natural gasremains relatively low, as it is now, producers do not have economic incentive to invest in newexploration and drilling. Under this scenario, it is expected that total production from currentlyproducing wells and leased wells not yet in production (but currently in development) willincrease in the short term, followed by a slow decline.
Should wellhead prices for natural gas
unexpectedly increase in future years, natural gasproduction and associated air emissions may be greaterthan projected. However, it is important to note that thelonger natural gas prices remain flat, the lower the peak production rate will be, even with a spike in the price of natural gas. This is because the overall size of theresource, or the reserves, is finite, and the reserve decreases in size as each year passes. The dataused in this analysis shows that, based on a reserve estimate of 30 trillion cubic feet of naturalgas in the Barnett Shale, approximately one-third has already been depleted, and over 75% willhave been recovered by the end of 2018.
8/6/2019 Air Quality Study Final
http://slidepdf.com/reader/full/air-quality-study-final 311/320
Fort Worth Natural Gas Air Quality Study Final Report July 13, 2011
8-1
8.0 Conclusions and Recommendations
Commencing with planning activities in July 2010 and field activities in August 2010, theFort Worth Natural Gas Air Quality Study was a multi-phase project aimed at characterizing theair quality impacts of natural gas exploration and production, determining any potential health
risks associated with those impacts, quantifying the total amount of pollutants being emitted, anddetermining if natural gas sites were in compliance with air quality regulations.
Two primary raw data collection activities were used: 1) an ambient air monitoringnetwork, and 2) a systematic point source testing program. Point source testing data were thenused to perform air dispersion modeling, and measured and modeled air concentrations wereused in the public health evaluation. Each of these tasks was designed to help city officialsanswer the following questions:
• How much air pollution is being released by natural gas exploration in Fort Worth?
• Do sites comply with environmental regulation?
• How do releases from these sites affect off-site air pollution levels?
• Are the city’s required setbacks for these sites adequate to protect public health?
Section 8.1 provides a summary of the conclusions for each task of this study, Section 8.2includes answers to the four primary study questions, and Section 8.3 provides specificrecommendations for ensuring that emissions from natural gas sites do not cause unhealthy airpollution levels.
8.1 Task Level Conclusions
As discussed previously, the Fort Worth Natural Gas Air Quality Study was multi-facetedand included Ambient Air Monitoring, Point Source Testing, Air Dispersion Modeling, a PublicHealth Evaluation, a Regulatory Assessment, and Full Build-Out Estimates. The key findings foreach of these tasks are provided below.
Key findings of the Ambient Air Monitoring task include:
• 169 ambient air samples from 8 locations in Fort Worth were collected and analyzed,resulting in over 15,000 ambient air data points generated for this study.
• Methane, ethane, propane, and butane were the pollutants found at highestconcentrations. However, more toxic pollutants (e.g., benzene) were also found, butgenerally at much lower levels.
• Concentrations measured at Site S-4 (located in a high-level activity area nearcompressor stations, well pads, and mobile sources) were generally higher than at theother sites.
• Concentrations measured at Sites S-6 and S-7 (both located within 350 of active wellpads) were surprisingly low relative to the other sites.
8/6/2019 Air Quality Study Final
http://slidepdf.com/reader/full/air-quality-study-final 312/320
Fort Worth Natural Gas Air Quality Study Final Report July 13, 2011
8-2
• Wind patterns observed during the sampling period were consistent with historicalwind patterns, indicating proper placement of the ambient air monitors.
Key findings of the Point Source Testing task include:
• At 96 sites, no emissions were detected by the IR camera. Most of these sitescontained 3 wells or less.
• The largest source of fugitive emissions detected with the IR camera was leaking tank thief hatches.
• Pneumatic Valve Controllers were the most frequent emission sources encountered atwell pads and compressor stations.
• Compressor engines have a significant impact on emissions, especially the large linecompressors found at compressor stations.
• There was little difference in average TOC emissions between dry and wet gas sites,
but average VOC and HAP emissions from wet gas sites proved to be considerablyhigher.
Key findings of the Public Health Evaluation task (including analysis of the emissionsconcentrations predicted under the Air Dispersion Modeling task) include:
• Benzene emissions from tanks could lead to air pollution levels slightly higher thanTCEQ’s short-term ESL, but only in very close proximity to the highest-emittingtanks.
• Large line engines can emit acrolein and formaldehyde at levels that would cause
offsite ambient air concentrations to exceed TCEQ’s short-term and long-termscreening levels over various distances. This finding is based entirely on estimatedemission rates.
• Trace levels of halogenated hydrocarbons detected during the ambient air monitoringprogram are not likely to be attributable to emissions from natural gas exploration andproduction activity.
Key findings of the Regulatory Assessment task include:
• Five sites had cumulative VOC emissions greater than the PBR trigger level of 25
tons/yr and/or CO emissions greater than the major source threshold of 100 tons/yr.
Key findings of the Full Build-Out Estimates task include:
• Emissions from the production of natural gas in the city of Fort Worth are projectedto peak in 2012 and 2013 at 9% above 2010 levels.
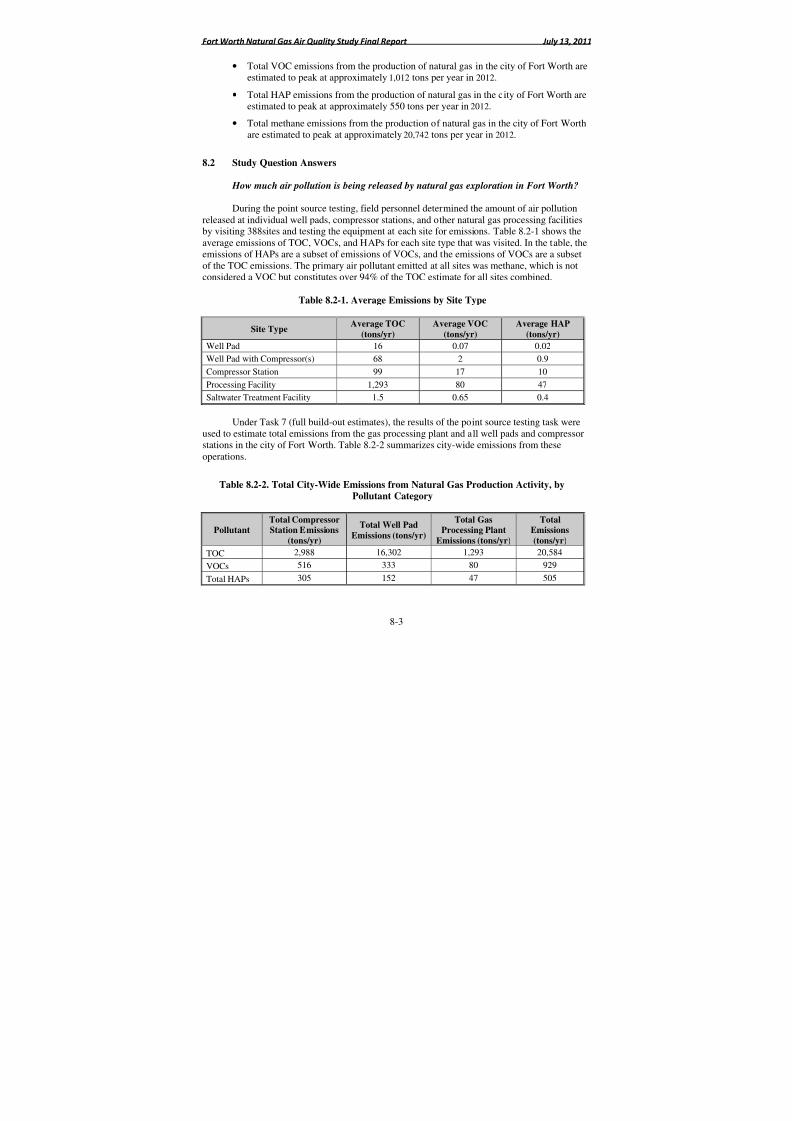
8/6/2019 Air Quality Study Final
http://slidepdf.com/reader/full/air-quality-study-final 313/320
Fort Worth Natural Gas Air Quality Study Final Report July 13, 2011
8-3
• Total VOC emissions from the production of natural gas in the city of Fort Worth areestimated to peak at approximately 1,012 tons per year in 2012.
• Total HAP emissions from the production of natural gas in the city of Fort Worth areestimated to peak at approximately 550 tons per year in 2012.
•
Total methane emissions from the production of natural gas in the city of Fort Worthare estimated to peak at approximately 20,742 tons per year in 2012.
8.2 Study Question Answers
How much air pollution is being released by natural gas exploration in Fort Worth?
During the point source testing, field personnel determined the amount of air pollutionreleased at individual well pads, compressor stations, and other natural gas processing facilitiesby visiting 388sites and testing the equipment at each site for emissions. Table 8.2-1 shows theaverage emissions of TOC, VOCs, and HAPs for each site type that was visited. In the table, the
emissions of HAPs are a subset of emissions of VOCs, and the emissions of VOCs are a subsetof the TOC emissions. The primary air pollutant emitted at all sites was methane, which is notconsidered a VOC but constitutes over 94% of the TOC estimate for all sites combined.
Table 8.2-1. Average Emissions by Site Type
Site TypeAverage TOC
(tons/yr)
Average VOC
(tons/yr)
Average HAP
(tons/yr)
Well Pad 16 0.07 0.02
Well Pad with Compressor(s) 68 2 0.9
Compressor Station 99 17 10
Processing Facility 1,293 80 47
Saltwater Treatment Facility 1.5 0.65 0.4
Under Task 7 (full build-out estimates), the results of the point source testing task wereused to estimate total emissions from the gas processing plant and all well pads and compressorstations in the city of Fort Worth. Table 8.2-2 summarizes city-wide emissions from theseoperations.
Table 8.2-2. Total City-Wide Emissions from Natural Gas Production Activity, byPollutant Category
PollutantTotal CompressorStation Emissions
(tons/yr)
Total Well Pad
Emissions (tons/yr)
Total GasProcessing Plant
Emissions (tons/yr)
TotalEmissions
(tons/yr)
TOC 2,988 16,302 1,293 20,584
VOCs 516 333 80 929
Total HAPs 305 152 47 505
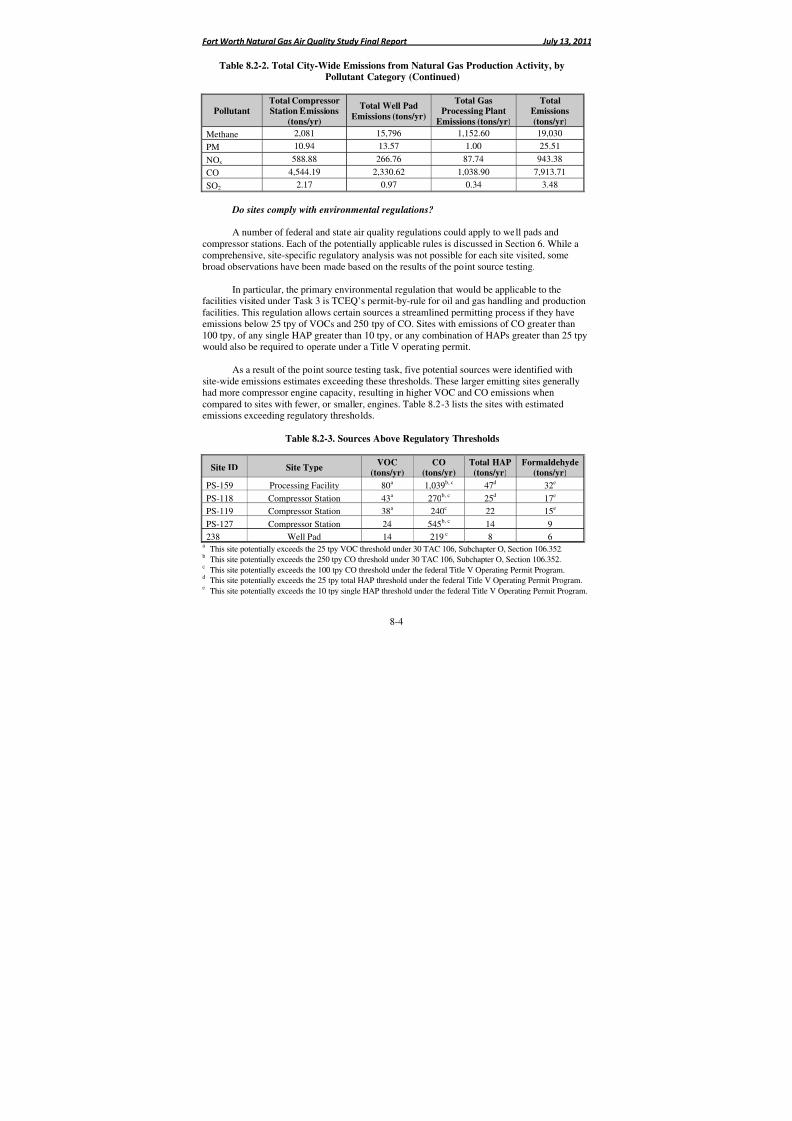
8/6/2019 Air Quality Study Final
http://slidepdf.com/reader/full/air-quality-study-final 314/320
Fort Worth Natural Gas Air Quality Study Final Report July 13, 2011
8-4
Table 8.2-2. Total City-Wide Emissions from Natural Gas Production Activity, byPollutant Category (Continued)
PollutantTotal CompressorStation Emissions
(tons/yr)
Total Well Pad
Emissions (tons/yr)
Total GasProcessing Plant
Emissions (tons/yr)
TotalEmissions
(tons/yr)
Methane 2,081 15,796 1,152.60 19,030
PM 10.94 13.57 1.00 25.51
NOx 588.88 266.76 87.74 943.38
CO 4,544.19 2,330.62 1,038.90 7,913.71
SO2 2.17 0.97 0.34 3.48
Do sites comply with environmental regulations?
A number of federal and state air quality regulations could apply to well pads andcompressor stations. Each of the potentially applicable rules is discussed in Section 6. While a
comprehensive, site-specific regulatory analysis was not possible for each site visited, somebroad observations have been made based on the results of the point source testing.
In particular, the primary environmental regulation that would be applicable to thefacilities visited under Task 3 is TCEQ’s permit-by-rule for oil and gas handling and productionfacilities. This regulation allows certain sources a streamlined permitting process if they haveemissions below 25 tpy of VOCs and 250 tpy of CO. Sites with emissions of CO greater than100 tpy, of any single HAP greater than 10 tpy, or any combination of HAPs greater than 25 tpywould also be required to operate under a Title V operating permit.
As a result of the point source testing task, five potential sources were identified with
site-wide emissions estimates exceeding these thresholds. These larger emitting sites generallyhad more compressor engine capacity, resulting in higher VOC and CO emissions whencompared to sites with fewer, or smaller, engines. Table 8.2-3 lists the sites with estimatedemissions exceeding regulatory thresholds.
Table 8.2-3. Sources Above Regulatory Thresholds
Site ID Site TypeVOC
(tons/yr)CO
(tons/yr)Total HAP(tons/yr)
Formaldehyde(tons/yr)
PS-159 Processing Facility 80a 1,039b, c 47d 32e
PS-118 Compressor Station 43a 270b, c 25d 17e
PS-119 Compressor Station 38a 240c 22 15e
PS-127 Compressor Station 24 545b, c 14 9
238 Well Pad 14 219 c 8 6a
This site potentially exceeds the 25 tpy VOC threshold under 30 TAC 106, Subchapter O, Section 106.352.b
This site potentially exceeds the 250 tpy CO threshold under 30 TAC 106, Subchapter O, Section 106.352.c
This site potentially exceeds the 100 tpy CO threshold under the federal Title V Operating Permit Program.d
This site potentially exceeds the 25 tpy total HAP threshold under the federal Title V Operating Permit Program.e
This site potentially exceeds the 10 tpy single HAP threshold under the federal Title V Operating Permit Program.
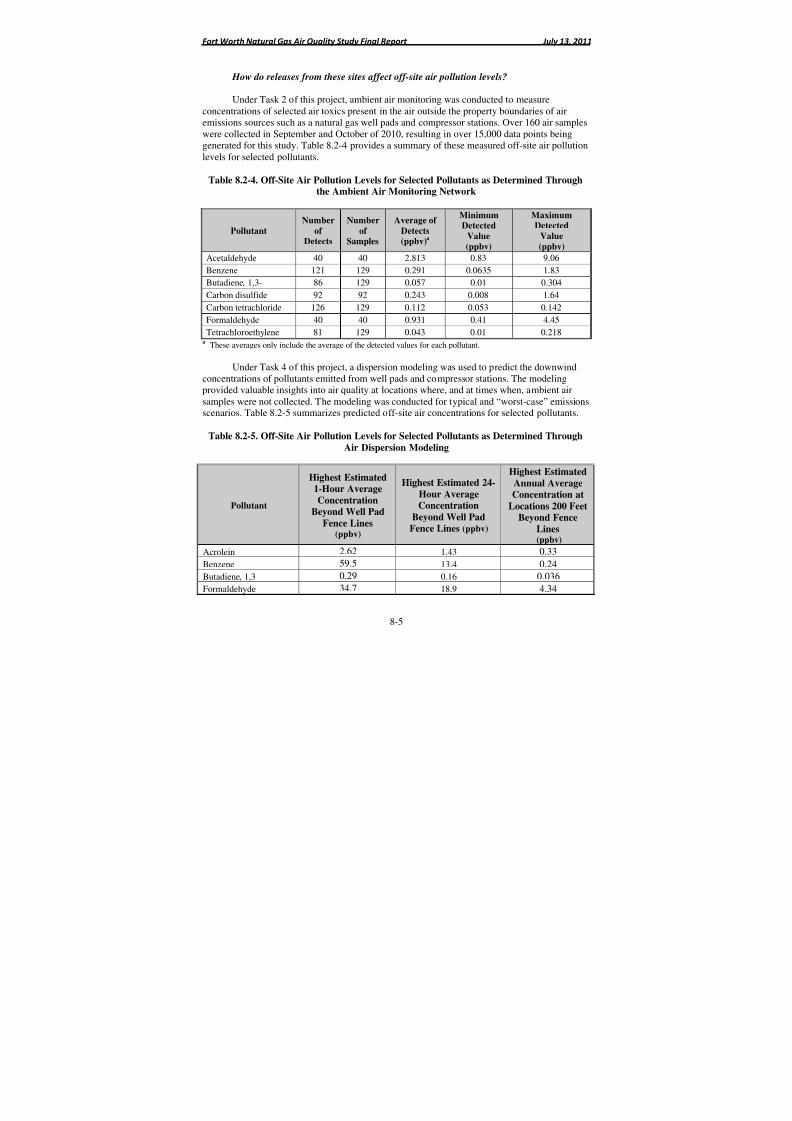
8/6/2019 Air Quality Study Final
http://slidepdf.com/reader/full/air-quality-study-final 315/320
Fort Worth Natural Gas Air Quality Study Final Report July 13, 2011
8-5
How do releases from these sites affect off-site air pollution levels?
Under Task 2 of this project, ambient air monitoring was conducted to measureconcentrations of selected air toxics present in the air outside the property boundaries of air
emissions sources such as a natural gas well pads and compressor stations. Over 160 air sampleswere collected in September and October of 2010, resulting in over 15,000 data points beinggenerated for this study. Table 8.2-4 provides a summary of these measured off-site air pollutionlevels for selected pollutants.
Table 8.2-4. Off-Site Air Pollution Levels for Selected Pollutants as Determined Throughthe Ambient Air Monitoring Network
Pollutant
Number
of Detects
Number
of Samples
Average of
Detects(ppbv)
a
MinimumDetected
Value
(ppbv)
MaximumDetected
Value
(ppbv)
Acetaldehyde 40 40 2.813 0.83 9.06
Benzene 121 129 0.291 0.0635 1.83
Butadiene, 1,3- 86 129 0.057 0.01 0.304
Carbon disulfide 92 92 0.243 0.008 1.64
Carbon tetrachloride 126 129 0.112 0.053 0.142
Formaldehyde 40 40 0.931 0.41 4.45
Tetrachloroethylene 81 129 0.043 0.01 0.218a
These averages only include the average of the detected values for each pollutant.
Under Task 4 of this project, a dispersion modeling was used to predict the downwind
concentrations of pollutants emitted from well pads and compressor stations. The modelingprovided valuable insights into air quality at locations where, and at times when, ambient airsamples were not collected. The modeling was conducted for typical and “worst-case” emissionsscenarios. Table 8.2-5 summarizes predicted off-site air concentrations for selected pollutants.
Table 8.2-5. Off-Site Air Pollution Levels for Selected Pollutants as Determined Through
Air Dispersion Modeling
Pollutant
Highest Estimated1-Hour Average
ConcentrationBeyond Well Pad
Fence Lines(ppbv)
Highest Estimated 24-
Hour Average
ConcentrationBeyond Well Pad
Fence Lines (ppbv)
Highest Estimated
Annual AverageConcentration at
Locations 200 FeetBeyond Fence
Lines(ppbv)
Acrolein 2.62 1.43 0.33
Benzene 59.5 13.4 0.24
Butadiene, 1,3 0.29 0.16 0.036
Formaldehyde 34.7 18.9 4.34
8/6/2019 Air Quality Study Final
http://slidepdf.com/reader/full/air-quality-study-final 316/320
Fort Worth Natural Gas Air Quality Study Final Report July 13, 2011
8-6
Are the city’s required setbacks for these sites adequate to protect public health?
ERG conducted a health screening evaluation to evaluate the health implications of airemissions from natural gas exploration and production activity. This evaluation was based onprotective health-based screening values, primarily those published by TCEQ, though
consideration was also given to EPA and ATSDR values for the pollutants of greatest concern.The ambient air monitoring data revealed no site-related pollutants with 24-hour averageconcentrations or program-average concentrations above TCEQ’s health-based screening levels.The modeling analysis identified three pollutants—acrolein, benzene, and formaldehyde—withestimated 1-hour average or annual average concentrations above screening levels at some offsitelocations. This was most prevalent for sites with multiple, large line compressor engines.However, due to the highly protective nature of the health-based screening values, none of theestimated concentrations reached levels expected to be associated with adverse health effects.
The modeling analysis served as the basis for evaluating the adequacy of setback distances. For the overwhelming majority of sites considered in this study, the modeling results
indicate that Fort Worth’s 600-foot setback distance is adequate. More specifically, for sites withno engines and for sites with smaller lift engines, no pollutants were found to have estimated1-hour maximum or annual average concentrations above TCEQ’s applicable health-basedscreening levels beyond the setback distances. For the relatively few sites with multiple, largeline engines, the modeling analysis found some areas beyond the setbacks to have estimatedacrolein and formaldehyde concentrations greater than TCEQ’s ESLs, though not reachingconcentrations expected to cause adverse health effects. For both pollutants, ERG’s modeling isbased entirely on estimated emission rates, and not measured values. This underscores the valueof obtaining more detailed acrolein and formaldehyde emissions data for line engines andfocused ambient air monitoring to validate these findings. Such studies would provide greaterconfidence in the adequacy and protectiveness of the city’s setbacks.
8.3 Recommendations
Although this study did not reveal any significant health threats beyond setback distances,it is important to remember that the sources of concern for this project—natural gas explorationand production activity—are located in residential settings throughout a metropolitan area.Though the most toxic pollutants these sources emit are released in relatively low quantities, allreasonable precautions to reduce emissions from the well pads and compressor stations should bemade. This is particularly important for tanks and line compressor engines, because these twosources accounted for the greatest portion of the risks observed for the pollutants selected forfurther evaluation. Such precautions would include the installation and operation of thefollowing air pollution control equipment:
Vapor Recovery Units on storage tanks – storage tanks are the highest source of benzeneemissions, and vapor recovery units could reduce these emissions by 90% or more. This wouldbe most beneficial at wet gas sites with higher condensate production.
3-way catalysts and/or catalytic oxidizers on compressor station compressor engines –the large compressor engines located at compressor stations are the main source of acrolein and
8/6/2019 Air Quality Study Final
http://slidepdf.com/reader/full/air-quality-study-final 317/320
Fort Worth Natural Gas Air Quality Study Final Report July 13, 2011
8-7
formaldehyde, the two pollutants of greatest concern from a public health perspective. 3-waycatalysts are primarily NOx control technologies, but have a co-benefit of reducing CO and VOCemissions. Catalytic oxidizers are used to control CO and VOC emissions.
Electric compressor engines – As many of the compressor stations in Fort Worth are
located in an urban setting, easy access to the electric grid also provides an opportunity toeliminate emissions from compressor engines completely through the use of electric motors.
Low bleed or no bleed pneumatic valve controllers – Pneumatic valve controllers werethe most frequent fugitive emission source found during the point source testing task. UnderEPA’s voluntary Natural Gas STAR Program, the use of low bleed valve controllers and electricvalve controllers is encouraged and has proven effective in reducing VOC (and methane)emissions from natural gas operations.
In addition to these air pollution control equipment recommendations, enhancedinspection and maintenance of equipment at natural gas sites can help ensure that preventable
emissions are greatly reduced or eliminated. At a small subset of sites, the point source testingteam noted signs of malfunctioning equipment that likely caused increased emissions. Forexample, some hatches atop tanks were ajar and not closed, and corrosion had apparently causeda hole to form on the roof of at least one tank.
The emission estimates used in this study for acrolein and formaldehyde are based on thebest emissions information currently available for compressor engines – emission factors fromU.S. EPA’s Compilation of Air Pollutant Emission Factors (AP-42).28 As control of acrolein andformaldehyde emissions from compressor engines is not explicitly required under any currentregulation, no control efficiency was assumed in our estimates. Options available to confirm ourassumptions and findings with regards to these pollutants include:
• Contact compressor station owners and operators to establish the frequency at whichtheir engines have installed controls, and to obtain any existing stack testing results
• Analyze the findings of TCEQ’s Phase II Barnett Shale Area Special Inventoryefforts to establish the frequency at which compressor engines have installed controls
• Conduct point source stack testing at the exhaust of compressor engines tocharacterize acrolein and formaldehdye emissions
• Conduct focused ambient air monitoring of acrolein and formaldehdye emissions inclose proximity to the larger compressor stations
Finally, ERG fully supports continued ambient air monitoring in and around the city of Fort Worth in order to confirm the key findings of this report. In particular, the results of TCEQ’s ongoing monitoring efforts in the Barnett Shale should be monitored for any changes inair quality in Fort Worth as worsening air quality may require additional response such asadditional controls or site maintenance requirements.
8/6/2019 Air Quality Study Final
http://slidepdf.com/reader/full/air-quality-study-final 318/320
Fort Worth Natural Gas Air Quality Study Final Report July 13, 2011
9-1
9.0 References
1. U.S. Environmental Protection Agency. 1999. Compendium Method TO-15: Determinationof Volatile Organic Compounds (VOCs) in Air Collected in Specially-Prepared Canistersand Analyzed by Gas Chromatography/Mass Spectrometry (GC/MS). Can be found at
http://www.epa.gov/ttn/amtic/airtox.html.
2. U.S. Environmental Protection Agency. 1999. Compendium Method TO-11A: Determinationof Formaldehyde in Ambient Air Using Adsorbent Cartridge Followed by High PerformanceLiquid Chromatography (HPLC). Can be found at http://www.epa.gov/ttn/amtic/airtox.html.
3. U.S. Environmental Protection Agency. 1999. Compendium Method TO-14A: Determinationof Volatile Organic Compounds (VOCs) in Ambient Air Using Specially Prepared Canisterswith Subsequent Analysis by Gas Chromatography. Can be found athttp://www.epa.gov/ttnamti1/files/ambient/airtox/to-14ar.pdf .
4. 101st
Congress (1989-1990). Title III—Hazardous Air Pollutants. S.1630.ENR. THOMAS(Library of Congress).
5. U.S. Environmental Protection Agency. 2010. SAT Initiative: Lamkin Elementary School(Cypress Texas). Can be found at http://www.epa.gov/schoolair/pdfs/LamkinTechReport.pdf .
6. U.S. Environmental Protection Agency. 2010. Results of the 2005 NATA Model-to-MonitorComparison, Final Report. Can be found athttp://www.epa.gov/ttn/atw/nata2005/05pdf/nata2005_model2monitor.pdf .
7. United States Environmental Protection Agency. Protocol for Equipment Leak Emission
Estimates. EPA-453/R-95-017. November 1995
8. Schulman et al., Addendum to ISC3 User’s Guide: The PRIME Plume Rise and BuildingDownwash Model. Earth Tech, Inc, November 1997. Can be found athttp://www.epa.gov/ttn/scram/7thconf/iscprime/useguide.pdf .
9. S Prasad, L Zhao, J Gomes. 2011. Methane and Natural Gas Exposure Limits. Presented atthe 2010 Joint Conference of International Society of Exposure Science and InternationalSociety for Environmental Epidemiology. Epidemiology 22(1):S251. January, 2011.
10. CCOHS. 2006. Health Effects of Methane. Canadian Centre for Occupational Health andSafety (CCOHS).
http://www.ccohs.ca/oshanswers/chemicals/chem_profiles/methane/health_met.html. Lastupdated December 11, 2006.
11. Agency for Toxic Substances and Disease Registry, 1994. Toxicological Profile forHexachlorobutadiene. U.S. Department of Health and Human Services: Agency for ToxicSubstances and Disease Registry. May, 1994.
8/6/2019 Air Quality Study Final
http://slidepdf.com/reader/full/air-quality-study-final 319/320
Fort Worth Natural Gas Air Quality Study Final Report July 13, 2011
9-2
12. Texas Commission on Environmental Quality, 2011a. Texas Air Monitoring InformationSystems. Site last accessed June 30, 2011.http://www5.tceq.state.tx.us/tamis/index.cfm?fuseaction=home.welcome
13. U.S. Environmental Protection Agency, 2010. Data Quality Evaluation Guidelines for
Ambient Air Acrolein Measurements. December 17, 2010.
14. Agency for Toxic Substances and Disease Registry, 2007. Toxicological Profile for Acrolein.U.S. Department of Health and Human Services: Agency for Toxic Substances and DiseaseRegistry. August, 2007.
15. Texas Commission on Environmental Quality, 2010. Development Support Document:Acrolein. Prepared by Allison Jenkins. November 19, 2010.
16. Weber-Tschopp A, Fischer T, Gierr R , et al. 1977. Experimental irritating effects of acroleinon man. Int Arch Occup Environ Health 40:117-130. (German)
17. Feron VJ, Kruysse A, Til HP, et al. 1978. Repeated exposure to acrolein vapour: Subacutestudies in hamsters, rats, and rabbits. Toxicology 9:47-58.
18. Pazdrak K, Gorski P, Krakowiak A, et al. 1993. Changes in nasal lavage fluid due toformaldehyde inhalation. In Arch Occup Environ Health 64:515-519.
19. Wilhelmsson B, Holmstrom M. 1992. Possible mechanisms of formaldehyde-induceddiscomfort in the upper airways. Scand J Work Environ Health 18:403-407.
20. Texas Commission on Environmental Quality, 2011b. Health Effects Evaluation of Region 4Carbonyl Monitoring Project, November 6-10, 2010: Sampling for Carbonyl Compounds inDish and Fort Worth, Texas. Memorandum from Shannon Ethridge, TCEQ ToxicologyDivision, to John Sadlier, TCEQ Office of Compliance and Enforcement. February 24, 2011.
21. The Perryman Group. 2007. Bounty from Below: The Impact of Developing Natural GasResources Associated with the Barnett Shale on Business Activity in Fort Worth and theSurrounding 14-County Area. Can be found athttp://www.barnettshaleexpo.com/docs/Barnett_Shale_Impact_Study.pdf .
22. U.S. Energy Information Administration. 2010. U.S. Crude Oil, Natural Gas, and NaturalGas Liquids Proved Reserves, 2009. Can be found athttp://www.eia.doe.gov/oil_gas/natural_gas/data_publications/crude_oil_natural_gas_reserves/cr.html.
23. Railroad Commission of Texas. 2011. Barnett Shale Information. Can be found athttp://www.rrc.state.tx.us/barnettshale/index.php.
24. U.S. Energy Information Administration. 2011. Annual Texas Natural Gas Wellhead Price.Can be found at http://www.eia.doe.gov/dnav/ng/hist/na1140_stx_3a.htm.

8/6/2019 Air Quality Study Final
http://slidepdf.com/reader/full/air-quality-study-final 320/320