Embed Size (px)
Citation preview

Research ArticleTheScientificWorldJOURNAL (2011) 11, 2582–2598ISSN 1537-744X; doi:10.1100/2011/430616
Air Monitoring: New Advances inSampling and Detection
Nicola Watson, Stephen Davies, and David Wevill
Markes International, Gwaun Elai Medi Science Campus, Llantrisant CF72 8XL, UK
Received 22 October 2011; Accepted 22 December 2011
Academic Editor: Richard Brown
As the harmful effects of low-level exposure to hazardous organic air pollutants become moreevident, there is constant pressure to improve the detection limits of indoor and ambientair monitoring methods, for example, by collecting larger air volumes and by optimising thesensitivity of the analytical detector. However, at the other end of the scale, rapid industrialisationin the developing world and growing pressure to reclaim derelict industrial land for housebuilding is driving the need for air monitoring methods that can reliably accommodate very-high-concentration samples in potentially aggressive matrices. This paper investigates the potentialof a combination of two powerful gas chromatography—based analytical enhancements—sample preconcentration/thermal desorption and time-of-flight mass spectrometry—to improvequantitative and qualitative measurement of very-low-(ppt) level organic chemicals, even in themost complex air samples. It also describes new, practical monitoring options for addressingequally challenging high-concentration industrial samples.
KEYWORDS: air sampling, air pollutants, mass spectrometry, volatile organic chemicals
Correspondence should be addressed to Stephen Davies, [email protected] © 2011 Nicola Watson et al. This is an open access article distributed under the Creative Commons Attribution License,which permits unrestricted use, distribution, and reproduction in any medium, provided the original work is properly cited.Published by TheScientificWorldJOURNAL; http://www.tswj.com/

TheScientificWorldJOURNAL (2011) 11, 2582–2598
1. INTRODUCTION
Samples of vapour-phase volatile organic chemicals (VOCs) in ambient air are collected in a number ofdifferent ways, of which sorbent tubes, canisters, and bags are the most popular [1, 2]. The representativesample of pollutants that results is then typically analysed by GC-MS.
However, in order to transfer a sample to the GC-MS without injecting large volumes of gas, apreconcentration device is needed. Ideally, the concentration device should allow selective retention oftarget VOCs while potential interferences such as water and CO2 are purged to vent. The state-of-the-artpre-concentration devices (focusing traps) built into modern thermal desorbers (TDs) are electrically cooledand configured such that retained analytes are desorbed/injected into the GC-MS with carrier gas flowingin the reverse direction to that used during the trapping/concentration process. Such “backflush” desorptionmeans that the focusing trap can be packed with multiple sorbents in series, allowing a wider range ofanalytes to be sampled simultaneously (Figures 1 and 2).
The choice of air sampling method depends on the volatility and polarity range of the VOCs ofinterest [1, 2] and also varies from country to country, primarily because of historical investment. TheUSA, China and Japan, for example, have traditionally preferred canisters for time-weighted monitoring orgrab sampling of the lighter VOCs [3–5], whereas methods across Europe and the rest of Asia have moretypically favoured active or passive sampling using sorbent tubes [6–8].
Online/real-time air monitoring is also used extensively for kinetic studies and for compliance withspecific regulations that require real-time monitoring data—for example, C2 to C10 hydrocarbon ozoneprecursors [9], odorous sulfur compounds [10, 11], and some trace perfluorinated compounds which arenow known to be potent and long-lived greenhouse gases [12].
Each air sampling/monitoring technique has its inherent advantages and disadvantages, and thesehave been explored in detail in previous work [1, 2].
2. NEW ADVANCES FOR AIR SAMPLING USINGCONTAINERS SUCH AS CANISTERS
2.1. High-Level Samples
Small canisters (around 400 mL volume) have been growing in popularity for grab-sampling high-concentration volatiles (with vapour pressures greater than those of n-nonane). Pre-concentration/trappingis still required prior to analysis in order to selectively eliminate the bulk constituents of air, especiallyoxygen, which would otherwise adversely affect the performance of the GC column and detector. However,sample volumes must be minimised to prevent overloading and/or contaminating the analytical system. Careis also required for small volumes of air to be quantitatively transferred without introducing uncertainty, andthis is usually achieved using gas sample loops, capable of accurately metering sample volumes in the orderof a few hundred microlitres.
A recent development has enabled gas loop introduction to be combined with the latest TD trappingtechnology, postdesorption sample splitting and enhanced line purging, such that high-concentrationsamples can be automatically processed without compromising measurement accuracy and with sufficientlylow carryover to enable much lower-level samples to be reliably measured on the same analytical system(Figure 3). Incorporating these techniques into a single system setup allows flexibility in the analysis ofunknown concentration samples with the added capability of running trace and high-concentration samplesin the same analytical sequence without compromising results. Prior to this development, samples wouldhave to be prescreened on a separate system and once assessed dilution of high-concentration samplesusing a diluent gas would have to be carried out [3, 13], this was a time consuming and labour intensivesetup, and by diluting the samples errors and more importantly the reporting limits will be elevated[13].
2583

TheScientificWorldJOURNAL (2011) 11, 2582–2598
Flow duringtrap desorption
Flow during focusing/sampling onto trap
Quartzwool Weak
sorbentStrongsorbent
Strongestsorbent
Retainingspring
FIGURE 1: Multibed focusing trap (Markes International Ltd, UK), showing weak sorbents at the left fortrapping semivolatile organic compounds and strong sorbents at the right for trapping very volatile organiccompounds.
Abu
nda
nce
×104
9085807570656055504540353025201510
50
706560555045403530252015105
Time (min)
1, 3-butadieneBenzene
Toluene
o-Xylene
Camphene
Dioctyl phthalate
1, 3-butadieneBenzene
Toluene
o-Xylene
Camphene
Dioctyl phthalateeeeeeeeeeeeeeeee
FIGURE 2: Tube desorption (TD-100, Markes International Ltd) demonstrating simultaneous analysis of awide range of compounds relevant to materials emissions testing (method conditions are shown in Table 1).
TABLE 1: Sampling and analytical conditions.
TD conditions GC conditions MS conditions
Configuration: TD-100 forautomated tube desorption(Markes International Ltd)Flow path temperature: 200◦CFocusing trap: air toxicsanalyser type trapTrapping temperature: 25◦CCold trap desorption: 320◦C for10 min (20 : 1 split)Trap heating rate: 40◦C/s
Column: 60 m × 0.32 mm × 1.0 µm,100% dimethylpolysiloxaneOven: 35◦C (25 min), 5◦C/min to 180◦C,then 15◦C/min to 320◦C (12 min)Constant pressure: 10 psi
Source temperature: 230◦CQuadrupole temperature: 150◦CTransfer line temperature: 280◦CScan range: m/z 10–400
Sampling: 1 µL of a 100 ng/µL standard loaded onto a multi-bed sorbent tube (Tenax TA, Carbograph 1TD, Carboxen 1003).
Linearity tests were also carried out to evaluate this novel approach for analysing concentratedcanister air against more conventional TD analysis procedures for lower-level (ambient) air samples(Figure 4).
The excellent linearity obtained across this range of air sample volumes, despite using two differentapproaches to metering the volume introduced to the focusing trap, shows good correlation of the data fromsamples introduced via gas sample loop and those metered using mass flow control. It is also noteworthy
2584

TheScientificWorldJOURNAL (2011) 11, 2582–2598
Abu
nda
nce
9000000
8500000
8000000
7500000
7000000
6500000
6000000
5500000
5000000
4500000
4000000
3500000
3000000
2500000
2000000
1500000
1000000
500000
0
9500000
1e + 07
1, 2, 4-trichlorobenzene
0.043% carryover
Hexachloro-1, 3-butadiene
0.061% carryover
2624222018161412108642
Time (min)
FIGURE 3: Main image: analysis of 40 mL of a 1 ppm 62-component “US EPA TO-15 air toxics” standard(i.e., a heavily overloaded sample) using a CIA-Advantage system, (Markes International Ltd). Inset:Expansion of the peaks for 1,2,4-trichlorobenzene and hexachloro-1,3-butadiene, showing subsequentanalysis of a 500 mL nitrogen blank demonstrating very low carryover even under extreme conditions andfor these late-eluting components (method conditions are shown in Table 2).
TABLE 2: Analytical conditions.
TD conditions GC conditions MS conditions
Configuration: CIA-Advantageautomated canister analysis system(Markes International Ltd)Sampling: 40 mL/min for 1 min(standard); 50 mL/min for 10 min(blank)Flow path temperature: 150◦CFocusing trap: air toxics analysertype trapTrapping temperature: 25◦CCold trap desorption: 320◦C for3 min (5 : 1 split)Trap heating rate: 40◦C/s
Column: 60 m × 0.32 mm × 1.8 µm,624 type phaseOven: 40◦C (5 min), 10◦C/min to260◦C (8 min)Constant pressure: 10 psi
Source temperature: 230◦CQuadrupole temperature: 150◦CTransfer line temperature: 280◦CScan range: m/z 35–300
2585

TheScientificWorldJOURNAL (2011) 11, 2582–2598
0
Sample volume (mL)
50 100 150 200
Trichloroethene R2 = 0.9997
R2 = 1
R2 = 0.9996
R2 = 1
Buta-1, 3-diene
Tetrachloroethene
Dichlorodifluorobenzene
Benzene1, 2, 4-trichlorobenzeneCarbon tetrachloride1, 3-dichlorobenzene
R2 = 0.9993R2 = 0.9994
R2 = 0.9999R2 = 0.9973
0 1 2Pe
ak a
rea
Loopsampling sampling
MFC
FIGURE 4: Responses for loop sampling (at 0.5 and 2 mL) and mass-flow-controlled sampling (at 25, 50,100, and 200 mL) (CIA-Advantage system, Markes International Ltd) for selected compounds from the TO-15 canister standard, showing that a single curve can be fitted to both sets of points (method conditionsshown in Table 3).
TABLE 3: Analytical conditions.
TD conditions GC conditions MS conditions
Configuration: CIA-Advantageautomated canister analysis system(Markes International Ltd)Sampling: 0.5 and 2 mL samplescollected using 0.5 mL loop; 25, 50,100, and 200 mL sampled with MFCat 25 mL/min, with sampling timevaried to produce required volumeFlow path temperature: 150◦CFocusing trap: air toxics analysertype trapTrapping temperature: 25◦CCold trap desorption: 320◦C for3 min (5 : 1 split)Trap heating rate: 40◦C/s
Column: 60 m × 0.32 mm × 1.8 µm,624 type phaseOven: 40◦C (5 min), 5◦C/min to230◦C (0 min)Constant pressure: 10 psi
Source temperature: 230◦CQuadrupole temperature: 150◦CTransfer line temperature: 280◦CScan range: m/z 35–300
that these two methods were employed on the same platform. Combined with the low carryover illustratedin Figure 3, this indicates that it should be possible to extend the concentration range of automatic canisterair analysis, without fear of system contamination. One benefit of this is that it should allow prescreeningof unknown samples in order to optimise parameters for subsequent quantitative analysis.
Further tests were also carried out to evaluate whether or not this new capability could be usedto quantify trace- and high-level contaminants in a single, heated canister air sample (Figure 5). Whilecanisters are not the ideal sampling method for higher-boiling contaminants, they are occasionally appliedfor middle-distillate fuels by heating the canister during subsequent analysis (Note that the use of canistersfor higher-boiling contaminants is not covered by standard air monitoring methods and is not normallyrecommended. Given the static (unpurged) nature of canisters and the challenge of heating an entire canister
2586

TheScientificWorldJOURNAL (2011) 11, 2582–2598
× 104
30252015105
8 910 11
100 mL sample
2 mL sample7 ppm7.5 ppm6.6 ppm8 ppm
9.6 ppb0.6 ppb13.7 ppb20.2 ppb65.9 ppb22.7 ppb88.3 ppb
1 2-methylbutane2 2-pentene3 Hexane4 Methylcyclopentane5 Cyclohexane6 Benzene7 HeptaneQuantified using the 2 mL sample:
8 Decane9 1, 2, 3-trimethylbenzene10 Undecane11 Dpdecane
Quantified using the 100 mL sample:
1 2 34
5
6
7A
bun
dan
ce3.8e + 07
3.6e + 07
3.4e + 07
3.2e + 07
3e + 07
2.8e + 07
2.6e + 07
2.4e + 07
2.2e + 07
2e + 07
1.8e + 07
1.6e + 07
1.4e + 07
1.2e + 07
1e + 07
8000000
6000000
4000000
2000000
0
120150110105100
959085807570656055504540353025201510
5
Time (min)
5 6 7 8 9 10 11 12 13 14
FIGURE 5: High-concentration vapours from a light diesel fraction collected into a canister and analysedusing TD–GC/MS (CIA-Advantage system, Markes International Ltd); selected peaks are indicated and theirapproximate concentrations given. Black trace: 2 mL sample taken using a gas loop. Blue trace: 100 mLsample taken using an MFC. Inset: zoomed-in plot, demonstrating the greater sensitivity that results fromusing MFC sampling (method conditions are shown in Table 4).
TABLE 4: Analytical conditions.
TD conditions GC conditions MS conditions
Configuration: CIA-Advantageautomated canister analysis system(Markes International Ltd)Sampling: 2 mL (gas sample loop);100 mL (MFC)Flow path temperature: 150◦CFocusing trap: air toxics analysertype trapTrapping temperature: 25◦CCold trap desorption: 300◦C for3 min (7 : 1 split)Trap heating rate: 40◦C/s
Column: 60 m × 0.32 mm × 1.8 µm,624 type phaseOven: 40◦C (5 min) 10◦C/min to260◦C (10 min)Constant pressure: 10 psi
Source temperature: 230◦CQuadrupole temperature: 150◦CTransfer line temperature: 280◦CScan range: m/z 33–350
2587

TheScientificWorldJOURNAL (2011) 11, 2582–2598
assembly uniformly, recoveries of higher-boiling analytes invariably remain compromised.). In this case,vapours from a light diesel fraction were analysed first with a low-volume sample (2 mL, black trace) toquantify high-concentration components and then a larger sample volume (100 mL, blue trace) to analysetrace-level components.
2.2. Optimising Analysis of Low-Level Canister Air Samples
For trace-level target compounds, a large canister (6 L) is typically used to collect the sample, witha large volume (1 L) being introduced to the analytical instrument in order to achieve good limits ofdetection. Furthermore, for trace-level monitoring, it is important that the entire preconcentrated sampleis subsequently injected into the GC(MS) for maximum sensitivity. In this case, and as has been reportedpreviously, a narrow-bore focusing trap, offering high linear gas velocity through the trap during thedesorption/transfer to the GC column (Figure 1), helps ensure good peak shape for early-eluting compounds[1, 2], even under splitless conditions.
Historically, the detection of very low-level compounds in air (�1 ppb) was possible using sensitivedetectors specific for the compounds of interest—for example, flame photometric detection (FPD) providessignificantly improved sensitivity for sulfur-containing compounds [14]. Alternatively, the latest TDtrapping technology in combination with quadrupole MS in selected ion monitoring (SIM) mode canprovide very low detection levels [12] (Figure 6). However, in each of these cases, compound identificationrelies on a limited number of characteristic ions and stable retention times. In this mode, to improvesensitivity, the vast majority of the spectral data are lost, so full characterisation of the sample is rarelypossible in a single analysis.
Time-of-flight (TOF) MS detectors for GC overcome this limitation by monitoring all ionssimultaneously across the mass range. This makes them significantly more sensitive than scanning massspectrometers such as quadrupoles for collection of full spectral information. The sensitivity of TOFtechnology typically allows SIM-type detection limits to be achieved for very-low-level samples withoutsacrificing spectral information. Conversely, the sensitivity of TOF can also be harnessed to offer moreflexibility for “normal” ambient air monitoring applications. By allowing the collection of smaller samplevolumes, method detection limits are not compromised relative to quadrupole mass spectrometers used infull-scan mode. There are several advantages to analysing smaller canister air volumes. Smaller canistersare easier/cheaper to transport, and using smaller volumes allows more repeat analyses to be carried out ona single sample, if required. The use of smaller sample volumes also means that less water is introducedinto the system during analysis of humid samples.
Figure 7 shows that Freon 113 (present in the atmosphere at ca. 80 ppt) can be confidently identifiedin as little as 10 mL of semi-rural air using TD-GC-TOF MS. NB Freon 113 provides a useful atmospheric“internal standard,” as its lifetime in the atmosphere is about 90 years and it has a uniform distribution overthe globe.
Depending on analyte breakthrough volumes during focusing, another approach to improvingdetection limits may be to use a larger sample size. However, this would require larger canisters for samplecollection, with consequent implications for the cost of shipping and storage, and the ease of deployingthem in the field.
Recently, there has been a shift in the USA away from canisters, driven by growing interest incompounds that cannot be quantitatively or reliably recovered from canisters under real-world conditions(e.g., naphthalene). Sorbent tubes are now increasingly deployed, as they allow a much wider range ofcompounds to be analysed [15]. Sorbent tubes also provide greater sample stability as polar compounds areprone to adsorption onto the canister walls [16]. This can be avoided if the correct type of canister is usedthat is, fully passivated and not electropolished [17]. Studies have also shown that humidification of thesample provides longer holding times for the polar species [17].
2588

TheScientificWorldJOURNAL (2011) 11, 2582–2598
40000
20000
0
CF4
C2F6
1110.510
Abu
nda
nce
Time (min)
(a)
20000
10000
0
C2F6
Abu
nda
nce
1110.510
Time (min)
(b)
SF6
40000
20000
0
Abu
nda
nce
1110.510Time (min)
(c)
1110.510
Time (min)
N2O20000
10000
0
Abu
nda
nce
(d)
FIGURE 6: TD-GC/MS (SIM monitoring) chromatograms. Extracted-ion spectra for (a) CF4 (m/z 69, CF3);(b) C2F6 (m/z 119, C2F5); (c) SF6 (m/z 127, SF5); (d) N2O (m/z 30, NO) from a full-scan analysis of 25 mLof a 100 ppb gas standard [6].
3. NEW ADVANCES FOR AIR MONITORING USING SORBENT TUBES
3.1. Extending the VOC Sampling Range
Sorbent tubes offer numerous advantages for air monitoring, as they are easy to transport, compatible with awider range of compounds, and are inherently compatible with a much wider range of air sample volumes.They are also compatible with analytes over a much wider polarity and volatility range. As with focusingtraps (e.g., Figure 1), the sorbent combination can be varied according to the compounds of interest, with aseries of multiple sorbents being used to retain/release the widest range of compounds.
The choice of sorbent(s) principally depends upon the volatility (specifically the vapour pressure)of the analyte concerned. Appropriate sorbent selection and combination have been discussed elsewhere ingreater detail [1, 2]. However, for information, typical sorbents and their applicable analyte volatility rangeare shown in Table 6.
2589

TheScientificWorldJOURNAL (2011) 11, 2582–2598
Freon 113(Ca. 80 ppt)
m/z
150.7-151.7Signal-to-noise:
71 : 1
8 8.5
1
A
23 4
B
5
6
C D
7
(1) Freon 113 (2) Cyclohexane(3) 2-methylhexane(4) Benzene(5) Heptane(6) Toluene(7) Styrene
Internal standards:(A) Bromochloromethane(B) 1, 3-difluorobenzene(C) Chlorobenzene-d5(D) 4-bromofluorobenzene
05
101520253035404550556065707580
×105
5 10 15 20 25 30 35Time (min)
Abu
nda
nce
FIGURE 7: Total ion chromatogram showing splitless analysis of only 10 mL of semi-rural air using TD-GC/TOF MS (TD; CIA-Advantage system, Markes International Ltd, TOF MS; BenchTOF-dx ALMSCOInternational Ltd, UK). Inset: extracted-ion chromatogram for a characteristic fragment ion of Freon 113(present in the atmosphere at ca. 80 ppt). Method conditions are shown in Table 5.
TABLE 5: Analytical conditions.
TD conditions GC conditions TOF MS conditions
Configuration: CIA-Advantageautomated canister analysis system(Markes International Ltd)Sampling: 10 mL/min for 1 min(MFC)Flow path temperature: 150◦CCold trap: air toxics analyser typetrapTrapping temperature: 25◦CCold trap desorption: 300◦C for3 min (splitless)Trap heating rate: 40◦C/s
Column: 60 m × 0.32 mm × 1.8 µm,624 type phaseOven: 40◦C (5 min), 5◦C/min to230◦C (0 min)Constant pressure: 10 psi
Configuration: BenchTOF-dx(ALMSCO International Ltd, UK)Ion source heating: 240◦CTransfer line temperature: 240◦CAcquisition rate: 2 data points/s,(5000 spectra/data point)Mass range: m/z 35–500
By choosing an appropriate sorbent combination, a whole suite of compounds can be analysed usingonly one sorbent tube. One such example is the analysis of 62 air toxic compounds ranging in volatilityfrom freons to hexachloro-1,3-butadiene (Figure 8) collected onto a dual-bed sorbent tube.
3.2. Grab-Sampling for Sorbent Tubes
Sorbent tubes are typically used for time-weighted average air monitoring using diffusive (passive) or activesampling methods [1, 2]. Active sampling traditionally requires some form of calibrated pump—either
2590

TheScientificWorldJOURNAL (2011) 11, 2582–2598
TABLE 6: Popular sorbents and their respective volatility ranges.
Sorbent name Volatility range
Quartz wool/silica beads C30–C40
Tenax TA C7–C30
Carbograph 2TD C8–C20
Carbograph 1TD C5/6–C14
Carbograph 5TD C3/4–C8
Carboxen 1003 C2–C5
Carbosieve SIII C2–C5
Carbon disulfide
Methyl-isobutyl ketone
Methyl-n-butyl ketone
Hexachloro-1,3-butadiene
Dichlorobenzene
0123456789
1011
405 10 15 20 25 30 35
×105
FIGURE 8: Sample equivalent to 1 L of a 2 ppb standard sampled using dual-bed sorbent tubesand analysed splitless using two-stage thermal desorption (TD-100, Markes International Ltd), methodconditions shown in Table 7.
constant-pressure- or constant-flow-type pump. However, simpler active sampling options are now availablefor “grab sampling” of air/gas volumes up to a few hundred millilitres. Key applications for grab samplingon to sorbent tubes include some industrial emissions (flue gas) measurements, landfill gases [18], andmonitoring exhaled breath (e.g., for biological exposure assessment [19]).
Appropriate devices include piston-type pumps or even large gas syringes, which can be coupled tothe nonsampling end of tubes, allowing air to be pulled through the sorbent tube as the plunger is withdrawn.Piston pumps are capable of sampling either large sample volumes for trace-level compounds or smallsample volumes for high-concentration compounds. The sample size taken depends on the concentrationof the compound(s) of interest and the detection method. Figure 9 compares the analysis of two identicallaboratory air samples, one “grab sampled” using a piston pump and one collected using a standard constant-flow pump both samples were collected on multi-bed sorbent tubes.
3.3. Benefits of Small Sample Volumes for Sorbent Tubes Using Piston Pump Sampling
Piston pumps facilitate rapid collection of small volumes of air or gas and offer advantages to many airmonitoring applications. For example, low sample volumes reduce the risk of volatile components breakingthrough the sorbent bed during sampling. They also minimise water retention. Sensitive analytical detectorssuch as TOF MS can be used to maintain required detection limits.
Figure 10 shows analysis of a small volume of air collected near the exhaust of a diesel car using amulti-bed sorbent tube and a piston pump. Note that the type of sorbent tube used in this case is usuallyrated for C4/5 to C30, but compounds as light as propene were quantitatively retained.
2591

TheScientificWorldJOURNAL (2011) 11, 2582–2598
TABLE 7: Sampling and analytical conditions.
TD conditions GC conditions MS conditions
Configuration: TD-100 forautomated tube desorption (MarkesInternational Ltd)Flow path temperature: 150◦CCold trap: air toxics analyser typetrapTrapping temperature: 25◦CCold trap desorption: 300◦C for3 min (10 : 1 split)Trap heating rate: 40◦C/s
Column: 60 m × 0.32 mm × 1.8 µm,624 type phaseOven: 40◦C (5 min), 5◦C/min to230◦C (0 min)Constant pressure: 10 psi
Source temperature: 230◦CQuadrupole temperature: 150◦CTransfer line temperature: 280◦CScan range: m/z 33–350
Sampling: 1 L pumped sampling onto a dual-bed sorbent tube.
Isobutane2-methyl pentane
3-methyl hexane
D-limonene
Tetradecane
Heptane
4 6 8 10 12 14 16 18
1816141210
86420−2−4−6−8−10−12−14−16
×105
FIGURE 9: Comparison of results from two identical 1 L laboratory air samples, one collected using aconstant-flow pump (black) and the other collected using piston pump (blue), analysed by TD–GC/MS (TD-100, Markes International Ltd), method conditions shown in Table 8.
TABLE 8: Sampling and analytical conditions.
TD conditions GC conditions MS conditions
Configuration: TD-100 forautomated tube desorption (MarkesInternational Ltd)Flow path temperature: 150◦CCold trap: air toxics analyser typetrapTrapping temperature: 25◦CCold trap desorption: 300◦C for3 min (10 : 1 split)Trap heating rate: 40◦C/s
Column: 60 m × 0.32 mm × 1.8 µm,624 type phaseOven: 40◦C (5 min), 5◦C/min to230◦C (0 min)Constant pressure: 10 psi
Source temperature: 230◦CQuadrupole temperature: 150◦CTransfer line temperature: 280◦CScan range: m/z 33–350
Sampling: Sample 1 (black trace): 1 L of sample pumped onto multi-bed tubes using a constant-flow pump at 100 mL/min for 10 min; Sample 2(blue trace): 1 L sampled onto a multi-bed tube, using ten pulls of a piston pump set at 100 mL per pull.
2592
TheScientificWorldJOURNAL (2011) 11, 2582–2598
Abu
nda
nce
9e+07
8.5e+07
8e+07
7.5e+07
7e+07
6.5e+07
6e+07
5.5e+07
5e+07
4.5e+07
4e+07
3.5e+07
3e+07
2.5e+07
2e+07
1.5e+07
1e+07
5000000
Propene
0
Naphthalene
Methylnaphthalenes
Time
105 15 20 25 30 35
FIGURE 10: Chromatogram of a 50 mL sample of air taken near a diesel exhaust, analysed using TD-GC/TOF MS (TD; TD-100, Markes International Ltd, TOF MS; BenchTOF-dx, ALMSCO International Ltd,UK). Note the quantitative retention of C3 hydrocarbons on a tube rated for C4/5 to C30. Method conditionsshown in Table 9.
TABLE 9: Sampling and analytical conditions.
TD conditions GC conditions TOF MS conditions
Configuration: TD-100 forautomated tube desorption (MarkesInternational Ltd)Flow path temperature: 180◦CCold trap: air toxics analyser typetrapTrapping temperature: 25◦CCold trap desorption: 300◦C for3 min (10 : 1 split)Trap heating rate: 40◦C/s
Column: 60 m × 0.32 mm × 1.8 µm,624 type phaseOven: 35◦C (5 min), 5◦C/min to230◦C (0 min)Constant flow: 1.7 mL/min at 35◦C
Configuration: BenchTOF-dx(ALMSCO International Ltd, UK)Ion source heating: 240◦CTransfer line temperature: 240◦CAcquisition rate: 2 data points/s,(5000 spectra/data point)Mass range: m/z 10–500
Sampling: 50 mL sample taken onto a dual-bed sorbent tube using one pull of the piston pump set at 50 mL per pull.
Ambient air monitoring procedures using TD-GC with conventional quadrupole MS technology inscan mode have typically required splitless analysis of sample volumes in the order of 1 L to reach thedetection limits required by the standard methods [3, 20]. However, unless care is taken to selectivelyeliminate water [21, 22], particularly when monitoring humid atmospheres using tubes containing strongsorbents, such large air sample volumes could lead to the transfer of relatively large quantities ofwater (>500 µg) into the chromatographic system. Potential adverse analytical effects could then includesplit discrimination, shifting retention times, variable detector response, or masking of high-volatilitycompounds. A combination of small sample volumes and high-sensitivity TOF MS detection overcomesthese issues.
Figure 11 shows the analysis of 500 mL of a 4 ppb-level standard of volatile hydrocarbons.The sample was analysed using TD-GC with three different detection techniques—a quadrupole massspectrometer in full-scan and SIM mode, and a TOF mass spectrometer. The split flow was recollected
2593
TheScientificWorldJOURNAL (2011) 11, 2582–2598
Detection method
Full scan (quad)
SIM (quad)
BenchTOFTM
S/N
15 : 1
200 : 1
1500 : 1
SIM (quadrupole)
Full scan (quadrupole)
Time-of-flight
Isoprene
40
6 8 10 12 14 16 18 20 22 24 26 28 30 32
7.4 7.6 7.8
323028262422201816141210
86420
2.8e+07
2.6e+07
2.4e+07
2.2e+07
2e+07
1.8e+07
1.6e+07
1.4e+07
1.2e+07
8000000
6000000
4000000
2000000
×104
1e+07
FIGURE 11: 500 mL of a 4 ppb level hydrocarbon standard collected on a multi-bed tube using apiston pump and analysed by TD-GC/MS (TD-100, Markes International Ltd), using a quadrupole massspectrometer (full scan, blue; SIM, red) and a TOF mass spectrometer (black—BenchTOF-dx ALMSCOInternational Ltd, UK). Table inset shows the root-mean-square (RMS) signal-to-noise ratio (S/N) forisoprene using the ion at m/z 67. The inset shows extracted-ion m/z 67 for 260 pg of isoprene on column,showing excellent peak shape and a signal-to-noise ratio for TOF MS implying a detection limit for isopreneof �10 ppt under the conditions used. Method conditions are shown in Table 10.
onto a clean sorbent tube during each run to facilitate repeat analysis of the same sample by each of thedetection methods. Three different detection techniques were chosen to show the enhancement in sensitivitythat occurs when using TOF detection. Published specifications of quadrupole analysers have signal-to-noise ratios for octafluoronaphthalene (OFN) between 160 : 1–450 : 1 for full-scan mode, and however, thisdepends on the mass range that was chosen when the signal-to-noise check was performed. A general signal-to-noise value for quadrupoles tends to be 400 : 1 for a mass range 50 to 400 m/z. Just as quadrupoles differin sensitivity so do TOF instruments and published specifications for OFN signal to noise range from 10 : 1to 800 : 1. The instrument used in this paper has a published specification for OFN signal to noise of 800 : 1over 1–1000 m/z.
2594
TheScientificWorldJOURNAL (2011) 11, 2582–2598
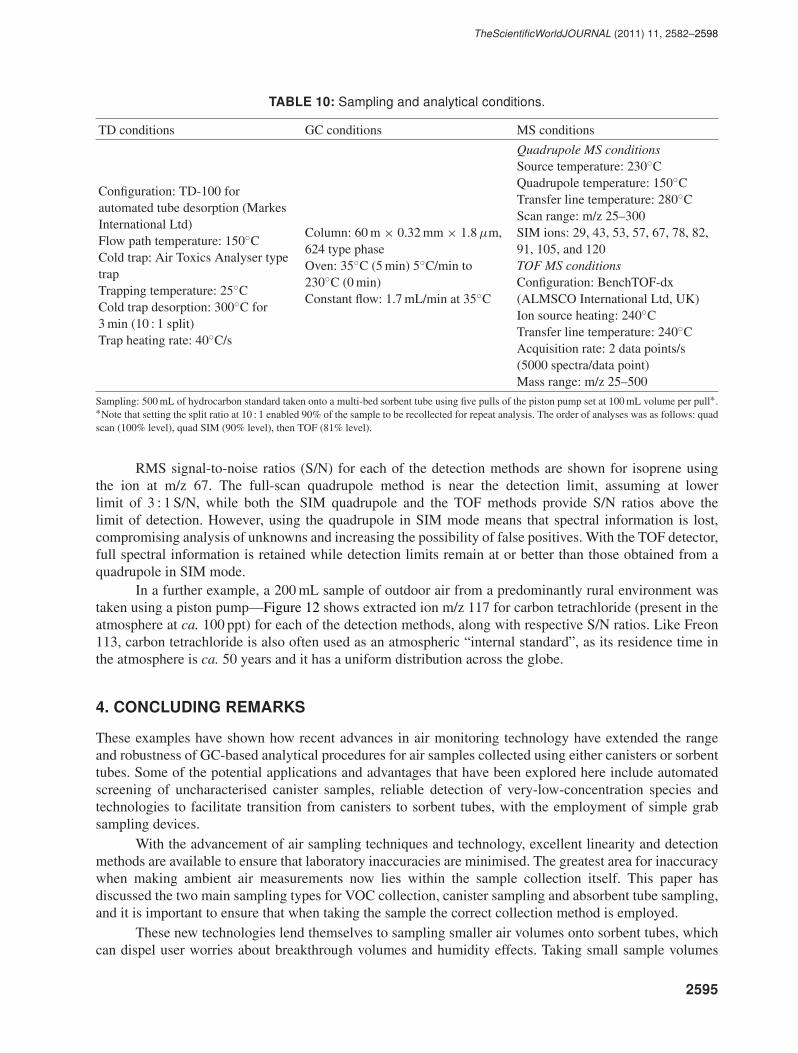
TABLE 10: Sampling and analytical conditions.
TD conditions GC conditions MS conditions
Configuration: TD-100 forautomated tube desorption (MarkesInternational Ltd)Flow path temperature: 150◦CCold trap: Air Toxics Analyser typetrapTrapping temperature: 25◦CCold trap desorption: 300◦C for3 min (10 : 1 split)Trap heating rate: 40◦C/s
Column: 60 m × 0.32 mm × 1.8 µm,624 type phaseOven: 35◦C (5 min) 5◦C/min to230◦C (0 min)Constant flow: 1.7 mL/min at 35◦C
Quadrupole MS conditionsSource temperature: 230◦CQuadrupole temperature: 150◦CTransfer line temperature: 280◦CScan range: m/z 25–300SIM ions: 29, 43, 53, 57, 67, 78, 82,91, 105, and 120TOF MS conditionsConfiguration: BenchTOF-dx(ALMSCO International Ltd, UK)Ion source heating: 240◦CTransfer line temperature: 240◦CAcquisition rate: 2 data points/s(5000 spectra/data point)Mass range: m/z 25–500
Sampling: 500 mL of hydrocarbon standard taken onto a multi-bed sorbent tube using five pulls of the piston pump set at 100 mL volume per pull∗.∗Note that setting the split ratio at 10 : 1 enabled 90% of the sample to be recollected for repeat analysis. The order of analyses was as follows: quadscan (100% level), quad SIM (90% level), then TOF (81% level).
RMS signal-to-noise ratios (S/N) for each of the detection methods are shown for isoprene usingthe ion at m/z 67. The full-scan quadrupole method is near the detection limit, assuming at lowerlimit of 3 : 1 S/N, while both the SIM quadrupole and the TOF methods provide S/N ratios above thelimit of detection. However, using the quadrupole in SIM mode means that spectral information is lost,compromising analysis of unknowns and increasing the possibility of false positives. With the TOF detector,full spectral information is retained while detection limits remain at or better than those obtained from aquadrupole in SIM mode.
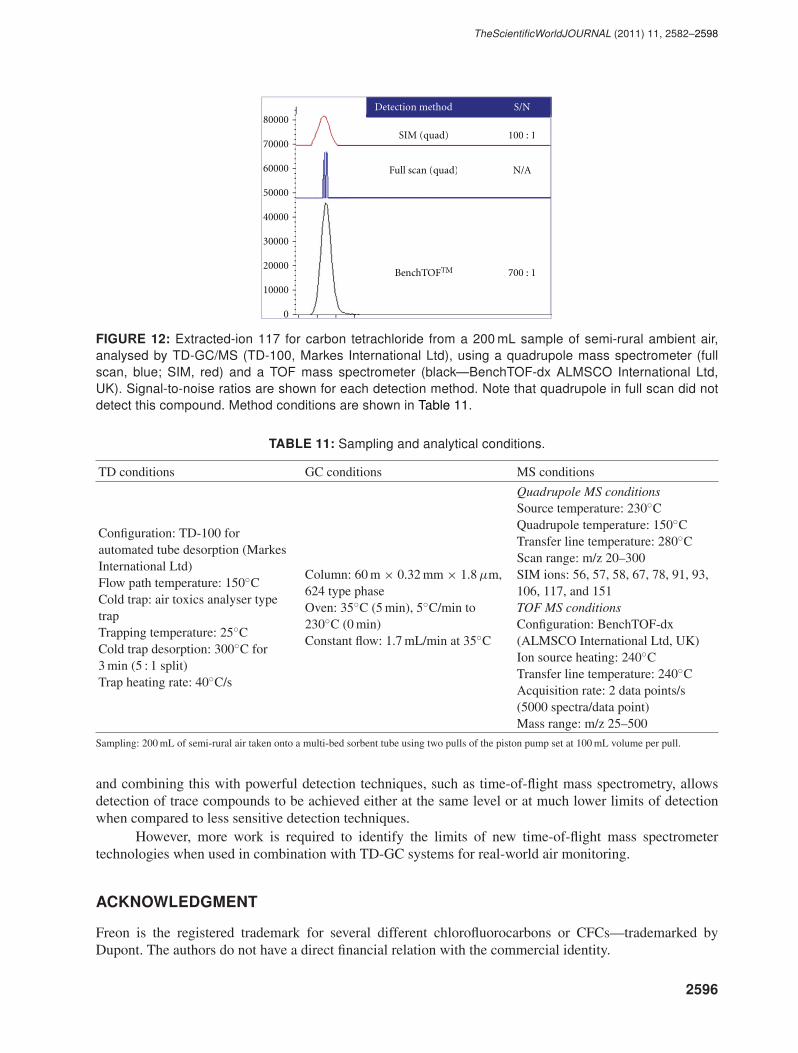
In a further example, a 200 mL sample of outdoor air from a predominantly rural environment wastaken using a piston pump—Figure 12 shows extracted ion m/z 117 for carbon tetrachloride (present in theatmosphere at ca. 100 ppt) for each of the detection methods, along with respective S/N ratios. Like Freon113, carbon tetrachloride is also often used as an atmospheric “internal standard”, as its residence time inthe atmosphere is ca. 50 years and it has a uniform distribution across the globe.
4. CONCLUDING REMARKS
These examples have shown how recent advances in air monitoring technology have extended the rangeand robustness of GC-based analytical procedures for air samples collected using either canisters or sorbenttubes. Some of the potential applications and advantages that have been explored here include automatedscreening of uncharacterised canister samples, reliable detection of very-low-concentration species andtechnologies to facilitate transition from canisters to sorbent tubes, with the employment of simple grabsampling devices.
With the advancement of air sampling techniques and technology, excellent linearity and detectionmethods are available to ensure that laboratory inaccuracies are minimised. The greatest area for inaccuracywhen making ambient air measurements now lies within the sample collection itself. This paper hasdiscussed the two main sampling types for VOC collection, canister sampling and absorbent tube sampling,and it is important to ensure that when taking the sample the correct collection method is employed.
These new technologies lend themselves to sampling smaller air volumes onto sorbent tubes, whichcan dispel user worries about breakthrough volumes and humidity effects. Taking small sample volumes
2595
TheScientificWorldJOURNAL (2011) 11, 2582–2598
80000
70000
60000
50000
40000
30000
20000
10000
0
100 : 1
N/A
700 : 1
Detection method
Full scan (quad)
SIM (quad)
BenchTOFTM
S/N
100 : 1
N/A
700 : 1
Full scan (quad)
SIM (quad)
BenchTOFTM
FIGURE 12: Extracted-ion 117 for carbon tetrachloride from a 200 mL sample of semi-rural ambient air,analysed by TD-GC/MS (TD-100, Markes International Ltd), using a quadrupole mass spectrometer (fullscan, blue; SIM, red) and a TOF mass spectrometer (black—BenchTOF-dx ALMSCO International Ltd,UK). Signal-to-noise ratios are shown for each detection method. Note that quadrupole in full scan did notdetect this compound. Method conditions are shown in Table 11.
TABLE 11: Sampling and analytical conditions.
TD conditions GC conditions MS conditions
Configuration: TD-100 forautomated tube desorption (MarkesInternational Ltd)Flow path temperature: 150◦CCold trap: air toxics analyser typetrapTrapping temperature: 25◦CCold trap desorption: 300◦C for3 min (5 : 1 split)Trap heating rate: 40◦C/s
Column: 60 m × 0.32 mm × 1.8 µm,624 type phaseOven: 35◦C (5 min), 5◦C/min to230◦C (0 min)Constant flow: 1.7 mL/min at 35◦C
Quadrupole MS conditionsSource temperature: 230◦CQuadrupole temperature: 150◦CTransfer line temperature: 280◦CScan range: m/z 20–300SIM ions: 56, 57, 58, 67, 78, 91, 93,106, 117, and 151TOF MS conditionsConfiguration: BenchTOF-dx(ALMSCO International Ltd, UK)Ion source heating: 240◦CTransfer line temperature: 240◦CAcquisition rate: 2 data points/s(5000 spectra/data point)Mass range: m/z 25–500
Sampling: 200 mL of semi-rural air taken onto a multi-bed sorbent tube using two pulls of the piston pump set at 100 mL volume per pull.
and combining this with powerful detection techniques, such as time-of-flight mass spectrometry, allowsdetection of trace compounds to be achieved either at the same level or at much lower limits of detectionwhen compared to less sensitive detection techniques.
However, more work is required to identify the limits of new time-of-flight mass spectrometertechnologies when used in combination with TD-GC systems for real-world air monitoring.
ACKNOWLEDGMENT
Freon is the registered trademark for several different chlorofluorocarbons or CFCs—trademarked byDupont. The authors do not have a direct financial relation with the commercial identity.
2596

TheScientificWorldJOURNAL (2011) 11, 2582–2598
REFERENCES
[1] E. Woolfenden, “Sorbent-based sampling methods for volatile and semi-volatile organic compounds in air—part1: sorbent-based air monitoring options,” Journal of Chromatography A, vol. 1217, no. 16, pp. 2674–2684, 2010.
[2] E. Woolfenden, “Sorbent-based sampling methods for volatile and semi-volatile organic compounds in air—part2. Sorbent selection and other aspects of optimizing air monitoring methods,” Journal of Chromatography A, vol.1217, no. 16, pp. 2685–2694, 2010.
[3] US EPA Method TO-15, The determination of volatile organic compounds (VOCs) in air collected in SUMMA�passivated canisters and analyzed by gas chromatography/mass spectrometry.
[4] Y. Liu, M. Shao, L. Fu, S. Lu, L. Zeng, and D. Tang, “Source profiles of volatile organic compounds (VOCs)measured in China—part I,” Atmospheric Environment, vol. 42, no. 25, pp. 6247–6260, 2008.
[5] ASTM D5466-95 Standard test method for determination of volatile organic chemicals in atmospheres (Canistersampling methodology).
[6] P. Ciccioli, “VOC in European countries: sampling, determination and monitoring strategies,” in Proceedingsof the Workshop on VOC Assessment and Evaluation, H. T. Bloemen and J. Burn, Eds., pp. 122–143, RIVM,Amersfoort, The Netherlands, 1993.
[7] X. L. Cao and N. C. Hewitt, “The sampling and analysis of volatile organic compounds in the atmosphere,” inReactive Hydrocarbons in the Atmosphere, N. C. Hewitt, Ed., pp. 199–157, Academic Press, San Diego, Calif,USA, 1999.
[8] EN ISO 16017 Air quality, Sampling and analysis of volatile organic compounds in ambient air, indoor air andworkplace air by sorbent tube/thermal desorption/capillary gas chromatography. Part 1: Pumped sampling andPart 2: Diffusive sampling.
[9] US EPA publication: Technical assistance document for sampling and analysis of ozone precursors. EPA/600-R-98/161.
[10] K. H. Kim, Y. Choi, E. Jeon, and Y. Sunwoo, “Characterization of malodorous sulfur compounds in landfill gas,”Atmospheric Environment, vol. 39, no. 6, pp. 1103–1112, 2005.
[11] K. P. Song, J.-S. Han, M.-D. Lee et al., “A study of quality assurance/quality control between institutions forreduced sulfur compounds in the ambient air using cryofocusing thermal desorber with GC/PFPD,” KoreanJournal of Odor Research and Engineering, vol. 6, pp. 33–39, 2007.
[12] D. Wevill, “The use of a thermal desorption system as a cryogen-free method for the monitoring of tracegreenhouse gases in air,” Labmate, vol. 34, no. 7, 2009.
[13] I. A. Bowles and L. Burt, “Method for the determination of air-phase petroleum hydrocarbons (APH),”Massachusetts Department of Environmental Protection, 2009.
[14] K. H. Kim, D. W. Ju, and S. W. Joo, “The evaluation of recovery rate associated with the use of thermal desorptionsystems for the analysis of atmospheric reduced sulfur compounds (RSC) using the GC/PFPD method,” Talanta,vol. 67, no. 5, pp. 955–959, 2005.
[15] H. C. Hayes, D. J. Benton, S. Grewal, and N. Khan, “Evaluation of sorbent methodology for petroleum impactedsite investigations,” in Proceedings of the Air and Waste Management Association conference on Vapor Intrusion,2007.
[16] R. W. Coutant, “Theoretical Evaluation of Stability of Volatile Organic Chemicals and Polar Volatile OrganicChemicals in Canisters,” EPA Contract 68-DO-0007, Environmental Protection Agency, 1993.
[17] T. J. Kelly, P. J. Callahan, J. Pleil, and G. F. Evans, “Method development and field measurements for polarvolatile organic compounds in ambient air,” Environmental Science and Technology, vol. 27, no. 6, pp. 1146–1153, 1993.
[18] UK Environment Agency Publication, Guidance for monitoring trace components in landfill gas, Ref: LFTGN04, 2004.
[19] D. Dyne, J. Cocker, and H. K. Wilson, “A novel device for capturing breath samples for solvent analysis,” Scienceof the Total Environment, vol. 199, no. 1-2, pp. 83–89, 1997.
[20] US EPA Method TO-17, Determination of volatile organic compounds in ambient air using active sampling onto sorbent tubes.
2597

TheScientificWorldJOURNAL (2011) 11, 2582–2598
[21] J. Gawlowski, T. Gierczak, E. Pietruszynska, M. Gawrys, and J. Niedzielski, “Dry purge for the removal of waterfrom the solid sorbents used to sample volatile organic compounds from the atmospheric air,” Analyst, vol. 125,no. 11, pp. 2112–2117, 2000.
[22] M. Gawrys, P. Fastyn, J. Gawłowski, T. Gierczak, and J. Niedzielski, “Prevention of water vapour adsorption bycarbon molecular sieves in sampling humid gases,” Journal of Chromatography A, vol. 933, no. 1-2, pp. 107–116,2001.
This article should be cited as follows:
Nicola Watson, Stephen Davies, and David Wevill, “Air Monitoring: New Advances in Sampling andDetection,” TheScientificWorldJOURNAL, vol. 11, pp. 2582–2598, 2011.
2598

Submit your manuscripts athttp://www.hindawi.com
Hindawi Publishing Corporationhttp://www.hindawi.com Volume 2014
ClimatologyJournal of
EcologyInternational Journal of
Hindawi Publishing Corporationhttp://www.hindawi.com Volume 2014
EarthquakesJournal of
Hindawi Publishing Corporationhttp://www.hindawi.com Volume 2014
Hindawi Publishing Corporationhttp://www.hindawi.com
Applied &EnvironmentalSoil Science
Volume 2014
Mining
Hindawi Publishing Corporationhttp://www.hindawi.com Volume 2014
Journal of
Hindawi Publishing Corporation http://www.hindawi.com Volume 2014
International Journal of
Geophysics
OceanographyInternational Journal of
Hindawi Publishing Corporationhttp://www.hindawi.com Volume 2014
Journal of Computational Environmental SciencesHindawi Publishing Corporationhttp://www.hindawi.com Volume 2014
Journal ofPetroleum Engineering
Hindawi Publishing Corporationhttp://www.hindawi.com Volume 2014
GeochemistryHindawi Publishing Corporationhttp://www.hindawi.com Volume 2014
Journal of
Atmospheric SciencesInternational Journal of
Hindawi Publishing Corporationhttp://www.hindawi.com Volume 2014
OceanographyHindawi Publishing Corporationhttp://www.hindawi.com Volume 2014
Advances in
Hindawi Publishing Corporationhttp://www.hindawi.com Volume 2014
MineralogyInternational Journal of
Hindawi Publishing Corporationhttp://www.hindawi.com Volume 2014
MeteorologyAdvances in
The Scientific World JournalHindawi Publishing Corporation http://www.hindawi.com Volume 2014
Paleontology JournalHindawi Publishing Corporationhttp://www.hindawi.com Volume 2014
ScientificaHindawi Publishing Corporationhttp://www.hindawi.com Volume 2014
Hindawi Publishing Corporationhttp://www.hindawi.com Volume 2014
Geological ResearchJournal of
Hindawi Publishing Corporationhttp://www.hindawi.com Volume 2014
Geology Advances in