Embed Size (px)
Citation preview

Final Report Health IT Hazard Manager Beta-Test
Prepared for: Agency for Healthcare Research and Quality 540 Gaither Road Rockville, MD 20850 www.ahrq.gov
Contract No. HHSA290200600011i, #14
Prepared by: Abt Associates and Geisinger Health System
Contributing Authors: James M. Walker, M.D., Principal Investigator; Geisinger Health System Andrea Hassol, M.S.P.H., Project Director; Abt Associates Inc. Bethany Bradshaw, Associate Analyst; Abt Associates Inc. Michael E. Rezaee, M.P.H., Analyst; Abt Associates Inc.
AHRQ Publication No. 12-0058-EF May 2012


This document is in the public domain and may be used and reprinted without permission except those copyrighted materials that are clearly noted in the document. Further reproduction of those copyrighted materials is prohibited without the specific permission of copyright holders.
Acknowledgments
The authors would like to gratefully acknowledge the contributions of the study test sites and vendors who participated, and the support and guidance of Kevin Chaney, Dr. Jonathan White, and Dr. Amy Helwig of the Agency for Healthcare Research and Quality, as well as Kathy Kenyon of the Office of the National Coordinator for Health IT.
Suggested Citation
Walker JM, Hassol A, Bradshaw B, Rezaee ME. Health IT Hazard Manager Beta-Test: Final Report. (Prepared by Abt Associates and Geisinger Health System, under Contract No. HHSA290200600011i, #14). AHRQ Publication No. 12-0058-EF. Rockville, MD: Agency for Health care Research and Quality. May 2012.
None of the investigators has any affiliations or financial involvement that conflicts with the material presented in this report.
This project was funded by the Agency for Healthcare Research and Quality (AHRQ), U.S. Department of Health and Human Services. The opinions expressed in this document are those of the authors and do not reflect the official position of AHRQ or the U.S. Department of Health and Human Services.


i
Contents
Executive Summary ...................................................................................................... 1
1.0 Background ......................................................................................................... 31.1 What Are Health IT Hazards and Why Do They Matter? ...................................... 31.2 A Health IT Safety Learning Community .............................................................. 6
2.0 Hazard Manager Development and Beta-test ................................................... 92.1 Hazard Manager Ontology ...................................................................................... 92.2 Beta Version Hazard Manager Design and Programming .................................... 11
Public and Private Fields ...................................................................................... 11System Security .................................................................................................... 12
2.3 Hazard Manager Beta-test ..................................................................................... 13Beta-test Participants ............................................................................................ 13Qualitative Analysis .............................................................................................. 14Descriptive Analysis of 495 Hazards .................................................................... 16All-project Meeting ............................................................................................... 17
3.0 Hazard Manager Version 2.0 ............................................................................ 193.1 Registration ........................................................................................................... 19
User Profile ........................................................................................................... 19Organization Profile .............................................................................................. 20Systems Involved .................................................................................................. 21
3.2 Discovery .............................................................................................................. 22Discovery Date and Time ..................................................................................... 22How Was the Hazard Discovered? ....................................................................... 24Was the Hazard Associated with a Shift Change? ................................................ 25Stage of Discovery ................................................................................................ 26How Long Has the Hazard Existed in the System? .............................................. 26How Was the Hazard Shared or Communicated? ................................................. 27
3.3 Hazard Causation .................................................................................................. 28Beta Version Causation Categories ...................................................................... 30Software Design .................................................................................................... 31Usability ................................................................................................................ 33Data Quality .......................................................................................................... 36

ii
Clinical Decision Support ..................................................................................... 38Other User Characteristics .................................................................................... 39Other Organizational Characteristics .................................................................... 41Implementation ..................................................................................................... 42Hardware ............................................................................................................... 44Hazard Manager 2.0 Causation Categories and Characteristics ........................... 44
3.4 Impact ................................................................................................................... 45Establishing Whether a Hazard Affected the Process of Care .............................. 48Potential for Patient Harm .................................................................................... 48Patient Harm ......................................................................................................... 49Date and Time When Harm was Identified .......................................................... 50
3.5 Hazard Control Plan .............................................................................................. 50Control Steps ......................................................................................................... 50Hazard Action Plan and Urgency ......................................................................... 53Completeness of Resolution ................................................................................. 54
3.6 Hazard Control Plan Approval .............................................................................. 553.7 Notes and References ............................................................................................ 58
4.0 Additional Insights ........................................................................................... 594.1 Vendor Perspectives .............................................................................................. 594.2 Use Cases for the Health IT Hazard Manager ...................................................... 60
Care Delivery Organizations ................................................................................. 60Vendors ................................................................................................................. 61Policymakers and Regulators ................................................................................ 61
5.0 Policy Implications and Next Steps ................................................................ 63Effects on the Pace of Health IT Development and Meaningful Use ................... 65
References ................................................................................................................... 67

iii
Exhibits
Exhibit 1. Proactive hazard control ................................................................................................. 4Exhibit 2. Hazard manager user permissions ................................................................................ 12Exhibit 3. Systems involved ......................................................................................................... 21Exhibit 4. Hazard manager 2.0 discovery tab ............................................................................... 23Exhibit 5. Hazard discovery questions in hazard manager 2.0 and hazard manager beta version 24Exhibit 6. “How was the hazard published?” ............................................................................... 27Exhibit 7. Hazard Manager 2.0 causation tab ............................................................................... 29Exhibit 8. Contributory causes of the 495 beta test hazards ......................................................... 30Exhibit 9. Software design characteristics of the 258 hazards to which software design
contributed ................................................................................................................... 31Exhibit 10: Faulty design selected as a contributing characteristic in inter-rater test scenarios .. 32Exhibit 11. Percent of hazards with one or more usability characteristics by study site .............. 34Exhibit 12. Characteristics of the 246 hazards with usability characteristics ............................... 35Exhibit 13. Characteristics of the 130 hazards with data quality characteristics .......................... 37Exhibit 14. Characteristics of the 80 hazards with CDS characteristics ....................................... 38Exhibit 15. Characteristics of the 84 hazards with other user characteristics ............................... 39Exhibit 16. Unforced user error selected as a contributing characteristic in inter-rater test
scenarios ..................................................................................................................... 40Exhibit 17. Characteristics of the 131 hazards with other organizational factors characteristics . 42Exhibit 18. Characteristics of the 45 hazards with Implementation characteristics ..................... 43Exhibit 19. Screenshot of hazard manager 2.0 impact tab for hazards that have not affected a care
process ........................................................................................................................ 46Exhibit 20. Screenshot of hazard manager 2.0 impact tab for hazards that have affected a care
process ........................................................................................................................ 47Exhibit 21. A screenshot of the hazard manager 2.0 hazard control plan tab ............................... 51Exhibit 22. Screenshot of the hazard manager plan approval ....................................................... 56Exhibit 23. Selected departments for the 495 hazards with vetting or mitigation entries ............ 57
Appendixes (provided electronically)
Appendix A. Beta Test Hazard and Revised Hazard Manager Appendix B. Revised Hazard Manager Ontology Appendix C. Descriptive Analysis Appendix D. Relational Analysis Results Appendix E. Inter-Rater Cognitive Testing Results Appendix F. “Other (Specify)” Entries

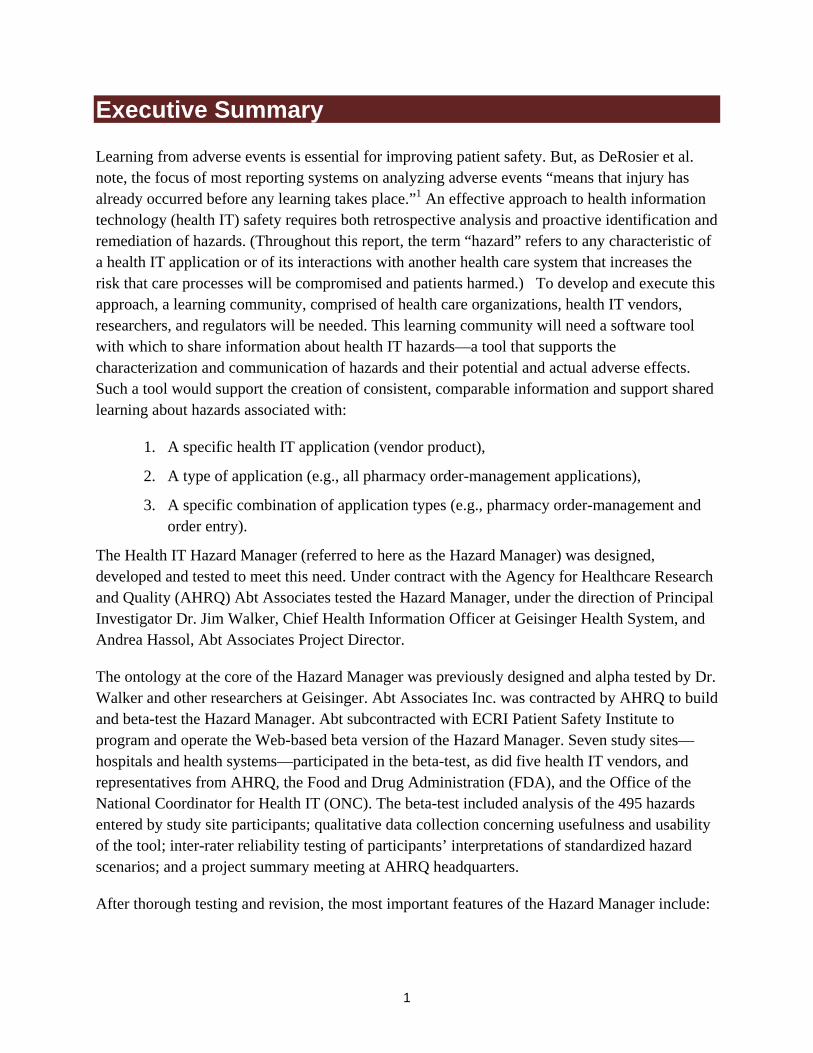
1
Executive Summary
Learning from adverse events is essential for improving patient safety. But, as DeRosier et al. note, the focus of most reporting systems on analyzing adverse events “means that injury has already occurred before any learning takes place.”1
1. A specific health IT application (vendor product),
An effective approach to health information technology (health IT) safety requires both retrospective analysis and proactive identification and remediation of hazards. (Throughout this report, the term “hazard” refers to any characteristic of a health IT application or of its interactions with another health care system that increases the risk that care processes will be compromised and patients harmed.) To develop and execute this approach, a learning community, comprised of health care organizations, health IT vendors, researchers, and regulators will be needed. This learning community will need a software tool with which to share information about health IT hazards—a tool that supports the characterization and communication of hazards and their potential and actual adverse effects. Such a tool would support the creation of consistent, comparable information and support shared learning about hazards associated with:
2. A type of application (e.g., all pharmacy order-management applications),
3. A specific combination of application types (e.g., pharmacy order-management and order entry).
The Health IT Hazard Manager (referred to here as the Hazard Manager) was designed, developed and tested to meet this need. Under contract with the Agency for Healthcare Research and Quality (AHRQ) Abt Associates tested the Hazard Manager, under the direction of Principal Investigator Dr. Jim Walker, Chief Health Information Officer at Geisinger Health System, and Andrea Hassol, Abt Associates Project Director.
The ontology at the core of the Hazard Manager was previously designed and alpha tested by Dr. Walker and other researchers at Geisinger. Abt Associates Inc. was contracted by AHRQ to build and beta-test the Hazard Manager. Abt subcontracted with ECRI Patient Safety Institute to program and operate the Web-based beta version of the Hazard Manager. Seven study sites—hospitals and health systems—participated in the beta-test, as did five health IT vendors, and representatives from AHRQ, the Food and Drug Administration (FDA), and the Office of the National Coordinator for Health IT (ONC). The beta-test included analysis of the 495 hazards entered by study site participants; qualitative data collection concerning usefulness and usability of the tool; inter-rater reliability testing of participants’ interpretations of standardized hazard scenarios; and a project summary meeting at AHRQ headquarters.
After thorough testing and revision, the most important features of the Hazard Manager include:

2
• A clear focus on how hazards are discovered, including the point in the health IT lifecycle in which a hazard is identified, how it is discovered, and how information about a hazard is shared within and beyond a care delivery organization (CDO) (e.g., which hazards are communicated to the vendors involved).
• Explication of the many causes that alone or in combination lead to health IT hazards, including distinct software design flaws that contribute to hazards, and the absence of effective IT protections that would help users avoid errors (of omission and commission).
• Information about the impact of hazards—which hazards are noticed before care is affected, which compromise the process of care delivery, which harm patients—as well as the type, severity and duration of patient harm. For hazards that have not yet caused harm, the Hazard Manager supports estimation of the potential for harm, including the number of patients that could be affected and the likelihood that an alert user would notice the hazard before a patient was harmed.
• Detailed information about the urgency of hazard correction and the steps taken to correct or mitigate a hazard. The departments that need to approve a hazard control plan, and the departments responsible for carrying out that plan, can also be recorded.
In future Federal deliberations about deployment of the health IT Hazard Manager as part of a national infrastructure for monitoring and improving health IT safety, there will be four important considerations:
1. Data aggregation at multiple levels: enabling CDOs (and health IT vendors and researchers) to learn from their own experience, from the experience of others using the same combination of vendor applications that they do, and from the experience of all health IT users.
2. Version Control: ensuring that all participants have access to the same version of the Hazard Manager’s ontology.
3. Confidentiality: determining whether and to what extent CDOs and vendors who report hazards to the system should have their confidentiality protected.
4. Access to detailed information: confidential brokering of requests between those wanting more information about a hazard and the organization that reported the hazard.
Several options are suggested for implementing the Health IT Hazard Manager as part of a national program of health IT safety. One possibility would be expansion of the Health IT Common Formats to include proactive health IT hazard identification, with aggregation and reporting through the National Patient Safety Database.

3
1.0 Background Well-designed, well-implemented health IT has the potential to help clinicians improve patient safety.2 However, according to the Institute of Medicine (IOM) report, To Err is Human, care delivery organizations (CDOs) …“should expect any new technology to introduce new sources of error…”
Learning from errors is essential for improving patient safety. The Patient Safety Act focuses on learning from retrospective analysis of safety incidents and adverse events. As DeRosier et al. note, however, “Most reporting systems concentrate on analyzing adverse events; this means that injury has already occurred before any learning takes place.”
3
1 A comprehensive approach to health IT safety requires both retrospective incident analysis, and proactive identification and remediation of hazards.4, 5-11 Hence Nancy Leveson’s dictum, “Hazard analysis is accident analysis before the accident.”11 McDonough has provided a careful review of proactive hazard analysis, concluding that it is a critical component of health care safety.
1.1 What Are Health IT Hazards and Why Do They Matte r?
9
A health IT hazard is a characteristic of any health IT application or its interactions with any other health care system (e.g., the people, equipment and work spaces of an ICU) that increases the risk that care processes will be compromised and patients harmed. Hazards point to much the same construct as Shappell and Wiegmann’s “environmental characteristics,”12 Reason’s “latent errors,”13 and the IOM’s “unsafe conditions.”
According to safety engineer Michael Wogalter, “Hazard control is critically important to the development and maintenance of safe products and services. Hazard control consists of hazard analysis, elimination of hazards through design, guarding against hazards. . ., removal of the product or service from use, warnings about the hazard, and training in hazard avoidance.”
14
15
The source of a hazard may not reside within any single software application, hence safety testing must be performed on the full suite of applications in use by a CDO—in addition to the safety testing performed by vendors on their own individual products.
Health IT hazard control is especially complex because even modest-sized CDOs typically use many software applications from many different vendors, make hundreds of configuration decisions for many applications, develop interfaces between many pairs of applications, and may develop custom code for some applications. The complexity of health IT—and of the other health care systems with which it interacts—requires that IT vendors and CDOs identify and control thousands of hazards throughout the health IT life cycle, from design and implementation through maintenance and upgrading.
16 For example, a hospital might be ready to transmit prescriptions for post-discharge medications directly from its electronic health record (EHR) to retail pharmacies. However, preimplementation analysis would

4
reveal that orders for post-discharge medications are frequently cancelled immediately prior to the patient’s final discharge and few retail pharmacies use (currently available) information systems that are capable of receiving electronically transmitted cancellations of prescriptions. Without the universal adoption of pharmacy information systems that can process electronic cancellations, many patients could receive post-discharge medications that the discharging physician believed had been cancelled. Nor would the “un-cancelled” medications appear on the electronic discharge summaries that patients and outpatient physicians receive when patients are discharged.
As Exhibit 1 illustrates, hazards may arise due to inadequacies in the design, manufacture, implementation, or maintenance of health IT. They may also arise in the interactions between health IT and other complex health care systems (e.g., the coordination of a patient’s post-discharge medication list among hospital physicians, community pharmacies, and outpatient physicians). If hazards are identified and eliminated before an application is implemented (represented by the grayed oval in Exhibit 1), no adverse effect can occur. If, however, the hazard is not identified or cannot be completely eliminated there is a risk that the hazard will compromise care—especially in the case of a fully automated system that users cannot override. A hazard may also combine with other characteristics of the care system to overwhelm the vigilance and skill of the health care team, compromising a process of care and potentially contributing to patient harm. For example, if the design of an inpatient EHR does not allow the entry of orders for critically ill patients until the patient has arrived at the hospital, urgent care (e.g., lab work, scans) that could have been ordered during transport and ready for initiation upon patient arrival will be delayed, with potentially lethal effects.
Exhibit 1. Proactive hazard control
17

5
Proactive hazard control has many advantages. It broadens an otherwise limited focus on safety incidents (and their most salient root causes) to a more systematic focus on the full range of hazards that may be created by health IT and its interactions with other health care systems. Second, a proactive focus on hazards expands the typical focus on “user error”18 to a more productive consideration of the ways that clinicians, health IT vendors and local IT implementers unknowingly create hazards.19 Third, a proactive focus on hazards can engage the skills and passion for quality of the most knowledgeable stakeholders: clinicians; patients; safety teams; health care informaticians; and IT business analysts, trainers, and production-support teams. Fourth, proactive (nonemergent) hazard assessment is a lower-stress setting in which to thoroughly analyze health IT safety from multiple perspectives, increasing the likelihood of identifying previously unanticipated hazards. Proactive hazard control also reduces important forms of bias that are associated with retrospective analysis, particularly hindsight, political, sponsor and confirmation biases.20 Proactive hazard control has the potential to improve the quality and efficiency of patient care while enhancing public trust.2, 6
Recognizing the importance of proactive hazard control, the IOM report on Health IT and Patient Safety makes the following recommendation regarding proactive and retrospective hazard reporting: “Recommendati
It also has the potential to decrease the number of expensive (to CDOs and vendors alike) emergency fixes necessitated by hazards that are identified retrospectively—after the health IT has been implemented and care has been compromised.
on 7: The Secretary of HHS should establish a mechanism for both vendors and users to report health IT-related deaths, serious injuries, or unsafe conditions [hazards].”
Some CDOs have substantial experience in identifying and resolving hazards.
14
21
Several methods for proactive hazard identification have been published
It is likely that many health IT hazards occur in CDOs but go unreported due to fears of adverse publicity and medico-legal exposure. Too little is known and shared about: (a) the types of hazards associated with the use of health IT, (b) the likelihood that specific hazards will compromise care processes or cause patient harm, and (c) reliable methods for identifying and controlling hazards. It is often difficult to predict either the likelihood of hazard occurrence or the magnitude of the adverse effects of a hazard, and feedback on the accuracy of such predictions is generally unavailable.
1,22-26 including at least one that has been validated for both for usefulness and usability by CDOs.2
CDOs (and health IT vendors and resellers) have no common language for sharing information about the health IT hazards they identify (proactively or retrospectively). While some health IT vendors encourage their customers to report hazards to them, and in turn communicate some hazards to their customers, there is currently no consistent format for this information sharing—no means by which CDOs or vendors can learn about the full range of hazards.
However, these methods have not been supported by a standard, systematic terminology of health IT hazards.

6
1.2 A Health IT Safe ty Learn ing Community A learning community comprised of CDOs, health IT vendors, researchers, and regulators will need a software tool with which to share information about health IT hazards—a tool that supports the characterization and communication of hazards and their potential and actual adverse effects. And as Israelski observes, “An important first step in risk management is to understand and catalog the hazards and possible resulting harms that might be caused...”27
A health IT safety learning community could also learn about the effectiveness of various methods for controlling hazards. CDOs need to know, for example, “If no other hazard-control method is feasible, is training an acceptably effective method for controlling this type of hazard—or should we decommission the involved application?”
For CDOs, relevant questions that such a catalog might address include: “What types of hazards have been linked to the combination of radiology information system and EHR that we use?” and “How many hazards have been linked to the next version of the order-management application that we are considering upgrading to?” For vendors, relevant questions might include: “How many hazards have been associated with the interfacing of our order-entry application to other vendors’ pharmacy systems?” and “What hazards are my customers finding that they have not told me about?”
Such a learning community will require a framework for sharing hazards that preserves the confidentiality of CDOs and health IT vendors. Fear of medico-legal exposure has long prevented the sharing of information about medical safety incidents and could have the same effect on sharing of information about health IT hazards. The software tool supporting the learning community must therefore shield the identity of CDOs who report hazards, who will want the information they contribute to the shared database/catalog to be protected from legal discovery.
The Health IT Hazard Manager is intended to support an industry-wide learning community by addressing the following stakeholder needs:
Individual CDOs
• Characterize health IT-related hazards consistently and efficiently, so that the hazards can be compared (internally) with other previously identified hazards.
• Manage hazards from identification to the most complete control that is feasible.
• Understand the variety, frequency, and impacts of hazards associated with the applications and combinations of applications they use (or are considering using, in the case of planned purchases and upgrades).
Organizations using the same applications (user groups)

7
• Understand the variety, frequency, and impacts of hazards associated with the applications and combinations of applications they share.
• Maintain vendor confidentiality outside the user community.
Health IT vendors
• Understand the variety, frequency, and impacts of hazards potentially associated with their software applications, particularly as they interact with other vendors’ applications and other systems of health care.
Policymakers
• Aggregate and analyze health IT hazards as early as possible in the IT life-cycle and throughout the life-cycle, as one element of a National program of health IT safety.


9
2.0 Hazard Manager Development and Beta-test Under contract with AHRQ, Abt Associates refined and tested the hazard ontology, under the direction of Principal Investigator Dr. Jim Walker, Chief Health Informatics Officer at Geisinger Health System, and Andrea Hassol, Abt Associates Project Director. The Hazard Manager Web site was implemented and supported throughout the study by the ECRI Patient Safety Institute.
2.1 Hazard Manager Onto logy As Bodenreider notes, a well-designed ontology ...”supports knowledge management tasks such as annotation (or indexing) of resources, information retrieval, access to information and mapping across resources ... making the data available to search and to algorithmic processing.”28 (See also Smith29) These contributions of an ontology are important because, as Pham et al. observe, “While this method [in-depth analysis of individual reports] may be feasible for local low-volume reporting systems, it is too labor-intensive for national high-volume systems.”30 For example, the Aviation Safety Information Analysis and Sharing system (ASIAS) receives more than 30,000 reports a year of unsafe conditions and incidents at airports.31 A hazard-reporting system that engaged America’s 5,000 hospitals; 20,000 physician practices; and millions of personal health record (PHR) users effectively could produce at least twice as many reports. Recognizing this need, the IOM report, Health IT and Patient Safety, recommends that “One of the tools ONC could provide to facilitate the implementation of Recommendation 3 is the development of a uniform format for these [adverse-event and hazard] reports, which could be coordinated through the Common Formats.”14
The development of the Hazard Manager ontology began with two researchers at Geisinger Health System iteratively categorizing 260 consecutive hazards proactively identified in Geisinger’s integrated inpatient and outpatient EHR, a networked PHR, and a regional health-information exchange (HIE). These researchers also reviewed the AHRQ Common Formats,
The term “Common Formats” refers to AHRQ’s common definitions and reporting formats that allow health care providers to collect and submit standardized information regarding patient safety events.
32 other general categorizations of health care error,33,34 and retrospective analyses of health IT-related adverse effects and their causes.35,15,36-43
The hazard ontology is designed to enable those who use it to:
The researchers concluded that while existing ontologies paid careful attention to the errors of health IT users, they paid much less attention to other human sources of hazards (IT vendors, IT implementation teams, etc.) or to nonhuman sources of hazards (most critically the interactions among health IT and other health care systems). As a result, there is limited overlap between the Hazard Manager terminology and other terminologies. (Appendix B of this report contains a mapping between the AHRQ Common Formats health IT module, and the Hazard Manager ontology.)

10
1. be reminded of the range of characteristics that might characterize the hazard they have identified;
2. document the hazard thoroughly and efficiently;
3. analyze and learn from their hazard-control experience; and
4. compare their experience with that of other care delivery organizations (CDOs).
By enabling users to compare hazards according to multiple characteristics, the terminology can support the discovery of new relationships among types of hazards across vendors and implementations, addressing such questions as: “How many of our hazards are discovered after they are already in production?,” “What types of hazards are more likely to result in patient harm?,” “What hazards are others finding in the application version which we are considering upgrading to?” and “Did we predict accurately the risk that a hazard would contribute to patient harm?”
The Hazard Manager’s ontology is designed to have the following performance characteristics:
• Clearly Bounded Subject Matter: The terminology is limited to health IT-related hazards and their potential adverse effects (excluding, for example, user factors such as fatigue).
• Single Terms: Each term points to a single construct. As a negative counter-example, note this item from the EHRevent incident-reporting system: “Inability to capture, save, view, retrieve, perceive important data”—five constructs combined into a single choice. (The EHRevent incident reporting system focuses on incidents where patients are harmed, rather than prospective hazard identification. It was created in collaboration with medical professional insurance carriers and adverse event reporting and government experts to improve EHR and patient safety and help to reduce professional liability.)
29
• Actionable: The terms (and the constructs they point to) are no more fine-grained (and no less) than is necessary to guide hazard control and to understand how to design systems to prevent future occurrences of similar hazards.
35
• Unambiguous: The boundaries between the ontology’s constructs are conceptually clear and are clearly expressed by the terms that point to the constructs.
• Comprehensive: The ontology enables meaningful characterization of all health IT-related hazards.
• Consistent Hierarchy: The terms and categories of terms represent similar levels of analysis. For example, the categories “Stage of Discovery” and “Method of Discovery”

11
are coordinate—that is, at the same level in the hierarchy. The term “Usability Testing” is a sub-category of the category “Method of Discovery,” and subordinate to it.
• Minimum Necessary: The number of terms and of categories is as small as is consistent with the preceding criteria.
• Continuous Improvement: All relevant pick lists include an “Other (specify)” option to enable users to identify unclear terms and missing constructs.
• Available: Without licensing fee.
44
The Hazard Manager and its ontology use as an organizing structure the phases in the life-cycle of a health IT hazard:
29
• Discovery • Causation • Impact • Hazard Mitigation
Each of these phases has a separate data entry screen or ‘tab’ in the Hazard Manager. On each tab there are a series of pick lists, with which users enter information about the hazard. During the beta-test, most participants entered information in the tabs in order, although one user chose an ad hoc order to work through the tabs; the Hazard Manager supports either approach.
Despite the potential of an ontology to enable the characterization, storage, and comparison of hazards, a terminology-based approach to hazard control will in some cases need to be supplemented with in-depth analysis of selected individual reports that have been identified as potentially informative. The Hazard Manager partially addresses this need with a free-text field for a short description of the hazard that is publically available to authorized users (with the reporter warned not to include confidential information about the patient, the reporting organization, or the vendor) and with a confidential free-text field available only to the organization that entered the hazard, to fully document the hazard for the organization’s own internal purposes.
2.2 Beta Vers ion Hazard Manager Des ign and Programming
Public and Private Fields
There is only one mandatory field in the Hazard Manager—a brief free-text description of the hazard. This brief description is public and is viewable and searchable by all registered Hazard Manager users. During the beta-test, system administrators reviewed the brief description before each hazard was “published” to the database, to ensure that no patient, clinician, institution or

12
vendor could be identified using this field. There were fewer than 10 instances (from among 495 hazards) where this field contained inappropriately revealing information, usually the name of a vendor or product.
The Hazard Manager also offers a free-text private description, viewable only by the CDO that enters a hazard. This field has no size limitation and enables organizations to enter as much information as they will need to understand and manage a hazard internally. There are three other free-text “notes” sections in the Hazard Manager, where organizations can make notes among their team members, as they investigate and correct a hazard. A CDO can view all of its own private fields, and system administrators can view all fields; however an organization cannot view any other organization’s private fields. Vendors, researchers, and policymakers can view only the public fields.
System Security
AHRQ contracted with Abt Associates to develop and test the Hazard Manager; Abt subcontracted with ECRI Institute, a patient safety organization (PSO), to program and operate the Hazard Manager Web site (on a secure https server) for the beta-test. System administrators approved each study participant’s access to the password-protected test Web site.
Hazard Manager account registration includes users’ names and contact information; system administrators verify users’ organizational affiliations, and grant access to one of four security levels. These security levels control the information users can see about others’ hazards. For example, a CDO staff person could see all of the hazards associated with its version of a vendor’s software product, but could not see which other CDO entered each hazard; a vendor could see all the hazards associated with its products, but not which CDO entered a given hazard. Exhibit 2 presents system permissions by user level.
Exhibit 2. Hazard manager user permissions
User Type Enter Edit Search View Hazard
Details View Reports
Care Delivery Organization (CDO)
Enter new hazards
Edit one’s own hazards
Terminology-based search of one’s own and others’ hazards (de-identified) using public fields
View one’s own hazards.
View the public fields of others’ hazards (de-identified)
View reports on one’s own hazards, others’ hazards (de-identified), or all hazards (de-identified)
Vendor Cannot enter hazards
Cannot edit hazards
Terminology-based search of customers’ and of all CDOs’ hazards (de-identified)
View customers’ and all CDOs’ hazards (de-identified)
View all hazards (de-identified) in aggregated, terminology-based reports

13
User Type Enter Edit Search View Hazard
Details View Reports
Public Policy or Research
Cannot enter hazards
Cannot edit hazards
Terminology-based search of all hazards (de-identified)
View all hazards (de-identified)
View all hazards (de-identified) in aggregated, terminology-based reports
Database Administrator
Can enter hazards
Can edit all hazards
Can search all hazards based on any characteristic including organizational affiliation and health IT vendor
Can view all hazards, including private fields
Can view all hazards (de-identified) in aggregated reports
2.3 Hazard Manager Beta -tes t With the approval of AHRQ, the Abt Associates Institutional Review Board (IRB) exempted this study from review, because it did not involve human subjects research. Office of Management and Budget approval was not sought because only seven organizations participated in the beta-test.
Beta-test Participants
Study sites. The beta-test began with seven CDOs that varied in geographic location, patient demographics and size. Two were multihospital systems, three were large integrated health care delivery systems (one rural), and two were single hospitals (one small and rural, the other an urban children’s hospital). All seven participated in initial usability discussions and inter-rater testing of hazard scenarios (see below). The small rural hospital was unable to enter hazards due to an unanticipated staff shortage, therefore only six study sites entered actual hazards. The lead participant at each site assigned staff to enter hazards for the test: in some sites IT production-support personnel were involved, in other sites members of the Patient Safety team participated. All study sites’ IRBs determined that the study was exempt. All of the study sites’ legal departments signed limited PSO agreements with ECRI for purposes of this study.
Vendors. Abt offered each participating organization’s EHR vendor the opportunity to participate, through a Webinar introduction to the Hazard Manager and view-only access to the (de-identified) hazards in the database. Abt held separate Webinars with representatives from five vendors to present the Hazard Manager and solicit their feedback on its design and ontology. Three vendors provided written feedback in addition to these discussions, and representatives from four vendors attended an all-project meeting at the conclusion of the test.

14
Federal agency representatives. Early in the project a meeting was convened with representatives from AHRQ and the FDA to discuss the project and the hazard ontology specifically. At the conclusion of the beta-test, an all-project meeting was held at AHRQ with the study participants, vendors, invited experts, and representatives from AHRQ, FDA, and ONC.
Qualitative Analysis
Initial use discussions. The seven study sites’ participants were introduced to the Hazard Manager during a Webinar in April 2011. Abt conducted individual Webinars with the seven participating groups in May and June 2011, to gather their initial impressions regarding the usability of the Hazard Manager.
Ontology discussions. Two group discussions were held with study participants via Webinar, concerning the Hazard Manager ontology; all seven test sites participated. Topics included: items that were unclear and might require rephrasing; the need for a glossary for unfamiliar terms; potential items to be added to the ontology; and items that could perhaps be consolidated or eliminated. Study participants also identified terms that were specific to one type of organization or health IT product, and consequently not relevant for all potential users of the tool.
Report discussions. The Hazard Manager report function was added in August 2011, 4 months after the beta-test began. After 1 month of using the report function, participants joined a group discussion about the reports. Participants offered input regarding the reports’ usability and usefulness. They suggested additional reports that should be predesigned and programmed, and other potential formats for presenting hazards.
Hazard Entry. During the 6 months of the beta-test, participants at six of the seven study sites entered hazards discovered at their organizations; a total of 495 hazards were entered. At one of the study sites only 20 hazards were entered, all of which were reviewed by the legal department prior to entry; there was no such legal review at the other study sites.
Inter-rater scenario testing. Separate sessions were held with participants at each test site for inter-rater scenario testing. Representatives from each organization entered the same six standardized, mock hazard scenarios into the Hazard Manager (the scenarios were based on actual hazards). The purpose of this testing was to understand how different users interpret a hazard, and how they enter information about it into the Hazard Manager. This stage of testing was conducted prior to the ontology discussions and before study participants had the opportunity to calibrate their understanding of the ontology with each other. Abt conducted the inter-rater scenario testing sessions (some in person and others remotely) using cognitive walk-throughs, encouraging participants to “think out loud” as they entered each standardized hazard, explains their reasons for choosing items in the Hazard Manager pick lists. Each test session was

15
captured digitally (audio and video); Appendix E of this report presents summaries of the inter-rater scenario testing results. The inter-rater testing scenarios were as follows:
1. Discontinue All: A new ‘Discontinue All’ button was added to the order screen as a large horizontal button beside a much smaller button for ‘Sign’ button. One week after the upgrade went into production, a user entered 15 orders to transfer a complex patient out of intensive care, but instead of signing, inadvertently clicked the larger Discontinue All button. There was no alert asking “do you want to do this?” and all 15 orders were discontinued, which the user noticed immediately. The user re-entered 14 of the orders, but forgot one. The patient was not injured by the omission. Immediate notices were sent out through the facility to warn users to beware of the ‘Discontinue All’ button. The local IT team worked with the vendor for several weeks to relocate the button, make it smaller, and add an alert before the ‘Discontinue All’ process was finalized.
2. Intracranial Pressure Calculation: The formula for calculating intracranial pressure (ICP) was re-entered incorrectly by local IT staff as part of a software upgrade, with the result that all pressures were miscalculated beginning at midnight. A surgeon came in the next morning and ordered a Computed Tomography (CT) scan for a patient with a high ICP reading, to rule out a new intracranial hemorrhage. After seeing the normal CT result later that morning, a nurse realized that the problem was with the ICP calculation and warned the surgeon. The patient received an unnecessary scan and radiation exposure, and was made anxious by the test. The ICP formula was re-entered and a new policy created that all changes to the EHR, such as entering a formula, must be double-checked by another IT staff member.
3. Potassium Overdose: During a busy holiday weekend, with several physicians covering on a medical floor, a patient with low potassium was given potassium both intravenously (IV) and orally (PO), resulting in an over-dose. The patient suffered cardiac arrhythmia and renal dysfunction, and survived with chronic renal damage. One hazard identified was the fact that IV and PO orders were entered on separate screens, neither of which displayed the total potassium dose given (or scheduled). Investigation did not identify any other patients who had received inappropriate K+ doses due to this problem. Despite months of negotiations, the vendor has not removed the hazard. In the absence of a fix, training has been instituted to alert users to double-check both the IV and PO orders, and to add up the total dose themselves.
4. Patient Named “Test”: During an upgrade, many test orders were placed, test prescriptions and labs filled, test notes entered, etc. using the word Test in place of patient name. Some of these entries were incorrectly associated with an actual patient with the surname of “Test.” No one on the IT or clinical teams noticed the large volume of contradictory information in Mr. Test’s chart for several weeks. When the patient used

16
a patient portal to view his lab results, he noticed the errant entries and contacted his physician. No treatment decisions were made based on the inaccurate information, and the patient was not harmed physically or psychologically. The IT staff identified three other patients with surnames beginning with “Test” and changed the names of all test patients to this format: zzOAMC1234. IT staff notified the vendor so that other users could be warned about the potential for this problem to occur.
5. Too Many Open Charts: A physician-user had four patient charts open when a nursed asked for an urgent order on a fifth patient. The user mistakenly entered the urgent order for Patient A’s CT scan into Patient B’s chart. Patient A’s test was delayed and her hospitalization was extended by one day, but she was otherwise unharmed; Patient B was exposed to radiation unnecessarily. A Root Cause Analysis found the hazard to be the ability to have too many charts open at once. At the direction of the Chief of Medicine, local IT staff reprogrammed the system to prevent having more than two charts open at once.
6. Failure to Delete Information Completely from an Automated Note-writing Tool: A new, point-and-click tool for creating progress notes was part of an EHR upgrade. During preimplementation testing, IT staff realized that when some symptom boxes were checked and then un-checked, the note text created by clicking the box was not deleted. After pointing this out to the vendor, the organization decided not to implement the tool, because it had too much potential for harm if clinicians were to see—and act on—information that the note’s author thought she had deleted.
Descriptive Analysis of 495 Hazards
At the end of the 6-month beta-test, ECRI securely forwarded the relational database containing the 495 hazards to Abt researchers. A quantitative analysis was conducted to determine whether relationships existed between broad ontology categories and distinct hazard characteristics. A statistical analysis file was created and analyzed using STATA 11.0.45.
The descriptive analysis was conducted in two steps:
• The first step was to determine how often each question in the Hazard Manager was answered, skipped by the user or skipped by the system. A system skip was determined by the skip logic programmed into the Hazard Manager. For example, if a user entering a hazard indicated that patient harm did not occur, the patient harm scale in the Hazard Manager was skipped by the system (not offered to the user).
• The second step was to determine how often each answer choice for a particular question was selected when the question was not skipped. The denominator is smaller for these lower-order questions, due to the skip logic of the higher order questions.

17
Next, researchers at Abt looked for relationships within and across the components of the Hazard Manager terminology (See Appendix D to identify patterns in the items selected; for example, whether hazards due to Faulty Software Design also involved Usability issues).
“Other (specify)” analysis. Most of the Hazard Manager’s pick lists contain an “Other (specify)” option (free-text field) for users to indicate missing or unclear hazard characteristics that may need to be addressed. The “Other (specify)” entries from the study sites’ 495 hazards were reviewed by Abt researchers to identify revisions required for Hazard Manager 2.0. (See Appendix F for the results of the “Other (specify)” analysis).
All-project Meeting
An All-Project meeting was held at AHRQ’s Rockville office in December 2011, 2 months after the hazard-entry phase of the beta-test concluded. Participants from five of the test sites attended the meeting, as did four of the vendors whose EHR products these sites use. Representatives from AHRQ, FDA, ONC, and Center for Medicare and Medicaid Services were invited to attend. A national expert in the field of health IT safety was also invited and attended.
Attendees were asked about additional terminology refinements, formatting changes, and organizational philosophies about hazard reporting. Vendors shared their concerns about the system and offered suggestions to improve is usefulness to the vendor community. The discussion also addressed the future deployment of the Hazard Manager, the potential Federal role in that deployment, and how this tool may contribute to a National program for improving health IT safety.


19
3.0 Hazard Manager Version 2.0 This chapter of the report describes features of the Hazard Manager Version 2.0, with relevant findings from the beta-test and consequent revisions made to the Hazard Manager.
3.1 Regis tra tion The Health IT Hazard Manager is designed to be operated on a secure, private Web application; each care delivery organization (CDO), and every individual user from that organization, must register prior to using the Hazard Manager. Registration involves completing both an organization profile and a user profile. After registering, users are given a user ID and password, and the opportunity to confirm their registration via email.
User Profile
Each individual user must be associated with their organization in the Hazard Manager database. Creating user profiles enables an organization to regulate who enters hazards. In addition, the audit system records the identity of everyone who enters or edits a hazard.
In Hazard Manager 2.0 the user profile includes the following information:
• First and last name • Employer • Role
o IT Implementation Team o IT Production-Support Team o Patient-Safety Team o Other (specify)
• Telephone number • Address (street, city, state, zip)
Beta-test participants noted that the hazards they learn about, and the degree of detail they are able to enter about a hazard, vary depending on the stages of the health IT life cycle an individual is involved in:
• IT Implementation teams usually identify hazards during preimplementation testing (before there is any possibility of care-process compromise or patient harm). In some settings, such teams identify the largest number of hazards. One of the complexities of controlling hazards at this stage of the health IT life cycle (even when skilled clinician-informaticians are members of the team) is estimating the likelihood that a given hazard will contribute to adverse effects and balancing that likelihood against the costs of hazard

20
control (which may include not using software modules that are judged to be too dangerous).
• IT production-support teams primarily learn about hazards from users, often when the hazard has contributed to care-process compromise (e.g., difficulty ordering a test) but before a patient has been harmed. At this stage of the health IT life cycle, the most complex task is estimating the likelihood that a given hazard will contribute to adverse effects to decide how emergently the hazard must be removed from the EHR (if it can be removed). If patient harm cannot be ruled out, such teams typically forward the information to the patient-safety team. IT production-support often do not participate in root-cause analyses (or other retrospective hazard analysis), nor do they assess patient harm.
• Patient Safety teams typically learn about the subset of hazards that contribute to identifiable patient harm. These teams may also learn about ‘near misses,’ in which a care process is compromised (e.g., a medication is administered late) but the patients is not harmed. These teams may identify health IT-related hazards during root cause analyses (or other forms of retrospective incident analysis). Patient-safety teams are usually aware of the severity of patient harm resulting from a safety incident, and be able to estimate the duration and type(s) of harm (i.e., physical, psychological, financial, and reputational). These teams may not include members whose knowledge of health IT enables them to identify health IT hazards or to estimate their contribution to the incident.
Beta-test participants served a variety of roles within their respective organizations: some were members of IT production-support teams; others were members of patient-safety teams; one participant’s role was specifically identified as IT safety, and one participant was an informatics researcher. These differences may account for the variety in the 495 hazards entered during the beta-test.
The Hazard Manager is designed to enable every participating organization to assign whatever individuals they wish to manage hazards. Given the relationship described above between an individual’s role and the types and characteristics of hazards s/he will enter, the Hazard Manager 2.0 asks users to identify their role (or roles).
Organization Profile
The organization profile includes a list of the core health IT applications used by the organization. An accurate, up-to-date list provides several benefits:
• It enables Hazard Manager users to efficiently identify the applications that may contribute to a hazard.
21
• It enables hazards to be accurately linked to specific vendor applications and versions.
• It decreases the risk that bogus hazards will be reported with the intention of damaging a vendor’s reputation.
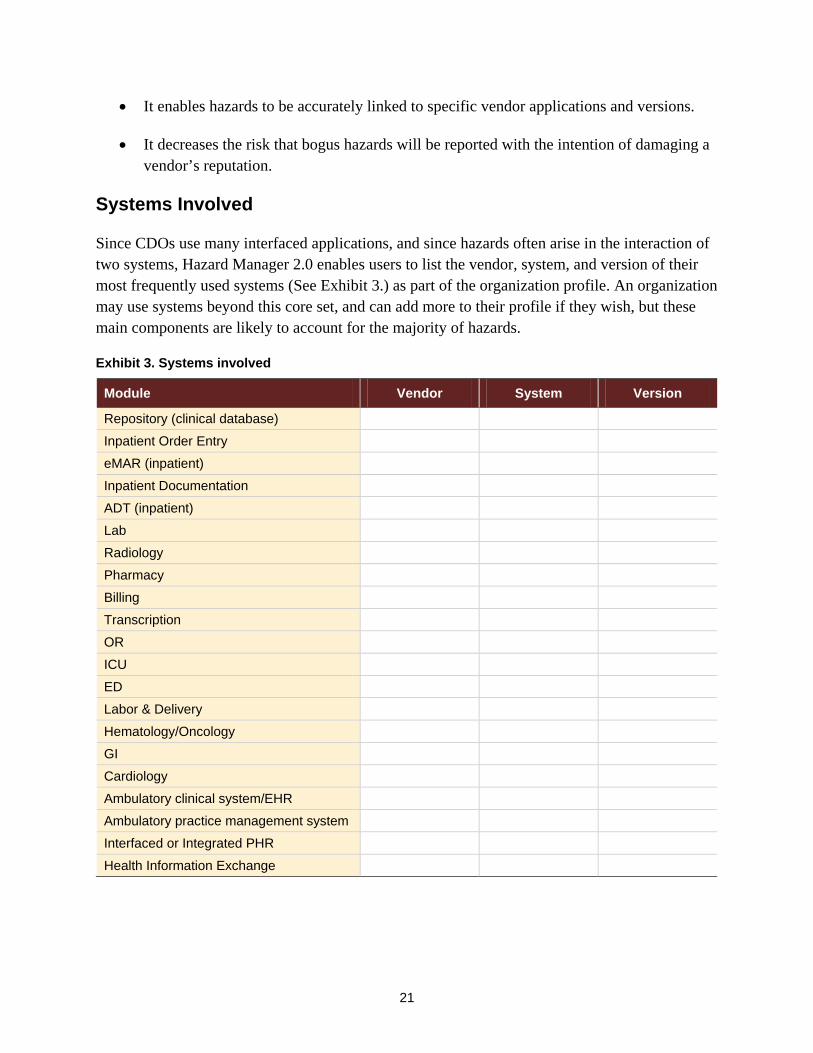
Systems Involved
Since CDOs use many interfaced applications, and since hazards often arise in the interaction of two systems, Hazard Manager 2.0 enables users to list the vendor, system, and version of their most frequently used systems (See Exhibit 3.) as part of the organization profile. An organization may use systems beyond this core set, and can add more to their profile if they wish, but these main components are likely to account for the majority of hazards.
Exhibit 3. Systems involved
Module Vendor System Version
Repository (clinical database)
Inpatient Order Entry
eMAR (inpatient)
Inpatient Documentation
ADT (inpatient)
Lab
Radiology
Pharmacy
Billing
Transcription
OR
ICU
ED
Labor & Delivery
Hematology/Oncology
GI
Cardiology
Ambulatory clinical system/EHR
Ambulatory practice management system
Interfaced or Integrated PHR
Health Information Exchange

22
CDOs upgrade and change their systems over time, but may wish to retain access to hazards they entered for previous systems and versions. Hazard Manager 2.0 therefore asks users to specify which Health IT systems are active in their organization. Hazard Manager 2.0 automatically populates the list of active health IT vendor product systems for each organization, based on the information in the organization profile; from this list, users can select the health IT systems involved in a particular hazard. Hazard Manager 2.0 also allows users to update their organization profile with new information at any time by providing their administrator with a list of their HIT systems, which the administrator then approves and sends to the system programmer to be entered in the profile. (A future enhancement might periodically ask organizations to update their profiles, to keep the profiles current.)
In the beta version of the Hazard Manager, the organization profile consisted of a CDO’s name and location, and main vendor EHR system and version. Study participants could indicate that a hazard involved two systems by entering the “Primary System Involved” and then creating multiple “Additional System” entries as needed. This process was awkward for test participants, who suggested that users should be able to indicate the multiple systems involved in one step—as is enabled in Hazard Manager 2.0. They also advised that the main EHR was not the only system implicated in hazards, hence the expanded list above that includes the major systems used by most CDOs.
3.2 Dis covery The Discovery tab captures basic information about how a hazard was first identified and reported. The information captured in this tab will support learning about:
• The points in the health IT lifecycle at which different types of hazards are identified • How different types of hazards are first discovered and by whom • How information about hazards is shared within and beyond a CDO
Exhibit 4 below shows the Hazard Manager 2.0 Discovery tab; it includes both single and multiselect questions, calendar and clock functions, and numeric text fields.
Discovery Date and Time
Of the 495 hazards that were entered during the beta-test, 68 percent (335 hazards) included information about the date and time the hazard was discovered. Study participants suggested that this information may be useful for some CDOs’ internal hazard tracking and resolution, but for many other hazards this information is either unavailable or irrelevant. Due to this mixed feedback, the date and time fields in the Hazard Manager 2.0 Discovery tab were relocated from a priority position at the top of the screen to the last item at the bottom of the screen. The time format was also changed to military time, to conform with many CDOs’ timekeeping conventions.

23
Exhibit 4. Hazard manager 2.0 discovery tab1
1 The information icon indicates that there is a definition for this term that users can view by hovering their mouse over the icon.

24
How Was the Hazard Discovered?
The beta version of the Hazard Manager offered one list to indicate who discovered a hazard (e.g., end user, patient safety team), and another to indicate how it was discovered (e.g., end user report, retrospective analysis). The most significant change to the Discovery tab was combining “Who discovered the hazard?” and “How was the hazard discovered?” into a single question, because test participants found the distinction between “who” and “how” confusing and unnecessary. Exhibit 5 below presents how Hazard Manager 2.0 combines the two questions into a single focus on how a hazard was discovered:
Exhibit 5. Hazard discovery questions in hazard manager 2.0 and hazard manager beta version
Hazard Manager 2.0
“How was the hazard discovered? [check all that apply]” • Local IT Implementation and Testing (DBV)
• Value-Added Reseller
• End-User Report (any clinician)
• Automated Error Log
• Patient or Lay-Caregiver Report
• Vendor Reported (any vendor)
• Chart Review
• Retrospective Analysis
• Other (specify)
Hazard Manager Beta Version “Who Discovered the hazard?” “How was the hazard discovered?”
• End-User
• Local IT
• Medical Records
• Safety Personnel
• Patient or Caregiver
• Health IT Vendor
• 3rd Party Content Vendor
• Researcher
• Regulator
• Other (specify)
• Prospective Risk Analysis (PRA)
• Usability Testing
• Electronic Report (Predefined)
• Error Log
• Chart Review
• End-User Report
• Patient Report
• Retrospective Analysis (e.g., root cause analysis)
• Other (specify)

25
In addition to merging these questions to eliminate redundancies, the Hazard Manager 2.0 addresses participants’ concerns about inconsistent interpretation of certain terms. In particular there was confusion about whether Patient or Caregiver could also be interpreted as End-User. To reduce confusion, these items are clarified as Patient or Lay-Caregiver Report and End-User Report (any clinician) in the Hazard Manager 2.0. Third Part Content Vendor was confusing to many study participants, and is clarified as Value-Added Reseller, which may be more familiar terminology.
Vendors voiced concerns that multiple customers could enter the same vendor-reported hazard. That is, a vendor might report a hazard to its 100 customers, each of whom could then enter it into the Hazard Manager, generating 100 reports about the same hazard. To avoid such duplication, any hazard that is indicated as Vendor Reported (any vendor) in the Hazard Manager 2.0 will be blocked from roll-up into reports and will be viewable only by the CDO that entered them. In this way, a CDO can see all of the hazards that might affect it, including those its vendor brought to its attention, but others cannot see these vendor-reported hazards.
Study participants observed that it is not always evident who discovered a hazard first, and since there may be several individuals who together discover a hazard, the Hazard Manager should permit multiple selections. This question is now multiselect in the Hazard Manager 2.0.
Was the Hazard Associated with a Shift Change?
The Hazard Manager beta version contained the question “Was the hazard associated with a shift change?” (yes/no) and a follow-up question asked users to specify which shift transition: First-to-Second Shift, Second-to-Third Shift, or Third-to-First Shift. Among the 495 beta-test hazards, information about shift change was included in 70 percent (346 hazards) and in 98 percent of these cases the answer was “no.” Among the seven cases in which a shift change was involved in a hazard, users indicated which shift change in only three cases.
Study participants reported that they were confused by the shift change options because CDOs use different shift schedules for different types of staff. For example, nurses on inpatient units often work 12 hour shifts, those in outpatient units work eight hour shifts (days only), and staff in IT departments commonly work 10 hour shifts. Study participants also advised that shift change or hand-off lapses would be more appropriately included in the Causation tab of the Hazard Manager, rather than as a component of Discovery. Based on these comments the Hazard Manager 2.0 no longer includes a shift change question, but does address communication failures during hand-offs.

26
Stage of Discovery
The “Stage of Discovery” options in the beta version Hazard Manager were as follows:
• Software Specification • Vendor Programming • Customer Configuration • Customer Programming • Testing • Training • Go-Live • Production Use • Upgrade
The only modification study participants suggested was changing “Go-Live” to “Initial Go-Live.”
How Long Has the Hazard Existed in the System?
The beta version of the Hazard Manager included the following question and open text answers about hazard duration:
“How long has the hazard existed within the system?”
Hours (up to 23): ____ [open text field] Days (up to 30): ____ [open text field] Months: ____ [open text field]
The text fields were restricted to numeric entries (i.e., users could enter “1,” but not “one”) and numbers could be entered into multiple fields.
Study participants struggled with interpreting this question: some interpreted it to mean the duration of time that a hazard had existed when it was discovered, while others focused on how long a hazard had existed up to the point when it was entered in the Hazard Manager. To eliminate this confusion, the question is rephrased in the Hazard Manager 2.0 as “How long was the hazard present in the system when it was discovered?”
176 of the 495 hazards entered during the test contained information about how long a hazard existed. Sixty-seven percent of these 176 hazards had been present for months, 24 percent for days, and 11 percent for just hours. Based on participant suggestions, the answer options were expanded to include Weeks, and users are restricted to entering just one time field – whichever makes the most sense for a particular hazard. Participants also observed that a hazard may have

27
been present for a long period that cannot be accurately measured. In this case, as in other ‘unknown’ situations, users are instructed to leave the item blank.
How Was the Hazard Shared or Communicated?
The beta version of the Hazard Manager included a question regarding internal or external sharing of information about a hazard. The beta version of this question was:
“How was the hazard published?” (Check all that apply.):
• Internal Report (not published) • Sent to health IT Vendor • 3rd Party Content (Vendor Communication) • User Group Communication (e.g., Listserv) • Published Report (including electronic) • Received from health IT Vendor
Exhibit 6 shows the responses to this question.
Exhibit 6. “How was the hazard published?”
Study participants felt that the term “publish” was confusing because publishing implies that information is made public, but some of the options (Internal Report, Sent to Health IT Vendor) reflect private, internal communications. They also advised that the distinction between internal and external communication was not clear in the options offered. To address these concerns the question and answers are revised as:
84%
13%
2%
1%
1%
19%
0% 20% 40% 60% 80% 100%
Internal Report
Sent to HIT Vendor
3rd-Party Content Vendor Communication
User Group Communications
Published Report
Received from HIT Vendor
Percent of Hazards
Publ
ishn
g O
ptio
ns
458 Hazards Published

28
“How was this hazard communicated?” [multiselect]
• Communicated internally • Reported to software vendor • Published report (including electronic publication) • Informal communication with vendor user group
3.3 Hazard Caus a tion The Hazard Manager 2.0 contains a tab for Causation, where users can indicate the characteristics that contribute to a hazard; this is the core of the Hazard Manager ontology. When combined with data from other Hazard Manager tabs, this information about hazard causes (poor usability, data quality, implementation issues, etc.) will support learning about:
• The most common causes of health IT hazards, and especially those with the potential to compromise care or harm patients.
• How multicause factors may combine to yield particularly dangerous hazards.
• The relative contribution of causal factors that may be the responsibility of vendors to mitigate versus those that result from local action or inaction (i.e., local implementation).
Exhibit 7 shows the Hazard Manager 2.0 Causation tab.

29
Exhibit 7. Hazard Manager 2.0 causation tab

30
Beta Version Causation Categories
The beta version of the Hazard Manager Causation tab grouped causal characteristics into eight superordinate categories, as follows:
1. Usability 2. Data Quality 3. Software Design 4. Clinical-Decision Support 5. Implementation 6. Hardware 7. Other user characteristics 8. Other organizational characteristics
Exhibit 8 below shows the percent of the 495 test hazards for which one or more characteristics in a category were selected. Software Design contributed to 52 percent of hazards, and Usability characteristics played a role in 49 percent of hazards. (Percentages do not total 100 percent because hazards often have more than one cause).
Exhibit 8. Contributory causes of the 495 beta test hazards
The sections below explore the specific constituents of each of the eight Causation categories in the beta version. In a few instances the results of inter-rater scenario testing are presented, to illustrate issues where lack of clarity led to inconsistent interpretation of the ontology.

31
Software Design
Software Design contributed to 258 (52 percent) of the 495 hazards, more than any other category, and it was a frequent contributor to hazards at all six study sites. The characteristics included in the beta version Software Design category included the following:
• Faulty vendor implementation/configuration recommendation • Inadequate clinical content (including 3rd-party) • Unusable software-implementation tools • Sub-optimal interfaces between applications • Unnecessary/unauthorized sharing of PHI • Faulty design • Nonconfigurable software • Other (specify)
Exhibit 9 below presents the distribution of Software Design Characteristics that were selected in these 258 hazards.
Exhibit 9. Software design characteristics of the 258 hazards to which software design contributed
Within the category of Software Design, 73 percent of Hazards involved Faulty Design. Faulty Design was the single most common of the 48 casual characteristics, cited in 189 (38 percent) of the 495 hazards. We explored the issue of Faulty Design in detail, to understand whether it includes more than one significant construct that should be separated.
17%
3%
0%
16%
1%
2%
73%
2%
0% 20% 40% 60% 80% 100%
Faulty vendor implementation/configuration
Inadequate clinical content (incl. 3rd-party)
Unusable in software-implementation tools
Sub-optimal interfaces between applications
Unnecessary/unauthorized sharing of PHI
Non-configurable software
Fauly Design
Other
Percent of Hazards
Soft
war
e De
sign
Cha
ract
eris
tics
258 Hazards to Which Software Design Contributed

32
111 of the 189 Faulty Design entries also had a Usability characteristic contributing to the hazard. Test participants explained that faulty design often manifests itself as poor usability.
In all of the inter-rater test scenarios, Faulty Design was viewed as a contributory characteristic (although not the only characteristic) by participants at one or more of the seven study sites that participated in Inter-rater scenario testing. There was, however, more unanimity about the role of Faulty Design for some of the scenarios than for others. (See Exhibit 10.)
Exhibit 10: Faulty design selected as a contributing characteristic in inter-rater test scenarios
Inter-Rater Test Scenarios (7 study sites):
Faulty Design
New “Discontinue All” button confused
with order-signing button
Inter-cranial
Pressure formula
incorrectly reset
Potassium overdose due to IV and PO
displayed/ calculated separately
Patient named “Test”
Too many charts open:
wrong-patient order entry
Note-writer tool
failed to erase
entries
# of Participating Study Sites indicating Faulty Design contributed to the hazard scenario
7 1 4 2 3 5
(See inter-rater test scenario descriptions on page 18)
In three test scenarios there was general agreement about the failure of software to work as intended (note-writer tool), to display complete information to users (IV and PO potassium orders), or to avoid foreseeable user confusion (“discontinue all” button).
In the other three test scenarios, the contribution of Faulty Design was identified by only a few test participants. One test participant explained that software should never designed to require manual reentry of a critical formula for calculating inter-cranial pressure, however other study participants did not view this as a software design flaw. Two participants suggested that software lacking a separate test environment—forcing IT teams to enter test cases as if they were ‘live’ patients – contributed to the patient-named-Test hazard scenario; the others did not agree that this reflected faulty design. In the wrong-patient order-entry scenario, three test participants believed that a sophisticated order entry system could prevent many such errors through confirmatory identification (e.g., patient photographs); other participants did not view these missing protections as faulty design. In these three examples, a few test participants acknowledged that while the software worked as intended—it was not specified or programmed incorrectly—they viewed it as flawed because it was insufficiently sophisticated to protect users from predictable errors.

33
Faulty Design was discussed at the all-project meeting, where participants advised that this term was not sufficiently specific. While outright errors in software specification or programming are rare, poor design covers a wide array of problems: software that does not meet user expectations, does not display information in an intuitive way, does not support clinical workflows and teamwork, does not properly control user access, does not protect users from making foreseeable errors, etc.
The Hazard Manager 2.0 contains a less ambiguous characteristic of Faulty Design (specification), to be used in the infrequent situations when a vendor’s specification of the software contributed to a hazard. The Hazard Manager 2.0 also better distinguishes several other Usability characteristics (see Usability below). In addition, characteristics were added to the Hazard Manager 2.0 to address situations where IT systems fail to warn or protect users from making predictable errors (see Decision Support below).
Security Breach and Unnecessary/Unauthorized Sharing of PHI were both included as Software Design characteristics in the beta-test Hazard Manager. These concepts are similar and reflect poor data security. Test participants felt that the distinction between these two characteristics is not sufficiently clear to warrant inclusion of both, and suggested that they be combined. The Hazard Manager 2.0 includes a characteristic called Inadequately Secured Data.
Several other Software Design characteristics are retained in the Hazard Manager 2.0, but are no longer categorized as Software Design problems. Inadequate Clinical Content is now grouped in the Decision Support category. Nonconfigurable Software, Sub-optimal Interfaces Between Applications, and Unusable Software Implementation Tools are included in a new category of Vendor Characteristics in the Hazard Manager 2.0. The Hazard Manager 2.0 retitles and redistributes all of the previous Software Design characteristics and there is no longer a separate category of Software Design characteristics.
Usability
Usability contributed to 246 (49 percent) of the 495 hazards. The beta version of the Hazard Manager contained the following characteristics in the Usability category:
• Difficult Information Access • Difficult Data Entry • Excessive Demands on Human Memory • Confusing Information Display • Inconsistent Information Display • Mismatch between health IT function and clinical reality • Inadequate or Confusing Feedback to the user

34
• Electronics-induced Credulity (excessive trust) • Other (specify)
Participants at the six study sites varied considerably in the percent of hazards to which they believed that Usability issues contributed- ranging from 19 percent to 75 percent. See Exhibit 11.
Exhibit 11. Percent of hazards with one or more usability characteristics by study site
The differences among the study sites do not appear to be related to the job/role of the individuals involved in the test. Participants in both site E and site F were Patient Safety team members, but the importance of Usability varied considerably in their assignment of causes contributing to hazards. The differences among the study sites are likely related to the different health IT products/applications they use, and the degree to which they customize their software applications to improve usability. For example, study site A has extensively customized its EHR it to improve usability—this may be why less than 20 percent of their hazards involved Usability. Study site D on the other hand, rarely customizes its EHR, and they reported Usability as a characteristic that frequently contributed to hazards.
Usability characteristics—often more than one—frequently contributed to a given hazard. Exhibit 12 shows the frequency of each of the Usability characteristics, among the 495 hazards.
19%
58%
73% 75%
30%
72%
0%
20%
40%
60%
80%
100%
Site A (n=104)
Site B (n=105)
Site C (n=66)
Site D (n=20)
Site E (n=100)
Site F (n=100)
Perc
ent o
f Haz
ards
Study Sites (n = total number of hazards entered per study site)
Percent of Hazards to which One or More Usability Characteristics Contributed, by Study Site

35
Exhibit 12. Characteristics of the 246 hazards with usability characteristics
Study participants suggested simpler terminology for some Usability characteristics, and advised that other characteristics should be retained in the Hazard Manager without revision. The Hazard Manager 2.0 contains the following changes:
Confusing Information Display and Inconsistent Information Display were not felt to be meaningfully different by study participants. The Hazard Manager 2.0 therefore combines these two characteristics as Confusing Information Display.
Inadequate or Confusing Feedback to User is simplified and revised as Inadequate Feedback to the User.
Difficult Data Entry, Excessive Demands on Human Memory, and Confusing Information Display are retained in the Hazard Manager 2.0. Difficult Information Access is revised as Information Hard to Find.
Mismatch Between Health IT Function and Clinical Reality addresses a common problem where the IT system does not mirror or support the clinical workflow. It does not, however, address a similar situation where the IT application does not match clinician expectations of how it should behave. For example, a clinician might expect the IT system to show both IV and PO potassium orders and their combined total dose—his or her mental model would not anticipate the need to check to two separate screens and manually add the two to find the total dose. Since the conflict between clinical workflow, clinician expectations, and health IT systems is central to many hazards, the Hazard Manager 2.0 contains two separate characteristics: Mismatch Between
30%
24%
10%)
29%
28%
28%
23%
4%
4%
0% 20% 40% 60% 80% 100%
Difficult Information Access
Difficulty Data Entry
Excessive Demands on Human Memory
Confusing Information Display
Inconsistent Information Display
Mismatch between HIT function & clinical reality
Inadequate or confusing feedback to user
Electronics-induced credulity
Other
Percent of Hazards
Usa
bilit
y Ch
arac
teris
tics
246 Hazards with Usability Characteristics

36
Real Workflows and Health IT, and Mismatch Between User Expectations (mental models) and Health IT.
Health IT must support the workflow not only of individuals, but of clinical teams. Study participants described the failure to support clinical teamwork as a common short-coming of health IT systems. The Hazard Manager 2.0 therefore contains a new item Sub-optimal Support of Teamwork.
Electronics Induced Credulity (excessive trust) played a role in only nine hazards. During discussions with study participants, it became clear that many did not believe that this construct is a characteristic of health IT hazards, but rather is a factor that prevents users from identifying hazards. This characteristic is removed from the Hazard Manager 2.0.
Data Quality
Data Quality contributed to 130 (26 percent) of the 495 hazards; a rate that did not vary substantially among the six study sites reporting hazards. The beta version of the Hazard Manager included the following characteristics in the category of Data Quality:
• Incorrect patient information • Information linked to the wrong patient • Faulty reference information • Miscalculation of a result (by health IT software) • Lost data • Inaccurate Natural Language Processing • Other (specify)
Among the several characteristics in the category of Data Quality, Incorrect Patient Information and Lost Data were the most common contributors to hazards, shown below in Exhibit 13.
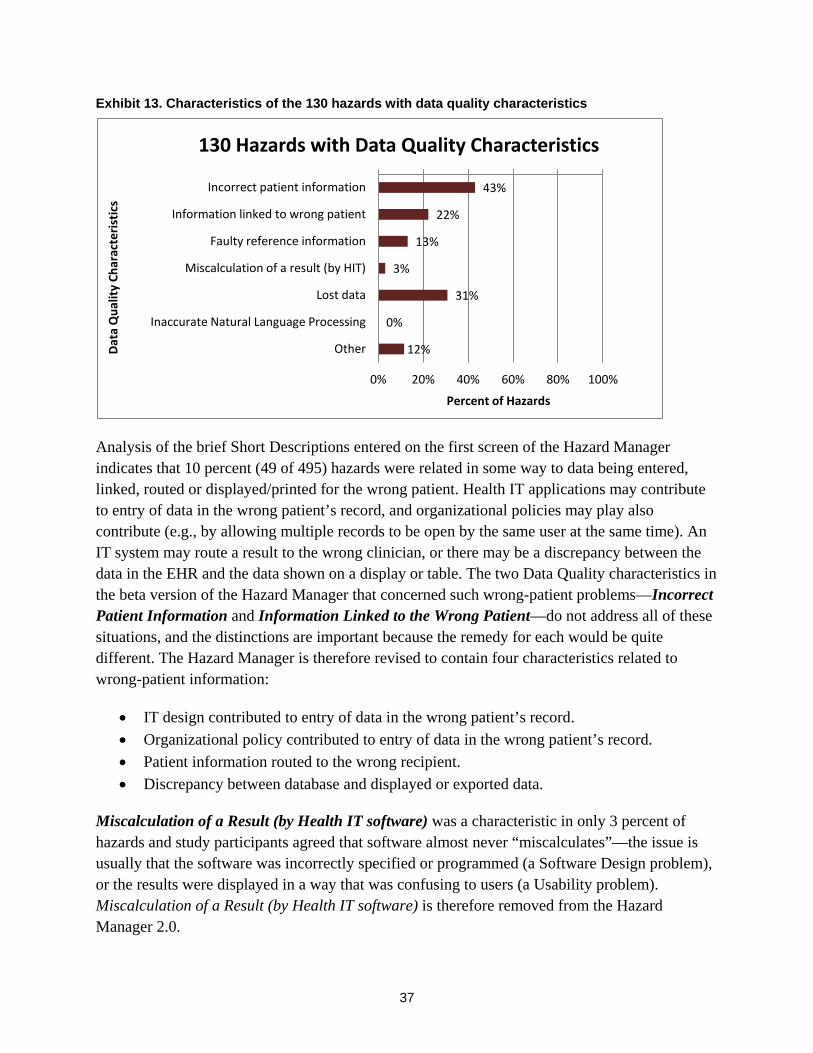
37
Exhibit 13. Characteristics of the 130 hazards with data quality characteristics
Analysis of the brief Short Descriptions entered on the first screen of the Hazard Manager indicates that 10 percent (49 of 495) hazards were related in some way to data being entered, linked, routed or displayed/printed for the wrong patient. Health IT applications may contribute to entry of data in the wrong patient’s record, and organizational policies may play also contribute (e.g., by allowing multiple records to be open by the same user at the same time). An IT system may route a result to the wrong clinician, or there may be a discrepancy between the data in the EHR and the data shown on a display or table. The two Data Quality characteristics in the beta version of the Hazard Manager that concerned such wrong-patient problems—Incorrect Patient Information and Information Linked to the Wrong Patient—do not address all of these situations, and the distinctions are important because the remedy for each would be quite different. The Hazard Manager is therefore revised to contain four characteristics related to wrong-patient information:
• IT design contributed to entry of data in the wrong patient’s record. • Organizational policy contributed to entry of data in the wrong patient’s record. • Patient information routed to the wrong recipient. • Discrepancy between database and displayed or exported data.
Miscalculation of a Result (by Health IT software) was a characteristic in only 3 percent of hazards and study participants agreed that software almost never “miscalculates”—the issue is usually that the software was incorrectly specified or programmed (a Software Design problem), or the results were displayed in a way that was confusing to users (a Usability problem). Miscalculation of a Result (by Health IT software) is therefore removed from the Hazard Manager 2.0.
43%
22%
13%
3%
31%
0%
12%
0% 20% 40% 60% 80% 100%
Incorrect patient information
Information linked to wrong patient
Faulty reference information
Miscalculation of a result (by HIT)
Lost data
Inaccurate Natural Language Processing
Other
Percent of Hazards
Data
Qua
lity
Char
acte
ristic
s
130 Hazards with Data Quality Characteristics

38
Three Data Quality characteristics in the Hazard Manager were seen by study participants as clear and useful, and remain unchanged: Lost Data, Inaccurate Natural Language Processing, and Faulty Reference Information. Although Inaccurate Natural Language Processing is not yet a common characteristic underlying health IT hazards, study participants agreed that their organizations are increasingly implementing this technology and they anticipate that it will contribute to hazards in the future.
Clinical Decision Support
Clinical Decision Support (CDS) contributed to 16 percent (80 of 495) hazards and the study sites did not vary significantly in the extent to which CDS was involved in their hazards. The Hazard Manager beta-test contained the following characteristics in the category of Clinical Decision Support:
• Faulty Recommendation • Missing Recommendation • Clinical Content Inadequate • Decision-Engine Logic Inadequate • Inappropriate level of automation • Other (specify)
Among the CDS characteristics cited in hazards, Missing Recommendation and Faulty Recommendation were the most common (see Exhibit 14).
Exhibit 14. Characteristics of the 80 hazards with CDS characteristics
20%
56%
9%
8%
16%
8%
0% 20% 40% 60% 80% 100%
Faulty Recommendation
Missing Recommendation
Clinical Content Inadequate
Decision-Engine Log Inadequate
Inappropriate level of automation
Other
Percent of Hazards
CDS
Char
acte
ristic
s
80 Hazards with CDS Characeristics

39
Study participants cautioned that nonspecific alerts can be hazardous, because clinicians may overlook important warnings (often referred to as “alert fatigue”). The Hazard Manager 2.0 includes a new characteristic Excessive NonSpecific Recommendations/Alerts.
Study participants recommended the retention of Inappropriate Level of Automation, and Inadequate Clinical Content in the Hazard Manager. They also advised that the logic in a clinical decision engine is not usually inadequate, rather the logic may not be implemented in a way that is understandable to users (Usability or Implementation issues). Decision-Engine Logic Inadequate has therefore been removed from the Hazard Manager 2.0.
Other User Characteristics
Other User Characteristics contributed to 17 percent (84 of 495) hazards. One study site’s participants cited User Characteristics in nearly half of its hazards; participants at the other study sites identified User Characteristics in less than 15 percent of their hazards. After discussion with participants from the anomalous study site, the reasons for its higher rate of User Characteristics were unclear.
The category of Other User Hazards in the beta-test Hazard Manager contained the following characteristics:
• Fatigue • Lack of Professionalism • Unforced user error
Exhibit 15 below presents the percentages of Other User Characteristics that were identified in the 84 hazards with Other User Characteristics.
Exhibit 15. Characteristics of the 84 hazards with other user characteristics
2%
6%
94%
0% 20% 40% 60% 80% 100%
Fatigue
Lack of professionalism
Unforced user error
Percent of Hazards
Oth
er U
ser C
hara
cter
istic
s
84 Hazards with Other User Characteristics

40
Study participants who are part of IT teams advised that they would not ordinarily know whether a hazard or incident was related to fatigue or a lack of professional behavior on the part of a clinician-user. Fatigue (two hazards) and Lack of Professionalism (five hazards) are therefore removed from the Hazard Manager 2.0.
Unforced User Error was the second most frequently selected characteristic among all beta-test hazards (second only to Faulty Design) and was interpreted by most study participants as being equivalent to user error—the forced vs. unforced nature of the error was either unclear or unknown as they entered hazards. We explored the issue of User Error in greater detail, to understand whether it incorporates more than one construct that should be disaggregated.
In four of the six inter-rater test scenarios, User Error was viewed as a contributory characteristic (although not the only characteristic) by one or more of the seven participating sites. (See Exhibit 16.)
Exhibit 16. Unforced user error selected as a contributing characteristic in inter-rater test scenarios
Inter-Rater Test Scenarios (7 study sites):
Unforced User Error New
“Discontinue All” button confused
with order-signing button
Inter-cranial
Pressure formula
incorrectly reset
Potassium overdose due to IV and PO
displayed/ calculated separately
Patient named “Test”
Too many charts open:
wrong-patient order entry
Note-writer tool
failed to erase
entries
# of Participants indicating Unforced User Error contributed to the hazard scenario
1 2 3 0 5 0
One of the inter-rater test scenarios (wrong-patient order entry) involved a situation that five of the seven test participants attributed in part to User Error. Participants at the other two study sites disagreed and felt strongly that most health IT systems are deficient and fail to protect users from the common problem of wrong-patient order entry. In addition, they pointed out that in the test scenario, organizational policies permitted users to have multiple records open at the same time, which contributed to the hazard. These two study participants felt that this frequent and predictable hazard could be avoided by improved software and organizational policies, and it is both unfair and dangerous to rely entirely on user vigilance as a safeguard.

41
One of the study site participants (a Director of Patient Safety) remarked that a majority of user errors can instead be viewed as deficient IT systems failing to protect users: “Human beings get tired and distracted; a smart IT system should protect tired, distracted people from making mistakes that could harm patients.” FDA representatives at the all-project meeting advised that the alternative construct of use error (rather than user error) would note the errant action, rather than blaming the user for erring. The Hazard Manager 2.0 takes this approach a step further and includes Use Error in the Absence of Other Hazard Characteristics. Thus only when other (presumably remediable) characteristics are ruled out, will a user’s error be recorded as contributing to a hazard.
Other Organizational Characteristics
Other Organizational Characteristics contributed to 27 percent (131 of the 495) hazards entered during the test. Study sites varied in the percent of their hazards to which Other Organizational Characteristics contributed, ranging from 7 percent to 70 percent. Much of the site-level difference was due to different rates of Inadequate Training Infrastructure, which was the most common Other Organizational Characteristic (see Exhibit 17 below).
The beta version Hazard Manager included the following in the category of Other Organizational Characteristics:
• Inadequate training infrastructure • Excessive workload (including cognitive) • Inadequate change management • Compromised communication among clinicians • Care processes poorly defined • Unclear policies • Interactions with other (nonhealth IT) care systems • Loss of preexisting safeguards • Virus or other malware • Security breach • Other (specify)

42
Exhibit 17. Characteristics of the 131 hazards with other organizational factors characteristics
A few hazards entered during the beta-test involved environmental characteristics such as placement of hardware or damaged equipment, poor lighting, facilities (heating, power), etc. A new characteristic called Physical Environment is therefore included in the Hazard Manager 2.0 to address miscellaneous environmental issues, including biomedical engineering.
Hazards related to Viruses or Other Malware are quite rare, but study participants nevertheless recommended that this characteristic be retained in the Hazard Manager. They suggested, however, that Security Breach be expanded to include all hazards where data are inadequately secured. The Hazard Manager 2.0 therefore includes Virus or Other Malware and Inadequately Secured Data.
Implementation
Implementation issues contributed to 9 percent (45 of 495) hazards. The Implementation category contained the following characteristics in the beta version of the Hazard Manager:
• Inadequate software change control • Inadequate project management • Inadequate control of user access • Unpredictable elements of the patient’s record available only on paper/scanned
documents • Other (specify)
As Exhibit 18 shows below, the most common Implementation issue was Inadequate Software Change Control.
32% 15%
8% 16% 19%
11% 9%
12% 0% 1%
18%
0% 20% 40% 60% 80% 100%
Inadequate training infrastructure Excessive workload (including cognitive)
Inadequate change management Compromised communication among clinicians
Care processess poorly defined Unclear policies
Interactions with other (non-HIT) care systems Loss of pre-existing safeguards
Virus or other malware Security breach
Other
Percent of Hazards
Oth
er O
rgan
izat
iona
l Fac
tors
131 Hazards with Other Organizational Factors

43
Exhibit 18. Characteristics of the 45 hazards with Implementation characteristics
Although Implementation appeared to be an infrequent contributor to health IT hazards, discussion with study participants and analysis of ‘Other (specify)’ entries indicated that this is not the case—rather the Hazard Manager beta version ontology failed to elucidate important implementation issues, or incorrectly grouped implementation characteristics into other categories.
Inadequate Software Change Control was cited as contributing to the misentered Intercranial Pressure formula by six of seven participants. Study participants viewed this specific hazard as a vendor responsibility, since the deficient software design required manual reentry of the formula after each upgrade. Unclear Policies that failed to require verification and testing of the re-entered formula was also cited as a characteristic of this hazard, and three test participants blamed the software itself for miscalculating the result—they felt that the software should have had safeguards to prevent the miscalculation (e.g., reference to a ‘control’ patient). Study participants advised that Unpredictable elements of the patient’s record available only on paper/scanned documents is a Data Quality problem rather than an Implementation problem, and this characteristic was reassigned to the Data Quality category.
Study participants recommended that the Hazard Manager distinguish characteristics that are the responsibility of vendors (software specification and design, vendor testing, implementation tools, etc.) from characteristics that are the responsibility of local IT teams (local configuration, local training, etc.) The Hazard Manager 2.0 groups vendor responsibilities (Software Design and Implementation) into a new category of Vendor Characteristics, and contains a separate category of Local Implementation characteristics.
40%
24%
18%
11%
24%
0% 20% 40% 60% 80% 100%
Inadequate software change control
Inadequate project management
Inadequate control of user access
Unpredictable elements of patient's record available only on paper/scanned documents
Other
Percent of Hazards
Impl
emen
tatio
n Ch
arac
teris
tics
45 Hazards with Implementation Characteristics
44
Hardware
Hardware contributed to 13 (3 percent) of the 495 hazards. The beta version category of Hardware contained the following hardware characteristics:
• Insufficient user hardware • User hardware poorly located • User hardware not working or malfunctioning • Back-end hardware failure • Slow health IT response • Other (specify)
Study participants felt that these separate hardware characteristics need not be distinguished. The Hazard Manager 2.0 therefore contains a single characteristic, “Hardware Failure.”
Hazard Manager 2.0 Causation Categories and Characteristics
As a result of the many revisions described above, the revised Categories in the Hazard Manager 2.0 Causation tab are as follows:
1. Usability 2. Data Quality 3. Decision Support 4. Vendor Characteristics (includes Software Design) 5. Local Implementation Characteristics 6. Other Characteristics (includes Hardware and Other User Characteristics)
In summary: the most significant structural change in the Hazard Manager Causation tab is the separation between Vendor characteristics (software design, implementation, testing, etc.) and characteristics related to Local Implementation. Another structural change is eliminating the categories of Hardware and also Software Design, and discarding or redistributing their subordinate characteristics to more appropriate categories. In addition, four characteristics related to wrong-patient data entry, ordering, result routing, or information display/printing replace the two previous characteristics that were insufficiently specific for these common types of hazards. Faulty Design and User Error, the two most frequently cited characteristics among the 495 hazards entered, are redefined to articulate the specific software design flaws that failed to prevent users from erring. Finally, Excessive Nonspecific Alerts and Recommendations is now specified as a characteristic.
At the recommendation of study participants, some of the Causation terms are defined with hover-over definitions implemented in the Hazard Manager 2.0. Terms that were widely and

45
consistently understood are not defined (a future enhancement could offer definitions for all terms in the Hazard Manager).
3.4 Impact The Impact tab in the Hazard Manager asks users to estimate the potential for a hazard to compromise care or harm a patient, and the estimated severity and duration of any resulting harm.
Impact information will offer care delivery organizations and vendors insights regarding:
• The causes of hazards that if discovered too late will likely lead to patient harm.
• The scale of impact of different types of hazards (number of patients affected, duration and severity of harm).
• Improved ability to predict the risks posed by hazards and to identify those most likely to cause harm.
Hazard Manager 2.0 first asks if a hazard has affected the process of care. When this first question is answered “no,” users are asked about the potential for the hazard to affect the process of care, if left uncorrected. When this initial question is answered “yes,” indicating that a hazard was in production and affected clinical care processes, users are next asked whether the compromised care process reached any patients and if so, whether any harm occurred. This branching logic separates hazards with a potential to affect care from those that have already done so, making hazard documentation easier and more efficient.
The following screen shot shows the questions posed for hazards that have not yet affected care delivery (Exhibit 19); the second screen shot shows the questions posed for hazards that have already affected care, including questions about patient harm resulting from a hazard (Exhibit 20).

46
Exhibit 19. Screenshot of hazard manager 2.0 impact tab for hazards that have not affected a care process

47
Exhibit 20. Screenshot of hazard manager 2.0 impact tab for hazards that have affected a care process

48
Establishing Whether a Hazard Affected the Process of Care
The Impact tab in the beta version Hazard Manager took a different approach and first asked users about:
“Risk of care-process compromise” [select one]
• Ruled Out Definitively • Low likelihood • Moderate likelihood • High likelihood • Has occurred – Here • Has occurred – Elsewhere
Some study participants were unclear about the meaning of “care-process compromise,” and a concern was raised that nonclinical staff (e.g., IT production teams) may be unfamiliar with this clinical construct. This first question about impact was not answered for 15 of the 495 test hazards; of the remaining 480, a care process was compromised (has occurred ‘here’ or ‘elsewhere’) in 31 percent (151 hazards). When study participants checked that a hazard “Has occurred here” or “Has occurred elsewhere,” indicating that the process of care had already been affected by the hazard, they were then asked whether the hazard had reached a patient, and whether a patient was harmed. Participants were confused by this logic sequence and advised that a clearer sequence would be to ask first whether a hazard has affected care, and separately whether it has reached a patient; Hazard Manager 2.0 takes this approach.
Potential for Patient Harm
The beta version of the Hazard Manager did not directly address hazards that have not yet affected care, but have the potential to do so. Many hazards discovered and fixed during design, build and testing phases are addressed before “go live” and therefore cannot affect care; if undiscovered and uncorrected, however, the potential to affect care and harm patients remains. Some hazards have the potential to cause very serious harm to many patients; others have only a slight chance of reaching or harming even one patient. The beta version of the Hazard Manager failed to make all of these distinctions, or record estimation of impact should a hazard continue uncorrected.
One goal of the Hazard Manager is to improve the ability of CDOs to discover hazards and estimate their potential for harm, so as to better prioritize workload for teams tasked with correcting hazards. The Hazard Manager 2.0 therefore asks users to estimate the likelihood that an affected care process will harm a patient if left uncorrected. Assessing the potential for harm includes: estimating the likelihood that a clinician-user might notice the hazard before any patients are harmed, estimating the number of patients that could be affected if the hazard is not

49
fixed, and estimating how serious that harm could be in a worst case scenario. Although some study participants were uncomfortable with the hypothetical nature of these estimates and were reluctant to estimate “what could happen if,” all agreed that it is important to distinguish hazards with little potential to cause harm from those that assuredly will do so if uncorrected.
The Hazard Manager beta version asked whether a hazard with the potential to compromise care would cause a delay in care, an omission of needed care or a commission of unnecessary (and potentially harmful) care. Study participants criticized this question because a single hazard can cause delay, omission and commission, for different patients. For example, a hazard that leads to entry of orders on the wrong patient would cause one patient to get something they should not, and the other to miss something they need—both omission and commission effects. Hazard Manager 2.0 no longer asks users to classify what type of care-process compromise occurred and instead focuses on the severity, duration and type of patient harm.
Patient Harm
Of the 151 beta-test hazards that compromised care, 9 percent (14 hazards) that caused patient harm were identified. For these 14 hazards, users were offered a harm ‘scale’ that distinguished major from minor patient harm, and temporary from chronic consequences. This harm scale did not mirror the AHRQ Harm Scale, because the latter did not distinguish degree of harm from duration of harm. AHRQ is now testing a revised harm scale that makes this distinction; this revised AHRQ Harm Scale is implemented in the Hazard Manager 2.0.
The AHRQ Harm Scale is intended for reporting of single-patient incidents and does not address situations where more than one patient is harmed. Health IT hazards, however, have the potential to affect hundreds or even thousands of patients before being corrected. (For example, the unintentional inactivation of alerts from a pediatric immunization scheduling module that went undiscovered for several months.) AHRQ advises that in situations where multiple patients are harmed, the worst case should be entered—the patient who suffered most and longest as a result of the hazard.
Neither the previous nor revised AHRQ Harm Scales specify the type of harm experienced by patients; both AHRQ Harm Scales combine physical and psychological harm, and are silent about financial or reputational harm to patients. It is possible, however, that a hazard could cause no physical harm, but have profound reputational repercussions (e.g., unauthorized release of HIV or mental health information to the media could cause reputational harm). The Hazard Manager therefore asks users to note the types of harm resulting from a hazard, in addition to the severity and duration of harm. Sometimes the type of harm is unknown or still progressing at the time a hazard is entered; for these situations users may indicate Don’t Know.
50
Date and Time When Harm was Identified
In the beta version of the Hazard Manager, users who indicated that care process compromise Has occurred-here (151 hazards) could use calendar and clock functions to indicate “When did the care-process compromise occur?” Of the 151 hazards where care compromise Has occurred here, the calendar and clock were used in 15 percent (23 hazards). If users then indicated that patient harm had occurred (14 hazards), they could use additional calendar and clock functions to answer “When was the patient harm identified?” Of the 14 hazards that harmed patients, the second set of calendar/clock were used in six hazards. Test participants advised that the information captured by these calendars and clocks is difficult to obtain and of little operational value in correcting hazards. They suggested that the tool instead ask the more direct question of how many patients were harmed. The date and time functions are therefore removed from the Hazard Manager 2.0 and replaced with a new question: “Best estimate of how many patients were harmed?” (<10, 10-100, or >100).
3.5 Hazard Contro l P lan The beta version of the Hazard Manager invited users to document their plans for correcting the hazard, in a tab called Corrective Action. This label was confusing to study participants and is relabeled Hazard Control Plan in the Hazard Manager 2.0. This tab captures information about the status, urgency and plan for hazard resolution. The information entered in this tab can be used to identify patterns in the approach to hazard control, and how control plans differ between hazards that have not yet affected care or caused harm, and those that have.
Exhibit 21 below is a screenshot of the Hazard Control Plan tab in the Hazard Manager 2.0 as it appears when a hazard requires the maximum three Control Steps.
Control Steps
The Corrective Action tab in the beta version of the Hazard Manager asked users to report a hazard’s “Initial Fix” and “Definitive Fix.” The following questions were asked first about the “Initial Fix” and again about the “Definitive Fix”:
“Fix date”: [date and time]
“Urgency of Fix”: [select one] (see discussion above)
• Urgency: Fix or remove from use within 24 hours • Urgency: Fix or remove from use within 72 hours • Urgency: Fix or remove from use within 1 month • Urgency: Fix or remove from use within 6 months

51
Exhibit 21. A screenshot of the hazard manager 2.0 hazard control plan tab

52
• No fix or removal possible • No fix or removal required
“Completeness of Fix”: [select one]
• Partial • Complete • None Feasible • None needed
“Plan” [private free-text field]
“Fix”: [multiselect]
• Software Upgrade (vendor) • Training for local IT • Configuration Change (local IT) • Custom Programming (local IT) • Care-Process Change • Policy Change • Training for End Users • Other (specify)
Given the often incremental nature of hazard resolution, the term “fix” is replaced with “control step” in the Hazard Manager 2.0. Study participants advised that it is difficult to assign a date and time to each control step because there may be several attempts before a “Definitive” fix is achieved. The beta-test data reflect this difficulty: of the 495 hazards, only three hazards included both a date and time for the “Initial Fix,” and seven had a date and time recorded for the “Definitive Fix.” Because study participants did not find the calendars and clocks on this tab useful, they are removed from the Hazard Manager 2.0.
Study participants who entered hazards that required just one control step were uncertain whether they should enter that one step as “Initial” or “Definitive,” or both. Hazards requiring more than two control steps were also difficult to enter. To address these issues, the Hazard Manager 2.0 Hazard Control Plan tab presents users with a first control step entry and these questions:
“Initial Control Step” [multiselect]
• Vendor Software Fix • Local IT Configuration Change • Local IT Custom Programming • Training for local IT

53
• Training for End Users • Care-process change • Policy change • Other
It then asks: “How complete is the control/correction of this hazard?” [select one]
• Complete • Partial; additional steps needed
If a user selects Partial; additional steps needed, they are asked for information about the “Next Control Step” (same questions as above). If they again answer Partial; additional steps needed they can enter a “Final Control Step.”
Hazard Action Plan and Urgency
A question at the top left corner of the screen in the beta version first asked to select one “Hazard Mitigation Plan” from the following:
• Do not implement affected software • Implement only after written risk acceptance • No mitigation plan required • No mitigation feasible
Study participants advised that the location of this question at the top left of the screen was confusing because it was positioned directly above “Initial Fix,” suggesting that it was related to only the initial fix, and not a general question about the entire approach to correcting the hazard. This confusion may have contributed to the fact that among the 495 hazards entered, only 43 percent (214 hazards) included answers to this question about the hazard mitigation plan.
Study participants found the terminology “Hazard Mitigation Plan” confusing and not always appropriate since it implied that the hazard was still present, even though many hazards are resolved immediately, before being entered in the Hazard Manager. In addition study participants did not feel that the answer options were comprehensive, particularly for hazards that were discovered after going into production.
Study participants felt that the questions about the urgency of the initial and definitive fix did not adequately convey the overall urgency for correcting a hazard because they were specific to each stage of the “fix,” not to the entire hazard. Participants were also unsure how to assign an urgency level for each stage of hazard correction. They suggested a general urgency question relative to the entire hazard, to facilitate triage and prioritization for teams tasked with correcting a hazard. Participants also suggested adding a skip logic for hazards with No mitigation plan

54
required and No mitigation feasible for situations when a “fix” is either unnecessary of impossible.
Based on these comments the Hazard Manager 2.0 was revised to combine “Hazard Mitigation Plan” and “Urgency” in the following question that applies to the entire hazard:
“How quickly must this hazard be fixed?” [select one]
• Already controlled—no action needed • Do not control—the risks exceed the benefits [no additional questions can be answered in
this tab] • If hazard is in production: URGENT—fix software or remove it from use within 24
hours • If hazard is in production: control hazard within 1 month • If hazard is in production: control hazard within 6 months • If hazard is not yet in production: delay implementation until software is fixed • Other
If users select Do not control-risks exceed the benefits, a new skip logic prevents them from answering any additional questions in this tab and informs them that “No further hazard control plan information is required.”
Completeness of Resolution
The beta version of the Hazard Manager asked users how complete hazard resolution was:
“Activity status”
• In Progress • Case closed: resolved • Case closed: not resolved
The Hazard Manager 2.0 now focuses on the completion of individual control steps, as described above.
The Hazard Manager 2.0 includes only one “Plan” free text field, which remains private and visible only to the CDO—it is a place where the team working to correct a hazard can leave notes for each other.

55
3.6 Hazard Contro l P lan Approva l The beta version Hazard Manager offered a tab called Vetting and Resolution that contained two identical lists, from which users could indicate who was ‘responsible for vetting’ a hazard mitigation plan, and who was ‘responsible for hazard mitigation.’ These questions were intended to identify the roles of different participants (vendors, IT teams, clinical leadership, etc.) in controlling hazards that are discovered at different stages (e.g., testing, go-live, production), and hazards with differing causality and severity.
Study participants did not interpret the purpose of these lists consistently. Some participants used the first list to identify anyone who should be informed about a particular hazard—everyone with a ‘need to know.’ Others used the first list more narrowly to identify departments that would be involved in correcting the hazard, or who would need to approve the hazard mitigation plan. Often the same departments were checked on both lists, indicating that all of the individuals who would approve the hazard mitigation plan would also be responsible for carrying it out.
In Hazard Manager 2.0, the purpose of this tab was clarified by renaming it hazard control Plan Approval. The term ‘hazard mitigation plan’ was confusing to study participants and is revised as ‘hazard control plan’ in the Hazard Manager 2.0—terminology that was more widely and consistently understood by study participants. The questions were also refined: ‘responsible for vetting’ is now ‘who needs to approve the hazard control plan?’ and ‘responsible for hazard mitigation’ is now ‘who will implement the hazard control plan?’ Exhibit 22 below shows the Hazard Manager 2.0 tab for Plan Approval.
The department that needed to vet the hazard mitigation plan was indicated in 84 percent of the 495 hazards, and the department that needed to carry out the mitigation plan was indicated in 85 percent. Local IT was responsible for vetting the plan in 85 percent of hazards, while Local IT and Clinical Leadership were responsible for carrying out the mitigation plan in 83 percent and 73 percent of hazards, respectively. Other departments were held responsible for vetting or carrying out a hazard mitigation plan less frequently. Exhibit 23 below shows how often each department was selected to vet and carry out the mitigation plan.

56
Exhibit 22. Screenshot of the hazard manager plan approval
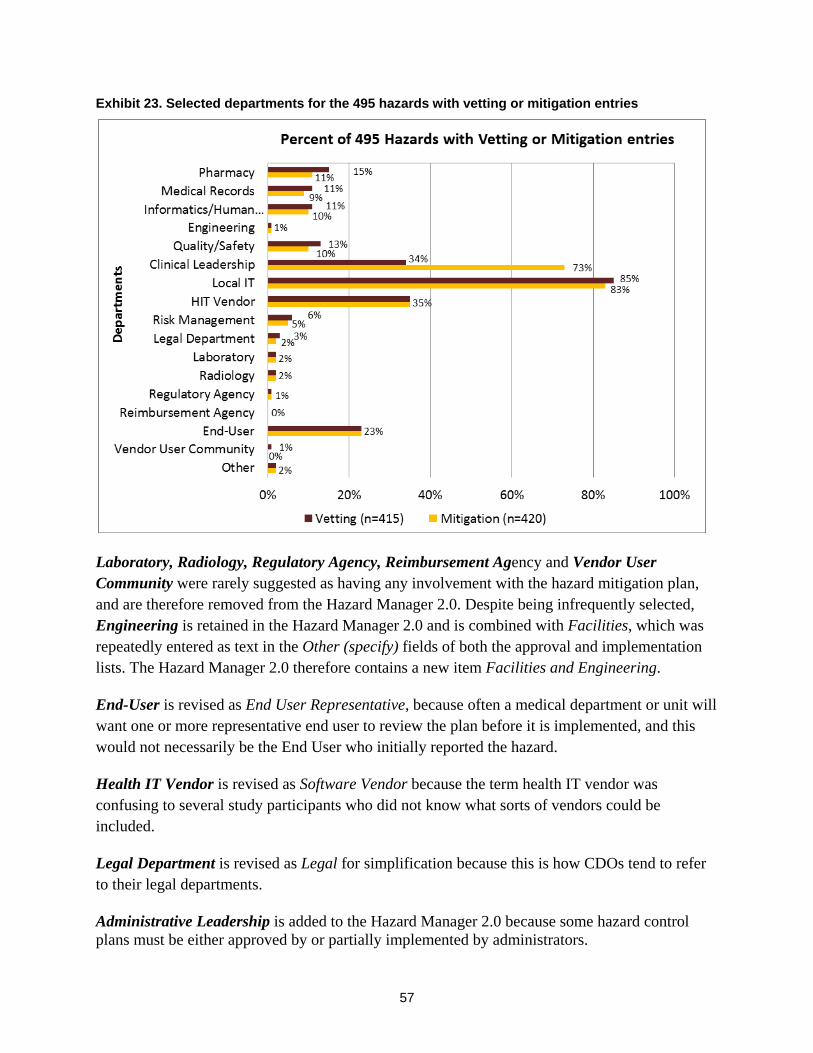
57
Exhibit 23. Selected departments for the 495 hazards with vetting or mitigation entries
Laboratory, Radiology, Regulatory Agency, Reimbursement Agency and Vendor User Community were rarely suggested as having any involvement with the hazard mitigation plan, and are therefore removed from the Hazard Manager 2.0. Despite being infrequently selected, Engineering is retained in the Hazard Manager 2.0 and is combined with Facilities, which was repeatedly entered as text in the Other (specify) fields of both the approval and implementation lists. The Hazard Manager 2.0 therefore contains a new item Facilities and Engineering.
End-User is revised as End User Representative, because often a medical department or unit will want one or more representative end user to review the plan before it is implemented, and this would not necessarily be the End User who initially reported the hazard.
Health IT Vendor is revised as Software Vendor because the term health IT vendor was confusing to several study participants who did not know what sorts of vendors could be included.
Legal Department is revised as Legal for simplification because this is how CDOs tend to refer to their legal departments.
Administrative Leadership is added to the Hazard Manager 2.0 because some hazard control plans must be either approved by or partially implemented by administrators.

58
Clinical Leadership, Local IT, Informatics/Human Factors, Quality/Safety, Risk Management, and Medical Records are retained in the Hazard Manager 2.0 without alteration.
To clarify the distinction between vetting a hazard control plan and carrying it out, the Hazard Manager 2.0 prompts the user to identify who must approve the hazard solution vs. who will implement it, and offers the same list for both:
• Clinical Leadership • Administrative Leadership • End User representatives • Local IT • Software Vendor • Informatics/Human Factors • Quality/Safety • Risk Management • Medical Records • Facilities and Engineering • Legal • Other(specify)
3.7 Notes and References The beta version Hazard Manager offered users two free-text tabs at the end: one labeled Notes, for CDO teams to document any hazard management activities for themselves, and the other labeled References, for users to note any references from within their CDO or from published literature that could be relevant to the hazard. Study participants appreciated the private free-text space for these purposes, but advised that only one such tab is needed. The Hazard Manager 2.0 therefore contains one tab at the end for Notes and References.

59
4.0 Additional Insights The beta-test raised important issues related to future use of the Hazard Manager; these insights may also be relevant for health IT-related incident reporting systems (e.g., AHRQ Common Formats).
4.1 Vendor Pers pec tives Five health IT vendors participated in the beta-test by reviewing the Hazard Manager, searching hazards entered by study sites (de-identified), and providing feedback; four of the five vendors also attended the all-project meeting at the conclusion of the test phase of the project. The five vendors shared the following perspectives about the Hazard Manager:
• Vendors generally support the goal of prospective identification of hazards, before hazards can compromise care or endanger patients.
• Vendors’ customers often contact them directly, and vendors estimate that they learn about 10 percent of the hazards present in their products – those that require immediate attention from the vendor—in this way. Vendors do not solicit hazards from their customers, however: they wait for customers to raise high-priority issues that require attention. Vendors are aware that they never hear about the other 90 percent of potential hazards, which their customers cope with individually. Vendors would like to address some of these other issues, if they can learn which are most common and have the greatest potential to compromise care. They requested that the Hazard Manager explicitly identify hazards that have not been reported to a vendor (which beta version does).
• Vendors have systems in place for communicating with their customers about issues that require attention, each using their own terminologies for categorizing the nature and antecedents of hazards. Most CDOs use products from multiple vendors; when hazards arise at the interface of different vendors’ products, there is no mechanism for consistent, simultaneous reporting of the hazard to the multiple vendors involved. The Hazard Manager addresses this need.
• Vendors generally use ad hoc and informal mechanisms to identify hazards or issues that are faced by many of their customers; they do not aggregate hazards across their customers to identify common problems. The Hazard Manager addresses this need.
• Vendors are concerned that the Hazard Manager not interfere with their existing customer communication channels. They worry that a customer who reports a hazard using the Hazard Manager may not send the same information to the vendor—believing that the vendor will be checking the Hazard Manager to learn about issues.

60
• Vendors and CDOs raised the related issue of duplicative reporting: CDOs reporting problems to their IT vendors, separately entering hazards in the Hazard Manager, and also reporting to Patient Safety Organizations.
• Vendors wish to be able to add ‘comments’ to Hazard Manager reports about their products, to explain which hazards have been fixed and which are local issues that must be addressed by CDOs (not vendors). They believe that the Hazard Manager database should not be used by policymakers to monitor the safety of individual vendors’ products, since the database contains only information from CDOs and lacks a mechanism to incorporate vendor explanations and insights.
• Vendors wish to contact their customers who enter high-priority hazards. Vendors agreed that the Hazard Manager could meet this need by supporting brokered communication requests from vendors who wish to contact the CDO reporting a hazard, in a way that protects CDO confidentiality. (See section 5.0 below.)
4.2 Us e Cas es for the Health IT Hazard Manager The participants in the all-project meeting offered many examples of how the information collected via the Hazard Manager data might be used by various stakeholders:
Care Delivery Organizations
• Support proactive hazard identification and improve safety by monitoring whether they are discovering hazards increasingly early in the health IT lifecycle (i.e., prior to production use).
• Improve the ability to estimate the seriousness of risk posed by different types of hazards, to better prioritize workload for IT staff.
• Share information between their own IT and Patient Safety teams, whose separate tracking systems are generally not integrated.
• Determine the percent of hazards that occur at the interface of two different vendors’ products, which of their vendors’ products are most involved in these interface-related hazards, and how these trends differ from national patterns reported by other CDOs.
• Prior to upgrading to a new product release, learn about hazards others have reported with that new version of the product.
• Appeal to their vendors for corrective action, by pointing to the frequency and volume of specific hazards across CDOs that use the same product.

61
Vendors
• Learn about the 90 percent of hazards that their customers do not presently share with them, especially those experienced by multiple customers.
• Learn which other vendors’ products frequently contribute to hazards when paired with their own (i.e., where interface issues are most problematic).
• Identify which hazards are unique to one customer, or shared by many, to prioritize software revision.
• Identify new hazards immediately following release of an upgrade to their products.
Policymakers and Regulators
• Determine hazards that occur at the interface of different vendors’ products (e.g., the hazards associated with using a pharmacy order-management system and CPOE from any two vendors).
• Compare hazards reported via this tool with reports filed through the PSO Common Formats, for a complete picture of the lifecycle of health IT hazards.
• Use information about the types of hazards that put patients most at risk, and when these hazards are discovered, to support design of programs to drive hazard identification ever earlier in the IT lifecycle (i.e., prior to production use); use Hazard Manager data to monitor the success of such programs.


63
5.0 Policy Implications and Next Steps In future Federal deliberations about deployment of the health IT Hazard Manager as part of a National infrastructure for monitoring and improving health IT safety, the following issues should be considered:
• Data aggregation at multiple levels: enabling care delivery organizations (CDOs) (and health IT vendors and researchers) to learn from their own experience, from the experience of others using the same combination of applications that they do, and from the experience of all health IT users.
• Version Control: ensuring that all community members have access to the same version of the Hazard Manager’s ontology.
• Confidentiality: determining whether and to what extent CDOs and vendors who report hazards to the system should have their confidentiality protected.
• Access to detailed information: confidential brokering of requests between those wanting more information about a hazard and the organization that reported the hazard.
A usable and useful health IT Hazard Manager would open several options to policy-makers, patient-safety organizations (including formal PSOs), professional societies, regulators, and others:
1. Integrate the Health IT Hazard Manager data with aggregate Common Formats data in the National Patient Safety Database (NPSD). The NPSD aggregates patient safety reports from Patient Safety Organizations, using the AHRQ Common Formats for reporting (http://www.ahrq.gov/qual/psoact.htm accessed on April 25, 2012). The NPSD is an evidence-based management resource for health care providers, patient safety organizations, researchers, and others interested in patient safety events and quality of care. Data about health IT hazards could be reported to the NPSD through PSOs. As the NPSD only accepts data in the Common Formats, key data elements from Hazard Manager would need to be identified and potentially integrated into future versions of the Common Formats. This mechanism would enable CDOs and vendors to report hazards efficiently and confidentially through a PSO. An independent information aggregation and analysis entity, such as the NPSD, could maintain a national database of de-identified hazards and make reports available to CDOs, vendors, researchers, and regulators. It could also broker confidential requests between interested parties and original reports of a hazard, to explore specific hazards further. Finally, this entity could perform analytics on the database, identifying patterns of hazards for further research. This option could be supported by a policy of
64
either voluntary or mandatory reporting. If voluntary, various incentives to encourage widespread reporting would reduce concerns about the data being partial or nonrepresentative. For example, a policy option to encourage proactive control of health IT hazards could entail extending the Joint Commission safety standard LD.5.2 (“Leaders ensure that an ongoing, proactive program for identifying risks to patient safety and reducing medical/health care errors is defined and implemented”)5
The AHRQ Common Formats are updated annually and include the necessary technical specifications for reporting entities. Development of a new Common Formats module for the health IT hazards or expansion of the current Common Formats Device with Health IT module to include additional elements related to health IT hazards would secure the standardization of the evolving Hazard Manager ontology and the accessibility of reports to all interested parties, improving the culture of safety surrounding health IT. Careful human checks of the brief (public) free-text fields prior to public release might improve reporting rates by increasing confidence in anonymity, although with the adverse effect of increasing the cost of the hazard-reporting system.
to explicitly include health IT hazard reporting.
The success of the Aviation Safety Information Analysis and Sharing (ASIAS) system of voluntary reporting of air-transportation unsafe conditions (nonaccidents)46 suggests the potential of this model for health IT hazards.2
2. In the absence of a central aggregating entity such as the NPSD, the Hazard Manager could be provided to individual CDOs, PSOs, vendors, and researchers by a Federal or private custodian. To maintain the interoperability of the various instances of the Hazard Manager over time, the custodian of the ontology could upgrade the Hazard Manager and ontology. If this upgrading occurred (for example, every 2 years), a use agreement could require users to upgrade to the new version within a year of each upgrade’s publication. This approach would have the virtue of making the Hazard Manager available to interested parties at minimal government cost, while maintaining a standard ontology for health IT hazards to enable comparison/aggregation across health care organizations. While this option would not require central administration, it would have the disadvantage of not supporting data
The hypothesis that such a system would be cost-effective and that CDOs and health IT vendors would trust such a system, would require testing.
2 ASIAS merges databases containing thousands of hazard reports from airlines, airports, air traffic control, weather and other sources, and generates reports exploring common aviation safety hazards. For example, wrong-runway departures are common and have the potential to be quite dangerous; ASIAS released a report on wrong-runway departures that explores the causes and consequences of these errors. An analogy in health IT would be reporting on the common causes and consequences of wrong-patient order-entry.

65
aggregation across health care organizations, and would not support shared learning about hazards related to specific combinations of vendor products.
3. The lowest cost approach would be to offer the Hazard Manager—as is and without any use agreement—for use by CDOs, health IT vendors, PSOs, and researchers. Some of these organizations might cooperate in an open-source software community that would coordinate the Hazard Manager’s future development and use. While this approach would have the lowest governmental cost, it would likely prevent the development of a standards-based national clearinghouse of hazards aggregated at the vendor-product level, making shared learning as expensive as it is in the ASIAS system (which spends most of its budget on cleaning and standardizing reports because the airlines cannot afford to re-engineer all their systems to use a standard ontology).
Finally, analyses of health IT-related hazards, including the effectiveness of various hazard-control strategies, could be funded both by public and private research funders and by health IT vendors, who could be required to report their support or conduct of such research (but not necessarily the results of that research). One obvious research question would be whether there are other common hazardous interfaces, such as the one between nonintegrated order-entry and pharmacy systems. Of course, such analyses will require “new statistical and analytical methods to prioritize events from large volumes of data ... [that] recognize the inherent characteristics of incident reporting data: under-reporting, reporting and surveillance bias, unknown denominators, missing and poor quality data, and reporter variation.”
Effects on the Pace of Health IT Development and Meaningful Use
30
Systems engineering knowledge, and the experience of CDOs and health IT vendors that practice proactive hazard control, suggest that the pace of development and Meaningful Use of health IT will be speeded rather than slowed by proactive hazard control. Hazard control has the potential to improve the quality and efficiency of patient care while enhancing public trust.2,6 Reducing hazards throughout the health IT life cycle would enable developers and implementers to work more efficiently. It also has the potential to decrease the number of expensive (to CDOs and vendors alike) emergency fixes necessitated by hazards that are identified retrospectively—after the health IT has been implemented and a care process has been compromised. These improvements would decrease the complexity and cost of health IT implementation and maintenance, a particular benefit for smaller CDOs and vendors.


67
References 1. DeRosier J, Stalhandske E, Bagian J. Using health
care failure mode and effect analysis: the VA National Center for Patient Safety's Prospective Risk Analysis System. Jt Comm J Qual Improv 2002 May;28(5):248–67, 209.
2. Bonnabry P, Despont-Gros C, Grauser D, et al. A risk analysis method to evaluate the impact of a CPOE system on patient safety. J Am Med Inform Assoc 2008 Jul-Aug;15(4):453–60.
3. Donaldson M. An overview of to err is human: re-emphasizing the message of patient safety. In: Kohn L, Corrigan J, Donaldson M, eds. To Err is Human: Building a Safer Health System. Washington, DC: National Academy Press; 2000.
4. Reason J. Human Error. Cambridge, UK: Cambridge University Press; 1990.
5. Joint Commission on Accreditation of Health care Organizations. 2002 Comprehensive Accreditation Manual for Hospitals: The Official Handbook. Oakbrook Terrace, IL: JCAHO; 2001.
6. Jackson D, Thomas M, Millett L, eds. Software for Dependable Systems: Sufficient Evidence? Washington, DC: National Academies Press; 2007.
7. Available at: Harrison, I. Health informatics—application of clinical risk management to the manufacture of health software. DSCN14/2009, v1.1. National Health Service 2009. http://www.isb.nhs.uk/documents/isb-0129/dscn-14-2009. Accessed December 27, 2011.
8. Lehto M. Optimal warnings: an information and decision theoretic perspective. In: Wogalter M, ed. Handbook of Warnings. Mahwah, NJ: Lawrence Erlbaum Associates; 2006. p. 89–108.
9. McDonough J. Proactive Hazard Analysis and Health Care Policy. New York, NY: Millbank Memorial Fund; 1999.
10. Moizer J. Safety hazard control in the workplace: a dynamic model. Proceedings of the 12th International System Dynamics Conference;1994; Stirling, UK.
11. Leveson N. Hazard Analysis definition. Personal communication. 2008.
12. Shappell S, Wiegmann D. Applying reason: the human characteristics analysis and classification system (HFACS). Human Characteristics and Aerospace Safety 2001;1:59–86.
13. Carayon P, Karsh B. Sociotechnical issues in the implementation of imaging technology. Behav Inf Technol 2000 Jun;19(4):247–62.
14. Institute of Medicine Committee on Patient Safety and Health Information Technology. Health IT and Patient Safety: Building Safer Systems for Better Care. Washington, DC: Institute of Medicine of the National Academies; 2011.
15. Wogalter M. Purposes and scope of warning. In: Wogalter M, ed. Handbook of Warnings. Mahwah, NJ: Lawrence Erlbaum Associates; 2006. p. 3–9.
16. Classen D, Avery A, Bates D. Evaluation and certification of computerized provider order entry systems. J Am Med Inform Assoc 2007 Jan-Feb;14(1):48–55.
17. Han Y, Carcillo J, Venkataraman S, et al. Unexpected increased mortality after implementation of a commercially sold CPOE system. Pediatrics 2005 Dec;116(6):1506–12.
18. Magrabi F, Ong M-S, Runciman W, et al. An analysis of computer-related patient safety incidents to inform the development of a classification. J Am Med Inform Assoc 2010 Nov-Dec;17(6):663–70.
19. Rasmussen J. Risk management in a dynamic society: a modelling problem. Saf Sci 1997;27(2):183–213.
20. Johnson J, Barach P. Clinical microsystems in health care: the role of human characteristics in shaping the microsystem. In: Carayon P, ed. Handbook of Human Characteristics and Ergonomics in Health Care and Patient Safety. Mahwah, NJ: Lawrence Erlbaum Associates; 2007.
21. Bates D. Computerized physician order entry and medication errors: Finding a balance. J Biomed Inform 2005 Aug;38(4):259–61.
22. Carayon, P, Wetterneck T, Hundt A, et al. Assessing nurse interaction with medication administration technologies: The development of observation

68
methodologies. In: Khlaid HM, Helander MG, and Yeo AW, eds. Work with Computing Systems. Kuala Lumpur: Damai Sciences; 2004.
23. Marx DA, Slonim AD. Assessing patient safety risk before the injury occurs: an introduction to sociotechnical probabilistic risk modeling in health care. Qual Saf Health Care 2003 Dec;12 Suppl 2:ii33-8.
24. Samarasa GM, Horst RL. A systems engineering perspective on the human-centered design of health information systems. J Biomed Inform 2005 Feb;38(1):61–74.
25. Williams E, Talley R. The Use of Failure Mode Effect and Criticality Analysis in a Medication Error Subcommittee. Hosp Pharm. 1994 Apr;29(4):331–2, 334–6, 339.
26. Wetterneck TB, Skibinski KA, Roberts TL, et al. Using FMEA to Plan Implementation of Smart IV Pump Technology. Am J Health Syst Pharm 2006; 63(16):1528–38.
27. Israelski E, Muto W. Human characteristics risk management in medical products. In: Carayon P, ed. Handbook of Human Characteristics and Ergonomics in Health Care and Patient Safety. Mahwah, NJ: Lawrence Erlbaum Associates; 2007.
28. Bodenreider O. Biomedical ontologies in action: role in knowledge management, data integration and decision support. Yearb Med Inform 2008:67–79.
29. Smith B, Ashburner M, Rosse C, et al. The OBO foundry: coordinated evolution of ontologies to support biomedical data integration. Nat Biotechnol 2007 Nov;25(11):1251–5.
30. Pham J, Gianci S, Battles J, et al. Establishing a global learning community for incident-reporting systems. Qual Saf Health Care 2010 Oct;19(5):446–51.
31. Johnson C, McElroy P. Supporting the Analysis of Human Error in National and International Incident Reporting Schemes. In: Cottam MP, Harvey DW, Pape RP, et al., eds. Foresight and Precaution: Proceedings of ESREL 2000, SARS and SRA-Europe Annual Conference; 2000 May 14–17; Edinburgh, UK. Oxford, UK: Taylor & Francis; 2000.
32. Available at: Agency for Health care Research and Quality. Hospital common formats version 1.1: event
descriptions, sample reports, and forms. https://www.psoppc.org/Web/patientsafety/version-1.1_documents. Accessed December 27, 2011.
33. Thomadsen B, Lin S-W, Laemmrich P, et al. Analysis of treatment delivery errors in brachytherapy using formal risk analysis techniques. Int J Radiat Oncol Biol Phys 2003 Dec;57(5):1492–508.
34. Available at: National Coordinating Council for Medication Error Reporting and Prevention. NCC MERP Taxonomy of Medication Errors. http://www.nccmerp.org/medErrorTaxonomy.html. Accessed December 27, 2011.
35. Available at: PDR Secure. EHR Safety Event Reporting System Web page. http://www.ehrevent.org/Report-EHR-Safety-Event/Page-1. Accessed December 27, 2011.
36. Ash J, Berg M, Coiera E. Some unintended consequences of information technology in health care: The nature of patient care information system-related errors. J Am Med Inform Assoc 2003 Mar-Apr;11(2):104–12.
37. Horsky J, Kuperman G, Patel V. Comprehensive analysis of a medication dosing error related to CPOE. J Am Med Inform Assoc 2005 Jul-Aug;12(4):377–82.
38. Koppel R, Metlay JP, Cohen A, et al. Role of computerized physician order entry systems in facilitating medication errors. JAMA 2005 Mar;293(10):1197-203.
39. Campbell E, Sittig D. Types of unintended consequences related to computerized provider order entry. J Am Med Inform Assoc 2006 Sep-Oct;13(5):547–56.
40. Ash J, Sittig D, Poon E, et al. The extent and importance of unintended consequences related to computerized provider order entry. J Am Med Inform Assoc 2007 Jul-Aug;14(4):415–23.
41. Koppel R, Wetterneck T, Telles JL, et al. Workarounds to barcode medication administration systems: their occurrences, causes, and threats to patient safety. J Am Med Inform Assoc 2008 Jul-Aug;15(4):408–23.
42. Ash JS, Sittig DF, Dykstra R, et al. The unintended consequences of computerized provider order entry:
69
findings from a mixed methods exploration. Int J Med Inform 2009 Apr;78(Suppl 1):S69–S76.
43. Campbell E, Guappone K, Sittig D, et al. Computerized provider order entry adoption: implications for clinical workflow. J Gen Intern Med 2008 Jan;24(1):21–6.
44. Venkatesh V. Creation of favorable user perceptions: exploring the role of intrinsic motivation. MIS Quarterly 1999 Jun;23(2):239–60.
45. StataCorp. Stata Statistical Software: Release 11. College Station, TX: StataCorp LP; 2009.
46. Available at: Federal Aviation Administration. About ASIAS. http://www.asias.faa.gov/portal/page/ portal/asias_pages/asias_home. Accessed December 27, 2011.