Embed Size (px)
Citation preview
.* r. i!
Agricultural Situation
and Prospects
dpte ,"f-*\E\d
I&It
Europeon UnionAgriculture ond rurol developmenf
#d-&,.*#ff
*eW
b
f, frp*
ffrn
#dfrI#
t#c1-
"6Pb$"-*/"
4,.*,c\s'I
fstf,oT-{f
^t*r 6tr n**#*l.d. 1 "s*l*
j '-t B
$Jfr"tr
!
""#,q'd.r!
fff
tcg
*
&c#"gs
gt$o tt,,$!;.}+g".mtfl
&-**jq"& *0,ff*
dA\a[ ;r\S s
e*
$**{* 4f
#d
#\f#
European Commission Directorate for Agriculture (DG VI)
Summary report
Agricultural Situation
and Prospects in the
Central and Eastern
European Countries
Bulgaria Czech Republic Estonia Hungary Latvia Lithuania Poland Romania Slovakia Slovenia
This report was prepared by DG VI with the help of Professor Alain Pouliquen, Directeur de Recherche at INRA (Institut National de Ia Recherche Agronomique )-, Montpellier, as adviser. Assistance was given by DG II, DG IA and EUROSTAT.
The manuscript was prepared by Rob Peters with the assistance of the other country report authors. The author accepts full responsibility for any errors which could still remain in the text. The closing date for data collection was May 1998.

!\ great deal of additional information on the European Union is available on the Internet. It can Je accessed through the Europa seNer (http://europa.eu.int).
~ataloguing data can be found at the end of this publication.
_uxembourg: Office for Official Publications of the European Communities, 1998
SBN 92-828-3957-5
:g European Communities, 1998 ~eproduction is authorised, provided the source is acknowledged.
0 rinted in Belgium
Table of contents
Introduction .... ................................................................ ..... ...................................................... .. . . . . . . . .. . . . .......... .. 3
About the data ................................................................................................................................................. 4
Executive Summary .................................................................................................................................. 5
1. General economic situation ...................................................................................................... 9
1.1. Macro-economic environment.. ................................................................................................. 9 1 .2. Agriculture in the overall economy ........................................................................................ 12
2. Agriculture and rural society .................................................................................................. 1 5
2.1. Agricultural production ................................................................................................................. 15 2.2. Agriculture and food trade ......................................................................................................... 15 2.3. Farm structures ................................................................................................................................... 18 2 .4. Rural development ........................................................................................................................... 20 2.5. Agriculture and environment ..................................................................................................... 20 2.6. Up- and downstream sectors ..................................................................................................... 21
3. Agricultural and rural policies ............................................................................................... 23
3.1. Market and production support ............................................................................................... 24 3.2. Trade policy ......................................................................................................................................... 26
3.2.1. WT0 ......................................................................................................................................... 26 3.2.2. Other trade agreements .................................................................................................... 26
3.3. Structural and rural policy ........................................................................................................... 29
4. Commodity situation and outlook ..................................................................................... 31
4.1. land use ................................................................................................................................. 32 4.2. livestock ................................................................................................................................. 32 4.3. Arable crops ........................................................................................................................ 33 4.4. Other crops .......................................................................................................................... 35 4.5. Dairy and meat ................................................................................................................. 37
5. General conclusion and outlook .......................................................................................... 41
CEC Summary report > 1
list of tables
TABLE 1: CEC-EU POPULATION AND GDP .................................................................................................. 9 TABLE 2: GROSS DOMESTIC PRODUCT, REAL GROWTH ............................................................................. 1 0 TABLE 3: OTHER ECONOMIC INDICATORS ....................................................................................................... 11 TABLE 4: IMPORTANCE OF AGRICULTURE .......................................................................................................... 12 TABLE 5: CEC NET AGROFOOD TRADE ........................................................................................................... 16 TABLE 6: CEC-EU NET AGROFOOD TRADE ................................................................................................... 17 TABLE 7: COMMODITY BREAKDOWN CEC-EU AGROFOOD TRADE ....................................................... 17 TABLE 8: SHARES IN AGROFOOD TRADE ......................................................................................................... 1 8 TABLE 9: CEC FARM STRUCTURE ACCORDING TO LAND USE ................................................................... 19 TABLE 1 0: PERCENTAGE PSE CEC-EU .............................................................................................................. 23 TABLE 11: EFFECTIVE SUPPORT PRICES SELECTED PRODUCTS 1997 /98 ................................................... 24 TABLE 1 2: PRODUCER PRICES SELECTED CROP PRODUCTS CEC-EU 1997 ............................................ 25 TABLE 13: PRODUCER PRICES SELECTED ANIMAL PRODUCTS CEC-EU 1997 ........................................ 25 TABLE 14: CEC-EU TARIFF PROTECTION SELECTED PRODUCTS (AD VALOREM EQUIVALENTS) ............. 27 TABLE 15: MINIMUM ACCESS TARIFF QUOTAS IN 2000 ............................................................................. 2 8 TABLE 16: EXPORT COMMITMENTS IN 2000 .................................................................................................. 29 TABLE 17: ARABLE LAND USE ................................................................................................................................ 33 TABLE 18: liVESTOCK NUMBERS ........................................................................................................................... 34 TABLE 19: CEREALS SUPPLY BALANCE .................................................................................................................. 35 TABLE 20: 01LSEEDS SUPPLY BALANCE ................................................................................................................ 35 TABLE 21: BEET SUGAR SUPPLY BALANCE ........................................................................................................... 36 TABLE 22: fRUIT, VEGETABLE AND WINE AREA AND PRODUCTION ............................................................ 36 TABLE 23: MILK SUPPLY BALANCE ......................................................................................................................... 37 TABLE 24: BEEF SUPPLY BALANCE ......................................................................................................................... 38 TABLE 25: PIGMEAT SUPPLY BALANCE .................................................................................................................. 38 TABLE 26: POULTRY SUPPLY BALANCE .................................................................................................................. 39
List of graphs
GRAPH 1: PER CAPITA INCOME {ECU PPP, 1996) ..................................................................................... 1 0 GRAPH 2: GROSS AGRICULTURAL OUTPUT ....................................................................................................... 1 4
2 < CEC Summary report
In 1995 DG VI published a series of ten country reports and a summary report on the agricultural situation and prospects in the associated couritries of Central and Eastern Europe (CECs). The reports provided an analysis of the transition agriculture and the agro-food sector in these countries were going through in the first half of the nineties and an assessment of the outlook for the main agricultural commodity markets till the year 2000.
With three years more of information the current publications, which cover Bulgaria, the Czech Republic, Estonia, Hungary, Latvia, Lithuania, Poland, Romania, Slovakia and Slovenia, provide an update of the 1995 reports and take the outlook horizon till 2003. The underlying working hypothesis for the reports is that the first CECs will join the Union and will start to be integrated in to the single market and the Common Agricultural Policy after 2003.
The accession process was officially launched on 30 March 1998 with the submission to the applicant countries of the Accession Partnerships, which for each country set out the principles, priorities, intermediate objectives and conditions leading up to
Introduction
accession. A main priority is adoption of the "acquis", the body of Community legislation, including for agriculture the sensitive areas of veterinary and phytosanitary legislation.
As was the case in 1995 the individual country reports have been prepared by the services of the Commission in close collaboration with national experts of the countries concerned and with the help of scientific advisers.
The country reports and the summary report attempt to provide an objective analysis of the current situation in agriculture and the agro-food sector and an assessment of where the candidate countries can be expected to be in their agricultural development by the time of the next enlargement.
CEC Summary report > 3
The data used in the country reports are derived from a CEC dataset established by DG VI in cooperation with other services of the European Commission and with external experts. Data originate from various sources, mainly national statistics and economic institutes, FAO, OECD, and the European Commission (DG II, Eurostat).
For agriculture, in general the FAO data were used, but for certain countries and/or for certain products, and in particular for the most recent years, the figures were adjusted or replaced by data from other sources, after discussion with country specialists. For the commodity supply balance sheets a simpler approach than by the FAO was used, taking into account trade in agricultural commodities up to the first processing stage, but not in further processed products.
The main objective was to obtain a dataset which was as coherent as possible, offering a good comparability of data.
4 < CEC Summary report
About the data
Despite all efforts to create a coherent, reliable and up to date dataset, all figures presented in the country reports should be interpreted with care. Significant changes in data collection and processing methods have sometimes led to major breaks in historical series as the countries concerned have moved from centrally planned to market economies. One general impression is that these problems may have led to overestimate the decline in economic activity in general and of agricultural production in particular in the first years of transition, data from 1989 and before being somewhat infl~ted and data after 1989 underrecording the increase in private sector activity. More recently many CECs have undertaken serious efforts to start to harmonise data collection and processing methods with EU practices.
With three more years of data and experience the original 1995 dataset has been improved and further adapted to DG VI's analytical needs.
Executive Summary
General economic situation
Most CECs achieved a turnaround m their economies in 1993 or 1994 after a sharp contraction in the first years of transition from centrally planned to market economies.
Average economic growth of the CECs slowed to 3.5% in 1997, after peaking at 5.7% in 1995. The overall evolution masks wide differences between countries: while Poland grew at close to 7%, Bulgaria's economy contracted by nearly 7% in 1997.
The slowing of aggregate economic growth should be reversed in 1998 and 1999. Although the recent events in Asia and Russia add some uncertainty to the forecast, it is expected that the external economic outlook will further improve, mainly determined by accelerated growth in the EU. On average, the ten applicant countries are expected to experience faster growth than the EU, which should allow the catching-up process to continue. The average CEC growth rate is expected to be in the 4 to 5% range till the end of the decade.
Agriculture in the overall economy
In terms of area, contribution to GDP and in particular share in total employment agriculture is still relatively more important in the CECs than in the EU. Only in the Czech Republic, Slovakia and Slovenia the relative size of agriculture is comparable to the EU average.
In a number of CECs agricultural employment has increased in absolute and relative terms, in particular in those countries where agriculture has played a buffer role in a generally deteriorating economic sit-
uation such as Romania and Bulgaria. The share of the total work force employed in agriculture is particularly high in these two countries, but also in Poland and Lithuania. The overall number of more than 1 0 million employed in agriculture for the CEC-10 is high compared to the EU's 7.5 million, while the productivity in agriculture as measured by the value added per worker is only around 11% of the EU level.
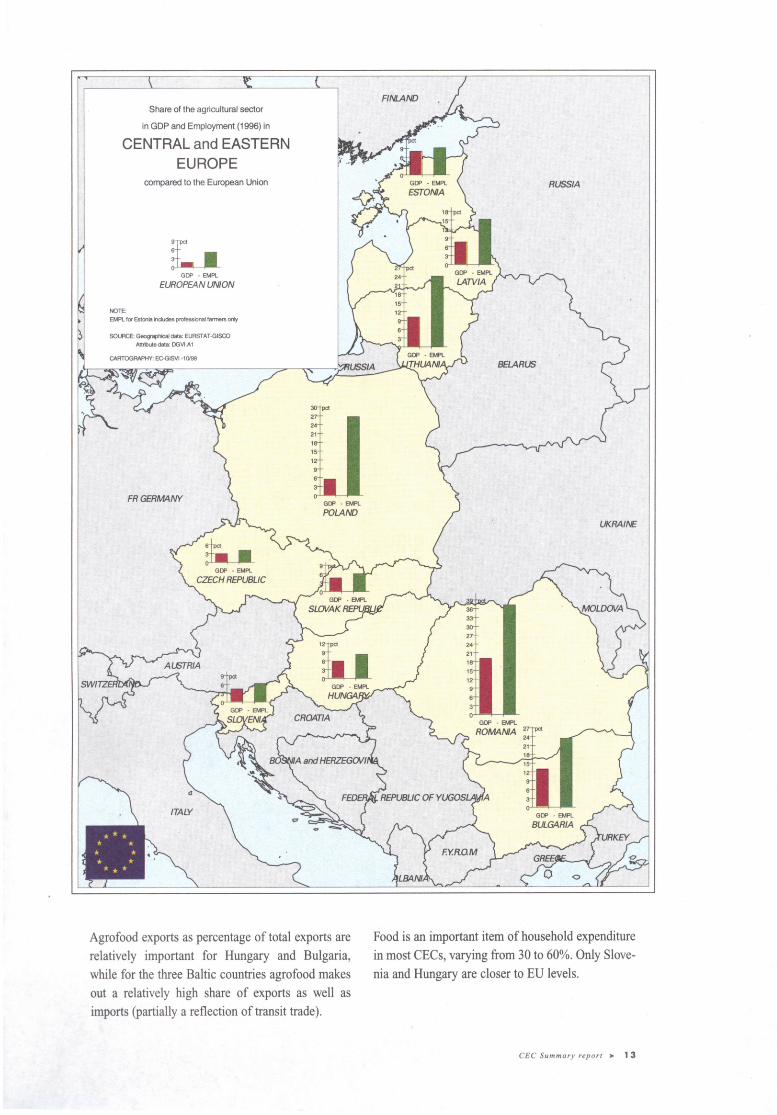
Food is an important item of household expenditure in most CECs, varying from 30 to 60%. Only Slovenia and Hungary are closer to EU levels.
Agricultural production
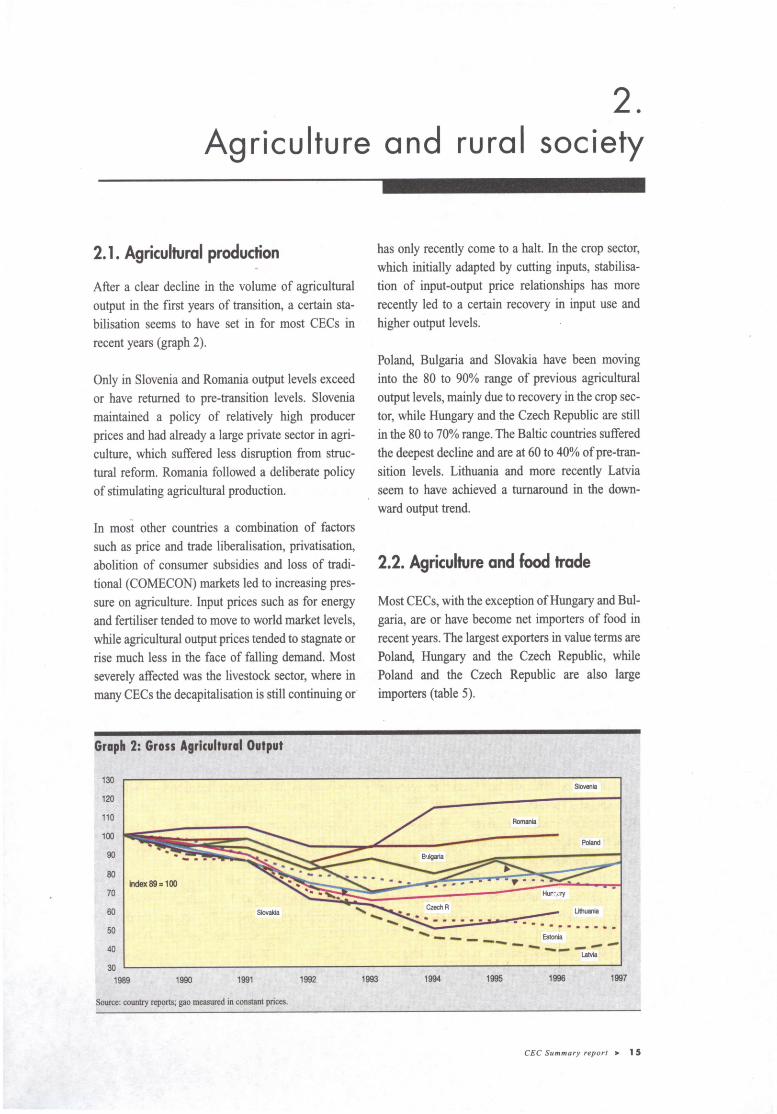
After a clear decline in the volume of agricultural output in the first years of transition, a certain stabilisation seems to have set in for most CECs in recent years.
Only in Slovenia and Romania output levels exceed or have returned to pre-transition levels. In most other countries a combination of factors such as price and trade liberalisation, privatisation, abolition of consumer subsidies and loss of traditional markets led to increasing pressure on agriculture. Input prices such as for energy and fertiliser tended to move to world market levels, while agricultural output prices tended to stagnate or rise much less in the face of falling demand. Most severely affected was the livestock sector, where in many CECs the decapitalisation is still continuing or has only recently come to a halt. In the crop sector, which initially adapted by cutting inputs, stabilisation of input-output price relationships has more recently led to a certain recovery in input use and higher output levels.
CEC Summary report > 5
Agriculture and food trade
Most CECs, with the exception of Hungary and Bulgaria, are or have become net importers of food in recent years. The largest exporters in value terms are Poland, Hungary and the Czech Republic, while Poland and the Czech Republic are also large importers.
The most important trade partner for many CECs is the EU, in particular on the import side, where the EU has a share varying between 40 and 55%, although it has lost some market share since 1995 as trade between the CECs is increasing.
Also as an export destination the EU is important, in particular for the more export oriented countries such as Hungary, Poland, the Czech Republic and Bulgaria, which ship between 30 and 40% of their agrofood exports to the EU, although also here a certain diversification in export destinations has taken place since 1995.
The CEC agrofood trade deficit with the EU has increased from 1 to around 1.5 bio ECU from 1995 to 1997. The only two countries that have a positive agrofood trade balance with the EU are Hungary and Bulgaria.
The commodity breakdown of agrofood trade flows between the CECs and the EU shows that the main export items are live animals and meat, still accounting for over 25% of export value to the EU, although the share of live animals has decreased as the livestock sector has declined. Vegetables are important in the export as well as the import trade with the EU, including processed vegetables and fruit on the import side as well as beverages.
6 < CEC Summary report
Farm structures
As in the wider economy, one of the main objectives of reform during transition was to decollectivise agriculture and to re-establish private property rights. Putting land and other farm assets into private ownership or private operation toqk a number of different forms, leading to different degrees of fragmentation of ownership and of farms.
A general feature in the countries, which had a predominantly collectivised agriculture in the pre-transition era, appears to be that the dualistic character -very large scale collective or state farms on the one hand and very small individual or private plots on the other - is diminishing. The average size of what is left of the state-managed farms or their successors, e.g. the private cooperatives, has decreased significantly, while at the other end of the scale the size of individual farms is slowly increasing. For the medium term, however, the forms of private producer cooperatives or associations, which have emerged, will most likely continue to play an important role in agricultural production and the focus of the smaller farms will contin\le to be production for own consumption and local markets. The rate of structural reform will also depend on the emergence of functioning land markets, which so far has been hindered by the delay in most countries of the definitive settlement of property rights and by limitations on acquisition of land in certain countries.
In Poland and Slovenia, that already had a large private sector in agriculture structural reform has been less marked. In particular in Poland the small scale and fragmented nature of private farming remains a long term structural handicap.
Rural development
In several CECs there was a net migratory flow to the countryside as general economic conditions worsened during transition and: agriculture played the role of buffer allowing people to live off their plots of land in their home villages and supplement other income sources such as retirement pensions. The underemployment and hidden unemployment related to subsistence farming poses large future challenges for a balanced development of the rural economies.
Agriculture and environment
Agriculture is the dominant form of land use, over 55% of total land area on average in the CECs, and an important factor in managing land, water and air resources (including bio-diversity) and in shaping the countryside.
During transition the application of fertilisers and agro-chemicals decreased substantially, as has livestock production, relaxing somewhat the pressures on the environment. More recently input use has again started to increase as the crop sector has recovered, but application levels are generally much below EU averages. For the future it remains to be seen how sustainable practices can be balanced with yield requirements.
Up- and downstream sectors
In the pre-transition era the CEC up- and downstream sectors of agriculture were predominantly in the hands of large state-owned monopolies. The privatisation and breaking up of state monopolies in the input supplying and food processing industries has progressed, albeit to different degrees and in different ways in the different countries.
Countries opted for different schemes such as mass privatisation through vouchers (e.g. the Czech Republic), first transforming the state monopolies into joint stock companies, then splitting them up and offering the shares to the general public, heavy involvement of foreign capital (e.g. Hungary) and employee and management buy outs (e.g. Slovenia).
Most CECs continue to face overcapacity and restructuring problems in the. first processing stages such as milling, slaughterhouses and dairies and much of the equipment is obsolete. Foreign direct investment has tended to concentrate on the higher value added sections of the food industry such as beverages, tobacco and confectionery, but also the sugar industry has attracted western capital, in particular in the Visegrad countries.
Agricultural and rural policies
Across the CECs a wide range of support instruments is applied varying from market price support and several types of direct payments to input subsidies, investment aids and tax exemptions.
The main market price support instruments applied are border measures (tariffs, import/export licensing and export subsidies) and intervention in the market to underpin minimum or floor prices.
Although in most cases support prices are still lower than in the EU, the gap has become smaller in recent years as (nominal) support prices have been increased.
The changes in price support, world market developments and some recovery in domestic demand have led to an increase in producer prices, somewhat more so for crop products than for animal products. The price gaps at farm gate level with the EU have tended to decline over time.
CEC Summary report > 7
Some countries have been introducing direct aids to support crop and livestock production, e.g. in the form of area and/or headage payments. Nearly all countries support agricultural production through credit and input subsidies and tax exemptions.
In addition to the legal framework that covers farm structures (land and farm privatisation) various structural and rural policy instruments are being developed by the CECs such as support for agricultural investment and· for farming in less favoured areas. Policies and support instruments for off farm investment and economic diversification in rural areas are generally still limited.
In most countries rural policy formulation is still at an early stage and limited to village renewal and improving the technical infrastructure, although some countries are developing programmes for small and medium sized enterprises, tourism and local pr~cessing of raw materials to promote economic diversification.
8 < CEC Summary report
Conclusion and Ou~ook
Support for agriculture through border protection, market intervention and structural aid has generally increased. Farm prices have increased, in particular for crop products. The price gap between the CECs and the EU for cereals, pigmeat and poultry has narrowed considerably and could be expected to disappear if the EU's Agenda 2000 CAP reform plans are implemented. Several CECs might face the need to adjust their price support downward for these products. For sugar, dairy and beef price gaps are still bigger, for the livestock products also partly due to quality differences. For the latter Agenda 2000 would reduce the EU prices.
The projections for the main commodities show that the CECs could be expected to somewhat increase their surplus production of cereals, oilseeds and pigmeat until 2003. The export of these surpluses would mostly have to be at world market prices. The traditional dairy surplus would be somewhat reduced, while for beef and poultry the region would be more or less self-sufficient.
1 . General economic situation
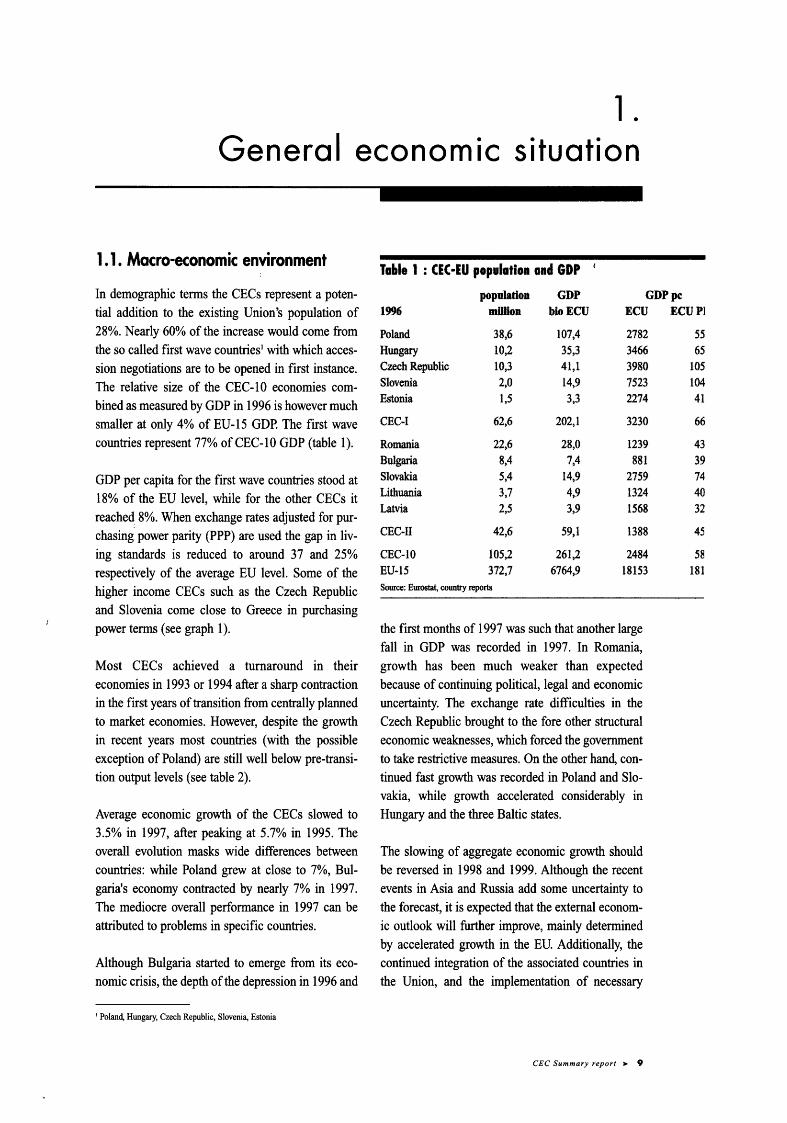
1. 1. Macro-economic environment Table 1 : CEC·EU population and GDP I
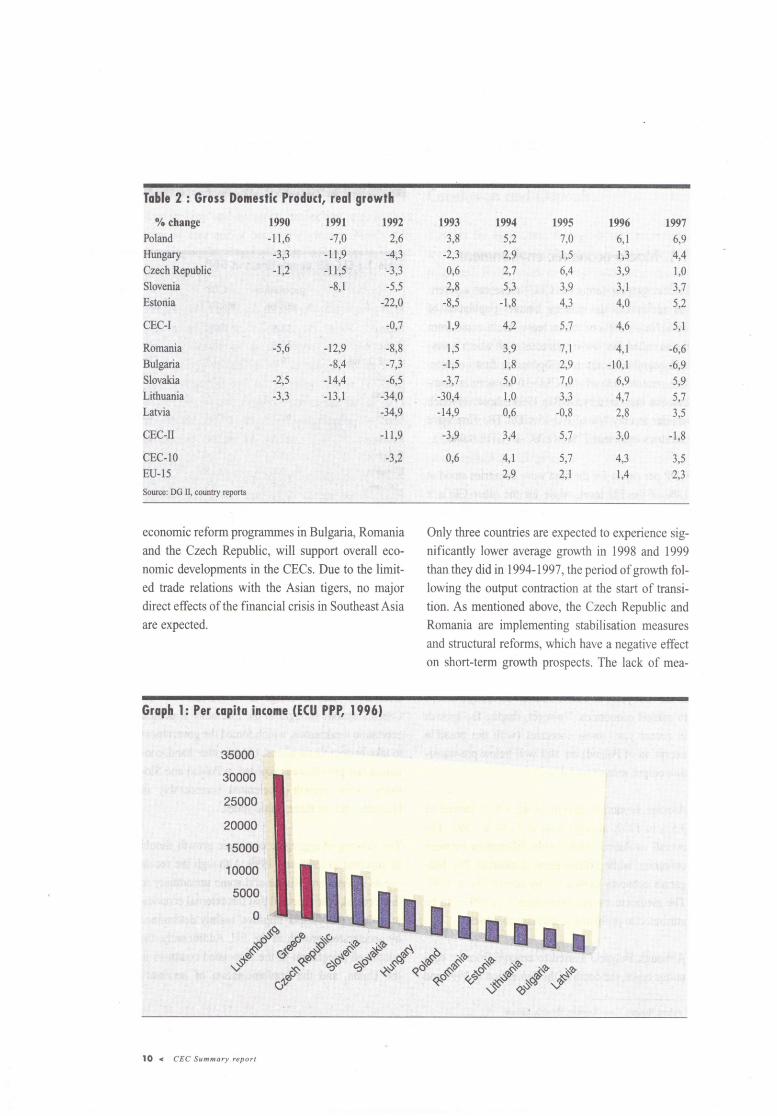
In demographic terms the CECs represent a potential addition to the existing Union's population of 28%. Nearly 60% of the increase would come from the so called first wave countries1 with which accession negotiations are to be opened in first instance. The relative size of the CEC-1 0 economies combined as measured by GDP in 1996 is however much smaller at only 4% of EU-15 GDP. The first wave countries represent 77% of CEC-1 0 GDP (table 1 ).
population GDP GDPpc
GDP per capita for the first wave countries stood at 18% of the EU level, while for the other CECs it reached 8%. When exchange rates adjusted for purchasing power parity (PPP) are used the gap in living standards is reduced to around 3 7 and 25% respectively of the average EU level. Some of the higher income CECs such as the Czech Republic and Slovenia come close to Greece in purchasing power terms (see graph 1).
Most CECs achieved a turnaround in their economies in 1993 or 1994 after a sharp contraction in the first years of transition from centrally planned to market economies. However, despite the growth in recent years most countries (with the possible exception of Poland) are still well below pre-transition output levels (see table 2).
Average economic growth of the CECs slowed to 3.5% in 1997, after peaking at 5.7% in 1995. The overall evolution masks wide differences between countries: while Poland grew at close to 7%, Bulgaria's economy contracted by nearly 7% in 1997. The mediocre overall performance in 1997 can be attributed to problems in specific countries.
Although Bulgaria started to emerge from its economic crisis, the depth of the depression in 1996 and
' Poland, Hungary, Czech Republic, Slovenia, Estonia
1996 mDJion bioECU ECU
Poland 38,6 107,4 2782 Hungary 10,2 35,3 3466 Czech Republic 10,3 41,1 3980 Slovenia 2,0 14,9 7523 Estonia 1,5 3,3 2274
CEC-1 62,6 202,1 3230
Romania 22,6 28,0 1239 Bulgaria 8A 7,4 881 Slovakia 5,4 14,9 2759 Lithuania 3,7 4,9 1324 Latvia 2,5 3,9 1568
CEC-Il 42,6 59,1 1388
CEC-10 105,2 261,2 2484 EU-15 372,7 6764,9 18153 Source: Eurostat, country reports
the first months of 1997 was such that another large fall in GDP was recorded in 1997. In Romania, growth has been much weaker than expected because of continuing political, legal and economic uncertainty. The exchange rate difficulties in the Czech Republic brought to the fore other structural economic weaknesses, which forced the government to take restrictive measures. On the other hand, continued fast growth was recorded in Poland and Slovakia, while growth accelerated considerably m Hungary and the three Baltic states.
The slowing of aggregate economic growth should be reversed in 1998 and 1999. Although the recent events in Asia and Russia add some uncertainty to the forecast, it is expected that the external economic outlook will further improve, mainly determined by accelerated growth in the EU. Additionally, the continued integration of the associated countries in the Union, and the implementation of necessary
CEC Summary report > 9
ECUP1
55 65
105 104 41
66
43 39 74 40 32
45
58 181
Tolfc 2 : Grosg
oA cbange
Poland
Hungsry
Czrrlhnrp,tUlrc
Slovenia
Eotonia
CEC-I
Romania
Bulgaria
Slovakia
Lithuania
Latvia
CBC-II
cEc-10
EU.15
Source DG Il country rcports
Donestfr Produti, reol gro*tli
1990
-l1,6-3,3
-l12
t99l-7,0
-11,9
-l 1,5'
-8,1
t9922,6
413
-3,3
-5,5
-22,4
-ar7
-8,8
-7 r3
-6,5
-34,0
-34,9
-11,9
tSrz
t9945,2
2,9
2,7
5,3
-1,8
42
3,9
1,8
5r0
1,0
0,6
3,4
4rl2,9
1995
7,0
1,5
6,4
319
4,3
5,7
7,1
2,9
7r0
3,3
-0,8
5r7
5,7
2rl
1996
6,1
l13
3,9
3,1
4,0
4,6
4,1
-10,1
6,9
4,7
2,8
3,0
t997
6,9
414
1,0
3r7
512
1993
3,8
-2,3
0,6
2r8
-8,5
1,9
-5n6
-215
-3r3
-12,9
-8,4
-14,4
-13,1
1,5
-1,5
-317
-30J-14,9
-319
0,6
5,1
-6,6
-6,9
5,9
5,7
3,5
4,3
1,4
-l'8
3r5
213
economic reform progranrmes in Bulgaria, Romania
and the Czech Republic, will support overall eco-
nomic developments in the CECs. Due to the limifed trade relations with the Asian tigers, no major
direct effects of the financial crisis in SoutheastAsia
are expected.
Only three countries are expected to experience sig-
nificantly lower average growth in 1998 and 1999
than they did in 1994-1997, the period of growth fol-
lowing the output contraction at the start of transi-
tion. As mentioned above, the Czech Republic and
Romania are implementing stabilisation measures
and structural reforms, which have a negative effect
on short-tenn growth prospects. The lack of mea-
Groph l: Per copito incone (t$ PPP, 19961
35000
30000:-
25000
20000
15t)00
10000
5000
0
"
lO < CEC Summary report
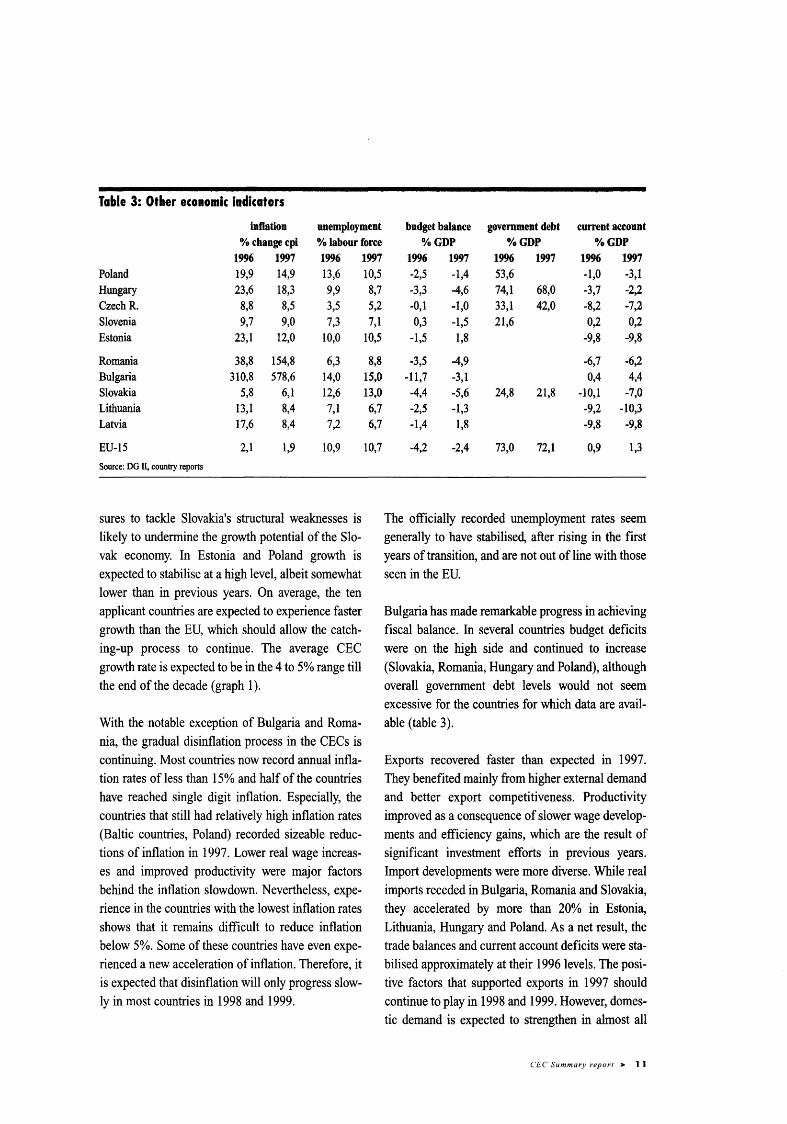
Table 3: Other economic indicators
inftation unemployment % changecpi % labour force
1996 1997 1996 1997 Poland 19,9 14,9 13,6 Hungary 23,6 18,3 9,9 Czech R. 8,8 8,5 3,5 Slovenia 9,7 9,0 7,3 Estonia 23,1 12,0 10,0
Romania 38,8 154,8 6,3 Bulgaria 310,8 578,6 14,0 Slovakia 5,8 6,1 12,6 Lithuania 13,1 8,4 7,1 Latvia 17,6 8,4 7,2
EU-15 2,1 1,9 10,9
Source: DG II, country reports
sures to tackle Slovakia's structural weaknesses is likely to undermine the growth potential of the Slovak economy. In Estonia and Poland growth is expected to stabilise at a high level, albeit somewhat lower than in previous years. On average, the ten applicant countries are expected to experience faster growth than the EU, which should allow the catching-up process to continue. The average CEC growth rate is expected to be in the 4 to 5% range till the end of the decade (graph 1 ).
With the notable exception of Bulgaria and Romania, the gradual disinflation process in the CECs is continuing. Most countries now record annual inflation rates of less than 15% and half of the countries have reached single digit inflation. Especially, the countries that still had relatively high inflation rates (Baltic countries, Poland) recorded sizeable reductions of inflation in 1997. Lower real wage increases and improved productivity were major factors behind the inflation slowdown. Nevertheless, experience in the countries with the lowest inflation rates shows that it remains difficult to reduce inflation below 5%. Some of these countries have even experienced a new acceleration of inflation. Therefore, it is expected that disinflation will only progress slowly in most countries in 1998 and 1999.
10,5 8,7 5,2 7,1
10,5
8,8 15,0 13,0 6,7 6,7
10,7
budget balance government debt current aceount %GDP o/oGDP %GDP
1996 1997 1996 1997 1996 1997 -2,5 -1,4 53,6 -1,0 -3,1 -3,3 -4,6 74,1 68,0 -3,7 -2,2 -0,1 -1,0 33,1 42,0 -8,2 -7;2 0,3 -1,5 21,6 0,2 0,2
-1,5 1,8 -9,8 -9,8
-3,5 -4,9 -6,7 -6,2 -l1,7 -3,1 0,4 4,4 -4,4 -5,6 24,8 21,8 -10,1 -7,0 -2,5 -1,3 -9,2 -10,3 -1,4 1,8 -9,8 -9,8
-4,2 -2,4 73,0 72,1 0,9 1,3
The officially recorded unemployment rates seem generally to have stabilised, after rising in the first years of transition, and are not out of line with those seen in the EU.
Bulgaria has made remarkable progress in achieving fiscal balance. In several countries budget deficits were on the high side and continued to increase (Slovakia, Romania, Hungary and Poland), although overall government debt levels would not seem excessive for the countries for which data are available (table 3).
Exports recovered faster than expected in 1997. They benefited mainly from higher external demand and better export competitiveness. Productivity improved as a consequence of slower wage developments and efficiency gains, which are the result of significant investment efforts in previous years. Import developments were more diverse. While real imports receded in Bulgaria, Romania and Slovakia, they accelerated by more than 20% in Estonia, Lithuania, Hungary and Poland. As a net result, the trade balances and current account deficits were stabilised approximately at their 1996 levels. The positive factors that supported exports in 1997 should continue to play in 1998 and 1999. However, domestic demand is expected to strengthen in almost all
CEC Summary report > 11

Table 4: lmportanc:e of agric:ulture
agric.area agrie. production* agric. employment agrofood trade food expe~~diture 1996 000 Ita % tot. area bloECU 'YoGDP 000 r. tot. empL % tot. exp. % tot. imp. r. housellold iKome
Poland 18474 59,1 6,5 6,0 4130 26,7 11,0 11,0 35 Hungary 6184 66,5 2,1 5,8 298 8,2 17,5 5,1 24 Czech Republic . 4279 54,3 1,2 2,9 211 4,1 5,7 . 7,5 31 Slovenia 785 38,7 0,7 4,4 61 6,3 4,2 7,8 23 Estonia 1450 32,1 0,3 8,0 74 9,2 15,7 15,6 30 CEC~I 31172 56,7 10,6 5,3 4774 18,4
Romania 14789 62,0 5,3 19,0 3975 37,3 8,8 7,6 58 Bulgaria 6164 55,5 0,9 12,8 769 23,4 18,8 8,0 54 Slovakia 2445 49,9 0,7 4,6 169 6,0 5,4 8,6 35 Lithuania 3151 48,5 0,5 10,2 398 24,0 13,1 17,1 52 Latvia 2521 39,0 0,3 7,6 208 15,3 16,8 13,4 39 CEC~ll 29070 55,0 7,8 13,1 5519 27,9 CEC~10 60242 55,9 18,4 7,0 10293 22,5
EU-15 135260 41,8 117,5 1,7 7514 5,1 7,4 9,6 18
Source: country reports *As measured by Gross Agricultural Product (GAP) Food expenditure for Poland, Hungary and the Czech Republic includes beverages and tobacco
countries, which should push up imports. Therefore, no improvement of external balances is foreseen. Increased inflows of foreign direct investment (FDI) make the current account deficits in most countries sustainable. However, in some countries that do not benefit from large FDI flows, persistent large imbalances are a cause for concern.
1.2. Agriculture in the overall economy
In terms of area, contribution to GDP and in particular share in total employment agriculture is still relatively more important in the CECs than in the EU. Only in the Czech Republic, Slovakia and Slovenia the relative size of agriculture is comparable to the EU average (table 4).
Most dependent on agriculture are Romania and Bulgaria followe~ by the Baltics. The share of agriculture in GDP has generally been declining in the CECs since 1989 with the exception of Romania, where it increased at the start of transition and in Bulgaria, where very contrasted developments in
agriculture and the rest of the economy last year lead to a sharp increase in the share of the former.
In a number of CECs agricultural employment has increased in absolute and relative terms, in particular in those countries where agriculture has played a buffer role in a generally deteriorating economic situation such as Romania and Bulgaria. The share of the total work force employed in agriculture is particularly high in these two countries, but also in Poland and Lithuania. The overall number of more than 10 million employed in agriculture for the CEC-1 0 is high compared to the EU's 7.5 million, while the productivity in agriculture as measured by the value added per worker is only around 11% of the EU leveF. An increase in productivity to half of the EU's level would imply that the current Gross Agricultural Product, measured on the basis of an output price level comparable to the EU, could be produced by an agricultural work force of around 6 million instead of the current 10 million, indicative of the potentially large labour surplus in agriculture and of the importance economic diversification in rural areas could assume in coming years.
2 Even when taking into account the generally lower agricultural prices in the CECs the productivity gap remains large.
12 < CEC Summary report
Share of the agricultural sector
in GDP and Employment (1996)in
CENTRAL and EASTERNEUROPE
compared to the European Union
GDP - EMPL
EUROPEAN UNION
tiOTE:
EMPL fq Estmh includes pof€sbndfam6 oniy
SOURCE: Gegraphbal dda: EURSTAT-GlS@
An6rJtedats: DGM.Al
CAFffOGMPtfY: ECGISVI -1 cy98
GOP . EMPL
POIAND
Agrofood exports as percentage of total exports are Food is an important item of household expenditure
relatively important for Hungary and Bulgaria, in most CECs, varying from 30 to 60%. Only Slove-
while for the three Baltic countries agrofood makes nia and Hungary are closer to EU levels.
out a relatively high share of exports as well as
imports (partially a reflection of transit trade).
CEC Sumnar)' report > I 3

2.Agriculture ond rurol society
2,1 . Agriculturol production
After a clear decline in the volume of agricultural
output in the first years of transition, a certain sta-
bilisation seems to have set in for most CECs in
recent years (graph 2).
Only in Slovenia and Romania output levels exceed
or have returned to pre-transition levels. Slovenia
maintained a policy of relatively high producer
prices and had already a large private sector in agri-
culture, which suffered less disruption from struc-
tural reform. Romania followed a deliberate policy
of stimulating agricultural production.
In most other countries a combination of factors
such as price and trade liberalisation, privatisation,
abolition of consumer subsidies and loss of tradi-
tional (COMECON) markets led to increasing pres-
sure on agriculture. Input prices such as for energy
and fertiliser tended to move to world market levels,
while agriculnral output prices tended to stagnate or
rise much less in the face of falling demand. Most
severely affected was the livestock sectog where in
many CECs the decapitalisation is still continuing or
has only recently come to a halt. In the crop sector,
which initially adapted by cutting inputs, stabilisa-
tion of input-output price relationships has more
recently led to a certain recovery in input use and
higher output levels.
Polan{ Bulgaria and Slovakia have been moving
into the 80 to 90Yo range of previous agricultural
output levels, mainly due to recovery in the crop sec-
tor, while Hungary and the Czech Republic are still
in the 80 to 70% range. The Baltic countries suffered
the deepest decline and are at 60 to 40o/o of pre-tran-
sition levels. Lithuania and more recently Latvia
seem to have achieved a turnaround in the down-
ward output trend.
2.2. Agriculture ond food hode
Most CECs, with the exception of Hungary and Bul-
gaia, are or have become net importers of food in
recent years. The largest exporters in value terms are
Polan4 Hungary and the Czech Republic, while
Poland and the Czech Republic are also large
importers (table 5).
Orcph 2: 0rorr Agrlcuhural 0ulpuf
tlO
30
1S9
Sorce: county reports; gao measured in consbnt prices.
CEC Summary report > | 5

Table 5: CEC net agrofood trade
millionECU 1990 1991 1992 Poland 972 312 -34 Hungary 1285 1621 1536 CzechR. Slovenia -90 Estonia
Romania -816 -423 -528 Bulgaria 356 365 351 Slovakia Lithuania Latvia 22
Source: country reports
Poland managed to halve its food trade deficit in 1997 by a big increase in exports, while Bulgaria saw its surplus drop as imports increased and exports declined.
The most important trade partner for many CECs is the EU, in particular on the import side, where the EU has a share varying between 40 and 55%, although it has lost some market share since 1995 as trade between the CECs is increasing.
Also as an export destination the EU is important, in particular for the more export oriented countries such as Hungary, Poland, the Czech Republic and Bulgaria, which ship between 30 and 40% of their agrofood exports to the EU, although also here a certain diversification in export destinations has taken place since 1995. After the sharp decline in exports to the FSU and other former COMECON markets in the early years of transition, a certain recovery has taken place in recent years. As the agrofood sector in Russia and other eastern markets has collapsed, they have increasingly become an outlet for lower quality CEC supplies3
• For the Baltics, traditional suppliers oflivestock products to the FSU, the latter region and in particular Russia is the most important outlet with again an increasing share in recent years.
Total CEC agrofood exports to the EU have been close to 3 bio ECU in recent years with the bulk of
1993 1994 1995 1996 1997 -481 -293 -365 -970 -418 1004 1048 1470 1423 1553
23 -336 -347 -648 -577 -217 -230 -293 -285 -362
49 21 -46 -132 -225
-524 -196 -253 -108 261 359 541 404 232
-189 -183 -337 -347 5 -18 -10
75 -5 21 -52 -119
exports coming from Poland and Hungary, while imports from the EU have continued to increase to around 4.5 bio ECU in 1997. As a result the CEC agrofood trade deficit with the EU has increased from 1 to around 1.5 bio ECU from 1995 to 1997. The only two countries that have a positive agrofood trade balance with the EU are Hungary and Bulgaria (table 6).
For the EU agrofood exports to the 10 CECs represent around 10% of total agrofood exports, while imports from the CECs represent a little over 5% of total EU agrofood imports.
The commodity breakdown of agrofood trade flows between the CECs and the EU shows that the main export items are live animals and meat, still accounting for over 25% of export value to the EU, although the share of live animals has decreased as the livestock sector has declined. Vegetables are important in the export as well as the import trade with the EU, including processed vegetables and fruit on the import side as well as beverages (table 7).
CEC-EU agrofood trade is dominated by the first wave countries, which have a share of over 80% in exports to the EU and of 75% in imports from the EU. Their export share has been slightly declining since 1993, while their import share has increased (table 8).
3 In part these products, of in particular animal origin, have on the home market been displaced by "western" products.
16 < CEC Summary report

Table 6: CEC·EU net agrofood trade
millionECU Poland Hungary Czech R. Slovenia Estonia
CEC-1
Romania Bulgaria Slovakia Lithuania Latvia
CEC-Il
CEC-10 Source: country reports, Comext
1990 354 596
-226 66
1991 -24 756
-167 37
1992 -82 607
-246 59
-4
1993 -346 384 -84
-132 -32
-210
-236 -47
-7
Table 7: Commodity breakdown CEC-EU agro!ood trade
% total agrofood trade CEC exports to EU 1993 1994 1995 1996 1997
1 Live animals 14% 14% 1 00~ 9% 1 00~ 2 Meat and offals 17% 16% 15% 17% 16% 3 Fish, crustaceans, etc. 3% 4 Dairy products, eggs, etc. 3% 5 Other animal products 1% 6 Live plants, cut flowers 9% 7 Vegetables 9% 8 Fruit and nuts 1% 9 Coffee, tea, spices 1%
l 0 Cereals 0% 11 Milling products, malt, starch 8% 12 Oilseeds 0%
0% 13 Plant extracts, resins, etc. 14 Plant fibres 2% 15 Fats and oils (vegetable or animal) 4% 16 Meat/fish preparations 17 Sugar and confectionary 18 Cocoa (preparations) 19 Cereal preparations 20 Vegetable/fruit preparations
1% 0% 0% 7% 1%
21 Miscellaneous food preparations 6% 22 Beverages, spirits 4% 23 Food industry waste, animal feed 1% 24 Tobacco (products) 8%
Source: Comext
3% 4% 5% 6% 3% 3% 3% 3% I% 1% 1% I% 9% 9% 8% 8% 9% 9% 9% 11%
1% 1% 1% 1% 2% 3% 2% 2% 0011! 1% 0% 00/o 1% 10% '9% 7% 0% 0% 0% 0% 0% 00/o 0% 0% 2% 2% 1% 1% 4% 3% 3% 3% 1% 2% 3% 3% 0% 1% 1% 1% 0% 1% 1% 1% 1% 9% 8% 8% 0% 1% 0% 00/o 5% 5% 6% 7% 4% 4% 5% 5% 1% 1% 1% 1% 9% 7% 6% 6%
1994 -331 370
-233 -194 -65
-453
-76 -35
-118
-34
1995 .;344
515 -338 -308 -150
-625
-129 -1
-139 -53 -53
-380
-1005
1996 -571 658
-526 -303 -253
-996
-134 . 71 -183 -102 -91
-446
-1442
CEC imports from EU
1997 -527 529
-457 -290 -249.
-994
75 -186 -141 -152
1993 1994 1995 1996 1997 1% 5%
2% 9%
2%' 1% 1% 4% 5% 3%
3% 3% 3% 3% 3% 2% 2% 2% 2% 2% 2% 2% 2% 2% 2% 4% 4% 5% 5% 4% 9% 100/0 9% 9% 9%
2% 2% 3% 2% 3% 14% 2% 1% 9% 5% 1% 1% 1% lo/o 2% 2% 2% 3% 4% 3% 00/o 1% 1% 1% 1% 00/o 0% 0% 00/o 0% 5% 6% 7% 6% 7% 1% 1% 1% 1% 1% 7% 4% 6% 5% 4% 5% 6% 6% 5% 5% 3% 4% 4% 5% 5% 3% 4% 4% 4% 4% 8% 9% 11% 10% 9%
7% 9% 8% 7% 6% 7% 7% 8% 7% 10% 6% 5% 5% 5% 4% 4% 4% 4% 4% 4%
CEC Summary report > 1 7
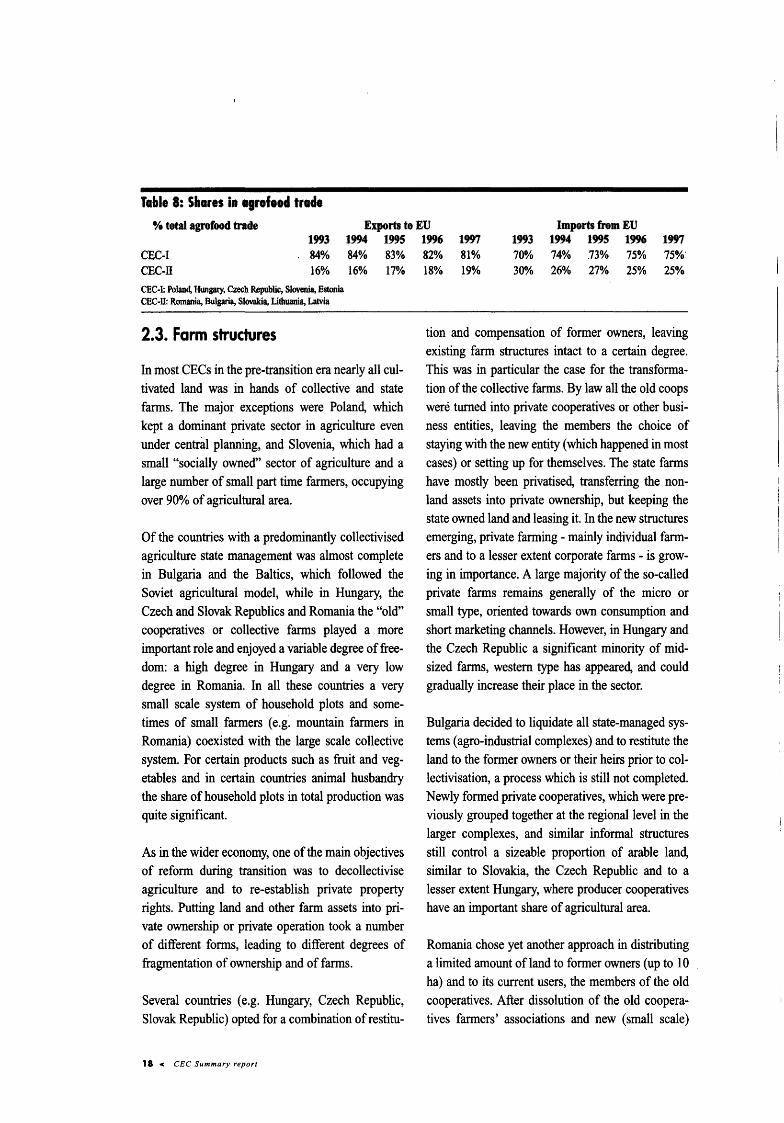
Talale 8: Slaares 11 agroftttl tra4t % total agrofood trade Exports to EU Imports from EU
1993 CEC·I 84% CEC-il 16%
CEC·I: Poland. Hungary, Czech Republic, Slovenia, Estonia CEC-ll: Romania, Bulgaria. Slovakia, Lithuania. Latvia
2.3. Farm structures
1994 1995 84% 83% 16% l?Ot'o
In most CECs in the pre-transition era nearly all cultivated land was in hands of collective and state farms. The major exceptions were Poland, which kept a dominant private sector in agriculture even under central planning, and Slovenia, which had a small "socially owned" sector of agriculture and a large number of small part time farmers, occupying over 90% of agricultural area.
Of the countries with a predominantly collectivised agriculture state management was almost complete in Bulgaria and the Baltics, which followed the Soviet agricultural model, while in Hungary, the Czech and Slovak Republics and Romania the "old" cooperatives or collective farms played a more important role and enjoyed a variable degree of freedom: a high degree in Hungary and a very low degree in Romania. In all these countries a very small scale system of household plots and sometimes of small farmers (e.g. mountain farmers in Romania) coexisted with the large scale collective system. For certain products such as fruit and vegetables and in certain countries animal husbandry the share of household plots in total production was quite significant.
As in the wider economy, one of the main objectives of reform during transition was to decollectivise agriculture and to re-establish private property rights. Putting land and other farm assets into private ownership or private operation took a number of different forms, leading to different degrees of fragmentation of ownership and of farms.
Several countries (e.g. Hungary, Czech Republic, Slovak Republic) opted for a combination of restitu-
18 c CEC Summary report
1996 1997 1993 1994 1995 1996 1997 82% 81% 700.4 74% .73% 75% 75%' 18% 19% 300t'o 26% 27% 25% 25%
tion and compensation of former owners, leaving existing farm structures intact to a certain degree. This was in particular the case for the transformation of the collective farms. By law all the old coops were turned into private cooperatives or other business entities, leaving the members the choice of staying with the new entity (which happened in most cases) or setting up for themselves. The state farms have mostly been privatised, transferring the nonland assets into private ownership, but keeping the state owned land and leasing it. In the new structures emerging, private farming - mainly individual farmers and to a lesser extent corporate farms- is growing in importance. A large majority of the so-called private farms remains generally of the micro or small type, oriented towards own consumption and short marketing channels. However, in Hungary and the Czech Republic a significant minority of midsized farms, western type has appeared, and could gradually increase their place in the sector.
Bulgaria decided to liquidate all state-managed systems (agro-industrial complexes) and to restitute the land to the former owners or their heirs prior to collectivisation, a process which is still not completed. Newly formed private cooperatives, which were previously grouped together at the regional level in the larger complexes, and similar informal structures still control a sizeable proportion of arable land, similar to Slovakia, the Czech Republic and to a lesser extent Hungary, where producer cooperatives have an important share of agricultural area.
Romania chose yet another approach in distributing a limited amount of land to former owners (up to 10 ha) and to its current users, the members of the old cooperatives. After dissolution of the old cooperatives farmers' associations and new (small scale)
(4)
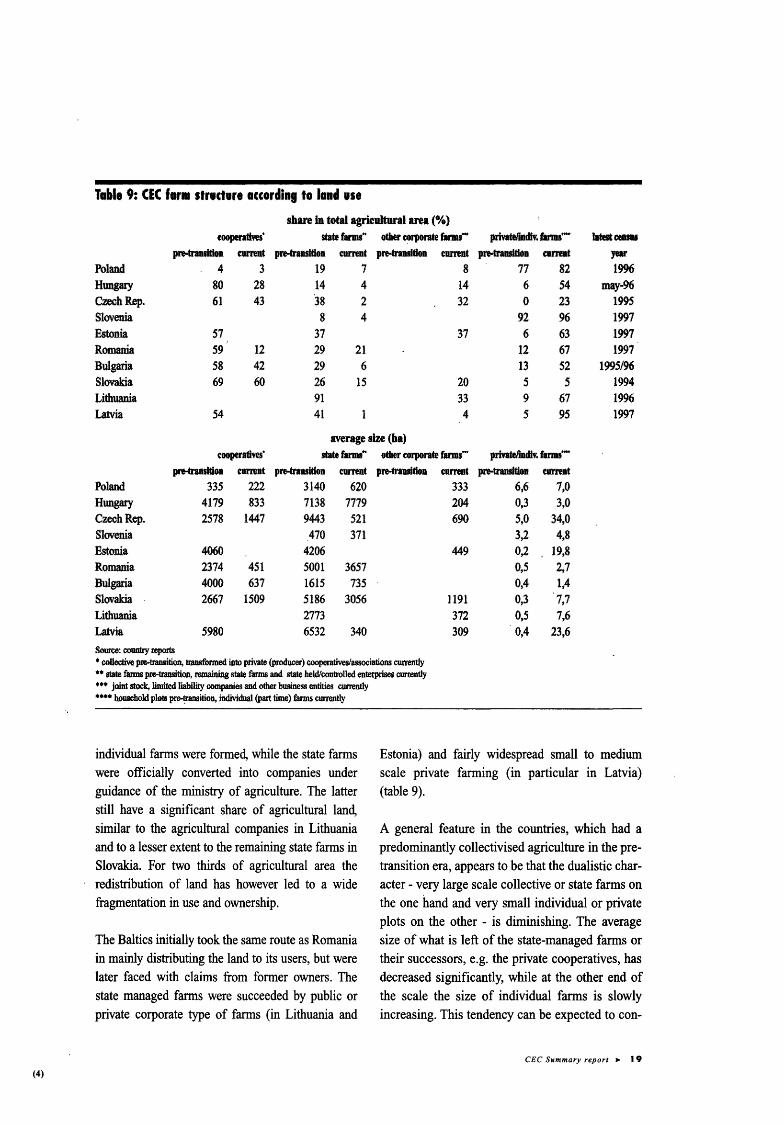
Ta.le 9: CEC far• structure accordine to land use share in total agrieultural area(%)
eoopera~ves• state farms .. other eorporate rarms- private/IBdiv. farms- latest etDI8
prHrantltioD current pre-traasltloa: current pre-trauitloa eurrent prHraasitloD: eumat year Poland 4 3 19 7 8 77 82 1996 Hungary 80 28 14 4 14 6 54 may-96 Czech Rep. 61 43 '38 2 32 0 23 1995 Slovenia 8 4 92 96 1997 Estonia 57 37 37 6 63 1997 Romania 59 12 29 21 12 67 1997 Bulgaria 58 42 29 6 13 52 1995/96 Slovakia 69 60 26 15 20 5 s 1994 Lithuania 91 33 9 67 1996 Latvia S4 41 4 5 95 1997
average size (ha) eoeperatives' state fll'llll .. other corporate rarms- pmatelimliv. farms-
piH'aDSldon eumnt pre-transitlon current prHransidon current prHransltlon current Poland 335 222 3140 620 333 6,6 7,0 Hungary 4179 833 7138 7779 204 0,3 3,0 CzeohRep. 2578 1447 9443 521 690 s.o 34,0 Slovenia 470 371 3,2 4,8 Estonia 4060 4206 449 0,2 19,8 Romania 2374 451 5001 3657 0,5 2,7 Bulgaria 4000 637 1615 735 0,4 1,4 Slovakia 2667 1509 5186 3056 1191 0,3 7,7 Lithuania 2773 372 0,5 7,6 Latvia 5980 6532 340 309 OA 23,6 SOI.Il'Ce: country reports • co.llectivo pie-transition, tamsformed into private {producer) cooperadveslassociations cun:ently •• state farms pre-transition. remaining state farms and state held/controlled enterprises currently *** joint stock, limited liability companies and other business entities currently .... household plots pre-~ition. individual (part time) farms currently
individual farms were formed, while the state farms were officially converted into companies under guidance of the ministry of agriculture. The latter still have a significant share of agricultural land, similar to the agricultural companies in Lithuania and to a lesser extent to the remaining state farms in Slovakia. For two thirds of agricultural area the redistribution of land has however led to a wide fragmentation in use and ownership.
The Baltics initially took the same route as Romania in mainly distributing the land to its users, but were later faced with claims from former owners. The state managed farms were succeeded by public or private corporate type of farms (in Lithuania and
Estonia) and fairly widespread small to medium scale private farming (in particular in Latvia) (table 9).
A general feature in the countries, which had a predominantly collectivised agriculture in the pretransition era, appears to be that the dualistic character - very large scale collective or state farms on the one hand and very small individual or private plots on the other - is diminishing. The average size of what is left of the state-managed farms or their successors, e.g. the private cooperatives, has decreased significantly, while at the other end of the scale the size of individual farms is slowly increasing. This tendency can be expected to con-
CEC SNmmary report > 19

tinue in the future and to contribute to increased efficiency as the larger units reach more manageable proportions and the smaller ones acquiring more land can benefit from economies of scale. For the medium term, however, the forms of private producer cooperatives or associations, which have emerged, will most likely continue to play an important role in agricultural production and the focus of the smaller farms will continue to be production for own consumption and local markets. The rate of structural reform will also depend on the emergence of functioning land markets, which so far has been hindered by the delay in most countries of the definitive settlement of property rights and still existing limitations on acquisition of land in certain countries.
In the two countries, that already had a large private sector in agriculture structural reform has been less marked. In Poland some increase in the size of private farms is taking place as land from the former state farms is transferred, but overall the small scale and fragmented nature of private farming remains a long term structural handicap. In Slovenia emphasis is being put on promoting the pluri-activity of rural households and on developing a "multipurpose" agriculture with besides a production a conservation function.
2.4. Rural development
Most of the CECs are relatively rural with a relatively large part of the population living in rural communities with a small number of inhabitants, dispersed settlement patterns and a low population density.
Many rural areas are characterised by an ageing population, over-dependence on agriculture and a poor technical and social infrastructure such as limited transport and communications networks, a lack of schools and limited access to health and other services. In some countries the latter was aggravated by the disappearance of the state and collective farms,
20 < CEC Summary report
which also provided social and other services to the local community.
In several CECs there was a net migratory flow to the countryside as general economic conditions worsened during transition and agriculture played the role of buffer allowing people to live off their plots of land in their home villages and supplement other income sources such as retirement pensions. The underemployment and hidden unemployment related to subsistence farming poses large future challenges for a balanced development of the rural economies.
2.5. Agriculture and environment
Agriculture is the dominant form of land use, over 55% of total land area on average in the CECs, and an important factor in managing land, water and air resources (including bio-diversity) and in shaping the countryside.
The main environmental problems related to agriculture in the CECs are erosion, water pollution by agro-chemicals, soil compaction and manure disposal in areas with a heavy concentration of animal production.
The quality of ground and surface water in many CECs has been influenced in the past by overuse of fertilisers and chemicals and by a high concentration of animal production.
During transition the application of fertilisers and agro-chemicals decreased substantially, as has livestock production, relaxing somewhat the pressures on the environment. More recently input use has again started to increase as the crop sector has recovered, but application levels are generally much below EU averages. For the future it remains to be seen how sustainable practices can be balanced with yield requirements.
2.6. Up- and downstream sectors
In the pre-transition era the CEC up- and downstream sectors of agriculture were predominantly in the hands of large state-owned monopolies. The privatisation and breaking up of state monopolies in the input supplying and food processing industries has progressed, albeit to different degrees and in different ways in the different countries.
First to be privatised was generally the end of the food chain, i.e. the distribution and retailing sectors, followed by parts of the food industry (usually not the first processing stages) and certain input supplying industries. In the upstream sector state monopolies were sometimes replaced by private monopolies, which nevertheless under the effects of trade liberalisation were opened up to import competition.
Countries opted for different schemes such as mass privatisation through vouchers (e.g. the Czech Republic), first transforming the state monopolies into joint stock companies, then splitting them up and offering the shares to the general public, heavy involvement of foreign capital (e.g. Hungary) and employee and management buy outs (e.g. Slovenia).
Most advanced in the privatisation and demonopolisation process would seem to be Hungary, the Czech Republic and Slovenia, while in Poland it only started to take off after 1995 and Romania and Bulgaria still have some way to go. In Slovakia and the Baltic countries privatisation of the up- and downstream sectors was completed on paper in 1997.
Most CECs continue to face overcapacity and restructuring problems in the first processing stages such as milling, slaughterhouses and dairies and much of the equipment is obsolete. Foreign direct investment has tended to concentrate on the higher value added sections of the food industry such as beverages, tobacco and confectionery, but also the
sugar industry has attracted western capital, in particular in the Vise grad countries4
•
For financial services agriculture in most countries depends on the banking sector, although many govermilents in response to a perceived lack of access to credit and capital due to low profitability of farming and the absence of collateral (in the context of unsettled property rights) have developed instruments to facilitate investment and provide loan guarantees (see also § 3.3).
• The four countries (Poland, Hungary, Czech and Slovak Republics) originally forming the Central European Free Trade Agreement (CEFTA, see also§ 3.2.2).
CEC Summary report > 21 -

3. Agricultural and Rural Policies
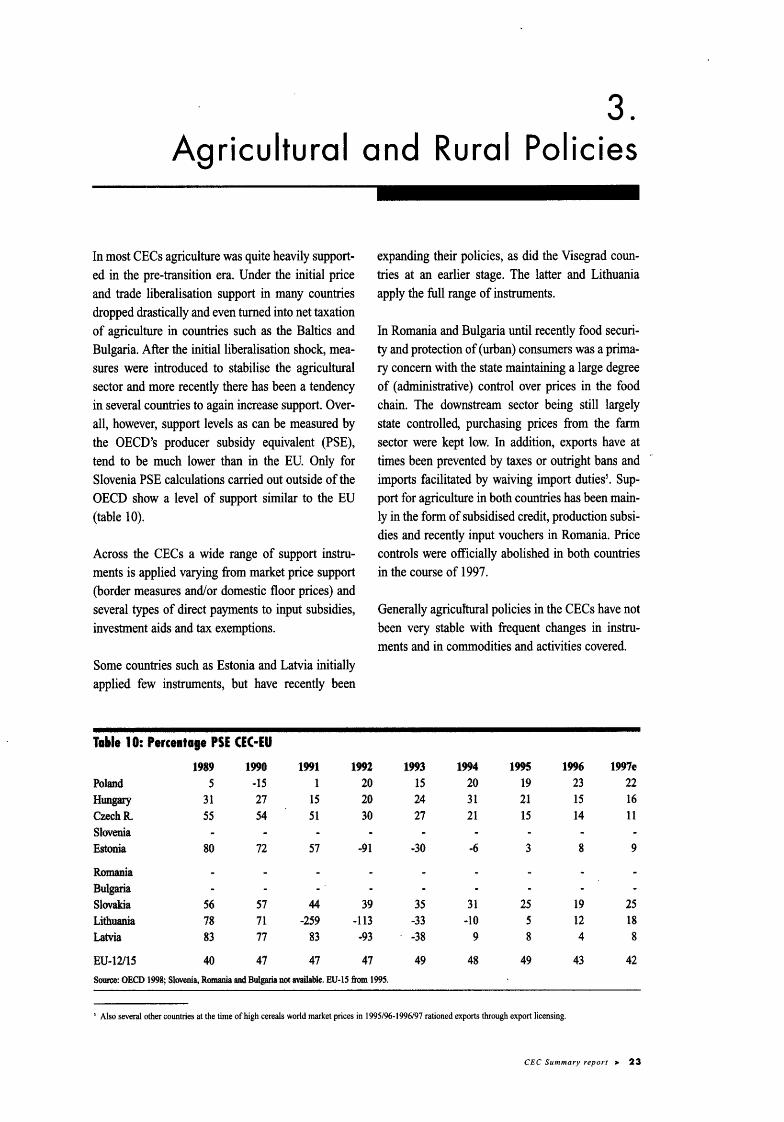
In most CECs agriculture was quite heavily supported in the pre-transition era. Under the initial price and trade liberalisation support in many countries dropped drastically and even turned into net taxation of agriculture in countries such as the Baltics and Bulgaria. After the initialliberalisation shock, measures were introduced to stabilise the agricultural sector and more recently there has been a tendency in several countries to again increase support. Overall, however, support levels as can be measured by the OECD's producer subsidy equivalent (PSE), tend to be much lower than in the EU. Only for Slovenia PSE calculations carried out outside of the OECD show a level of support similar to the EU (table 10).
Across the CECs a wide range of support instruments is applied varying from market price support (border measures and/or domestic floor prices) and several types of direct payments to input subsidies, investment aids and tax exemptions.
Some countries such as Estonia and Latvia initially applied few instruments, but have recently been
Ta.le 10: Percentage PSE CEC-EU
1989 1990 1991 1992 Poland 5 -15 1 20 Hungary 31 27 15 20 CzechR. 55 54 51 30 Slovenia Estonia 80 72 57 -91
Romania Bulgaria Slovakia 56 57 44 39 Lithuania 78 71 -259 -113 Latvia 83 77 83 ·93
EU-12/15 40 47 47 47
expanding their policies, as did the Visegrad countries at an earlier stage. The latter and Lithuania apply the full range of instruments.
In Romania and Bulgaria until recently food security and protection of(urban) consumers was a primary concern with the state maintaining a large degree of (administrative) control over prices in the food chain. The downstream sector being still largely state controlled, purchasing prices from the farm sector were kept low. In addition, exports have at times been prevented by taxes or outright bans and .. imports facilitated by waiving import duties5
• Support for agriculture in both countries has been main-ly in the form of subsidised credit, production subsidies and recently input vouchers in Romania. Price controls were officially abolished in both countries in the course of 1997.
Generally agricultural policies in the CECs have not been very stable with frequent changes in instruments and in commodities and activities covered.
1993 1994 1995 199(; 1997e 15 20 19 23 22 24 31 21 15 16 27 21 15 14 11
-30 -6 3 8 9
35 31 25 19 25 -33 .. to 5 12 18 -38 9 8 4 8
49 48 49 43 42 Source: OECD 1998; Slovenia, Romania and Bulgaria not available. EU-15 from 1995.
' Also several other countries at the time of high cereals world market prices in 1995/96-1996/97 rationed exports through export licensing.
CEC Summary report > 23
3. 1. Market and production support
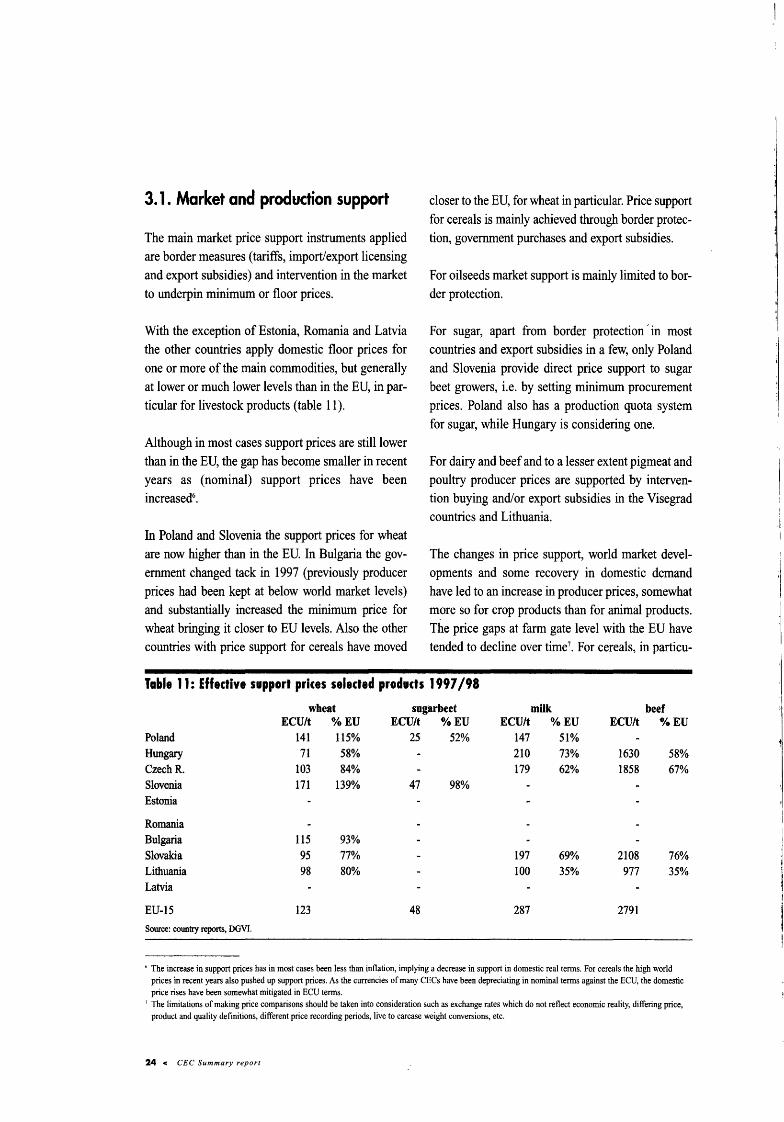
The main market price support instruments applied are border measures (tariffs, import/export licensing and export subsidies) and intervention in the market to underpin minimum or floor prices.
With the exception of Estonia, Romania and Latvia the other countries apply domestic floor prices for one or more of the main commodities, but generally at lower or much lower levels than in the EU, in particular for livestock products (table 11 ).
Although in most cases support prices are still lower than in the EU, the gap has become smaller in recent years as (nominal) support prices have been increased6
•
In Poland and Slovenia the support prices for wheat are now higher than in the EU. In Bulgaria the government changed tack in 1997 (previously producer prices had been kept at below world market levels) and substantially increased the minimum price for wheat bringing it closer to EU levels. Also the other countries with price support for cereals have moved
closer to the EU, for wheat in particular. Price support for cereals is mainly achieved through border protection, government purchases and export subsidies.
For oilseeds market support is mainly limited to border protection.
For sugar, apart from border protection · in most countries and export subsidies in a few, only Poland and Slovenia provide direct price support to sugar beet growers, i.e. by setting minimum procurement prices. Poland also has a production quota system for sugar, while Hungary is considering one.
For dairy and beef and to a lesser extent pigmeat and poultry producer prices are supported by intervention buying and/or export subsidies in the Visegrad countries and Lithuania.
The changes in price support, world market developments and some recovery in domestic demand have led to an increase in producer prices, somewhat more so for crop products than for animal products. The price gaps at farm gate level with the EU have tended to decline over time7
• For cereals, in particu-
Table 11: Effective support prices selected products 1997/98
wheat sugarbeet milk beef ECU/t %EU ECU/t %EU ECU/t %EU ECU/t %EU
Poland 141 115% 25 52% 147 51% Hungary 71 58% 210 73% 1630 58% CzechR. 103 84% 179 62% 1858 67% Slovenia 171 139% 47 98% Estonia
Romania Bulgaria 115 93% Slovakia 95 77% 197 69% 2108 76% Lithuania 98 80% 100 35% 977 35% Latvia
EU-15 123 48 287 2791 Source: country reports, DGVI.
' The increase in support prices has in most cases been less than inflation, implying a decrease in support in domestic real terms. For cereals the high world prices in recent years also pushed up support prices. As the currencies of many CECs have been depreciating in nominal terms against the ECU, the domestic price rises have been somewhat mitigated in ECU terms.
' The limitations of making price comparisons should be taken into consideration such as exchange rates which do not reflect economic reality, differing price, product and quality definitions, different price recording periods, live to carcase weight conversions, etc.
24 < CEC Summary report
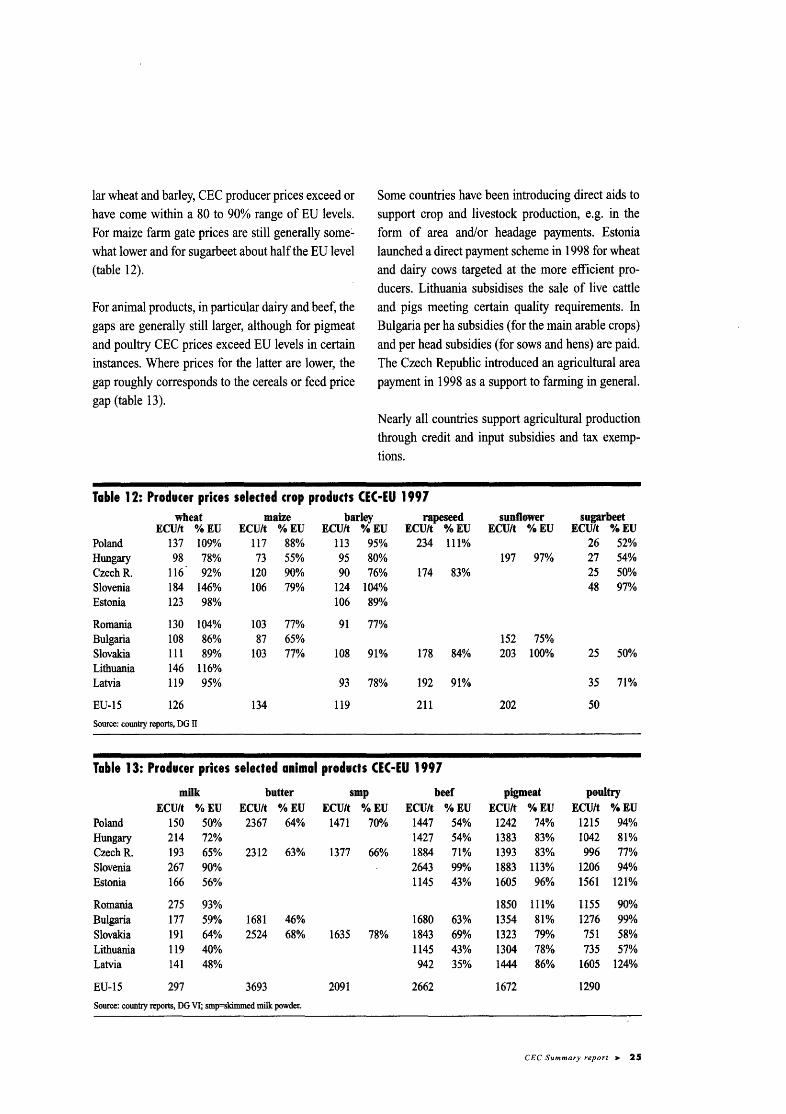
lar wheat and barley, CEC producer prices exceed or have come within a 80 to 90% range of EU levels. For maize farm gate prices are still generally some:. what lower and for sugarbeet about half the EU level (table 12).
For animal products, in particular dairy and beef, the gaps are generally still larger, although for pigmeat and poultry CEC prices exceed EU levels in certain instances. Where prices for the latter are lower, the gap roughly corresponds to the cereals or feed price gap (table 13).
Some countries have been introducing direct aids to support crop and livestock production, e.g. in the form of area and/or headage payments. Estonia launched a direct payment scheme in 1998 for wheat and dairy cows targeted at the more efficient producers. Lithuania subsidises the sale of live cattle and pigs meeting certain quality requirements. In Bulgaria per ha subsidies (for the main arable crops) and per head subsidies (for sows and hens) are paid. The Czech Republic introduced an agricultural area payment in 1998 as a support to farming in general.
Nearly all countries support agricultural production through credit and input subsidies and tax exemptions.
Table 12: Producer prices selected trop products CEC·EU 1997 wheat maize barley rapeseed sunflower sugarbeet
ECU/t %EU ECU/t %EU ECU/t % EU ECU/t %EU ECU/t %EU ECU/t %EU Poland 137 109% 117 88% 113 95% 234 111% 26 52% Hungary 98 78% 73 55% 95 80% 197 97% 27 54% Czech R. 116 92% 120 90% 90 76% 174 83% 25 50% Slovenia 184 146% 106 79% 124 104% 48 97% Estonia 123 98% 106 896A,
Romania 130 104% 103 77% 91 77% Bulgaria 108 86% 87 65% 152 75% Slovakia 111 89% 103 77% 108 91% 178 84% 203 100% 25 50% Lithuania 146 116% Latvia 119 95% 93 78% 192 91% 35 71%
EU-15 126 134 119 211 202 50
Source: country reports, DG ll
Table 13: Producer prices selected aaimal products CEC·EU 1997
milk butter smp beef pigmeat poultry ECU/t %EU ECU/t %EU ECU/t %EU ECU/t %EU ECU/t OfeEU ECU/t %EU
Poland 150 50% 2367 64% 1471 70% 1447 54% 1242 74% 1215 94% Hungary 214 72% 1427 54% 1383 83% 1042 81% CzechR. 193 65% 2312 63% 1377 66% 1884 71% 1393 83% 996 77% Slovenia 267 90% 2643 99% 1883 113% 1206 94% Estonia 166 56% 1145 43% 1605 96% 1561 121%
Romania 275 93% 1850 111% 1155 90% Bulgaria 177 59% 1681 46% 1680 63% 1354 81% 1276 99% Slovakia 191 64% 2524 68% 1635 78% 1843 690/o 1323 79% 751 58% Lithuania 119 40% 1145 43% 1304 78% 735 57% Latvia 141 48% 942 35% 1444 86% 1605 124%
EU-15 297 3693 2091 2662 1672 1290
Source: country reports, DG VI; smp=skimmed milk powder.
CEC Summary report > 25
3.2. Trade policy
For the CECs, which are member of the WT08, the
border measures underpinning market price support as discussed above, are to a large extent conditioned by their Uruiuay Round commitments on market access and export competition. Trade policy is further governed by a number of bilateral and regional trade agreements, such as the association agreements with the EU, CEFTA (the Central European Free Trade Agreement) and BFTA (the Baltic Free Trade Agreement).
3.2.1. WTO
For the WTO tariffs have generally been bound at lower levels than the EU has, the exceptions being Poland and Romania and for the products oilseeds, pigmeat and poultry. Most countries are currently applying tariffs at their bound rates with the exception of Poland and Romania, which both negotiated relatively high protection levels (see Table 14).
Table 15 gives an overview of access commitments for selected main commodities. In particular for cereals and pigmeat total quantities are non-negligible. However, when compared to the commitments on subsidised export volumes {Table 16) net export positions are clearly built in for the main commodities. The potential price gaps (between the domestic and the world market) which can be covered when making full use of the allowed subsidised volumes are relatively limited, in particular for cereals.
3.2.2. Other trade agreements
The association or Europe Agreements between the EU and the CECs grant - in the field of agriculture - asymmetric trade concessions for a number of agricultural products, mainly in the form of tariff
quotas at a preferential rate. The agreements were modified to take into account the Uruguay Round Agreement of 1994 and the EU enlargement of 1995.
For the adjustment to the GATT agreement the inquota preferential rates were set to 20 % of the MFN tariff rate (instead of 40 % of the import levy at the end of the first five year period before). For the second five year period the EU decided to increase the tariff rate quotas by 25% (compared to 50% in the first period).
For the EU enlargement to Austria, Finland and Sweden, the former preferences enjoyed by the CECs in their trade with the EFTA-3 were included.
Most countries have increased their use of the preferential quotas over time. Fully used or to a large extent have been the quotas for dairy products and poultry and for certain fruit and vegetables and wine. Underused have been the quotas for the other meats and live animals (beef, sheep, pigmeat) and for eggs.
The Central European Free Trade Agreement was signed in December 1992 and replaced the "Visegrad Agreement" of February 1991 between Poland, Hungary and former Czechoslovakia. It came into force in March 1993 between four countries (after the split of Czechoslovakia into the Czech and Slovak Republics).
In November 1995 Slovenia became member with a transition period till the end of 1999 and Romania joined in July 1997 with a transition period till end 1998. Bulgaria has applied for membership and will likely join in 1998. Several other countries have also started negotiations to become CEFTA members such as Latvia, Lithuania, FYROM (Former Yugoslav Republic of Macedonia) and Croatia. However, under CEFTA rules, only candidates that
' Poland, Hungary, Czech Republic, Slovenia, Romania (with developing country status), Bulgaria (joined in 1997), and Slovakia. The Baltics are in advanced state of negotiation for their WTO membership.
26 c CEC Summary report
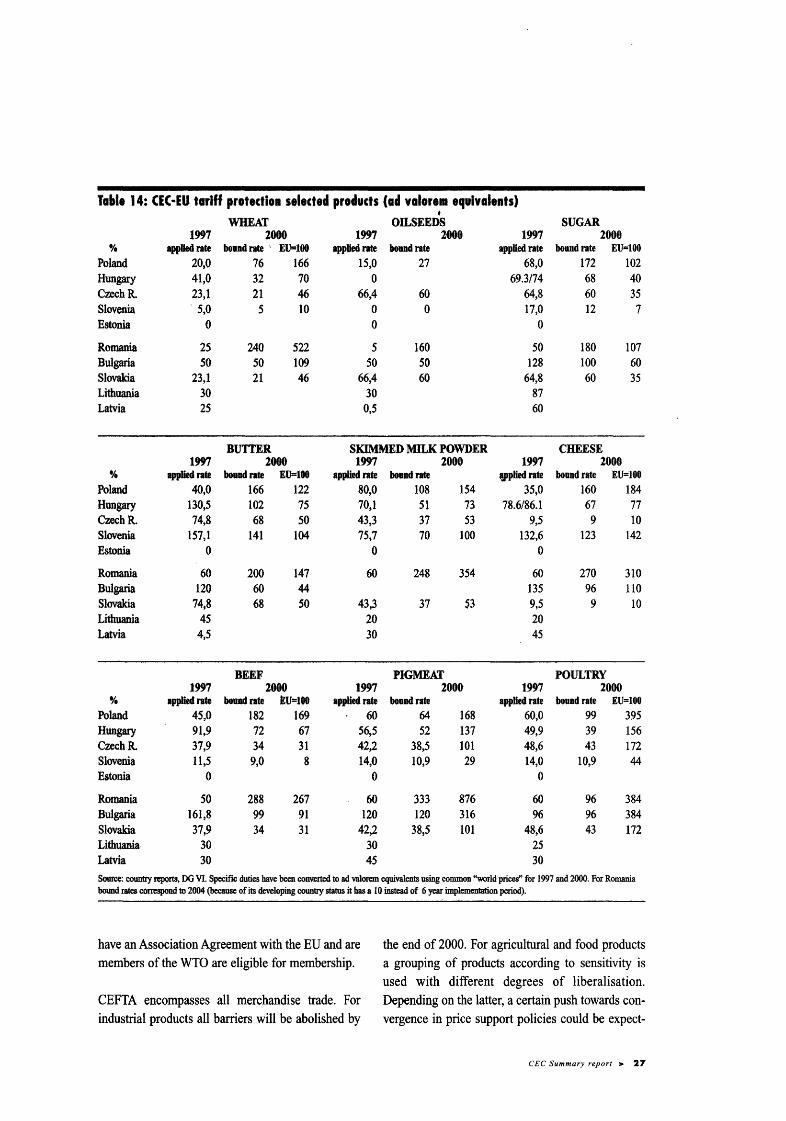
Tat.le 14: CEC·EU tariff protection selected products (ad valorem et~uivalents) • WHEAT OILSEEDS SUGAR
1997 2000 1997 2000 1997 2000 % applied rate boundrate ' EU=lOO applied rate bound rate appUedrate bound rate EU=lOO
Poland 20,0 76 166 15,0 27 68,0 172 102 Hungary 41,0 32 70 0 69.3/74 68 40 CzechR. 23,1 21 46 66,4 60 64,8 60 35 Slovenia . 5,0 5 10 0 0 17,0 12 7 Estonia 0 0 0
Romania 25 240 522 5 160 50 180 107 Bulgaria 50 50 109 50 50 128 100 60 Slovakia 23,1 21 46 66,4 60 64,8 60 35 Lithuania 30 30 87 Latvia 25 0,5 60
BUTTER SKIMMED MILK POWDER CHEESE 1997 zooo 1997 2000 1997 2000
% applied rate boiOlcl rate EU=108 applied rate boudrate lfPiied rate bound rate EU=tOO Poland 40,0 166 122 80,0 108 154 35,0 160 184 Hungary 130,5 102 15 70,1 51 73 78.6/86.1 67 77 CzechR. 74,8 68 50 43,3 37 53 9,5 9 10 Slovenia 157,1 141 104 75,7 70 100 132,6 123 142 Estonia 0 0 0
Romania 60 200 147 60 248 354 60 270 310 Bulgaria 120 60 44 135 96 110 Slovakia 74,8 68 so 43,3 37 53 9,5 9 10 Lithuania 45 20 20 Latvia 4,5 30 45
BEEF PIGMEAT POULTRY 1997 2000 1997 2000 1997 2000
% applied rate bouadrate EU=lO& applied rate bound rate app6edrate bound rate EU=lOO Poland 45,0 182 169 60 64 168 60,0 99 395 Hungary 91,9 72 67 56,5 52 137 49,9 39 156 CzechR. 37,9 34 31 42,2 38,5 101 48,6 43 172 Slovenia lt,S 9,0 8 14,0 10,9 29 14,0 10,9 44 Estonia 0 0 0
Romania so 288 267 60 333 876 60 96 384 Bulgaria 161,8 99 91 120 120 316 96 96 384 Slovakia 37,9 34 31 42,2 38,5 101 48,6 43 172 Lithuania· 30 30 25 Latvia 30 45 30 Source: country reports, DO VI. Specific duties have been conv.erted to ad valorem equivalents using common "world prices" for 1997 and 2000. For Romania bound rates correspond to 2004 (because of its developing country status it has a 10 instead of 6 year implementation period).
have an Association Agreement with the EU and are members of the WTO are eligible for membership.
CEFTA encompasses all merchandise trade. For industrial products all barriers will be abolished by
the end of 2000. For agricultural and food products a grouping of products according to sensitivity is used with different degrees of liberalisation. Depending on the latter, a certain push towards convergence in price support policies could be expect-
CEC Summary report > 27
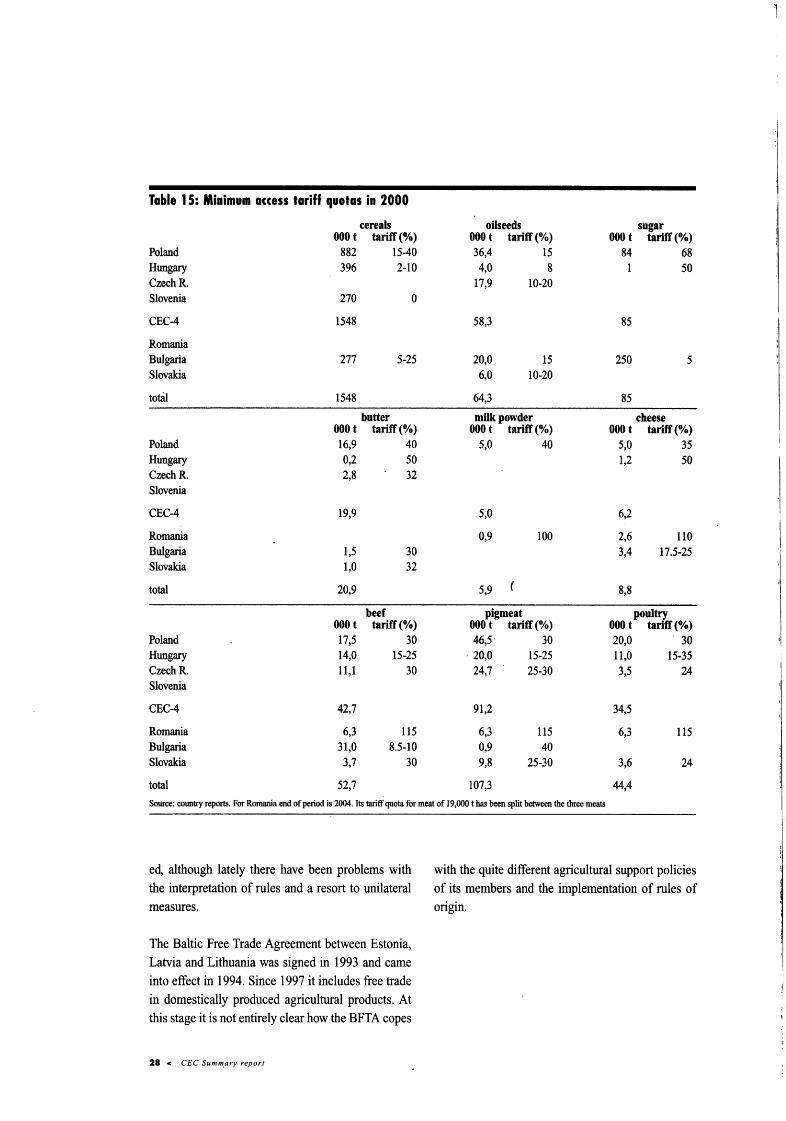
Table 15: Minimum access tariff quotas in 2000
cereals oilseeds sugar 000 t tariff (o/o) OOOt tariff(%) OOOt tariff (o/o)
Poland 882 15-40 36,4 15 84 68 Hungary 396 2-10 4,0 8 50 CzechR. 17,9 10-20 Slovenia 270 0
CEC-4 1548 58,3 85
Romania Bulgaria 277 5-25 20,0 15 250 5 Slovakia 6,0 10-20
total 1548 64,3 85
butter milk powder cheese 000 t tariff(%) 000 t tariff(%) 000 t tariff (o/o)
Poland 16,9 40 5,0 40 5,0 35 Hungary 0,2 50 1,2 50 CzechR. 2,8 32 Slovenia
CEC-4 19,9 5,0 6,2
Romania 0,9 100 2,6 llO Bulgaria 1,5 30 3,4 17.5-25 Slovakia 1,0 32
total 20,9 5,9 8,8
beef pigmeat poultry 000 t tariff (o/o) 000 t tariff (o/o) OOOt tariff(%)
Poland 17,5 30 46,5· 30 20,0 . 30 Hungary 14,0 15-25 . 20,0 15-25 11,0 15-35 CzechR. 11,1 30 24,7 25-30 3,5 24 Slovenia
CEC-4 42,7 91,2 34,5
Romania 6,3 115 6,3 115 6,3 115 Bulgaria 31,0 8.5-10 0,9 40 Slovakia 3,7 30 9,8 25-30 3,6 24
total 52,7 107,3 44,4 Source: country reports. For Rmnania end of period is 2004. Its tariff quota for meat of 19,000 t bas been split between the three meats
ed, although lately there have been problems with with the quite different agricultural support policies the interpretation of rules and a resort to unilateral of its members and the implementation of rules of measures. origin.
The Baltic Free Trade Agreement between Estonia, Latvia and Lithuania was signed in 1993 and came into effect in 1994. Since 1997 it includes free trade in domestically produced agricultural products. At this stage it is not entirely clear how the BFTA copes
28 < CEC Summ.ary report
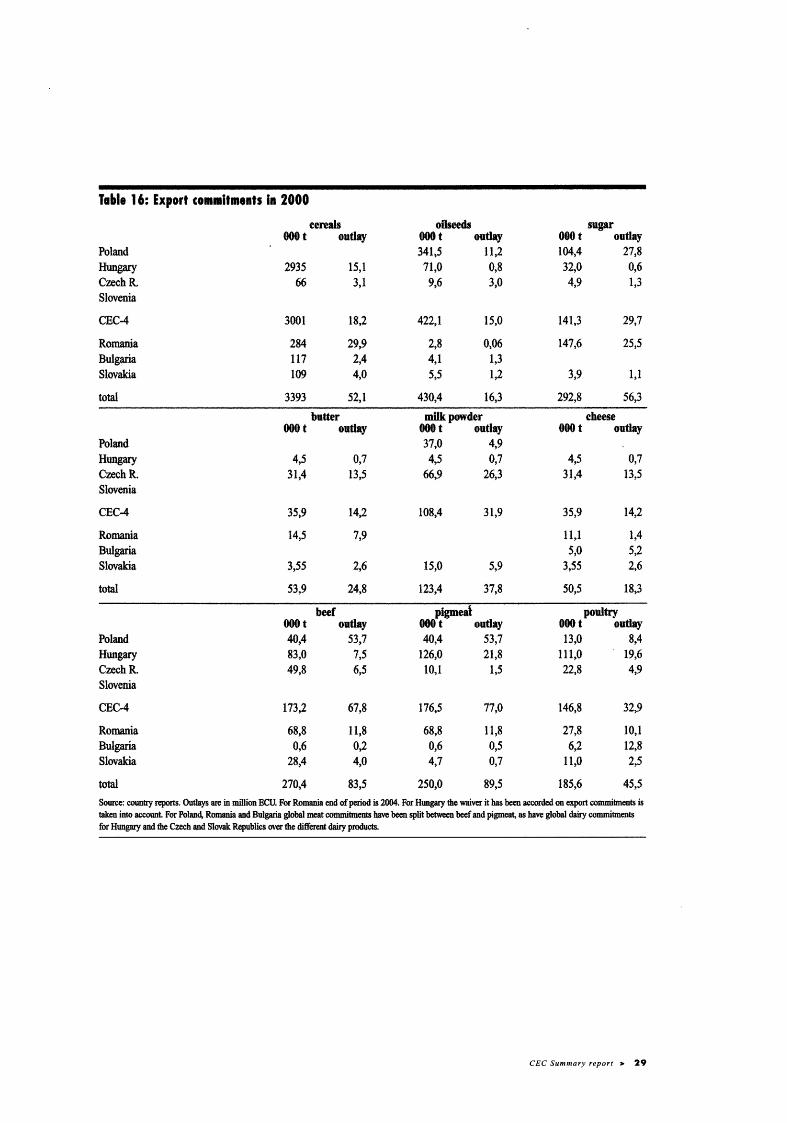
Ta.le 16: Export commitments ia 2000
cereals oilseeds sugar ooet outlay OOOt outlay OOOt outlay
Poland 341,5 11,2 104,4 27,8 Hungary 2935 15,1 71,0 0,8 32,0 0,6 CzechR. 66 3,1 9,6 3,0 4,9 1,3 Slovenia
CBC4 3001 18,2 422,1 15,0 141,3 29,7
Romania 284 29,9 2,8 0,06 147,6 25,5 Bulgaria 117 2,4 4,1 1,3 Slovakia 109 4,0 5,5 1,2 3,9 1,1
total 3393 52,1 430,4 16,3 292,8 56,3
butter miJkpowder cheese OOOt outlay 000 t outlay OOOt outlay
Poland 37,0 4,9 Hungary 4,5 0,7 4,5 0,7 4,5 0,7 CzechR. 31,4 13,5 66,9 26,3 31,4 13,5 Slovenia
CEC4 35,9 14,2 108,4 31,9 35,9 14,2
Romania 14,5 7,9 11,1 1,4 Bulgaria 5,0 5,2 Slovakia 3,55 2,6 15,0 5,9 3,55 2,6
total 53,9 24,8 123,4 37,8 50,5 18,3
beef pigmeal poultry OOOt outlay OOOt outlay OOOt outlay
Poland 40,4 53,7 40,4 53,7 13,0 8,4 Hungary 83,0 7,5 126,0 21,8 111,0 19,6 CzechR. 49,8 6,5 10,1 1,5 22,8 4,9 Slovenia
CBC-4 173,2 67,8 176,5 77,0 146,8 32,9
Romania 68,8 ll,8 68,8 11,8 27,8 10,1 Bulgaria 0,6 0,2 0,6 0,5 6,2 12,8 Slovakia 28,4 4,0 4,7 0,7 11,0 2,5
total 270,4 83,5 250,0 89,5 185,6 45,5
Source: country reports. Outlays are in million BCU. For Romania end of period is 2004. For Hungary the waiver it has been accorded on export commilments is taken into account. For Poland, Romania and Bulgaria global meat commitments bave been split between beef and pigmeat, as bave global dairy commitments for Hungary and the Czech and Slovak Republics over the different dairy products.
CEC Summary report > 29
3.3. Structural and rural policy
In addition to the legal framework that covers farm structures (land and farm privatisation) various structural and rural policy instruments are being developed by the CECs such as support for agricultural investment and for farming in less favoured areas. Policies and support instruments for off farm investment and economic diversification in rural areas are generally still limited.
The perceived lack of access to capital has led many governments to set up farm investment programmes in the form of grants, interest rate subsidies and loan guarantees either allocated directly by the ministry of agriculture or channelled through the commercial banking system. Investment items covered are usually equipment and machinery, buildings and land improvement.
Many countries have .schemes to support farming in less favoured areas often in the form of area and/or headage payments, which can absorb a significant part of the agricultural budget (e.g. Slovakia and the Czech Republic).
In most countries rural policy formulation is still at an early stage and limited to village renewal and improving the technical infrastructure, although some countries are developing programmes for small and medium sized enterprises, tourism and local processing of raw materials to promote economic diversification.
30 < CEC Summary report
4. Commodity situation and outlook
'
In this chapter an overview will be presented of the current situation and expected developments in the medium term for the main commodity sectors, starting with the evolution of land use and livestock numbers during transition.
For each of the countries tentative projections of supply and demand up to the year 20039 have been made based on detailed country analyses. In building the scenarios for agriculture in the country reports the following main (and often interrelated) elements were considered:
• the general economic environment, i.e. degree of macro-economic stabilisation, progress in privatising the economy, rate of economic and income growth as one of the determinants of food demand;
• rate of structural reform in agriculture and of restructuring in the up- and downstream sectors; credit and (foreign) capital availability; settlement of (land) property rights;
• input intensities; productivity increases;
• likely development of support policies (border measures, direct subsidies), budgetary and GATT constraints, alignment to EU policies; share of household income spent on food;
• world market developments;
• population growth.
For the CEC bloc as a whole an annual average GDP growth of 4 to 5% over the projection period is expected, with Poland and the Baltic countries at the higher end of the range (around 6 to 7%) in the next
' The assumed minimum pre-accession period, before the first CECs join the EU..
few years, Romania and the Czech Republic at the lower end (around 2 to 3%) and the others in between.
The general income growth in the CECs will contribute to some growth of demand for agricultural products, although the pre-transition levels of per capita consumption will likely not be reached, in particular for livestock products. Some growth in animal production will also increase the feed demand for cereals.
In most countries land reform, including the establishment of functioning land markets, and restructuring of the food chain will continue during the projection period. The evolution of farm structures can be expected to be slow in view of the agricultural sector's weak financial situation and limited capability to attract investment.
Although several countries recently increased their agricultural budgets significantly, further substantial increases in agricultural support do not seem likely in view of the budgetary constraints many countries face. Budgetary transfers to agriculture might increasingly be used for direct payments as the scope for increasing price support is limited by GATT and regional trade agreements. The extent to which domestic prices can rise is also limited by the still relatively high share of household income spent on food and by the still relatively high inflation rates in most countries. CAP like instruments will increasingly be put in place as countries (in particular those expecting to be in the first wave of entrants) align their policies to the EU, although not necessarily the levels of support for the reasons mentioned above.
CEC Summary report > 31
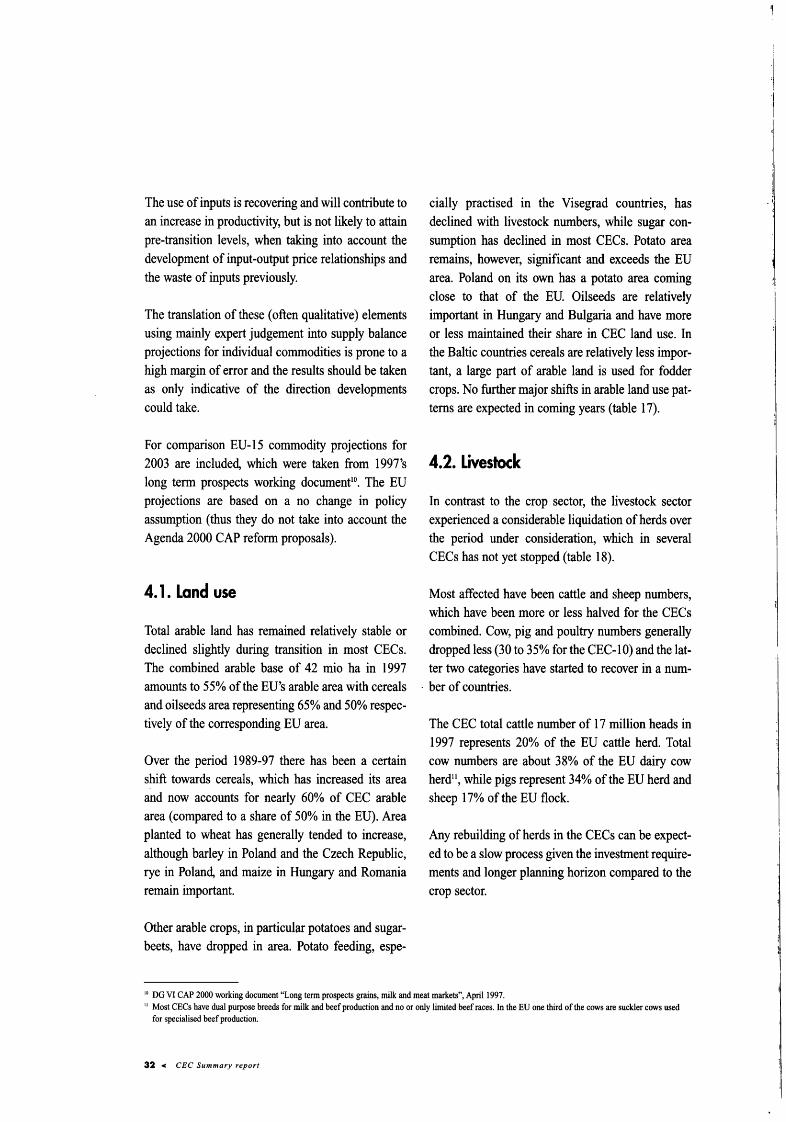
The use of inputs is recovering and will contribute to an increase in productivity, but is not likely to attain pre-transition levels, when taking into account the development of input-output price relationships and the waste of inputs previously.
The translation of these (often qualitative) elements using mainly expert judgement into supply balance projections for individual commodities is prone to a high margin of error and the results should be taken as only indicative of the direction developments could take.
For comparison EU-15 commodity projections for 2003 are included, which were taken from 1997's long term prospects working document'0• The EU projections are based on a no change in policy assumption (thus they do not take into account the Agenda 2000 CAP reform proposals).
4. 1. Land use
Total arable land has remained relatively stable or declined slightly during transition in most CECs. The combined arable base of 42 mio ha in 1997 amounts to 55% of the EU's arable area with cereals and oilseeds area representing 65% and 50% respectively of the corresponding EU area.
Over the period 1989-97 there has been a certain shift towards cereals, which has increased its area and now accounts for nearly 60% of CEC arable area (compared to a share of 50% in the EU). Area planted to wheat has generally tended to increase, although barley in Poland and the Czech Republic, rye in Poland, and maize in Hungary and Romania remain important.
Other arable crops, in particular potatoes and sugarbeets, have dropped in area. Potato feeding, espe-
cially practised in the Visegrad countries, has declined with livestock numbers, while sugar consumption has declined in most CECs. Potato area remains, however, significant and exceeds the EU area. Poland on its own has a potato area coming close to that of the EU. Oilseeds are relatively important in Hungary and Bulgaria and have more or less maintained their share in CEC land use. In the Baltic countries cereals are relatively less important, a large part of arable land is used for fodder crops. No further major shifts in arable land use patterns are expected in coming years (table 17).
4.2. Livestock
In contrast to the crop sector, the livestock sector experienced a considerable liquidation of herds over the period under consideration, which in several CECs has not yet stopped (table 18).
Most affected have been cattle and sheep numbers, which have been more or less halved for the CECs combined. Cow, pig and poultry numbers generally dropped less (30 to 35% for the CEC-1 0) and the latter two categories have started to recover in a num-
- her of countries.
The CEC total cattle number of 17 million heads in 1997 represents 20% of the EU cattle herd. Total cow numbers are about 3 8% of the EU dairy cow herd'', while pigs represent 34% of the EU herd and sheep 17% of the EU flock.
Any rebuilding of herds in the CECs can be expected to be a slow process given the investment requirements and longer planning horizon compared to the crop sector.
10 DG VI CAP 2000 working document "Long term prospects grains, milk and meat markets", Aprill997. 11 Most CECs have dual purpose breeds for milk and beef production and no or only limited beef races. In the EU one third of the cows are suckler cows used
for specialised beef production.
32 < CEC Summary report
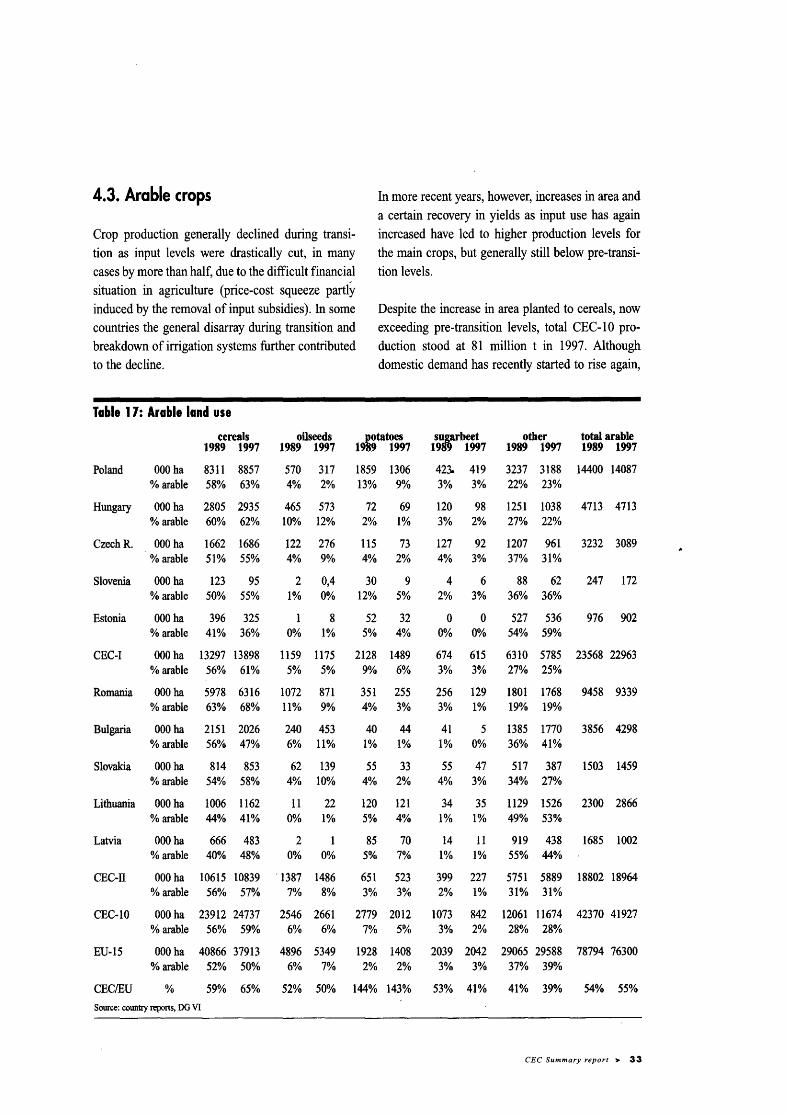
4.3. Arable crops
Crop production generally declined during transition as input levels were drastically cut, in many cases by more than half, due to the difficult financial situation in agriculture (price-cost squeeze partly induced by the removal of input subsidies). In some countries the general disarray during transition and breakdown of irrigation systems further contributed to the decline.
Table 17: Arable land use
In more recent years, however, increases in area and a certain recovery in yields as input use has again increased have led to higher production levels for the main crops, but generally still below pre-transition levels.
Despite the increase in area planted to cereals, now exceeding pre-transition levels, total CEC-1 0 production stood at 81 million t in 1997. Although domestic demand has recently started to rise again,
eereals 1989 1997
oilseeds 1989 1997
potatoes 1989 1997
s~u_ga.rbeet 1989 1997
other total arable 1989 1997 1989 1997
Poland 000 ha 8311 8857 % arable 58% 63%
Hungary 000 ha 2805 2935 % arable 60% 62%
Czech R. 000 ha 1662 1686 ·%arable 51% 55%
Slovenia 000 ha 123 95 % arable 50% 55%
Estonia OOOha 396 325 % arable 41% 36%
570 317 1859 1306 4% 2% 13% 9%
465 573 10% 12%
122 276 4% 9%
2 0,4 1% 00/o
8 0% 1%
72 69 2% 1%
115 73 4% 2%
30 9 12% 5%
52 32 5% 4%
CEC-I 000 ha 13297 13898 1159 1175 2128 1489 %arable 56% 61% 5% 5%
Romania 000 ha 5978 6316 1072 871 % arable 63% 68%
Bulgaria 000 ha 2151 2026 % arable 56% 47%
Slovakia OOOha 814 853 % arable 54% 58%
Lithuania 000 ha 1006 1162 %arable 44% 41%
Latvia OOOha 666 483 % arable 40% 48%
11% 9%
240 453 6% 11%
62 139 4% 10%
11 22 0% 1%
2 0% OOAI
CEC-II 000 ha 10615 10839 · 1387 1486 % arable 56% 57% 7% 8%
9% 6%
351 255 4% 3%
40 44 I% 1%
55 33 4% 2%
120 121 5% 4%
85 70 5% 7%
651 523 3% 3%
423. 419 3237 3188 14400 14087 3% 3% 22% 23%
120 98 1251 1038 4713 4713 3% 2% 27% 22%
127 92 1207 961 3232 3089 4% 3% 37% 31%
4 6 88 62 247 172 2% 3% 36% 36%
0 0 527 536 976 902 0% 00/o 54% 59%
674 615 6310 5785 23568 22963 3% 3% 27% 25%
256 129 1801 1768 9458 9339 3% 1% 19% 19%
41 5 1385 1770 3856 4298 1% 0% 36% 41%
55 47 517 387 1503 1459 4% 3% 34% 27%
34 35 1129 1526 2300 2866 I% 1% 49% 53%
14 11 919 438 1685 1002 1% 1% 55% 44%
399 227 5751 5889 18802 18964 2% 1% 31% 31%
CEC-10 000 ha 23912 24737 2546 2661 2779 2012 1073 842 12061 11674 42370 41927 % arable 56% 59% 6% 6% 7% 5% 3% 2% 28% 28%
EU-15 000 ha 40866 37913 4896 5349 1928 1408 2039 2042 29065 29588 78794 76300 % arable 52% 50% 6% 7% 2% 2% 3% 3% 37% 39%
CEC/EU % 59% 65% 52% 500/o 144% 143% 53% 41% 41% 39% 54% 55%
Source: country reports, DG VI
CEC Summary report > 33
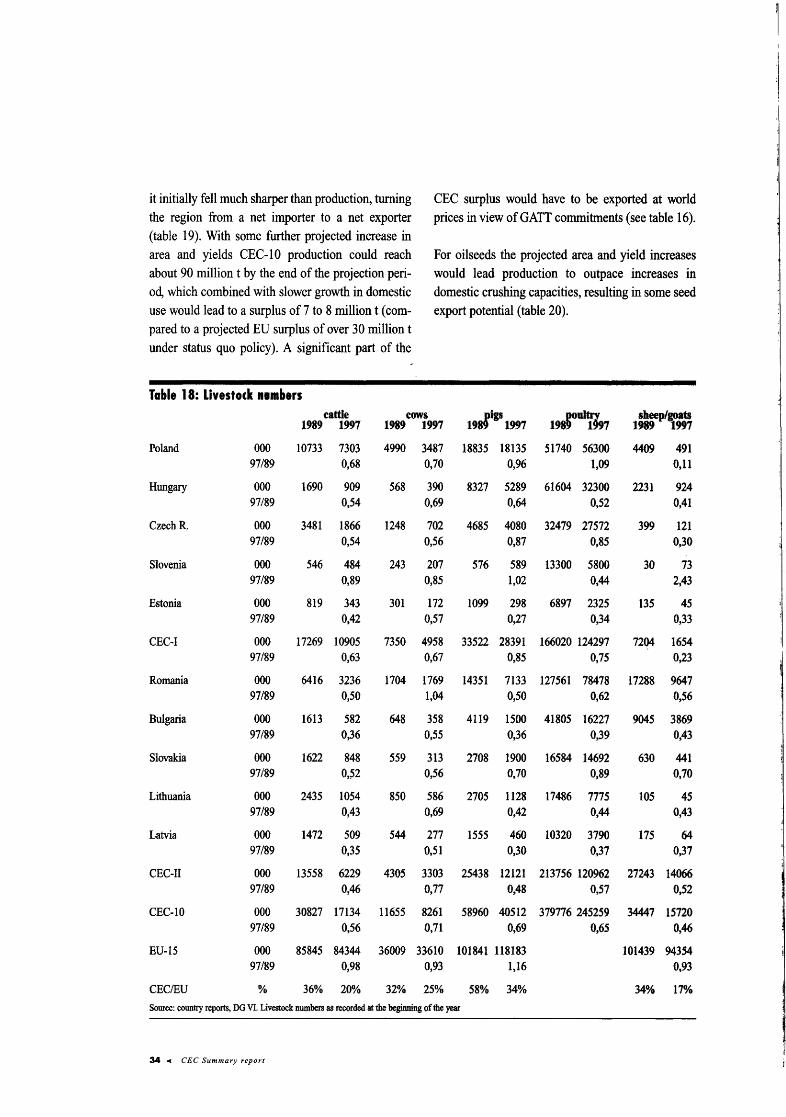
it initially fell much sharper than production, turning CEC surplus would have to be exported at world the region from a net importer to a net exporter prices in view of GATT commitments (see table 16). (table 19). With some further projected increase in area and yields CEC-1 0 production could reach For oilseeds the projected area and yield increases about 90 million t by the end of the projection peri- would lead production to outpace increases in od, which combined with slower growth in domestic domestic crushing capacities, resulting in some seed use would lead to a surplus of 7 to 8 million t (com- export potential (table 20). pared to a projected EU surplus of over 30 million t under status quo policy). A significant part of the
Table 18: Livestock numbers cattle eows
t9stigs1997 198rutYlt, t#p/Tm 1989 1997 1989 1997
Poland 000 10733 7303 4990 3487 18835 18135 51740 56300 4409 491 97/89 0,68 0,70 0,96 1,09 0,11
Hungary 000 1690 909 568 390 8327 5289 61604 32300 2231 924 97/89 0,54 0,69 0,64 0,52 0,41
CzechR. 000 3481 1866 1248 702 4685 4080 32479 27572 399 121 97/89 0,54 0,56 0,87 0,85 0,30
Slovenia 000 546 484 243 207 576 589 13300 5800 30 73 97/89 0,89 0,85 1,02 0,44 2,43
Estonia 000 819 343 301 172 1099 298 6897 2325 135 45 97/89 0,42 0,57 0,27 0,34 0,33
CEC-I 000 17269 10905 7350 4958 33522 28391 166020 124297 7204 1654 97/89 0,63 0,67 0,85 0,75 0,23
Romania 000 6416 3236 1704 1769 14351 7133 127561 78478 17288 9647 97/89 0,50 1,04 0,50 0,62 0,56
Bulgaria 000 1613 582 648 358 4119 1500 41805 16227 9045 3869 97/89 0,36 0,55 0,36 0,39 0,43
Slovakia 000 1622 848 559 313 2708 1900 16584 14692 630 441 97/89 0,~2 0,56 0,70 0,89 0,70
Lithuania 000 2435 1054 850 586 2705 1128 17486 7775 105 45 97/89 0,43 0,69 0,42 0,44 0,43
Latvia 000 1472 509 544 277 1555 460 10320 3790 175 64 97/89 0,35 0,51 0,30 0,37 0,37
CEC-Il 000 13558 6229 4305 3303 25438 12121 213756 120962 27243 14066 97/89 0,46 0,77 0,48 0,57 0,52
CEC-10 000 30827 17134 11655 8261 58960 40512 379776 245259 34447 15720 97/89 0,56 0,71 0,69 0,65 0,46
EU-15 000 85845 84344 36009 33610 101841 118183 101439 94354 97/89 0,98 0,93 1,16 0,93
CECIEU % 36% 20% 32% 25% 58% 34% 34% I 70/o
Source: country reports, DG VI. Livestock numbers as recorded at the beginning of the year
34 < CEC Summary report
Taltle 19: Cereals supply ltalance ma(OGella) yield (tlba) proclaetloa(Mt) domestie aae (0(10 t) balante (GOt t)
19&9 199'7 2083 1989 1997 2003 1989 1997 - 1989 1997 - 1989 m7 2003
Poland 8311 8857 9275 3,2 2,9 3,3 26888 25351 30831 28942 27078 30435 -2054 -1727 396 Hungary 2805 2935 2850 5,5 4,8 5,0 15417 14114 14164 13205 1183 7 10385 2212 2277 3779 CzechR. 1662 1686 1650 4,7 4,1 4,4 7793 6983 7317 7840 6797 6886 -47 186 431 Slovenia 125 95 102 4,2 5,4 5,9 527 511 602 870 974 1076 -343 -457 -474 Estonia 396 325 352 2,4 1,9 2,1 967 615 741 1400 715 795 -433 -100 -54
CEC-1 13299 13898 14229 3.9 3,4 3,8 51592 47580 53655 52251 47401 49577 -665 179 4078
Romania 5978 6316 5920 3,1 3,2 3,3 18309 20058 19553 17651 18000 17792 658 2058 1761 Bulgaria 2151 2026 2380 4,4 2,1 3,3 9485 5548 7948 9364 5350 7134 121 198 814 Slovakia 814 853 878 5,2 4,4 4,8 4232 3741 4229 4219 3644 3588 13 97 641 Lithuania 1006' 1162 1222 3,0 2,6 2,8 3023 3052 3427 3760 2746 3118 -737 306 309 Latvia 666 483 548 2,4 2,1 2,3 1570 1038 1246 2351 929 983 -787 109 263
CEC-n 10615 10839 10948 3,4 3,1 3,3 36619 33437 36403 37351 30669 32615 -732 2768 3788
CEC-10 23914 24737 25171 3,7 3,3 3,6 88211 81017 90058 89608 78070 82192 -1397 2947 7866 EtJ..15 40866 37913 36300 4,6 5,4 5,7 188506 203667 207297 159300 175200 175857 29206 28467 31440
Source: counu:y reports, 00 VI. Years are marketing years, e.g. 1989=198919C).
Taltle 20: Ollseecls"s•pply ltalaRCe area(Mu) yield(tilla) prodaetioa (08tt) domestic ... (080 t) balante (080 t)
Pofaoo 19&9 1991 - 1989 1991 2003 1989 1997 - 1989 1997 l803 19&9 1997 2083 570 317 550 2,8 1,9 2,3 1585 595 1244 1095 798 994 490 -203 250
Hungary 465 573 601 2,0 1,3 2,1 915 737 1259 797 730 1039 118 7 220 Czechll 106 238 260 3,0 2,5 2,8 322 584 718 322 569 665 0 15 54 Slovenia 2,0 0,4 Estonia 0,6 8,2 1,8 1,2 1 10
CEC-I 1144 ll37 1411 2,5 1,7 2,3 2823 1926 3221 2214 2097 2698 609 -171 524
Romania 968 1012 llOO 1,0 1,2 1,3 979 1212 1458 1024 ll92 1389 -45 20 69' Bulgaria 240 453 500 1,9 1,0 1,2 458 446 600 41& 409 508 -19 37 92 Slovakia 62 139 150 2,4 1,9 2,2 147 269 330 121 198 217 26 71 113 Lithuania lt 22 1,7 1,7 19 37 Latvia 1,9 0,9 1,2 1,4 4 1
CEC-ll 1283 1627 1750 1,3 1,2 1,4 1607 1965 2388 1623 1799 2114 ~16 166 274
CEC-10 2426 2763 3161 1,8 1,4 1,8 4430 3891 5609 3836 3896 4812 594 -6 798 EU-15 4896 5742 5573 2,4 2,5 2,3 11636 14526 12741 22797 27588 29000 -11161 ~13062 ~16259
SOllt'C« country reports, 00 VI. Years are marketing years, e.g, 1989-1989/90.
For sugar a decline in beet area would be compensated by an increase in yields (field and plant combined inter alia under the influence of western investment), stabilising beet sugar production at around 3.8 million t. With some further increase in demand in the countries with lower per capita consumption such as Romania and Bulgaria, which are large importers of raw sugar for their refineries, and with less production foreseen in high cost producer
Poland, the beet sugar deficit of the CEC region would tend to increase (table 21).
4.4. Other crops
As for the arable crops the area used for fruit and vegetables and wine production has remained fairly stable or declined somewhat in most CECs during
CEC Summary report > 35
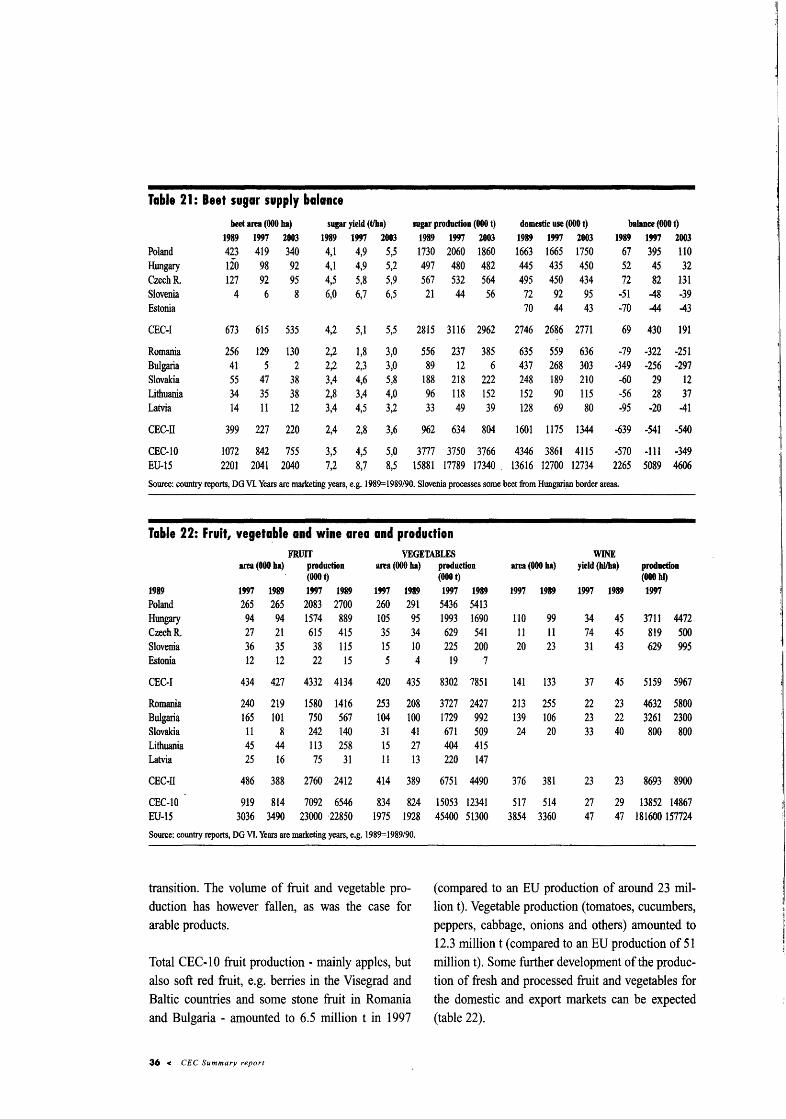
Table 21: Beet sugar supply balance beet area (000 ha) sugar yield (tlka) sugar production (000 t) domestic use (000 t) balance (000 t)
1989 1997 2003 1989 1997 2003 1989 1997 2003 1989 1997 2003 1989 1997 2003 Poland 423 419 340 4.1 4,9 5,5 1730 2060 1860 1663 1665 1750 67 395 110 Hungary tio 98 92 4,1 4,9 5,2 497 480 482 445 435 450 52 45 32 CzechR. 127 92 95 4,5 5,8 5,9 567 532 564 495 450 434 72 82 131 Slovenia 4 6 8 6,0 6,7 6,5 21 44 56 72 92 95 ~51 48 -39 Estonia 70 44 43 -70 -44 43
CEC·I 673 615 535 4,2 5,1 5,5 2815 3116 2962 2746 2686 2771 69 430 191
Romania 256 129 130 2,2 1,8 3,0 556 237 385 635 559 636 -79 ·322 -251 Bulgaria 41 5 2 2,2 2,3 3,0 89 12 6 437 268 303 -349 -256 -297 Slovakia 55 47 38 3,4 4,6 5,8 188 218 222 248 189 210 -60 29 12 Lithuania 34 35 38 2,8 3,4 4,0 96 118 152 152 90 115 -56 28 37 Latvia 14 11 12 3,4 4,5 3,2 33 49 39 128 69 80 -95 -20 41
CEC-Il 399 227 220 2,4 2,8 3,6 962 634 804 1601 1175 1344 -639 -541 -540
CEC-10 1072 842 755 3,5 4,5 5,0 3777 3750 3766 4346 3861 4115 -570 -111 ·349 EU-15 2201 2041 2040 7,2 8,7 8,5 15881 17789 17340 ' 13616 12700 12734 2265 5089 4606
Source: country reports, DG VI. Years are marketing years, e.g. 1989= 1989/90. Slovenia processes some beet from Hungarian border areas.
Table 22: Fruit, vegeta_ble and wine area and production FRUIT VEGETABLES WINE
area (000 ha) production area (000 ha) (OOOt)
1989 1997 1989 1997 1989 1997 1989 Poland 265 265 2083 2700 260 291 Hungary 94 94 1574 889 105 95 CzechR. 27 21 615 415 35 34 Slovenia 36 35 38 115 15 10 Estonia 12 12 22 15 5 4
CEC~I 434 427 4332 4134 420 435
Romania 240 219 1580 1416 253 208 Bulgaria 165 101 750 567 104 100 Slovakia 11 8 242 140 31 41 Lithuania 45 44 113 258 15 27 Latvia 25 16 75 31 11 13
CEC-II 486 388 2760 2412 414 389
CEC-10 919 814 7092 6546 834 824 EU-15 3036 3490 23000 '22850 1975 1928
Source: country reports, DG VI. Years are marketing years, e.g. 1989=1989/90.
transition. The volume of fruit and vegetable production has however fallen, as was the case for arable products.
Total CEC-1 0 fruit production - mainly apples, but also soft red fruit, e.g. berries in the Visegrad and Baltic countries and some stone fruit in Romania and Bulgaria - amounted to 6.5 million t in 1997
36 < CEC Summary report
production area (000 ha) yield (hllha) prodaetion (OOOt) (000 hi) 1997 1989 1997 1989 1997 1989 1997
5436 5413 1993 1690 110 99 34 45 3711 4472 629 541 11 11 74 45 819 500 225 200 20 23 31 43 629 995
19 7
8302 7851 141 133 37 45 5159 5967
3727 2427 213 255 22 23 4632 5800 1729 992 139 106 23 22 3261 2300 671 509 24 20 33 40 800 800 404 415 220 147
6751 4490 376 381 23 23 8693 8900
15053 12341 517 514 27 29 13852 14867 45400 51300 3854 3360 47 47 181600 157724
(compared to an EU production of around 23 million t). Vegetable production (tomatoes, cucumbers, peppers, cabbage, onions and others) amounted to 12.3 million t (compared to an EU production of 51 million t). Some further development of the production of fresh and processed fruit and vegetables for the domestic and export markets can be expected (table 22).
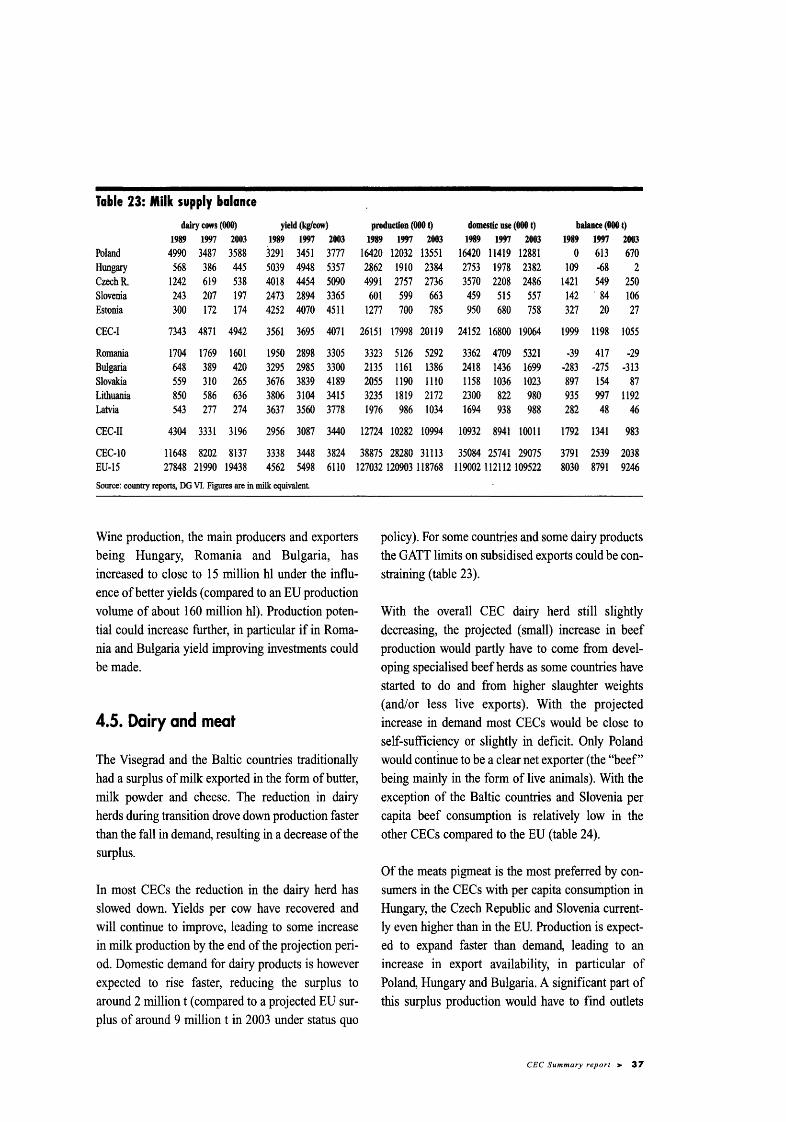
Table 23: Milk supply balance dairy cows (000) yield (kgfcow) production (000 t) domestic use (000 t) balance (000 t)
1989 1997 2003 1989 1997 1003 1989 1997 2003 1989 1997 2003 1989 1997 2003
Poland 4990 3487 3588 3291 3451 3777 16420 12032 13551 16420 11419 12881 0 613 670 Hungary 568 386 445 5039 4948 5357 2862 1910 2384 2753 1978 2382 109 -68 2 CzechR. 1242 619 538 4018 4454 5090 4991 2757 2736 3570 2208 2486 1421 549 250 Slovenia 243 207 197 2473 2894 3365 601 599 663 459 515 557 142 . 84 106 Estonia 300 172 174 4252 4070 45ll 1277 700 785 950 680 758 327 20 27
CEC-1 7343 4871 4942 3561 3695 4071 26151 17998 20ll9 24152 16800 19064 1999 1198 1055
Romania 1704 1769 1601 1950 2898 3305 3323 5126 5292 3362 4709 5321 -39 417 -29 Bulgaria 648 389 420 3295 2985 3300 2135 1161 1386 2418 1436 1699 -283 -275 -313 Slovakia 559 310 265 3676 3839 4189 2055 1190 1110 1158 1036 1023 897 154 87 Lithuania 850 586 636 3806 3104 3415 3235 1819 2172 2300 822 980 935 997 1192 Latvia 543 277 274 3637 3560 3778 1976 986 1034 1694 938 988 282 48 46
CEC-Il 4304 3331 3196 2956 3087 3440 12724 10282 10994 10932 8941 10011 1792 1341 983
CEC-10 11648 8202 8137 3338 3448 3824 38875 28280 31113 35084 25741 29075 3791 2539 2038 EU-15 27848 21990 19438 4562 5498 6110 127032 120903 118768 119002 112112 109522 8030 8791 9246
Source: country reports, DG VI. Figures are in milk equivalent
Wine production, the main producers and exporters being Hungary, Romania and Bulgaria, has increased to close to 15 million hl under the influence of better yields (compared to an EU production volume of about 160 million hl). Production potential could increase further, in particular if in Romania and Bulgaria yield improving investments could be made.
4.5. Dairy and meat
The Visegrad and the Baltic countries traditionally had a surplus of milk exported in the form ofbutter, milk powder and cheese. The reduction in dairy herds during transition drove down production faster than the fall in demand, resulting in a decrease of the surplus.
In most CECs the reduction in the dairy herd has slowed down. Yields per cow have recovered and will continue to improve, leading to some increase in milk production by the end of the projection period. Domestic demand for dairy products is however expected to rise faster, reducing the surplus to around 2 million t (compared to a projected EU surplus of around 9 million t in 2003 under status quo
policy). For some countries and some dairy products the GATT limits on subsidised exports could be constraining (table 23).
With the overall CEC dairy herd still slightly decreasing, the projected (small) increase in beef production would partly have to come from developing specialised beef herds as some countries have started to do and from higher slaughter weights (and/or less live exports). With the projected increase in demand most CECs would be close to self-sufficiency or slightly in deficit. Only Poland would continue to be a clear net exporter (the "beef" being mainly in the form of live animals). With the exception of the Baltic countries and Slovenia per capita beef consumption is relatively low in the other CECs compared to the EU (table 24).
Of the meats pigmeat is the most preferred by consumers in the CECs with per capita consumption in Hungary, the Czech Republic and Slovenia currently even higher than in the EU. Production is expected to expand faster than demand, leading to an increase in export availability, in particular of Poland, Hungary and Bulgaria. A significant part of this surplus production would have to find outlets
CEC Summary report > 37
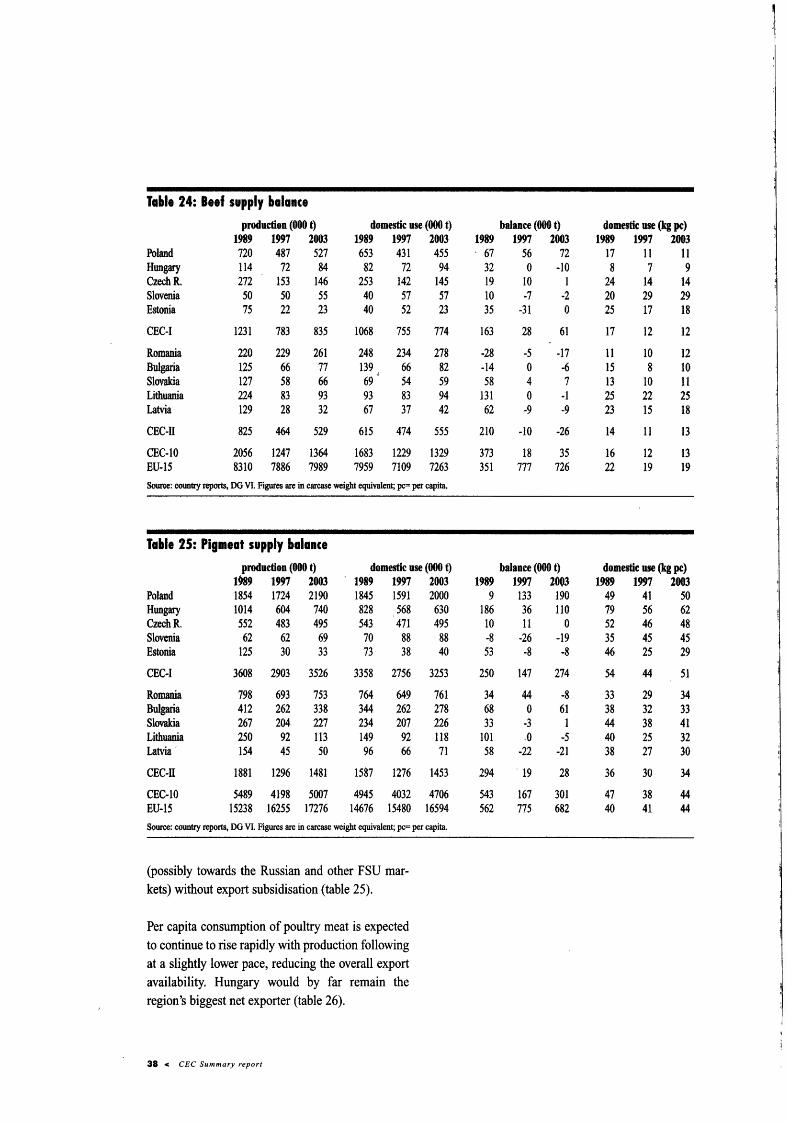
Ta~le 24: Beef supply balance production (000 t) domestic use (000 t) balance (000 t) domestic use (kg pe)
1989 1997 2003 1989 1997 2003 1989 1997 2003 1989 1997 2003 Poland 720 487 527 653 431 455 67 56 72 17 11 11 Hungary 114 72 84 82 12 94 32 0 -10 8 1 9 CzechR. 272 153 146 253 142 145 19 10 1 24 14 14 Slovenia 50 50 55 40 57 57 10 -7 -2 20 29 29 Estonia 75 22 23 40 52 23 35 -31 0 25 17 18
CEC-I 1231 783 835 1068 155 714 163 28 61 17 12 12
Romania 220 229 261 248 234 278 -28 -5 -17 11 10 12 Bulgaria 125 66 77 139 66 82 -14 0 -6 15 8 10 Slovakia 127 58 66 69 54 59 58 4 7 13 10 11 Lithuania 224 83 93 93 83 94 131 0 -1 25 22 25 Latvia 129 28 32 67 37 42 62 -9 -9 23 15 18
CEC-ll 825 464 529 615 474 555 210 -10 -26 14 11 13
CEC-10 2056 1247 1364 1683 1229 1329 373 18 35 16 12 13 EU-15 8310 7886 7989 7959 7109 7263 351 777 726 22 19 19 Source: country reports, DO VI. Figures are in carcase weight equivalent; pc: per capita,
Ta~le 25: Pigmeat supply balance production (000 t) domestic use (000 t) balance (000 t) domestic use (kg pe) 1~ 1997 2003 1989 1997 2003 1989 1997 2003 1989 1997 2003
Poland 1854 1724 2190 1845 1591 2000 9 133 190 49 41 50 Hungary 1014 604 740 828 568 630 186 36 llO 79 56 62 CzechR. 552 483 495 543 471 495 10 11 0 52 46 48 Slovenia 62 62 69 70 88 88 -8 -26 -19 35 45 45 Estonia 125 30 33 73 38 40 53 -8 -8 46 25 29
CEC-1 3608 2903 3526 3358 2756 3253 250 147 274 54 44 51
Romania 798 693 753 764 649 761 34 44 -8 33 29 34 Bulgaria 412 262 338 344 262 278 68 0 61 38 32 33 Slovakia 267 204 227 234 207 226 33 -3 1 44 38 41 Lithuania 250 92 113 149 92 118 101 .o -5 40 25 32 Latvia· 154 45 50 96 66 71 58 -22 -21 38 27 30
CEC-H 1881 1296 1481 1587 1276 1453 294 ' 19 28 36 30 34
CEC-10 5489 4198 5007 4945 4032 4706 543 167 301 47 38 44 EU-15 15238 16255 17276 14676 15480 16594 562 775 682 40 41 44 Source: country reports, DO VI. Figures are in carcase weight equivalent; pc= per capita.
(possibly towards the Russian and other FSU mar-kets) without export subsidisation (table 25).
Per capita consumption of poultry meat is expected to continue to rise rapidly with production following at a slightly lower pace, reducing the overall export availability. Hungary would by far remain the region's biggest net exporter (table 26).
38 < CEC Summary report
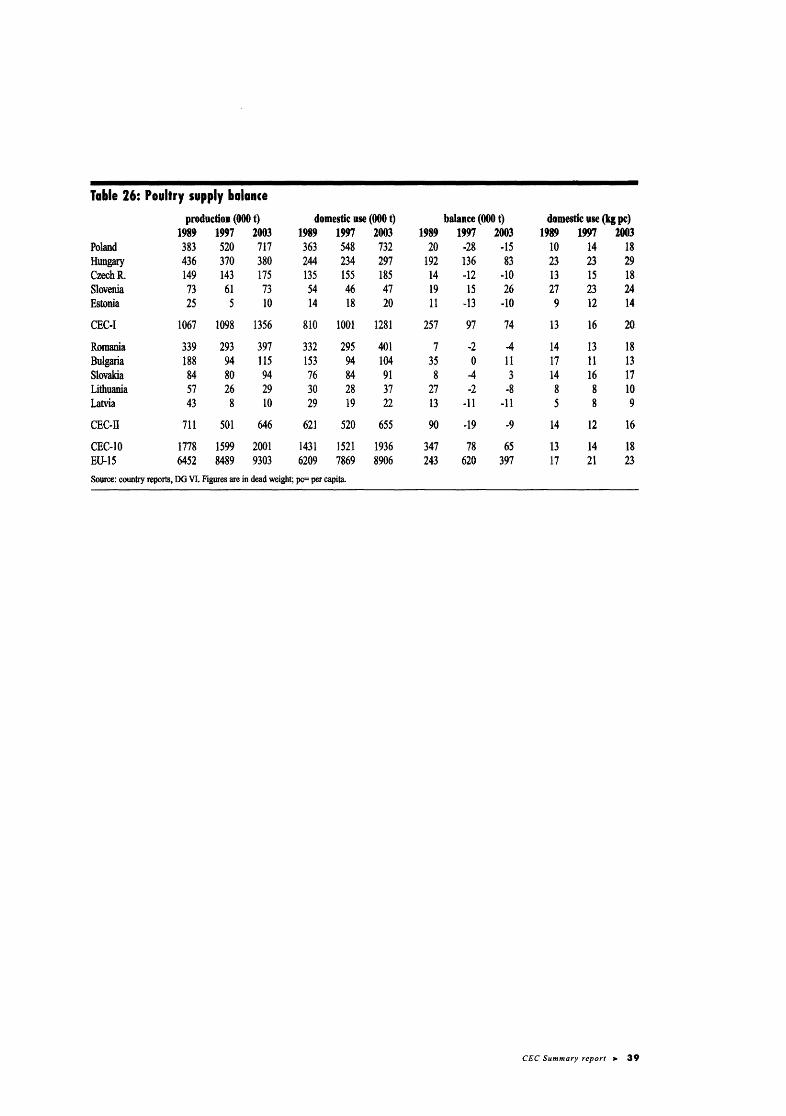
Table 26: Poultry supply balance production (006 t) domestic use (000 t) balance (006 t) domestic use (kg pc)
1989 1997 2003 1989 1997 2003 1989 1997 2003 1989 1997 1003 Poland 383 520 717 363 548 732 20 ~28 -15 10 14 18 Hungary 436 370 380 244 234 297 192 136 83 23 23 29 CzechR. 149 143 175 135 155 185 14 -12 -10 13 15 18 Slovenia 73 61 73 54 46 47 19 15 26 27 23 24 Estonia 25 5 lO 14 18 20 II -13 -10 9 12 14
CEC-1 1067 1098 1356 810 1001 1281 257 97 74 13 16 2(}
Romania 339 293 397 332 295 401 7 ~2 4 14 l3 18 Bulgaria 188 94 115 153 94 104 35 0 11 17 l1 13 Slovakia 84 80 94 76 84 91 8 4 3 14 16 17 Lithuania 57 26 29 30 28 37 27 -2 -8 8 8 10 Latvia 43 8 lO 29 19 22 l3 -11 -11 5 8 9
CEC-ll 711 501 646 621 520 655 90 -19 -9 14 12 16
CEC-10 1778 1599 2001 1431 1521 1936 347 78 65 13 14 18 EU-15 6452 8489 9303 6209 7869 8906 243 620 397 17 21 23 Source: country reports, DG VI. Figures are in dead weight; pc= per capita.
CEC Summary report > 39

5. General conclusion and outlook
In most CECs agriculture has lived through a deep crisis of adjustment since 1989/90 and is only now starting to refind its bearings. Crop production is on the rise, while the decline of the livestock sector would seem to have bottomed out. Land reform and privatisation have on paper been completed in most countries, although the definitive settlement of property rights, the establishment of functioning land markets and the restructuring of farms and farm management is still an ongoing process far from complete. In particular the absorption of surplus labour from the farm sector in the rural economies will pose a major challenge for most CECs.
Similarly the up- and downstream sectors have been privatised, but still face major overcapacity and restructuring problems. In many CECs the agrofood sector as a whole furthermore faces an uphill road in creating market institutions, (re )establishing marketing and distribution chains, meeting EU veterinary and phytosanitary standards and in building the administrative capacity to accompany this process.
Support for agriculture through border protection, market intervention and structural aid has generally increased. Farm prices have increased, in particular
for crop products. The price gap between the CECs and the EU for cereals, pigmeat and poultry has narrowed considerably and could be expected to disappear if the EU's Agenda 2000 CAP reform plans are implemented. Several CECs might face the need to adjust their price support downward for these products. For sugar, dairy and beef price gaps are still bigger, for the livestock products also partly due to quality differences. For the latter Agenda 2000 would reduce the EU prices.
The projections for the main commodities show that the CECs could be expected to somewhat increase their surplus production of cereals, oilseeds and pigmeat until 2003. The export of these surpluses would mostly have to be at world market prices. The traditional dairy surplus would be somewhat reduced, while for beef and poultry the region would be more or less self-sufficient.
In a post-accession situation the agrofood sector in the first CECs joining the EU would be subjected to the full competitive force of the single market. In particular the livestock sector in these countries could be expected to face problems in dealing with the competitive pressure under single market requirements.
CEC Summary report > 41
European Commission
Agricultural Situation and Prospects in the Central and Eastern European Countries -
Summary report
Luxembourg: Office for Official Publications of the European Communities
1998-42 p., 2 figures, 1 map- 21,0 x 29,7 em
ISBN 92-828-3957-5
42 c CEC Summary report
Venta • Salg • Verkauf • nwAf)o£1c:; • Sales • Vente • Vendita • Verkoop • Venda • Myynti • Forsaljning
BELGIQUE/BELGIE
Jean De Lannoy Avenue du Ro1 202/Koningslaan 202 B-1190 Bruxelles!Brussel Tel. (32·2) 538 43 o8 Fax (32·2) 538 08 41 E-mail: jean.de.lannoy@ infoboard.be URL: http://www.jean-de-lannoy.be
La librairie europeenne/De Europese Boekhandel Rue de Ia Loi 244/Wetstraat 244 B-1 040 Bruxelles!Brussel Tel. (32·2) 295 26 39 Fax (32·2) 735 08 60 E-mail: mail@ libeurop.be URL: http://www.libeurop.be
Moniteur belge/Belgisch Staatsblad Rue de Louvain 40-42/Leuvenseweg 40-42 B-1000 Bruxelles!Brussel Tel. (32·2) 552 22 11 Fax (32·2) 511 01 84
DAN MARK
J. H. Schultz Information AJS Herstedvang 1 0-12 DK-2620 Alberts lund Til. (45) 43 63 23 00 Fax (45) 43 63 19 69 E-mail: schultz@ schultz.dk URL: http://www.schultz.dk
DEUTSCHLAND
Bundesanzeiger Verlag GmbH Vertriebsabteilung Amsterdamer StraBe 192 D-50735 K61n Tel. (49-221) 97 66 80 Fax (49·221) 97 66 82 78 E-Mail: vertrieb@ bundesanzeiger.de URL: http://www.bundesanzeiger.de
Nur fOr Veroffentlichungen des Gerichtshofes
Carl Heymanns Verlag KG Luxemburger Strasse 449 D-50939 Koln Tel. (49-221) 94 373-0 Fax (49-221) 94 373-901
EMMA/GREECE
G. C. Eleftheroudakis SA International Bookstore Panepistimiou 17 GR-1 0564 Athina Tel. (30·1) 331 41 80/1/2/3/4/5 Fax (30-1) 323 98 21 E-mail: elebooks@ netor.gr
ESPANA
Boletin Oficial del Estado Trafalgar, 27 E-28071 Madrid Tel. (34) 915 38 21 11 (Libros)/
913 84 17 15 (Suscripciones) Fax (34) 915 38 21 21 (L1bros)/
913 84 17 14 (Suscripciones) E-mail: [email protected] URL: http://www.boe.es
Mundi Prensa Libros, SA Castello, 37 E-28001 Madrid Tel. (34) 914 36 37 oo Fax (34) 915 75 39 98 E-mail: libreria@ m undiprensa.es URL: http://www.mundiprensa.com
FRANCE
Journal official Service des publications des CE 26, rue Desa1x F-75727 Paris Cedex 15 Tel. (33) 140 58 n 31 Fax (33) 140 58 77 00
IRELAND
Government Supplies Agency Publications Section 4-5 Harcourt Road Dublin 2 Tel. (353-1) 661 31 11 Fax (353·1) 475 27 60
IT ALIA
LicosaSpA Via Duca di Calabria, 1/1 Casella postale 552 1·50125 Firenze Tel. (39-55) 64 54 15 Fax (39·55) 64 12 57 E-mail: [email protected] URL: http://www.ftbcc.it/licosa
LUXEMBOURG
Messageries du livre SARL 5, rue Raiffeisen L-2411 Luxembourg Tel. (352) 40 10 20 Fax (352) 49 06 61 E-mail: mdl@pt lu URL: http://www.mdl.lu
Abonnements:
Messageries Paul Kraus 11, rue Christophe Plan tin L-2339 Luxembourg Tel. (352) 49 98 88-8 Fax (352) 49 98 88-444 E-mail: [email protected] URL: http://www.mpk.lu
NEDERLAND
SOU Servicecentrum Uitgevers Christoffel Plantijnstraat 2 Postbus 20014 2500 EA Den Haag Tel. (31-70) 378 98 80 Fax (31·70) 378 97 83 E-mail: [email protected] URL: http://www.sdu.nl
OSTERREICH
Manz'sche Verlags- und Universitiitsbuchhandlung GmbH Kohlmarkt 16 A-1014Wien Tel. (43·1) 53 16 11 00 Fax (43·1) 5316 11 67 E-Mail: [email protected] URL: http://www .austria.EU.net:81/manz
PORTUGAL
Distribuidora de Livros Bertrand Ld.• Grupe Bertrand, SA Rua das Terras dos Vales, 4-A Apartado 60037 P-2700 Amadora Tel. (351-2) 495 90 50 Fax (351·2) 496 02 55
lmprensa Nacionai-Casa da Moeda, EP Rua Marques Sa da Bandeira, 16-A P-1050 Lisboa Codex Tel. (351-1) 353 03 99 Fax (351·1) 353 02 94 E-mail: del.incm@ mail.telepac.pt URL: http://www.incm.pt
SUOMI/FINLAND
Akateeminen Kirjakauppa/Akademiska Bokhandeln Keskuskatu 1/Centralgatan 1 PUPS 128 FIN-001 01 Helsinki/Helsingfors P./tfn (358·9) 121 44 18 F./fax (358·9) 121 44 35 Sahkoposti: akatilaus@ stockmann.fi URL: http://www.akateeminen.com
SVERIGE
BTJAB
~~~~\o~:~~~J 1 Tin. (46-46) 18 00 00 Fax (46-46) 30 79 47 E-post: [email protected] URL: http://www.btj.se
UNITED KINGDOM
The Stationery Office Ltd International Sales Agency 51 Nine Elms Lane London SW8 5DR Tel. (44·171) 873 90 90 Fax (44-171) 873 84 63 E-mail: [email protected] URL: http://www.the-stationery-office.co.uk
fSLAND
Bokabud Larusar Blondal Skolavordustig, 2 IS-101 Reykjavik Tel. (354) 551 56 50 Fax (354) 552 55 60
NORGE
Swats Norge AS 0stenjoveien 18 Boks 6512 Etterstad N-0606 Oslo Tel. (47-22) 97 45 00 Fax (47·22) 97 45 45
SCHWEIZ/SUISSE/SVIZZERA
Euro Info Center Schweiz c/o OSEC StampfenbachstraBe 85 PF 492 CH-8035 ZOrich Tel. (41-1) 365 53 15 Fax (41-1) 365 54 11 E-mail: [email protected] URL: http://www .osec.ch!eics
BALGARIJA
Europress Euromedia Ltd 59, blvd Vitosha BG-1 000 Sofia Tel. (359·2) 980 37 66 Fax (359·2) 980 42 30 E-mail: [email protected]
CESKA REPUBLIKA
US IS NIS-prodejna Havelkova 22 CZ-130 00 Praha 3 Tel. (420·2) 24 23 14 86 Fax (420·2) 24 23 11 14 E-mail: [email protected] URL: http://www.n1s.cz
CYPRUS
Cyprus Chamber of Commerce and Industry PO Box 1455 CY-1509 Nicosia Tel. (357·2) 66 95 00 Fax (357·2) 66 10 44 E-mail: [email protected]
EESTI
Eesti Kaubandus-Toostuskoda (Estonian Chamber of Commerce and Industry) Toom-Kooli 17 EE-0001 Tallinn Tel. (372) 646 02 44 Fax (372) 646 02 45 E-mail: [email protected] URL: http://www.koda.ee
MAGYARORSZAG
Euro Info Service Europa Haz Margitsziget PO Box475 H-1396 Budapest 62 Tel. (36·1) 350 80 25 Fax (36·1) 350 90 32 E-mail: euroinfo@ mail.matav.hu URL: http://www.euroinfo.hu/index.htm
MALTA
Miller Distributors Ltd Malta International Airport POBox 25 Luqa LQA05 Tel. (356) 66 44 88 Fax (356) 67 67 99 E-mail: [email protected]
POLSKA
Ars Polona Krakowskie Przedm iescie 7 Skr. pocztowa 1001 PL-00·950 Warszawa Tel. (48·22) 826 12 01 Fax (48-22) 826 62 40 E-mail: [email protected]
ROMANIA
Euromedia Str. G-ral Berthelot Nr 41 R0-70749 Bucuresti Tel. (40·1) 315 44 03 Fax (40-1) 315 44 03
SLOVAKIA
Centrum VTI SR Nam. Slobody, 19 SK-81223 Bratislava Tel. (421·7) 531 83 64 Fax (421-7) 5318364 E-mail: [email protected] URL: http://www.sltk.stuba.sk
SLOVENIA
Gospodarski Vestnik Dunajska casta 5 SL0-1000 Ljubljana Tel. (386) 611 33 03 54 Fax (386) 611 33 91 28 E-mail: [email protected] URL: http://www.gvestnik.si
TURKIYE
Dunya lnfotel AS 100, Yil Mahallessi 34440 TR-80050 Bagcilar-lstanbul Tel. (90·212) 629 46 89 Fax (90-212) 629 46 27
AUSTRALIA
Hunter Publications PO Box 404 3067 Abbotsford, Victoria Tel. (61·3) 94 17 53 61 Fax (61-3) 94 19 71 54 E-mail: [email protected]
CANADA
Renouf Publishing Co. Ltd 5369 Chemin Canotek Road Unit 1 K1J 9J3 Ottawa, Ontario Tel. (1-613) 745 26 65 Fax (1-613) 745 76 60 E-mail: order.dept@ renoufbooks.com URL: http://www.renoufbooks.com
EGYPT
The Middle East Observer 41 Sherif Street Cairo Tel. (20-2) 393 97 32 Fax (20-2) 393 97 32
HRVATSKA
Mediatrade Ltd Pavia Hatza 1 HR-10000 Zagreb Tel. (385·1) 43 03 92 Fax (385·1) 43 03 92
INDIA
EBIC India 3rd Floor, Y. B. Chavan Centre Gen. J. Bhosale Marg. 400 021 Mumbai Tel. (91·22) 282 60 64 Fax (91·22) 285 45 64 E-mail: [email protected] URL: http://www.ebicindia.com
ISRAEL
ROY International
PO Box 13056 61130 Tel Aviv Tel. (972·3) 546 14 23 Fax (972·3) 546 14 42 E-mail: [email protected]
Sub-agent for the Palestinian Authority:
Index Information Services PO Box 19502 Jerusalem Tel. (972-2) 627 16 34 Fax (972·2) 627 12 19
JAPAN
PSI-Japan
Asahi Sanbancho Plaza #206 7-1 Sanbancho, Chiyoda-ku Tokyo 102 Tel. (81·3) 32 34 69 21 Fax (81-3) 32 34 6915 E-mail: [email protected] URL: http://www.psi-japan.com
MALAYSIA
EBIC Malaysia Level?, Wisma Hong Leong 18 Jalan Perak 50450 Kuala Lumpur Tel. (60-3) 262 62 98 Fax (60-3) 262 61 98 E-mail: [email protected]
PHILIPPINES
EBIC Philippines 19th Floor, PS Bank Tower Sen. Gil J. Puyat Ave. cor. Tindalo St. Makati City Metro Manilla Tel (63-2) 759 66 80 Fax (63-2) 759 66 90 E-mail: [email protected] URL: http://www.eccp.com
RUSSIA
CCEC 60-letiya Oktyabrya Av. 9 117312 Moscow Tel. (70-95) 135 52 27 Fax (70-95) 135 52 27
SOUTH AFRICA
Safto Saito House NO 5 Esterhyzen Street PO Box 782 706 2146 Sandton Tel. (27-11) 883 37 37 Fax (27-11) 883 65 69 E-mail: [email protected] URL: http:/www.safto.co.za
SOUTH KOREA
Information Centre for Europe (ICE) 204 Woo Sol Parktel 395-185 Seogyo Dong, Mapo Ku 121-210 Seoul Tel. (82-2) 322 53 03 Fax (82-2) 322 53 14 E-mail: [email protected]
THAILAND
EBIC Thailand 29 Vanissa Building, 8th Floor Soi Chidlom Ploenchit 1 0330 Bangkok Tel. (66-2) 655 06 27 Fax (66-2) 655 06 28 E-mail: [email protected] URL: http:/www.ebicbkk.org
UNITED STATES OF AMERICA
Bernan Associates 4611-F Assembly Drive Lanham MD20706 Tel. (1-800) 274 44 47 (toll free telephone) Fax (1-800) 865 34 50 (toll free fax) E-mail: [email protected] URL: http://www.bernan.com
ANDERE LANDER/OTHER COUNTRIES/ AUTRES PAYS
Bitte wenden Sie sich an ein Buro lhrer Wahl/ Please contact the sales office of your choice I Veuillez vous &dresser au bureau de vente de votre choix
6/98
-I
I
J
J
I
mz
Europeon CommissionDirectorote-Generol for Agriculture (DG Vll
The present report forms part of a series
on Central and Eastern European countries
produced by the Directorate-General for
Agriculture at the European Commission.
The summary report draws together the
main findings from the ten individual
country reports, which aim to provide an
analysis of the current situation and the
medium-term outlook for the agricultural and
agro-food sectors in the accession
candidate countries.
lr&*#& ^sx*##
{"ffi@q#
\tr"."Affi--*db
g' *
&rf'*
h
t
$
*$*
dd
{j#'6
4I
p&
e*q
ISBN 1a-8eA-315?-5
Hililtiltililr|illllllll9 "789282tr839577',>