Embed Size (px)
Citation preview
IUSS Pavia - Institute for Advanced Study
Master in Cooperation and Development
Palestinian foreign trade:
Current situation and future prospects
Laura Panza
Supervisor: Prof. Marco Missaglia
Academic Year 2006/2007
1
IUS
S -
Pavia
Laura Panza
Palestinian foreign trade: Current situation and future prospects
An Individual Study Submitted in Partial Fulfilment of the Requirements for the Master degree in
Cooperation and Development
Supervisor: Prof. Marco Missaglia
Pavia, January 28-29 January 2008
2
IUS
S -
Pavia
Contents
1. Introduction 3
2. The effects of the asymmetric integration: a non-viable economy 4
3. Macroeconomic overview 7
4. The structure of trade 14
5. Trade agreements 23
6. Indirect taxes 25
7. Export of labor 33
8. The rise of the informal sector 35
9. Export promotion 37
10. Conclusion 45
References 47
3
IUS
S -
Pavia
1.Introduction
The aim of this paper is to investigate whether trade can be a vehicle for growth and development
for the Palestinian economy, taking into consideration its nature of war-torn, occupied territory.
The first two chapters (2-3) of the following analysis aim to depict the current economic
performance of the Occupied Territories: starting from a wide framework, which identifies the roots
of the non-viability of the Palestinian economy, they further give an overall glance to its
macroeconomic structure. Chapter 4 goes in deeper details, analyzing the changes in the trade
structure and trade policies caused by the second intifada and the consequent distortions derived by
the political instability, which deepened the asymmetric forced integration with the Israeli
economy: the rise in the share of both imports and exports from and to Israel during the last decade
represents in fact the clearest sign of the absence of the necessary means to conduct an independent,
non-biased trade policy, thus leading to a process of inward orientation of the Palestinian economy.
Chapter 5 and 6 focus on the trade agreements and the indirect taxation system currently
implemented, which embody the institutional legitimation of the WBGS forced dependency on
Israeli market.
The paper further describes another factor hindering the process of development, the export of labor
(chapter 7), outlining how the flow of workers employed in the Israeli market constituted one of the
major obstacles to the possibility of structural change and increasing productive capacities for the
Palestinian economy. The strengthening of the policy of closures, concretely materialized with the
impossibility of accessing the Israeli labor market, as well as with the absence of expanding the
supply side of the domestic economy, brought, as direct consequence, to the widening of the
informal sector (chapter 8).
At the light of the above mentioned considerations, that helped drawing a clearer picture of WBGS
current economic status, chapter 9 outlines some trade policies that could be implemented as
recovery strategy, focusing on export promotion; the methodology used to validate the proposed
suggestions was based on the computation of Palestinian revealed comparative advantage, using the
Balassa index. Considering the scarcity of natural factor endowments, marble and stone constitute
the only Palestinian competitive commodities: an effective export policy should therefore focus on
supplying high value added goods and services and on finding new niche markets.
Finally, the conclusive chapter outlines the necessity of establishing freedom of movement and
access as preliminary condition for the achievement of economic viability: finding a political
solution constitutes therefore the first step that can lead to economic growth.
4
IUS
S -
Pavia
2. The effects of the asymmetric integration: a non-viable economy
Thirteen years after the beginning of the Oslo peace process and signing of the Economic Protocol
between Israel and the Palestinians, we find that the issue of the economic viability1 of the
Palestinian state is still unresolved. In fact it is difficult to talk about economic viability,
considering that there is no workable definition of what is a Palestinian economy: it is generally
agreed that the Palestinian economy covers the regions of the West Bank and Gaza Strip (WBGS),
but the territories and the borders delineating these areas are not well defined.
In order to understand why today the economic situation of the West Bank and Gaza Strip is non-
viable, it’s necessary to analyze how it evolved during 40 years of Israeli military occupation, the
main responsible for the fragmentation of its economic space. The Palestinian economy maintains
the typical features of an underdeveloped economy and it’s still organized around the same structure
of 1967, when agriculture was the dominant sector and the industrial sector (which composed less
than 10% of the GDP) was organized around micro-enterprises producing for the local market.
The repercussions of forty years of military occupation are visible in the economic anomaly that
WBGS is facing: on one side the forced integration in the Israeli economy led to a dramatic rise of
per capita incomes, which are higher than those of the Arab neighboring countries; on the other side
the Palestinian economic structure remained unchanged, with agriculture playing an extremely
relevant role and with an industrial share of GDP of a bare 14%.
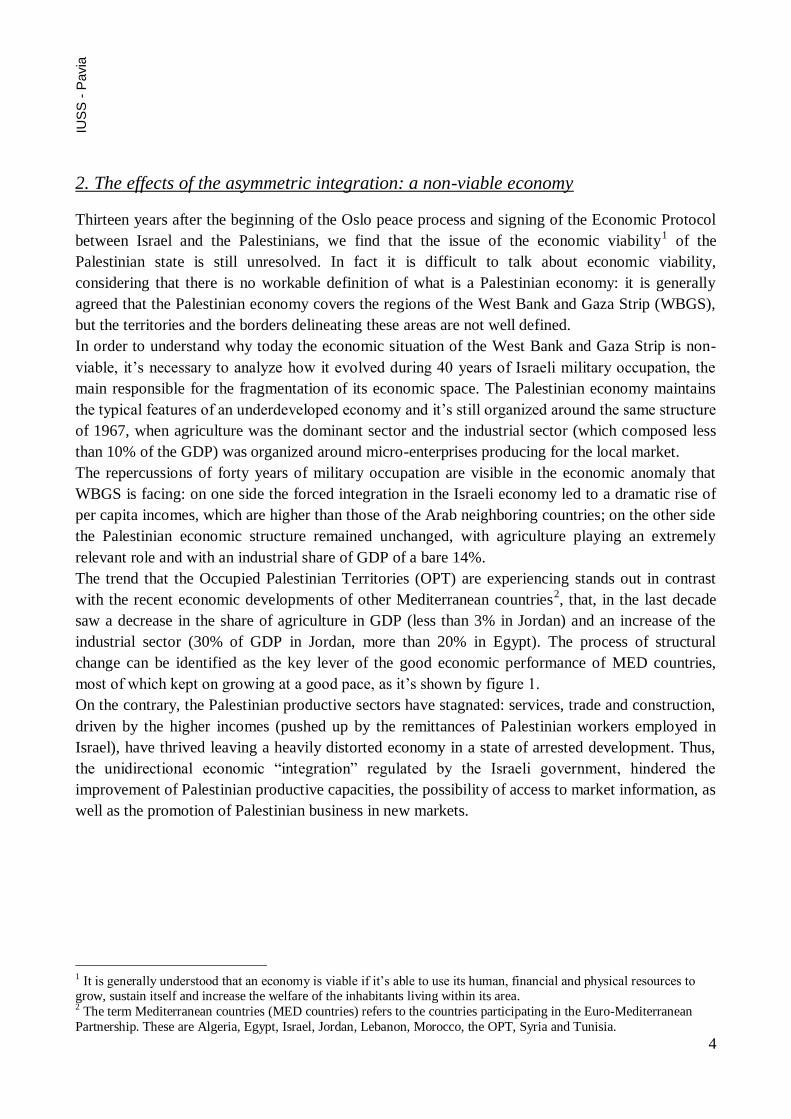
The trend that the Occupied Palestinian Territories (OPT) are experiencing stands out in contrast
with the recent economic developments of other Mediterranean countries2, that, in the last decade
saw a decrease in the share of agriculture in GDP (less than 3% in Jordan) and an increase of the
industrial sector (30% of GDP in Jordan, more than 20% in Egypt). The process of structural
change can be identified as the key lever of the good economic performance of MED countries,
most of which kept on growing at a good pace, as it’s shown by figure 1.
On the contrary, the Palestinian productive sectors have stagnated: services, trade and construction,
driven by the higher incomes (pushed up by the remittances of Palestinian workers employed in
Israel), have thrived leaving a heavily distorted economy in a state of arrested development. Thus,
the unidirectional economic ―integration‖ regulated by the Israeli government, hindered the
improvement of Palestinian productive capacities, the possibility of access to market information, as
well as the promotion of Palestinian business in new markets.
1 It is generally understood that an economy is viable if it’s able to use its human, financial and physical resources to grow, sustain itself and increase the welfare of the inhabitants living within its area. 2 The term Mediterranean countries (MED countries) refers to the countries participating in the Euro-Mediterranean
Partnership. These are Algeria, Egypt, Israel, Jordan, Lebanon, Morocco, the OPT, Syria and Tunisia.
5
IUS
S -
Pavia
Fig. 1 The economic performance of MED countries
The protracted Israeli-Palestinian conflict since October 20003 has brought WBGS economy to a
point of collapse: the supply capacity has been depleted by a massive reduction of its productive
activities and the destruction of its physical infrastructure. This has led to the expansion of the
informal economy, as impoverished households are resorting to survival activities to maintain their
subsistence. The outbreak of the intifada has effectively isolated the country from the rest of the
world, paralyzing Palestinian trade: the absence of a national seaport and Israel’s total control of the
borders and transport routes rendered Palestine a de-facto land-locked economy, with a limited
portion of the territory under PA jurisdiction4, thus leading to complete dependence on the
utilization of neighboring countries’ transport facilities for participation in international trade.
3 Ariel Sharon, the leader of the right-wing Likud party, made a provocative visit to the cite of Al-Aqsa mosque, known
as Harem al Sharif, on 28 September 2000, in order to reaffirm Israeli sovereignty over it. The Palestinian reaction took
the form of the second intifada. 4 The Oslo agreement divided the Palestinian Territory in three distinct areas, defined as Zone ―A‖, ―B‖ and ‖C‖. Zone
―A‖ includes the most populated Palestinian cities but constitutes no more than 3% of the West Bank; here Palestinians
exercise full control over land disposition. Zone ―B‖ encompasses 450 Palestinian towns and villages representing
around 23% of the West Bank; those lands are under both Israeli and Palestinian authority. Zone ―C‖ constitutes the rest of the West Bank (74%) including agricultural land, the Jordan Valley, natural reserves, areas with lower
population density, Israeli settlements and military areas In Area C Israel has full authority over zoning, building and
land registration. In spite of what is established by the Oslo accords, Israel did not withdrew from zones ―B‖ and ‖C‖.
6
IUS
S -
Pavia
The significant difference in size and level of economic development constitutes the biggest
obstacle for a possible symmetric economic integration between the two countries: WBGS Gross
National Income (GNI) per capita was only 7% of that of Israel in 2004; even more significant are
the differences captured by Palestinian GDP, which represented a mere 3% of Israeli’s GDP in
2005. The major asymmetries in respective economic weights are reflected in the relative
importance of respective markets: WBGS markets covered 6% of total Israeli exports, as compared
with Israeli markets, accounting for 88% of Palestinian exports in 2005: similarly, Palestinian goods
represented only 0,8% of total Israeli imports, while the corresponding rate in case of WBGS was
74%.
7
IUS
S -
Pavia
3.Macroeconomic overview
This chapter aims at giving a quick glance to the main macroeconomic features of the West Bank
and Gaza Strip, focusing principally on the overall Palestinian growth performance, together with
the examination of the factors responsible of the current economic crisis.
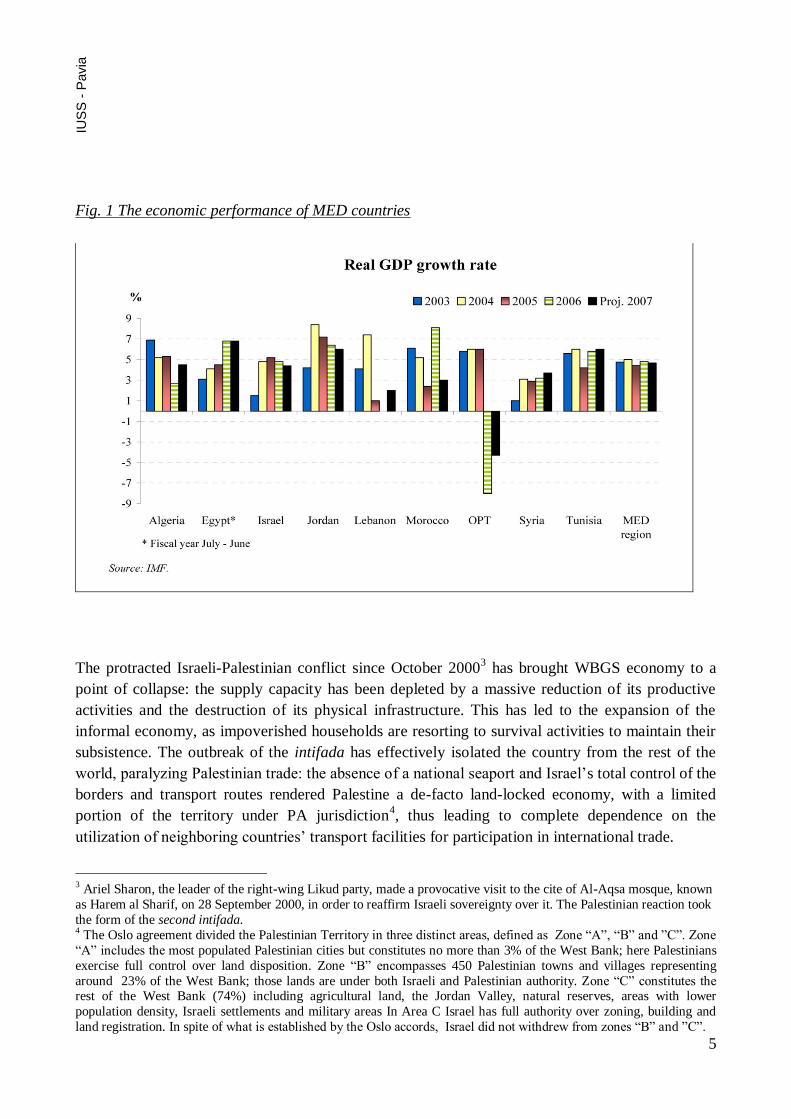
All in all it can be affirmed that the period between 1994 and 2006 stands as a lost decade in terms
of economic development, holding an uncertain prospect for a strong recovery: this time span
witnessed in fact a dramatic contraction of the main macroeconomic and social indicators (table 1.a
and 1.b), as well as a reduction in competitive industrial capacities. Consequently, the situation that
the territories of West Bank and Gaza are currently facing clearly doesn’t rest upon a solid
structure, able to generate positive steps towards economic expansion.
Tab. 1.a: Macroeconomic indicators, 1995-2006
1995 2000 2001 2002 2003 2004 2005 2006
Nominal GDP (US$
billions)
4.52 4.44 3.75 3.16 3.62 4.08 4.48 4.39
Real GDP Growth (%
change)
-2.4 -5.4 -15.4 -9.4 5.8 6.0 6.0 -6.0
Nominal GDP per capita 1731 1861 1697 1469 1535 1636 1724 1764
Exports (US$ billions) 0.64 0.87 0.56 0.46 0.46 0.53 0.59 0.53
Exports (% growth) -10 -2.2 -35.6 -17.9 0 15.2 11.3 -10.2
Imports (US$ billions) 2.73 3.40 2.70 2.54 2.84 3.28 3.60 3.48
Imports (% growth) -2.0 -10.5 -20.6 -5.9 11.8 15.5 9.8 -3.3
Income from abroad (US$
billions)
- 0.67 0.32 0.22 0.25 0.23 0.35 0.30
As % of GDP - 15.7 8.71 7.11 7 5.65 7.95 6.85
Consumption expenditure
as % of GDP
-
125.75 136.52 140.87 138.85 142.19 143.08 147.72
Investment expenditure
as % of GDP
- 31.52 20.72 24.72 26.82 25.12 24.14 19.30
Local savings as % of GDP - -25.75 -36.52 -40.87 -38.85 -42.19 -43.08 -47.72
Current Account
(US$ billions)
- -0.949 -0.571 -0.735 -0.903 -1.28 -1.06 -0.98
As % of GDP - 21.38 15.26 13.8 24.92 31.44 23.77 22.6
Capital and finance
account (US$ billions)
- 1.086 0.720 0.413 1.130 1.319 0.986 1.017
As % of GDP - 24.45 19.22 13.11 31.18 32.36 22.03 23.15
Sources: IMF and World Bank
8
IUS
S -
Pavia
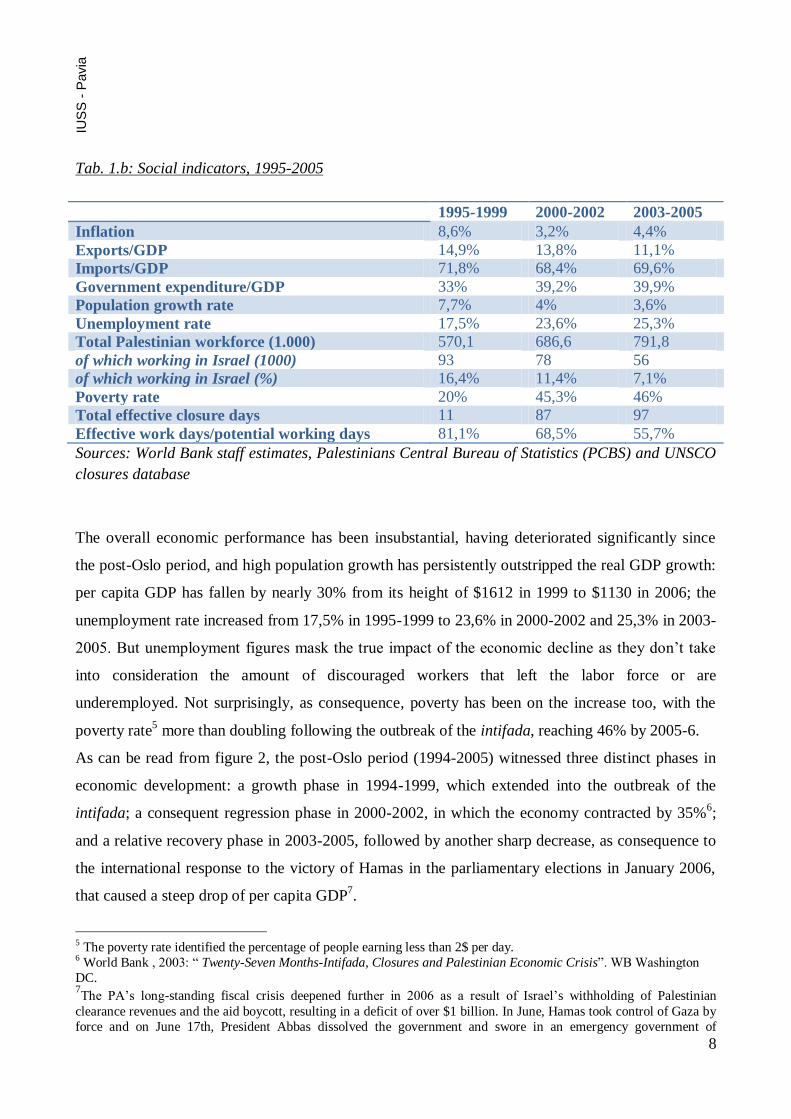
Tab. 1.b: Social indicators, 1995-2005
1995-1999 2000-2002 2003-2005
Inflation 8,6% 3,2% 4,4%
Exports/GDP 14,9% 13,8% 11,1%
Imports/GDP 71,8% 68,4% 69,6%
Government expenditure/GDP 33% 39,2% 39,9%
Population growth rate 7,7% 4% 3,6%
Unemployment rate 17,5% 23,6% 25,3%
Total Palestinian workforce (1.000) 570,1 686,6 791,8
of which working in Israel (1000) 93 78 56
of which working in Israel (%) 16,4% 11,4% 7,1%
Poverty rate 20% 45,3% 46%
Total effective closure days 11 87 97
Effective work days/potential working days 81,1% 68,5% 55,7%
Sources: World Bank staff estimates, Palestinians Central Bureau of Statistics (PCBS) and UNSCO
closures database
The overall economic performance has been insubstantial, having deteriorated significantly since
the post-Oslo period, and high population growth has persistently outstripped the real GDP growth:
per capita GDP has fallen by nearly 30% from its height of $1612 in 1999 to $1130 in 2006; the
unemployment rate increased from 17,5% in 1995-1999 to 23,6% in 2000-2002 and 25,3% in 2003-
2005. But unemployment figures mask the true impact of the economic decline as they don’t take
into consideration the amount of discouraged workers that left the labor force or are
underemployed. Not surprisingly, as consequence, poverty has been on the increase too, with the
poverty rate5 more than doubling following the outbreak of the intifada, reaching 46% by 2005-6.
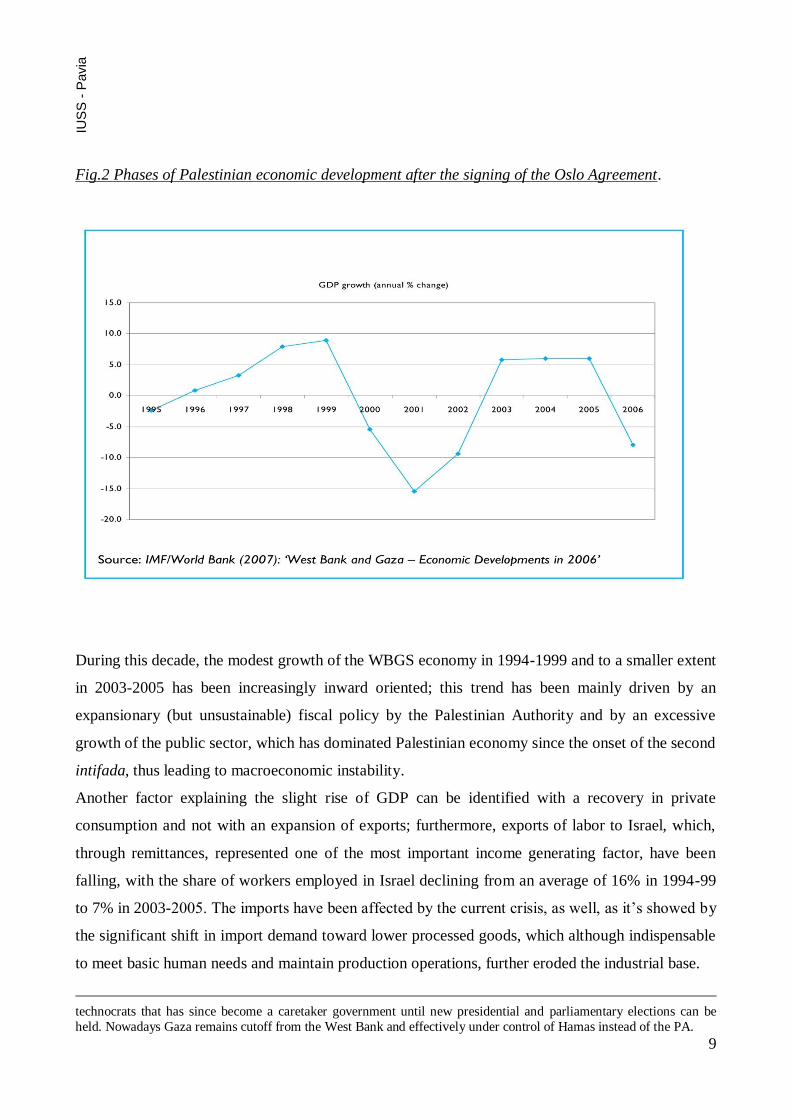
As can be read from figure 2, the post-Oslo period (1994-2005) witnessed three distinct phases in
economic development: a growth phase in 1994-1999, which extended into the outbreak of the
intifada; a consequent regression phase in 2000-2002, in which the economy contracted by 35%6;
and a relative recovery phase in 2003-2005, followed by another sharp decrease, as consequence to
the international response to the victory of Hamas in the parliamentary elections in January 2006,
that caused a steep drop of per capita GDP7.
5 The poverty rate identified the percentage of people earning less than 2$ per day. 6 World Bank , 2003: ― Twenty-Seven Months-Intifada, Closures and Palestinian Economic Crisis‖. WB Washington
DC. 7The PA’s long-standing fiscal crisis deepened further in 2006 as a result of Israel’s withholding of Palestinian
clearance revenues and the aid boycott, resulting in a deficit of over $1 billion. In June, Hamas took control of Gaza by
force and on June 17th, President Abbas dissolved the government and swore in an emergency government of
9
IUS
S -
Pavia
Fig.2 Phases of Palestinian economic development after the signing of the Oslo Agreement.
During this decade, the modest growth of the WBGS economy in 1994-1999 and to a smaller extent
in 2003-2005 has been increasingly inward oriented; this trend has been mainly driven by an
expansionary (but unsustainable) fiscal policy by the Palestinian Authority and by an excessive
growth of the public sector, which has dominated Palestinian economy since the onset of the second
intifada, thus leading to macroeconomic instability.
Another factor explaining the slight rise of GDP can be identified with a recovery in private
consumption and not with an expansion of exports; furthermore, exports of labor to Israel, which,
through remittances, represented one of the most important income generating factor, have been
falling, with the share of workers employed in Israel declining from an average of 16% in 1994-99
to 7% in 2003-2005. The imports have been affected by the current crisis, as well, as it’s showed by
the significant shift in import demand toward lower processed goods, which although indispensable
to meet basic human needs and maintain production operations, further eroded the industrial base.
technocrats that has since become a caretaker government until new presidential and parliamentary elections can be
held. Nowadays Gaza remains cutoff from the West Bank and effectively under control of Hamas instead of the PA.
10
IUS
S -
Pavia
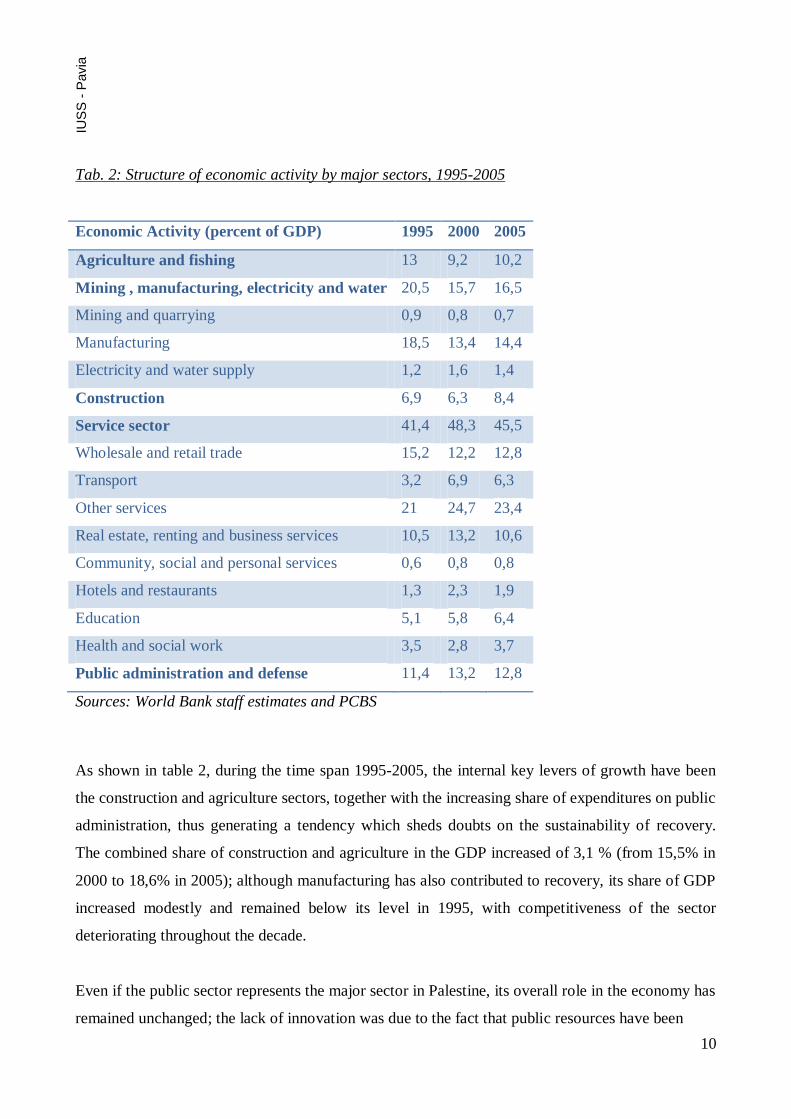
Tab. 2: Structure of economic activity by major sectors, 1995-2005
Economic Activity (percent of GDP) 1995 2000 2005
Agriculture and fishing 13 9,2 10,2
Mining , manufacturing, electricity and water 20,5 15,7 16,5
Mining and quarrying 0,9 0,8 0,7
Manufacturing 18,5 13,4 14,4
Electricity and water supply 1,2 1,6 1,4
Construction 6,9 6,3 8,4
Service sector 41,4 48,3 45,5
Wholesale and retail trade 15,2 12,2 12,8
Transport 3,2 6,9 6,3
Other services 21 24,7 23,4
Real estate, renting and business services 10,5 13,2 10,6
Community, social and personal services 0,6 0,8 0,8
Hotels and restaurants 1,3 2,3 1,9
Education 5,1 5,8 6,4
Health and social work 3,5 2,8 3,7
Public administration and defense 11,4 13,2 12,8
Sources: World Bank staff estimates and PCBS
As shown in table 2, during the time span 1995-2005, the internal key levers of growth have been
the construction and agriculture sectors, together with the increasing share of expenditures on public
administration, thus generating a tendency which sheds doubts on the sustainability of recovery.
The combined share of construction and agriculture in the GDP increased of 3,1 % (from 15,5% in
2000 to 18,6% in 2005); although manufacturing has also contributed to recovery, its share of GDP
increased modestly and remained below its level in 1995, with competitiveness of the sector
deteriorating throughout the decade.
Even if the public sector represents the major sector in Palestine, its overall role in the economy has
remained unchanged; the lack of innovation was due to the fact that public resources have been
11
IUS
S -
Pavia
increasingly allocated to wages, currently accounting for 95% of total expenditure. The period
2003-2005 witnessed two larges salary hikes8, despite the PA’s revenue fall, following the outbreak
of the intifada and the international boycott of the Hamas government, thus provoking a 20% rise in
the average wage rate in 2004 and a further 20% during the last quarter of 2005. The increase in the
wage bill appears to have acted countercyclical and helped to protect household incomes in times of
economic crisis; however, in particular during 2002-2003, the wage expenditure was quite far above
trend and in excess of what the cyclical downturn of the economy would have suggested;
expenditure in this sector may have contributed to social stability, but they did not contribute to
growth. Overall, continued rise of the expenditures during the intifada resulted in a rapid expansion
in the expenditure/GDP ratio, which was more than doubled during 1999-2005, reaching 49%, one
of the highest ratios in the world.
Palestinian economy is highly sensitive to external stimuli, as it’s confirmed by the fact that the
main indicators of the limited growth process in WBGS don’t generate from internal dynamics, but
are driven by external assistance and workers’ remittances from Israel, rather than increased local
productive capacities for tradable goods and productivity growth. This phenomenon of diverging
productivity between WBGS and Israel, is well documented by the economist S. Dessus,9 attesting
that the benefits of the integration of Palestinian economy with a much more highly developed
partner (Israel) have not materialized. The conditions necessary to allow a process of deeper
integration were not in place even before the intifada: the formal agreement that ruled the economic
relationship between Israel and WBGS (the so called Paris Protocol), signed in 1994 during the
Oslo peace process did not allow the development of the Palestinian economy; on the contrary, it
increased its level of dependency on the Jewish state, because of the establishment of a quasi-
custom union, characterized by the absence of internal borders and by the use of Israeli domestic
currency in the Occupied Territories. This form of integration has not generated economies-of-scale
effects and although WBG has remained under a single customs ―envelop‖, its economy has never
8 The first salary hike occurred in late 2003 as part of the wage increase envisaged when the Civil Service Law was implemented. The second round of salary increases benefited security service staff in particular relevant to civil
servants. 9 Sebastien Dessus, ―A Palestinian Growth History, 1968-2000‖ (Journal of Economic Integration, Vol. 19, N° 3, 2004)

12
IUS
S -
Pavia
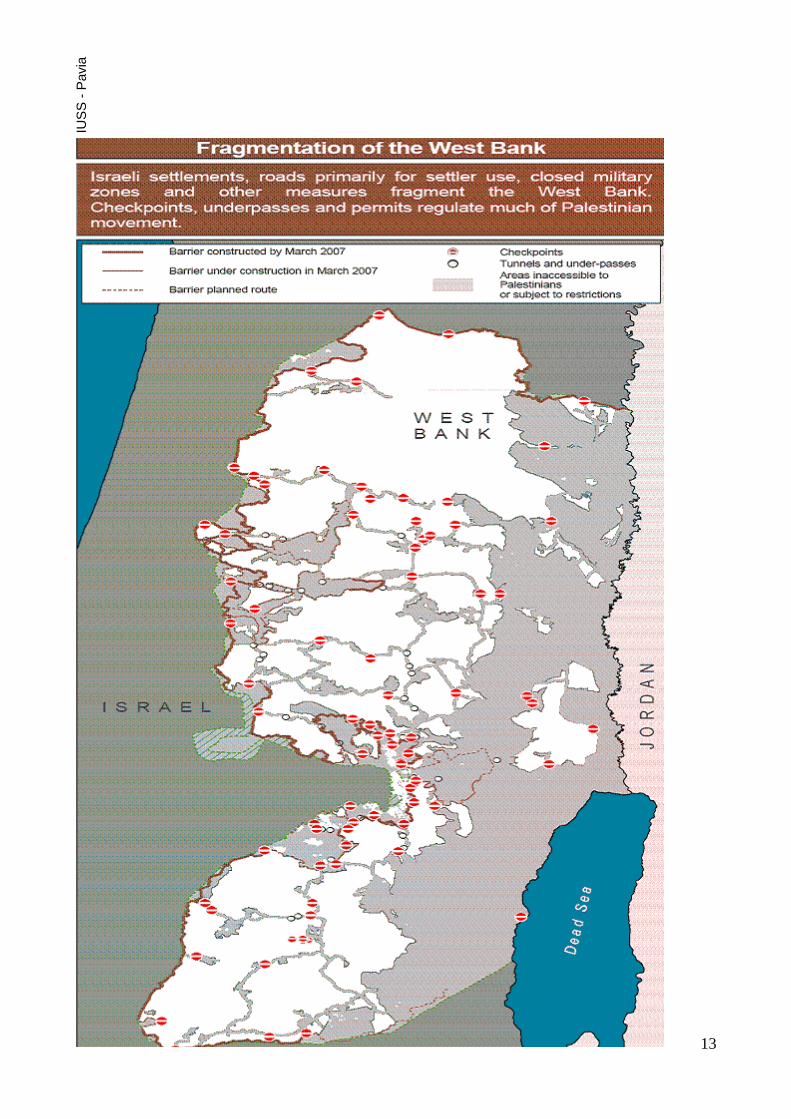
been a single economic space10
(the map on p. 12 clearly shows West Bank’s territorial
fragmentation).
The economy is effectively undergoing a process of ―de-development‖, connected with the
emerging of an autarchic economic structure, marked by the weakening of the economic
relationship both between Israel and WBG and inside of the Territories themselves. A de-developed
economy is characterized by a lack of productive capacities able to lead to structural change and
reforms: according to the economist Sara Roy11
, this phenomenon had been caused by a precise
Israeli strategy aiming at hindering the achievement of the economical and institutional changing,
necessary to originate a process of capital and investment accumulation in WBG: these policies,
defined ―integration and externalization‖ were based on the appropriation of Palestinian resources
and on the employment of cheap unskilled Palestinian labor in Israel; the long term effect of this
trend was the impossibility of building a solid industrial base and of an efficient infrastructure; in
addition to that, a process of enclavisation12
originated as result of the decrease of the economic
activities following the Al-Aqsa intifada, thus hindering the creation of a viable Palestinian
economy.
10 Since borders’ controls have been in place not only between Israel and WBG , but also inside of the Occupied
Territories, the WBG has been de facto a two layered, if not multiple layered economy, because of the presence of
multiple checkpoints within its territory. 11 Roy Sara, 2001: ―Palestinian society and economy: the continued denial of a possibility” Journal of Palestine Studies XXX n°4 p. 5-20. 12 The term enclavisation describes a process of internal withdrawal and divarication of the economy, of detachment
from international commercial relationships and the return to traditional activities and modes of production.
13
IUS
S -
Pavia
14
IUS
S -
Pavia
4.The structure of trade
“The trade regime in the Paris Protocol was designed solely to serve passing political purposes;
while the political design was obscure, the Protocol exhibited the same characteristics in the
economic arrangements. This created uncertainty of nature and an extent that would make it
impossible for any economic system to function properly”.
Nu’man Kanafani13
The Palestinian Territories are characterized by a high degree of openness to international trade.
According to the PCBS data, during the last decade imports of final goods, services, equipment and
intermediate inputs used in domestic production represented approximately 70% of GDP, while
exports of goods and services represented between 15 and 20% of GDP. Such large degree of
openness, considering that Israel constitutes the most important source of Palestinian imports and
the largest market for its exports, leaves West Bank and Gaza vulnerable to the economic policies
and strategies of the occupying government. Israeli restrictions on the movement of both labor and
goods have affected the regular flow of Palestinian exports and imports, resulting in massive
distortions in the economy, including the loss of external markets, shrinkage and fragmentation of
internal markets between major cities, increased transaction costs, risk, uncertainties, and so on. In
fact, even if in 1995 the PNA replaced the Israeli Civil Administration in ruling economic activities
in WBG, the Palestinian economy remains totally contained by Israel14
; estimates from the World
Bank Report 2006 indicate that total restricted areas represent more than the 50% of the West Bank.
The lack of territorial contiguity within the West Bank is the most evident sign of a fragmented
economy: besides the physical impediments, that are clear manifestations of the policy of closures,
the Israeli government set up a series of more complex restrictions, rooted in military orders
associated with the occupation, based on a set of administrative practices and permit policies which
limit the freedom of movement, of obtaining a job, of investing capital; they are used to bar
Palestinians from accessing large segments of the West Bank including all areas within the
13 N. Kanafani: ―Economic Aspects of the Israeli-Palestinian Conflict‖. The Economic Journal, 111. June 2001 14 The Paris Protocol on Economic Relations between the Government of Israel and the PLO Representing the Palestinian People, signed in Paris the 28/04/1994, outlines the Palestinian autonomous sphere of competences and the
rules regulating economic relationships with Israel. The main issues of the protocol deal with trade, labour market and
fiscal system.

15
IUS
S -
Pavia
municipal boundary of the settlements, the Jordan Valley, East Jerusalem, restricted roads and other
military ―closed‖ areas.
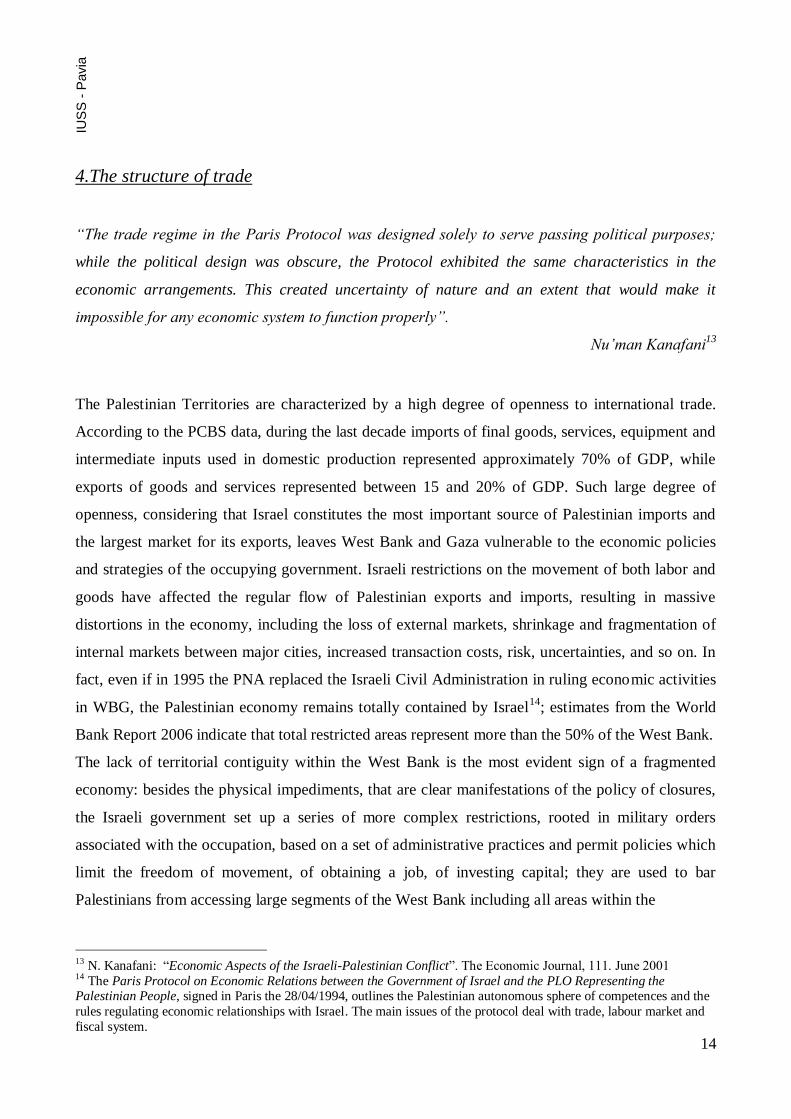
As indicated by table 3 and in figures 3 and 4, in 1999 Israel accounted for 71% of total Palestinian
imports and 97% of total exports. By comparison Jordan, the second most important trade partner,
had a meager share of 2,3%, while other markets accounted for insignificant shares: Palestinian
exports to Arab countries constituted less than 1% of total exports, showing a sharp decrease in
comparison with the 80s, when they accounted for more than 30% of the total export. On the
regional level, Europe was the most important source of non-Israeli imports, with more than 15% of
the total value of Palestinian imports in 1999. This strong level of dependence on the Israeli
economy became deeper and deeper in the following years, thus further slowing down the
capability of autonomous trade policy decision of the PA.
Tab. 3: Trade partners of the Palestinian Territory by value of trade, 1999
Region Imports Exports Total Trade
Millions of US$ % Millions of US$ % Millions of US$ %
Israel 1.853,6 70,5 360,4 96,9 2.214,1 73,8
Jordan 59,8 2,3 8,4 2,3 68,3 2,3
Total Arab countries 73,9 2,8 9,6 2,6 83,5 2,8
European countries 405,9 15,4 1,5 0,4 407,4 13,6
Asian countries 193,9 7,4 0 0 194 6,5
American countries 56, 5 2,1 0,4 0,1 56,9 1,9
Total Trade 2.629 100 372,1 100 3.001,1 100
Source: PCBS, ―Statistical Abstract of Palestine N. 2‖ November 2001
16
IUS
S -
Pavia
70.52.3
2.8
15.4
7.4
2.1
Palestian Imports1999 Israel
Jordan
Arab countries
European countries
Asian countries
American countries 96.9
2.3
2.6
0.40.4
Palestinian Exports 1999
Israel
Jordan
Arab countries
European countries
American countries
Figure 3 Figure 4
Palestinian trade and investment showed an increasing trend between the years 1994-2000, with an
annual growth rate of 5,2%, but have since then deteriorated badly as consequence of the several
economic measures and impediments imposed by the Israeli occupation authorities in response to
the al-Aqsa intifada (28/09/2000). The impact of those measures has being increasing and
accumulating over time, thus deteriorating the already unstable performance of the Palestinian
economy.
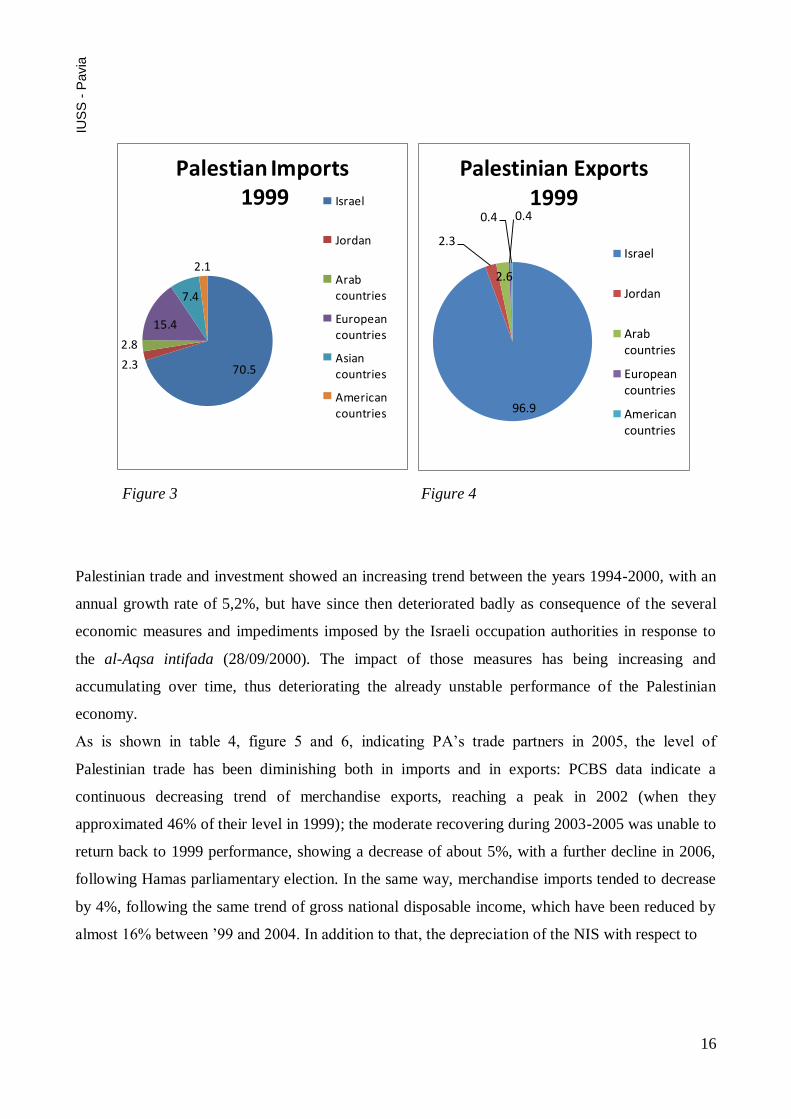
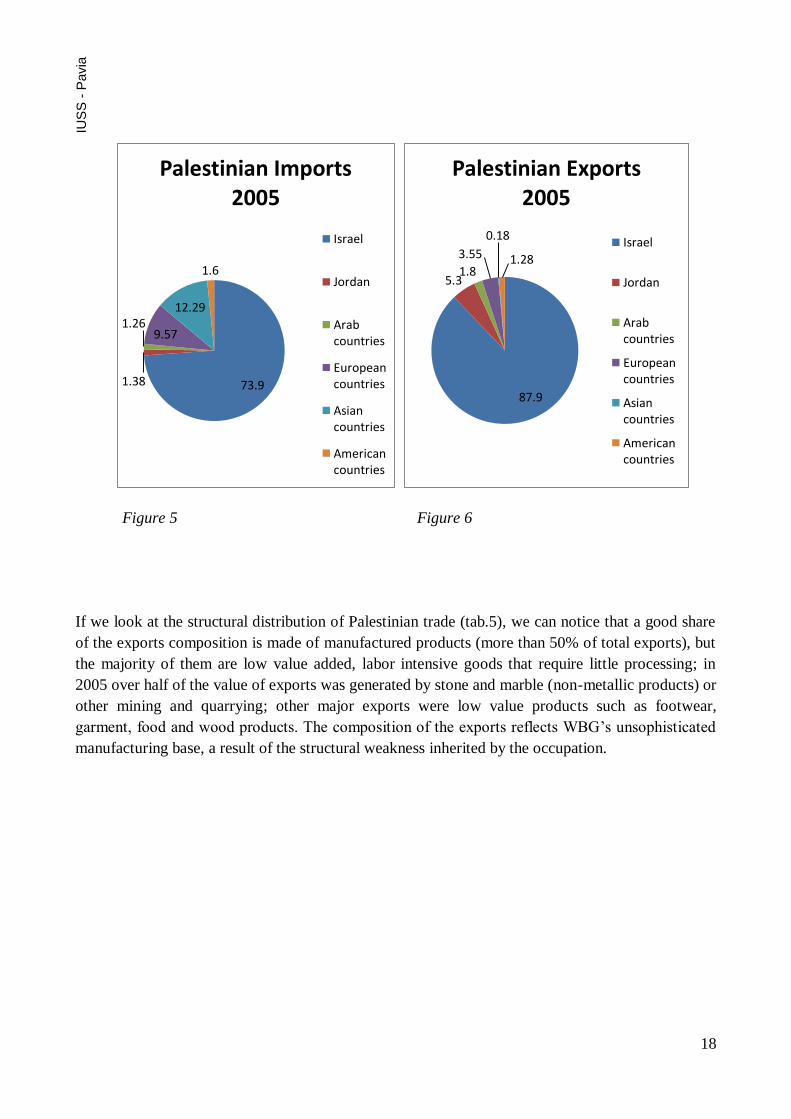
As is shown in table 4, figure 5 and 6, indicating PA’s trade partners in 2005, the level of
Palestinian trade has been diminishing both in imports and in exports: PCBS data indicate a
continuous decreasing trend of merchandise exports, reaching a peak in 2002 (when they
approximated 46% of their level in 1999); the moderate recovering during 2003-2005 was unable to
return back to 1999 performance, showing a decrease of about 5%, with a further decline in 2006,
following Hamas parliamentary election. In the same way, merchandise imports tended to decrease
by 4%, following the same trend of gross national disposable income, which have been reduced by
almost 16% between ’99 and 2004. In addition to that, the depreciation of the NIS with respect to

17
IUS
S -
Pavia
the US$ and the Euro has resulted in a cut of imports from both Europe (-37%) and the United
States (-23,8%)15
.
Furthermore, the increased dependency of Palestinian economy on Israel can be attested by two
indicators:
the proportion of Palestinian direct imports from Israel: total imports rose from 70% to
almost 74%;
the trade deficit: it has widened over time, due to the percentages of reduction in exports
which have been greater than those in imports.
Tab. 4: Trade partners of the Palestinian Territory by value of trade, 2005
Region Imports Exports Total trade
Millions of US$ % Millions of US$ % Millions of US$ %
Israel 1.872,8 73,9 290,55 87,9 2163,35 75,7
Jordan 35,12 1,38 17,46 5,3 52,58 1,83
Total Arab Countries 32,12 1,26 5,8 1,8 37,92 1,32
European Countries 242,35 9,57 11,73 3.55 254,08 8,8
Asian Countries 311,25 12,29 0,6 0,18 311,85 10,8
American countries 38,22 1,6 4,2 1,28 42,42 1,48
Total trade 2531,86 100 330.34 100 2862,2 100
Sources: PCBS ― Total Value of Exports from Remaining West Bank*16
and Gaza Strip by Country
of Destination and SITC. Total Value of Imports for Remaining West Bank* and Gaza Strip by
Country of Origin and SITC‖. 3 Divisions in 2005.
15 PCBS, Palestinian Foreign Trade Statistic, various issues, 1996-2004. 16
* Remaining west Bank refers to all West Bank excluding those parts of Jerusalem which were annexed by Israel in 1967.
18
IUS
S -
Pavia
73.91.38
1.269.57
12.29
1.6
Palestinian Imports 2005
Israel
Jordan
Arab countries
European countries
Asian countries
American countries
87.9
5.31.8
3.55
0.18
1.28
Palestinian Exports 2005
Israel
Jordan
Arab countries
European countries
Asian countries
American countries
Figure 5 Figure 6
If we look at the structural distribution of Palestinian trade (tab.5), we can notice that a good share
of the exports composition is made of manufactured products (more than 50% of total exports), but
the majority of them are low value added, labor intensive goods that require little processing; in
2005 over half of the value of exports was generated by stone and marble (non-metallic products) or
other mining and quarrying; other major exports were low value products such as footwear,
garment, food and wood products. The composition of the exports reflects WBG’s unsophisticated
manufacturing base, a result of the structural weakness inherited by the occupation.
19
IUS
S -
Pavia
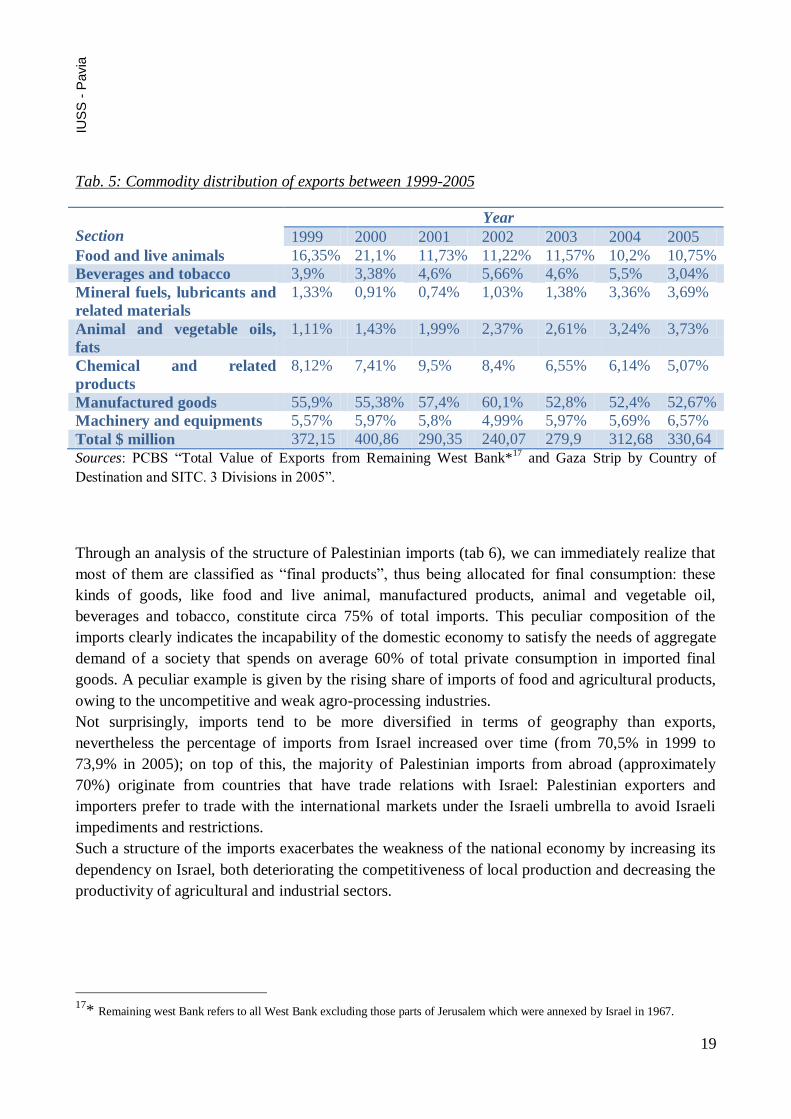
Tab. 5: Commodity distribution of exports between 1999-2005
Section
Year
1999 2000 2001 2002 2003 2004 2005
Food and live animals 16,35% 21,1% 11,73% 11,22% 11,57% 10,2% 10,75%
Beverages and tobacco 3,9% 3,38% 4,6% 5,66% 4,6% 5,5% 3,04%
Mineral fuels, lubricants and
related materials
1,33% 0,91% 0,74% 1,03% 1,38% 3,36% 3,69%
Animal and vegetable oils,
fats
1,11% 1,43% 1,99% 2,37% 2,61% 3,24% 3,73%
Chemical and related
products
8,12% 7,41% 9,5% 8,4% 6,55% 6,14% 5,07%
Manufactured goods 55,9% 55,38% 57,4% 60,1% 52,8% 52,4% 52,67%
Machinery and equipments 5,57% 5,97% 5,8% 4,99% 5,97% 5,69% 6,57%
Total $ million 372,15 400,86 290,35 240,07 279,9 312,68 330,64
Sources: PCBS ―Total Value of Exports from Remaining West Bank*17
and Gaza Strip by Country of
Destination and SITC. 3 Divisions in 2005‖.
Through an analysis of the structure of Palestinian imports (tab 6), we can immediately realize that
most of them are classified as ―final products‖, thus being allocated for final consumption: these
kinds of goods, like food and live animal, manufactured products, animal and vegetable oil,
beverages and tobacco, constitute circa 75% of total imports. This peculiar composition of the
imports clearly indicates the incapability of the domestic economy to satisfy the needs of aggregate
demand of a society that spends on average 60% of total private consumption in imported final
goods. A peculiar example is given by the rising share of imports of food and agricultural products,
owing to the uncompetitive and weak agro-processing industries.
Not surprisingly, imports tend to be more diversified in terms of geography than exports,
nevertheless the percentage of imports from Israel increased over time (from 70,5% in 1999 to
73,9% in 2005); on top of this, the majority of Palestinian imports from abroad (approximately
70%) originate from countries that have trade relations with Israel: Palestinian exporters and
importers prefer to trade with the international markets under the Israeli umbrella to avoid Israeli
impediments and restrictions.
Such a structure of the imports exacerbates the weakness of the national economy by increasing its
dependency on Israel, both deteriorating the competitiveness of local production and decreasing the
productivity of agricultural and industrial sectors.
17
* Remaining west Bank refers to all West Bank excluding those parts of Jerusalem which were annexed by Israel in 1967.
20
IUS
S -
Pavia
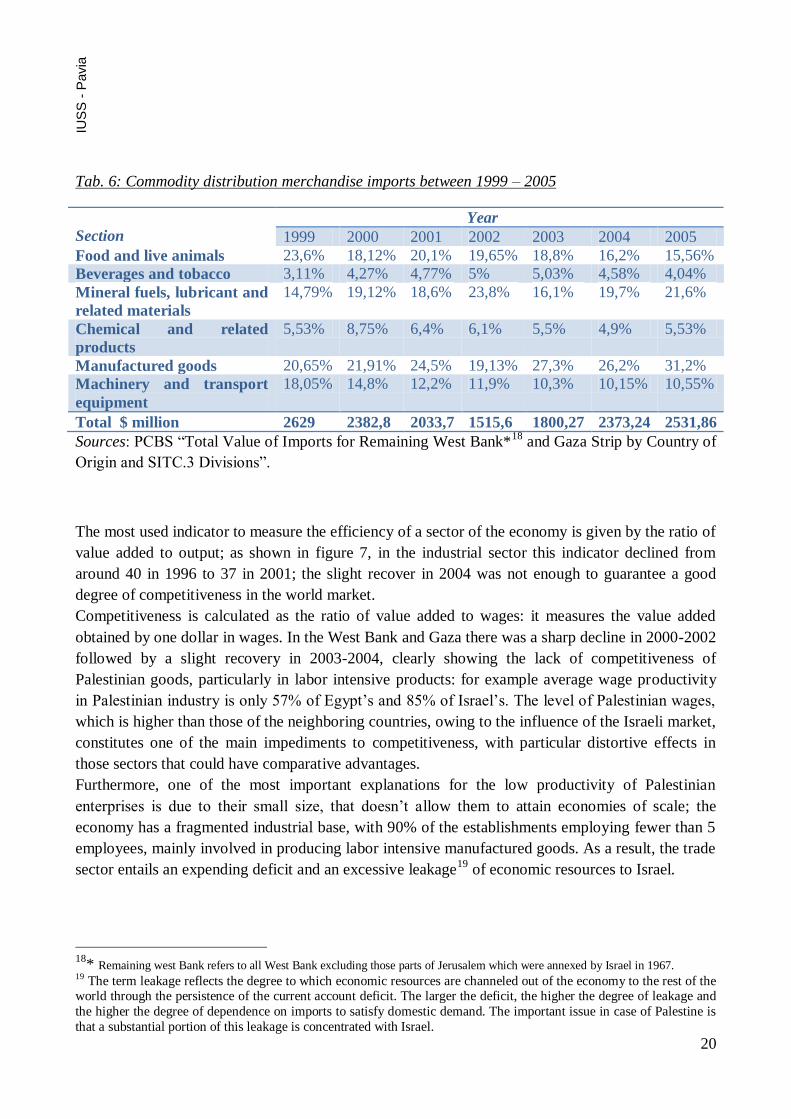
Tab. 6: Commodity distribution merchandise imports between 1999 – 2005
Section
Year
1999 2000 2001 2002 2003 2004 2005
Food and live animals 23,6% 18,12% 20,1% 19,65% 18,8% 16,2% 15,56%
Beverages and tobacco 3,11% 4,27% 4,77% 5% 5,03% 4,58% 4,04%
Mineral fuels, lubricant and
related materials
14,79% 19,12% 18,6% 23,8% 16,1% 19,7% 21,6%
Chemical and related
products
5,53% 8,75% 6,4% 6,1% 5,5% 4,9% 5,53%
Manufactured goods 20,65% 21,91% 24,5% 19,13% 27,3% 26,2% 31,2%
Machinery and transport
equipment
18,05% 14,8% 12,2% 11,9% 10,3% 10,15% 10,55%
Total $ million 2629 2382,8 2033,7 1515,6 1800,27 2373,24 2531,86
Sources: PCBS ―Total Value of Imports for Remaining West Bank*18
and Gaza Strip by Country of
Origin and SITC.3 Divisions‖.
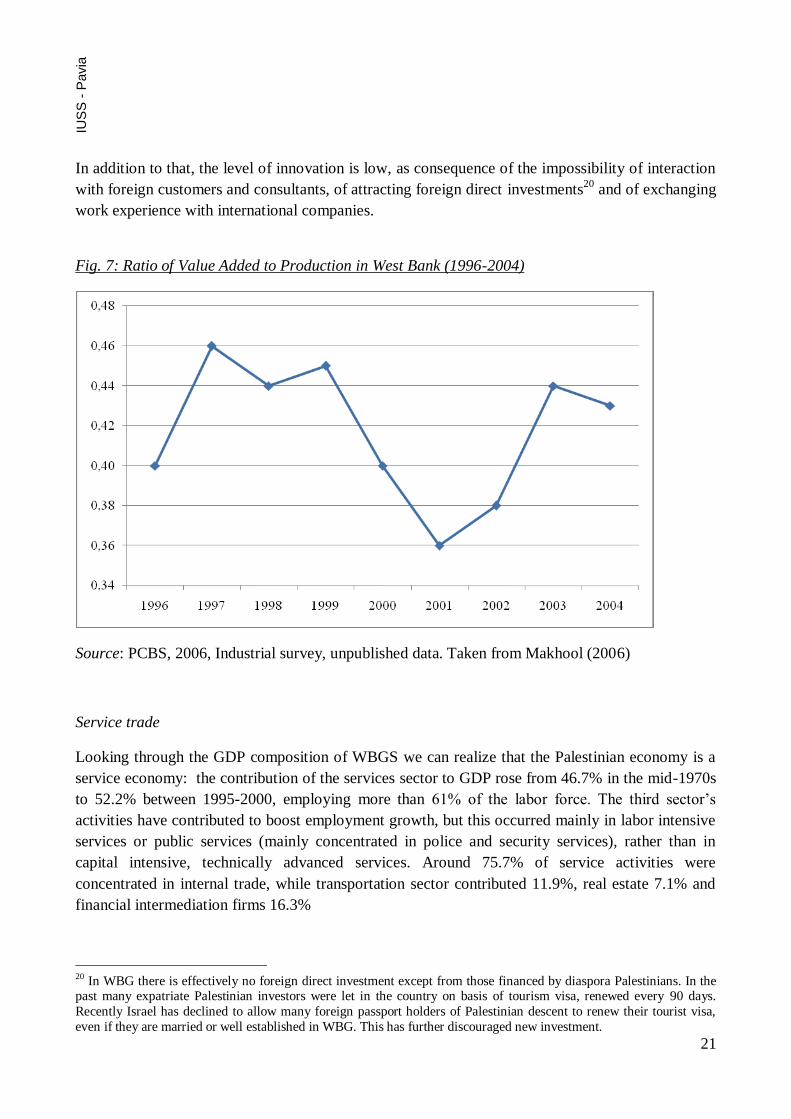
The most used indicator to measure the efficiency of a sector of the economy is given by the ratio of
value added to output; as shown in figure 7, in the industrial sector this indicator declined from
around 40 in 1996 to 37 in 2001; the slight recover in 2004 was not enough to guarantee a good
degree of competitiveness in the world market.
Competitiveness is calculated as the ratio of value added to wages: it measures the value added
obtained by one dollar in wages. In the West Bank and Gaza there was a sharp decline in 2000-2002
followed by a slight recovery in 2003-2004, clearly showing the lack of competitiveness of
Palestinian goods, particularly in labor intensive products: for example average wage productivity
in Palestinian industry is only 57% of Egypt’s and 85% of Israel’s. The level of Palestinian wages,
which is higher than those of the neighboring countries, owing to the influence of the Israeli market,
constitutes one of the main impediments to competitiveness, with particular distortive effects in
those sectors that could have comparative advantages.
Furthermore, one of the most important explanations for the low productivity of Palestinian
enterprises is due to their small size, that doesn’t allow them to attain economies of scale; the
economy has a fragmented industrial base, with 90% of the establishments employing fewer than 5
employees, mainly involved in producing labor intensive manufactured goods. As a result, the trade
sector entails an expending deficit and an excessive leakage19
of economic resources to Israel.
18
* Remaining west Bank refers to all West Bank excluding those parts of Jerusalem which were annexed by Israel in 1967. 19 The term leakage reflects the degree to which economic resources are channeled out of the economy to the rest of the world through the persistence of the current account deficit. The larger the deficit, the higher the degree of leakage and
the higher the degree of dependence on imports to satisfy domestic demand. The important issue in case of Palestine is
that a substantial portion of this leakage is concentrated with Israel.
21
IUS
S -
Pavia
In addition to that, the level of innovation is low, as consequence of the impossibility of interaction
with foreign customers and consultants, of attracting foreign direct investments20
and of exchanging
work experience with international companies.
Fig. 7: Ratio of Value Added to Production in West Bank (1996-2004)
Source: PCBS, 2006, Industrial survey, unpublished data. Taken from Makhool (2006)
Service trade
Looking through the GDP composition of WBGS we can realize that the Palestinian economy is a
service economy: the contribution of the services sector to GDP rose from 46.7% in the mid-1970s
to 52.2% between 1995-2000, employing more than 61% of the labor force. The third sector’s
activities have contributed to boost employment growth, but this occurred mainly in labor intensive
services or public services (mainly concentrated in police and security services), rather than in
capital intensive, technically advanced services. Around 75.7% of service activities were
concentrated in internal trade, while transportation sector contributed 11.9%, real estate 7.1% and
financial intermediation firms 16.3%
20 In WBG there is effectively no foreign direct investment except from those financed by diaspora Palestinians. In the past many expatriate Palestinian investors were let in the country on basis of tourism visa, renewed every 90 days.
Recently Israel has declined to allow many foreign passport holders of Palestinian descent to renew their tourist visa,
even if they are married or well established in WBG. This has further discouraged new investment.
22
IUS
S -
Pavia
The trade of the third sector in the Palestinian economy represents 30% of total trade if we include
remittances: in fact, an analysis of the structure of service exports reveals that labor plays the most
significant role within the sector, while a few other categories, such as transportation, travel and
tourism cover minor positions. On the other hand the imports cover a wide variety of services
comprising transportation, travel, insurance, education, medical services, telecommunications,
cultural materials and information technology; most of them are imported from Israel, with a small
percentage coming from Jordan (higher education, medical services).21
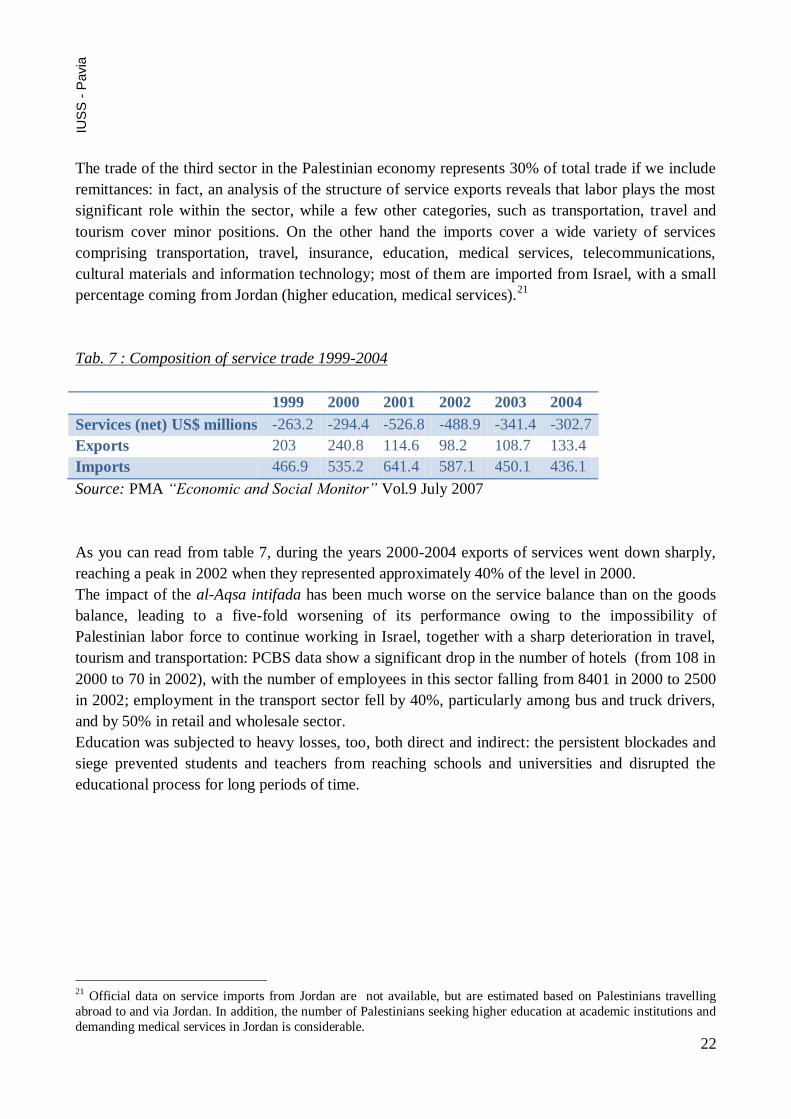
Tab. 7 : Composition of service trade 1999-2004
1999 2000 2001 2002 2003 2004
Services (net) US$ millions -263.2 -294.4 -526.8 -488.9 -341.4 -302.7
Exports 203 240.8 114.6 98.2 108.7 133.4
Imports 466.9 535.2 641.4 587.1 450.1 436.1
Source: PMA “Economic and Social Monitor” Vol.9 July 2007
As you can read from table 7, during the years 2000-2004 exports of services went down sharply,
reaching a peak in 2002 when they represented approximately 40% of the level in 2000.
The impact of the al-Aqsa intifada has been much worse on the service balance than on the goods
balance, leading to a five-fold worsening of its performance owing to the impossibility of
Palestinian labor force to continue working in Israel, together with a sharp deterioration in travel,
tourism and transportation: PCBS data show a significant drop in the number of hotels (from 108 in
2000 to 70 in 2002), with the number of employees in this sector falling from 8401 in 2000 to 2500
in 2002; employment in the transport sector fell by 40%, particularly among bus and truck drivers,
and by 50% in retail and wholesale sector.
Education was subjected to heavy losses, too, both direct and indirect: the persistent blockades and
siege prevented students and teachers from reaching schools and universities and disrupted the
educational process for long periods of time.
21 Official data on service imports from Jordan are not available, but are estimated based on Palestinians travelling
abroad to and via Jordan. In addition, the number of Palestinians seeking higher education at academic institutions and
demanding medical services in Jordan is considerable.

23
IUS
S -
Pavia
5. Trade agreements
The viability of the Palestinian economy will continue to depend on the nature of its trade relations
with the outside world: the central question that needs to be answered is what is the optimal trade
arrangement that can exist between the WBGS and Israel as well as between the WBGS and the rest
of the world, keeping in mind that Israel remains today the biggest market for Palestinian imports
and exports: in fact the application of the Paris Protocol, creating a quasi-custom union between
WBGS and Israel, prevented Palestinian products from enjoying the benefits of the agreements
signed between the PNA and other countries.
The Paris protocol
The current Palestinian trade regime is dominated by the ―Paris Protocol on Economic Relations
between the Government of Israel and the PLO Representing the Palestinian People”, established
in 1994 within the broader framework of the Oslo Agreement to govern the economic relationship
between Israel and the Occupied Territories. It establishes a quasi-custom union between the two
economies by identifying three lists of goods in order to let the two parties implement different
import-export policies, without fixing any commercial border between them. Nevertheless the
volume of merchandise that could be autonomously administered by the PA has been subjected to a
series of restrictions, as the types of importable goods have been subdivided in three different
categories:
- A1: foodstuff and agricultural products, with the exclusion of fresh fruit and vegetable can be
imported from Arab or Islamic countries in a maximum quantity of 50% of the domestic demand;
fertilizers, household machinery and construction industry machinery can be imported exclusively
from Jordan and Egypt for a maximum quantity of 30% of the domestic market.
- A2 : follows same rules of A1 but covers some imports from all over the word.
- B: capital goods for economic development, like machinery for industry and agriculture, are not
subjected to restrictions in quantity or in origin, but they have to conform to Israeli standard.
Furthermore, the Protocol establishes that the export of Palestinian goods must follow the
environmental, health and security standards in force in Israel. With the exception of some
merchandise such as vegetables, poultry, milk and eggs (subjected to quotas22
) the agreement
guarantees free movement of both agricultural and industrial products from both parts, without
applying any import tax.
The implementation of the guidelines of the Paris Protocol (PP) provoked an increase in the prices
of essential inputs of production, as well as Palestinian production that relied on imported inputs,
thus weakening the comparative advantage of the Palestinian products internally and abroad. A
further distortion caused by the quasi-custom union manifested itself when Israel liberalized its
trade in particular areas as part of fulfilling its promises to the World Trade Organization without
coordination with the Palestinian side.
22 Quotas are intended to protect Israeli goods from Palestinian competition. This measure is based on a unilateral
asymmetric decision, which doesn’t foresee the same treatment for Palestinian agricultural products.
24
IUS
S -
Pavia
Considering the status quo and the de facto trade regime, the PP appears outdated and inapplicable,
principally because of the absence of the main principle on which it was built: the freedom of
movements of people and goods between the OPT and Israel. The various policies implemented on
local basis that have rendered the PP inoperable can be so summarized:
the creation of additional barriers between the two markets, due to the expansion of the
settlements and to the roads leading to them, dividing the West Bank in cantons or
bantustan23
.
the restriction of entering the Jordan Valley for most Palestinian, dramatically limiting the
possibility of investing and of benefiting from this important agricultural region.
the ongoing economic boycott of the Gaza Strip, implemented through the de facto closure
of Karni/al Montar and Rafah Border Crossings, completely isolating it from any relation
with the outside world.
the unilateral creation of de facto non-agreed economic borders through the continued
separation of East Jerusalem from the West Bank, the complex system of areas and subareas
created by the separation wall and the checkpoints, exasperating the fragmentation of the
West Bank, depriving it from substantial sources of trade and commerce.
Trade and transport agreements between Egypt, Jordan and the PA
In addition to the Paris Protocol the PA has currently other bilateral agreements with Jordan and
Egypt; following the access on the Arab Free Trade Area (AFTA) in 2002, Palestine is also putting
efforts in fostering regional trade integration24
.
Palestinian trade with Jordan is regulated by two agreements:
o Preferential trade agreement, signed in 1995: it establishes a framework for cooperation in
the areas of trade, investment and transportation, providing for the elimination of non-tariff
trade barriers, optimizing transport and trade procedures25
.
o Transport agreement, signed in 2000: it exempts Palestinian and Jordanian trucks from
administrative fees. The two sides also signed a custom cooperation agreement in 2001
which fosters the exchange of administrative and technical expertise and the harmonization
of custom procedures.
The preferential trade agreement with Egypt, signed in 1998, establishes a coordination of national
custom procedures, including the exchange of customs information and technical expertise, in
addition to facilitating transit operation.
23 In the WBGS case the term bantustan indicates a limited area, from which Palestinians can go out only through a
permit granted by the Israeli authorities. 24 The League of Arab States decided to apply a special and differential treatment to Palestine, exempting its exports from custom tariffs and taxes with similar effect. However, those efforts were rendered invalid by existing non-tariff
barriers , poor transportation and trade infrastructure services. 25 The Protocol calls for mutual recognition of National standards for vehicles transporting goods in transit
25
IUS
S -
Pavia
The potential beneficial effects of these agreements, aimed at lowering the level of dependence of
the Palestinian trade from Israel, were nevertheless not set in motion for several reasons, the most
important of which can be identified by Israeli security measures at Palestinian borders; first of all,
all the exports and imports exit and entering the OPT need first to pass through the inspections of
Israeli crossing points. In the case of Gaza and West Bank exports travelling to or through Jordan,
after inspection at Israeli crossing points26
, they are escorted in convoys of 5-15 trucks by Israeli
security patrols up to the commercial crossing with Jordan. Trucks are then subjected to ―back to
back‖ procedures27
(see table below) for further inspection and then reloaded onto Jordanian trucks
before reaching their final destination.
The imports coming from Egypt or Jordan follow the same ―back to back‖ procedure and are
subjected to strict quota: the number of trucks crossing Allenby is limited to 50 a day, while those
from Egypt is limited to 25.
Other agreements have been signed by the PNA, but most of them don’t find a real application
unless the Israeli government has stipulated analogous accords: it is in fact impossible to import or
export to countries that don’t have a trade agreement with the occupier.
Trade with Saudi Arabia
Palestinian traders can export all types of products to Saudi Arabia, and in the mean time, the
government of Saudi Arabia grants duty free treatment to the following Palestinian products:
26 There are different border crossing points and re-export points between the Palestinian Territory and its neighboring
states: Rafah Border Crossing between Gaza and Egypt; Karni/Almontar Border Crossing connecting Gaza with the
West Bank and Israel; King Husseyn Bridge and Damya Bridge, between West Bank and Jordan‖; most of exports and imports flow through Eretz crossing, between Gaza and Israel. 27 During the back to back procedures goods are unloaded from Palestinian trucks, placed on the ground for inspection
and reloaded in Jordanian trucks.
“Back to Back” vs “Door to Door” A ―back-to-back‖ cargo movement is generally understood as the transfer of loose goods from
one truck to another, positioning two trucks with their backs to one another. Primitive variants
involve labor-intensive handling and placement of cargo on the ground during the transfer, thus
originating serious time delays and damages to cargo. Even if a modern ―back-to-back‖ system
which is less damaging than primitive one has been developed, thanks to the adoption of a
coordinated transfer across a level platform using mechanized equipment, it is not currently
used.
The concept of ―door to door‖, as envisioned by the Palestinian Authority, refers to the
movement of a cargo, intact and in a single vehicle, from the cargo’s point of origin to its
destination. Under this definition, door to door describes the movement of the vehicle and its
cargo, not simply the cargo—and is akin to what is seen in international agreements as a right of
transit.
26
IUS
S -
Pavia
agricultural products, livestock, metallic and non-metallic raw materials. At the same time imports
from Saudi Arabia is limited to items listed in A1 and A2.
In order to benefit from the preferential arrangement an official certificate of origin is required,
stamped accordingly by the Saudi Embassy in Jordan or Egypt , together with the official invoice.
The name of the producer, country of citizenship and the rule of origin should be clearly indicated
on the product.
Declaration of Free Trade between WBGS and the USA
Under the Palestinian-US Free Trade Agreement, duty free treatment is granted to all Palestinian
products entering the US and vice versa. In order to benefit from the duty free treatment, a
certificate of origin must accompany the goods.
Free Trade Arrangement between the Palestine Liberation Organization and Canada
According to the arrangement signed between the parties, tariffs were eliminated on industrial
products. For agricultural products and processed food, tariffs were reduced or eliminated in
accordance with quotas.
Interim Association Agreement on Trade and Cooperation between the European Union and the
Palestine Liberation Organization.
The interim association agreement on Trade and Cooperation grants reciprocal duty free treatment
on industrial products complying with the rule of origin. Concerning agricultural items, the
European Union grants duty free or reduced tariff treatment on the products exported to the EU
within quotas. The same applies on agricultural imports from the EU to the WBGS.
Interim Agreement between the EFTA States and the Palestine Liberation Organization
The following EFTA countries signed an interim agreement with the PLO: Iceland, Liechtenstein,
Norway and Switzerland. The Agreement provides duty free treatment to most Palestinian and
EFTA industrial products. Moreover, duty free is granted to some Palestinian and EFTA processed
agricultural products, while the majority of processed agricultural products are granted at a reduced
tariff. A duty free treatment is also granted to fish and other marine products. The PLO has signed
separate protocols with the four EFTA countries to identify the agricultural duty free products, as
EFTA countries do not share a common agricultural policy.
Agreement on Commercial Cooperation between the Palestine Liberation Organization and Russia
Both parties extend to one another the status of the Most Favored Nation in regard to trade.
Imports and exports between the two parties are duty free for the following goods:
Instruments and items specified for montage and repair.
Equipment and instruments specified for undertaking experiments and scientific research.
Articles for demonstration during fairs and exhibitions.
Containers and similar packages utilized in international trade on a return basis.
27
IUS
S -
Pavia
6. Indirect taxes28
―The imports and exports of Palestinians through the points of exit and entry in Israel will be given
equal trade and economic treatment”
Art. III (13) Paris Protocol
The territories of the West Bank and Gaza Strip live under the same custom envelop of Israel: for
this reason it’s impossible to speak about Palestinian trade policy, as it remains totally bound the
occupier’s trade strategy: Israeli tax rates, both direct and indirect, constitute the governing
guidelines, as are Israeli standards and import regulations.
According to the Paris Protocol, the PA should impose the same indirect taxes of Israel, including
the VAT, purchase taxes and custom duties on both domestic and imported goods. Furthermore,
under the Revenue Clearance System set in place through the Protocol, the Israeli government is
required to transfer to the PA all import duties on products destined to the Palestinian Territories: in
fact, only Israeli firms are licensed as clearing agents at the commercial borders with Jordan, Egypt
and Israel29
. Even if the accord establishes that the PA is responsible for the implementation of
clearance procedures at the main crossing points with Jordan and Egypt (though the situation
changed after the second intifada)30
, the largest portion of PA’s revenues is from imports coming
through Israel (80% of the goods are imported through the port of Ashod). These revenues are
collected by the Israeli authorities and then transferred to the PA on the basis of the import
document, which testifies the final destination of the products. Owing to the impossibility of setting
Palestinian clearing agencies to work on the borders, the Israeli government deducts from the
revenues a 3% administrative cost, to remunerate their work on behalf of the PA.
As outlined in the previous chapter, the PA is given the possibility of setting its own custom rates
only for the goods nominated in the lists A1 and A2, where, within defined quota, the approval of
the Israeli authorities is not required (according to this regulation, at present no customs are applied
to a series of imports, like cattle, dried yogurt and wheat). Another exception established by the
agreement concerns the purchase tax on cars, whereby the Israeli apply a 95% rate, while the
Palestinian 75%.
28 Most of the information provided by this chapter have been written thanks to the collaboration of Hatem Yousef,
Director General of Custom and Excise in the West Bank and Reuven Melzer, Senior Chief Coordinator of the
department of Customs and VAT in Israel. 29
The custom clearance procedure applied in the Occupied Territories is derived from the Israeli custom law, as the PA
doesn’t have a custom law of its own: it’s a combination of Israel regulations and bylaws, code no. 11 issued in 1929
and its amendments which apply in the Gaza Strip, the Jordanian Customs and Excise Act no.1 issued in 1962 and its
amendments that applied in the West Bank. 30 Article 14 of the Paris Protocol reads as follows: ― In the entry points of the Jordan river and the Gaza Strip (….) the
Palestinian Authority will have full responsibility and powers in the Palestinian custom point (freight area) for the
implementation of the agreed upon customs and importation policy as specified in this protocol, including the
inspection and the collection of taxes and other charges, when due. (…) The Palestinian custom official will be responsible for the handling of the customs procedures including the inspection and the collection of due taxes.‖ Since
September 2000 all entry points into the Palestinian Territories have been exclusively controlled by Israeli authorities,
making the above quoted provisions dead letter.
28
IUS
S -
Pavia
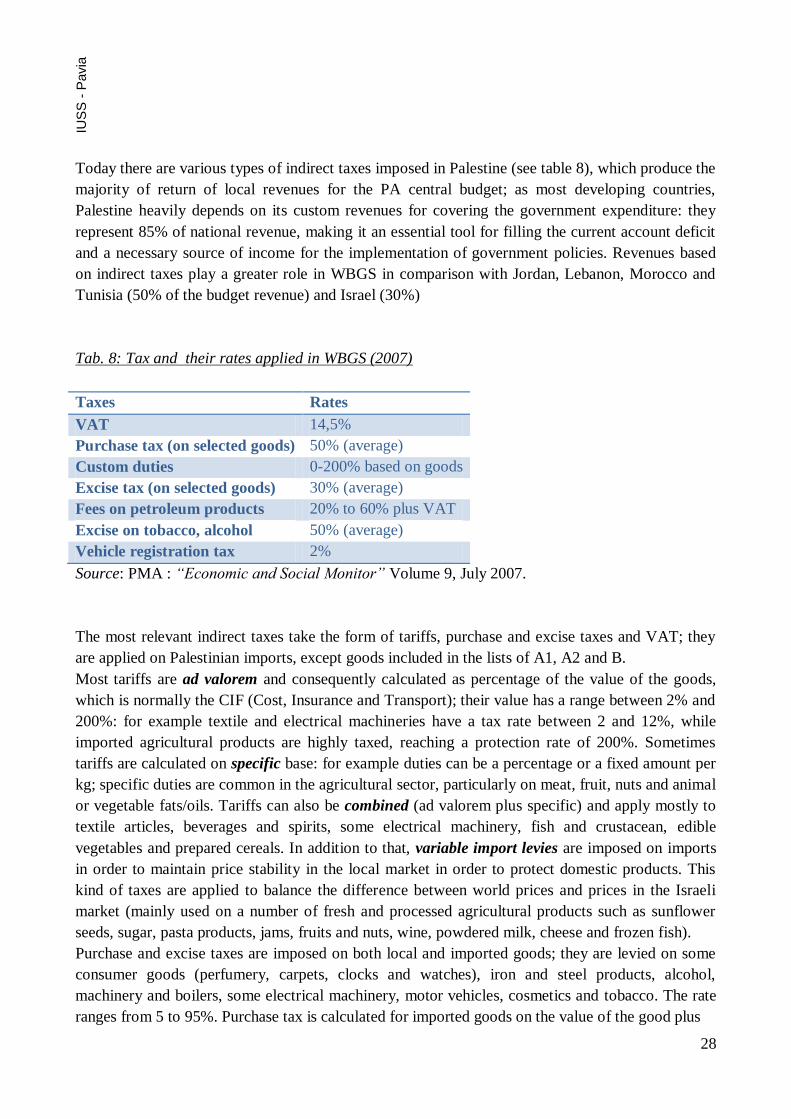
Today there are various types of indirect taxes imposed in Palestine (see table 8), which produce the
majority of return of local revenues for the PA central budget; as most developing countries,
Palestine heavily depends on its custom revenues for covering the government expenditure: they
represent 85% of national revenue, making it an essential tool for filling the current account deficit
and a necessary source of income for the implementation of government policies. Revenues based
on indirect taxes play a greater role in WBGS in comparison with Jordan, Lebanon, Morocco and
Tunisia (50% of the budget revenue) and Israel (30%)
Tab. 8: Tax and their rates applied in WBGS (2007)
Taxes Rates
VAT 14,5%
Purchase tax (on selected goods) 50% (average)
Custom duties 0-200% based on goods
Excise tax (on selected goods) 30% (average)
Fees on petroleum products 20% to 60% plus VAT
Excise on tobacco, alcohol 50% (average)
Vehicle registration tax 2%
Source: PMA : “Economic and Social Monitor” Volume 9, July 2007.
The most relevant indirect taxes take the form of tariffs, purchase and excise taxes and VAT; they
are applied on Palestinian imports, except goods included in the lists of A1, A2 and B.
Most tariffs are ad valorem and consequently calculated as percentage of the value of the goods,
which is normally the CIF (Cost, Insurance and Transport); their value has a range between 2% and
200%: for example textile and electrical machineries have a tax rate between 2 and 12%, while
imported agricultural products are highly taxed, reaching a protection rate of 200%. Sometimes
tariffs are calculated on specific base: for example duties can be a percentage or a fixed amount per
kg; specific duties are common in the agricultural sector, particularly on meat, fruit, nuts and animal
or vegetable fats/oils. Tariffs can also be combined (ad valorem plus specific) and apply mostly to
textile articles, beverages and spirits, some electrical machinery, fish and crustacean, edible
vegetables and prepared cereals. In addition to that, variable import levies are imposed on imports
in order to maintain price stability in the local market in order to protect domestic products. This
kind of taxes are applied to balance the difference between world prices and prices in the Israeli
market (mainly used on a number of fresh and processed agricultural products such as sunflower
seeds, sugar, pasta products, jams, fruits and nuts, wine, powdered milk, cheese and frozen fish).
Purchase and excise taxes are imposed on both local and imported goods; they are levied on some
consumer goods (perfumery, carpets, clocks and watches), iron and steel products, alcohol,
machinery and boilers, some electrical machinery, motor vehicles, cosmetics and tobacco. The rate
ranges from 5 to 95%. Purchase tax is calculated for imported goods on the value of the good plus
29
IUS
S -
Pavia
the amount of custom duty, applying the Tama System, which is called ―import increment rate‖:
Tama is the Hebrew acronym for import rate uplift and is a mark-up applied before calculating the
purchase tax31
.
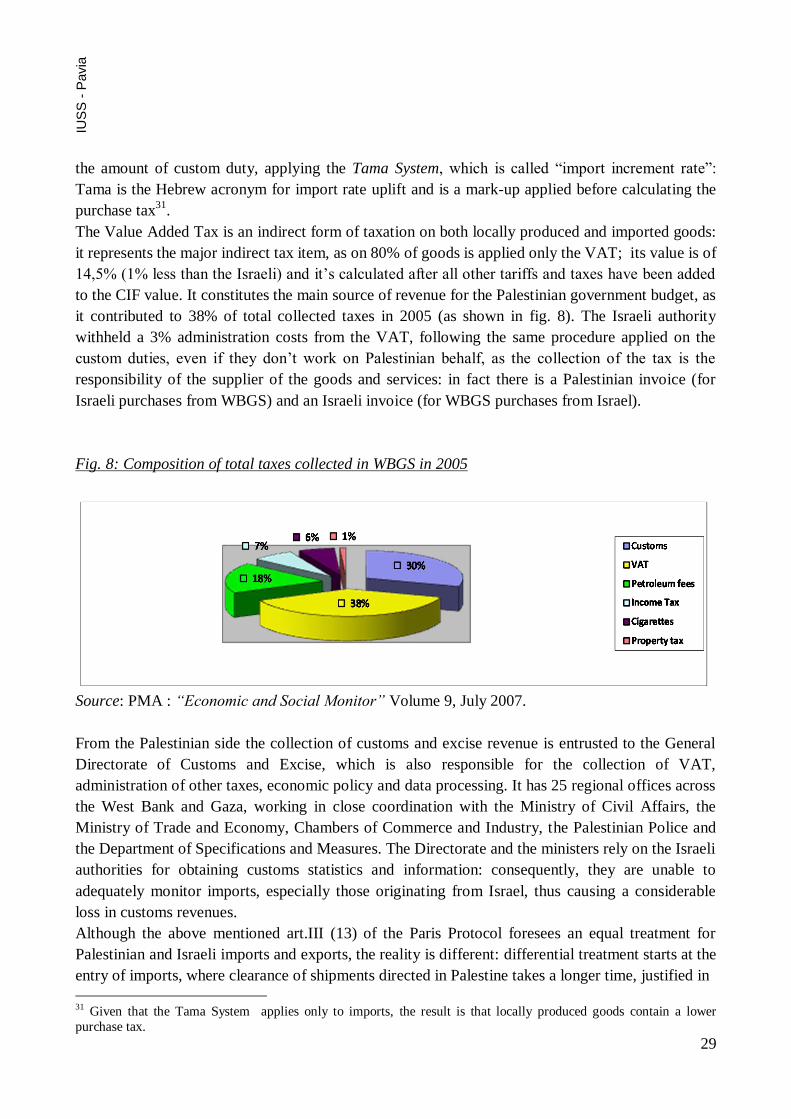
The Value Added Tax is an indirect form of taxation on both locally produced and imported goods:
it represents the major indirect tax item, as on 80% of goods is applied only the VAT; its value is of
14,5% (1% less than the Israeli) and it’s calculated after all other tariffs and taxes have been added
to the CIF value. It constitutes the main source of revenue for the Palestinian government budget, as
it contributed to 38% of total collected taxes in 2005 (as shown in fig. 8). The Israeli authority
withheld a 3% administration costs from the VAT, following the same procedure applied on the
custom duties, even if they don’t work on Palestinian behalf, as the collection of the tax is the
responsibility of the supplier of the goods and services: in fact there is a Palestinian invoice (for
Israeli purchases from WBGS) and an Israeli invoice (for WBGS purchases from Israel).
Fig. 8: Composition of total taxes collected in WBGS in 2005
Source: PMA : “Economic and Social Monitor” Volume 9, July 2007.
From the Palestinian side the collection of customs and excise revenue is entrusted to the General
Directorate of Customs and Excise, which is also responsible for the collection of VAT,
administration of other taxes, economic policy and data processing. It has 25 regional offices across
the West Bank and Gaza, working in close coordination with the Ministry of Civil Affairs, the
Ministry of Trade and Economy, Chambers of Commerce and Industry, the Palestinian Police and
the Department of Specifications and Measures. The Directorate and the ministers rely on the Israeli
authorities for obtaining customs statistics and information: consequently, they are unable to
adequately monitor imports, especially those originating from Israel, thus causing a considerable
loss in customs revenues.
Although the above mentioned art.III (13) of the Paris Protocol foresees an equal treatment for
Palestinian and Israeli imports and exports, the reality is different: differential treatment starts at the
entry of imports, where clearance of shipments directed in Palestine takes a longer time, justified in
31 Given that the Tama System applies only to imports, the result is that locally produced goods contain a lower
purchase tax.
30
IUS
S -
Pavia
terms of security. A study of the World Bank32
certifies that Israeli imports face a risk of security
check of 15-20% (80-90% of Israeli imports are checked only through a computerized system),
whereas WBG importers face the certainty of security checks. Another study by the Confederation
of Palestinian Chamber of Commerce, Palestinian companies exporting through Haifa faced higher
costs (18%) and longer delays (20%) than comparable Israeli companies. As a result, in order to
avoid paying extra costs, because of border security measures, many companies directly purchase
goods imported into Israel by Israeli firms (following a subcontracting mechanism).
On top of this, importers and exporters from the West Bank are compelled to use Israeli transport
companies when goods are destined for WBGS or leaving WBGS through Israel. ―Back to back‖
system (see box pag.20) provokes additional transition costs, not only because of extra unloading
and loading operations but also because of extra time and possible losses in quality as a result of
rough handling.
According to the current structure of the taxing system three main issues can be raised, which
outline the necessity of modifying the current custom union agreement:
The absence of a Palestinian custom clearing authority gives the Israeli government the
possibility of exerting political pressure before handing over the collected funds to the PA
treasury: this situation took place in 2001-2002 and in 2006, where the occupier withheld
the tax revenues, motivating the decision with political reason. Considering that in WBGS
tax productivity is very high (three times higher than the average among Arab states) and
that tax revenue normally constitute about 20% of the total Palestinian GDP (compared to
8% of other Arab states), the Israeli decision of withholding tax revenues provoked a serious
unbalance in the government budget. At the moment most of those withheld funds have
been given back to the PA, even if some of the amount has been deducted to refund the
Israeli victims of the conflict33
.
Owing to the so called quasi-custom union system, the PA is experiencing relevant losses in
VAT revenues for the goods imported to Israel and then re-exported to Palestine, as the
VAT collected remains within the Israeli state; this practice is implemented owing to a
distortion of the original accord, which states that taxes should be collected according to
final destination of the goods; the Israeli authorities substituted the word destination with
the term declaration, thus withholding large amounts of money. According to World Bank
estimates, the lost revenues reach a sum of 174 million dollars per year.
The PA has lost custom duties, excise taxes and VAT on purchases which are not
documented by invoices. The fiscal leakage is estimated to be between 3 and 4.2% of GDP.
On this basis it is necessary to reconsider the structure of the Paris Protocol and to identify
alternative trade regimes which could generate better Palestinian economic outcomes than the
32 World Bank, 2006: ―West Bank and Gaza Country Economic Memorandum. Growth in the West Bank and Gaza:
Opportunities and Constraints”. Vol. 1 33 No parallel treatment has been offered to Palestinian victims.

31
IUS
S -
Pavia
existing custom union. The recent academicals debate concerning a revision of the current
agreement between Israel and the PNA sets on the ground different options:
a) an upgrading of the existing Paris Protocol, eliminating the above mentioned distortions;
b) a custom union within two independent states, effectively providing for free exchange of
goods between two independent states;
c) an agreement with the Most Favored Nation principle, which would give the WBGS the
same opportunity to reform its trade relation with both Israel and third parties under a
uniform approach;
d) a Free Trade Agreement, which would unable the OPT to amend their trade policy only
vis-à-vis third parties; it would require checking the origin of goods flowing between
WBGS and Israel to determine whether they are produced within the FTA (and as such
eligible if tax exemptions) or whether they are re-exports originating from third parties.
e) An Asymmetric Free Trade Area, which recognizes the existence of initial different
conditions and of asymmetrical relationships between countries: these factors are taken
into account and modify a pure form of FTA, fixing some commercial clauses. In the
Israeli-Palestinian case it could imply: fixing temporary favorable prices for WBGS,
independently from the FTA, stipulating independent trade agreements with third
partners and the implementation of protection mechanisms for infant industries.

32
IUS
S -
Pavia
7. Export of labor
The level of dependence of the Palestinian trade from the Israeli market grows much higher if we
take into account the role of remittances: since 1967 exports of labor from West Bank and Gaza
have been more important than exports of goods, as you can read from fig. 9, contributing to
finance a large trade deficit.
Fig. 9 Exports of Palestinian goods and services to Israel
The combination of large exports of labor, together with the limited investment in the industrial
sector and the absence of technology transfer, has undermined the competitiveness of WBGS
industrial sector (a phenomenon identified in economics with the term of Dutch disease) and limited
the potential for growth in the domestic labor productivity: in fact the possibility of a daily
commute to work in Israel increased the wage bill beyond the productivity growth. Even during the
phases of growth, the increase of Palestinian GDP was not export led, but rather driven by a rise in
consumption thanks to higher incomes deriving from remittances. The increase in number of jobs
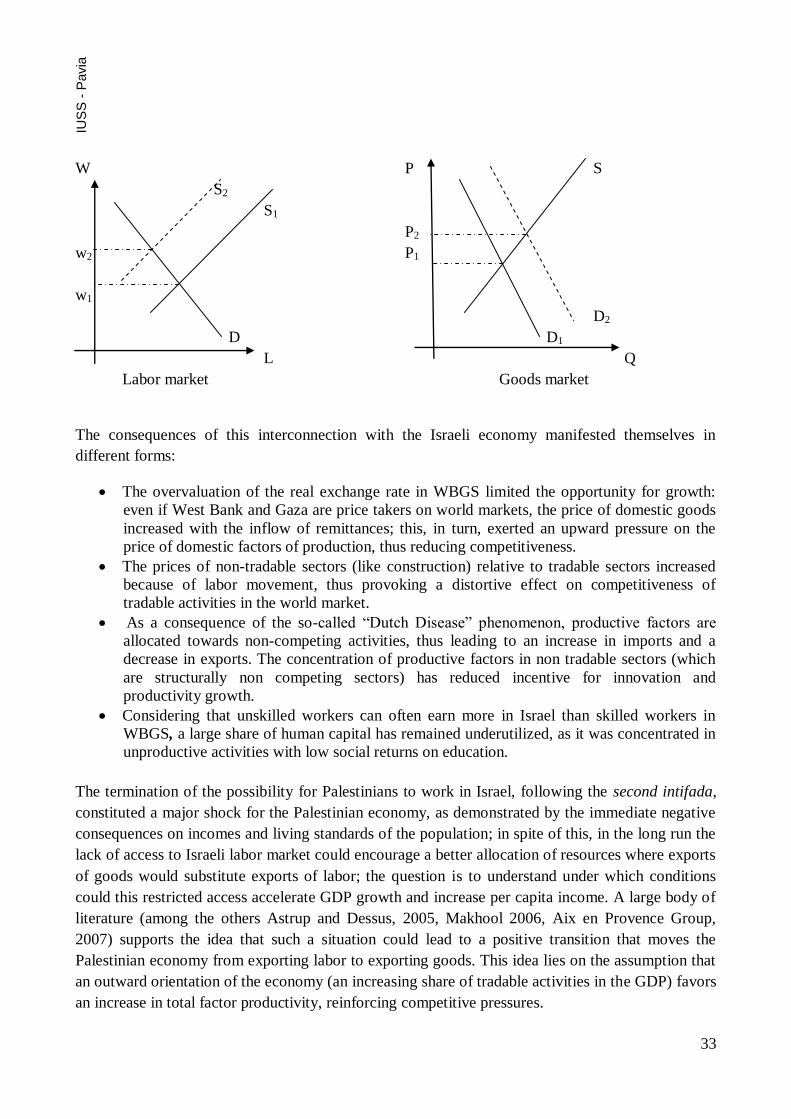
available for the Palestinian workers in Israel led to a larger decrease in the labor supply of the
Palestinian labor market (the supply curve shifts to the right) thus enhancing the wage bill and to a
greater demand for domestic products (the demand curve moves to the left), thus increasing
domestic prices, as shown in the graph below.
33
IUS
S -
Pavia
W P S
S2
S1
P2
w2 P1
w1
D2
D D1
L Q
Labor market Goods market
The consequences of this interconnection with the Israeli economy manifested themselves in
different forms:
The overvaluation of the real exchange rate in WBGS limited the opportunity for growth:
even if West Bank and Gaza are price takers on world markets, the price of domestic goods
increased with the inflow of remittances; this, in turn, exerted an upward pressure on the
price of domestic factors of production, thus reducing competitiveness.
The prices of non-tradable sectors (like construction) relative to tradable sectors increased
because of labor movement, thus provoking a distortive effect on competitiveness of
tradable activities in the world market.
As a consequence of the so-called ―Dutch Disease‖ phenomenon, productive factors are
allocated towards non-competing activities, thus leading to an increase in imports and a
decrease in exports. The concentration of productive factors in non tradable sectors (which
are structurally non competing sectors) has reduced incentive for innovation and
productivity growth.
Considering that unskilled workers can often earn more in Israel than skilled workers in
WBGS, a large share of human capital has remained underutilized, as it was concentrated in
unproductive activities with low social returns on education.
The termination of the possibility for Palestinians to work in Israel, following the second intifada,
constituted a major shock for the Palestinian economy, as demonstrated by the immediate negative
consequences on incomes and living standards of the population; in spite of this, in the long run the
lack of access to Israeli labor market could encourage a better allocation of resources where exports
of goods would substitute exports of labor; the question is to understand under which conditions
could this restricted access accelerate GDP growth and increase per capita income. A large body of
literature (among the others Astrup and Dessus, 2005, Makhool 2006, Aix en Provence Group,
2007) supports the idea that such a situation could lead to a positive transition that moves the
Palestinian economy from exporting labor to exporting goods. This idea lies on the assumption that
an outward orientation of the economy (an increasing share of tradable activities in the GDP) favors
an increase in total factor productivity, reinforcing competitive pressures.

34
IUS
S -
Pavia
8. The rise of the informal sector
As depicted from the previous chapters, the fluctuations in the political and economical
environment, particularly in the absence of political and economical stability, which have
continuously characterized the Palestinian context since the compulsory expulsion in 1948, led to
the creation to an extremely fragile and unstable economy. The natural response to this precarious
economic structure was the rise of the informal sector, whose main characteristic is the high level of
flexibility and the ability to adjust rapidly to changes. This sector expanded itself overtime,
providing a principle income for the families and acting as an important device for poverty
alleviation. In contrast with the widespread mistrust for governmental institutions, informal
enterprises are approved socially, as they provide financial profit for many poor families and are
considered preferable to the very basic assistance offered by the Minister of Social Affairs. It
became apparent that most operators in domestic commerce and service activities in the informal
sector set up their projects during the second intifada, but many informal enterprises’ projects
started before the creation of the PNA, thus outlining the continuous structural role of informality
form the early phases of the Palestinian economy.
A study from the Palestinian Economic Policy Research Institute (MAS)34
shows that the major role
covered by the informal enterprises was to provide work opportunities for family members new to
the labor market, for those who lost their jobs in the Israeli market, or for returnees. Other
enterprises were started in response to a change in health of a family member or the ageing of the
head of the household by establishing a home-base shop. Another research by MAS35
shows that
the biggest percentage of operators in the informal economy are involved in service activities
(32.4%), followed by the construction sector (29.7%), commercial activities (28%) and industrial
and handicraft activities (9.9%)
The most efficient competitive mechanism used in marketing the products and services of the
informal enterprises is achieved through the cut of production costs: the high level of flexibility,
being a major feature of this sector, is actually put in motion by the poor working conditions of the
workers, who work for long hours, without time off, without respect of any norm for the workers’
protection. The economic efficiency of the sector is testified by its total value added, which, in
2003, amounted to nearly US$ 115 million (approximately 67% of the total production), thus
showing a better performance if compared with the formal sector (look at fig. 7 page 13). The main
reason of this phenomenon can be explained by the fact that the average wage in this sector was
around US$ 800 annually per worker, much lower than the national average, (4040 US$ per capita
per year).
In Palestine informal sector enterprises are family based: the family as such provides the supply of
an inexpensive workforce, in addition to the use of family members as backup when needed,
especially women, children and elderly: the availability of flexible workforce constitutes a vital tool
34 Majdi Malki: “The Informal sector Enterprises in the West Bank and Gaza Strip: Case Studies”. MAS, December
2000. 35 MAS: ―Social and economic characteristics of the informal sector in the West Bank and Gaza Strip‖, 2004.
35
IUS
S -
Pavia
for the success of the informal enterprises as it gives them the ability to respond to changes in
demand for their products and services at low production costs. Moreover, these enterprises have a
low degree of risk, as they cover an existing demand: having good information of the market needs,
they direct their products to specific geographic areas in the district where they are located, in
neighboring villages or refugee camps.
Another crucial feature that renders this sector so effective is the low capital required to start the
activities: the average size of the capital of a single enterprise was US$ 7221, with transport,
communication and storage enterprises requiring the higher amount of capital (around five times the
average). The capital is usually supplied from personal savings, family grants, friends and relative
support or official institutional non-profit loans, in particular NGO loan programs. Nevertheless the
majority of informal activities are not financed officially and regularly: the percentage of informal
activities that were established by loans from banks or non-profit organizations was just 2.9% in
2004, thus revealing the weak influence of official financing institutions.
Further advantages are represented by the conformation to social norm and traditions: in fact
informal enterprises allow women to combine household duties with work, in tune with the
prevailing social environment. Despite the negative features entailed in this sector, it has expanded
overtime, especially after the economic shock provoked by the second intifada and the restricted
access for Palestinian workforce to the Israeli labor market: the informal enterprises started to play
an increasingly crucial role for in the socio-economic environment, acting as ―safety valve‖,
absorbing the shocks of national economy. In addition to that, they are considered a necessary
supplement of the formal sector, thanks to their ability of fulfilling roles in production and services
that the formal sector cannot, like construction-related professions, services or products directed to
the cultural needs of the middle class such as handmade art crafts, traditional food production, and
occupation that require intensive labor and routine work such as embroidery, sewing, wood carving
and so on.
The central problem of the informal sector is embodied by its nature itself: in spite of its role of
social safety net, it is unable to contribute to economic development: informal enterprises don’t
originate capital for investments, since the owners usually spend their profits on private
consumption; moreover competition with other similar enterprises is destructive, as it drives to
reduction on product prices and increases workers exploitation, without providing any form of
occupational safety requirement.
36
IUS
S -
Pavia
9. Export promotion
On the basis of the analysis carried out in the previous chapters it’s clear that the Palestinian
economy doesn’t have any possibility of developing, as long as its structure continues to be built
upon the current peace agreement. As we have seen, the Oslo accord, and specifically the Paris
Protocol (PP), instead of bringing stability and reconciliation between the two parties, it deepened
the relation of dependence of WBGS toward the Jewish state, leaving Palestinian economy without
a functional and clear trade regime: in fact, though the Paris Protocol was part of the provisional
interim agreement and was intended to lead to PNA’s control over its internal markets and borders,
these changes never happened.
On the contrary, the quasi-custom union established by the PP, together with the complete border
control by Israel, constitute the main obstacle preventing Palestine from gaining from trade, as they
embody the main reason for the artificial rise of transaction costs: the OPT’s scenario stands in
contrast with the global trend, which is characterized by a continuous reduction in tariff and non-
tariff barriers within the context of multilateral trade arrangements, as well as by the rapid advances
in information and telecommunication technology, which have increased worldwide the importance
of trade as engine for growth.
Palestine is suffering from an asymmetric integration in the world economy, as the aggregate
demand has the possibility of accessing to the foreign market (as showed by the high level of
imports), while the aggregate supply is cut off from the global scenario, as the producers cannot sell
their goods to foreign countries; the main reason behind this lies in the high production costs,
determined by the high labor costs (the reasons of the distortion in the wage setting is explained in
chapter 7), as well as the multiple non-tariff trade barriers (NTBs) imposed by Israel to restrict the
flow of Palestinian trade, such as rising transportation costs36
, inadequate services of wholesale
markets, cold storage and packaging, restrictions on imported inputs37
, security checks and
inspections.
Undoubtedly, freeing the input markets from the restrictions enforced by Israel will allow
Palestinian producers and exporters to improve the competitiveness of the manufactured and
farming sectors in the domestic market as well as in the international markets. In fact importing
goods from cheaper origins other than Israel will eventually reduce costs, improving the value
added for agriculture and industry.
Being a small country, Palestine should trade and export to the outside world in order to expand its
production possibility frontier and exploit the advantages of the growing international trade; but,
considering that the OPT’s economy is underdeveloped and extremely fragile, an unconditional
opening to free trade would lead to overall losses rather than gains. It would be erroneous to equate
outward orientation to a pure free market approach, as export promotion can entail substantial
36The increase in transportation costs is due to several measures imposed by Israel, like back-to-back and convoying
trucks procedures, as well as monopolistic practices carried out by Palestinian importers, as basic goods like wheat, vegetable oil, live animal, wood, etc… have been imported by a few monopolists which have determined market prices. 37 Animal feedstuffs, fertilizers, iron and cement are the main controlled inputs imported from Israel. In fact, local
production of these inputs covers less than 20% of the total domestic demand.
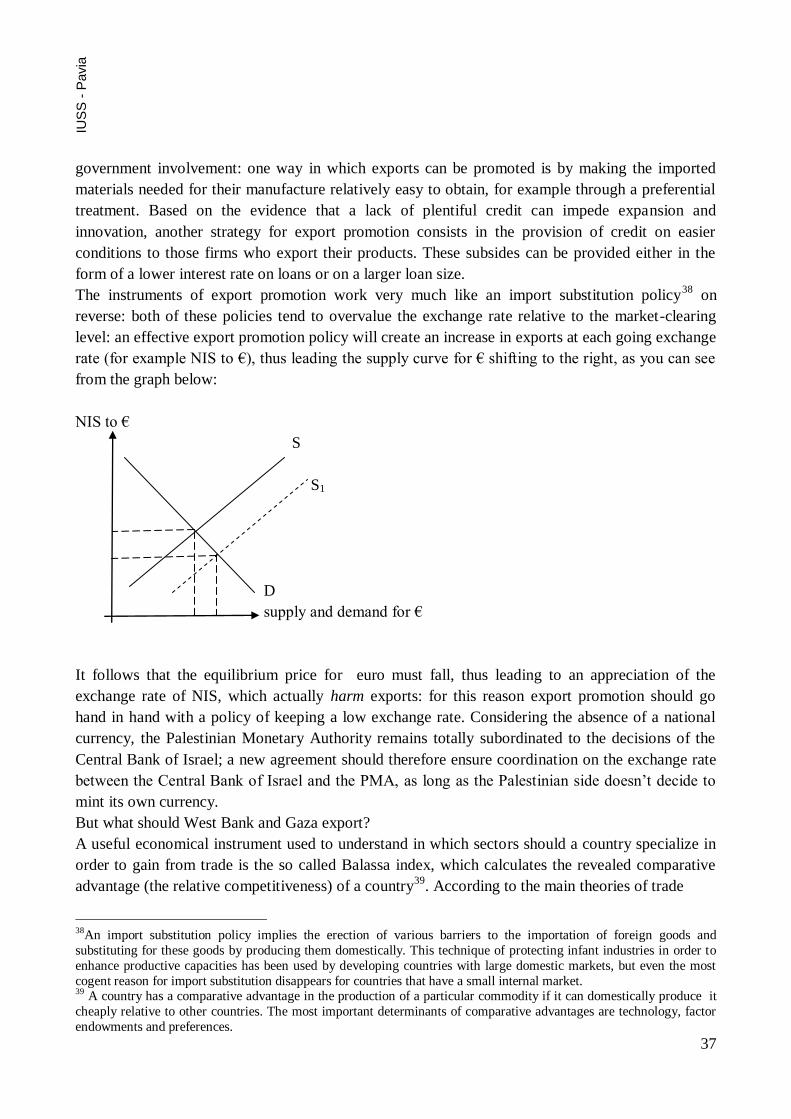
37
IUS
S -
Pavia
government involvement: one way in which exports can be promoted is by making the imported
materials needed for their manufacture relatively easy to obtain, for example through a preferential
treatment. Based on the evidence that a lack of plentiful credit can impede expansion and
innovation, another strategy for export promotion consists in the provision of credit on easier
conditions to those firms who export their products. These subsides can be provided either in the
form of a lower interest rate on loans or on a larger loan size.
The instruments of export promotion work very much like an import substitution policy38
on
reverse: both of these policies tend to overvalue the exchange rate relative to the market-clearing
level: an effective export promotion policy will create an increase in exports at each going exchange
rate (for example NIS to €), thus leading the supply curve for € shifting to the right, as you can see
from the graph below:
NIS to €
S
S1
D
supply and demand for €
It follows that the equilibrium price for euro must fall, thus leading to an appreciation of the
exchange rate of NIS, which actually harm exports: for this reason export promotion should go
hand in hand with a policy of keeping a low exchange rate. Considering the absence of a national
currency, the Palestinian Monetary Authority remains totally subordinated to the decisions of the
Central Bank of Israel; a new agreement should therefore ensure coordination on the exchange rate
between the Central Bank of Israel and the PMA, as long as the Palestinian side doesn’t decide to
mint its own currency.
But what should West Bank and Gaza export?
A useful economical instrument used to understand in which sectors should a country specialize in
order to gain from trade is the so called Balassa index, which calculates the revealed comparative
advantage (the relative competitiveness) of a country39
. According to the main theories of trade
38An import substitution policy implies the erection of various barriers to the importation of foreign goods and
substituting for these goods by producing them domestically. This technique of protecting infant industries in order to
enhance productive capacities has been used by developing countries with large domestic markets, but even the most
cogent reason for import substitution disappears for countries that have a small internal market. 39 A country has a comparative advantage in the production of a particular commodity if it can domestically produce it
cheaply relative to other countries. The most important determinants of comparative advantages are technology, factor
endowments and preferences.
38
IUS
S -
Pavia
based on comparative advantages, a country should specialize in the production of those goods and
services that it produces best relative to others, trading its commodities for those that it cannot
produce itself or is relatively inefficient in producing.
The following table shows the relative comparative advantage of WBGS calculated through one
specific version of Balassa index. This type of measurement refers to the ―own‖ country trade
performance, recognizing the possibility of simultaneous exports and imports within a particular
commodity:
RCA1 = (Xij/ Mij) / (Xit/Mit)
where X an M represent exports and imports respectively; i is a country and j is a commodity, t a set
of commodities.
The presence of a comparative advantage is attested if RCA > 1, whereas if RCA < 1 the country has a
comparative disadvantage in the production of that commodity.
The calculation of the Balassa index for WBGS data of imports and exports, using PCBS data, tells that
Palestinian own revealed comparative advantage are achieved for different commodities (see tab. 9), most of
which are produced within the primary sector; this trend confirms the structure of the Palestinian economy,
based on agriculture and farming activities:
- crude animal and vegetable materials (RCA =13.5);
- fixed vegetable fats and oil –crude (RCA=5.21);
- vegetable and fruit (RCA= 1.99);
- tobacco and tobacco manufacturers (RCA=1.66);
- fish (RCA=1.65);
- coffee, tea, cocoa and spices (RCA=1.31);
- fixed vegetable fats and oil -processed (RCA=1.06).
The competitiveness of WBGS economy in the industrial sector is revealed for a few commodities,
limited to labor intensive goods:
- furniture (RCA= 11.4);
- footwear (RCA=8.78);
- leather, leather manufactures (RCA=6.156);
- non-metallic mineral manufactures (RCA=3.59);
- plastics in non-primary forms (RCA=3.48);
- miscellaneous manufactured articles (RCA=2.260);
- rubber manufactures (RCA=2.06);
- manufactures of metals (RCA=1.804);
- textile yarn, fabrics, made-up articles (RCA=1.57);
- clothing accessories (RCA=1.509);
- travel goods (RCA=1.01).
The only capital intensive goods with a comparative advantage, anyway low, are medicinal and
pharmaceutical products (RCA=1.63).
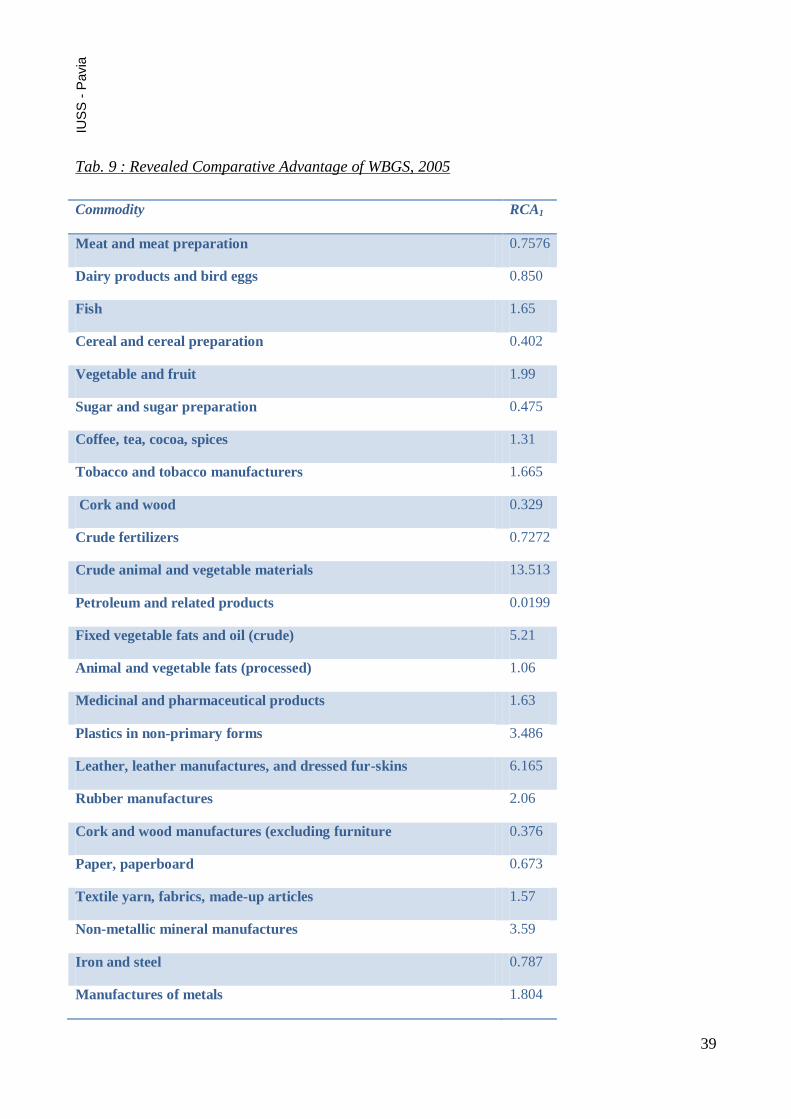
39
IUS
S -
Pavia
Tab. 9 : Revealed Comparative Advantage of WBGS, 2005
Commodity RCA1
Meat and meat preparation 0.7576
Dairy products and bird eggs 0.850
Fish 1.65
Cereal and cereal preparation 0.402
Vegetable and fruit 1.99
Sugar and sugar preparation 0.475
Coffee, tea, cocoa, spices 1.31
Tobacco and tobacco manufacturers 1.665
Cork and wood 0.329
Crude fertilizers 0.7272
Crude animal and vegetable materials 13.513
Petroleum and related products 0.0199
Fixed vegetable fats and oil (crude) 5.21
Animal and vegetable fats (processed) 1.06
Medicinal and pharmaceutical products 1.63
Plastics in non-primary forms 3.486
Leather, leather manufactures, and dressed fur-skins 6.165
Rubber manufactures 2.06
Cork and wood manufactures (excluding furniture 0.376
Paper, paperboard 0.673
Textile yarn, fabrics, made-up articles 1.57
Non-metallic mineral manufactures 3.59
Iron and steel 0.787
Manufactures of metals 1.804
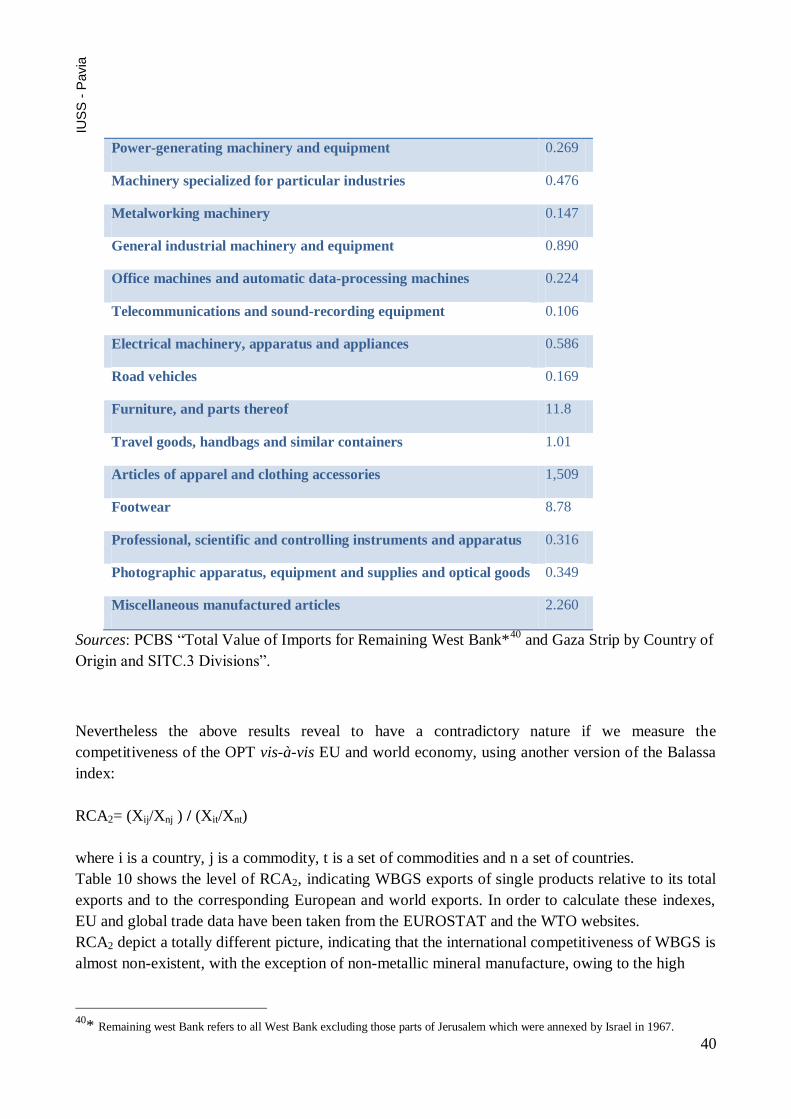
40
IUS
S -
Pavia
Power-generating machinery and equipment 0.269
Machinery specialized for particular industries 0.476
Metalworking machinery 0.147
General industrial machinery and equipment 0.890
Office machines and automatic data-processing machines 0.224
Telecommunications and sound-recording equipment 0.106
Electrical machinery, apparatus and appliances 0.586
Road vehicles 0.169
Furniture, and parts thereof 11.8
Travel goods, handbags and similar containers 1.01
Articles of apparel and clothing accessories 1,509
Footwear 8.78
Professional, scientific and controlling instruments and apparatus 0.316
Photographic apparatus, equipment and supplies and optical goods 0.349
Miscellaneous manufactured articles 2.260
Sources: PCBS ―Total Value of Imports for Remaining West Bank*40
and Gaza Strip by Country of
Origin and SITC.3 Divisions‖.
Nevertheless the above results reveal to have a contradictory nature if we measure the
competitiveness of the OPT vis-à-vis EU and world economy, using another version of the Balassa
index:
RCA2= (Xij/Xnj ) / (Xit/Xnt)
where i is a country, j is a commodity, t is a set of commodities and n a set of countries.
Table 10 shows the level of RCA2, indicating WBGS exports of single products relative to its total
exports and to the corresponding European and world exports. In order to calculate these indexes,
EU and global trade data have been taken from the EUROSTAT and the WTO websites.
RCA2 depict a totally different picture, indicating that the international competitiveness of WBGS is
almost non-existent, with the exception of non-metallic mineral manufacture, owing to the high
40
* Remaining west Bank refers to all West Bank excluding those parts of Jerusalem which were annexed by Israel in 1967.
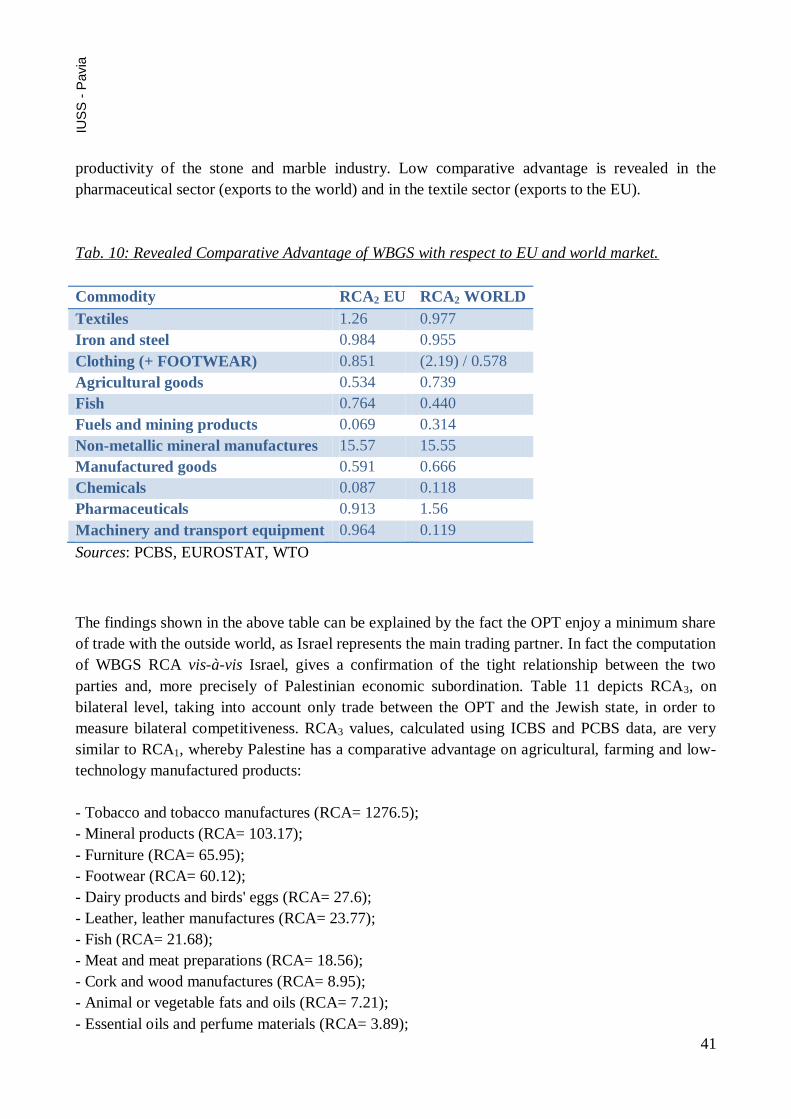
41
IUS
S -
Pavia
productivity of the stone and marble industry. Low comparative advantage is revealed in the
pharmaceutical sector (exports to the world) and in the textile sector (exports to the EU).
Tab. 10: Revealed Comparative Advantage of WBGS with respect to EU and world market.
Commodity RCA2 EU RCA2 WORLD
Textiles 1.26 0.977
Iron and steel 0.984 0.955
Clothing (+ FOOTWEAR) 0.851 (2.19) / 0.578
Agricultural goods 0.534 0.739
Fish 0.764 0.440
Fuels and mining products 0.069 0.314
Non-metallic mineral manufactures 15.57 15.55
Manufactured goods 0.591 0.666
Chemicals 0.087 0.118
Pharmaceuticals 0.913 1.56
Machinery and transport equipment 0.964 0.119
Sources: PCBS, EUROSTAT, WTO
The findings shown in the above table can be explained by the fact the OPT enjoy a minimum share
of trade with the outside world, as Israel represents the main trading partner. In fact the computation
of WBGS RCA vis-à-vis Israel, gives a confirmation of the tight relationship between the two
parties and, more precisely of Palestinian economic subordination. Table 11 depicts RCA3, on
bilateral level, taking into account only trade between the OPT and the Jewish state, in order to
measure bilateral competitiveness. RCA3 values, calculated using ICBS and PCBS data, are very
similar to RCA1, whereby Palestine has a comparative advantage on agricultural, farming and low-
technology manufactured products:
- Tobacco and tobacco manufactures (RCA= 1276.5);
- Mineral products (RCA= 103.17);
- Furniture (RCA= 65.95);
- Footwear (RCA= 60.12);
- Dairy products and birds' eggs (RCA= 27.6);
- Leather, leather manufactures (RCA= 23.77);
- Fish (RCA= 21.68);
- Meat and meat preparations (RCA= 18.56);
- Cork and wood manufactures (RCA= 8.95);
- Animal or vegetable fats and oils (RCA= 7.21);
- Essential oils and perfume materials (RCA= 3.89);
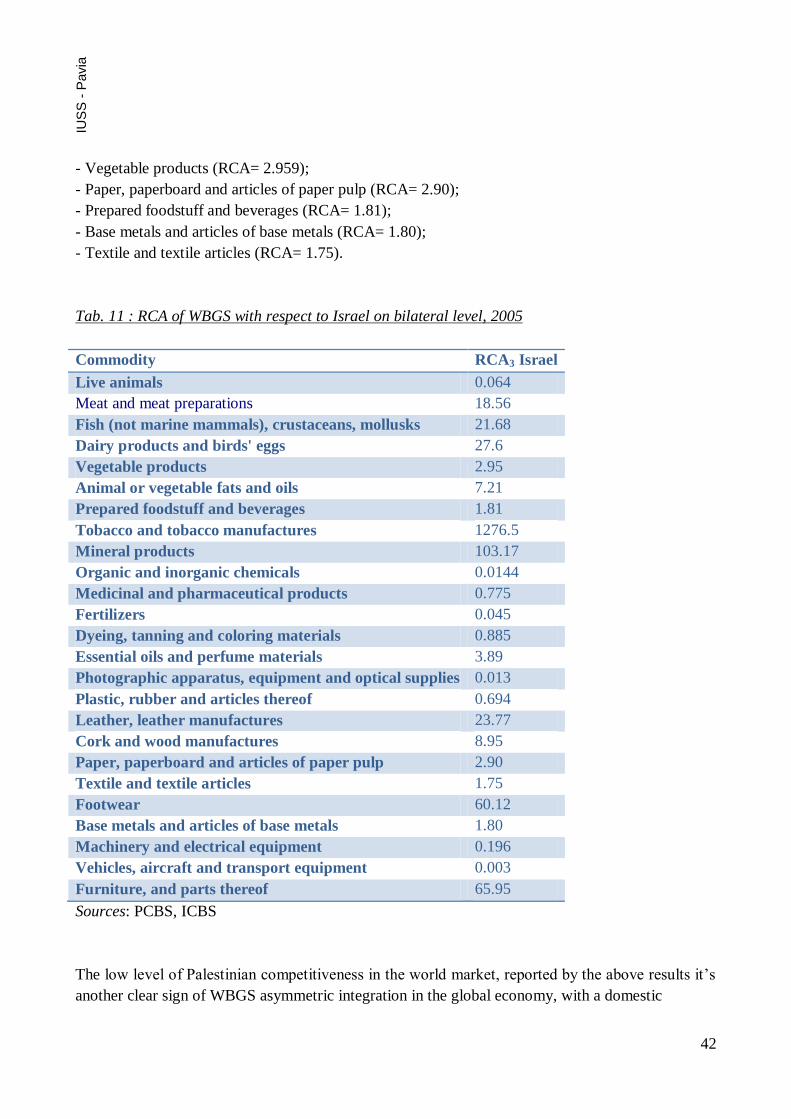
42
IUS
S -
Pavia
- Vegetable products (RCA= 2.959);
- Paper, paperboard and articles of paper pulp (RCA= 2.90);
- Prepared foodstuff and beverages (RCA= 1.81);
- Base metals and articles of base metals (RCA= 1.80);
- Textile and textile articles (RCA= 1.75).
Tab. 11 : RCA of WBGS with respect to Israel on bilateral level, 2005
Commodity RCA3 Israel
Live animals 0.064
Meat and meat preparations 18.56
Fish (not marine mammals), crustaceans, mollusks 21.68
Dairy products and birds' eggs 27.6
Vegetable products 2.95
Animal or vegetable fats and oils 7.21
Prepared foodstuff and beverages 1.81
Tobacco and tobacco manufactures 1276.5
Mineral products 103.17
Organic and inorganic chemicals 0.0144
Medicinal and pharmaceutical products 0.775
Fertilizers 0.045
Dyeing, tanning and coloring materials 0.885
Essential oils and perfume materials 3.89
Photographic apparatus, equipment and optical supplies 0.013
Plastic, rubber and articles thereof 0.694
Leather, leather manufactures 23.77
Cork and wood manufactures 8.95
Paper, paperboard and articles of paper pulp 2.90
Textile and textile articles 1.75
Footwear 60.12
Base metals and articles of base metals 1.80
Machinery and electrical equipment 0.196
Vehicles, aircraft and transport equipment 0.003
Furniture, and parts thereof 65.95
Sources: PCBS, ICBS
The low level of Palestinian competitiveness in the world market, reported by the above results it’s
another clear sign of WBGS asymmetric integration in the global economy, with a domestic

43
IUS
S -
Pavia
demand open to foreign products, but a supply unable to reach foreign markets. This phenomenon
can be explained by three main factors:
- high NTB barriers and transaction costs, caused by Israeli’s occupation strategy;
- low factor endowment: apart from stone and marble, Palestine is not rich in natural resources;
- high production costs, mainly determined by the high labor and input costs.
At the light of these results Palestinian trade policy, in order to enter new markets, should focus on
producing goods with a high value added, concentrating on quality rather than on quantity,
supplying higher value niche products to importer and retailer clients, penetrating new markets.
44
IUS
S -
Pavia
10. Conclusion
The analysis proposed in this paper suggests that the de facto economic integration of West Bank
and Gaza with Israel has not produced dynamic games in terms of productivity growth,
technological transfer and greater access to export markets, thus confining the Palestinian
Territories to low-skilled goods production, prompting labor force emigration. Today’s OPT
economy is living a deep recession, operating below its potential, with a real GDP per capita almost
30% lower than in 1999; the loss of jobs and remittance income as a result of Israeli closure41
policy, following the outbreak of the second intifada, has not been replaced by an offsetting
increase in the export of Palestinian goods and services.
The nature of relation with Israel constitutes the strongest conditioning factor for predicting future
Palestinian growth, affecting both the environment in which WBGS economy is evolving, as well
as the spectrum of policy instruments at its disposal to promote growth.
In fact, as outlined along the chapters, if we want to understand the role that can be played by trade
policy in West Bank and Gaza, it’s necessary to take into account three major characteristics of the
economy: first of all its structure, dominated by small and medium enterprises, producing low value
added goods and services for the domestic market; second, the trade linkages with the Israeli
economy, currently taking the form of a ―quasi-custom union‖, which have increased the degree of
dependency from the Israeli market; third, the political instability, aggravated by the outbreak of the
al-Aqsa intifada, the separation barrier and the expansion of the settlements, which have isolated the
West Bank and Gaza from their existing and potential regional and international partners.
The question of territorial sovereignty might appear superfluous in a world which is increasingly
globalised, and where freedom of trade, information and financial flows seems to erode the
importance of clear territorial jurisdiction; however this is not the case of the Palestinian Territories,
because, as long as there isn’t a clear and unambiguous demarcation of the borders and of the
control over land and resources, trade cannot be a vehicle for growth.
In the last chapter we have seen how an export promotion strategy could boost growth: to attain this
goal, a new trade agreement is needed, in order to minimize Palestinian dependence on Israeli
market as the only market for its products, not only in order to have the opportunity to import
production inputs and consumer goods at lower prices than those imported from the occupier, but
also to have the possibility of penetrating new markets, focusing on an export strategy based on
high value added commodities.
The current situation envisages two alternative path of development:
a first one would consist in eliminating the present negative aspect of asymmetric forced
integration by separating the two economies, ruled by two independent states. The two state
concept will promote:
a. independence in defining economic objectives and strategies;
b. growth in both economies;
41 With the term closure is meant that Palestinian goods and people can’t access Israel and the world; sometimes it also
implies that access within various part of the West Bank and links with Gaza Strip are severed.
45
IUS
S -
Pavia
c. the pursuit of policies that acknowledge economic interdependencies;
d. the prospective convergence of Palestinian living standards with those of
Israel.
a second way of development, which has been recently revaluated in the academicals
debates, foresees the creation of a single state42
, in which decision makers will try to
maximize the benefits of integration between the two realities. This might necessitate
implementing measures to:
a. encourage Israeli investments in the West Bank and Gaza;
b. facilitate the transfer of Israeli technology to WBGS;
c. reduce transaction costs to favor trade integration.
Several measures had been implemented in this regard at the beginning of the Oslo period, like the
development of industrial estates to promote Israeli-Palestinian capital sharing joint ventures, but
much remains to do in this domain.
In the absence of sovereignty, demarcated borders, freedom of movement and free access to world
markets, WBGS economy is becoming more and more fragmented43
, disarticulated and dependent;
the damaging measures imposed on the economy during the Oslo years demonstrate that economic
reform cannot precede political change, but must follow from it: placing the economic before the
political issue is destined to fail because the centre of control will remain with the occupier,
reflecting the occupier’s interests and objectives.
Long term Palestinian economic growth cannot occur or be sustained without a complete end of the
Israeli occupation: the recovery of the WBGS is not a technical problem but a political one, and, as
such, it requires a political solution.
42 The 17-18 November 2007 a conference was held at the SOAS, London ―Challenging the boundaries: a single state
in Palestine-Israel‖ aimed to open a debate on democratic alternative sto the two-state paradigm. Suggested
bibliography on the topic: A. Ali: ―One Country-Abold proposal to end the Israeli-Palestinian impasse” Metropolitan
Books, 2006; M. A. Hadi: ―Palestinian –Israeli impasse. Exploring alternative solutions to the Palestinian conflict‖,
PASSIA, 2005; J. Hilal: ―Where now for Palestine? The demise of the two-state solution‖, Zedbooks; J. Cook: ―Blood
and religion. The unmaking of the Jewish and democratic state”, 2006; G. Karmi: ―Married to another man. Israel’s
dilemma in Palestine‖, 2007;J. Kovel : ― Overcoming Zionism”, Pluto Press, 2007; Tilley :‖ The one state solution, a breakthrough for peace in the Israeli-Palestinian deadlock‖, 2005. 43 According to the UNCTAD, internal closures have divided WBGS into 54 ―fragments of isolated areas under
Palestinian Authority …… jurisdiction‖.

46
IUS
S -
Pavia
References:
- World Bank: “The Palestinian Economy and the Prospects for its recovery”. Economic
Monitoring Report to the Ad Hoc Liaison Committee. Number 1, December 2005
- World Bank: “West Bank and Gaza Investment Climate Assessment: Unlocking the
potential of the private sector”. March 2007.
- World Bank: “Movement and Access Restrictions in the West Bank: Uncertainty and
Inefficiency in the Palestinian Economy”. May 2007.
- World Bank: “ West Bank and Gaza Update”. March 2004.
- World Bank: “ West Bank and Gaza Update”. March 2005.
- World Bank: “ West Bank and Gaza Update”. April 2006.
- World Bank: “ West Bank and Gaza Update”. September 2006.
- World Bank: “ West Bank and Gaza Update”. March 2007.
- World Bank: “West Bank and Gaza Country Economic Memorandum. Growth in the West
Bank and Gaza: Opportunities and Constraints”, vol.1. September 2006.
- World Bank: “Two Years after London: Restarting Palestinian Economic Recovery.
Economic Monitoring Report to the Ad Hoc Liaison Committee”. September 2007.
- MAS : “Cost Structure, Economies of Scale and Their Effect on the Competitiveness of
Palestinian Industries” , Basim Makhool, Nasr Atyani. March 2004.
- MAS : ―Disengaging the Gaza Economy and Palestinian Policy Options: A simulation
framework”. 2005
- MAS : ―The Informal Sector Enterprises in the West Bank and Gaza Strip: case studies‖
Majdi Malki. December 2000.
- MAS : “Palestinian Trade Policy: Alternative and Options” Mahmoud El-Jafari. June 2002.
- MAS : ―Social and economic characteristics of the informal sector in the West Bank and
Gaza Strip‖, 2004.
- MAS : “Gaza in the Post-Separation Environment: A simulation Exercise”, 2007.
- MAS : ―Evaluation of Palestinian International Economic and Trade Agreements‖, 2002.
- MAS: “The Palestinian National Authority’s role in maximizing the benefits of International
Trade Agreements”, 2005.
- MAS : “Palestinian Service Sector and its role in economic development”, 2003.
- MAS : “Informal food processing industries in the Palestinian Territories: current status
and prospects”, 2006.
- MAS : “Informal construction services in the Palestinian Territories: current status and
prospects”, 2006.
- MAS : “Informal handicraft industries in the Palestinian Territories: current status and
prospects”, 2006.
- UNCTAD : “The Palestinian war-torn economy: aid, development and state formation”,
UN New York and Geneva. April 2006.
- UNCTAD : “Transit Trade and Maritime Transport Facilitation for the Rehabilitation and
Development of the Palestinian Economy”, UN New York and Geneva. March 2004.
-
47
IUS
S -
Pavia
- UNCTAD : “ Integrated Simulation Framework for Palestinian Macroeconomic, Trade and
Labor Policy”, UN New York and Geneva. January 2007.
- European Commission, Occasional Papers : “European Neighborhood Policy: Economic
Review of EU Neighbor Countries” by Directorate- General for Economic and Financial
Affairs. Number 30, June 2007.
- Sara Roy: “Failing Peace. Gaza and the Palestinian-Israeli conflict”, Pluto Press. London,
2007
- Ken Cole: “Palestinian development: Knowledge and Progress”, Development Studies
Program. Birzeit University, 2001
- Debraj Ray: ―Development Economics”. Princeton University Press. 1998.
- David Cobham, Nu’man Kanafani: ―The economics of Palestine. Economic policy and
institutional reform for a viable Palestinian state‖. Routledge, Studies in development
economics, 2004.
- Shlomo Swirski: “The Price of Occupation to Israeli Society”. December 2004, Adva
Center, Tel Aviv.
- World Institute for Development Economics Research: “Economic Aspects of the
Palestinian –Israeli Conflict. The Collapse of the Oslo Accord”, Fadle M. Naqib. October
2002.
- Economic Research Forum : “Setting the Stage for a National Currency in the West Bank
and Gaza: The Choice of Exchange Rate Regime”, Samya Beidas and Magda Kandil.
December 2005.
- Claus Astrup and Sebastien Dessus: “Exporting Goods or Exporting Labor?: Long Term
Implication for the Palestinian Economy” Review of Middle East Economics and Finance.
Vol. 3 N. 1, April 2005.
- Rt Hon Ed Balls MP and Jon Cunliffe CB: ―Economic Aspects of peace in the Middle East‖.
HM Government, September 2007.
- FEMISE : ―Palestine Country Profile. The Road Ahead for Palestine‖. Economic Research
Forum, Egypt; Institute de La Méditerranée, France. February 2006
- Leila Farshakh: “Economic Viability of a Palestinian State in the West Bank and Gaza
Strip: Is It possible without territorial integrity and sovereignty?” Journal of Middle East
Studies. Vol. 1, May 2001.
- PMA: “Twelfth Annual Report, 2006”. Department of research and Monetary Policy, May
2007.
- PMA : “Economic and Social Monitor” Volume 9, July 2007.
- Basim Makhool, Mahmoud Elkhafif: ―Integrated Framework for Palestinian
Macroeconomic, Trade and Labour Policy”. MAS/UNCTAD/ILO, 2004.
- Majdi Haj Khalil: ―Trade Security‖ Palestinian Shipper Council, May 2007.
- AIX Group: “Rethinking the Transitional Economic Arrangements between Israel and the
Palestinian Authority. An alternative to the Paris Protocol”, September 2007.
- The MATTIN Group: ― What way forward for the Gaza strawberry sector. An examination
of European market supply opportunities and compatible marketing and export logistics
48
IUS
S -
Pavia
options on which an Export Marketing-Driven Sectoral Development Strategy can be based‖.
Ramallah, 2003.
- The MATTIN Group: ―Pre-feasibility Study for a pilot garment export marketing and trading
facility”. Ramallah, 2000.
- PALTRADE: “Facilitating Trade Flows between WBGS and Israel. Al Montar/Karni Terminal
movement monitoring‖. Monthly Report, February 2007.
- Utku Utkulu and Dilek Seymen: ―Revealed Comparative Advantage and Competitiveness:
Evidence for Turkey vis-à-vis the EU/15‖. European Trade Study Group 6th Annual
Conference. ETSG 2004, Nottingham, September 2004.
- Amita Batra, Zeba Khan: ―Revealed comparative advantage: an analysis for India and
China” Indian Council for Research on international economic relations, August 2005.
- European Commission: ―European Neighbourhood Policy: Economic Review of EU
Neighbour Countries”. Directorate-General for Economic and Financial Affairs, June 2007.
- Ephraim Kleiman, “The conditions of economic viability”, Israel-Palestine Journal, Vol.14
N. 3, 2007.
- Arie Arnon, Sab Bamya: “Back to Negotiating the final status-The economic dimension”,
Israel-Palestine Journal, Vol.14 N. 3, 2007.
- Hisham Awartani: “Reform in Institutional framework and economic policy”, Israel-
Palestine Journal, Vol.14 N. 3, 2007.