Embed Size (px)
Citation preview

MAGTUG 1st Annual Symposium 3/8/2013
Villanova University 1
aGIS‐a brief overview
Steve Welebny – Photogrammetrist ‐ Keystone Aerial Surveys

MAGTUG 1st Annual Symposium 3/8/2013
Villanova University 2

MAGTUG 1st Annual Symposium 3/8/2013
Villanova University 3
5 Federal AviationAdministrationMay 8, 2012 https://airports‐gis.faa.gov/
Nav Aid Cost
VOR
‣ Install = $250,000
‣ 20‐year life cycle cost = $1,100,000
ILS
‣ Install = $1,200,000
‣ 20‐year life cycle cost = $2,700,000
Neither figure considers cost of real estate
6 Federal AviationAdministrationMay 8, 2012 https://airports‐gis.faa.gov/
WAAS Capabilities
Why WAAS?‣ Enhances en‐route navigation performance over GPS alone
‣ Enhances non‐precision approach capability over GPS alone
‣ Allows WAAS equipped users to fly more than 2,891 published LNAV/VNAV procedures to minimums as low as 300 feet
‣ Allows WAAS equipped users to fly new LPV procedures
‐ Can use GPS for an alternate (LNAV only)
‐ Advanced missed approach
Better than 99.99% availability of system
95% availability in CONUS of approach with vertical guidance‣ 200’ minimum(maybe)
WAAS specific approaches (LPV)
‣ 646 LPV approaches published, with 300 new expected in 2007

MAGTUG 1st Annual Symposium 3/8/2013
Villanova University 4
MAGTUG 1st Annual Symposium 3/8/2013
Villanova University 5
9 Federal AviationAdministrationMay 8, 2012 https://airports‐gis.faa.gov/
StreamlinedDepartures
Vector -Free
ArrivalsAll-Weather
Approaches
StreamlinedDepartures
Efficient, Flexible Routing
Vector -Free
ArrivalsAll-Weather
Approaches
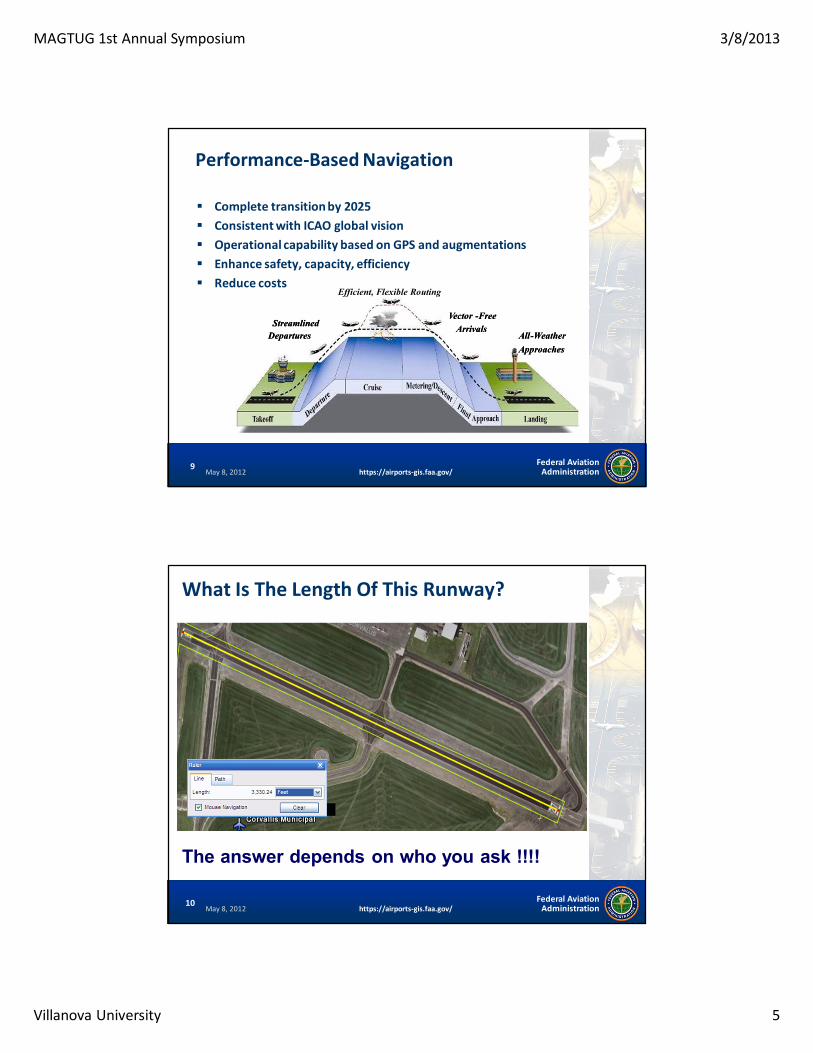
Performance‐Based Navigation
Complete transition by 2025
Consistent with ICAO global vision
Operational capability based on GPS and augmentations
Enhance safety, capacity, efficiency
Reduce costs
10 Federal AviationAdministrationMay 8, 2012 https://airports‐gis.faa.gov/
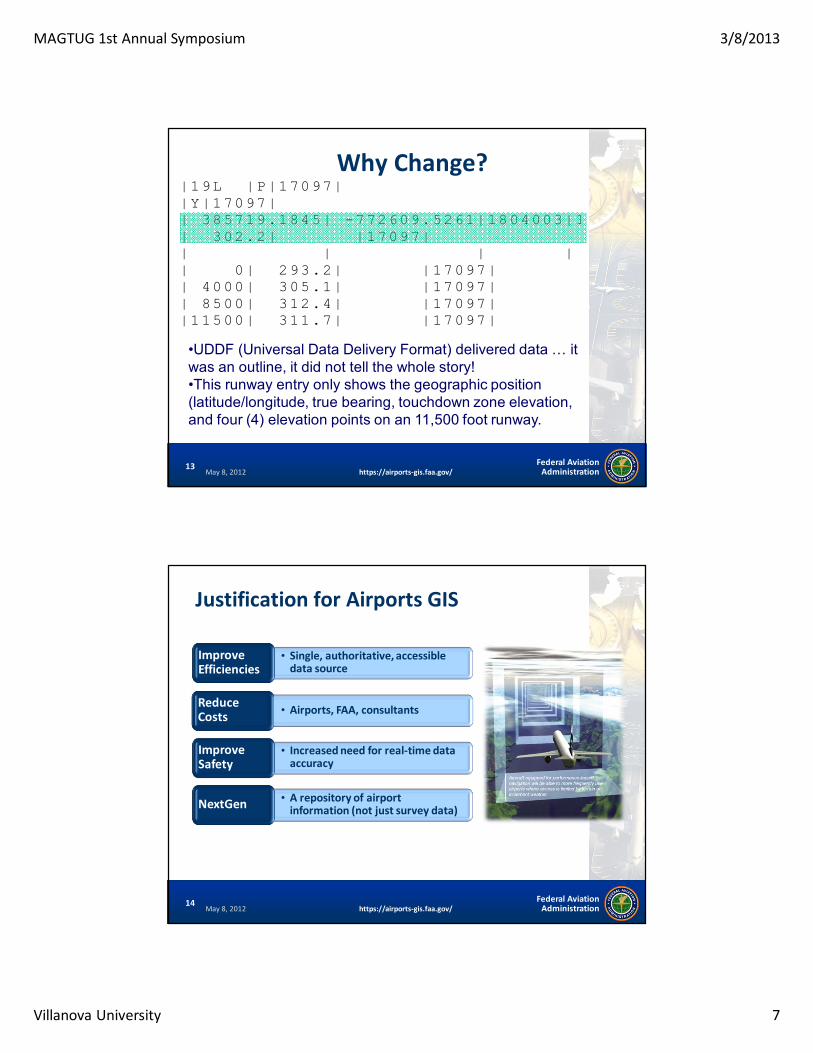
What Is The Length Of This Runway?
The answer depends on who you ask !!!!

MAGTUG 1st Annual Symposium 3/8/2013
Villanova University 6
11 Federal AviationAdministrationMay 8, 2012 https://airports‐gis.faa.gov/
Which Data Is Correct? NFDC NASR Data
iOEAAA
NFPG Data
12 Federal AviationAdministrationMay 8, 2012 https://airports‐gis.faa.gov/
History of the Program•Conceived to address the airport data problems the FAA was experiencing agency wide
•It was recognized that there had to be a better way of collecting, storing managing, and sharing the data about our airports
•Adopted as a FAA Flight Plan goal in 2006
MAGTUG 1st Annual Symposium 3/8/2013
Villanova University 7
13 Federal AviationAdministrationMay 8, 2012 https://airports‐gis.faa.gov/
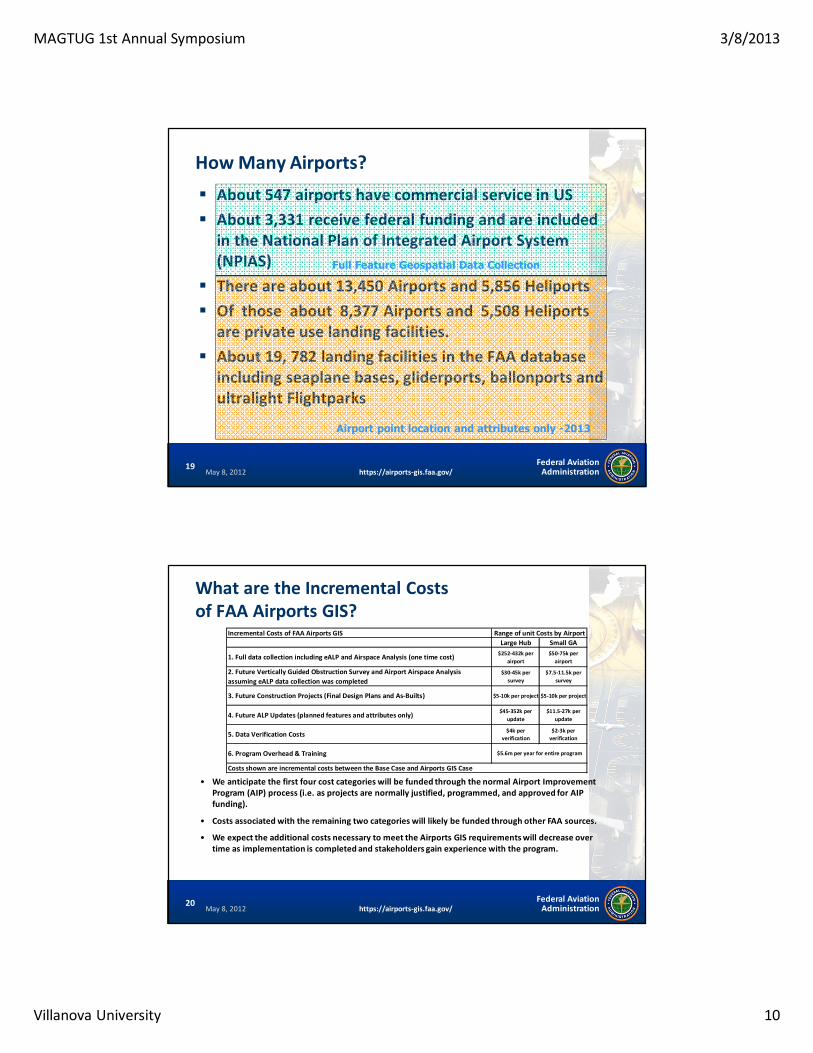
Why Change?
•UDDF (Universal Data Delivery Format) delivered data … it was an outline, it did not tell the whole story!•This runway entry only shows the geographic position (latitude/longitude, true bearing, touchdown zone elevation, and four (4) elevation points on an 11,500 foot runway.
|19L |P|17097||Y|17097|| 385719.1845| -772609.5261|1804003|1| 302.2| |17097|| | | | | 0| 293.2| |17097|| 4000| 305.1| |17097|| 8500| 312.4| |17097||11500| 311.7| |17097|
14 Federal AviationAdministrationMay 8, 2012 https://airports‐gis.faa.gov/
• Single, authoritative, accessible data source
Improve Efficiencies
• Airports, FAA, consultantsReduce Costs
• Increased need for real‐time data accuracy
Improve Safety
• A repository of airport information (not just survey data)NextGen
Justification for Airports GIS

MAGTUG 1st Annual Symposium 3/8/2013
Villanova University 8
15 Federal AviationAdministrationMay 8, 2012 https://airports‐gis.faa.gov/
e‐ALP VISION | From There To Now
Element: RunwayAttribute: Runway Threshold Runway End: 19RNAVD 88 Elevation: 8.8’Length: 7,500’Width: 200’Degrees-Minutes-Seconds (NAD83 DMS) Lat. 37 deg 37' 37.94" N Long. 122 deg 22' 12.44" W
Element: NAVAIDAttribute: VOR/DMEFrequency; 115.80Operator: FAANAVD 88 Elevation: 13’Lat. 37 deg 37’ 10.136”NLong. 122 deg 22 26.008”W
AIP Grant: AIP No. 3-06-0221-40Name: Rehabilitate ApronMaterial: AsphaltArea: 11,243 SYStatus: Completion date 10/2009
AIP Grant: AIP No. 3-06-0221-40Name: Rehabilitate RunwayMaterial: AsphaltStatus: Completion date 10/2009
What if… the FAA could capture and
validate data against a defined standard, import it from and/or export it to an ALP, and make it available electronically for whoever needs it?
16 Federal AviationAdministrationMay 8, 2012 https://airports‐gis.faa.gov/
Element: RunwayAttribute: Runway Threshold Runway End: 19RNAVD 88 Elevation: 8.8’Length: 7,500’Width: 200’Degrees-Minutes-Seconds (NAD83 DMS) Lat. 37 deg 37' 37.94" N Long. 122 deg 22' 12.44" W
Element: NAVAIDAttribute: VOR/DMEFrequency; 115.80Operator: FAANAVD 88 Elevation: 13’Lat. 37 deg 37’ 10.136”NLong. 122 deg 22 26.008”W
AIP Grant: AIP No. 3-06-0221-40Name: Rehabilitate ApronMaterial: AsphaltArea: 11,243 SYStatus: Completion date 10/2009
AIP Grant: AIP No. 3-06-0221-40Name: Rehabilitate RunwayMaterial: AsphaltStatus: Completion date 10/2009
WE CAN DO BETTER NOW!BY PROVIDING A RICHERDATA SET
THE RESULT:A COMPLETEPICTURE FOR NEXTGEN PLANNING
Airports GIS and e‐ALP make data …information

MAGTUG 1st Annual Symposium 3/8/2013
Villanova University 9
17 Federal AviationAdministrationMay 8, 2012 https://airports‐gis.faa.gov/
How The Program Is Designed To Help
Airports-GIS provides the foundation for
connecting the airports, FAA, and
other agencies
A central database for storing survey, charting, analysis, and planning data
The Airport Surveying-GIS program provides a single portal for the collection and dissemination of standards based verified source data to support future design, mapping, surveying, and construction activities from a known good (independent verification and validation) and maintained data set.
How Ambitious?
Complete Data for 825 Airports in the First Five Years‣ All large airports submitting as‐built data through the system
Medium and Large Sized Airports completed between 2012‐2017
Small Non‐Primary Airports completed between 2013‐2019
Part 139 and Towered Airports completed between 2014‐2020
Relievers and Airports with <25 aircraft completed between 2013‐2019
MAGTUG 1st Annual Symposium 3/8/2013
Villanova University 10
19 Federal AviationAdministrationMay 8, 2012 https://airports‐gis.faa.gov/
How Many Airports?
About 547 airports have commercial service in US
About 3,331 receive federal funding and are included in the National Plan of Integrated Airport System (NPIAS)
There are about 13,450 Airports and 5,856 Heliports
Of those about 8,377 Airports and 5,508 Heliports are private use landing facilities.
About 19, 782 landing facilities in the FAA database including seaplane bases, gliderports, ballonports and ultralight Flightparks
Full Feature Geospatial Data Collection
Airport point location and attributes only -2013
20 Federal AviationAdministrationMay 8, 2012 https://airports‐gis.faa.gov/
What are the Incremental Costs of FAA Airports GIS?
• We anticipate the first four cost categories will be funded through the normal Airport Improvement Program (AIP) process (i.e. as projects are normally justified, programmed, and approved for AIP funding).
• Costs associated with the remaining two categories will likely be funded through other FAA sources.
• We expect the additional costs necessary to meet the Airports GIS requirements will decrease over time as implementation is completed and stakeholders gain experience with the program.
Incremental Costs of FAA Airports GIS
Large Hub Small GA
1. Full data collection including eALP and Airspace Analysis (one time cost)$252‐432k per
airport
$50‐75k per
airport
2. Future Vertically Guided Obstruction Survey and Airport Airspace Analysis
assuming eALP data collection was completed
$30‐45k per
survey
$7.5‐11.5k per
survey
3. Future Construction Projects (Final Design Plans and As‐Builts) $5‐10k per project $5‐10k per project
4. Future ALP Updates (planned features and attributes only)$45‐352k per
update
$11.5‐27k per
update
5. Data Verification Costs$4k per
verification
$2‐3k per
verification
6. Program Overhead & Training
Costs shown are incremental costs between the Base Case and Airports GIS Case
$5.6m per year for entire program
Range of unit Costs by Airport
MAGTUG 1st Annual Symposium 3/8/2013
Villanova University 11
What Is the Airport Improvement Program?
The Airport Improvement Program (AIP) provides grants to public agencies — and, in some cases, to private owners and entities -- for the planning and development of public-use airports that are included in the National Plan of Integrated Airport Systems (NPIAS).
How Much of the Project Cost Does the Grant Cover?
For large and medium primary hub airports, the grant covers 75 percent of eligible costs (or 80 percent for noise program implementation). For small primary, reliever, and general aviation airports, the grant covers a range of 90-95 percent of eligible costs, based on statutory requirements. Please contact your local Airports Office for more details.
What Airports are Eligible?
AIP grants for planning, development, or noise compatibility projects are at or associated with individual public-use airports (including heliports and seaplane bases). A public-use airport is an airport open to the public that also meets the following criteria:
Publicly owned, or Privately owned but designated by FAA as a reliever, or Privately owned but having scheduled service and at least 2,500 annual enplanements.
Further, to be eligible for a grant, an airport must be included in the NPIAS. The NPIAS, which is prepared and published every 2 years, identifies public-use airports that are important to public transportation and contribute to the needs of civil aviation, national defense, and the Postal service.
Recipients of grants are referred to as "sponsors." The description of eligible grant activities is described in the authorizing legislation and relates to capital items serving to develop and improve the airport in areas of safety, capacity, and noise compatibility. In addition to these basic principles, a sponsor must be legally, financially, and otherwise able to carry out the assurances and obligations contained in the project application and grant agreement.
22 Federal AviationAdministrationMay 8, 2012 https://airports‐gis.faa.gov/
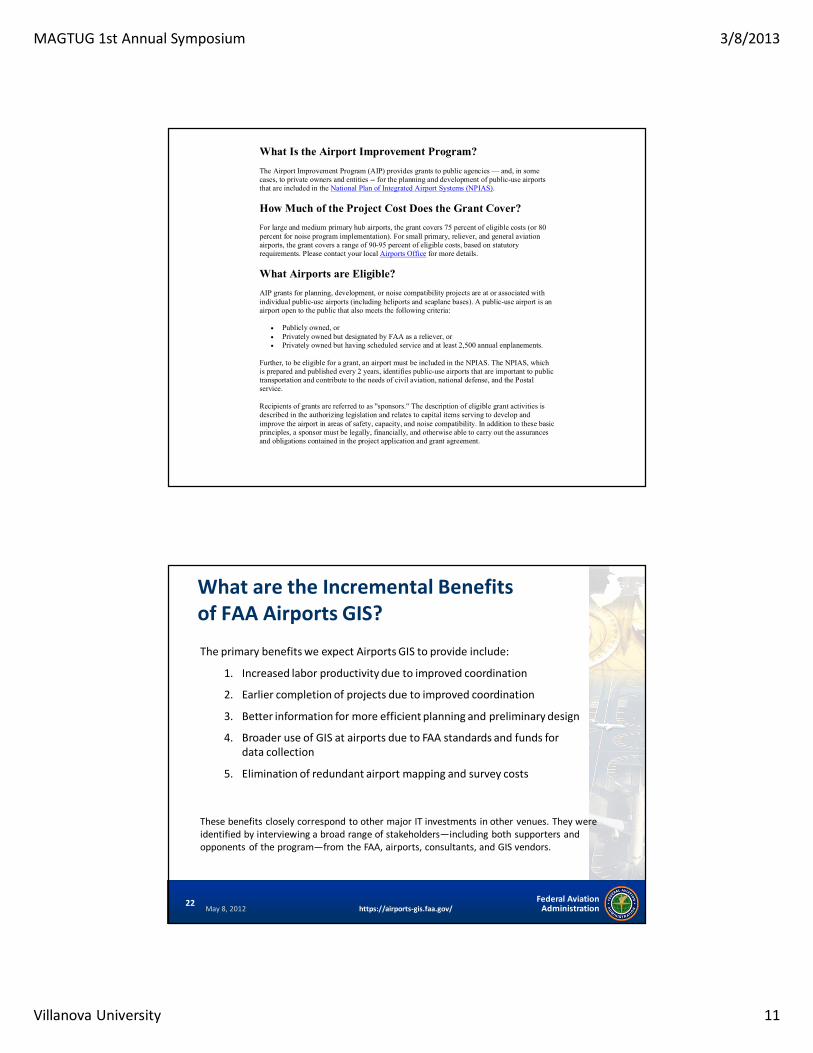
What are the Incremental Benefits of FAA Airports GIS?
The primary benefits we expect Airports GIS to provide include:
1. Increased labor productivity due to improved coordination
2. Earlier completion of projects due to improved coordination
3. Better information for more efficient planning and preliminary design
4. Broader use of GIS at airports due to FAA standards and funds for data collection
5. Elimination of redundant airport mapping and survey costs
These benefits closely correspond to other major IT investments in other venues. They were identified by interviewing a broad range of stakeholders—including both supporters and opponents of the program—from the FAA, airports, consultants, and GIS vendors.

MAGTUG 1st Annual Symposium 3/8/2013
Villanova University 12
23 Federal AviationAdministrationMay 8, 2012 https://airports‐gis.faa.gov/
Data Distribution Before Airports GIS
No aerial photography
Airport Layout Plan @ ADO‣ Paper
‣ CAD
Modification of Standards @ ADO
Obstruction Surveys to National Geodetic Survey (NGS)
No airport Data @ HQ
5010 safety data to National Flight Data Center (NFDC)
24 Federal AviationAdministrationMay 8, 2012 https://airports‐gis.faa.gov/
Data Distribution After Airports GIS
No aerial photography
Airport Layout Plan @ ADO‣ Paper
‣ CAD
Modification of Standards @ ADO
Obstruction Surveys to National Geodetic Survey (NGS)
No airport Data @ HQ
5010 safety data to National Flight Data Center (NFDC)
Aerial Photography to Cloud Server
Digital data eALP derived from feature extraction from photography
Modification of Standards digital tracking in Airports GIS
Obstruction Surveys in Airports GIS
All data airport data in Airports GIS including the 5010 data (starting 2013)

MAGTUG 1st Annual Symposium 3/8/2013
Villanova University 13
25 Federal AviationAdministrationMay 8, 2012 https://airports‐gis.faa.gov/
Airport Sponsor Benefits
Provides a single point of entry for the submission and maintenance of AIRPORT DATA and to communicate the changes electronically to the FAAProvides non-GIS Equipped Airports with a GIS Foundation for:
Airport Layout Plans, Obstruction Charts, Construction plans, and other airport mapping productsPlanningZoning
Improves Response to Airport ChangesProvides On-line Access to Electronic Obstruction Charts and Airport Layout Plan Data to FAA, Airports, and ConsultantsProvides the sponsor access to FAA data Speeds Production and Currency of FAA Charts and publications
26 Federal AviationAdministrationMay 8, 2012 https://airports‐gis.faa.gov/
eALP | On‐line Viewer
eALP
MAGTUG 1st Annual Symposium 3/8/2013
Villanova University 14
27 Federal AviationAdministrationMay 8, 2012 https://airports‐gis.faa.gov/
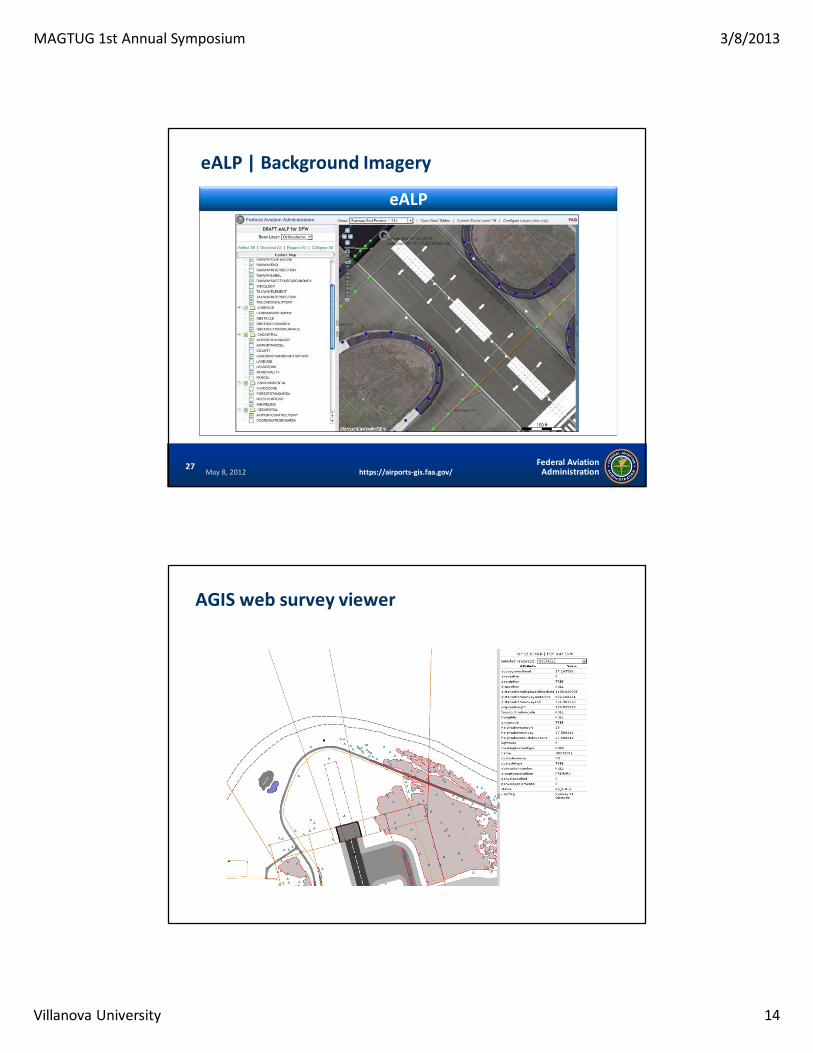
eALP | Background Imagery
eALP
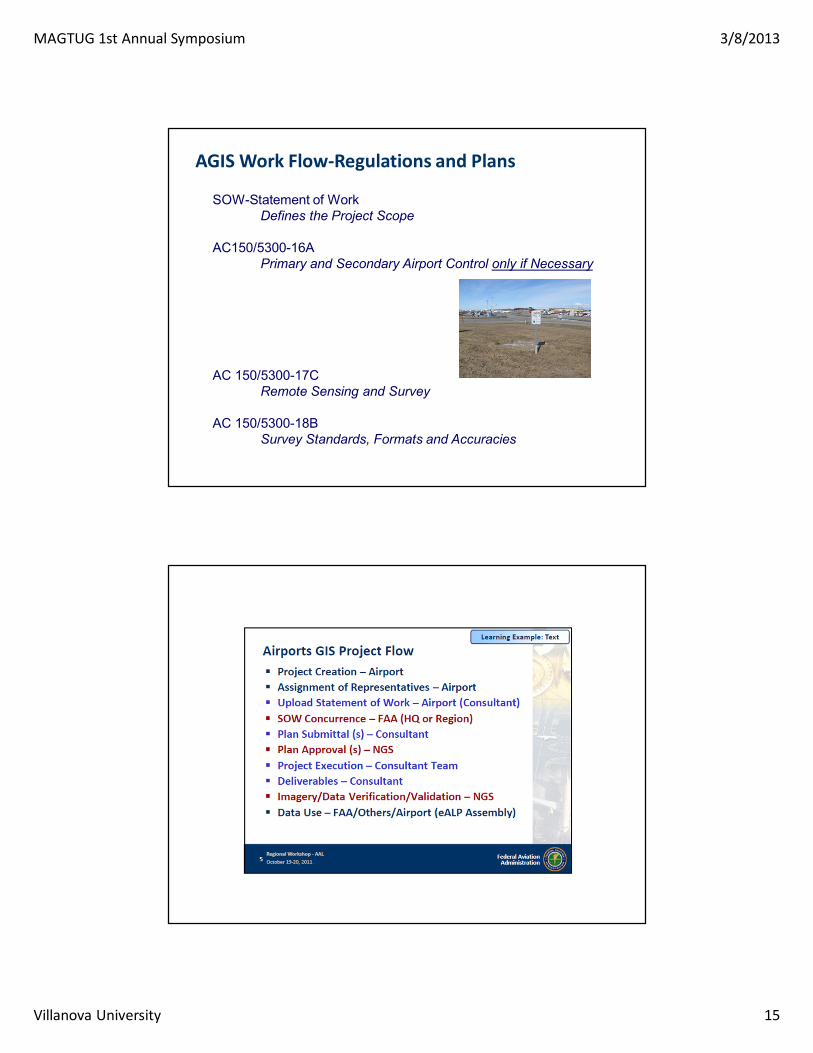
AGIS web survey viewer
MAGTUG 1st Annual Symposium 3/8/2013
Villanova University 15
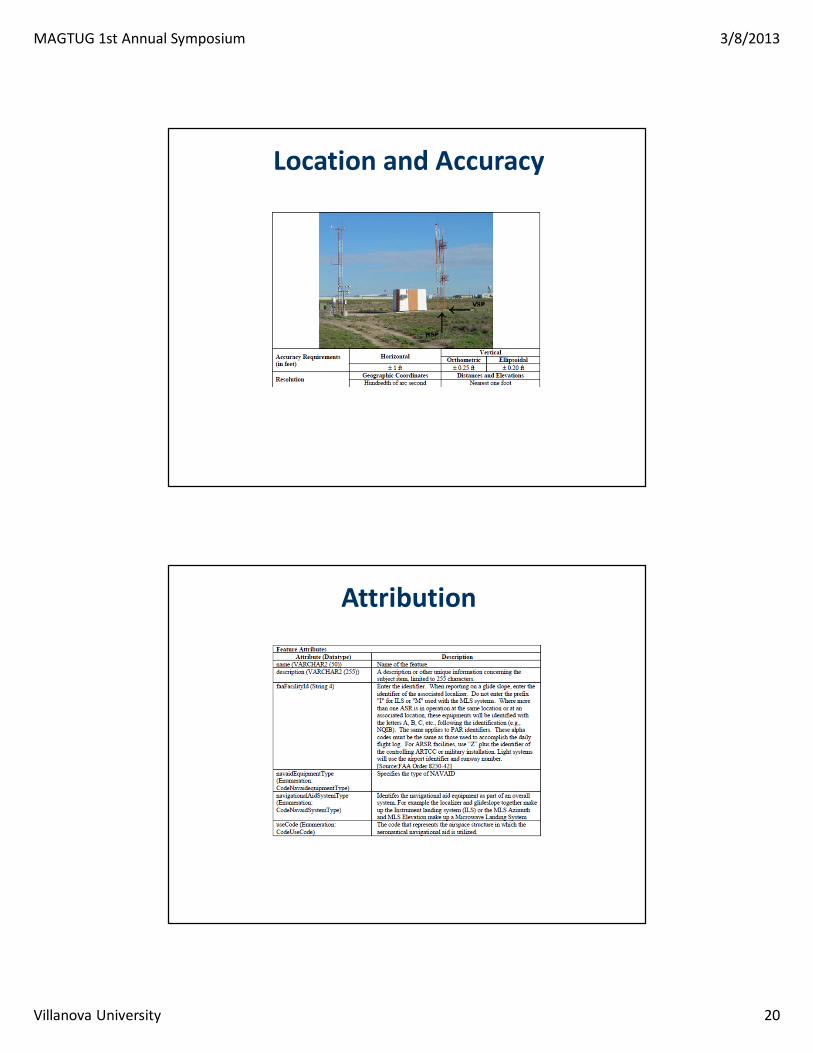
SOW-Statement of WorkDefines the Project Scope
AC150/5300-16APrimary and Secondary Airport Control only if Necessary
AC 150/5300-17CRemote Sensing and Survey
AC 150/5300-18BSurvey Standards, Formats and Accuracies
AGIS Work Flow‐Regulations and Plans

MAGTUG 1st Annual Symposium 3/8/2013
Villanova University 16
31 Federal AviationAdministrationMay 8, 2012 https://airports‐gis.faa.gov/
Survey Data Collection
Airports
GIS
O U T P U T
Airports GIS
Aeronautical Charting data
Instrument Procedures data
Obstruction data
Aerial Photos
Airport Planning
I N P U T
Data Standards
• Collection
• Input
Geodetic Control
Photography Control
Engineering
Applications
Modification of Standards Tool
Airport Design Tool
Airspace Evaluation Tool
Part 139 Inspections Tool
electronic ALP Tool
Planning
Application

MAGTUG 1st Annual Symposium 3/8/2013
Villanova University 17
34 Federal AviationAdministrationMay 8, 2012 https://airports‐gis.faa.gov/
GIS Data Features The bulk of AC 150/5300‐18B details the airport feature
descriptions defining the specifications for each feature group and class.
Utilize the specifications defined to ensure the data delivered is accurate and meets standards.
Each feature is described by …
‣ Feature group
‣ Geometry type,
‣ Sensitivity, requirements,
‣ Positional accuracy
‣ Data capture rule,
‣ Attributes required to provide the data to the FAA.

MAGTUG 1st Annual Symposium 3/8/2013
Villanova University 18
35 Federal AviationAdministrationMay 8, 2012 https://airports‐gis.faa.gov/
Airport Features
There are eleven feature groups in the standard
‣ Airfield Navigational Aids
‣ Airspace Sea Plane
‣ Cadastral Security
‣ Environmental Surface Transportation
‣ Geospatial Utilities
‣ Manmade Structures
In each Feature Group are the individual features.
36 Federal AviationAdministrationMay 8, 2012 https://airports‐gis.faa.gov/
AC 150/5300‐18, Chapter 5 | Feature Groups
Airfield
Airspace
Cadastral
Environmental
Geospatial
Man Made
Navigational Aides
Seaplane
Security
Surface Transportation
Utilities

MAGTUG 1st Annual Symposium 3/8/2013
Villanova University 19
Topology
Features
MAGTUG 1st Annual Symposium 3/8/2013
Villanova University 20
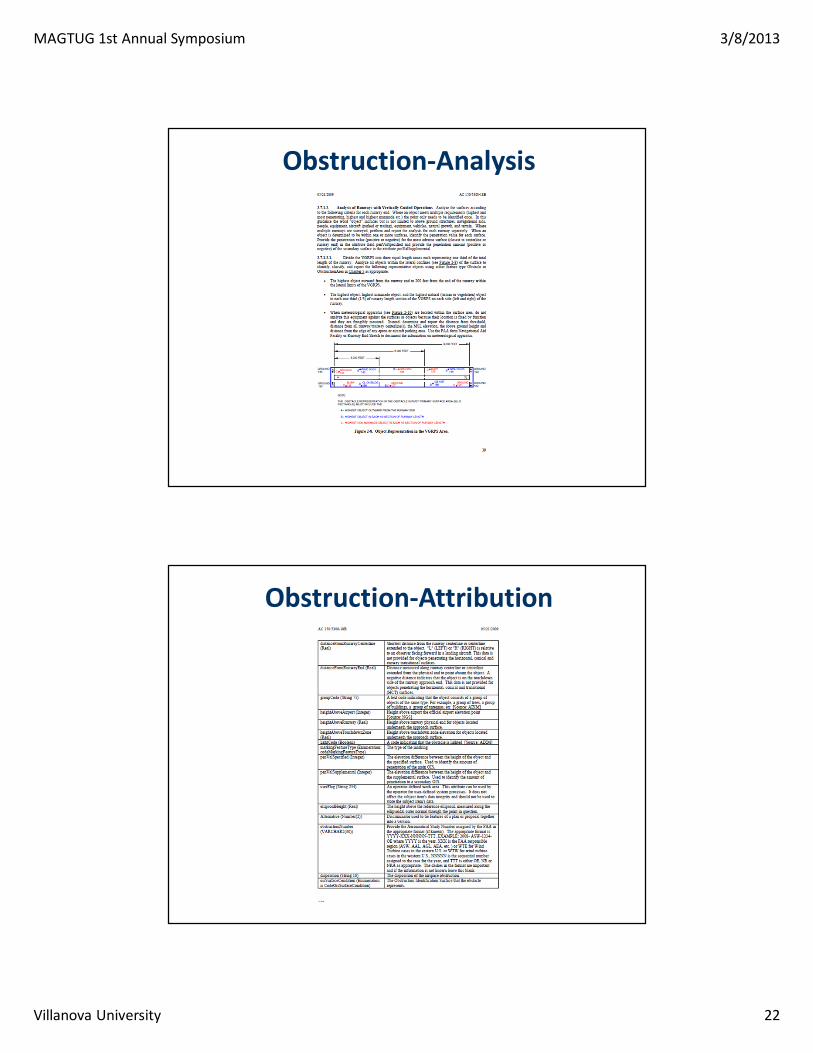
Location and Accuracy
Attribution

MAGTUG 1st Annual Symposium 3/8/2013
Villanova University 21
Attribution‐Calculation
Airspace‐Construction
MAGTUG 1st Annual Symposium 3/8/2013
Villanova University 22
Obstruction‐Analysis
Obstruction‐Attribution

MAGTUG 1st Annual Symposium 3/8/2013
Villanova University 23
45 Federal AviationAdministrationMay 8, 2012 https://airports‐gis.faa.gov/
Other Types of Surveys
AC 150/5300‐18B for the first time discusses standards for other types of surveys relating to or happening on Airports, most of which you are familiar with
• Boundary/Land Use
• Sub Surface Utility Engineering
• Topographic
• Airport Mapping Database
• Construction
• Airport Pavement
Utility Points‐Page One
MAGTUG 1st Annual Symposium 3/8/2013
Villanova University 24
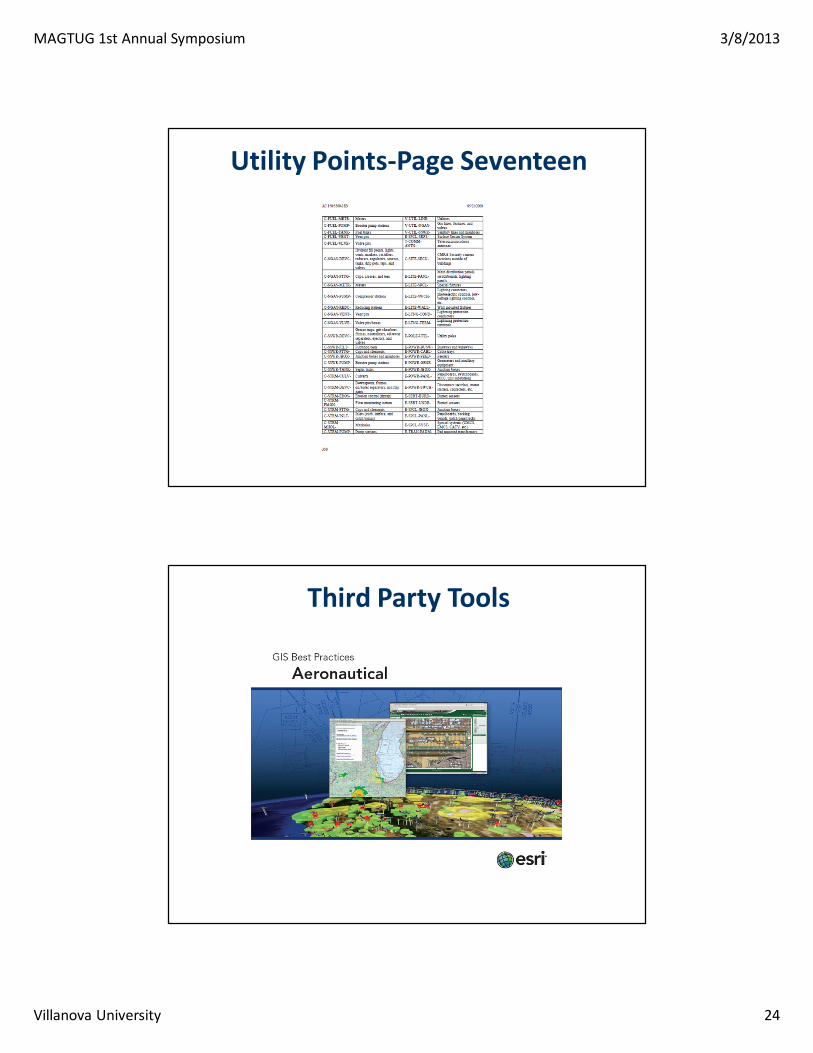
Utility Points‐Page Seventeen
Third Party Tools

MAGTUG 1st Annual Symposium 3/8/2013
Villanova University 25
ESRI Aeronautical Validation Tools
50 Federal AviationAdministrationMay 8, 2012 https://airports‐gis.faa.gov/
Third Party Tools

MAGTUG 1st Annual Symposium 3/8/2013
Villanova University 26
Runway End Point Possibility Number 6‐ Easy!
3D Feature Collection Directly into ESRI ArcGIS using DAT/EM Systems Summit Evolution Digital Stereoplotter

MAGTUG 1st Annual Symposium 3/8/2013
Villanova University 27
Stereo Capture collects 3D image features directly from the SUMMIT EVOLUTION stereoplotter into ArcView, ArcEditor and ArcInfo and allows for:
Automatic Field Updates
DAT/EM Stereo Capture for ArcGIS Overview
Real‐time panning and zooming in 3D viewing environment
3D digitizing and editing directly into ArcMap
GIS data superimposed onto 3D stereo imagery
Real‐time automated field updating
DTM loading, distribution, and editing
Load orientation control data
Automatic contour generation
3D editing tools
Tool to covert 2D shapefiles and feature classes to 3D based on a DTM distribution

MAGTUG 1st Annual Symposium 3/8/2013
Villanova University 28
Completed Chart