Embed Size (px)
Citation preview
Emelie Jönsson
Agile Development and User-Centered Design- a case study at Sony Mobile Communications AB
Master's Thesis
Department of Design SciencesLund UniversityISRN:LUTMDN/TMAT-5168-SE
EAT 2013
CORE Metadata, citation and similar papers at core.ac.uk
Provided by Lund University Publications - Student Papers
Agile Development and User -
Centered D es ign
A case study at Sony Mobile Communicat ions AB
Emelie Jönsson
Master´s thesis at the department of Design Science, LTH
Supervisor LTH: Joakim Eriksson
Supervisor Sony Mobile: Rune Hvalsøe
i
ABSTRACT
The main purpose of this master´s thesis was to investigate how agile development and user-
centered design can be combined in a development process. The target development process
for this investigation was a development process at a section in the department Application
and Service at Sony Mobile Communications AB in Lund, Sweden.
The first goal of the thesis was to provide the section with a set of recommendations,
concerning how they further can combine agile development and user-centered design in
their development process. Furthermore, the section had started a pilot project concerning
usability testing with LTH (The Faculty of Engineering at Lund University), and therefore it
was interesting to know whether this gives something back in return on investment to the
development process. Consequently, this was the second goal of the thesis.
In order to fulfill the purpose and goals of the thesis a case study was performed. The
performance resulted in an examination, evaluation and analysis regarding the current
development process. The method used in the case study was ethnographical and the
development teams at the section were used as reference material. Moreover, to be able to
investigate the potential return on investment for the usability tests both development teams
and test persons attending the test sessions were used as reference material.
The result of the case study revealed a return on investment for the started usability tests and
this investment the development teams most benefits from. The benefit of the development
teams, especially the developers and product owners, is the increase of awareness towards
user experience questions and usability questions. Furthermore, the examination, evaluation
and analysis of the current development process resulted in five recommendations of how
the development process at the section further can combine agile development and user-
centered design. The outcome of these recommendations is that the current development
process needs to combine user-centered design by more involvement of usability evaluation
methods and end-users at an earlier stage.
ii
SAMMANFATTNING
Syftet med detta examensarbete var att undersöka hur agil utveckling och
användarcentrerad design kan kombineras i en utvecklingsprocess. Undersökningen baseras
sig på den utvecklingsprocess med Scrum som används på en sektion vid avdelningen
Applikationer och Service på Sony Mobile Communications AB i Lund, Sverige.
Det första målet med examensarbetet var att förse sektionen med ett antal förslag på hur de
kan förbättra sin utvecklingsprocess för att ytterligare kombinera agil utveckling och
användarcentrerad design. Eftersom sektionen nyligen har startat ett projekt angående
användbarhetstester med LTH (Lunds Tekniska Högskola) och kombinerar detta med deras
utvecklingsprocess, var det angeläget att undersöka om det ger någon nytta tillbaka till
utvecklingsprocessen. Därför var detta det andra målet med examensarbetet.
För att kunna uppnå syftet och målen med examensarbetet genomfördes en casestudie där
den nuvarande utvecklingsprocessen undersöktes, evaluerades och analyserades. Den metod
som användes i studien var etnografisk och teammedlemmarna i utvecklingsteamen på
sektionen användes som referensmaterial. För att undersöka användbarhetstesterna
användes både teammedlemmarna och de testpersoner som deltog i testerna som
referensmaterial.
Resultatet av studien visar att användbarhetstesterna som utförs på sektionen ger något
tillbaka och speciellt i ökad medvetenhet gällande användarupplevelsefrågor och
användbarhetsfrågor. Denna medvetenhetsökning berör speciellt utvecklarna och
produktägarna. När det kommer till undersökningen, evalueringen och analysen av den
nuvarande utvecklingsprocess som används på sektionen resulterade det i fem stycken
rekommendationer av hur processen ytterligare kan ta hänsyn till användarcentrerad design.
Det sammanlagda utlåtandet av rekommendationerna är att den nuvarande processen måste
i ett tidigare skedde kombinera användarcentrerad design genom att använda sig av fler
användbarhetsmetoder och slutanvändare.
iii
PREFACE
This thesis was carried out as a final part of my Master´s degree studies in Information and
Communication technology at the Faculty of Engineering (LTH), Lund University, in
collaboration with the company Sony Mobile Communications AB in Lund, Sweden. The
thesis corresponds to 30 ECTS, which equals one semester of work.
This thesis has provided me with valuable insight and I have gained much knowledge,
which will be undoubtedly aid for me in my future carrier. In order to accomplish this thesis
several persons have helped me throughout the duration of the thesis and for that I want to
thank the following persons:
My supervisor Joakim Eriksson at the Design Science institution, LTH, which helped and
supported me throughout the whole duration of this thesis, particularly with the report.
My supervisor Rune Hvalsøe at Sony Mobile Communications AB, who came up with the
idea and gave me the opportunity to conduct the thesis. He also gave me valuable input and
helped me remain on track during the progress of this thesis. For that I am very thankful.
Furthermore, I would like to thank the team members of the development teams at the
section who helped me by participating in different interviews, surveys and observations.
Also, a thank to the students from LTH who was a part of the usability test sessions
conducted at the section for helping me by answering the surveys.
I would also like to thank Alexander Triebe for helping me review the report.
Last but not least, I would like to thank my family, friends and acquaintances that followed
me during the whole education and supported me. Without you this would not be possible.
Thank you!
iv
TABLE OF CONTENTS
1. Introduction .................................................................................................................................. 1
1.1. Background ........................................................................................................................... 1
1.2. Sony Mobile Communications AB ..................................................................................... 2
1.3. Purpose and Research questions ........................................................................................ 2
2. Disposition .................................................................................................................................... 3
3. Theoretical background .............................................................................................................. 4
3.1. Agile development ............................................................................................................... 4
3.1.1. Agile Manifesto ............................................................................................................. 5
3.1.2. Scrum process ............................................................................................................... 7
3.2. Waterfall model .................................................................................................................... 9
3.3. User-centered design ......................................................................................................... 11
3.3.1. Definition of user experience .................................................................................... 12
3.3.2. Usability ....................................................................................................................... 12
3.3.3. Donald Norman´s design principles ........................................................................ 13
3.3.4. Shneiderman´s eight golden rules ............................................................................ 13
3.4. Usability evaluation methods ........................................................................................... 14
3.4.1. Prototypes .................................................................................................................... 15
3.4.2. Focus group ................................................................................................................. 15
3.4.3. Heuristic evaluation ................................................................................................... 15
3.4.4. Cognitive walkthrough .............................................................................................. 16
3.4.5. Usability testing .......................................................................................................... 16
3.4.6. Usability test environment ........................................................................................ 17
3.4.7. Think - aloud technique ............................................................................................. 18
3.4.8. Task scenario ............................................................................................................... 18
3.5. Requirement engineering .................................................................................................. 19
3.5.1. Quality requirements ................................................................................................. 19
v
3.6. System usability scale ........................................................................................................ 19
3.7. SWOT-analysis .................................................................................................................... 21
3.8. Cost-benefit evaluation ...................................................................................................... 21
3.9. Ethnographical methods ................................................................................................... 22
4. Related work on UCD in agile context ................................................................................... 23
4.1. User-centered design and agile development ................................................................ 23
4.1.1. Similarities and differences between UCD and agile ............................................ 23
4.1.2. Related practices ......................................................................................................... 25
4.2. Quality and agile development ........................................................................................ 28
4.2.1. Differences between traditional RE and A-RE ....................................................... 28
4.2.2. Related practices ......................................................................................................... 29
4.3. Effective development and scaling development .......................................................... 31
4.3.1. Scaling Agile ................................................................................................................ 31
4.3.2. Think it, Build it, Ship it and Tweak it .................................................................... 32
4.3.3. Closing The Loop ........................................................................................................ 34
5. Case study ................................................................................................................................... 35
5.1. Method ................................................................................................................................. 35
5.1.1. Ethnographical methods used in the case study .................................................... 36
5.1.2. Method for first phase ................................................................................................ 37
5.1.3. Method for second phase .......................................................................................... 38
5.1.4. Method for third phase .............................................................................................. 38
5.1.5. Method for fourth phase ............................................................................................ 39
5.1.6. Method for the evaluation of return on investment .............................................. 39
5.2. Result .................................................................................................................................... 40
5.2.1. Result from first phase ............................................................................................... 40
5.2.2. Result from second phase .......................................................................................... 48
5.2.3. Result from third phase ............................................................................................. 50
vi
5.2.4. Result from fourth phase ........................................................................................... 55
5.2.5. Return on investment for current usability test ..................................................... 58
5.3. Discussion ............................................................................................................................ 65
5.3.1. Discussion regarding the used ethnographical methods...................................... 65
5.3.2. Discussion regarding the result from case study ................................................... 66
6. Conclusion and Further work .................................................................................................. 70
6.1. Conclusion regarding the study ....................................................................................... 70
6.2. Further work regarding the study ................................................................................... 72
7. References ................................................................................................................................... 73
Appendix A: System usability scale survey ................................................................................... 76
Appendix B: Data from system usability scale ............................................................................... 78
Appendix C: Survey for the observers at UX tests ........................................................................ 80
Appendix D: Data from survey with observers ............................................................................. 82
Appendix E: Survey for usability test .............................................................................................. 83
Appendix F: Data from usability test survey ................................................................................. 85
Appendix G: Manuscript for cost-benefit ....................................................................................... 86
Appendix H: Data from cost-benefit evaluation ............................................................................ 88
vii
TERMINOLOGY
LTH = The Faculty of Engineering at Lund University.
Sony Mobile = Sony Mobile Communications AB.
PO = Product owner.
CTL = Closing The Loop.
GA = Google Analytics.
Usability process = Concerns the whole process that considers usability and user experience.
From the design phase to the last sprint of the development phase.
Usability test = Concerns the recently started pilot project concerning usability test in
cooperation with LTH.
UCD = User-centered design.
Observers = this term concerns the development team members when they are attending the
usability test sessions.
Test persons = this terms concerns the LTH students that are attending the usability test
sessions.
1
1. INTRODUCTION
Over the last decade the agile development process (further described in chapter 3.1) has
increased in popularity and is today used to quickly and effectively develop a product which
requires short time–to-market. Therefore, agile development methods are often used in the
mobile phone branch where time-to-market is crucial. When developing a mobile phone that
nowadays is used by almost all ages in the society it is important to consider user-centered
design inform of usability, user experience and quality. This is important because the phone
should be accessible for anyone. Though, it is necessary to combine user-centered design and
agile development in a development process to receive a product that possesses a high
quality of user experience.
1.1. BACKGROUND
Agile development and user-centered design are two approaches that have been used for a
time in the industry to assure that the implemented product achieves high quality. Though,
their common goal is to provide the customer with a product of high quality the process to
achieve this diverse. The key difference between them is that in agile development the
product is built in increments and each increment is developed in iterations. These iterations
contain all steps that regularly are done after each other in other development processes. The
focus in agile development is strongly on building a product with outstanding functionality,
and this is performed with closely collaboration with the customer. While in user-centered
design (UCD) the focus is too early in the process involve the end-user of the product by
performing different kinds of usability evaluation methods (UEM: s) to ensure that the
product fulfills the end-user’s needs.
The initiator of this thesis, Sony Mobile Communications AB, works according to the agile
development method Scrum (presented in chapter 3.1.2). In their development process it is
important to be quick and effective to the market in order to compete with their competitors.
Another important aspect of their development process is to ensure that the developed
product gives the user the right user experience and quality to ensure that they choose their
phones instead of the competitors. Though, they wish to accomplish this there is one
disadvantage with the development method used at Sony Mobile, namely that the agile
development method Scrum does not support usability process in the same extent as user-
centered design.
It is from this disadvantage the thesis has its background and the objective of this thesis is to
investigate how the current development process at a section of the department Application
and Service can further combine agile development with user-centered design.
2
1.2. SONY MOBILE COMMUNICATIONS AB
Sony Mobile Communications AB was founded 2012 and is the former joint venture between
Sony and Ericsson, Sony Ericsson. Today, the company is a subsidiary of the Tokyo based
company Sony Corporation. The company Sony Mobile´s vision is to deliver the best of Sony
technology through the Xperia™ smartphones and tablet portfolio. The smartphones and
tablets are developed with use of the Android platform which is an open platform owned by
Google Inc. and where they are the leading developer of the platform.
1.3. PURPOSE AND RESEARCH QUESTIONS
The purpose of this master´s thesis is to investigate how user-centered design with regard to
usability, user experience and quality requirements can be integrated into the agile
development process. To be able to understand how this can be combined, a case study will
be performed in a section at Application and Services located at Sony Mobile
Communications AB in Lund, where their current agile development process is used as a
reference. In order to answer this question, the current development process which includes
the usability process, at the section needs to be examined, evaluated and analysed.
Furthermore, the recently started pilot usability tests in collaboration with LTH (The Faculty
of Engineering at Lund University) shall also be evaluated and analysed in terms of return
on investment. The purpose of the return on investment is to evaluate if the two
development teams at the section will increase their awareness towards user experience and
usability and also to investigate if the tested applications will increase in user experience and
usability.
The goals of the case study are to provide the section with a prioritized list of
recommendations of how they can improve their development process, and provide the
section with an evaluation if the usability tests give a return on investment.
In order to conduct a case study with the purpose and goals described above the following
main question needs to be answered:
How can user-centered design in terms of user experience, usability and quality be
integrated into agile development?
To be able to answer this main question the following sub questions needs to be investigated
by the case study:
1. Which proposals exist in industry to achieve an integration of user-centered design
and agile development?
2. How can the current development process at the section be improved?
3. Does the quality of the tested applications improve in terms of usability and user
experience when usability testing is integrated into the development process?
4. Does the awareness of the development teams regarding usability and user
experience increase if user tests are integrated into the development process?
3
2. DISPOSITION
THEORETICAL BACKGROUND
This chapter describes the theory collected for the case study. This includes theory about the
main areas agile development, user-centered design, usability evaluation methods and
requirement engineering.
RELATED WORK ON UCD IN AGILE CONTEXT
This chapter contains the literature review that was performed in the area user-centered
design and agile development. The literature is based on projects which have been
established in different companies in the same or similar industries.
CASE STUDY
The chapter contains a description of how the case study was performed and the result of the
case study. Furthermore, a short discussion regarding the outcome of the case study is also
presented.
CONCLUSION AND FURTHER WORK
The research questions that were established in the beginning are answered here and also a
discussion regarding further work is presented.
REFERENCES
References that were used in the study can be found in this chapter.
APPENDIX
This chapter contains all appendices for the study.
4
3. THEORETICAL BACKGROUND
This chapter describes the theory framework of this study. The chapter serves as an
introduction to the main areas agile development, user-centered design, usability evaluation
methods and requirement engineering. The reader is assumed to possess some basic
knowledge of these areas, even though a simple and brief description of them follows below.
3.1. AGILE DEVELOPMENT
Agile development approaches evolved in the 1990: s as a reaction to the more documents –
driven methods, especially the waterfall approach (Jalote, 2008). The term agile development
is an umbrella term for different kinds of agile methods, such as:
Crystal techniques,
Atern (former DSDM)
Feature-driven development,
Scrum and
Extreme Programming (XP).
Agile methods have the characteristics that they are iterative, focus on team work,
collaboration between customer and development team and also feedback from customer
throughout the development lifecycle. The key difference between agile development and
more heavily-driven development is that in agile development things like requirements and
solutions to different problems will evolve through the development process.
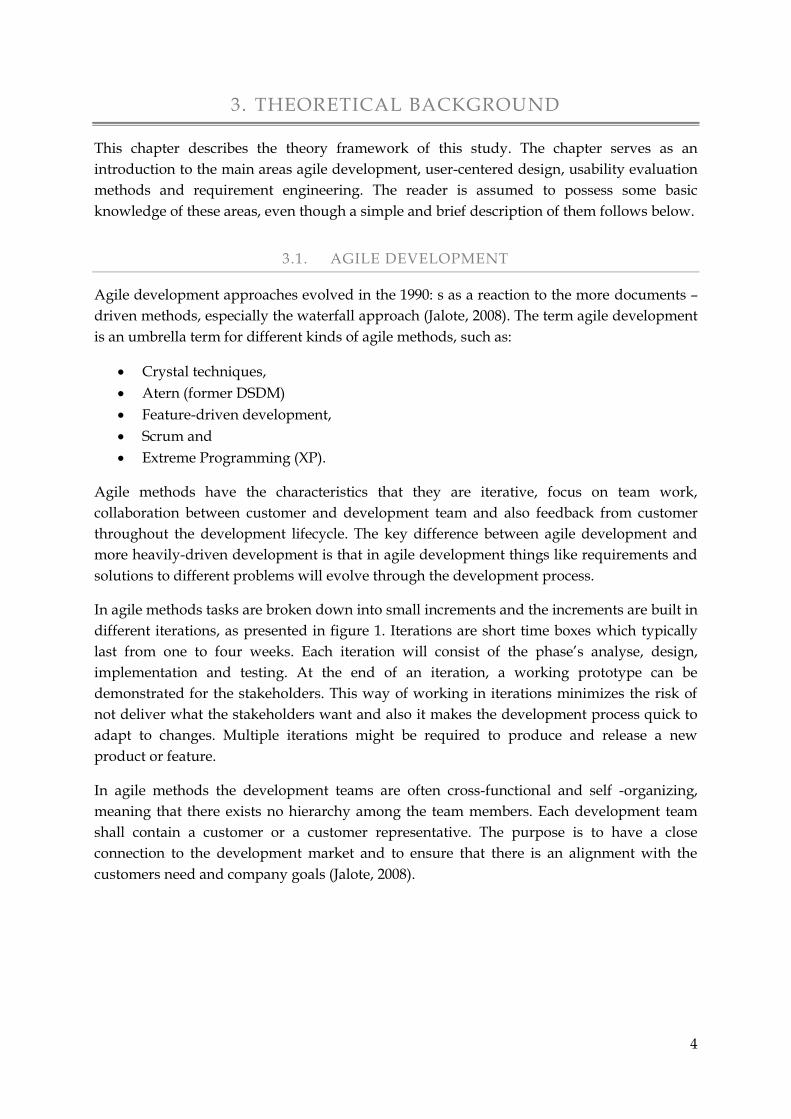
In agile methods tasks are broken down into small increments and the increments are built in
different iterations, as presented in figure 1. Iterations are short time boxes which typically
last from one to four weeks. Each iteration will consist of the phase’s analyse, design,
implementation and testing. At the end of an iteration, a working prototype can be
demonstrated for the stakeholders. This way of working in iterations minimizes the risk of
not deliver what the stakeholders want and also it makes the development process quick to
adapt to changes. Multiple iterations might be required to produce and release a new
product or feature.
In agile methods the development teams are often cross-functional and self -organizing,
meaning that there exists no hierarchy among the team members. Each development team
shall contain a customer or a customer representative. The purpose is to have a close
connection to the development market and to ensure that there is an alignment with the
customers need and company goals (Jalote, 2008).
5
FIGURE 1: AN OUTLINE OF HOW AGILE DEVELOPMENT WORKS.
3.1.1. AGILE MANIFESTO
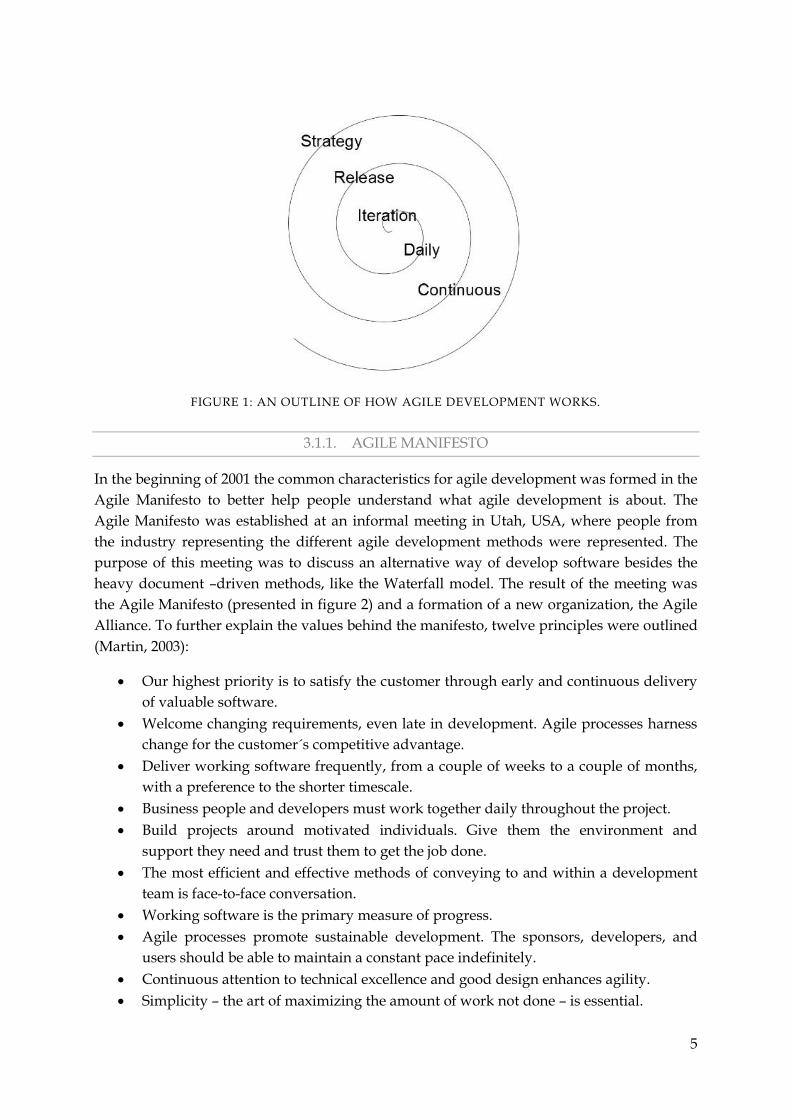
In the beginning of 2001 the common characteristics for agile development was formed in the
Agile Manifesto to better help people understand what agile development is about. The
Agile Manifesto was established at an informal meeting in Utah, USA, where people from
the industry representing the different agile development methods were represented. The
purpose of this meeting was to discuss an alternative way of develop software besides the
heavy document –driven methods, like the Waterfall model. The result of the meeting was
the Agile Manifesto (presented in figure 2) and a formation of a new organization, the Agile
Alliance. To further explain the values behind the manifesto, twelve principles were outlined
(Martin, 2003):
Our highest priority is to satisfy the customer through early and continuous delivery
of valuable software.
Welcome changing requirements, even late in development. Agile processes harness
change for the customer´s competitive advantage.
Deliver working software frequently, from a couple of weeks to a couple of months,
with a preference to the shorter timescale.
Business people and developers must work together daily throughout the project.
Build projects around motivated individuals. Give them the environment and
support they need and trust them to get the job done.
The most efficient and effective methods of conveying to and within a development
team is face-to-face conversation.
Working software is the primary measure of progress.
Agile processes promote sustainable development. The sponsors, developers, and
users should be able to maintain a constant pace indefinitely.
Continuous attention to technical excellence and good design enhances agility.
Simplicity – the art of maximizing the amount of work not done – is essential.
6
The best architectures, requirements, and designs emerge from self-organizing teams.
At regular intervals, the team reflects on how to become more effective, then tunes
and adjusts its behavior accordingly.
FIGURE 2: THE AGILE MANIFESTO FROM THE AGILE ALLIANCE.
7
3.1.2. SCRUM PROCESS
As the reader already noticed, developing according to Scrum is developing according to
agile principles. A Scrum development team is a rather small team and typically consists of
5-10 developers. Originally, the name Scrum comes from the Rugby Scrum, where it is
desirable that everybody in the pack acts together with everyone else in the team to move the
ball down the pitch (Rising and Janoff, 2000).
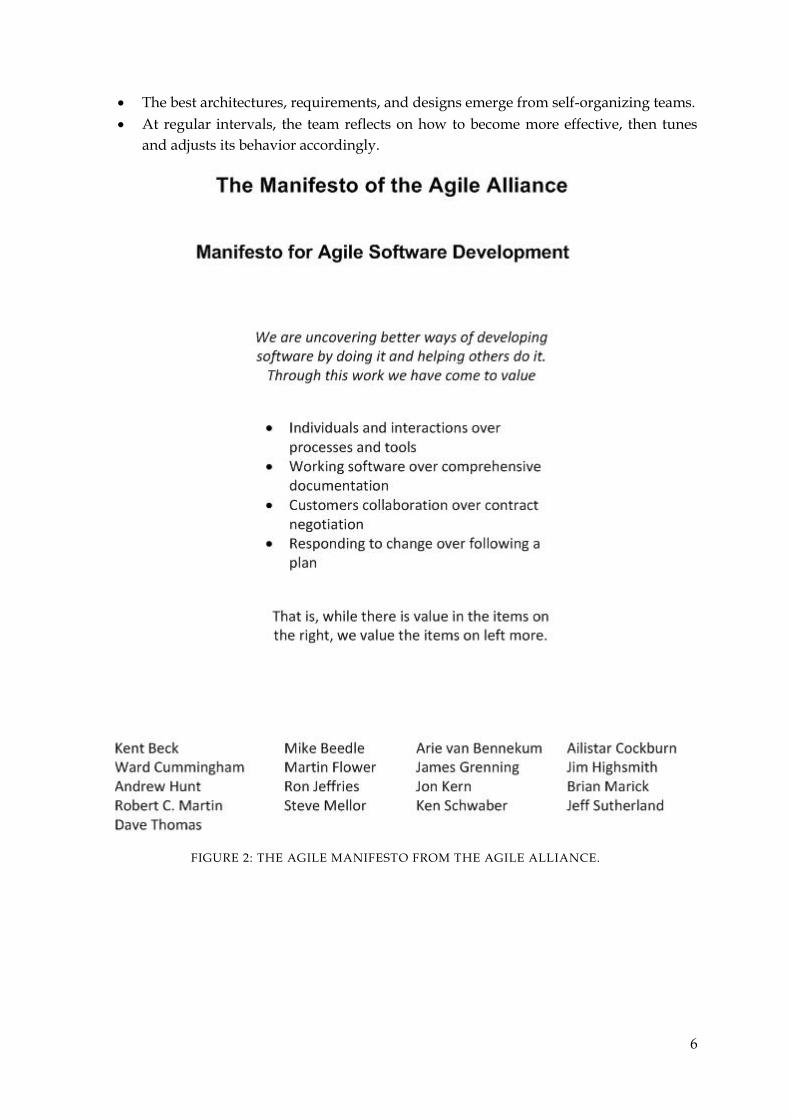
A Scrum development process (as the one in figure 3) consists of a number of sprints; sprints
are series of short development phases that delivers the product incrementally. Typically, a
sprint will be 2 weeks long and contain a sprint backlog, a sprint backlog consists of the tasks
(items) that the teams shall implement during the sprint. The tasks stated in the sprint
backlog are the most prioritized one from the product backlog. The product backlog is a list
created by the product owner (PO) with all tasks that shall be implemented during all the
sprints in the development process. A sprint is time-boxed, hence end date of the sprint does
not change. However, a team can reduce the number of tasks that shall be delivered at the
end of the sprint, though not the end date of the sprint (Hughes and Cotterell, 2009).
FIGURE 3: A SCHEMATIC SKETCH OF THE GENERAL STRUCTURE OF THE SCRUM PROCESS.
3.1.2.1. THE ROLES OF THE SCRUM PROCESS
Scrum defines three roles for the project, product owner (PO), development team and scrum
master.
In Scrum the responsibility of the product owner (PO) is to represent the customer
(stakeholder) in the project. Another responsibility for the PO is to make sure that the
product produced in the project is of great value for the customers. As mentioned before, it is
also PO´s responsibility to conduct the product backlog and organize the different task in
such order that the tasks with the highest customer value have a high prioritization.
The development team is responsible for developing the different task. The team does this in
a self-organized and self-managed fashion (Schwaber, 2004). This means that their
responsibility is to take a number of tasks from the product backlog and implement them in
the next coming sprint.
8
The scrum master´s responsibility is the Scrum process. The scrum master makes sure that
everyone involved in the project understands and follows the Scrum process.
3.1.2.2. THE TWO ARTIFACTS IN THE SCRUM PROCESS
In Scrum one of the artifacts is the product backlog. This is a prioritized list, often described as
a TODO-list, where the entire tasks for the project are gathered. As declared before it is the
product owner who is responsible for the product backlog. All tasks (items) in the product
backlog should contain an estimation of how long it will take to implement them. The
estimation is done in cooperation with the development team. The product backlog is
constantly updated through the entire project (Schwaber, 2004).
The other artifact in the Scrum process is the sprint backlog. The sprint backlog contains the
tasks that shall be implemented during the following sprint. Each task in the sprint backlog
is estimated and if the estimation is too large it is considered as a place holder (show stopper)
until it is broken into smaller tasks. Only the team is allowed to change and add tasks to the
sprint backlog, the reason for this are that it contains the definition of delivery that the team
has committed to deliver (Schwaber, 2004).
3.1.2.3. TERMINOLOGI IN SCRUM
Spikes:
Spikes are time-boxed events in agile development and are also used in Scrum. The purpose
of a spike is to have a research environment in the agile development process, where for
example prototypes are implemented.
A spike will typically take place as a user story in the sprints and is often introduced before a
large task shall be implemented, in order to secure budget and expand knowledge around
the task. The duration of a spike can vary from between a few hours to days and this
decision is taken by the product owner in cooperation with the development team. It is
important that a spike is no longer in time then estimated, because in Scrum and other agile
process the purpose is to deliver tangible values before documentation (Schwaber, 2004).
Burn down chart:
A burn down chart is a graphical representation of how much work there are left versus time
left in the sprint. A burn down chart is useful for predicting when all work will be completed
and where to put in more resources to insure that the task are done before the sprint ends.
User story:
A feature which is added to the product backlog is commonly referred to as a (user) story.
The stories often have a common structure that is in the general from: “As a <user type> I
want to <do some action> so that <desired result>”. It is important that a story is INVEST
which means that the story is Independent, Negotiable, Valuable, Estimable, Small, Testable
requirement.
9
Epic:
An epic is a group of related stories. Epics are often used in the backlog to structure features
that not yet have been analysed and broken down into stories.
Story points:
Story points are used to discuss the difficulty of the story, without assessing actual hours. A
common used scale for this is the clothes size (S, M, L, XL).
Tasks:
Tasks are added to the story in the beginning of each sprint, usually at the sprint planning.
Tasks are used to break down the user story into smaller task of what is going to be
implemented to achieve the user story.
Definition of Done:
Definition of Done (DoD) is another term for the exit-criteria. Implying that DoD defines
when the item of the product backlog is completed.
Backlog grooming:
The purpose of backlog grooming is to estimate the existing backlogs items by the use of
effort/points. At each sprint the team should spent some time with backlog grooming in
order to refine the acceptance criteria for each individual story.
3.2. WATERFALL MODEL
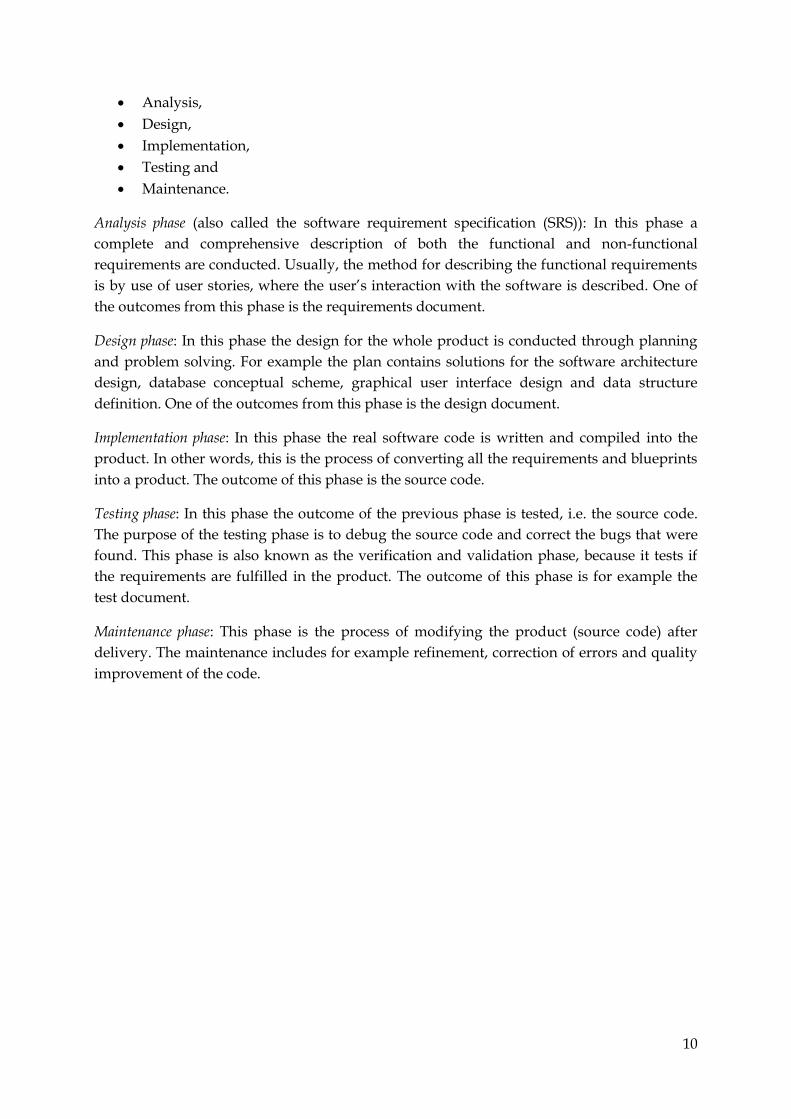
The software development method Waterfall model (presented in figure 4) was introduced
in the 1970 by Winston W. Royce. Nowadays, the model is still widely used in the software
development world, although lately agile methods have become more popular than before.
The name Waterfall model comes from the fact that it is a sequential development method in
which the process is flowing downwards like a waterfall down a hillside. The basic idea
behind the model is that each phase will have separate concerns, i.e. each phase deals with a
distinct and separate set of concerns (Jalote, 2008). Separating the concerns and focusing on a
few task in each phase makes it easier to handle complexity both for the engineers and
managers. The circumstance that the model separates concerns and a deal with them in
diverse phases and by this creates natural milestones is one of the key factors for its success.
Therefore, it is often favored by higher management (Hughes and Cotterell, 2009).
As the reader already noticed the Waterfall model defines several different phases, where
each phase must be completed before moving on to the next phase. The input to the
following phase is the output from the previous, consequently the next phase cannot begin
before the previous one is completed. The outputs from the previous phase are often called
work products. The model has five phases (Bassil, 2011):
10
Analysis,
Design,
Implementation,
Testing and
Maintenance.
Analysis phase (also called the software requirement specification (SRS)): In this phase a
complete and comprehensive description of both the functional and non-functional
requirements are conducted. Usually, the method for describing the functional requirements
is by use of user stories, where the user’s interaction with the software is described. One of
the outcomes from this phase is the requirements document.
Design phase: In this phase the design for the whole product is conducted through planning
and problem solving. For example the plan contains solutions for the software architecture
design, database conceptual scheme, graphical user interface design and data structure
definition. One of the outcomes from this phase is the design document.
Implementation phase: In this phase the real software code is written and compiled into the
product. In other words, this is the process of converting all the requirements and blueprints
into a product. The outcome of this phase is the source code.
Testing phase: In this phase the outcome of the previous phase is tested, i.e. the source code.
The purpose of the testing phase is to debug the source code and correct the bugs that were
found. This phase is also known as the verification and validation phase, because it tests if
the requirements are fulfilled in the product. The outcome of this phase is for example the
test document.
Maintenance phase: This phase is the process of modifying the product (source code) after
delivery. The maintenance includes for example refinement, correction of errors and quality
improvement of the code.
11
FIGURE 4: THE CLASSIC WATERFALL MODEL.
As mentioned before the Waterfall model is widely used, although it has some strong
limitations. The key limitations are (Jalote, 2008):
In the model it is assumed that the requirements of a system can be frozen before the
design phase begins,
The model follows the “big bang” approach, which means that the entire software is
delivered in one shot at the end,
The model encourages “requirements bloating”. Since all requirements must be
specified at the start and what is specified will be delivered and
It is a document-driven process that requires formal document at the end of each
phase.
3.3. USER-CENTERED DESIGN
User – centered design (UCD) is an umbrella term for a diverse set of processes, methods
and procedures that are used to designing usable products that will achieve high quality of
user experience and usability (Rubin and Chisnell, 2008). The term user-centered design is
just one of many names for the same design approach, and additional names are human
factors engineering, ergonomics and usability engineering. The definition of user-centered
design is not unambiguous and the definition presented below is from The International
Organization of Standardization (ISO 9241):
12
“USER-CENTERED DESIGN IS CHARACTERIZED BY THE
ACTIVE INVOLVEMENT OF USERS AND A CLEAR
UNDERSTANDING OF USER AND TASK REQUIREMENTS, AN
APPROPRIATE ALLOCATION OF FUNCTION BETWEEN
USERS AND TECHNOLOGY; THE ITERATION OF DESIGN
SOLUTIONS; MULTI-DISCIPLINARY DESIGN”.
According to ISO 9241 user-centered design philosophy is achieved if the user is in the center
of the development process and the following bullets are embraced:
Early focus on users and their task,
Evaluation and measurements of product usage and
Iterative design and testing.
3.3.1. DEFINITION OF USER EXPERIENCE
Before describing usability it is in order to describe the difference between usability and user
experience. Hence, user experience and usability are often comprehended as
interchangeable, which is incorrect. When considering the term user experience the term
involves more dimensions of the users experience when using the product, such as the user’s
entire interaction with the product. This experience includes for example the thoughts,
feelings and perception that result from the interaction (Tullis and Albert, 2008). However,
usability is one of the dimensions in user experience and is further described below.
3.3.2. USABILITY
Although, usability is a widely used term the definition of usability is not unambiguously.
For example the International Organization for Standardization (ISO) and usability experts
has come up with their own definition. The definitions presented below are from ISO 9241-11
and from the famous usability expert Jakob Nielsen.
The definition of usability is according to the ISO standard (ISO 9241-11):
“THE EXTENT TO WHICH A PRODUCT CAN BE USED BY
SPECIFIED USERS TO ACHIEVE SPECIFIED GOALS WITH
EFFECTIVENESS, EFFICIENCY, AND SATISFACTION IN A
SPECIFIED CONTEXT OF USE”.
Many usability experts including the famous Jakob Nielsen think this definition is a bit
formal and difficult to comprehend. Hence, Nielsen has defined usability as follows (Nielsen,
2013):
“USABILITY IS A QUALITY ATTRIBUTE THAT ASSESSES HOW
EASY USER INTERFACE IS TO USE”.
13
To substance his definition Nielsen also quantified five quality components that shall be
fulfilled in a usable product. The five components are:
Learnability: How easy it is for users to accomplish basic tasks the first time they encounter
the design?
Efficiency: How quick can the user perform task, when they know the design?
Memorability: When users return to the design after a period of time not using it, how easily
can they reestablish proficiency?
Errors: How many errors do users make, how severe are these errors, and how easily can
they recover from the errors?
Satisfaction: How pleasant is it to use the design?
3.3.3. DONALD NORMAN´S DESIGN PRINCIPLES
Donald A. Norman is a well-known usability expert and in his popular book “The Design of
Everyday things” (Norman, 2002) he describes how a product should be designed to achieve
usability. The most essential usability factors according to Norman are summarized below:
Feedback is accomplished to the user if the product sends back information of what actions
has been done and which result has been accomplished by this action.
Visibility is attained if the right functions are visible for the user and if things that are not
acquired for the situation are hidden deeper down in the design structure.
Affordance implies that the functions should be designed and implemented in such way that
they give the user a clue of how they should be used.
Mapping aims to when a function gives the user the right mental model, meaning that the
function reflects what will happen when it is used.
Constraints imply that the number of available actions should be limited so the problem of
making errors is reduced. This can for example be achieved by gray out functions that are
not usable in a specific occasion.
3.3.4. SHNEIDERMAN´S EIGHT GOLDEN RULES
Shneiderman and Plaisant provide in their book “Designing the user interface” eight golden
rules that can be applied for all user interfaces (Shneiderman and Plaisant, 2010). These eight
golden rules are summarized below.
Strive for consistency:
Similar situations should result in consistent sequence of actions. Meaning that items such as
terminology, icons, color and fonts should be consistent throughout the product.
14
Cater to universal usability:
The product shall be usable for different kinds of users. This means that both novice and
expert user should find a pleasure in using the product.
Offer informative feedback:
The product should give some sort of feedback for every action performed by the user. The
type of feedback depends on which action the user has performed.
Design dialogs to yield closure:
Sequences of actions that are required to perform different tasks should be organized into a
group of actions with a beginning, middle and end.
Prevent errors:
The product shall be designed in such way that the user is prevented from doing major
errors. This can be achieved with for example gray out items that are not appropriate in the
specific situation.
Permit easy reversal of actions:
Actions performed by the user shall as much as possible be reversible by the user. This will
relieve the anxiety of the user, since the user knows that a possible error can be undone.
Support internal locus of control:
The users should feel that they are in charge over the product and not that the product is in
charge over them.
Reduce short-term memory load:
The product shall not force the user to remember any piece of information that will overload
the short-term memory load. Humans have a limited capacity for information, seven plus
minus two chunks, when it comes to short-term memory load.
3.4. USABILITY EVALUATION METHODS
The objective for perform usability evaluation methods (UEM: s) is to comprehend if the
tested product archives high quality of user experience and usability. There are a set of
different usability evaluation methods and they all have their advantages and drawbacks in
different parts of the development cycle. Some of them are more appropriate in the
beginning and some more towards the end of the development cycle.
The methods that are referred to in the case study are described below, but first different
kinds of prototypes are described often employed in usability evaluation methods.
15
3.4.1. PROTOTYPES
Different stages of a prototype are often used when performing some sort of usability
evaluation method. A prototype can be everything from a scale model to software that is still
in its beta stage. A prototype is also very helpful when performing different usability
evaluation methods since it will help out when discussing different design proposals. It is
also an effective way to try out new ideas. There are two stages of how a prototype can be
conducted, low-fidelity and high fidelity (Rubin and Chisnell, 2008).
Low- fidelity: Often a low-fidelity prototype does not look anything like the final product
regarding the final design. It is usually created as a simple sketch with pen and paper or
sometimes a simple implementation of how the final interface might look like, but with very
limited functionality. This type of prototype is often used in early design stages of the
development lifecycle and is used to explore different ideas and discuss them. The
advantage of this type of prototype is that it is often simple, easy and cheap to conduct.
High-fidelity: Compared to low-fidelity, high-fidelity is a prototype that resembles the final
prototype a lot more. Also, making a high-fidelity prototype is a lot more expensive, but the
result is fully interactive and has often the look and feel of the final product. It is important
that high-fidelity prototypes are created after low-fidelity. The reason for this is that they are
so expensive to conduct and therefore low-fidelity prototypes should be conducted before.
3.4.2. FOCUS GROUP
Focus groups are used to discuss ideas and expectations from different stakeholders in a
project, such as end-users and distributors. It promotes people to come up with problems in
their current process and to find ideal solutions for these problems. Focus groups are usually
used in early design and implementation stages and often involve 6 to 18 people who are
representing a variety of the stakeholders. A session usually last between one to five hours.
A focus group is led by a moderator who starts each session by introducing the system
(product) that is to be discussed. Participants of the session are encouraged to discuss their
own experiences with the system, not considering if it is positive or negative experience. The
next step in the session is to discuss solutions to the negative experiences. After this the third
and last step is to prioritize the different solutions that have been raised during the session
(Lauesen, 2002).
3.4.3. HEURISTIC EVALUATION
Heuristic evaluation is a sort of expert review of a product (system), where a specific set of
guidelines are followed. The usability expert Jakob Nielsen conducted 10 guidelines for what
to think about when heuristic evaluations are conducted. The originally ten guidelines are
(Barnum, 2011):
16
1. Visibility of system status,
2. Match between system and the real world,
3. User control and freedom,
4. Consistency and standards,
5. Error preventing,
6. Recognition rather than recall,
7. Flexibility and efficiency of use,
8. Aesthetic and minimalist design,
9. Help users recognize, diagnose and recover from errors and
10. Help and documentation.
Conducting a formal heuristic evaluation requires three to five evaluators. Each evaluator
independently reviews the product at least two times, one to become familiar with the
product and a second time to inspect the product according to the ten heuristic guidelines.
The result of each evaluation is then discussed in a meeting and every issue find is rated on a
severity scale. A typical used severity scale is:
Catastrophe,
Major problem,
Minor problem and
Cosmetic problem.
According to research, heuristic evaluation finds about 70-80 percent of the major usability
problems and is therefore a good approach to use when real users are not an option.
Although, the disadvantage is that they only finds the major usability problems and often
oversees the problems that the user finds most problematic. This usability evaluation method
can preferably be used during the whole development lifecycle (Rubin and Chisnell, 2008).
3.4.4. COGNITIVE WALKTHROUGH
Cognitive walkthrough is another sort of review where a member of the team or company
which develops the product stands in for the real user. A moderator walks through the
design principles of the product and any issue identified by the member is recorded. This
review can also be conducted in the entire development cycle, both on low-fidelity
prototypes and high –fidelity prototypes (Rubin and Chisnell, 2008).
3.4.5. USABILITY TESTING
Usability testing is one of the most used techniques when it comes to usability evaluation
methods. The key advantage of this methods compared to the other is that this method uses
real users when the product is tested (Barnum, 2011).
Usability testing can be performed in different stages of the development process and
depending of which stage they are conducted the name of the test differs. The usability tests
described below are the ones used in the case study.
17
3.4.5.1. FORMATIVE TEST
Formative test1 is conducted quite early in the development lifecycle of the product. The time
for formative test is often in preliminary stages of design and implementation. The main
reason for conducting formative test is to explore the effectiveness of the preliminary design
or implementation. The layout for formative usability testing is informal, the reason for this
is that there are often collaboration between test moderator and test person.
Formative testing can either be done in horizontal representation or vertical representation.
Horizontal representation means that the user can interact either to left or right in the
product but is limited in moving deeper in the product. Vertical representation is the other
way around, which means that the user can move several layers down in the product but not
so much to right or left (Rubin and Chisnell, 2008).
Formative testing can be seen as a test that can be done quite fast and easy. The essential
elements for this type of tests are:
A few (2-3) question,
3 -5 users,
Task-based scenarios and
Use of think-aloud method.
3.4.5.2. COMPARISON TEST
Comparison test2 can be done any time in the products development lifecycle. The purpose
of comparison test is to compare different products with each other. Often, when performing
comparison test different prototypes (i.e. different designs of a user interface) are used to
understand which of them that is best. However, the best design of the user interface often
turns out to be a combination of the different prototypes. Therefore, this is a good method
for better understand the advantages and disadvantages of the different prototypes and then
make a hybrid of the best from each alternative (Rubin and Chisnell, 2008).
3.4.6. USABILITY TEST ENVIRONMENT
As the reader may know there are a set of different usability test environments that can be
employed when performing usability test. The one further described is the classic testing
laboratory setup and this environment was also used in the case study.
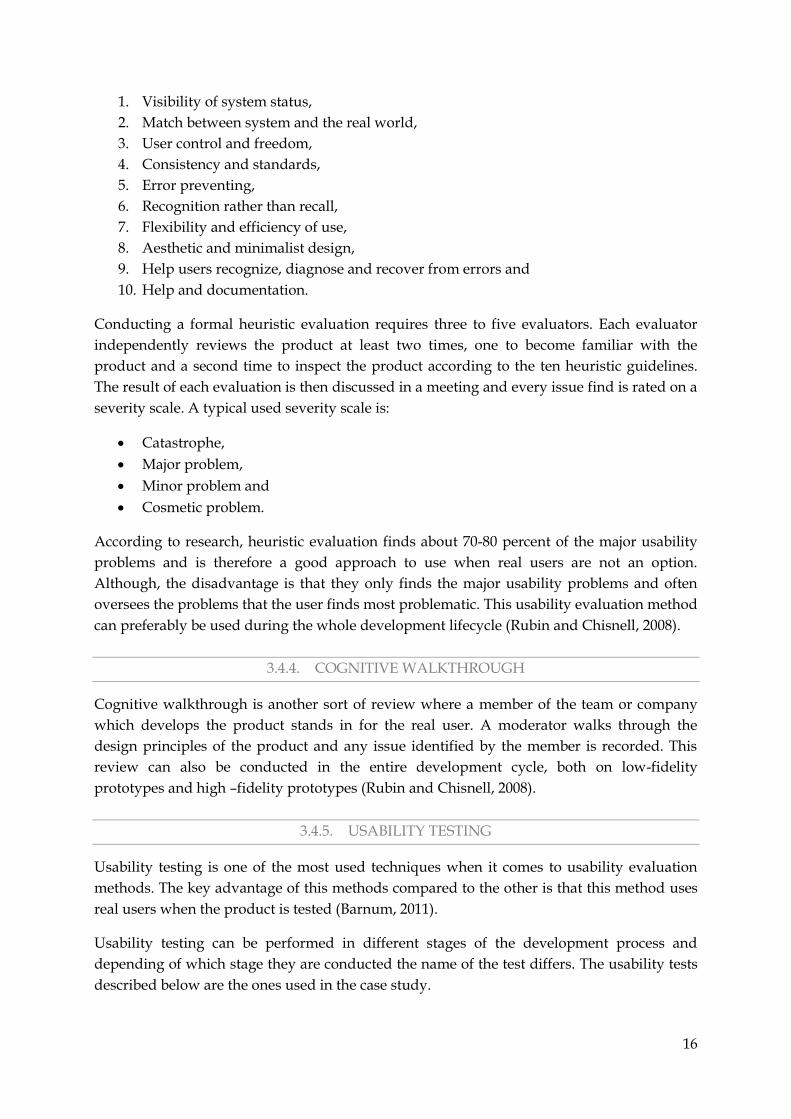
The classic testing laboratory setup consists of one room designated as the test room and a
second room designated as an observation and control room, as presented in figure 5. The
test session is performed in the test room and in more formative usability tests (as the one
performed) the test moderator is in the room. In the observation room a few observers are
watching the test and takes notes of what problems the user is encountering when
1 Formative test is sometimes also referred to as exploratory test. 2 Comparison test is sometimes also referred to as competitor test.
18
performing the task scenarios. Between the two rooms (that are next to each other) there are
a one way mirror and a soundproof wall.
FIGURE 5: A SKETCH OF THE CLASSIC LABORATORY TESTING ROOM.
3.4.7. THINK - ALOUD TECHNIQUE
To capture what the test person thinks regarding the product that is tested the think-aloud
technique can be used. The basic idea behind the technique is that the test person should
think loud when performing the different task scenarios with the product. Meanwhile, the
observers shall hear what pleases, frustrates and confuses the participants while they are
performing a specific task.
The advantage of the technique is that often that observers increase their knowledge of what
is usable and what is less usable by using the technique. The disadvantage of this technique
is that for the test person this is in an unnatural situation and it may take more time to
complete the task when think- aloud method is used (Barnum, 2011).
3.4.8. TASK SCENARIO
Task scenarios are often used to describe the context around the performed task. When
conducting task scenario it is essential that it describes: the state that the product should
initial have and the result that the participant will strive to achieve. Task scenarios can either
be distributed or read to the test person.
19
3.5. REQUIREMENT ENGINEERING
When declaring how usable a product shall be it is often done by the use of requirements.
Requirements are separated in to two main categories, namely functional requirements and
quality (non-functional) requirements. Usability requirements are a part of the quality
requirements and according to Lauesens´s book (Lauesen, 2002) quality requirements specify
how well the system must perform its functions. For example how fast it must respond, how
easy it must be to use, how secure it must be to attacks etc. Hence, functional requirements
specify how data is to be used, how it is recorded, computed, transformed, updated and
transmitted in the system (product). The key difference between functional and quality
requirements is according to Lauesen that quality requirements are not only software
requirements, but requirements for the entire system, in contrast to functional requirements.
3.5.1. QUALITY REQUIREMENTS
Quality requirements are often less concerned when there is no time left in the development
lifecycle, and this is the case when having market-driven development. Though, quality
requirements consist of a broad view of different categories that are important to consider
when developing a product (Regnell and Brinkkemper, 2005). According to ISO 9126 quality
requirements consists of the following main categories:
Functionality: This term includes quality factors such as security, accuracy and
interoperability.
Reliability: How frequently the system malfunctions, for example MTBF = Mean Time
Between Failures.
Usability: How easy it is to use the system (application), how efficient it is for carrying out
day to day tasks etc.
Maintainability: How easy it is to locate and repair errors.
Portability: How easy it is to reuse parts of the system (application) in other systems
(applications).
Suitability: Whether the system (application) adequately support the user tasks.
Compliance and Conformance: How well the system (application) fulfills domain standards and
technical standard.
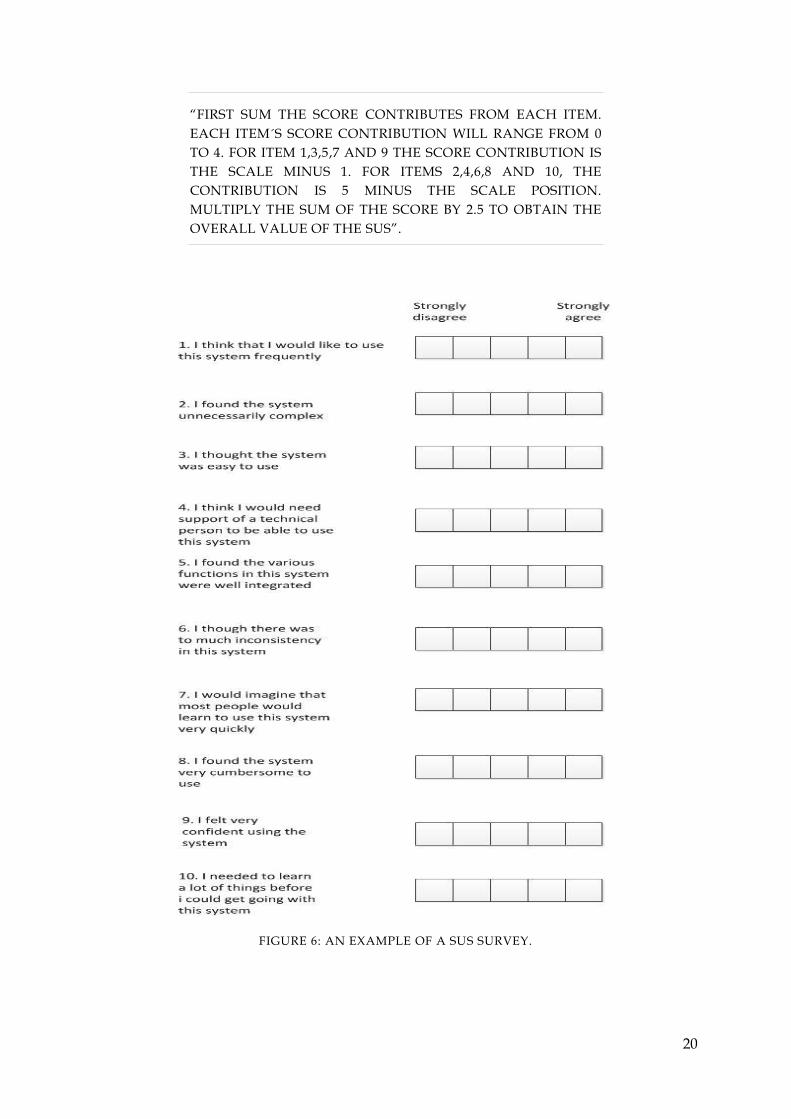
3.6. SYSTEM USABILITY SCALE
In order to determine if the product has increased in user experience and usability the
System Usability Scale (SUS) can be used, see figure 6. The SUS was invented by John Brook
in 1996 and has since then been used to quickly and fast evaluate the general usability of a
product. The usability is evaluated through the SUS score, the score is ranked from 0 to 100.
To calculate the SUS score the following formula is used (Brook, 1996).
20
“FIRST SUM THE SCORE CONTRIBUTES FROM EACH ITEM.
EACH ITEM´S SCORE CONTRIBUTION WILL RANGE FROM 0
TO 4. FOR ITEM 1,3,5,7 AND 9 THE SCORE CONTRIBUTION IS
THE SCALE MINUS 1. FOR ITEMS 2,4,6,8 AND 10, THE
CONTRIBUTION IS 5 MINUS THE SCALE POSITION.
MULTIPLY THE SUM OF THE SCORE BY 2.5 TO OBTAIN THE
OVERALL VALUE OF THE SUS”.
FIGURE 6: AN EXAMPLE OF A SUS SURVEY.
21
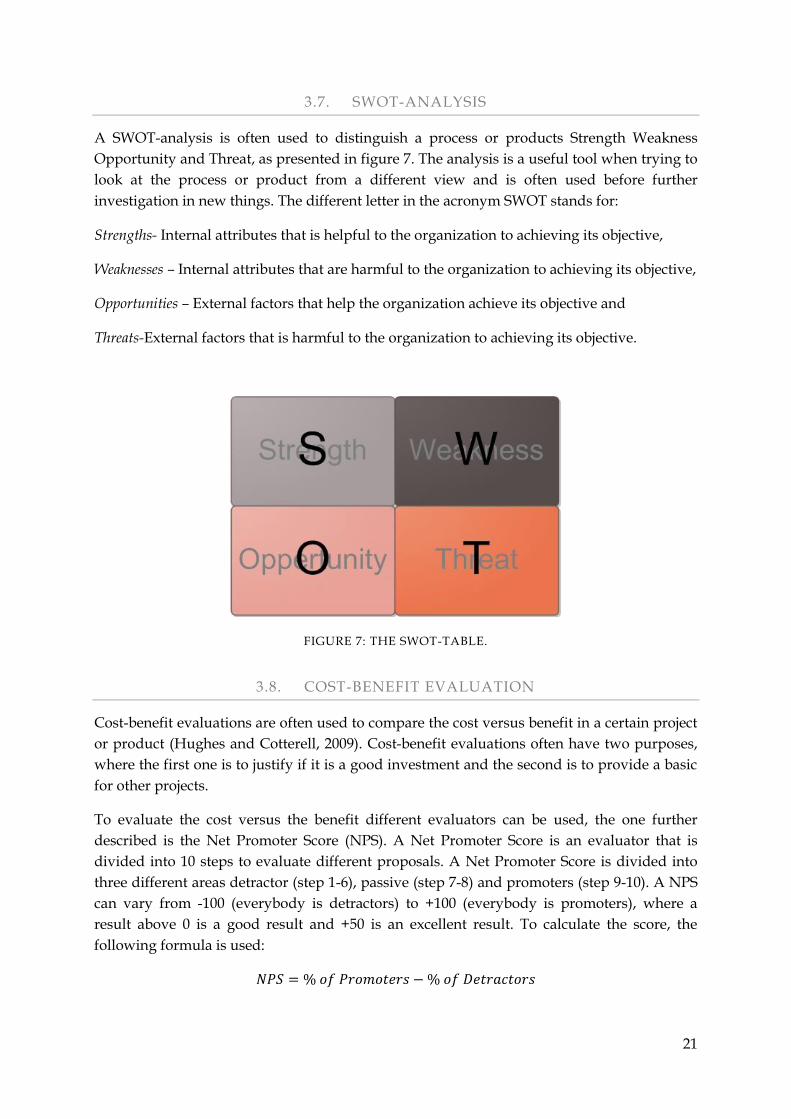
3.7. SWOT-ANALYSIS
A SWOT-analysis is often used to distinguish a process or products Strength Weakness
Opportunity and Threat, as presented in figure 7. The analysis is a useful tool when trying to
look at the process or product from a different view and is often used before further
investigation in new things. The different letter in the acronym SWOT stands for:
Strengths- Internal attributes that is helpful to the organization to achieving its objective,
Weaknesses – Internal attributes that are harmful to the organization to achieving its objective,
Opportunities – External factors that help the organization achieve its objective and
Threats-External factors that is harmful to the organization to achieving its objective.
FIGURE 7: THE SWOT-TABLE.
3.8. COST-BENEFIT EVALUATION
Cost-benefit evaluations are often used to compare the cost versus benefit in a certain project
or product (Hughes and Cotterell, 2009). Cost-benefit evaluations often have two purposes,
where the first one is to justify if it is a good investment and the second is to provide a basic
for other projects.
To evaluate the cost versus the benefit different evaluators can be used, the one further
described is the Net Promoter Score (NPS). A Net Promoter Score is an evaluator that is
divided into 10 steps to evaluate different proposals. A Net Promoter Score is divided into
three different areas detractor (step 1-6), passive (step 7-8) and promoters (step 9-10). A NPS
can vary from -100 (everybody is detractors) to +100 (everybody is promoters), where a
result above 0 is a good result and +50 is an excellent result. To calculate the score, the
following formula is used:
22
3.9. ETHNOGRAPHICAL METHODS
The ethnographic research method is a qualitative method and was in the beginning used to
understand the differences between cultural groups and another way of life from native
view point of the inhabitants in Greece (Spradley, 1979). The method was in the beginning
employed by anthropologists and sociologists. Nowadays, the method is used to gather
information about user and tasks directly from their normal work, home or leisure
environment. Normally, ethnographical studies focus on long term studies that can span
from weeks to months or even years. Often information is collected through participant
observation, interview, audio and video recording, diaries and also photographs.
23
4. RELATED WORK ON UCD IN AGILE CONTEXT
This chapter serves as a literature review of research papers that have been published in the
area of user-centered design and agile context. The reader is assumed to have basic
knowledge of how the different development methods diverse, even though some of the
differences that are most applicable are further discussed below.
4.1. USER-CENTERED DESIGN AND AGILE DEVELOPMENT
As the reader already has noticed this chapter summarizes the literature review of user-
centered design in agile development. Before any further discussion about this area it is in
order to present the questions that this chapter is trying to address. The question stated
below corresponds to sub research question 1 (presented in chapter 1.3) and is a further
explanation.
What key tensions between user-centered design and agile methods have been
identified in related research that makes them difficult to integrate?
Which methods have been proposed in order to integrate user-centered design and
agile methods?
4.1.1. SIMILARITIES AND DIFFERENCES BETWEEN UCD AND AGILE
The key differences between agile methods and user-centered design are discussed in this
chapter, where the main focus is on distinguish which differences there are between the
methods. The main similarity between the two methods is their common aspect of
developing high quality software for the end customer. Although, this common aspect there
are many obstacles that need to be overwhelmed in order to integrate the two approaches.
Some of the key obstacles are further described below.
4.1.1.1. CUSTOMER FOCUS VS. END-USER
One of the main differences between agile development and user-centered design (UCD) is
the focus on customer respective end-user. In agile development the customer is the person
who is either the real customer for the project or a representative for the customer. In the
agile context the customer should sit with the team and write and prioritize requirements (in
form of user stories) and test the software. Agile development also values collaboration and
communication between the customer and development team and uses them as the natural
communication tool for what the end-user wants (Blomkvist, 2005). In UCD the end-users
are the persons who are really using the system and that participates in requirements
gathering through interviews (focus groups) and field studies Ferreira et al. (2012).
The problem of integrating UCD in an agile context would not be so hard according to
(Blomkvist, 2005) if the agile methods distinguish between customers and end-users. Agile
development focus on satisfying the customers need and often change to do them satisfied,
but this focus can lead to problems with user experience if the customer is not the real end-
user (Sohaib and Khan, 2010). Also according to Chamberlain et al. (2006) these distinguishes
24
between customers and end-users are one of the cornerstones in successfully integrating
UCD in an agile context.
4.1.1.2. ITERATIVE PROCESSES
The main similarity between user-centered design (UCD) and agile development is that they
both are iterative, in some sense. Although, both agile development and user-centered
design are iterative they are it not in the same way. In UCD iterations, larger amount of
fidelity’s (low-fidelity and high-fidelity) is iterated through the whole design process before
implementation (Barnum, 2011). In agile development the focus is on mainly building and
releasing an increment of the product through different iterations. In order to integrate the
two methods UCD has to change and become incremental, since there is no time in agile
development to do an up- front design process (Blomkvist, 2005). Although, it is important
for UCD iteration to adapt to incremental iteration, UCD needs some sort of up-front design
in the beginning of the development process. The motive for this is that they should be able
to feed the developers with prototypes so they know what to implement.
4.1.1.3. REQUIRED DESIGN VS. UP-FRONT DESIGN
One of the characteristics of agile development is to “maximize the work not done”. This
implies that agile development favors light-weight just-in time modeling before extensive up
– front design, which can change when requirements are changing (Blomkvist, 2005).
Traditionally, UCD has been up-front since there are a few changes after the design has been
finalized. Although, agile development is against up-front design there needs to be some sort
of up-front design when UCD is integrated in agile development, because otherwise there
will not be any design to implement at the first sprint. Ferreira et al. (2007) performed an
investigation on four different projects that used agile methods and tried to incorporate
UCD. The outcome of this study was that it is preferable to use a minor part of up-front
design in an agile context. The reason for this is that in up-front design process there are a set
of low-fidelity prototypes that are investigated and tested before implementing and this is
something that can be used in agile context to know what the real end-user desires.
4.1.1.4. UNIT TESTING VS. USABILITY TESTING
In agile development there are often two different methods that are performed to assure
software quality. These different methods are unit testing and integration level testing
(Blomkvist, 2005). There is also some sort of acceptance test that is done in collaboration with
the customer. This type of testing is often done in the end of each sprint or as soon as a
specific user story is implemented. This type of collaboration between the customer and
development team is possible throughout the whole development process and agile process
enables this.
On the other hand in user-centered design (UCD) testing with real end-users is a major part
in the development process. This enables user-centered design to identify what the end-user
desire. Though, this major advantage the traditional user-centered design process with a
major usability test session does not fit the agile development methods. To arrange this, a
more light-weighted form of usability testing can be used in an agile method and this type of
25
testing can be integrated in the sprint as a form of acceptance test for usability and user
experience (Blomkvist, 2005).
4.1.2. RELATED PRACTICES
The aim of this chapter is to present some of the proposals that have been used in the
industry to overwhelm the key differences between the two approaches.
4.1.2.1. THE SPECIALIST, GENERALIST AND HYBRID APPROACH
The approach of integrating UCD practices in an agile context is described in Fox et al. (2008)
article “Agile Methods and User-Centered Design: How These Two Methodologies Are Being
Integrated In Industry”. The method described by Fox et al. in the article are based on their
own three approaches specialist, generalist and hybrid approach combined with (Sy, 2007)
method described in the article “Adapting Usability Investigations for Agile User-centered
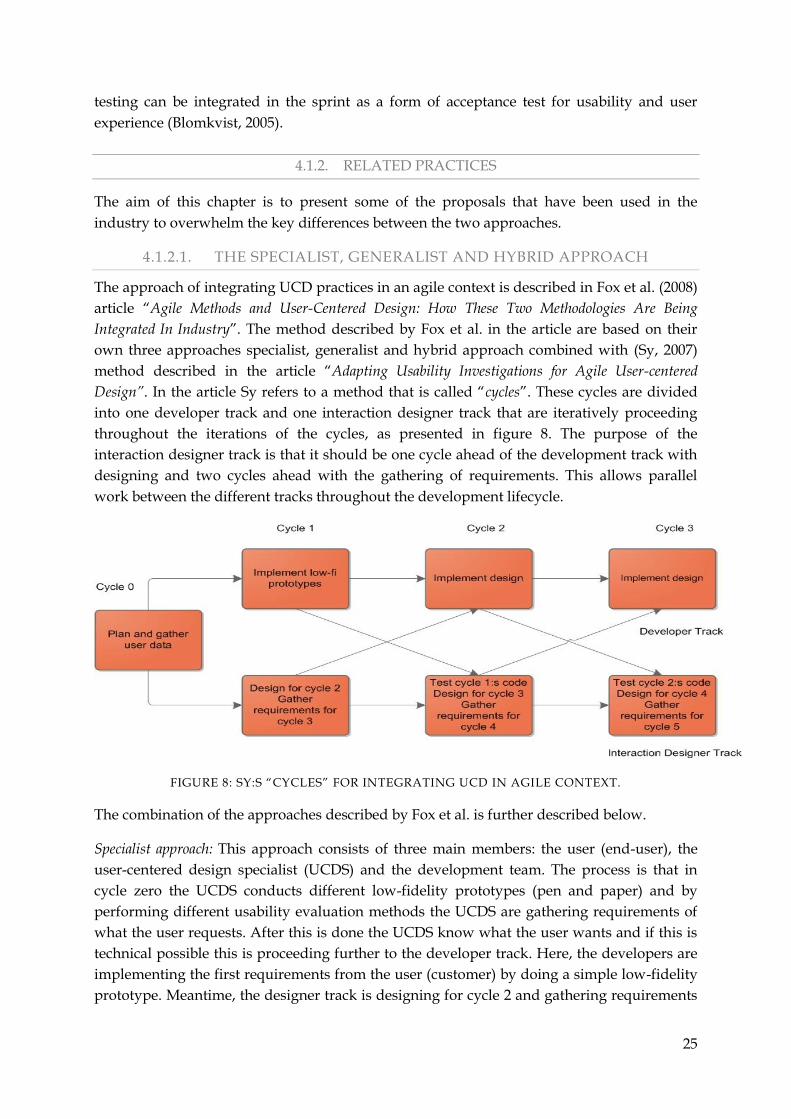
Design”. In the article Sy refers to a method that is called “cycles”. These cycles are divided
into one developer track and one interaction designer track that are iteratively proceeding
throughout the iterations of the cycles, as presented in figure 8. The purpose of the
interaction designer track is that it should be one cycle ahead of the development track with
designing and two cycles ahead with the gathering of requirements. This allows parallel
work between the different tracks throughout the development lifecycle.
FIGURE 8: SY:S “CYCLES” FOR INTEGRATING UCD IN AGILE CONTEXT.
The combination of the approaches described by Fox et al. is further described below.
Specialist approach: This approach consists of three main members: the user (end-user), the
user-centered design specialist (UCDS) and the development team. The process is that in
cycle zero the UCDS conducts different low-fidelity prototypes (pen and paper) and by
performing different usability evaluation methods the UCDS are gathering requirements of
what the user requests. After this is done the UCDS know what the user wants and if this is
technical possible this is proceeding further to the developer track. Here, the developers are
implementing the first requirements from the user (customer) by doing a simple low-fidelity
prototype. Meantime, the designer track is designing for cycle 2 and gathering requirements
26
for cycle 3. When the developers are finished with the prototype of cycle 1 they are passing it
to the designers who are performing a usability test on the prototype. This process will go
round in each sprint till the whole product is implemented.
Generalist approach: In the general approach the two main roles are user/customer and
developer team. In this approach the development team stands in for the UCDS. The
advantage of this approach is that the development team gathers knowledge of the user
interface (UI) design. The disadvantage of this approach is that the team members can be
biased by their knowledge of the design and implementation and therefore miss the “real”
user problems. Besides this change the generalist approach works in the same way as the
specialist approach.
Hybrid approach: The hybrid approach consists of a combination of both UCDS and members
of the development team acting as UCDS. The UCDS and the development team is taking
turns of who is the one performing the usability testing. This approach is used to increase the
knowledge of the development team regarding usability and user experience. Besides this
change the hybrid approach works in the same way as the specialist approach.
4.1.2.2. U-SCRUM
In the article “U-SCRUM: An Agile Methodology for Promoting Usability” by (Singh, 2008) the
method U-Scrum is presented. Singh invented this method as an alternative method to the
traditional Scrum, where usability engineering is not considered as one of the main areas.
The U-Scrum presented in the article was conducted in a project as a pilot study were high
quality of user experience was crucial. The principal difference between Scrum and U-Scrum
is that in U-Scrum the role of the product owner is assigned to two persons. One PO focus
largely on the traditional responsibility areas of a product owner and the other focus mainly
on usability and user experience. The area of responsibility for the usability product owner
(U-PO) is to incorporate user centered design into the Scrum process. This is done by using
personas3 and user experience vision (UE-vision). Through use of personas the entire team
can better understand the user´s intentional terms. A user experience vision (UE-vision) is a
study where the U-PO is asking particularly the market and the customer what they want
and how they want it. UE-vision provides the basis for a discussion between the
development team and PO on how the different features shall be implemented in a more
usable way.
In the article Singh mentions which benefits the U-Scrum gave the project compared to the
use of traditional Scrum method. The major difference according to Singh is that when using
the U-Scrum method the usability of the product is significantly higher. The evidence of this
came from comments from end-users and customer of the produced product. Another
improvement with the method is that the developers were more productive during the pilot
study with the U-Scrum method. This observation was attributed to the fact that they know
3 A persona is a psycho-social profile of a typical user and is reflecting the user´s goals, skills and attitude towards the product. It is important that a persona describes how a user wants to feel when using the product.
27
had a broader vision and knowledge of the whole product when the U-PO had developed a
UE-vision for the whole project.
4.1.2.3. THE RITE METHOD
The rapid iterative test and evaluation method (RITE) was developed by Microsoft´s user
testing team and is described in the article “The Rapid Iterative Test and Evaluation Method
(RITE): Better Products in Less Time” by Medlock et al. (2005). In this article Medlock et al.
discuss how user friendly products can be developed with the help of the RITE method.
According to Medlock, RITE is a method that is adapted to agile development and more
effective than traditional usability tests. The four basic principles for conducting usability
test as the one in RITE is:
1. The primary goal is to improve the usability of the product,
2. The participants are real users,
3. The participants do real task stories and
4. The development team observers and takes notes from each test session.
The important aspects of RITE are the persons observing the test sessions are the developers
of the product and also the participants are real end-users. Another important aspect is that
after each test session the material shall be analysed and the issues should be prioritized. In
this manner the method will save time compared to traditional usability tests.
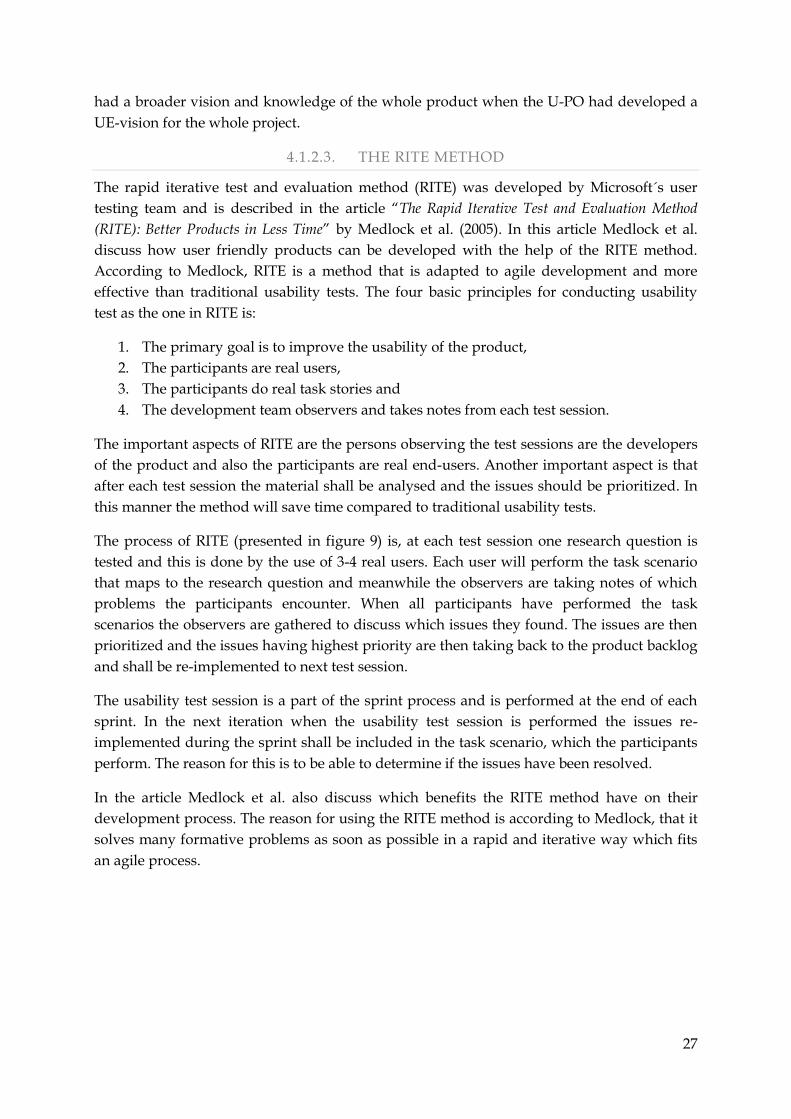
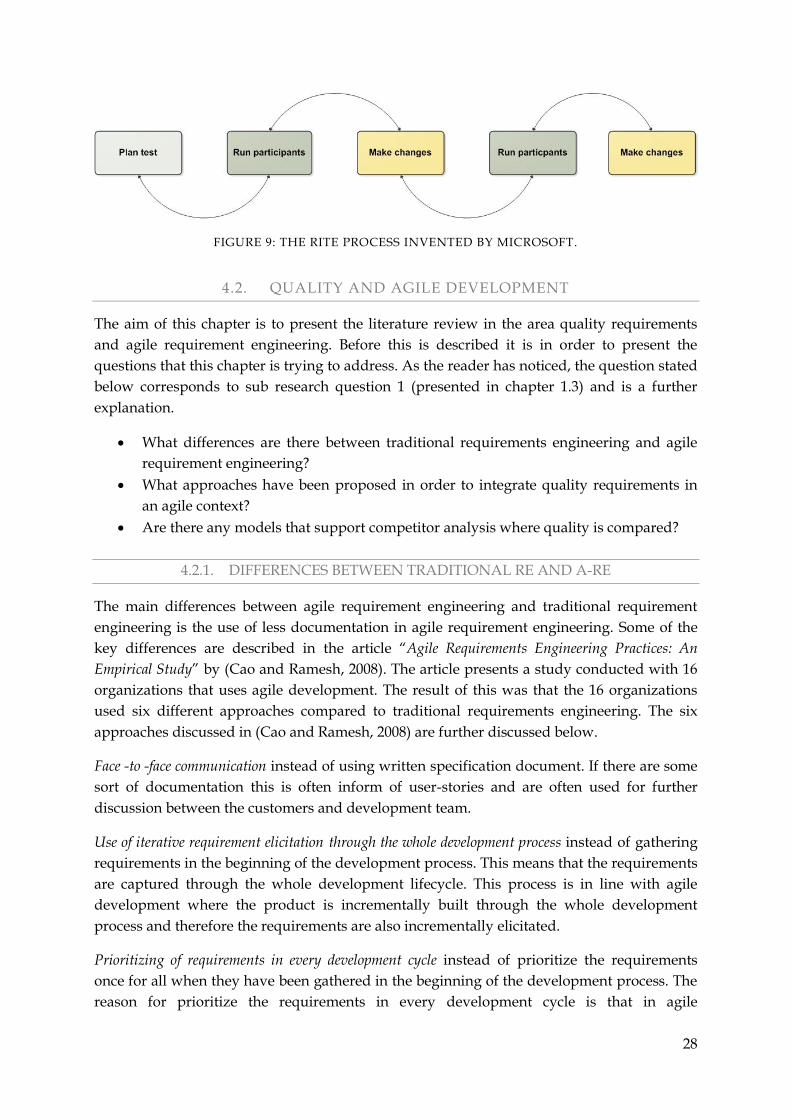
The process of RITE (presented in figure 9) is, at each test session one research question is
tested and this is done by the use of 3-4 real users. Each user will perform the task scenario
that maps to the research question and meanwhile the observers are taking notes of which
problems the participants encounter. When all participants have performed the task
scenarios the observers are gathered to discuss which issues they found. The issues are then
prioritized and the issues having highest priority are then taking back to the product backlog
and shall be re-implemented to next test session.
The usability test session is a part of the sprint process and is performed at the end of each
sprint. In the next iteration when the usability test session is performed the issues re-
implemented during the sprint shall be included in the task scenario, which the participants
perform. The reason for this is to be able to determine if the issues have been resolved.
In the article Medlock et al. also discuss which benefits the RITE method have on their
development process. The reason for using the RITE method is according to Medlock, that it
solves many formative problems as soon as possible in a rapid and iterative way which fits
an agile process.
28
FIGURE 9: THE RITE PROCESS INVENTED BY MICROSOFT.
4.2. QUALITY AND AGILE DEVELOPMENT
The aim of this chapter is to present the literature review in the area quality requirements
and agile requirement engineering. Before this is described it is in order to present the
questions that this chapter is trying to address. As the reader has noticed, the question stated
below corresponds to sub research question 1 (presented in chapter 1.3) and is a further
explanation.
What differences are there between traditional requirements engineering and agile
requirement engineering?
What approaches have been proposed in order to integrate quality requirements in
an agile context?
Are there any models that support competitor analysis where quality is compared?
4.2.1. DIFFERENCES BETWEEN TRADITIONAL RE AND A-RE
The main differences between agile requirement engineering and traditional requirement
engineering is the use of less documentation in agile requirement engineering. Some of the
key differences are described in the article “Agile Requirements Engineering Practices: An
Empirical Study” by (Cao and Ramesh, 2008). The article presents a study conducted with 16
organizations that uses agile development. The result of this was that the 16 organizations
used six different approaches compared to traditional requirements engineering. The six
approaches discussed in (Cao and Ramesh, 2008) are further discussed below.
Face -to -face communication instead of using written specification document. If there are some
sort of documentation this is often inform of user-stories and are often used for further
discussion between the customers and development team.
Use of iterative requirement elicitation through the whole development process instead of gathering
requirements in the beginning of the development process. This means that the requirements
are captured through the whole development lifecycle. This process is in line with agile
development where the product is incrementally built through the whole development
process and therefore the requirements are also incrementally elicitated.
Prioritizing of requirements in every development cycle instead of prioritize the requirements
once for all when they have been gathered in the beginning of the development process. The
reason for prioritize the requirements in every development cycle is that in agile
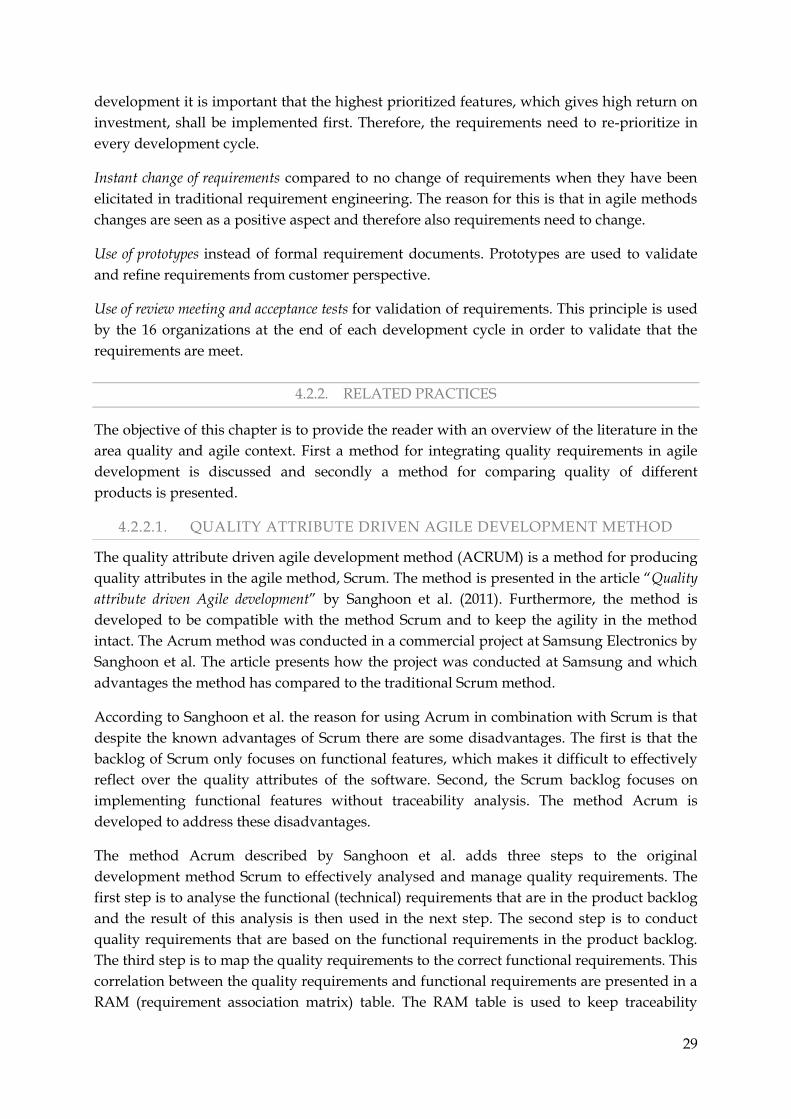
29
development it is important that the highest prioritized features, which gives high return on
investment, shall be implemented first. Therefore, the requirements need to re-prioritize in
every development cycle.
Instant change of requirements compared to no change of requirements when they have been
elicitated in traditional requirement engineering. The reason for this is that in agile methods
changes are seen as a positive aspect and therefore also requirements need to change.
Use of prototypes instead of formal requirement documents. Prototypes are used to validate
and refine requirements from customer perspective.
Use of review meeting and acceptance tests for validation of requirements. This principle is used
by the 16 organizations at the end of each development cycle in order to validate that the
requirements are meet.
4.2.2. RELATED PRACTICES
The objective of this chapter is to provide the reader with an overview of the literature in the
area quality and agile context. First a method for integrating quality requirements in agile
development is discussed and secondly a method for comparing quality of different
products is presented.
4.2.2.1. QUALITY ATTRIBUTE DRIVEN AGILE DEVELOPMENT METHOD
The quality attribute driven agile development method (ACRUM) is a method for producing
quality attributes in the agile method, Scrum. The method is presented in the article “Quality
attribute driven Agile development” by Sanghoon et al. (2011). Furthermore, the method is
developed to be compatible with the method Scrum and to keep the agility in the method
intact. The Acrum method was conducted in a commercial project at Samsung Electronics by
Sanghoon et al. The article presents how the project was conducted at Samsung and which
advantages the method has compared to the traditional Scrum method.
According to Sanghoon et al. the reason for using Acrum in combination with Scrum is that
despite the known advantages of Scrum there are some disadvantages. The first is that the
backlog of Scrum only focuses on functional features, which makes it difficult to effectively
reflect over the quality attributes of the software. Second, the Scrum backlog focuses on
implementing functional features without traceability analysis. The method Acrum is
developed to address these disadvantages.
The method Acrum described by Sanghoon et al. adds three steps to the original
development method Scrum to effectively analysed and manage quality requirements. The
first step is to analyse the functional (technical) requirements that are in the product backlog
and the result of this analysis is then used in the next step. The second step is to conduct
quality requirements that are based on the functional requirements in the product backlog.
The third step is to map the quality requirements to the correct functional requirements. This
correlation between the quality requirements and functional requirements are presented in a
RAM (requirement association matrix) table. The RAM table is used to keep traceability
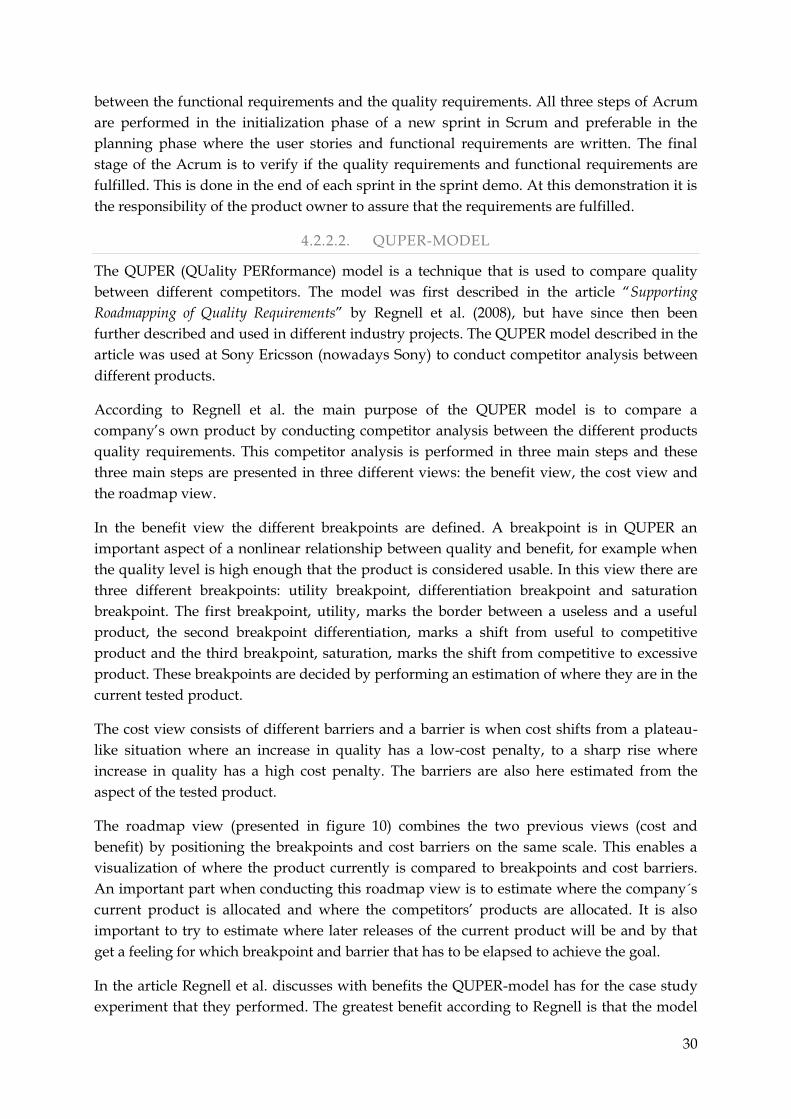
30
between the functional requirements and the quality requirements. All three steps of Acrum
are performed in the initialization phase of a new sprint in Scrum and preferable in the
planning phase where the user stories and functional requirements are written. The final
stage of the Acrum is to verify if the quality requirements and functional requirements are
fulfilled. This is done in the end of each sprint in the sprint demo. At this demonstration it is
the responsibility of the product owner to assure that the requirements are fulfilled.
4.2.2.2. QUPER-MODEL
The QUPER (QUality PERformance) model is a technique that is used to compare quality
between different competitors. The model was first described in the article “Supporting
Roadmapping of Quality Requirements” by Regnell et al. (2008), but have since then been
further described and used in different industry projects. The QUPER model described in the
article was used at Sony Ericsson (nowadays Sony) to conduct competitor analysis between
different products.
According to Regnell et al. the main purpose of the QUPER model is to compare a
company’s own product by conducting competitor analysis between the different products
quality requirements. This competitor analysis is performed in three main steps and these
three main steps are presented in three different views: the benefit view, the cost view and
the roadmap view.
In the benefit view the different breakpoints are defined. A breakpoint is in QUPER an
important aspect of a nonlinear relationship between quality and benefit, for example when
the quality level is high enough that the product is considered usable. In this view there are
three different breakpoints: utility breakpoint, differentiation breakpoint and saturation
breakpoint. The first breakpoint, utility, marks the border between a useless and a useful
product, the second breakpoint differentiation, marks a shift from useful to competitive
product and the third breakpoint, saturation, marks the shift from competitive to excessive
product. These breakpoints are decided by performing an estimation of where they are in the
current tested product.
The cost view consists of different barriers and a barrier is when cost shifts from a plateau-
like situation where an increase in quality has a low-cost penalty, to a sharp rise where
increase in quality has a high cost penalty. The barriers are also here estimated from the
aspect of the tested product.
The roadmap view (presented in figure 10) combines the two previous views (cost and
benefit) by positioning the breakpoints and cost barriers on the same scale. This enables a
visualization of where the product currently is compared to breakpoints and cost barriers.
An important part when conducting this roadmap view is to estimate where the company´s
current product is allocated and where the competitors’ products are allocated. It is also
important to try to estimate where later releases of the current product will be and by that
get a feeling for which breakpoint and barrier that has to be elapsed to achieve the goal.
In the article Regnell et al. discusses with benefits the QUPER-model has for the case study
experiment that they performed. The greatest benefit according to Regnell is that the model
31
enlightens the quality requirements and compares the products quality requirements with
other competitor’s quality requirements.
FIGURE 10: THE ROADMAP VIEW OF THE QUPER-MODEL.
4.3. EFFECTIVE DEVELOPMENT AND SCALING DEVELOPMENT
The objective of this chapter is to go through the literature review of which techniques and
methods that have been considered in the industry to effectively scale agile development.
Before this is discussed it is in order to present the questions that this chapter is trying to
address. As the reader has noticed, the question stated below corresponds to sub research
question 1 (presented in chapter 1.3) and is a further explanation.
How can agile development be scaled to fit an organization?
Which methods can be used to create an effective development process?
4.3.1. SCALING AGILE
One way of achieving the method CTL (Closing The Loop, further described in 4.3.3) can be
to use the method Scaling Agile that is described in the article “Scaling Agile @ Spotify” by
(Kniberg and Ivarsson, 2012). This article describes how they work at Spotify with agile
development method Scrum and how the company is structured to get a product that has
high quality and is developed quickly and effective to satisfy customer.
The basic unit of development at Spotify is a Squad. A Squad is another name for the Scrum
team that consists of a product owner, developers and designers. A Squad has not a formal
Squad leader (section manager) but has instead an agile coach how helps them evolve and
improve their work. The coach runs retrospective meetings, sprint planning meetings and
does one to one coaching. In turn, a Squad is a part of a Tribe (department) and a Tribe is a
gathering of Squads that are working in the same area. Each Tribe has a Tribe leader that is
responsible for the work of the whole Tribe. It is important that the Tribe is in the same
geographically place and have a limit of 100 people. The limitation is because research has
shown that people can only have a social relationship with maximum 100 people at the same
time.
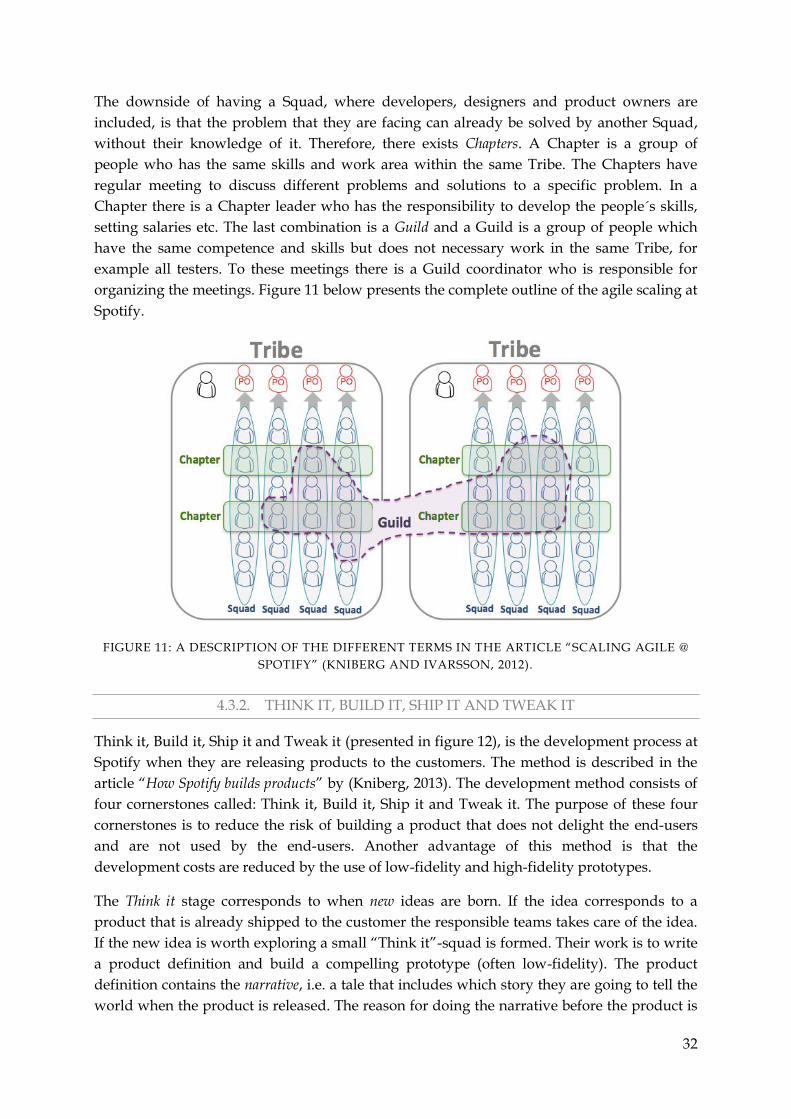
32
The downside of having a Squad, where developers, designers and product owners are
included, is that the problem that they are facing can already be solved by another Squad,
without their knowledge of it. Therefore, there exists Chapters. A Chapter is a group of
people who has the same skills and work area within the same Tribe. The Chapters have
regular meeting to discuss different problems and solutions to a specific problem. In a
Chapter there is a Chapter leader who has the responsibility to develop the people´s skills,
setting salaries etc. The last combination is a Guild and a Guild is a group of people which
have the same competence and skills but does not necessary work in the same Tribe, for
example all testers. To these meetings there is a Guild coordinator who is responsible for
organizing the meetings. Figure 11 below presents the complete outline of the agile scaling at
Spotify.
FIGURE 11: A DESCRIPTION OF THE DIFFERENT TERMS IN THE ARTICLE “SCALING AGILE @
SPOTIFY” (KNIBERG AND IVARSSON, 2012).
4.3.2. THINK IT, BUILD IT, SHIP IT AND TWEAK IT
Think it, Build it, Ship it and Tweak it (presented in figure 12), is the development process at
Spotify when they are releasing products to the customers. The method is described in the
article “How Spotify builds products” by (Kniberg, 2013). The development method consists of
four cornerstones called: Think it, Build it, Ship it and Tweak it. The purpose of these four
cornerstones is to reduce the risk of building a product that does not delight the end-users
and are not used by the end-users. Another advantage of this method is that the
development costs are reduced by the use of low-fidelity and high-fidelity prototypes.
The Think it stage corresponds to when new ideas are born. If the idea corresponds to a
product that is already shipped to the customer the responsible teams takes care of the idea.
If the new idea is worth exploring a small “Think it”-squad is formed. Their work is to write
a product definition and build a compelling prototype (often low-fidelity). The product
definition contains the narrative, i.e. a tale that includes which story they are going to tell the
world when the product is released. The reason for doing the narrative before the product is
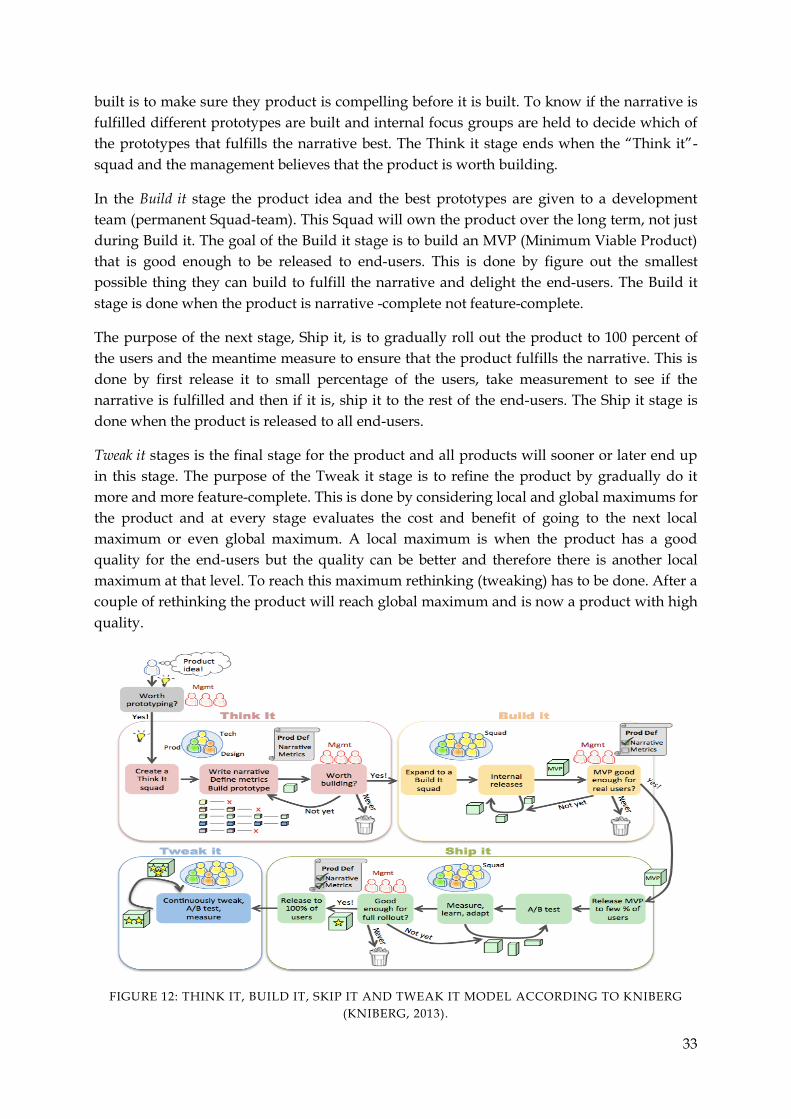
33
built is to make sure they product is compelling before it is built. To know if the narrative is
fulfilled different prototypes are built and internal focus groups are held to decide which of
the prototypes that fulfills the narrative best. The Think it stage ends when the “Think it”-
squad and the management believes that the product is worth building.
In the Build it stage the product idea and the best prototypes are given to a development
team (permanent Squad-team). This Squad will own the product over the long term, not just
during Build it. The goal of the Build it stage is to build an MVP (Minimum Viable Product)
that is good enough to be released to end-users. This is done by figure out the smallest
possible thing they can build to fulfill the narrative and delight the end-users. The Build it
stage is done when the product is narrative -complete not feature-complete.
The purpose of the next stage, Ship it, is to gradually roll out the product to 100 percent of
the users and the meantime measure to ensure that the product fulfills the narrative. This is
done by first release it to small percentage of the users, take measurement to see if the
narrative is fulfilled and then if it is, ship it to the rest of the end-users. The Ship it stage is
done when the product is released to all end-users.
Tweak it stages is the final stage for the product and all products will sooner or later end up
in this stage. The purpose of the Tweak it stage is to refine the product by gradually do it
more and more feature-complete. This is done by considering local and global maximums for
the product and at every stage evaluates the cost and benefit of going to the next local
maximum or even global maximum. A local maximum is when the product has a good
quality for the end-users but the quality can be better and therefore there is another local
maximum at that level. To reach this maximum rethinking (tweaking) has to be done. After a
couple of rethinking the product will reach global maximum and is now a product with high
quality.
FIGURE 12: THINK IT, BUILD IT, SKIP IT AND TWEAK IT MODEL ACCORDING TO KNIBERG
(KNIBERG, 2013).
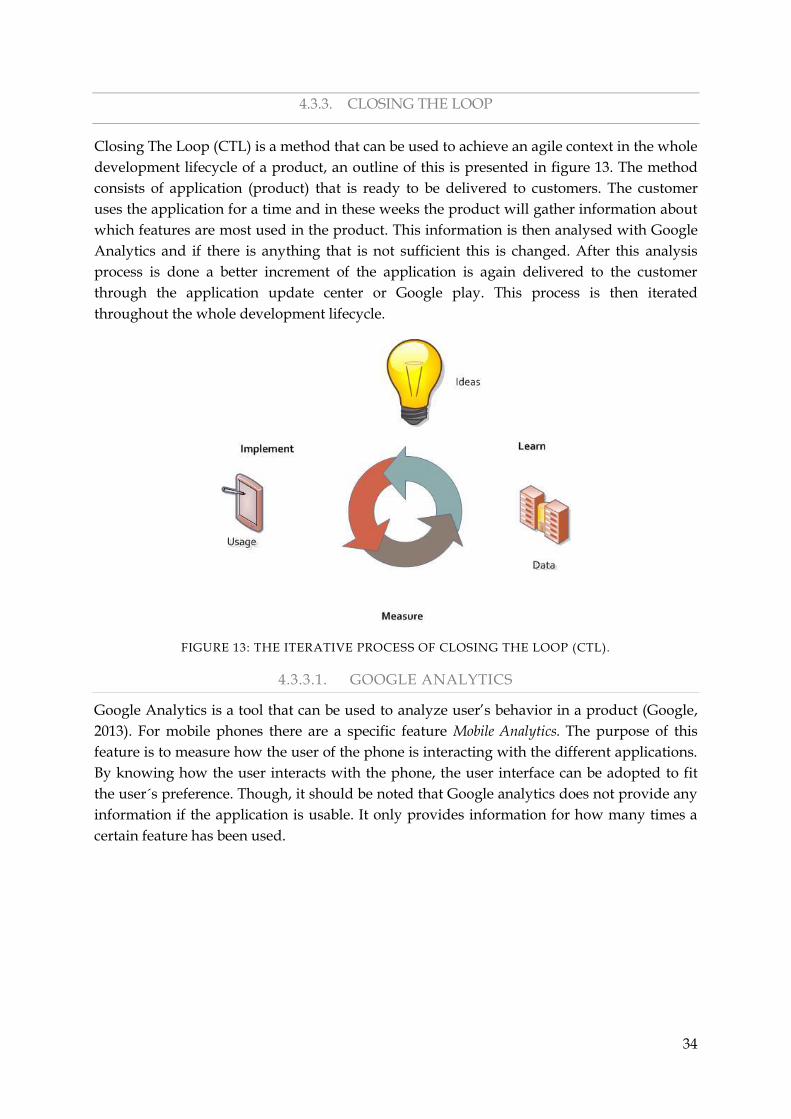
34
4.3.3. CLOSING THE LOOP
Closing The Loop (CTL) is a method that can be used to achieve an agile context in the whole
development lifecycle of a product, an outline of this is presented in figure 13. The method
consists of application (product) that is ready to be delivered to customers. The customer
uses the application for a time and in these weeks the product will gather information about
which features are most used in the product. This information is then analysed with Google
Analytics and if there is anything that is not sufficient this is changed. After this analysis
process is done a better increment of the application is again delivered to the customer
through the application update center or Google play. This process is then iterated
throughout the whole development lifecycle.
FIGURE 13: THE ITERATIVE PROCESS OF CLOSING THE LOOP (CTL).
4.3.3.1. GOOGLE ANALYTICS
Google Analytics is a tool that can be used to analyze user’s behavior in a product (Google,
2013). For mobile phones there are a specific feature Mobile Analytics. The purpose of this
feature is to measure how the user of the phone is interacting with the different applications.
By knowing how the user interacts with the phone, the user interface can be adopted to fit
the user´s preference. Though, it should be noted that Google analytics does not provide any
information if the application is usable. It only provides information for how many times a
certain feature has been used.
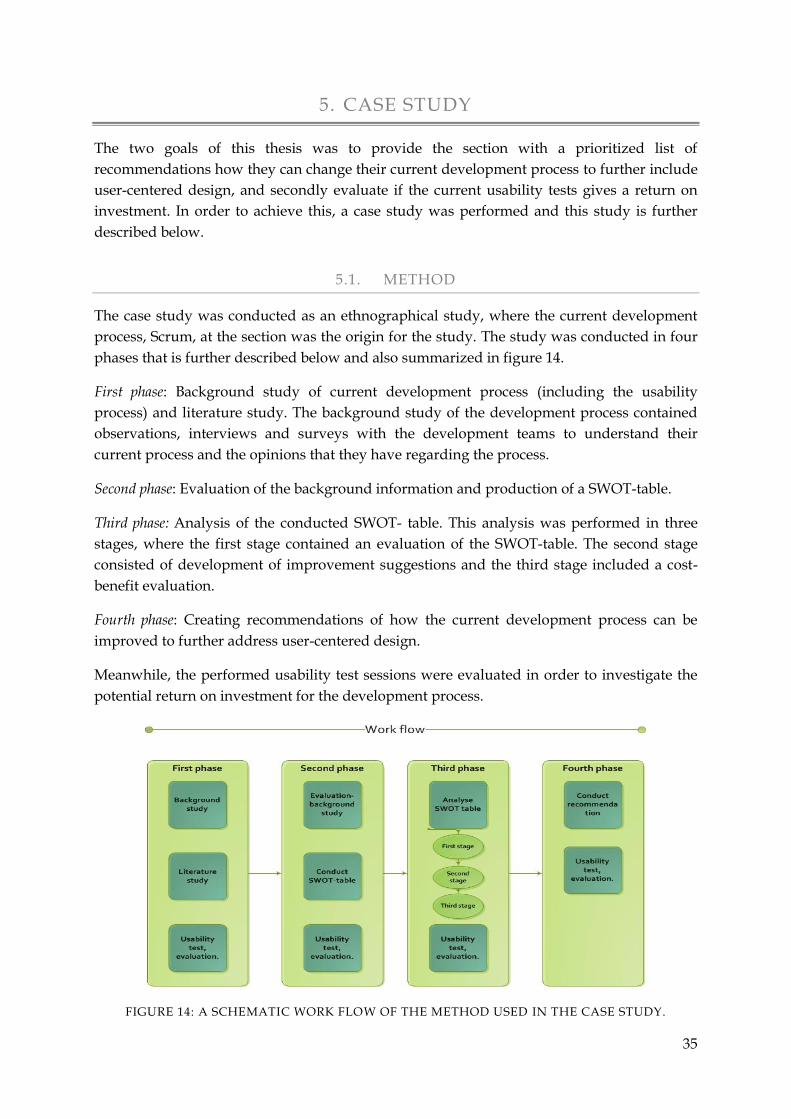
35
5. CASE STUDY
The two goals of this thesis was to provide the section with a prioritized list of
recommendations how they can change their current development process to further include
user-centered design, and secondly evaluate if the current usability tests gives a return on
investment. In order to achieve this, a case study was performed and this study is further
described below.
5.1. METHOD
The case study was conducted as an ethnographical study, where the current development
process, Scrum, at the section was the origin for the study. The study was conducted in four
phases that is further described below and also summarized in figure 14.
First phase: Background study of current development process (including the usability
process) and literature study. The background study of the development process contained
observations, interviews and surveys with the development teams to understand their
current process and the opinions that they have regarding the process.
Second phase: Evaluation of the background information and production of a SWOT-table.
Third phase: Analysis of the conducted SWOT- table. This analysis was performed in three
stages, where the first stage contained an evaluation of the SWOT-table. The second stage
consisted of development of improvement suggestions and the third stage included a cost-
benefit evaluation.
Fourth phase: Creating recommendations of how the current development process can be
improved to further address user-centered design.
Meanwhile, the performed usability test sessions were evaluated in order to investigate the
potential return on investment for the development process.
FIGURE 14: A SCHEMATIC WORK FLOW OF THE METHOD USED IN THE CASE STUDY.
36
5.1.1. ETHNOGRAPHICAL METHODS USED IN THE CASE STUDY
In order to perform the case study ethnographical methods were used. This chapter presents
the methods which were used during the study.
5.1.1.1. OBSERVATION
Observations were used as a research method through the whole study. Observations can,
according to Höst et al. (2006) be conducted with various degrees of interactivity with the
observed subject. There is also a factor of the subjects´ awareness in regard to being
observed. These two factors combined generate four different types of observations. The type
of observations used in this study differed throughout the study depending on which task
being observed.
In the initial phase of the project observations were conducted with low participation.
Meetings were attended and occasional questions were asked in order to fill in missing
information. This type of information can best be classified as observing participators, thus the
group was aware of them being observed, but the primary goal was to gather information
(Merriam, 1994). Observations were used as a method to identify factors that might not be
visible to those being observed. The intention of the observation method was to gather
background information and to objectively identify factors in the development process that
could be used as foundation for discussions with the development teams. In addition to
more formal observations there were unstructured observations, individual discussions with
team members. In these either a single topic or several small topics were discussed with the
team members. This type of unstructured observations were conducted when certain gaps in
the information was needed or when questions that needed a fast answer was raised.
5.1.1.2. INTERVIEW
Interview sessions were performed throughout the study and this was conducted both in a
semi-structured way and structured way. For the semi-structured interviews there were
conducted guidelines, but these where neither followed strictly nor did they specify
everything in detail. By performing semi-structured interviews the participants was not
forced to share the opinion of the questioner and they had the opportunity to discuss the
interest of their deeper. The interview sessions were made in group and not individual, more
like some sort of focus group. The motivation for this choice of interview method was made
due to practical reasons. Firstly, to schedule a meeting with all team members of the
development teams would be almost impossible regarding to time. Secondly, in a group
interview the participants can use each other’s ideas and make use of each other to eliciting
thoughts and interesting information. For the structured interviews these were conducted
with guidelines and questions that were strictly followed. Structured interviews were
performed to evaluate different proposals and by performing structured interviews the
participants only have to focus on the asked question.
Interviews were both conducted with developers, product owners, scrum master and
designers of the development teams. The reason for this is that they often have different
perceptive of the development process.
37
Interview sessions were used to investigate the current development process, to analysis and
evaluate the conducted SWOT-table, and to evaluate the improvement suggestions through a
cost-benefit evaluation. The sessions were recorded and notes were taken during the session.
At the interview sessions it was made clear to the participants that they were anonymous
and that the recording was only going to be used for analyze afterwards, to elicit certain
areas of interest.
5.1.1.3. SURVEY
Different surveys were used throughout the whole case study process. The purpose of the
surveys were to deeper investigate their development process and to evaluate the return on
investment (ROI) for current usability test.
For the deeper investigation of their current development process a survey with likert scale
items and comment space was used. The range in the likert scale survey was from “strongly
disagree” to “strongly agree” in five steps. The survey was conducted using a website form, to
which the participants was emailed the link. All answers were submitted anonymously,
which was made clear in the email to the participants.
A System Usability Scale (SUS) survey was used in order to evaluate the return on
investment for the current usability test (presented in chapter 5.2.1.2). Also, two evaluations
surveys were used to evaluate the return on investment for the current usability test. The
first was a likert scale survey with the range from “strongly disagree” to “strongly agree”. The
second one was a survey to evaluate the team member´s awareness towards the tested
applications. In both of these surveys the development team members were asked to
evaluate their own subjective feeling of how the now consider usability questions and user
experience questions.
5.1.2. METHOD FOR FIRST PHASE
This chapter presents the method for the first phase of the case study. As the reader already
knows the first phase corresponded to gathering of background information corresponding
to the development process at the section.
The method for the first phase was to take use of the ethnographical methods presented. For
background information regarding their current development process mostly observations
was performed and sometime unstructured observations. To gather information about their
current usability process and opinion towards the usability process, interview session and a
liker scale survey were used.
The questions for the interview session were closed questions in the beginning and later on
there were more open questions were the participants were allowed to discuss more freely
around the topics. After the interview session was performed a likert scale survey was filled
out by the development teams to understand if the answer given at the interview session
was shared with the rest of the team. The survey concerned the closed questions for the
interview session.
38
5.1.3. METHOD FOR SECOND PHASE
The aim of the chapter is to present the method for the second phase of the case study. This
phase included an evaluation and production of a SWOT-table. In order to develop this
SWOT-table the result from the first phase was evaluated and analysed. The evaluation and
analyzing of the first phase was performed by gathering the information into the four piles
strength, weakness, opportunity and threat concerning the development process. Then these
piles were structured in order to remove duplicate information and organize the information
in a more readable form. These piles then formed the outline of the developed SWOT-table.
5.1.4. METHOD FOR THIRD PHASE
This chapter describes the analysis process of the SWOT-table, performed in the third phase
of the case study. The analysis process consisted of three stages:
First stage: The development teams chose a few items from the SWOT-table that they
would either retain or improve,
Second stage: Improvement suggestions for the selected items in stage one
corresponding to the columns weakness, opportunity and threat of the SWOT-table
was constructed and
Third stage: Evaluation of the improvement suggestions by the development teams
through a cost-benefit evaluation.
First stage in the analysis process was to select a few items in the SWOT-table which the
development teams would like to retain (concerning strength and opportunity) or improve
(concerning to weakness and threat). The reason for only choosing a few items in the SWOT-
table is that the analysis process should be based on the items that the development teams
consider to be most important to either retain or improve in their current development
process. The procedure of the first stage was that the participants of the interview session
were asked to select a few (3-4) items from the SWOT-table that they would either retain or
improve. After the participants had selected a few items each, there was a discussion among
them why they choose the specific items and what pros and cons there are with their selected
items. When each of them had presented their selected items they discussed which of the
items presented they together would retain or improve. The result of this is further discussed
below.
Second stage was to come up with and conduct improvement suggestions corresponding to
each selected item of the first stage. The improvement suggestions are based on the
background study in first phase of the case study and suggestions that the participants of the
interview session in the first stage came up with.
Third stage in the analysis process was to evaluate the improvement suggestions for the
selected items from the first step by performing a cost-benefit analysis. The evaluation
corresponds to the improvement suggestions of the second stage of the analysis process. In
the interview session the participants were asked to evaluate the items by answering a set of
questions (presented in appendix G) that corresponded to each improvement suggestion.
39
After the participants had evaluated each improvement suggestion they were asked to
perform a Net Promoter Score (NPS) on each item, NPS is further described in chapter 3.8.
The participants’ task was to choose the items giving their development process as high
benefit as possible to minor cost and this was done by the help of NPS.
5.1.5. METHOD FOR FOURTH PHASE
The objective of this chapter is to describe the method used in the fourth phase of the case
study. The purpose of the fourth phase was to conduct recommendations regarding how the
current development process at the section can better include user-centered design in the
development process. The recommendations given have partly its background from the
result of the third phase of the case study, but also the author´s experience through the
conducted literature study. The recommendations are prioritized in the order that the
development teams think they give them most benefit for minor cost. In order to conduct
these recommendations the cost-benefit evaluation of the third phase was evaluated and
analysed.
5.1.6. METHOD FOR THE EVALUATION OF RETURN ON INVESTMENT
The aim of this chapter is to present the method used to evaluate the return on investment
for the current usability tests performed at the section. The return on investment (ROI)
corresponds to evaluation of usability and user experience towards the applications
(application 1 and application 2) which were tested during the usability test sessions and the
awareness of development teams towards usability and user experience. The techniques
used to evaluate the return on investment were of both quantitative and qualitative data. For
the quantitative evaluation unstructured observations was performed and for qualitative
data different surveys, further described below, were used.
To be able to evaluate the usability and user experience of the tested applications the System
Usability Scale (SUS) survey (presented in appendix A) were used. The survey was answered
by test persons (LTH students) attending the usability sessions during the conduction of the
case study (the SUS values of the test persons are presented in appendix B) and from these
answers the mean value of the SUS score was counted. The mean value of the SUS score was
then used to evaluate if the usability and user experience was increasing between the test
sessions of a specific application.
In order to calculate the mean value of the SUS score first the total score of the survey from
each participant had to be calculated through the use of the following formula:
{ } { }
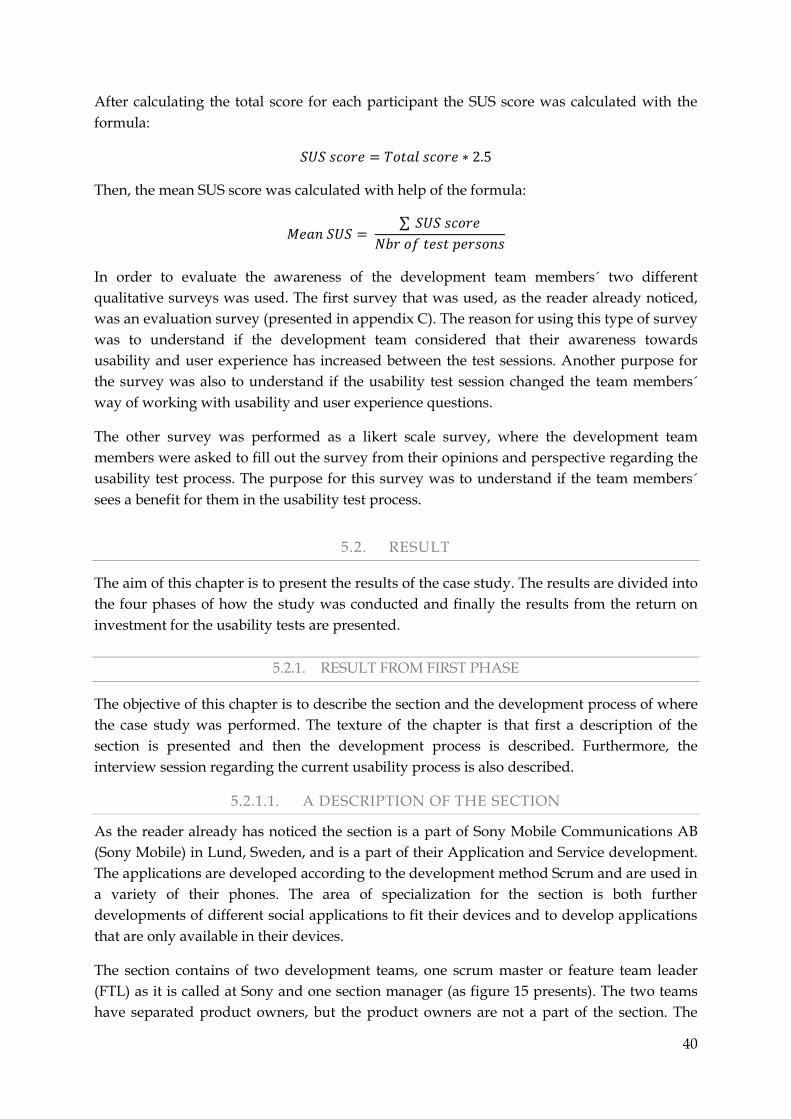
40
After calculating the total score for each participant the SUS score was calculated with the
formula:
Then, the mean SUS score was calculated with help of the formula:
∑
In order to evaluate the awareness of the development team members´ two different
qualitative surveys was used. The first survey that was used, as the reader already noticed,
was an evaluation survey (presented in appendix C). The reason for using this type of survey
was to understand if the development team considered that their awareness towards
usability and user experience has increased between the test sessions. Another purpose for
the survey was also to understand if the usability test session changed the team members´
way of working with usability and user experience questions.
The other survey was performed as a likert scale survey, where the development team
members were asked to fill out the survey from their opinions and perspective regarding the
usability test process. The purpose for this survey was to understand if the team members´
sees a benefit for them in the usability test process.
5.2. RESULT
The aim of this chapter is to present the results of the case study. The results are divided into
the four phases of how the study was conducted and finally the results from the return on
investment for the usability tests are presented.
5.2.1. RESULT FROM FIRST PHASE
The objective of this chapter is to describe the section and the development process of where
the case study was performed. The texture of the chapter is that first a description of the
section is presented and then the development process is described. Furthermore, the
interview session regarding the current usability process is also described.
5.2.1.1. A DESCRIPTION OF THE SECTION
As the reader already has noticed the section is a part of Sony Mobile Communications AB
(Sony Mobile) in Lund, Sweden, and is a part of their Application and Service development.
The applications are developed according to the development method Scrum and are used in
a variety of their phones. The area of specialization for the section is both further
developments of different social applications to fit their devices and to develop applications
that are only available in their devices.
The section contains of two development teams, one scrum master or feature team leader
(FTL) as it is called at Sony and one section manager (as figure 15 presents). The two teams
have separated product owners, but the product owners are not a part of the section. The
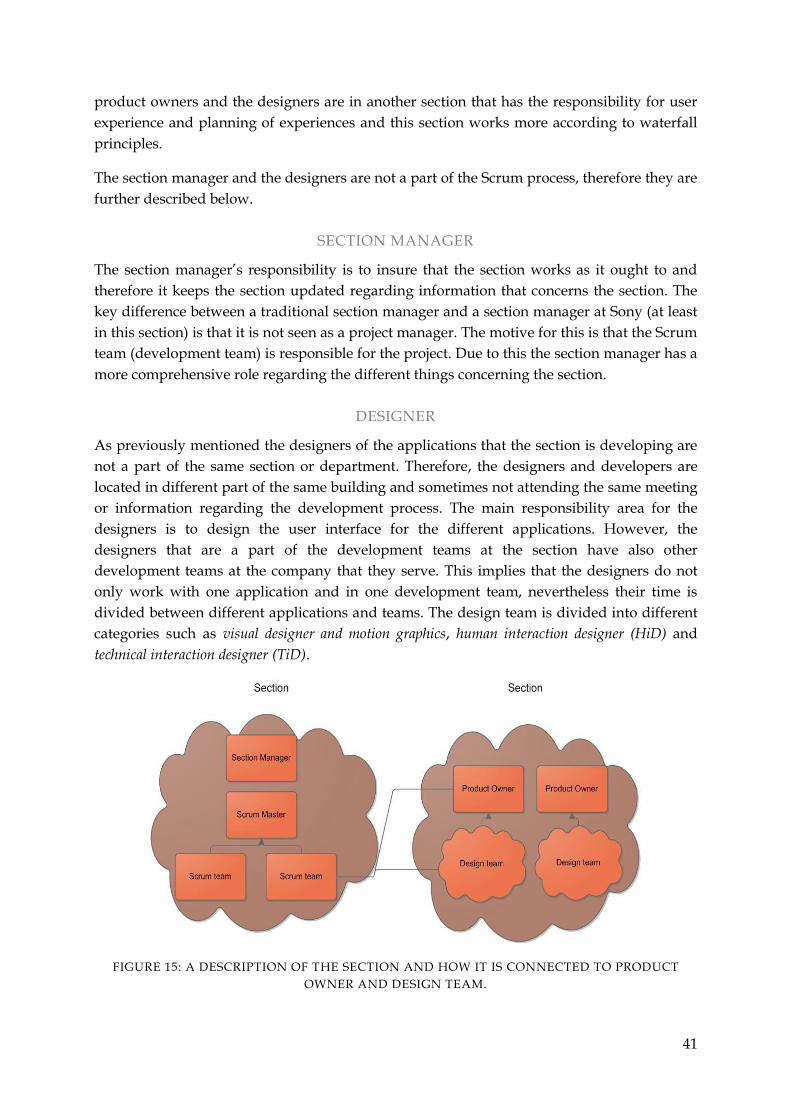
41
product owners and the designers are in another section that has the responsibility for user
experience and planning of experiences and this section works more according to waterfall
principles.
The section manager and the designers are not a part of the Scrum process, therefore they are
further described below.
SECTION MANAGER
The section manager’s responsibility is to insure that the section works as it ought to and
therefore it keeps the section updated regarding information that concerns the section. The
key difference between a traditional section manager and a section manager at Sony (at least
in this section) is that it is not seen as a project manager. The motive for this is that the Scrum
team (development team) is responsible for the project. Due to this the section manager has a
more comprehensive role regarding the different things concerning the section.
DESIGNER
As previously mentioned the designers of the applications that the section is developing are
not a part of the same section or department. Therefore, the designers and developers are
located in different part of the same building and sometimes not attending the same meeting
or information regarding the development process. The main responsibility area for the
designers is to design the user interface for the different applications. However, the
designers that are a part of the development teams at the section have also other
development teams at the company that they serve. This implies that the designers do not
only work with one application and in one development team, nevertheless their time is
divided between different applications and teams. The design team is divided into different
categories such as visual designer and motion graphics, human interaction designer (HiD) and
technical interaction designer (TiD).
FIGURE 15: A DESCRIPTION OF THE SECTION AND HOW IT IS CONNECTED TO PRODUCT
OWNER AND DESIGN TEAM.
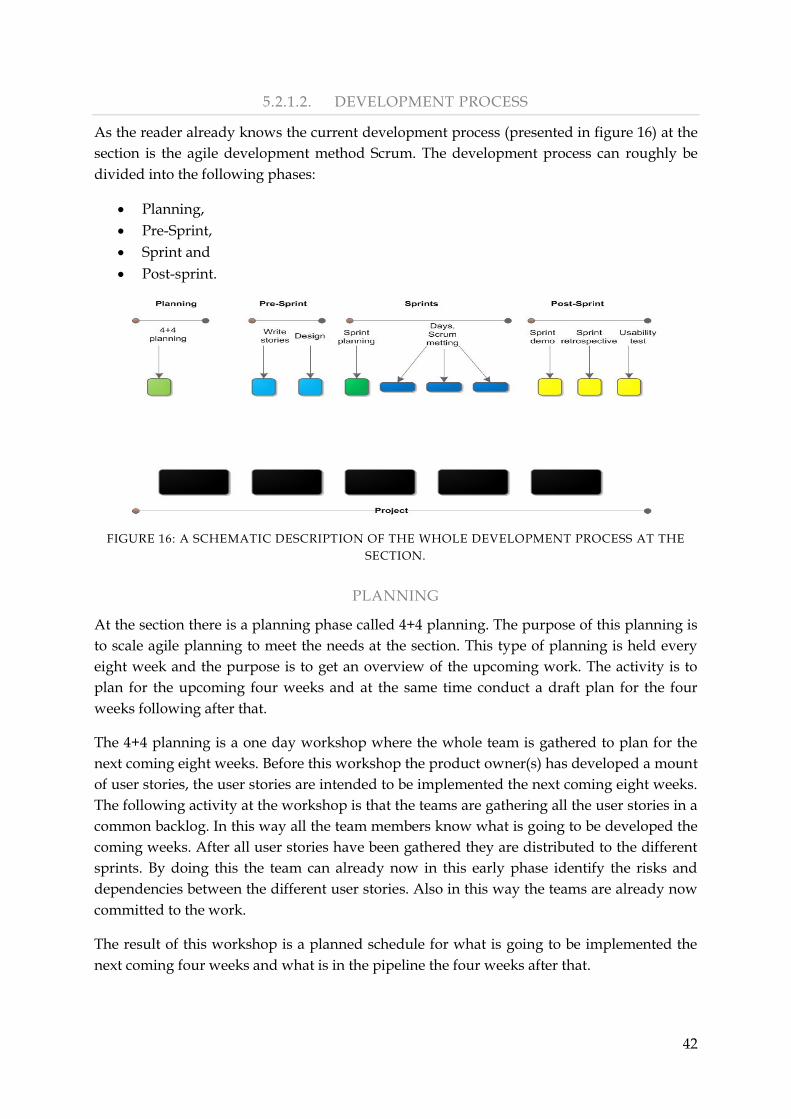
42
5.2.1.2. DEVELOPMENT PROCESS
As the reader already knows the current development process (presented in figure 16) at the
section is the agile development method Scrum. The development process can roughly be
divided into the following phases:
Planning,
Pre-Sprint,
Sprint and
Post-sprint.
FIGURE 16: A SCHEMATIC DESCRIPTION OF THE WHOLE DEVELOPMENT PROCESS AT THE
SECTION.
PLANNING
At the section there is a planning phase called 4+4 planning. The purpose of this planning is
to scale agile planning to meet the needs at the section. This type of planning is held every
eight week and the purpose is to get an overview of the upcoming work. The activity is to
plan for the upcoming four weeks and at the same time conduct a draft plan for the four
weeks following after that.
The 4+4 planning is a one day workshop where the whole team is gathered to plan for the
next coming eight weeks. Before this workshop the product owner(s) has developed a mount
of user stories, the user stories are intended to be implemented the next coming eight weeks.
The following activity at the workshop is that the teams are gathering all the user stories in a
common backlog. In this way all the team members know what is going to be developed the
coming weeks. After all user stories have been gathered they are distributed to the different
sprints. By doing this the team can already now in this early phase identify the risks and
dependencies between the different user stories. Also in this way the teams are already now
committed to the work.
The result of this workshop is a planned schedule for what is going to be implemented the
next coming four weeks and what is in the pipeline the four weeks after that.
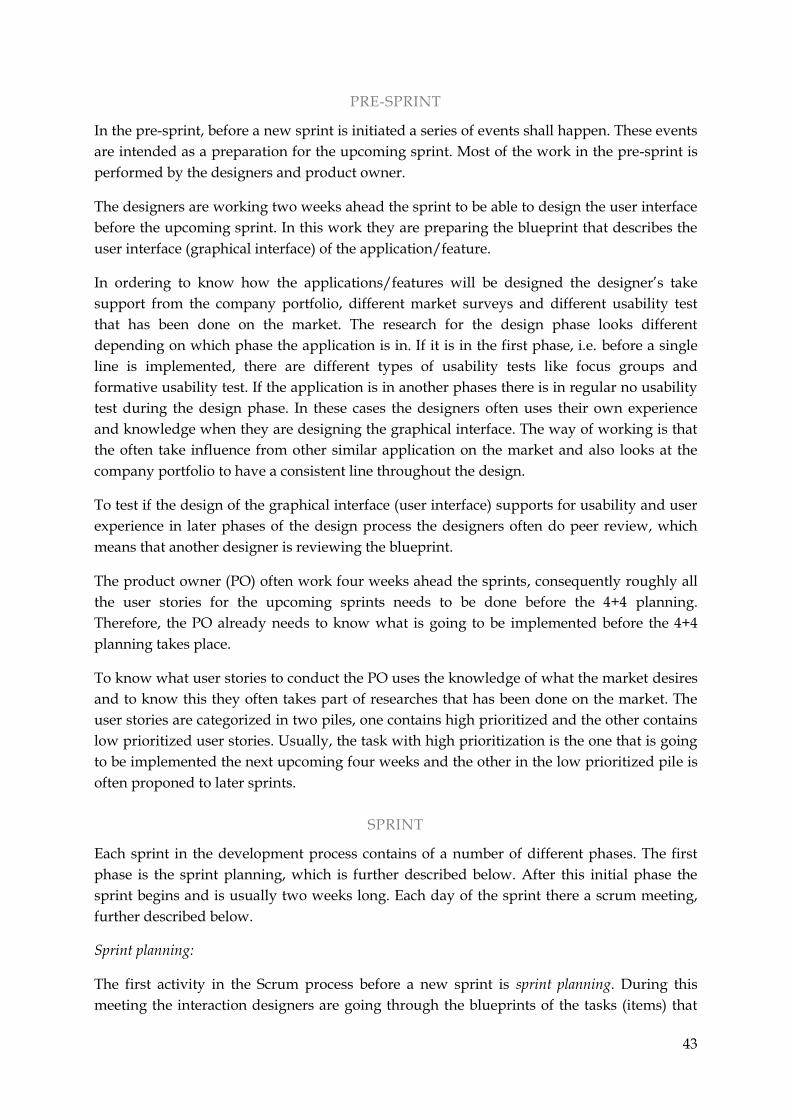
43
PRE-SPRINT
In the pre-sprint, before a new sprint is initiated a series of events shall happen. These events
are intended as a preparation for the upcoming sprint. Most of the work in the pre-sprint is
performed by the designers and product owner.
The designers are working two weeks ahead the sprint to be able to design the user interface
before the upcoming sprint. In this work they are preparing the blueprint that describes the
user interface (graphical interface) of the application/feature.
In ordering to know how the applications/features will be designed the designer’s take
support from the company portfolio, different market surveys and different usability test
that has been done on the market. The research for the design phase looks different
depending on which phase the application is in. If it is in the first phase, i.e. before a single
line is implemented, there are different types of usability tests like focus groups and
formative usability test. If the application is in another phases there is in regular no usability
test during the design phase. In these cases the designers often uses their own experience
and knowledge when they are designing the graphical interface. The way of working is that
the often take influence from other similar application on the market and also looks at the
company portfolio to have a consistent line throughout the design.
To test if the design of the graphical interface (user interface) supports for usability and user
experience in later phases of the design process the designers often do peer review, which
means that another designer is reviewing the blueprint.
The product owner (PO) often work four weeks ahead the sprints, consequently roughly all
the user stories for the upcoming sprints needs to be done before the 4+4 planning.
Therefore, the PO already needs to know what is going to be implemented before the 4+4
planning takes place.
To know what user stories to conduct the PO uses the knowledge of what the market desires
and to know this they often takes part of researches that has been done on the market. The
user stories are categorized in two piles, one contains high prioritized and the other contains
low prioritized user stories. Usually, the task with high prioritization is the one that is going
to be implemented the next upcoming four weeks and the other in the low prioritized pile is
often proponed to later sprints.
SPRINT
Each sprint in the development process contains of a number of different phases. The first
phase is the sprint planning, which is further described below. After this initial phase the
sprint begins and is usually two weeks long. Each day of the sprint there a scrum meeting,
further described below.
Sprint planning:
The first activity in the Scrum process before a new sprint is sprint planning. During this
meeting the interaction designers are going through the blueprints of the tasks (items) that
44
shall be implemented during the adjacent sprint. Team members then have the opportunity
to discuss the blueprint with the interaction designers. Users are represented during this
meeting through user stories (few sentence of which functions the user needs to accomplish a
specific task, they can be seen as informal requirements), towards each user story the team
members attach tasks. Each task is then prioritized and the team estimates how many hours
it will take to implement, test and review them. The tasks with the highest priority shall be
implemented during the adjacent sprint and the rest of them will be added to the product
backlog.
Scrum meeting:
During the sprint, the teams hold daily scrum meetings. It is the scrum master who has the
responsibility of these meetings. The purpose of the meeting is to discuss the process of the
different tasks and obstacles that has a raised since last meeting. A meeting is about 15
minutes long and it is the master´s responsibility to keep the meeting short and focused. At
each meeting everyone in the team shall be able to answer the following questions:
What have you completed, relative to the backlog, since last meeting?
What obstacles got in your way of completing this work?
What specific things do you plan to accomplish to next scrum meeting?
POST-SPRINT
The post-sprint includes the activities that are accomplished in the end of each sprint. These
activities are the usability process (often after a few sprints), the sprint demo and the sprint
retrospective.
Usability process:
After a few (2-3) sprints have been accomplished there is a minor and formative usability
test. This usability process begun (December 2012) as a collaboration between LTH (The
Faculty of Engineering at Lund University) and Sony Mobile. Before this collaboration the
section did zero to two major usability tests a year.
The idea is that this collaboration should begin as a pilot project where student from LTH
and the two teams from the section should participate. The students shall meet the teams
every second week and a team shall meet the student every fourth week. Meaning that each
team performs approximately (depends on when there is an opportunity) usability test every
fourth week.
The process for the usability test is that first product owner, developers and test moderator
for the usability test is coming up with task scenarios for the test. Task scenarios are based on
features in the application that the development team has a feeling of being tricky for the
user. It is in the products owners interested to test features that will give highest return on
investment. The scope for the test is rather small compared to other usability tests. The type
of usability test is more a formative usability test and only a few (3-5) task scenarios are
prepared.
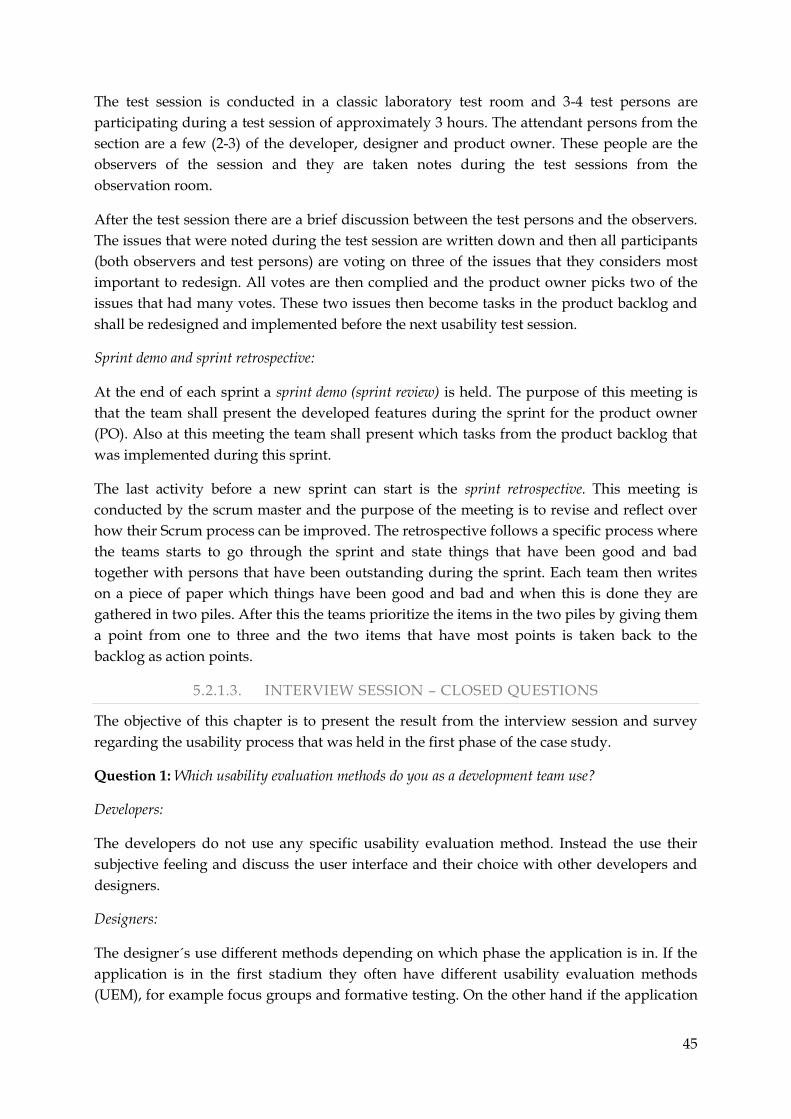
45
The test session is conducted in a classic laboratory test room and 3-4 test persons are
participating during a test session of approximately 3 hours. The attendant persons from the
section are a few (2-3) of the developer, designer and product owner. These people are the
observers of the session and they are taken notes during the test sessions from the
observation room.
After the test session there are a brief discussion between the test persons and the observers.
The issues that were noted during the test session are written down and then all participants
(both observers and test persons) are voting on three of the issues that they considers most
important to redesign. All votes are then complied and the product owner picks two of the
issues that had many votes. These two issues then become tasks in the product backlog and
shall be redesigned and implemented before the next usability test session.
Sprint demo and sprint retrospective:
At the end of each sprint a sprint demo (sprint review) is held. The purpose of this meeting is
that the team shall present the developed features during the sprint for the product owner
(PO). Also at this meeting the team shall present which tasks from the product backlog that
was implemented during this sprint.
The last activity before a new sprint can start is the sprint retrospective. This meeting is
conducted by the scrum master and the purpose of the meeting is to revise and reflect over
how their Scrum process can be improved. The retrospective follows a specific process where
the teams starts to go through the sprint and state things that have been good and bad
together with persons that have been outstanding during the sprint. Each team then writes
on a piece of paper which things have been good and bad and when this is done they are
gathered in two piles. After this the teams prioritize the items in the two piles by giving them
a point from one to three and the two items that have most points is taken back to the
backlog as action points.
5.2.1.3. INTERVIEW SESSION – CLOSED QUESTIONS
The objective of this chapter is to present the result from the interview session and survey
regarding the usability process that was held in the first phase of the case study.
Question 1: Which usability evaluation methods do you as a development team use?
Developers:
The developers do not use any specific usability evaluation method. Instead the use their
subjective feeling and discuss the user interface and their choice with other developers and
designers.
Designers:
The designer´s use different methods depending on which phase the application is in. If the
application is in the first stadium they often have different usability evaluation methods
(UEM), for example focus groups and formative testing. On the other hand if the application
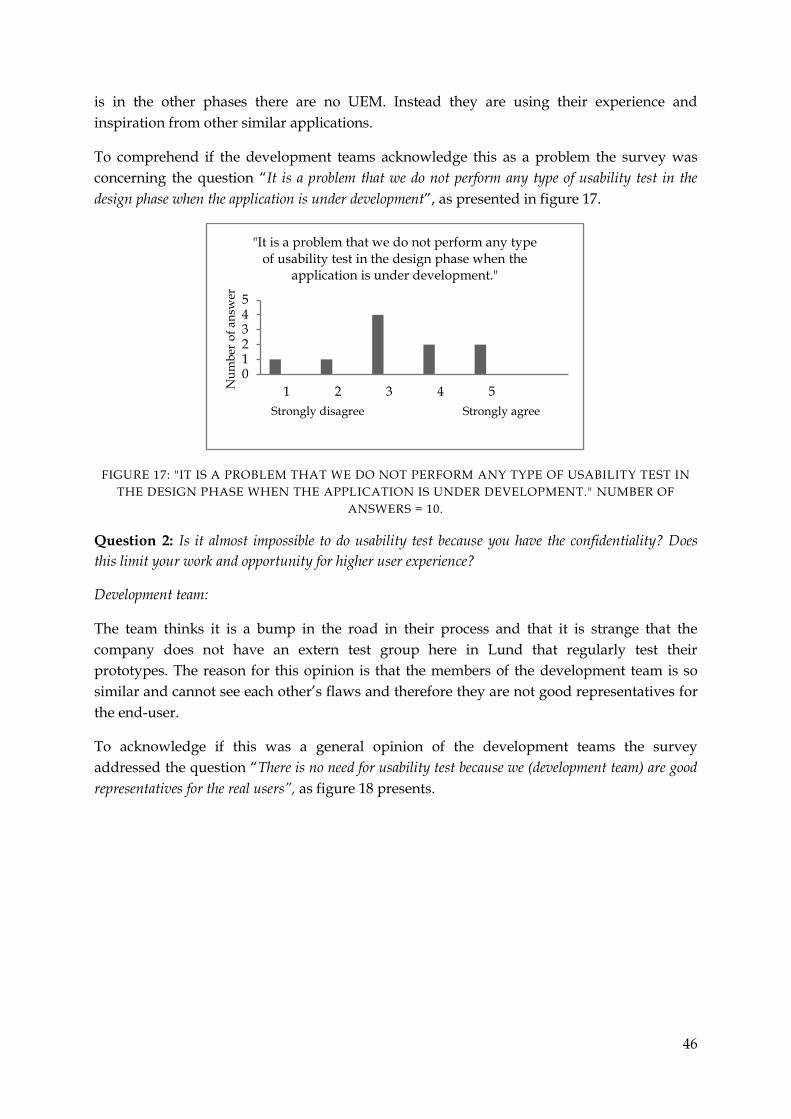
46
is in the other phases there are no UEM. Instead they are using their experience and
inspiration from other similar applications.
To comprehend if the development teams acknowledge this as a problem the survey was
concerning the question “It is a problem that we do not perform any type of usability test in the
design phase when the application is under development”, as presented in figure 17.
FIGURE 17: "IT IS A PROBLEM THAT WE DO NOT PERFORM ANY TYPE OF USABILITY TEST IN
THE DESIGN PHASE WHEN THE APPLICATION IS UNDER DEVELOPMENT." NUMBER OF
ANSWERS = 10.
Question 2: Is it almost impossible to do usability test because you have the confidentiality? Does
this limit your work and opportunity for higher user experience?
Development team:
The team thinks it is a bump in the road in their process and that it is strange that the
company does not have an extern test group here in Lund that regularly test their
prototypes. The reason for this opinion is that the members of the development team is so
similar and cannot see each other’s flaws and therefore they are not good representatives for
the end-user.
To acknowledge if this was a general opinion of the development teams the survey
addressed the question “There is no need for usability test because we (development team) are good
representatives for the real users”, as figure 18 presents.
012345
1 2 3 4 5Nu
mb
er o
f a
nsw
er
Strongly disagree Strongly agree
"It is a problem that we do not perform any type of usability test in the design phase when the
application is under development."
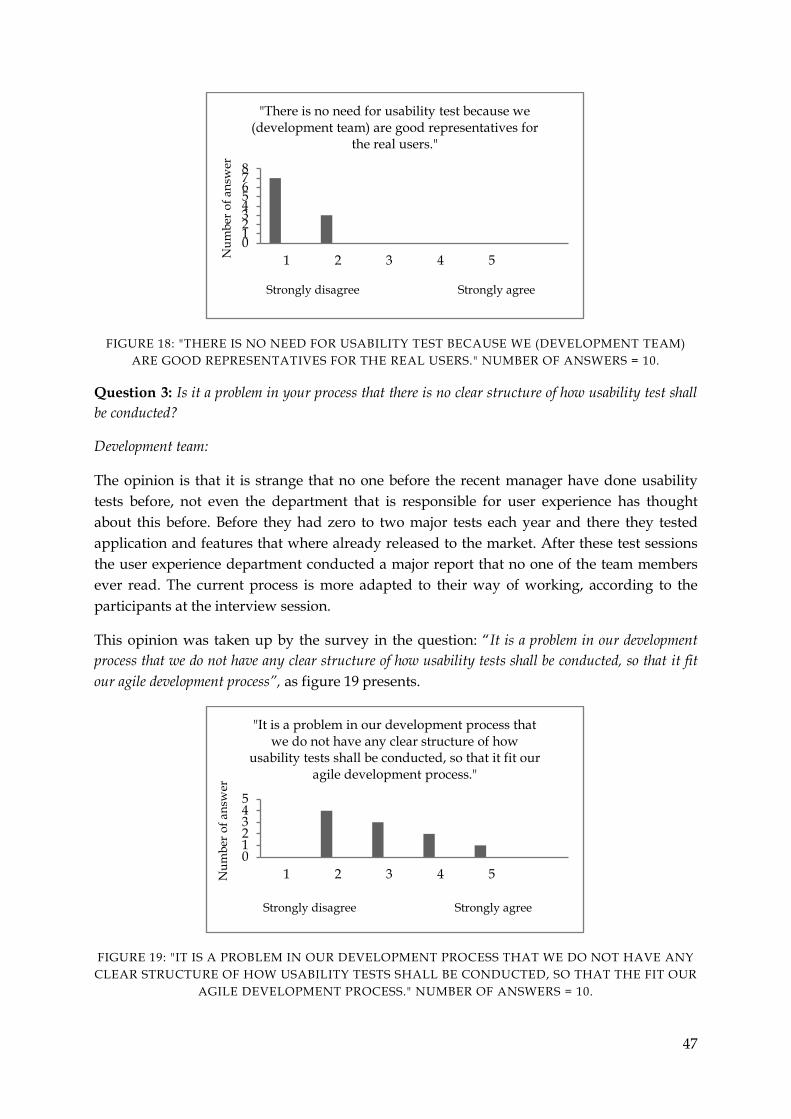
47
FIGURE 18: "THERE IS NO NEED FOR USABILITY TEST BECAUSE WE (DEVELOPMENT TEAM)
ARE GOOD REPRESENTATIVES FOR THE REAL USERS." NUMBER OF ANSWERS = 10.
Question 3: Is it a problem in your process that there is no clear structure of how usability test shall
be conducted?
Development team:
The opinion is that it is strange that no one before the recent manager have done usability
tests before, not even the department that is responsible for user experience has thought
about this before. Before they had zero to two major tests each year and there they tested
application and features that where already released to the market. After these test sessions
the user experience department conducted a major report that no one of the team members
ever read. The current process is more adapted to their way of working, according to the
participants at the interview session.
This opinion was taken up by the survey in the question: “It is a problem in our development
process that we do not have any clear structure of how usability tests shall be conducted, so that it fit
our agile development process”, as figure 19 presents.
FIGURE 19: "IT IS A PROBLEM IN OUR DEVELOPMENT PROCESS THAT WE DO NOT HAVE ANY
CLEAR STRUCTURE OF HOW USABILITY TESTS SHALL BE CONDUCTED, SO THAT THE FIT OUR
AGILE DEVELOPMENT PROCESS." NUMBER OF ANSWERS = 10.
012345678
1 2 3 4 5Nu
mb
er o
f a
nsw
er
Strongly disagree Strongly agree
"There is no need for usability test because we (development team) are good representatives for
the real users."
012345
1 2 3 4 5Nu
mb
er o
f a
nsw
er
Strongly disagree Strongly agree
"It is a problem in our development process that we do not have any clear structure of how
usability tests shall be conducted, so that it fit our agile development process."
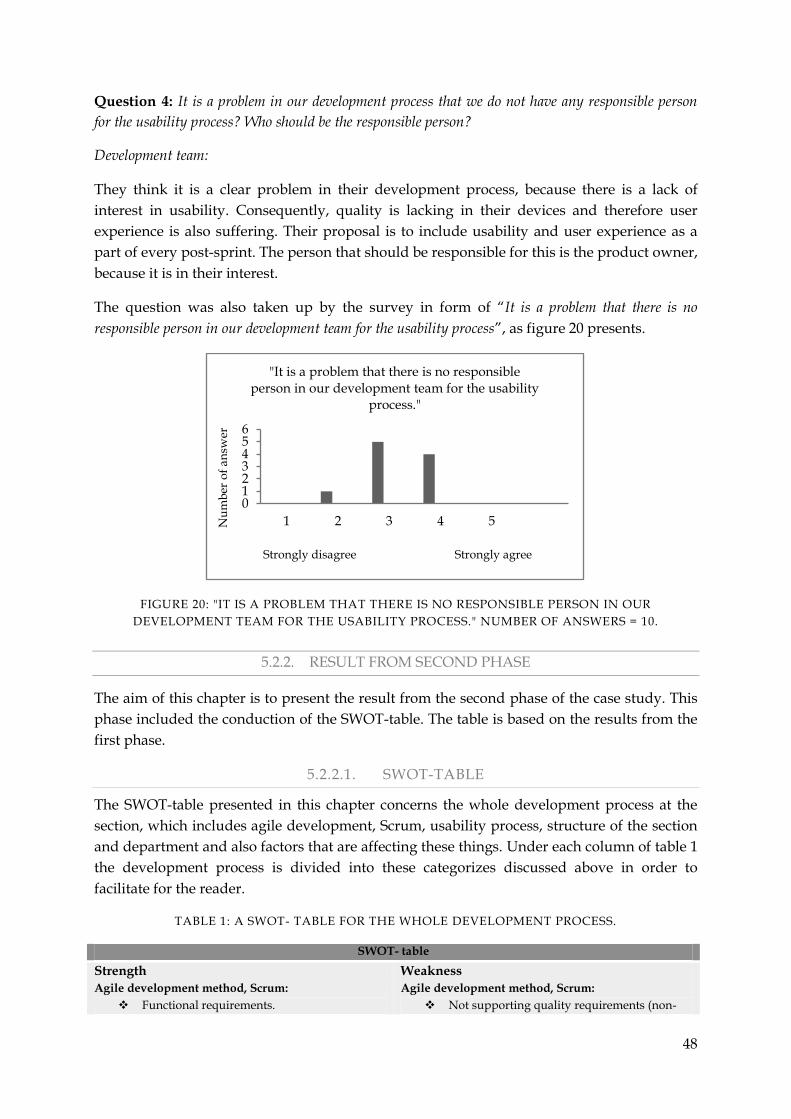
48
Question 4: It is a problem in our development process that we do not have any responsible person
for the usability process? Who should be the responsible person?
Development team:
They think it is a clear problem in their development process, because there is a lack of
interest in usability. Consequently, quality is lacking in their devices and therefore user
experience is also suffering. Their proposal is to include usability and user experience as a
part of every post-sprint. The person that should be responsible for this is the product owner,
because it is in their interest.
The question was also taken up by the survey in form of “It is a problem that there is no
responsible person in our development team for the usability process”, as figure 20 presents.
FIGURE 20: "IT IS A PROBLEM THAT THERE IS NO RESPONSIBLE PERSON IN OUR
DEVELOPMENT TEAM FOR THE USABILITY PROCESS." NUMBER OF ANSWERS = 10.
5.2.2. RESULT FROM SECOND PHASE
The aim of this chapter is to present the result from the second phase of the case study. This
phase included the conduction of the SWOT-table. The table is based on the results from the
first phase.
5.2.2.1. SWOT-TABLE
The SWOT-table presented in this chapter concerns the whole development process at the
section, which includes agile development, Scrum, usability process, structure of the section
and department and also factors that are affecting these things. Under each column of table 1
the development process is divided into these categorizes discussed above in order to
facilitate for the reader.
TABLE 1: A SWOT- TABLE FOR THE WHOLE DEVELOPMENT PROCESS.
SWOT- table
Strength
Agile development method, Scrum:
Functional requirements.
Weakness
Agile development method, Scrum:
Not supporting quality requirements (non-
0123456
1 2 3 4 5Nu
mb
er o
f a
nsw
er
Strongly disagree Strongly agree
"It is a problem that there is no responsible person in our development team for the usability
process."
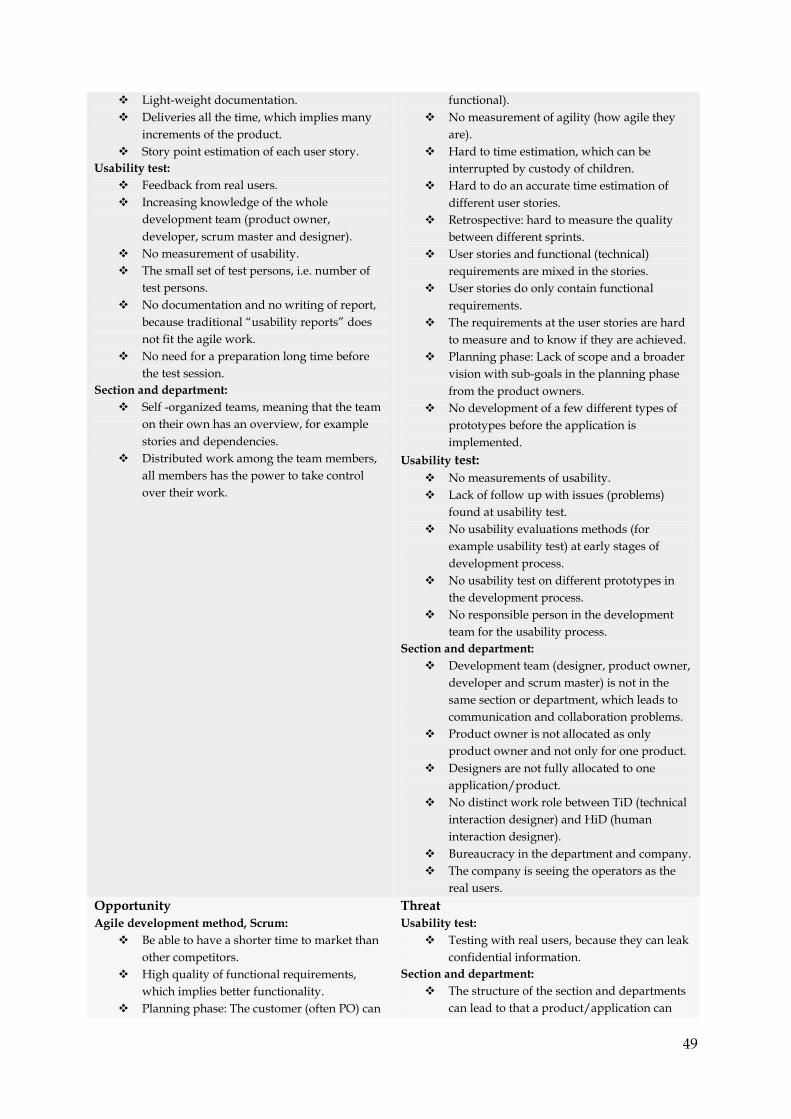
49
Light-weight documentation.
Deliveries all the time, which implies many
increments of the product.
Story point estimation of each user story.
Usability test:
Feedback from real users.
Increasing knowledge of the whole
development team (product owner,
developer, scrum master and designer).
No measurement of usability.
The small set of test persons, i.e. number of
test persons.
No documentation and no writing of report,
because traditional “usability reports” does
not fit the agile work.
No need for a preparation long time before
the test session.
Section and department:
Self -organized teams, meaning that the team
on their own has an overview, for example
stories and dependencies.
Distributed work among the team members,
all members has the power to take control
over their work.
functional).
No measurement of agility (how agile they
are).
Hard to time estimation, which can be
interrupted by custody of children.
Hard to do an accurate time estimation of
different user stories.
Retrospective: hard to measure the quality
between different sprints.
User stories and functional (technical)
requirements are mixed in the stories.
User stories do only contain functional
requirements.
The requirements at the user stories are hard
to measure and to know if they are achieved.
Planning phase: Lack of scope and a broader
vision with sub-goals in the planning phase
from the product owners.
No development of a few different types of
prototypes before the application is
implemented.
Usability test:
No measurements of usability.
Lack of follow up with issues (problems)
found at usability test.
No usability evaluations methods (for
example usability test) at early stages of
development process.
No usability test on different prototypes in
the development process.
No responsible person in the development
team for the usability process.
Section and department:
Development team (designer, product owner,
developer and scrum master) is not in the
same section or department, which leads to
communication and collaboration problems.
Product owner is not allocated as only
product owner and not only for one product.
Designers are not fully allocated to one
application/product.
No distinct work role between TiD (technical
interaction designer) and HiD (human
interaction designer).
Bureaucracy in the department and company.
The company is seeing the operators as the
real users.
Opportunity
Agile development method, Scrum:
Be able to have a shorter time to market than
other competitors.
High quality of functional requirements,
which implies better functionality.
Planning phase: The customer (often PO) can
Threat
Usability test:
Testing with real users, because they can leak
confidential information.
Section and department:
The structure of the section and departments
can lead to that a product/application can
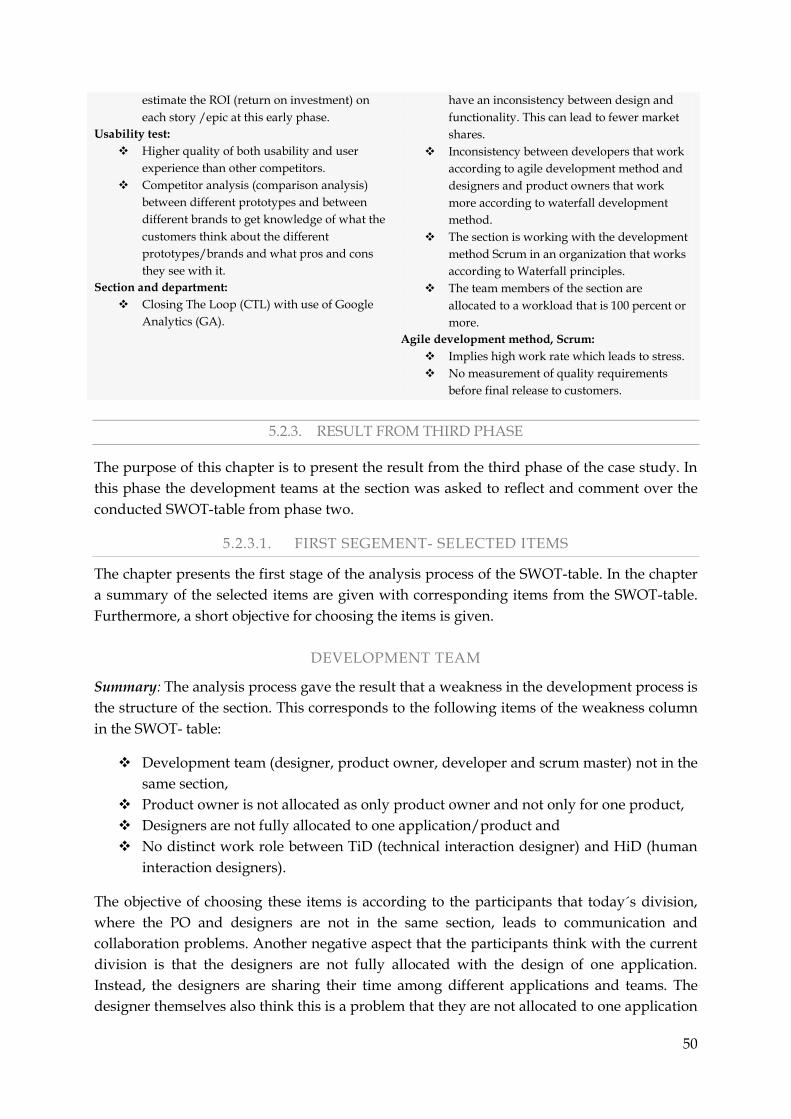
50
estimate the ROI (return on investment) on
each story /epic at this early phase.
Usability test:
Higher quality of both usability and user
experience than other competitors.
Competitor analysis (comparison analysis)
between different prototypes and between
different brands to get knowledge of what the
customers think about the different
prototypes/brands and what pros and cons
they see with it.
Section and department:
Closing The Loop (CTL) with use of Google
Analytics (GA).
have an inconsistency between design and
functionality. This can lead to fewer market
shares.
Inconsistency between developers that work
according to agile development method and
designers and product owners that work
more according to waterfall development
method.
The section is working with the development
method Scrum in an organization that works
according to Waterfall principles.
The team members of the section are
allocated to a workload that is 100 percent or
more.
Agile development method, Scrum:
Implies high work rate which leads to stress.
No measurement of quality requirements
before final release to customers.
5.2.3. RESULT FROM THIRD PHASE
The purpose of this chapter is to present the result from the third phase of the case study. In
this phase the development teams at the section was asked to reflect and comment over the
conducted SWOT-table from phase two.
5.2.3.1. FIRST SEGEMENT- SELECTED ITEMS
The chapter presents the first stage of the analysis process of the SWOT-table. In the chapter
a summary of the selected items are given with corresponding items from the SWOT-table.
Furthermore, a short objective for choosing the items is given.
DEVELOPMENT TEAM
Summary: The analysis process gave the result that a weakness in the development process is
the structure of the section. This corresponds to the following items of the weakness column
in the SWOT- table:
Development team (designer, product owner, developer and scrum master) not in the
same section,
Product owner is not allocated as only product owner and not only for one product,
Designers are not fully allocated to one application/product and
No distinct work role between TiD (technical interaction designer) and HiD (human
interaction designers).
The objective of choosing these items is according to the participants that today´s division,
where the PO and designers are not in the same section, leads to communication and
collaboration problems. Another negative aspect that the participants think with the current
division is that the designers are not fully allocated with the design of one application.
Instead, the designers are sharing their time among different applications and teams. The
designer themselves also think this is a problem that they are not allocated to one application
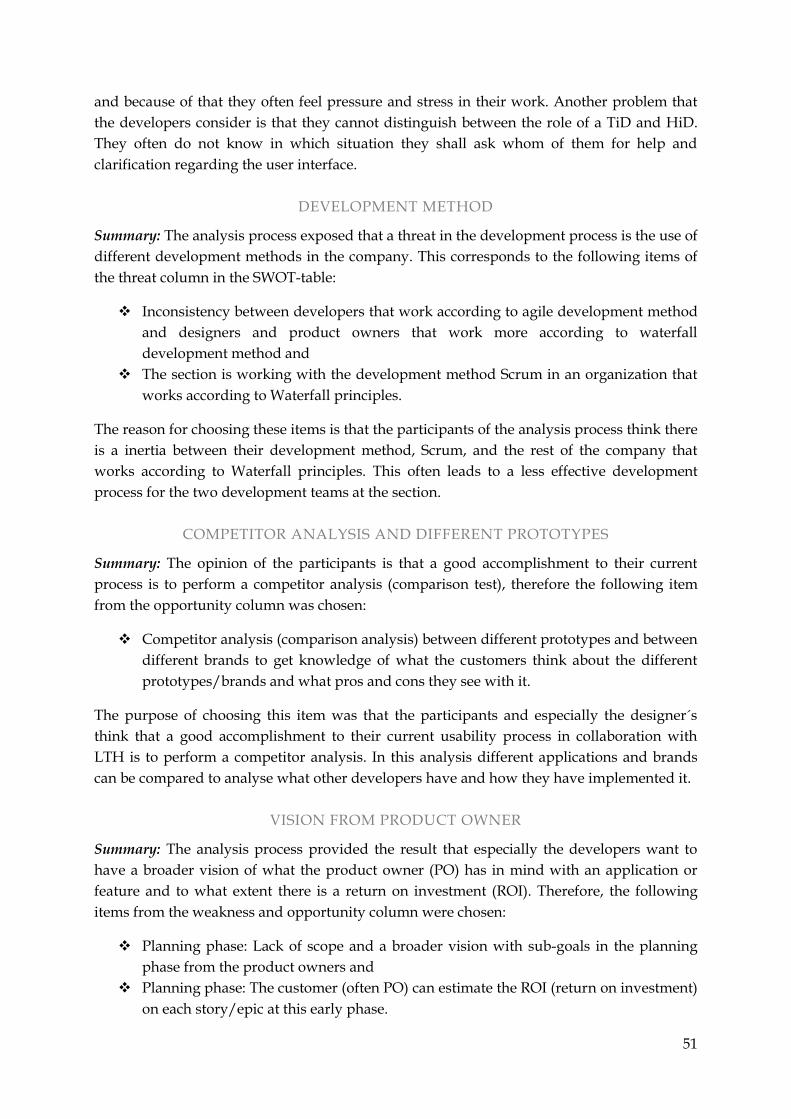
51
and because of that they often feel pressure and stress in their work. Another problem that
the developers consider is that they cannot distinguish between the role of a TiD and HiD.
They often do not know in which situation they shall ask whom of them for help and
clarification regarding the user interface.
DEVELOPMENT METHOD
Summary: The analysis process exposed that a threat in the development process is the use of
different development methods in the company. This corresponds to the following items of
the threat column in the SWOT-table:
Inconsistency between developers that work according to agile development method
and designers and product owners that work more according to waterfall
development method and
The section is working with the development method Scrum in an organization that
works according to Waterfall principles.
The reason for choosing these items is that the participants of the analysis process think there
is a inertia between their development method, Scrum, and the rest of the company that
works according to Waterfall principles. This often leads to a less effective development
process for the two development teams at the section.
COMPETITOR ANALYSIS AND DIFFERENT PROTOTYPES
Summary: The opinion of the participants is that a good accomplishment to their current
process is to perform a competitor analysis (comparison test), therefore the following item
from the opportunity column was chosen:
Competitor analysis (comparison analysis) between different prototypes and between
different brands to get knowledge of what the customers think about the different
prototypes/brands and what pros and cons they see with it.
The purpose of choosing this item was that the participants and especially the designer´s
think that a good accomplishment to their current usability process in collaboration with
LTH is to perform a competitor analysis. In this analysis different applications and brands
can be compared to analyse what other developers have and how they have implemented it.
VISION FROM PRODUCT OWNER
Summary: The analysis process provided the result that especially the developers want to
have a broader vision of what the product owner (PO) has in mind with an application or
feature and to what extent there is a return on investment (ROI). Therefore, the following
items from the weakness and opportunity column were chosen:
Planning phase: Lack of scope and a broader vision with sub-goals in the planning
phase from the product owners and
Planning phase: The customer (often PO) can estimate the ROI (return on investment)
on each story/epic at this early phase.
52
The objective of choosing these items is that the participants of the analysis session think that
the product owner has to give them a broader view of what is going to be implemented and
which return on investment (ROI) it gives. By performing this, the development teams can
feel more committed to the work and also by estimate ROI it can be assured that right
features or applications are developed before other.
USER STORIES AND REQUIREMENTS
Summary: The analysis process also exposed that a weakness and threat in the development
process is the lack of quality requirements and no measurement of quality. Furthermore,
user stories and functional (technical) requirements are mixed. This corresponds to the
following items of the SWOT-table:
Not supporting quality requirements (non-functional),
User stories and functional (technical) requirements are mixed in the stories and
No measurement of quality requirements before final release to customers.
According to the participants of the analysis process user stories and functional requirements
are mixed up in the stories. Also, the quality measurement which is conducted with help of
Definition of Done (DoD) is more a stability measurement and therefore these items were
chosen.
SELF-ORGANIZED TEAMS AND DISTRIBUTED WORK
Summary: The analysis session of the SWOT-table showed that the participants will retain
the following items from the strength column:
Self -organized teams, meaning that the team on their own has an overview, for
example stories and dependencies and
Distributed work among the team members, all members has the power to take
control over their work.
According to the participants in the analysis process this is a result of that they now work
according to agile development. Before, when they had the development process heartbeat
(which is a form of Waterfall model) they were much more controlled by the section
manager and their work was not so independent. Therefore they would like to retain their
current development process, but strength it by scaling the agile principles so it more fits
their development process.
53
5.2.3.2. SECOND STAGE – IMPROVEMENT SUGGESTION
The purpose of this chapter is to present the improvement suggestions that were constructed
in the second stage of the analysis process of the SWOT-table.
DEVELOPMENT TEAM
Improvement suggestion: The suggestion is to do a restructure of the departments and
sections, where the designers and product owners are in the same section as the developers.
The product owners and designers should have a similar structure of their work as the
feature team leaders (FTL) has. Meaning that the designers will be allocated to the
applications that the section and developers shall implement and the product owner(s) shall
be fully allocated as the customer to the developing applications at the section. The outcome
of this is that each development team will contain all resources (skills) that are necessary to
develop an application of high quality, which implies that the development teams will be
small companies in the company.
DEVELOPMENT METHOD
Improvement suggestion: The recommendation is to gather the whole company and learn all
sections and departments to work according to agile principles, if needed the agile principles
can be scaled to fit the specific situation. Also, to make a more effective development process
where time to market is shorted the concept Closing The Loop (CTL) with Google Analytics
(GA) can be used, presented in chapter 4.3.3.
COMPETITOR ANALYSIS AND DIFFERENT PROTOTYPES
Improvement suggestion: By use of competitor analysis in the current usability process it is
easier to know if the feature or whole application is worth to implement. The idea consists of
creating a few variants, prototypes, when a new application or feature shall be implemented
and then perform a competitor analysis, in form of a focus group. Also, this type of focus
group can increase and broad the knowledge of what other brands has and how they
implement it.
VISION FROM PRODUCT OWNER
Improvement suggestion: The proposal is to through the use of return on investment (ROI)
estimation (on the different user stories and their respective task) the view of the
development team will be broader. Another opportunity with this estimation is that the PO
can then in the current usability tests establish that they will give high ROI. Preferably, the
vision from PO should be done in the planning phase (4+4) in the current development
process.
54
USER STORIES AND REQUIREMENTS
Improvement suggestion: The proposal is to include quality requirements in the user stories
and make the requirements measurable, in that way it is easy to measure if the requirements
are achieved. The writing of the quality requirements can for example be done in the
planning phase where the user stories are written and be verified at the sprint demo.
5.2.3.3. THIRD STAGE – COST-BENEFIT EVALUATION
The aim of this chapter is to present the third stage of the analysis process of the SWOT-
table. The purpose was to conduct a cost-benefit analysis of the improvement suggestions
discussed in the second stage of the analysis process. As the reader already has noticed the
evaluation is based on an interview session where the improvement suggestions was
presented and the participants evaluated them according to the questions presented in
appendix G and by help of a Net Promoter Score (NPS).
DEVELOPMENT TEAM
Cost-benefit evaluation: According to the cost-benefit evaluation the benefit of restructuring
the sections and departments is higher than the cost. Because the benefit of this proposal
means that the whole development will be gathered under one section and work as one unit.
If this becomes reality, the development process will be more effective and the quality of the
developed application will increase. The cost of changing the structure of the sections and
departments will not be so high because the existing employees only need to be restructured.
DEVELOPMENT METHOD
Cost-benefit evaluation: The evaluation presented that the participants think that the cost of
teaching the whole company to work according to agile principles will be quite expensive.
However, the benefit will be much higher than the cost of performing it. Furthermore, the
evaluation showed that the participants think that the GA (Google Analytics) will help them
to get a distribution of data that is not possible to get with classic usability evaluation
methods. This is the most valuable benefit of Google Analytics. Furthermore, the cost of GA
is not enormous therefore the benefit is higher than the cost. When it comes to the suggestion
Closing The Loop (CTL) the evaluation expose that the participants think that this will
improve their process and make it more effective, but also enables them to deliver the
minimum acceptable scope that has high quality for the end customers. For their section they
cannot appreciate any enormous costs with using CTL as development process.
COMPETITOR ANALYSIS AND DIFFERENT PROTOTYPES
Cost-benefit evaluation: According to the evaluation this suggestion will cost rather much in
terms of time. To conduct a competitor analysis will (according to the participated designers)
take about 3-4 hours, which will be added to their current usability process. On the other
hand the benefit of the suggested improvement will be rather high, therefore the benefit will
be higher than the cost.
55
VISION FROM PRODUCT OWNER
Cost-benefit evaluation: The cost-benefit evaluation revealed that the participants thought
that this suggestion would have a great benefit to their current process. If they would have a
vision of the whole application and which task that gives most ROI they would feel more
committed to their work. Also, they would have a feeling of which task that was more worth
for ROI and therefore they could be more accurate when they designed and implemented
these tasks. The cost for the product owner would only be 1-2 hours preparation before the
4+4 planning.
USER STORIES AND REQUIREMENTS
Cost-benefit evaluation: The benefit of conducting quality requirements and performing
measurement of them is of great interest according to the participants. Although, they think
they are not the right persons for performing this action and neither is the product owner.
Therefore, the company as whole should have some procedure when it comes to establish
and measure quality requirements in the agile development process. This would of course
cost a larger amount and the two alternatives are to either employ somebody with the skills
(costs more) or educate current employees (costs less).
EVALUATION OF COST VERSUS BENEFIT WITH NPS
Below the Net Promoter Score for the improvement suggestions are presented (see table 2).
As the reader already know the aim for conducting a Net Promoter Score was to evaluate the
improvement suggestion through as high benefit as possible to minor cost. Furthermore, the
data from the Net Promoter Score can be found in appendix H.
TABLE 2: THE NET PROMOTER SCORE FOR THE IMPROVEMENT SUGGESTIONS.
Improvement suggestion Total NPS
Development team
Development method
Competitor analysis and different prototypes
Vision from product owner
User stories and requirements
5.2.4. RESULT FROM FOURTH PHASE
The objective of this chapter is to describe the result from the fourth phase of the case study.
In this chapter recommendations regarding how the current development process can be
improved are discussed.
The recommendations given for the current development process are partly based on the Net
Promoter Score and the information which was collected through use of the different
ethnographical methods. As the reader already noticed, the recommendations are prioritized
in the order that the development teams think they gives most benefit for minor cost in a
decreasing scale.
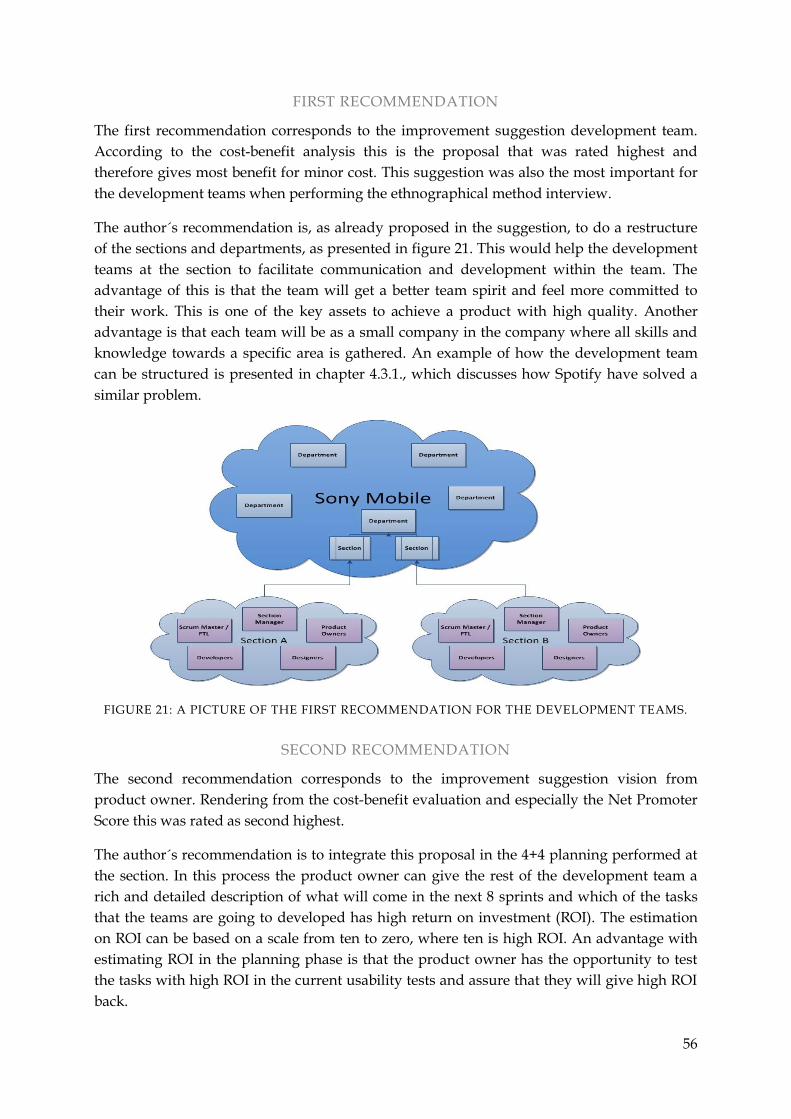
56
FIRST RECOMMENDATION
The first recommendation corresponds to the improvement suggestion development team.
According to the cost-benefit analysis this is the proposal that was rated highest and
therefore gives most benefit for minor cost. This suggestion was also the most important for
the development teams when performing the ethnographical method interview.
The author´s recommendation is, as already proposed in the suggestion, to do a restructure
of the sections and departments, as presented in figure 21. This would help the development
teams at the section to facilitate communication and development within the team. The
advantage of this is that the team will get a better team spirit and feel more committed to
their work. This is one of the key assets to achieve a product with high quality. Another
advantage is that each team will be as a small company in the company where all skills and
knowledge towards a specific area is gathered. An example of how the development team
can be structured is presented in chapter 4.3.1., which discusses how Spotify have solved a
similar problem.
FIGURE 21: A PICTURE OF THE FIRST RECOMMENDATION FOR THE DEVELOPMENT TEAMS.
SECOND RECOMMENDATION
The second recommendation corresponds to the improvement suggestion vision from
product owner. Rendering from the cost-benefit evaluation and especially the Net Promoter
Score this was rated as second highest.
The author´s recommendation is to integrate this proposal in the 4+4 planning performed at
the section. In this process the product owner can give the rest of the development team a
rich and detailed description of what will come in the next 8 sprints and which of the tasks
that the teams are going to developed has high return on investment (ROI). The estimation
on ROI can be based on a scale from ten to zero, where ten is high ROI. An advantage with
estimating ROI in the planning phase is that the product owner has the opportunity to test
the tasks with high ROI in the current usability tests and assure that they will give high ROI
back.
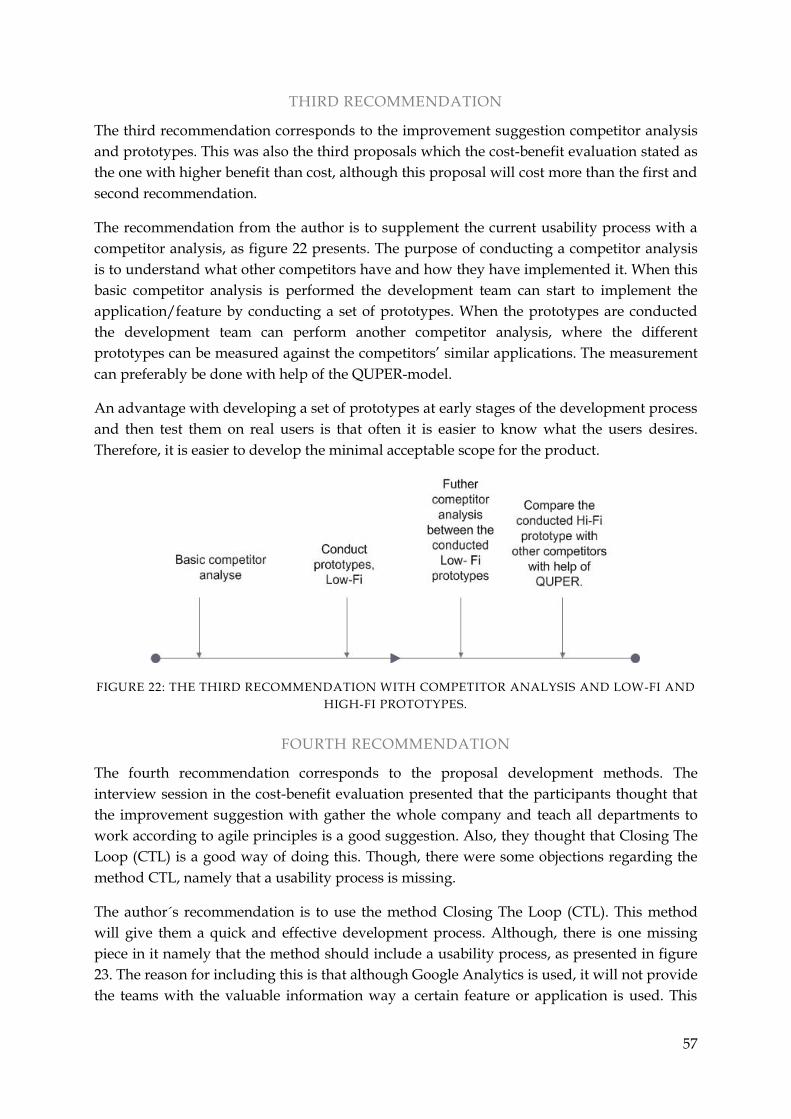
57
THIRD RECOMMENDATION
The third recommendation corresponds to the improvement suggestion competitor analysis
and prototypes. This was also the third proposals which the cost-benefit evaluation stated as
the one with higher benefit than cost, although this proposal will cost more than the first and
second recommendation.
The recommendation from the author is to supplement the current usability process with a
competitor analysis, as figure 22 presents. The purpose of conducting a competitor analysis
is to understand what other competitors have and how they have implemented it. When this
basic competitor analysis is performed the development team can start to implement the
application/feature by conducting a set of prototypes. When the prototypes are conducted
the development team can perform another competitor analysis, where the different
prototypes can be measured against the competitors’ similar applications. The measurement
can preferably be done with help of the QUPER-model.
An advantage with developing a set of prototypes at early stages of the development process
and then test them on real users is that often it is easier to know what the users desires.
Therefore, it is easier to develop the minimal acceptable scope for the product.
FIGURE 22: THE THIRD RECOMMENDATION WITH COMPETITOR ANALYSIS AND LOW-FI AND
HIGH-FI PROTOTYPES.
FOURTH RECOMMENDATION
The fourth recommendation corresponds to the proposal development methods. The
interview session in the cost-benefit evaluation presented that the participants thought that
the improvement suggestion with gather the whole company and teach all departments to
work according to agile principles is a good suggestion. Also, they thought that Closing The
Loop (CTL) is a good way of doing this. Though, there were some objections regarding the
method CTL, namely that a usability process is missing.
The author´s recommendation is to use the method Closing The Loop (CTL). This method
will give them a quick and effective development process. Although, there is one missing
piece in it namely that the method should include a usability process, as presented in figure
23. The reason for including this is that although Google Analytics is used, it will not provide
the teams with the valuable information way a certain feature or application is used. This
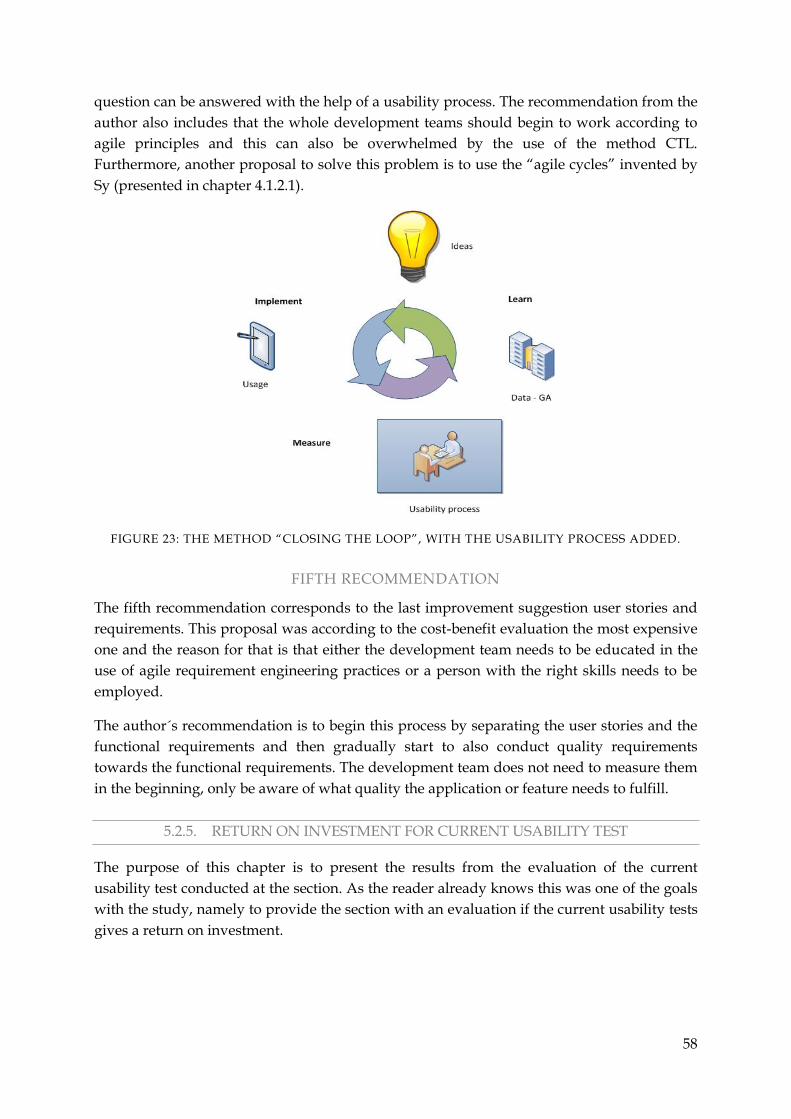
58
question can be answered with the help of a usability process. The recommendation from the
author also includes that the whole development teams should begin to work according to
agile principles and this can also be overwhelmed by the use of the method CTL.
Furthermore, another proposal to solve this problem is to use the “agile cycles” invented by
Sy (presented in chapter 4.1.2.1).
FIGURE 23: THE METHOD “CLOSING THE LOOP”, WITH THE USABILITY PROCESS ADDED.
FIFTH RECOMMENDATION
The fifth recommendation corresponds to the last improvement suggestion user stories and
requirements. This proposal was according to the cost-benefit evaluation the most expensive
one and the reason for that is that either the development team needs to be educated in the
use of agile requirement engineering practices or a person with the right skills needs to be
employed.
The author´s recommendation is to begin this process by separating the user stories and the
functional requirements and then gradually start to also conduct quality requirements
towards the functional requirements. The development team does not need to measure them
in the beginning, only be aware of what quality the application or feature needs to fulfill.
5.2.5. RETURN ON INVESTMENT FOR CURRENT USABILITY TEST
The purpose of this chapter is to present the results from the evaluation of the current
usability test conducted at the section. As the reader already knows this was one of the goals
with the study, namely to provide the section with an evaluation if the current usability tests
gives a return on investment.
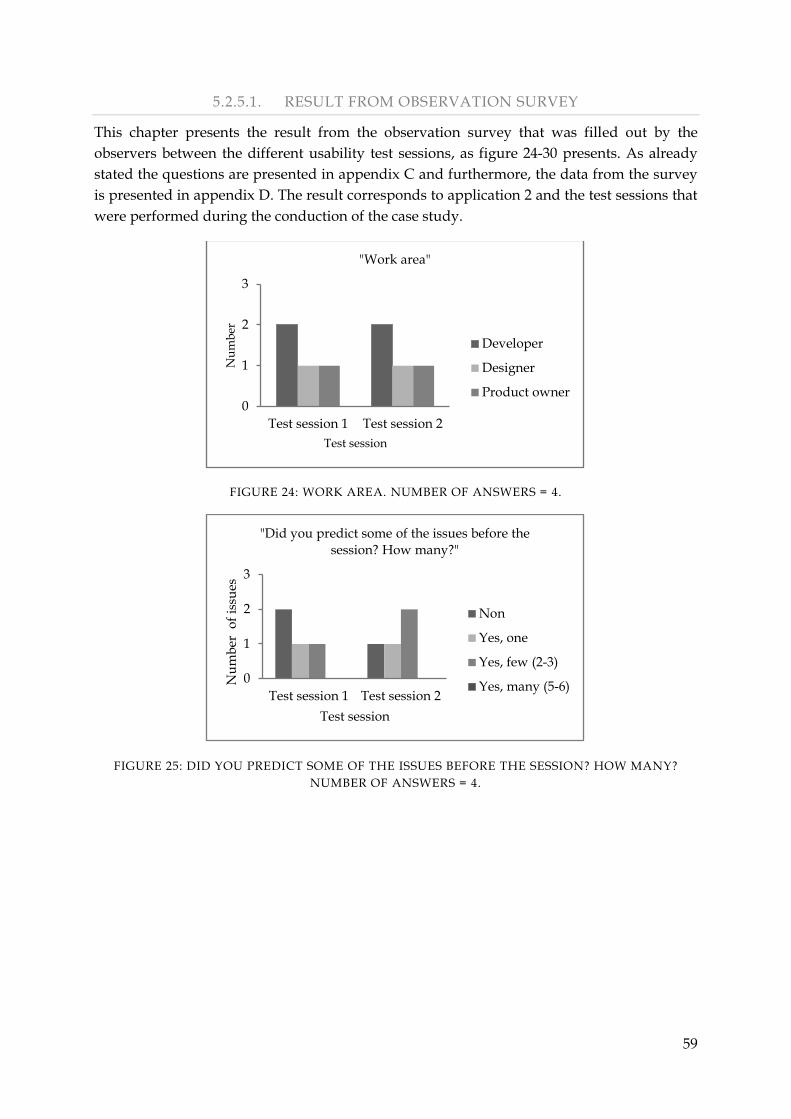
59
5.2.5.1. RESULT FROM OBSERVATION SURVEY
This chapter presents the result from the observation survey that was filled out by the
observers between the different usability test sessions, as figure 24-30 presents. As already
stated the questions are presented in appendix C and furthermore, the data from the survey
is presented in appendix D. The result corresponds to application 2 and the test sessions that
were performed during the conduction of the case study.
FIGURE 24: WORK AREA. NUMBER OF ANSWERS = 4.
FIGURE 25: DID YOU PREDICT SOME OF THE ISSUES BEFORE THE SESSION? HOW MANY?
NUMBER OF ANSWERS = 4.
0
1
2
3
Test session 1 Test session 2
Nu
mb
er
Test session
"Work area"
Developer
Designer
Product owner
0
1
2
3
Test session 1 Test session 2
Nu
mb
er
of
issu
es
Test session
"Did you predict some of the issues before the session? How many?"
Non
Yes, one
Yes, few (2-3)
Yes, many (5-6)
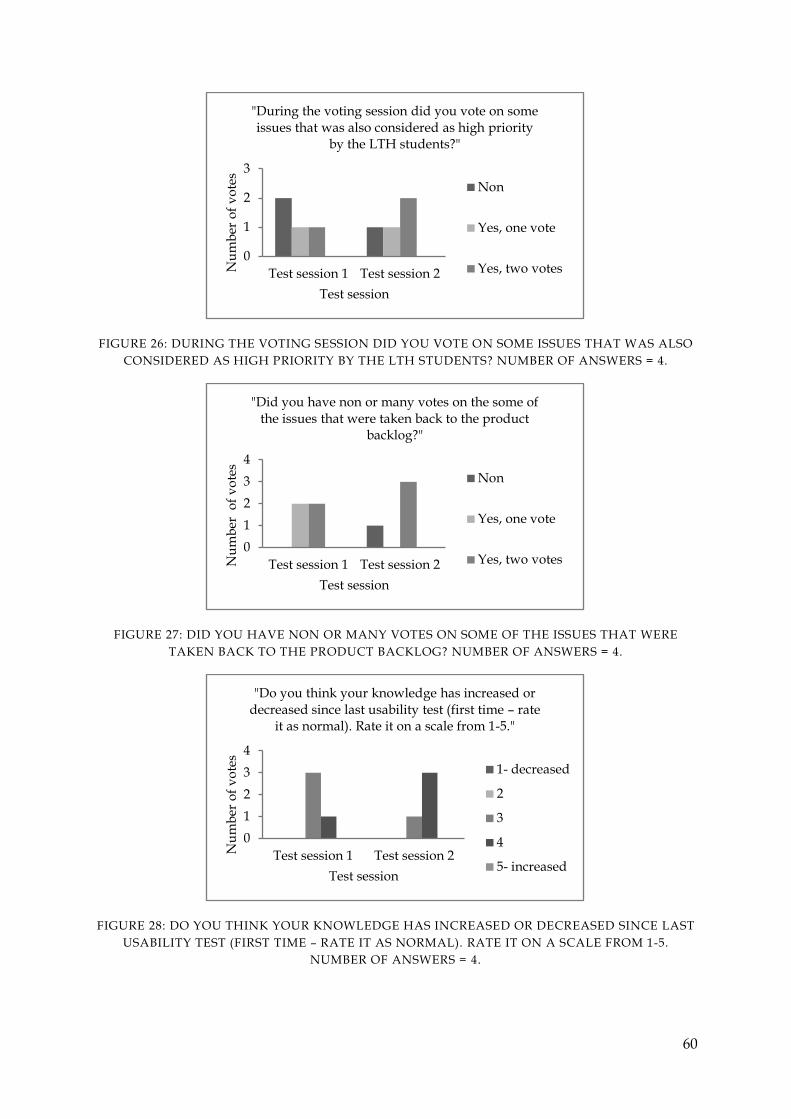
60
FIGURE 26: DURING THE VOTING SESSION DID YOU VOTE ON SOME ISSUES THAT WAS ALSO
CONSIDERED AS HIGH PRIORITY BY THE LTH STUDENTS? NUMBER OF ANSWERS = 4.
FIGURE 27: DID YOU HAVE NON OR MANY VOTES ON SOME OF THE ISSUES THAT WERE
TAKEN BACK TO THE PRODUCT BACKLOG? NUMBER OF ANSWERS = 4.
FIGURE 28: DO YOU THINK YOUR KNOWLEDGE HAS INCREASED OR DECREASED SINCE LAST
USABILITY TEST (FIRST TIME – RATE IT AS NORMAL). RATE IT ON A SCALE FROM 1-5.
NUMBER OF ANSWERS = 4.
0
1
2
3
Test session 1 Test session 2Nu
mb
er o
f v
ote
s
Test session
"During the voting session did you vote on some issues that was also considered as high priority
by the LTH students?"
Non
Yes, one vote
Yes, two votes
0
1
2
3
4
Test session 1 Test session 2Nu
mb
er
of
vo
tes
Test session
"Did you have non or many votes on the some of the issues that were taken back to the product
backlog?"
Non
Yes, one vote
Yes, two votes
0
1
2
3
4
Test session 1 Test session 2Nu
mb
er o
f v
ote
s
Test session
"Do you think your knowledge has increased or decreased since last usability test (first time – rate
it as normal). Rate it on a scale from 1-5."
1- decreased
2
3
4
5- increased
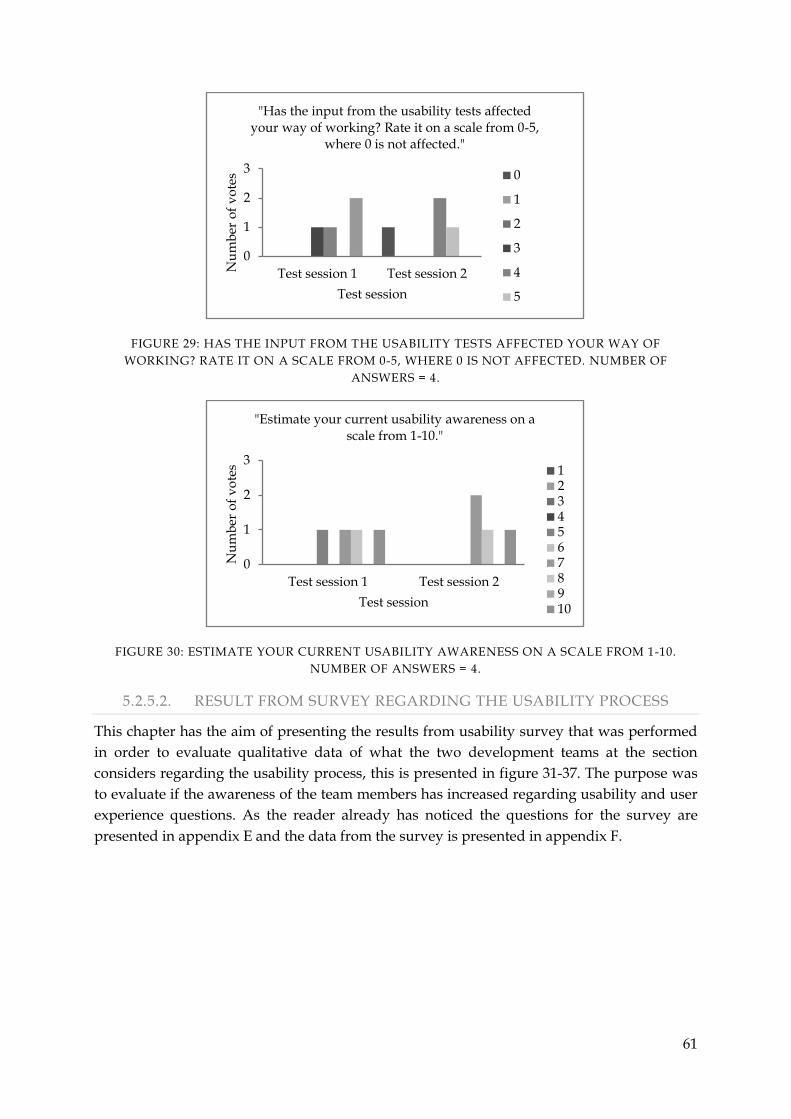
61
FIGURE 29: HAS THE INPUT FROM THE USABILITY TESTS AFFECTED YOUR WAY OF
WORKING? RATE IT ON A SCALE FROM 0-5, WHERE 0 IS NOT AFFECTED. NUMBER OF
ANSWERS = 4.
FIGURE 30: ESTIMATE YOUR CURRENT USABILITY AWARENESS ON A SCALE FROM 1-10.
NUMBER OF ANSWERS = 4.
5.2.5.2. RESULT FROM SURVEY REGARDING THE USABILITY PROCESS
This chapter has the aim of presenting the results from usability survey that was performed
in order to evaluate qualitative data of what the two development teams at the section
considers regarding the usability process, this is presented in figure 31-37. The purpose was
to evaluate if the awareness of the team members has increased regarding usability and user
experience questions. As the reader already has noticed the questions for the survey are
presented in appendix E and the data from the survey is presented in appendix F.
0
1
2
3
Test session 1 Test session 2Nu
mb
er o
f v
ote
s
Test session
"Has the input from the usability tests affected your way of working? Rate it on a scale from 0-5,
where 0 is not affected."
0
1
2
3
4
5
0
1
2
3
Test session 1 Test session 2
Nu
mb
er o
f v
ote
s
Test session
"Estimate your current usability awareness on a scale from 1-10."
12345678910
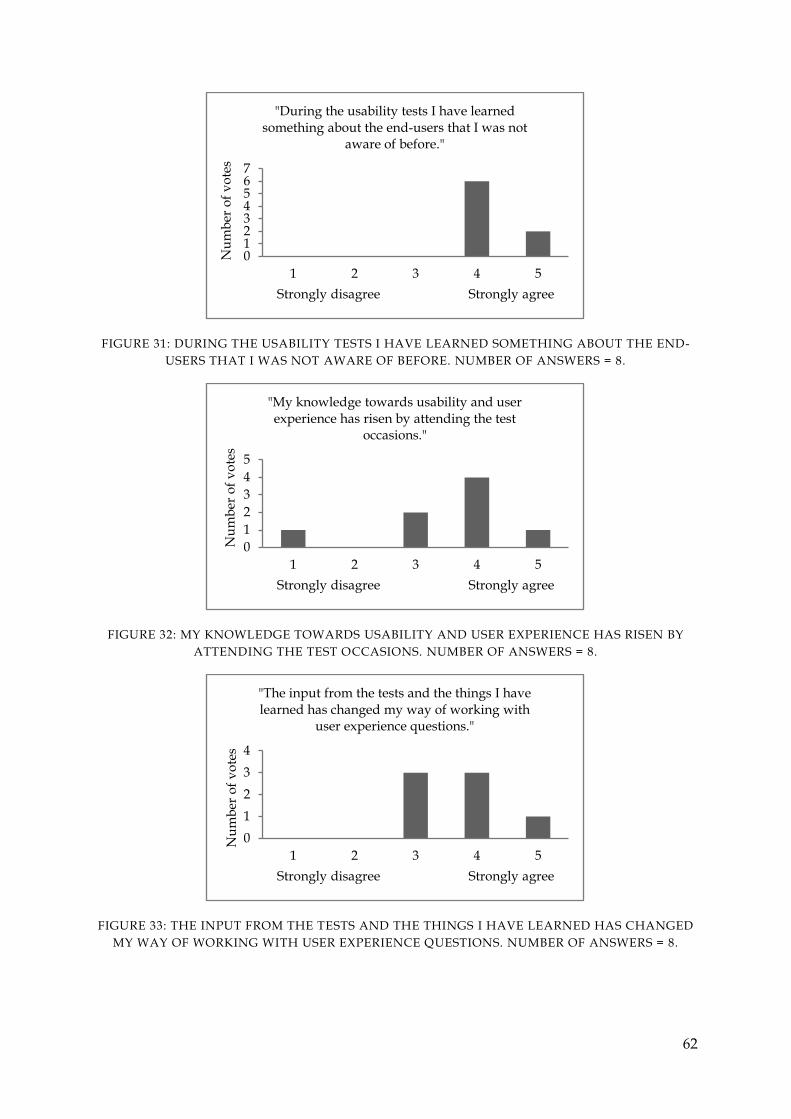
62
FIGURE 31: DURING THE USABILITY TESTS I HAVE LEARNED SOMETHING ABOUT THE END-
USERS THAT I WAS NOT AWARE OF BEFORE. NUMBER OF ANSWERS = 8.
FIGURE 32: MY KNOWLEDGE TOWARDS USABILITY AND USER EXPERIENCE HAS RISEN BY
ATTENDING THE TEST OCCASIONS. NUMBER OF ANSWERS = 8.
FIGURE 33: THE INPUT FROM THE TESTS AND THE THINGS I HAVE LEARNED HAS CHANGED
MY WAY OF WORKING WITH USER EXPERIENCE QUESTIONS. NUMBER OF ANSWERS = 8.
01234567
1 2 3 4 5
Nu
mb
er o
f v
ote
s
Strongly disagree Strongly agree
"During the usability tests I have learned something about the end-users that I was not
aware of before."
0
1
2
3
4
5
1 2 3 4 5
Nu
mb
er o
f v
ote
s
Strongly disagree Strongly agree
"My knowledge towards usability and user experience has risen by attending the test
occasions."
0
1
2
3
4
1 2 3 4 5
Nu
mb
er o
f v
ote
s
Strongly disagree Strongly agree
"The input from the tests and the things I have learned has changed my way of working with
user experience questions."

63
FIGURE 34: THE BENEFIT OF CONDUCTING THE USABILITY TESTS IS HIGHER THAN THE COST
OF PERFORMING THEM. NUMBER OF ANSWERS = 8.
FIGURE 35: NOW, WHEN I HAVE BEEN ON SEVERAL TEST OCCASIONS I HAVE A DEEPER
UNDERSTANDING FOR KNOWING WHAT THINGS THAT CAN BE CONSIDERED AS A PROBLEM
FOR THE USERS. NUMBER OF ANSWERS = 8.
FIGURE 36: NOW, AFTER A FEW TEST OCCASIONS I OFTEN SEE THE SAME MAJOR PROBLEMS
THAT THE TEST PERSONS (LTH STUDENTS) ALSO CONSIDER TO BE PROBLEMS. NUMBER OF
ANSWERS = 8.
0
1
2
3
4
1 2 3 4 5
Nu
mb
er o
f v
ote
s
Strongly disagree Strongly agree
"The benefit of conducting the usability tests is higher than the cost of performing them."
012345
1 2 3 4 5
Nu
mb
er o
f v
ote
s
Strongly disagree Strongly agree
"Now, when I have been on several test occasions I have a deeper understanding for knowing what things that can be considered as a problem for the
users."
0
2
4
6
1 2 3 4 5
Nu
mb
er o
f v
ote
s
Strongly disagree Strongly agree
"Now, after a few test occasions I often see the same major problems that the test persons (LTH
students) also consider to be problems."
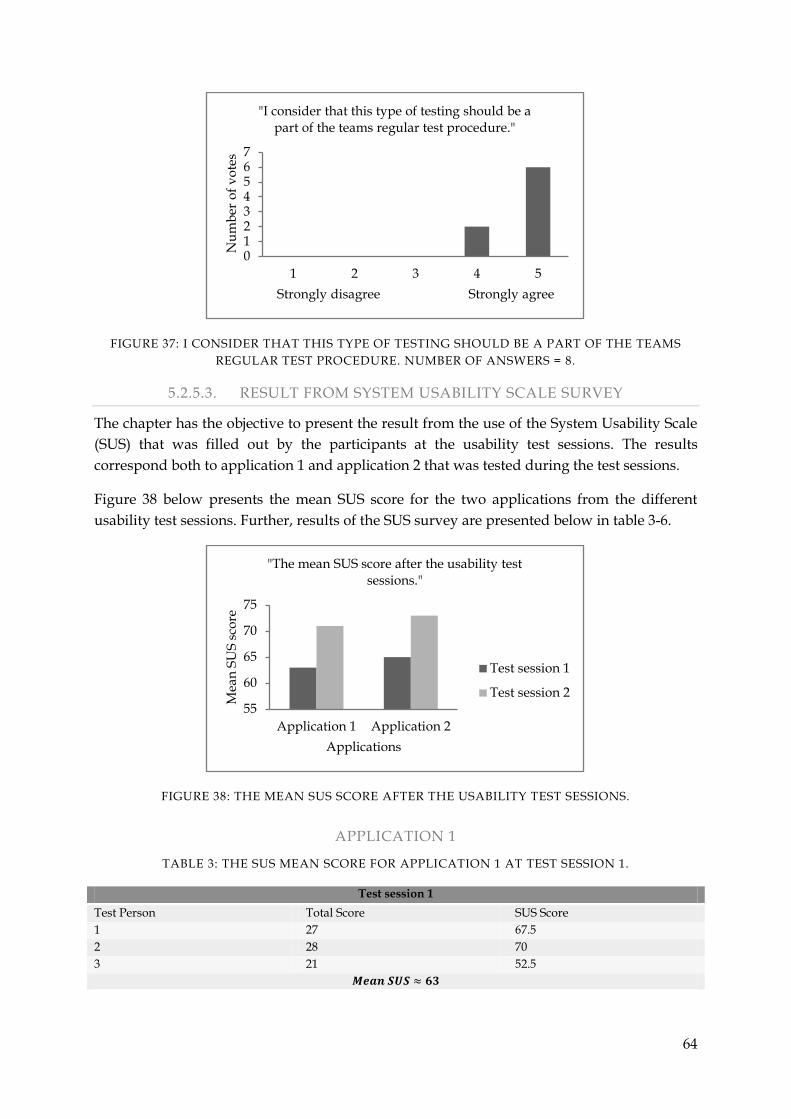
64
FIGURE 37: I CONSIDER THAT THIS TYPE OF TESTING SHOULD BE A PART OF THE TEAMS
REGULAR TEST PROCEDURE. NUMBER OF ANSWERS = 8.
5.2.5.3. RESULT FROM SYSTEM USABILITY SCALE SURVEY
The chapter has the objective to present the result from the use of the System Usability Scale
(SUS) that was filled out by the participants at the usability test sessions. The results
correspond both to application 1 and application 2 that was tested during the test sessions.
Figure 38 below presents the mean SUS score for the two applications from the different
usability test sessions. Further, results of the SUS survey are presented below in table 3-6.
FIGURE 38: THE MEAN SUS SCORE AFTER THE USABILITY TEST SESSIONS.
APPLICATION 1
TABLE 3: THE SUS MEAN SCORE FOR APPLICATION 1 AT TEST SESSION 1.
Test session 1
Test Person Total Score SUS Score
1 27 67.5
2 28 70
3 21 52.5
01234567
1 2 3 4 5
Nu
mb
er o
f v
ote
s
Strongly disagree Strongly agree
"I consider that this type of testing should be a part of the teams regular test procedure."
55
60
65
70
75
Application 1 Application 2
Mea
n S
US
sco
re
Applications
"The mean SUS score after the usability test sessions."
Test session 1
Test session 2
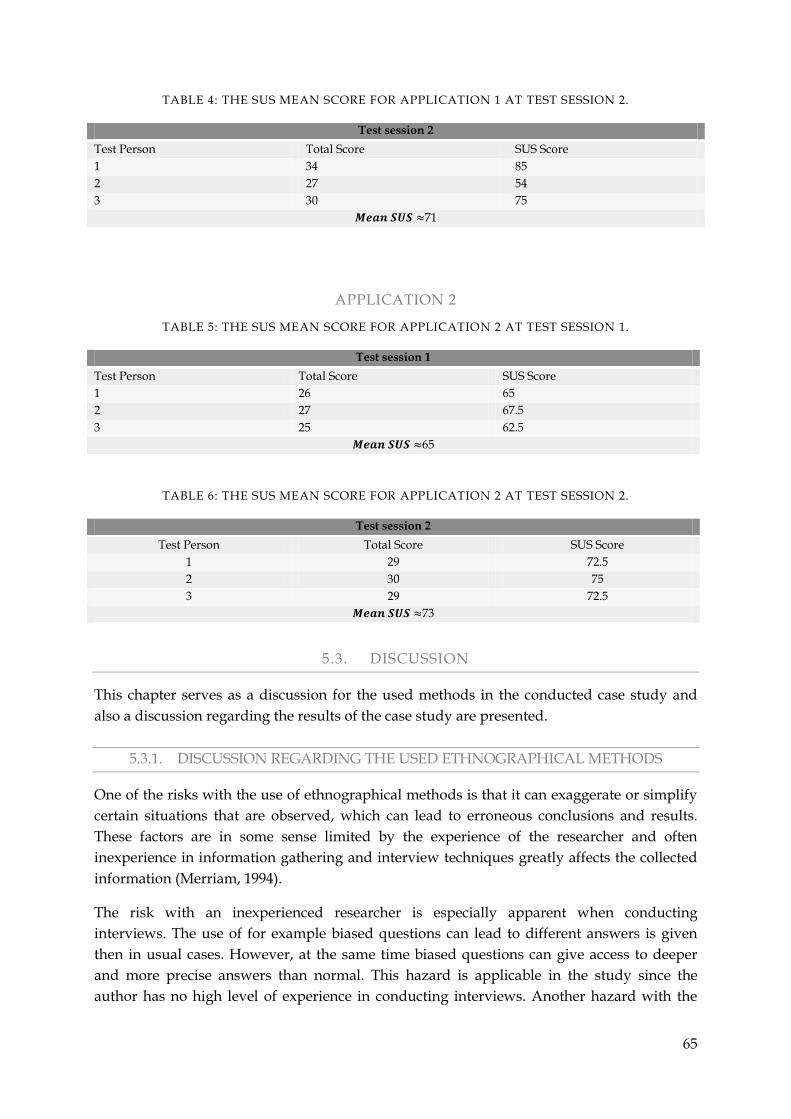
65
TABLE 4: THE SUS MEAN SCORE FOR APPLICATION 1 AT TEST SESSION 2.
Test session 2
Test Person Total Score SUS Score
1 34 85
2 27 54
3 30 75
71
APPLICATION 2
TABLE 5: THE SUS MEAN SCORE FOR APPLICATION 2 AT TEST SESSION 1.
Test session 1
Test Person Total Score SUS Score
1 26 65
2 27 67.5
3 25 62.5
65
TABLE 6: THE SUS MEAN SCORE FOR APPLICATION 2 AT TEST SESSION 2.
Test session 2
Test Person Total Score SUS Score
1 29 72.5
2 30 75
3 29 72.5
73
5.3. DISCUSSION
This chapter serves as a discussion for the used methods in the conducted case study and
also a discussion regarding the results of the case study are presented.
5.3.1. DISCUSSION REGARDING THE USED ETHNOGRAPHICAL METHODS
One of the risks with the use of ethnographical methods is that it can exaggerate or simplify
certain situations that are observed, which can lead to erroneous conclusions and results.
These factors are in some sense limited by the experience of the researcher and often
inexperience in information gathering and interview techniques greatly affects the collected
information (Merriam, 1994).
The risk with an inexperienced researcher is especially apparent when conducting
interviews. The use of for example biased questions can lead to different answers is given
then in usual cases. However, at the same time biased questions can give access to deeper
and more precise answers than normal. This hazard is applicable in the study since the
author has no high level of experience in conducting interviews. Another hazard with the
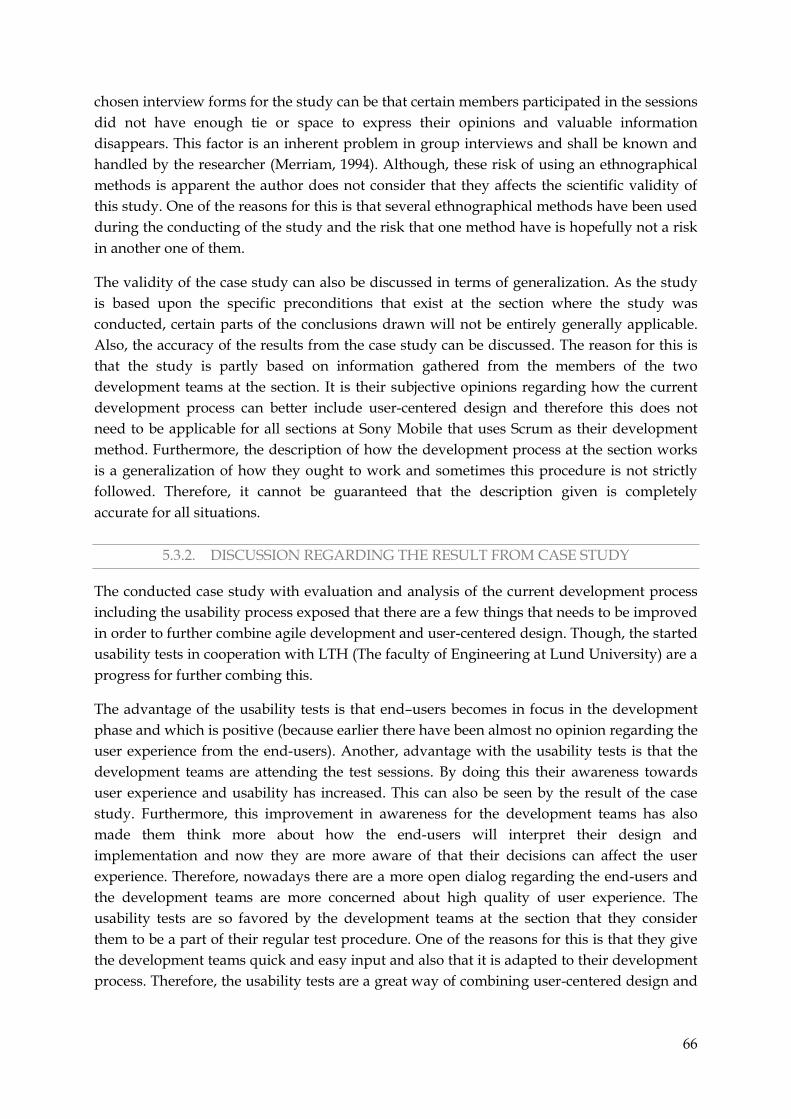
66
chosen interview forms for the study can be that certain members participated in the sessions
did not have enough tie or space to express their opinions and valuable information
disappears. This factor is an inherent problem in group interviews and shall be known and
handled by the researcher (Merriam, 1994). Although, these risk of using an ethnographical
methods is apparent the author does not consider that they affects the scientific validity of
this study. One of the reasons for this is that several ethnographical methods have been used
during the conducting of the study and the risk that one method have is hopefully not a risk
in another one of them.
The validity of the case study can also be discussed in terms of generalization. As the study
is based upon the specific preconditions that exist at the section where the study was
conducted, certain parts of the conclusions drawn will not be entirely generally applicable.
Also, the accuracy of the results from the case study can be discussed. The reason for this is
that the study is partly based on information gathered from the members of the two
development teams at the section. It is their subjective opinions regarding how the current
development process can better include user-centered design and therefore this does not
need to be applicable for all sections at Sony Mobile that uses Scrum as their development
method. Furthermore, the description of how the development process at the section works
is a generalization of how they ought to work and sometimes this procedure is not strictly
followed. Therefore, it cannot be guaranteed that the description given is completely
accurate for all situations.
5.3.2. DISCUSSION REGARDING THE RESULT FROM CASE STUDY
The conducted case study with evaluation and analysis of the current development process
including the usability process exposed that there are a few things that needs to be improved
in order to further combine agile development and user-centered design. Though, the started
usability tests in cooperation with LTH (The faculty of Engineering at Lund University) are a
progress for further combing this.
The advantage of the usability tests is that end–users becomes in focus in the development
phase and which is positive (because earlier there have been almost no opinion regarding the
user experience from the end-users). Another, advantage with the usability tests is that the
development teams are attending the test sessions. By doing this their awareness towards
user experience and usability has increased. This can also be seen by the result of the case
study. Furthermore, this improvement in awareness for the development teams has also
made them think more about how the end-users will interpret their design and
implementation and now they are more aware of that their decisions can affect the user
experience. Therefore, nowadays there are a more open dialog regarding the end-users and
the development teams are more concerned about high quality of user experience. The
usability tests are so favored by the development teams at the section that they consider
them to be a part of their regular test procedure. One of the reasons for this is that they give
the development teams quick and easy input and also that it is adapted to their development
process. Therefore, the usability tests are a great way of combining user-centered design and
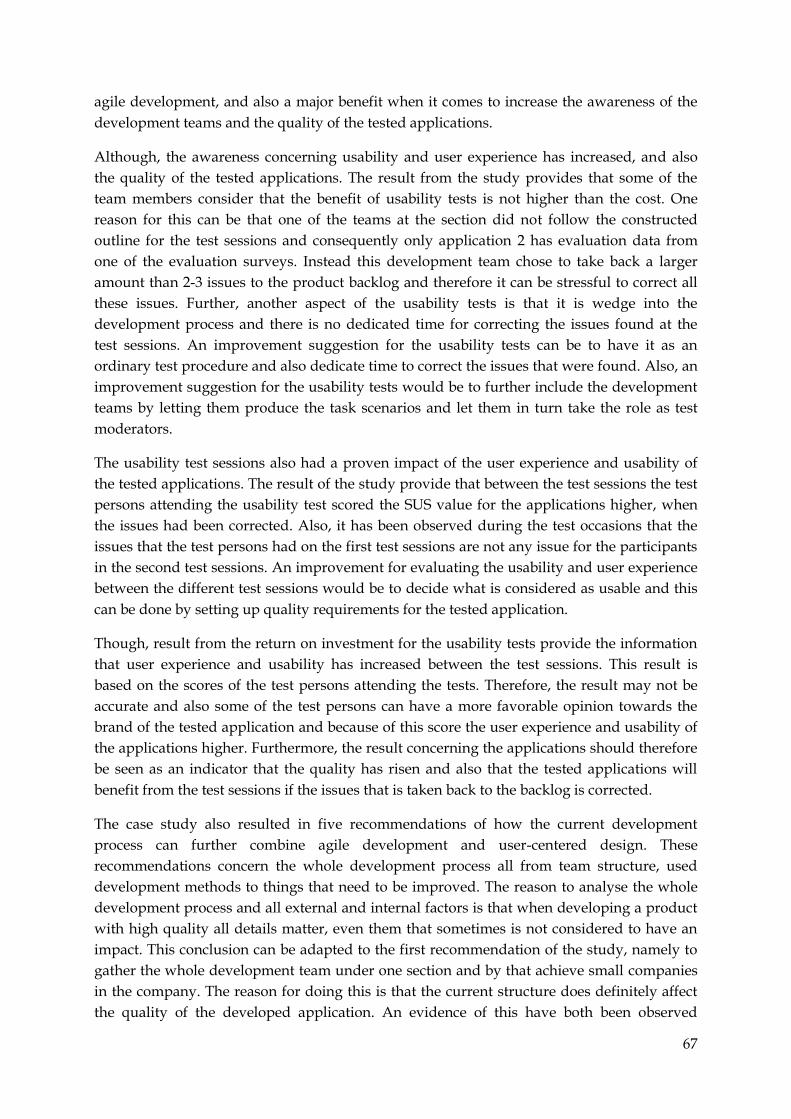
67
agile development, and also a major benefit when it comes to increase the awareness of the
development teams and the quality of the tested applications.
Although, the awareness concerning usability and user experience has increased, and also
the quality of the tested applications. The result from the study provides that some of the
team members consider that the benefit of usability tests is not higher than the cost. One
reason for this can be that one of the teams at the section did not follow the constructed
outline for the test sessions and consequently only application 2 has evaluation data from
one of the evaluation surveys. Instead this development team chose to take back a larger
amount than 2-3 issues to the product backlog and therefore it can be stressful to correct all
these issues. Further, another aspect of the usability tests is that it is wedge into the
development process and there is no dedicated time for correcting the issues found at the
test sessions. An improvement suggestion for the usability tests can be to have it as an
ordinary test procedure and also dedicate time to correct the issues that were found. Also, an
improvement suggestion for the usability tests would be to further include the development
teams by letting them produce the task scenarios and let them in turn take the role as test
moderators.
The usability test sessions also had a proven impact of the user experience and usability of
the tested applications. The result of the study provide that between the test sessions the test
persons attending the usability test scored the SUS value for the applications higher, when
the issues had been corrected. Also, it has been observed during the test occasions that the
issues that the test persons had on the first test sessions are not any issue for the participants
in the second test sessions. An improvement for evaluating the usability and user experience
between the different test sessions would be to decide what is considered as usable and this
can be done by setting up quality requirements for the tested application.
Though, result from the return on investment for the usability tests provide the information
that user experience and usability has increased between the test sessions. This result is
based on the scores of the test persons attending the tests. Therefore, the result may not be
accurate and also some of the test persons can have a more favorable opinion towards the
brand of the tested application and because of this score the user experience and usability of
the applications higher. Furthermore, the result concerning the applications should therefore
be seen as an indicator that the quality has risen and also that the tested applications will
benefit from the test sessions if the issues that is taken back to the backlog is corrected.
The case study also resulted in five recommendations of how the current development
process can further combine agile development and user-centered design. These
recommendations concern the whole development process all from team structure, used
development methods to things that need to be improved. The reason to analyse the whole
development process and all external and internal factors is that when developing a product
with high quality all details matter, even them that sometimes is not considered to have an
impact. This conclusion can be adapted to the first recommendation of the study, namely to
gather the whole development team under one section and by that achieve small companies
in the company. The reason for doing this is that the current structure does definitely affect
the quality of the developed application. An evidence of this have both been observed
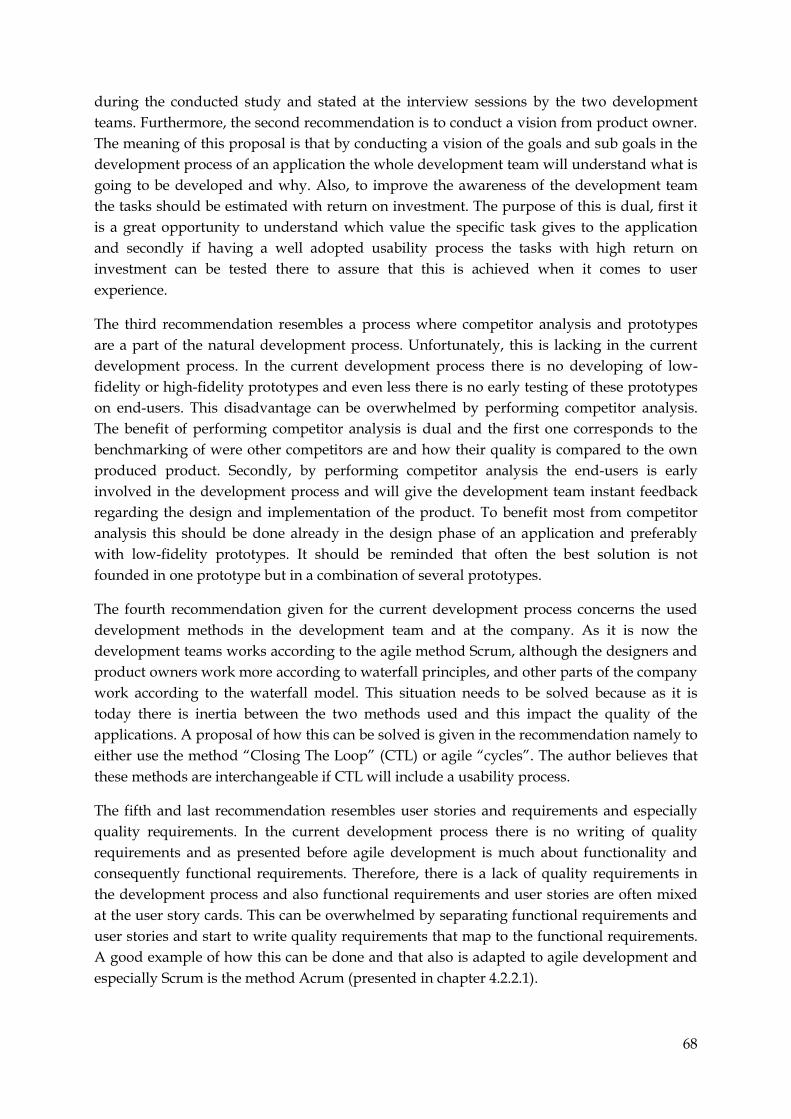
68
during the conducted study and stated at the interview sessions by the two development
teams. Furthermore, the second recommendation is to conduct a vision from product owner.
The meaning of this proposal is that by conducting a vision of the goals and sub goals in the
development process of an application the whole development team will understand what is
going to be developed and why. Also, to improve the awareness of the development team
the tasks should be estimated with return on investment. The purpose of this is dual, first it
is a great opportunity to understand which value the specific task gives to the application
and secondly if having a well adopted usability process the tasks with high return on
investment can be tested there to assure that this is achieved when it comes to user
experience.
The third recommendation resembles a process where competitor analysis and prototypes
are a part of the natural development process. Unfortunately, this is lacking in the current
development process. In the current development process there is no developing of low-
fidelity or high-fidelity prototypes and even less there is no early testing of these prototypes
on end-users. This disadvantage can be overwhelmed by performing competitor analysis.
The benefit of performing competitor analysis is dual and the first one corresponds to the
benchmarking of were other competitors are and how their quality is compared to the own
produced product. Secondly, by performing competitor analysis the end-users is early
involved in the development process and will give the development team instant feedback
regarding the design and implementation of the product. To benefit most from competitor
analysis this should be done already in the design phase of an application and preferably
with low-fidelity prototypes. It should be reminded that often the best solution is not
founded in one prototype but in a combination of several prototypes.
The fourth recommendation given for the current development process concerns the used
development methods in the development team and at the company. As it is now the
development teams works according to the agile method Scrum, although the designers and
product owners work more according to waterfall principles, and other parts of the company
work according to the waterfall model. This situation needs to be solved because as it is
today there is inertia between the two methods used and this impact the quality of the
applications. A proposal of how this can be solved is given in the recommendation namely to
either use the method “Closing The Loop” (CTL) or agile “cycles”. The author believes that
these methods are interchangeable if CTL will include a usability process.
The fifth and last recommendation resembles user stories and requirements and especially
quality requirements. In the current development process there is no writing of quality
requirements and as presented before agile development is much about functionality and
consequently functional requirements. Therefore, there is a lack of quality requirements in
the development process and also functional requirements and user stories are often mixed
at the user story cards. This can be overwhelmed by separating functional requirements and
user stories and start to write quality requirements that map to the functional requirements.
A good example of how this can be done and that also is adapted to agile development and
especially Scrum is the method Acrum (presented in chapter 4.2.2.1).
69
The overall outcome from the results of the case study exposed that there is a benefit of
conducting usability tests. Also, this is a step to further integrate end-users into the
development process and consequently further combing agile development and user-
centered design. To improve both the quality and integration of user-centered design in the
agile development the given recommendations are a good start and also a good start for
further use of usability evaluation methods and end-users.
70
6. CONCLUSION AND FURTHER WORK
This chapter will serve as a conclusion and further work considering the case study. The
opinions given in this chapter reflects the one of the author.
6.1. CONCLUSION REGARDING THE STUDY
The purpose of this thesis and consequently the case study was to investigate how agile
development and user-centered design can further be combined in the current development
process at the section. The author believes that the research questions that were stated before
the case study started are answered and also that there were enough time to meet them.
In chapter 1.3 the main research question was established and a set of sub research questions
in order to answer the main research question. The answers to these questions can be found
below.
Which proposals exist in industry to achieve an integration of user-centered design and
agile development?
The literature study included in the case study presented that there exists several proposals
of how user-centered design (UCD) can be integrated into agile development. The proposals
presented in this case study are the one that the author considers most suitable for the
current development process at the section. In order to further integrate UCD in the current
development process the two methods U-Scrum (presented in chapter 4.1.2.2) for usability
and user experience respectively Acrum (presented in chapter 4.2.2.1) for quality
requirements can be used.
How should the current development process at the section be improved?
This question corresponds to the given recommendations in the case study. The problem
with this question is that there are so many ways that the current development process can
be improved to better consider user-centered design. The obstacle is that every
recommendation for the development process cannot be done in one step and therefore it
needs to be done in several sub steps and consequently the most important one needs to be
done first.
At the section there is already a good start for how user-centered design (UCD) shall be
integrated and this is the use of the current usability process and the usability tests.
Although, this is a good start there are things that can be done to further integrate UCD in
the development process. The important things are concerning the four first
recommendations given in the result of the case study. The first one corresponds to
gathering of the whole development team in one section and establish small companies in
the company. The second one is to conduct a vision from product owner (PO) and by
performing this establish that the task scenarios with high return on investment are having a
high user experience. The third one is to accomplish a competitor analysis and the
developing of prototypes. In the current development process there is almost no use of
71
competitor analysis were different products and prototypes are compared. The advantage of
doing this type of test is that users are early involved in the process and the benefit of
producing prototypes is that it is easier to achieve the minimal acceptable scope that the end-
users considers as acceptable. The fourth one corresponds to the development methods used
in the development teams and at the company. As it is now, the designers and product
owners work more according to waterfall principles and the developers work according to
Scrum. The recommendation is to let the whole development team work according to agile
principles and scale it if needed. Furthermore, the proposed method “Closing The Loop”
(CTL) (presented in chapter 4.3.3) with Google Analytics is a good start for both further
integrate user-centered design and great a quickly and effective development process, like an
agile process. However, Google Analytics cannot provide the information why an
application or feature is used or not. Therefore, it would be desirable to include a usability
process into the method CTL.
Does the quality of the tested applications improve in terms of usability and user
experience when usability testing is integrated into the development process?
This question is the hardest one to answer because the evaluations of the usability and user
experience have been based on the test persons´ subjective opinion regarding the tested
applications during the usability tests. Another problematic thing is that there have been a
rather small set of test sessions during the duration of the case study. Although, the result
from the case study presents that the user experience and usability have increased.
Furthermore, it has also been observed that the problems corrected from the usability test
sessions have not become issues in the next test session.
Does the awareness of the development teams regarding usability and user experience
increase if user tests are integrated into the development process?
The result from the case study definitely presents that the awareness of the team members
has increased in terms of usability and user experience. The clearest result of this is that the
development team now more can predict what the problems for the users can be and they
are more aware of this when they are implementing their applications. The result from the
case study also presents that the feedback that the development teams are provided with
during the usability test sessions is so valuable that they now consider that this type of
usability tests shall be a part of their regularly test procedure.
The conclusion of the conducted case study is that it is possible to further integrate user-
centered design in the agile development method Scrum performed at the section. Although,
the usability test process gives a deeper understanding for the development team regarding
user experience their awareness and knowledge cannot be replaced with the opinions the
end–users. Furthermore, if the method “Closing The Loop” shall be used, it will requires a
usability process to be able to adapt it as a more user-centered design process.
72
6.2. FURTHER WORK REGARDING THE STUDY
If time permitted further development of the case study would be to investigate if the
development process would become any better if some of the given recommendations would
be included into the development. It would also be interesting to evaluate if the user
experience and usability of the applications would become any better if the development
process included the recommendations.
When it comes to further work with the conducted case study it would be interesting to
include more usability test sessions and by doing this see if the awareness of the
development teams will increase anymore. Also, it would be appealing to see if the test
persons attending the usability test sessions would score the user experience and usability
higher when the major problems from each test session was corrected.
Overall, the author believe that the study is useful in two ways, where the first one is to use
as a set of suggestions for how to further combine agile development and user-centered
design. The second is to provide the section with the information that usability tests help
them both to increase the awareness of the development teams and the user experience of the
tested applications.
73
7. REFERENCES
Papers
Bassil, Y., 2011, A Simulation Model for the Waterfall-Software Development Life Cycle,
International Journal of Engineering & Technology (iJET). [online] Available through:
<http://iet-journals.org/archive/2012/may_vol_2_no_5/255895133318216.pdf> [Accessed
21 January 2013].
Cao, L., and Ramesh, B., 2008, Agile Requirements Engineering Practices: An Empirical Study,
IEEE Computer Software. [online] Available through:
<http://ieeexplore.ieee.org.ludwig.lub.lu.se/stamp/stamp.jsp?tp=&arnumber=4420071>
[Accessed 13 March 2013].
Chamberlain, S., Sharp, H., and Maiden, N., 2006, Towards a framework for integrating Agile
development and user-centered design, Proceedings of 7th International Conference on Extreme
Programming and Agile Processes in Software Engineering, June 17-22 2006, Oulu, Finland.
[online] Available through: <http://www.ime.usp.br/~marivb/ihc3.pdf> [Accessed 12
March 2013].
Ferreira, J., Noble, J., and Biddle, R., 2007 Agile Development Iterations and UI Design,
Proceedings of 2007 Agile Conference, August 13-17 2007, Washington DC, USA. [online]
Available through:
<http://ieeexplore.ieee.org.ludwig.lub.lu.se/stamp/stamp.jsp?tp=&arnumber=4293575>
[Accessed 4 March 2013].
Ferreira, J., Sharp, H., and Robinson H., 2012, Agile development and User Experience Design
Integration as an Ongoing Achievement in Practice, Proceedings of 2012 Agile Conference,
August 13-17 2012, Dallas, Texas, USA. [online] Available through:
<http://ieeexplore.ieee.org.ludwig.lub.lu.se/stamp/stamp.jsp?tp=&arnumber=6298087>
[Accessed 12 March 2013].
Fox, D., Sillito, J., and Maurer, F., 2008, Agile Methods and User-Centered Design: How These
Two Methodologies Are Being Successfully Integrated In Industry, Proceedings of 2008 Agile
Conference, August 4-8 2008, Toronto, Ontario, Canada. [online] Available through:
<http://ieeexplore.ieee.org.ludwig.lub.lu.se/stamp/stamp.jsp?tp=&arnumber=4599453>
[Accessed 13 March 2013].
Regnell B., Berntsson Svensson R., and Olsson, T., 2008, Supporting Roadmapping of Quality
Requirements, IEEE Computer Society. [online] Available through:
<http://ieeexplore.ieee.org.ludwig.lub.lu.se/stamp/stamp.jsp?tp=&arnumber=4455630>
[Accessed 7 March 2013].
Rising, L., and Norman, S., 2000, The Scrum Software Development Process for Small Teams, IEEE
Computer Society. [online] Available through:
<http://ieeexplore.ieee.org.ludwig.lub.lu.se/stamp/stamp.jsp?tp=&arnumber=854065>
[Accessed January 25 2013].
74
Sanghoon, J., Myungjin H., Eunseok, L., and Keun, L., 2011, Quality Attribute driven Agile
Development, Proceedings of 9th International Conference on Software Engineering Research,
Management and Application, August 10-12 2011, Baltimore, Maryland, USA. [online]
Available through:
<http://ieeexplore.ieee.org.ludwig.lub.lu.se/stamp/stamp.jsp?tp=&arnumber=6065642>
[Accessed 6 March 2013].
Singh, M., 2008, U-SCRUM: An Agile Methodology for Promoting Usability, Proceedings of the
Agile 2008 Conference, August 4-8 2008, Toronto, Ontario, Canada. [online] Available
through:
<http://ieeexplore.ieee.org.ludwig.lub.lu.se/stamp/stamp.jsp?tp=&arnumber=4599538>
[Accessed 30 January 2013].
Sohaib, O., and Khan, K., 2010, Integrating Usability Engineering and Agile Software
Development: A Literature Review, Proceedings of 2010 International Conference On Computer
Design and Application, June 25-27 2010, Qinhuangdao, Hebei, China. [online] Available
through:
<http://ieeexplore.ieee.org.ludwig.lub.lu.se/stamp/stamp.jsp?tp=&arnumber=5540916>
[Accessed 4 March 2013].
Sy, D., 2007, Adapting Usability Investigations for Agile User-centered Design, Proceedings of
Journal of Usability Studies. [online] Available through:
<http://www.upassoc.org/upa_publications/jus/2007may/agile-ucd.pdf> [Accessed 5
March 2013].
Books
Barnum, C., 2011, Usability Testing Essential – Ready, Set, Test, USA: Elsevier.
Blomkvist, S., 2005, Towards a model for bridging agile development and user-centered design, In
Seffah A., Gulliksen J., and Desmarais, M., Human-Centered Software Engineering — Integrating
Usability in the Software Development Lifecycle, Netherlands: Springer.
Brook, J., 1996, SUS: a “quick and dirty” usability scale. In Jordan, B., Weerdmeester, B.A., and
McClelland, A.L., Usability Evaluation in Industry, UK: Taylor and Francis.
Hughes, B., and Cotterell, M., 2009, Software Project Management, UK: McGraw-Hill.
Höst, M., Regnell, B., and Runeson, P., 2006, Att genomföra examensarbete, Sweden:
Studentlitteratur.
Jalote, P., 2008, A Concise Introduction to Software Engineering, UK: Springer-Verlag
Lauesen, S., 2002, Software Requirements- Styles and Techniques, UK: Person Edition.
Martin, R., 2003, Agile Software Development- Principles, Patterns and Practices, USA: Prentice
Hall.
75
Medlock, M., Wixon, D., McGee, M., and Welsh, D., 2005, The Rapid Iterative Test and
Evaluation Method (RITE): Better Products in Less Time, In Cost-Justifying Usability, Second
Edition. In Age, Bias R., and Mayhew, D., An Update for the Internet, USA: Elsevier.
Merriam, S.B., 1994, Fallstudien som forskningsmetod, Sweden: Studentlitteratur.
Norman, D., 2002, The design of Everyday Things, USA: Basic Books.
Regnell B., and Brinkkemper, S., 2005, Market-Driven Requirement Engineering for Software
Products, In Aurum A., and Wohlin, C., Engineering and Managing Software Requirements, UK:
Springer.
Rubin, J., and Chisnell, D., 2008, Handbook of Usability Testing – How to Plan, Design, and
Conduct Effective Tests, USA: Wiley.
Shneiderman, B., and Plaisant, C., 2010, Designing the User Interface – Strategies for Effective
Human-Computer Interaction, USA: Pearson Higher Education.
Schwaber, K., 2004, Agile Project Management with Scrum, Microsoft Press.
Spradley, J. P., 1979, The Ethnographic Interview, USA: Holt, Rinehart & Winston.
Tullis, T., and Albert, B., 2008, Measuring the User Experience – Collecting, Analyzing, and
Preventing Usability Metrics, UK: Morgan Kaufmann Publishers.
Web
Google, 2013, Google Analystics. [online] Available through:
<http://www.google.com/analytics/learn/index.html> [Accessed 30 January 2013].
Kniberg, H., and Ivarsson, A., 2012, Scaling Agile @ Spotify. [online] Available through:
<http://blog.crisp.se/2012/11/14/henrikkniberg/scaling-agile-at-spotify> [Accessed 7
March 2013].
Kniberg, H., 2013, How Spotify builds products. [online] Available through:
<http://blog.crisp.se/2012/11/14/henrikkniberg/how-spotify-builds-products> [Accessed
11 March 2013].
Nielsen, J., 2013, Usability 101: Introduction to Usability. [online] Available through:
<http://www.nngroup.com/articles/usability-101-introduction-to-usability/> [Accessed 22
March 2013].
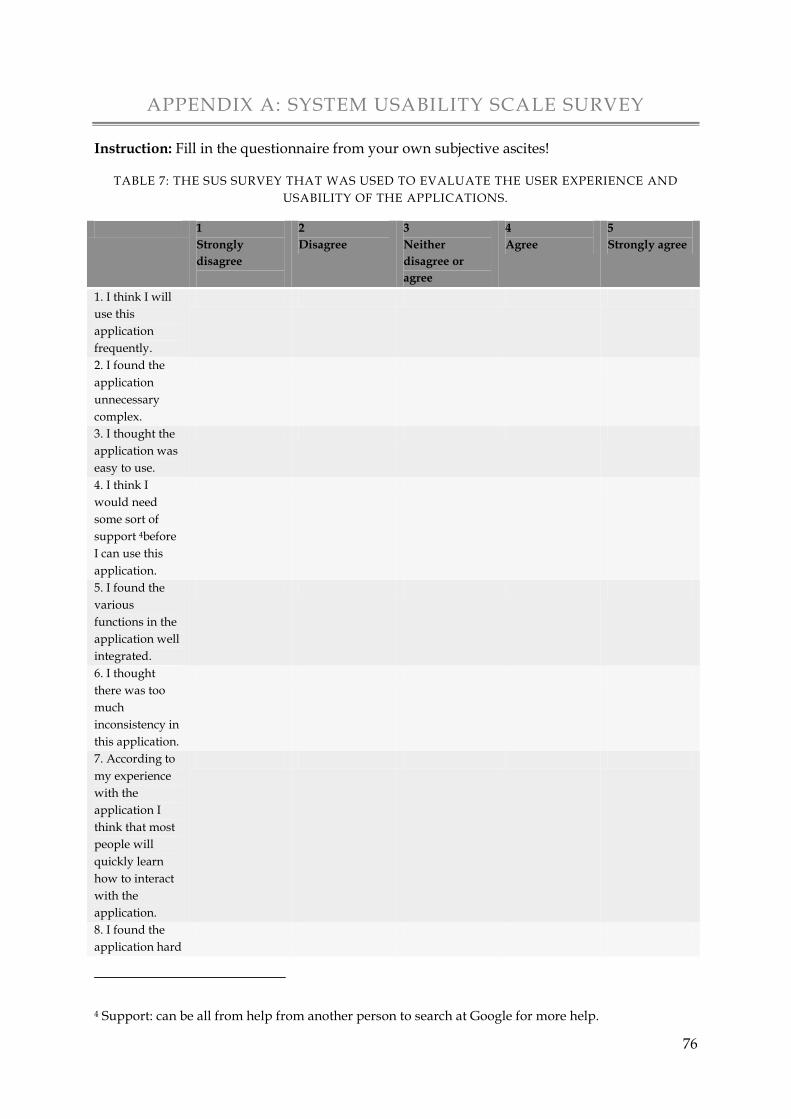
76
APPENDIX A: SYSTEM USABILITY SCALE SURVEY
Instruction: Fill in the questionnaire from your own subjective ascites!
TABLE 7: THE SUS SURVEY THAT WAS USED TO EVALUATE THE USER EXPERIENCE AND
USABILITY OF THE APPLICATIONS.
1
Strongly
disagree
2
Disagree
3
Neither
disagree or
agree
4
Agree
5
Strongly agree
1. I think I will
use this
application
frequently.
2. I found the
application
unnecessary
complex.
3. I thought the
application was
easy to use.
4. I think I
would need
some sort of
support 4before
I can use this
application.
5. I found the
various
functions in the
application well
integrated.
6. I thought
there was too
much
inconsistency in
this application.
7. According to
my experience
with the
application I
think that most
people will
quickly learn
how to interact
with the
application.
8. I found the
application hard
4 Support: can be all from help from another person to search at Google for more help.
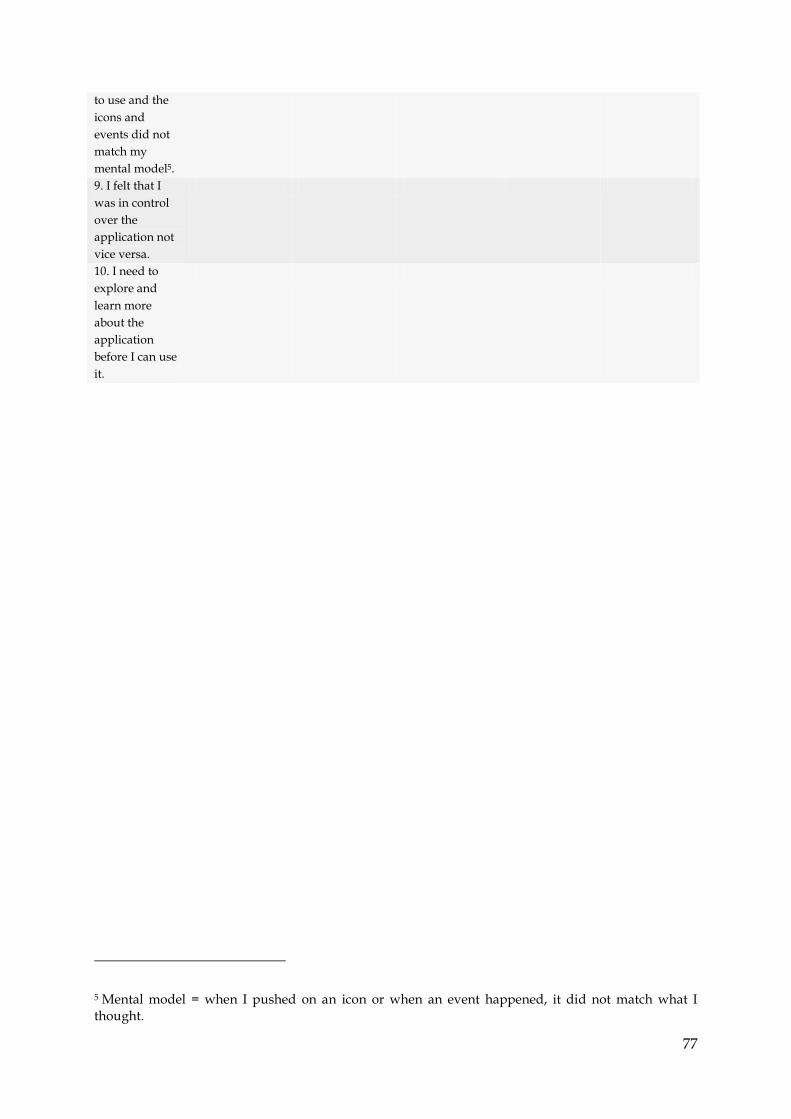
77
to use and the
icons and
events did not
match my
mental model5.
9. I felt that I
was in control
over the
application not
vice versa.
10. I need to
explore and
learn more
about the
application
before I can use
it.
5 Mental model = when I pushed on an icon or when an event happened, it did not match what I thought.
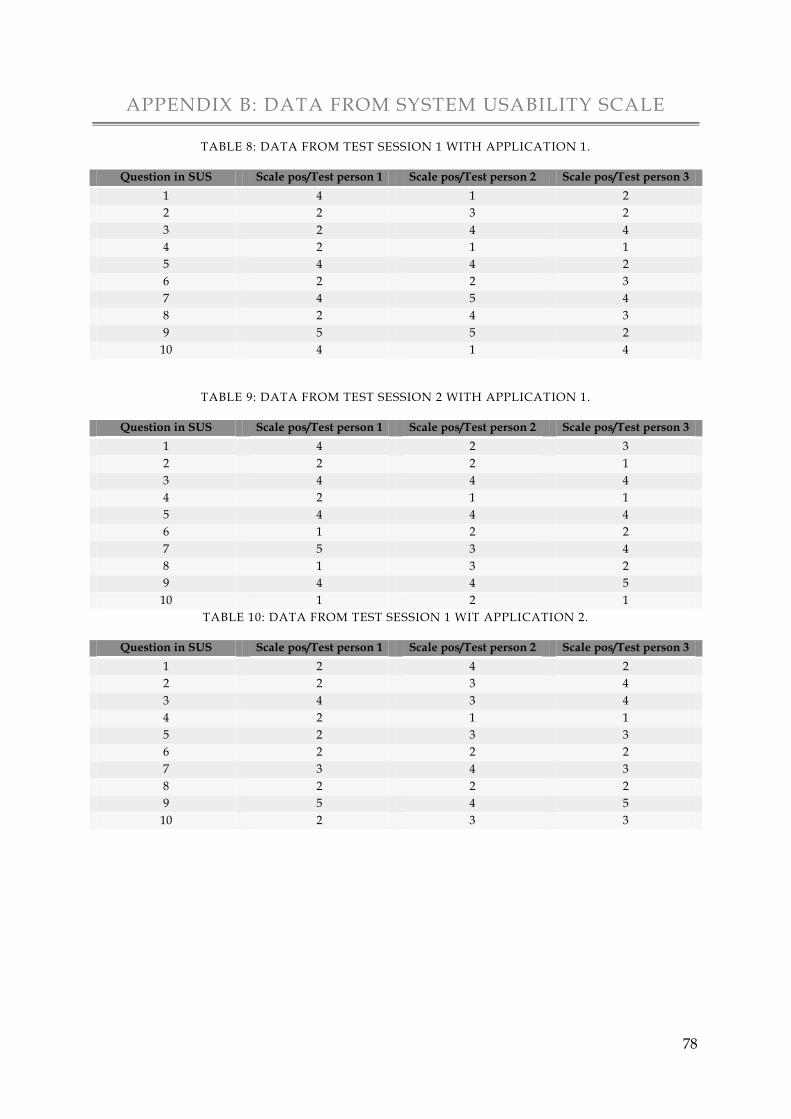
78
APPENDIX B: DATA FROM SYSTEM USABILITY SCALE
TABLE 8: DATA FROM TEST SESSION 1 WITH APPLICATION 1.
Question in SUS Scale pos/Test person 1 Scale pos/Test person 2 Scale pos/Test person 3
1 4 1 2
2 2 3 2
3 2 4 4
4 2 1 1
5 4 4 2
6 2 2 3
7 4 5 4
8 2 4 3
9 5 5 2
10 4 1 4
TABLE 9: DATA FROM TEST SESSION 2 WITH APPLICATION 1.
Question in SUS Scale pos/Test person 1 Scale pos/Test person 2 Scale pos/Test person 3
1 4 2 3
2 2 2 1
3 4 4 4
4 2 1 1
5 4 4 4
6 1 2 2
7 5 3 4
8 1 3 2
9 4 4 5
10 1 2 1
TABLE 10: DATA FROM TEST SESSION 1 WIT APPLICATION 2.
Question in SUS Scale pos/Test person 1 Scale pos/Test person 2 Scale pos/Test person 3
1 2 4 2
2 2 3 4
3 4 3 4
4 2 1 1
5 2 3 3
6 2 2 2
7 3 4 3
8 2 2 2
9 5 4 5
10 2 3 3
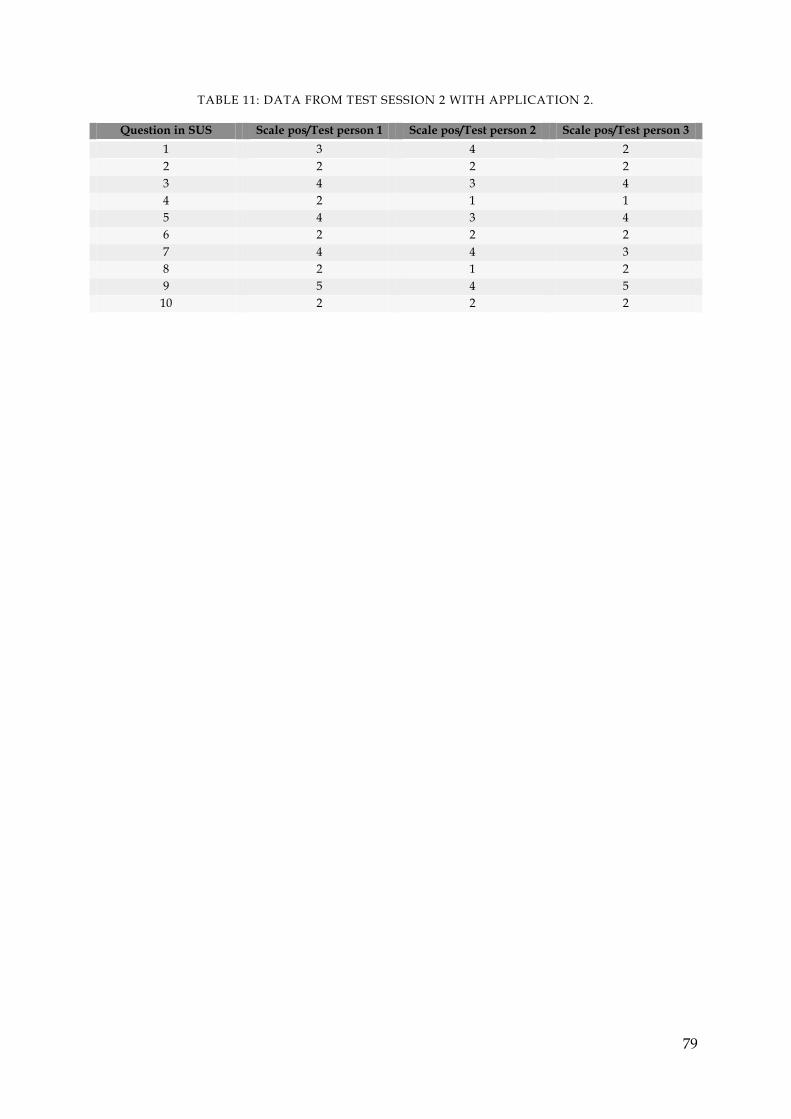
79
TABLE 11: DATA FROM TEST SESSION 2 WITH APPLICATION 2.
Question in SUS Scale pos/Test person 1 Scale pos/Test person 2 Scale pos/Test person 3
1 3 4 2
2 2 2 2
3 4 3 4
4 2 1 1
5 4 3 4
6 2 2 2
7 4 4 3
8 2 1 2
9 5 4 5
10 2 2 2
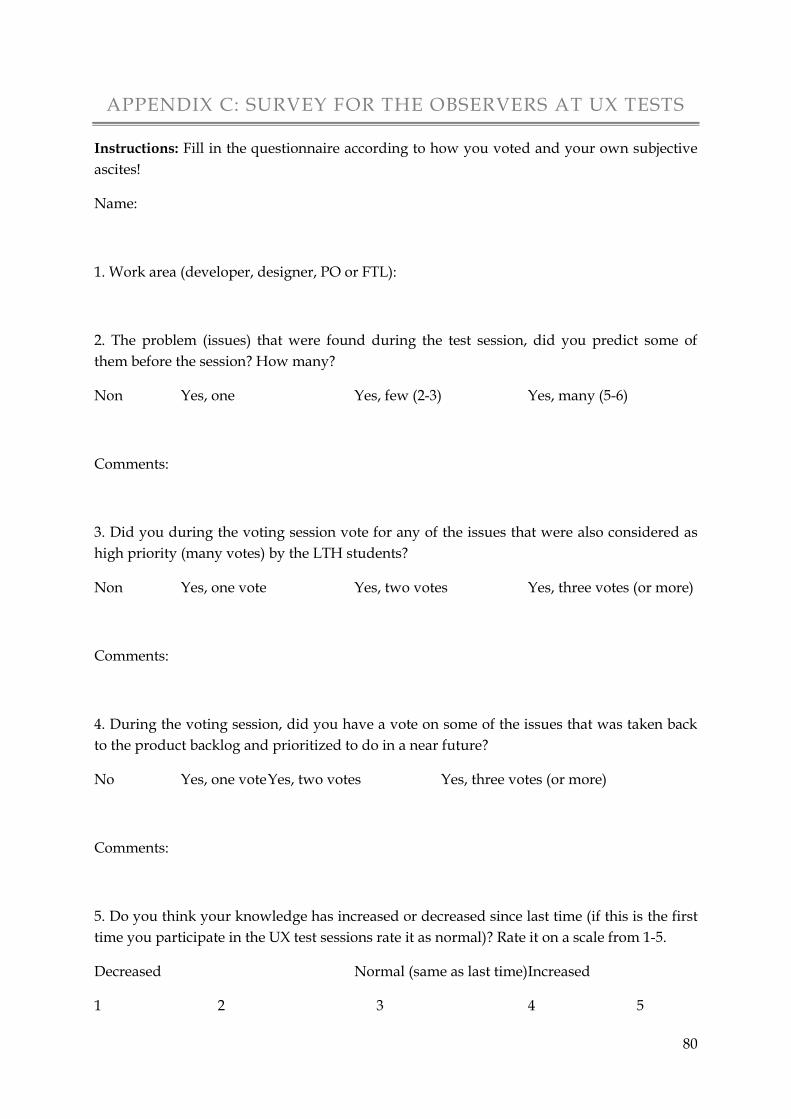
80
APPENDIX C: SURVEY FOR THE OBSERVERS AT UX TESTS
Instructions: Fill in the questionnaire according to how you voted and your own subjective
ascites!
Name:
1. Work area (developer, designer, PO or FTL):
2. The problem (issues) that were found during the test session, did you predict some of
them before the session? How many?
Non Yes, one Yes, few (2-3) Yes, many (5-6)
Comments:
3. Did you during the voting session vote for any of the issues that were also considered as
high priority (many votes) by the LTH students?
Non Yes, one vote Yes, two votes Yes, three votes (or more)
Comments:
4. During the voting session, did you have a vote on some of the issues that was taken back
to the product backlog and prioritized to do in a near future?
No Yes, one vote Yes, two votes Yes, three votes (or more)
Comments:
5. Do you think your knowledge has increased or decreased since last time (if this is the first
time you participate in the UX test sessions rate it as normal)? Rate it on a scale from 1-5.
Decreased Normal (same as last time) Increased
1 2 3 4 5
81
Comments:
6. If this is your first time at the UX test session, please state that.
Has the input and knowledge that you gained from the usability test affected your way of
working for example when you implement, design or prioritize the work? Rate it on a scale
from 0-5, where 0 is not affected.
Zero One Two Three Four Five or first time
Comments:
7. Estimate your current usability awareness on a scale from 1-10.
Comments:
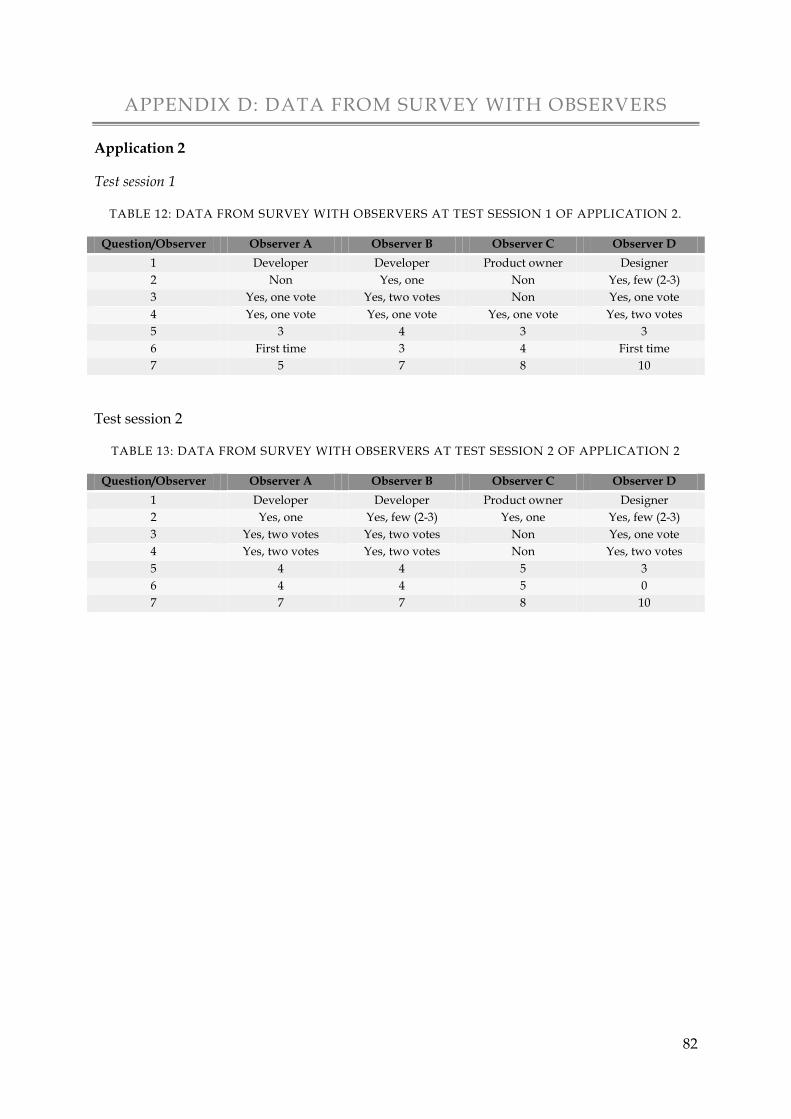
82
APPENDIX D: DATA FROM SURVEY WITH OBSERVERS
Application 2
Test session 1
TABLE 12: DATA FROM SURVEY WITH OBSERVERS AT TEST SESSION 1 OF APPLICATION 2.
Question/Observer Observer A Observer B Observer C Observer D
1 Developer Developer Product owner Designer
2 Non Yes, one Non Yes, few (2-3)
3 Yes, one vote Yes, two votes Non Yes, one vote
4 Yes, one vote Yes, one vote Yes, one vote Yes, two votes
5 3 4 3 3
6 First time 3 4 First time
7 5 7 8 10
Test session 2
TABLE 13: DATA FROM SURVEY WITH OBSERVERS AT TEST SESSION 2 OF APPLICATION 2
Question/Observer Observer A Observer B Observer C Observer D
1 Developer Developer Product owner Designer
2 Yes, one Yes, few (2-3) Yes, one Yes, few (2-3)
3 Yes, two votes Yes, two votes Non Yes, one vote
4 Yes, two votes Yes, two votes Non Yes, two votes
5 4 4 5 3
6 4 4 5 0
7 7 7 8 10
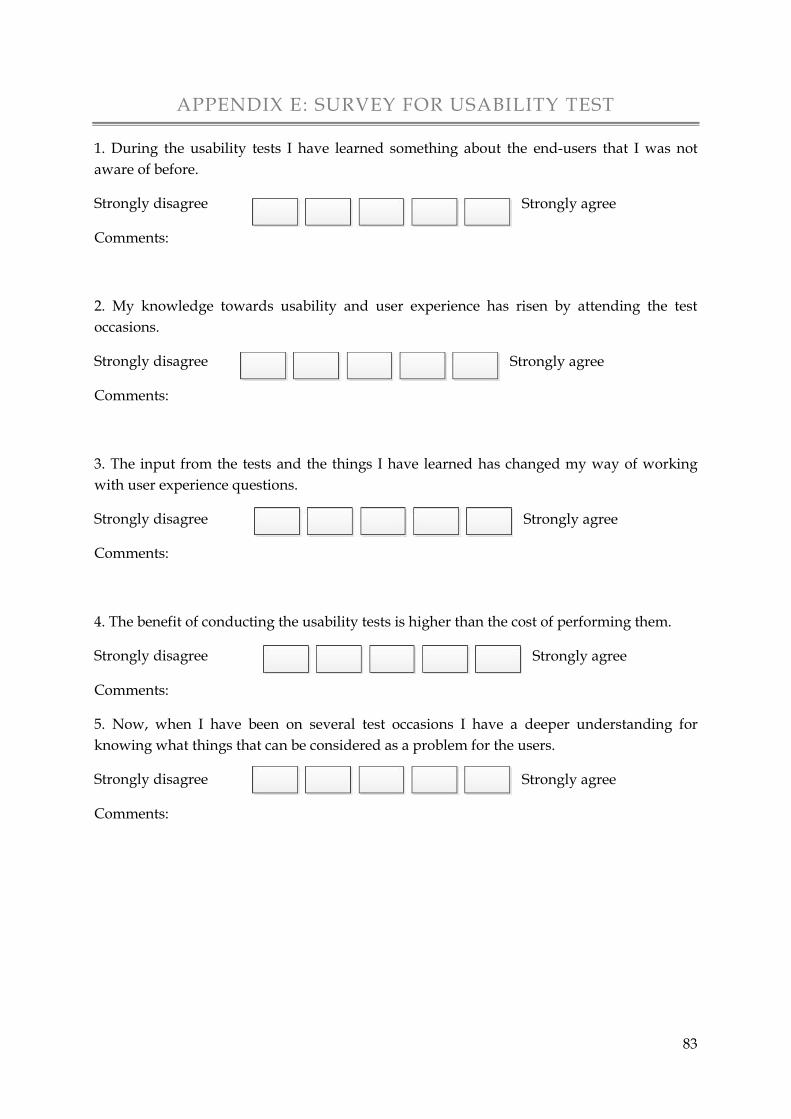
83
APPENDIX E: SURVEY FOR USABILITY TEST
1. During the usability tests I have learned something about the end-users that I was not
aware of before.
Strongly disagree Strongly agree
Comments:
2. My knowledge towards usability and user experience has risen by attending the test
occasions.
Strongly disagree Strongly agree
Comments:
3. The input from the tests and the things I have learned has changed my way of working
with user experience questions.
Strongly disagree Strongly agree
Comments:
4. The benefit of conducting the usability tests is higher than the cost of performing them.
Strongly disagree Strongly agree
Comments:
5. Now, when I have been on several test occasions I have a deeper understanding for
knowing what things that can be considered as a problem for the users.
Strongly disagree Strongly agree
Comments:
84
6. Now, after a few test occasions I often see the same major problems that the test persons
(LTH students) also consider to be problems.
Strongly disagree Strongly agree
Comments:
7. I consider that this type of testing should be a part of the teams regular test procedure.
Strongly disagree Strongly agree
Comments:
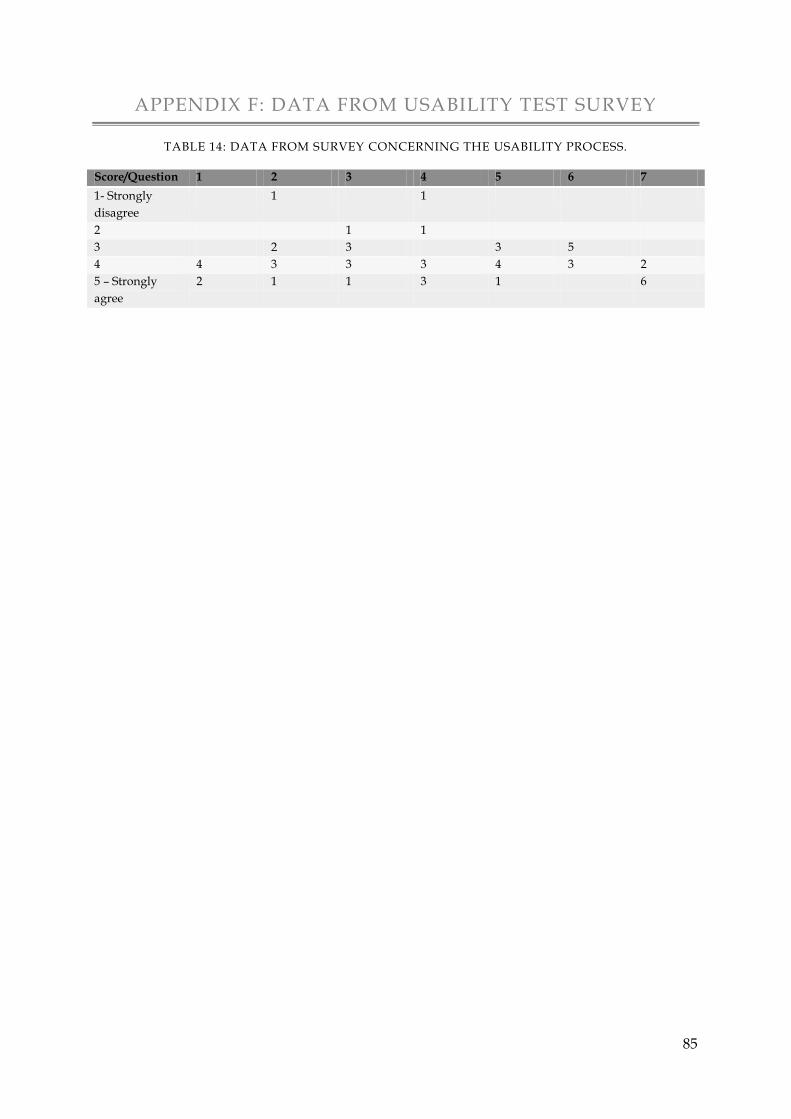
85
APPENDIX F: DATA FROM USABILITY TEST SURVEY
TABLE 14: DATA FROM SURVEY CONCERNING THE USABILITY PROCESS.
Score/Question 1 2 3 4 5 6 7
1- Strongly
disagree
1 1
2 1 1
3 2 3 3 5
4 4 3 3 3 4 3 2
5 – Strongly
agree
2 1 1 3 1 6
86
APPENDIX G: MANUSCRIPT FOR COST-BENEFIT
DEVELOPMENT TEAM
Improvement suggestion: The suggestion is to do a restructure of the departments and
sections, where the designers and product owners are in the same section as the developers.
The product owners and designers should have a similar structure of their work as the
feature team leaders (FTL) has. Meaning that the designers will be allocated to the
applications that the section and developers shall implement and the product owner(s) shall
be fully allocated as the customer to the developing applications at the section. The outcome
of this is that each development team will contain all resources (skills) that are necessary to
develop an application of high quality, which implies that the development teams will be
small companies in the company.
What costs do you see with this proposal?
In terms of time and more employees?
Which benefits do you see in this proposal?
Benefits in: time saving? Easier communication?
DEVELOPMENT METHOD
Improvement suggestion: The recommendation is to gather the whole company and learn all
sections and departments to work according to agile principles, if needed the agile principles
can be scaled to fit the specific situation. Also, to make a more effective development process
where time to market is shorted the concept Closing The Loop (CTL) with Google Analytics
(GA) can be used.
What cost do you see in the use of CTL (Closing The Loop)?
In terms of work? Would it be more difficult for you to use the method or can
you see a problem with the product projects?
Which benefit does GA (Google Analystics) gives your development process?
In terms of more efficient development, quality (usability/user experience).
Is there any cost with GA?
In terms of knowledge to use it or staff resources.
COMPETITOR ANALYSIS AND DIFFERENT PROTOTYPES
Improvement suggestion: By use of competitor analysis in the current usability process it is
easier to know if the feature or whole application is worth to implement. The idea consists of
creating a few variants, prototypes, when a new application or feature shall be implemented
and then perform a competitor analysis, in form of a focus group. Also, this type of focus
group can increase and broad the knowledge of what other brands has and how they
implement it.
Which costs do you see with a competitor analysis?
In terms of time and commitment for employees.
87
Which benefits do you see?
In terms of more usable product? Developing the “right”
features/applications?
VISION FROM PRODUCT OWNER
Improvement suggestion: The proposal is to through the use of return on investment (ROI)
estimation (on the different user stories and their respective task) the view of the
development team will be broader. Another opportunity with this estimation is that the PO
can then in the current usability tests establish that they will give high ROI. Preferably, the
vision from PO should be done in the planning phase (4+4) in the current development
process.
Which costs do you see with a vision from the PO?
In terms of time?
Which benefits do you see?
In terms of more knowledge of what is going to be developed?
USER STORIES AND REQUIREMENTS
Improvement suggestion: The proposal is to include quality requirements in the user stories
and make the requirements measurable, in that way it is easy to measure if the requirements
are achieved. The writing of the quality requirements can for example be done in the
planning phase where the user stories are written and be verified at the sprint demo.
Would this be a benefit for your process?
Or is it enough with the quality requirements tool in your DoD (Definition of
Done)?
Which cost do you see with this proposal?
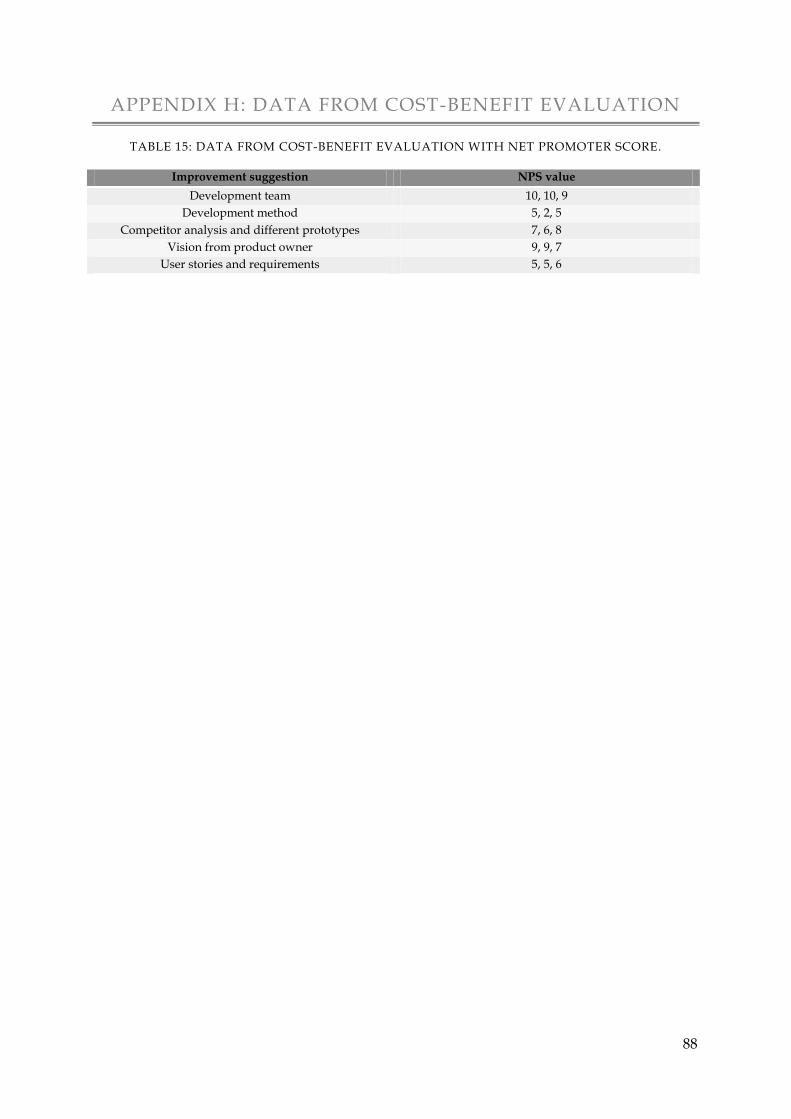
88
APPENDIX H: DATA FROM COST-BENEFIT EVALUATION
TABLE 15: DATA FROM COST-BENEFIT EVALUATION WITH NET PROMOTER SCORE.
Improvement suggestion NPS value
Development team 10, 10, 9
Development method 5, 2, 5
Competitor analysis and different prototypes 7, 6, 8
Vision from product owner 9, 9, 7
User stories and requirements 5, 5, 6


![Combining User-Centered Design and Lean Startup with Agile Software Development… · 2020. 5. 27. · product assertiveness. Vilkki [15] claims that agile must be combined with other](https://img.pdfslide.us/doc/110x75/60473b432b52ad0990707ed5/combining-user-centered-design-and-lean-startup-with-agile-software-development.jpg)