Embed Size (px)
Citation preview
Athens Journal of Health - Volume 1, Issue 1 – Pages 23-36
https://doi.org/10.30958/ajh.1-1-2 doi=10.30958/ajh.1-1-2
Agglomeration Economies and Wellbeing:
Evidence from India
By Arup Mitra
This paper argues that large cities by virtue of being more
productive are able to offer better economic and non-economic
opportunities. Even the slum residents located at the lower rungs of
the socio-economic ladder are able to derive these benefits through
income, education and health linkages. The well-being index
constructed on the basis of certain economic, social, demographic,
health and education specific variables collected through a primary
survey in four cities shows its positive association with city size and
its variation in relation to the nature of the city. The percentage of
slum dwellers residing in the bottom size classes is lower in large
and industrialized city compared to the ones which are stagnant and
lack economic growth. However considerable poverty also exists in
large cities notwithstanding agglomeration benefits and this makes a
case for urban employment support programmes.
Framework
In the process of economic development urbanization and industrialization
share a close nexus: not only industrialization leads to urbanization but also
urbanization has productivity-augmenting effects on industry (Mills and
Becker, 1986; Krugman, 1991; Fujita and Thisse, 2003; Kuchiki, 2005). When
production was predominantly agricultural in pre-industrial society, it occurred
outside the cities. This pattern got reversed as the industrial revolution
progressed - manufacturing production emerged as the major activity occurring
in inner city areas (Brotchie, Newton, Hall and Nijkamp, 1985). On the whole,
economic development not only caused a shift in the composition of growth
and occupational structure but also manifested itself in terms of locational shift
of the population resulting in urbanization. Within the urban areas large cities
because of agglomeration economies, manifesting themselves in terms of
higher levels of productivity and technical efficiency are again considered
better than the medium sized or small towns.
In relation to this view it has been widely noted that economic growth
varies considerably across space; even within India, states have recorded
different growth rates, which do not seem to have any tendency towards
convergence in the long run (Sachs, Bajpai and Ramiah, 2002). Among several
Professor, Institute of Economic Growth, India.

Vol. 1, No. 1 Mitra: Agglomeration Economies and Wellbeing: Evidence from India…
24
factors that influence economic growth, industrial performance has been
treated as the engine of growth implying that equalization of industrial
productivity can bring in equalization of economic growth across space. And
also states with higher rates of urbanisation reported higher rates of economic
growth (Sachs, Bajpai and Ramiah, 2002), thus bringing out a close connection
between industry and urban.
In the context of agglomeration economies it is noted that some industries
induce concentration of economic activity as they exhibit high economies of
scale in operation and there are others which benefit from concentration
because of these external economies (Mills, 1967 and Henderson, 1986).
Concentration not only strengthens the forward and backward linkages, but
also reduces the cost of operation by developing complementary services. The
effective price of infrastructure services declines if there is concentration of
users of these services (Mohan, 1993). In all, interdependence of industries in
terms of input-output linkages, ancillarization and availability of infrastructure
contribute to the growth of agglomeration economies. The benefits of
concentration can be attributed to the following factors (Hermansen, 1972): (a)
substantial economies of investment expenditure – the investment for the
whole complex is less than the sum of investment for each enterprise planned
and located in isolation, (b) efficient production due to advantages of
specialization, economies of large scale operation and organization of common
managerial and infrastructural facilities, (c) possibility of jointly exploiting of
the natural and raw material resources of the area of location, and (d)
opportunities for close contact, rapid diffusion of technological innovations,
and rapid overall development of the economy. The external economies, in
general are divided into two categories: (a) urbanization economies and (b)
localization economies1, resulting in productivity augmenting effects.
Agglomeration effects are usually captured in terms of total population/work
force/employment in a given industry or all industries (Mitra, 1999).
Since the large cities are characterized by higher levels of productivity the
real wages are also higher therein. Even in the informal sector the wages due to
forward and backward linkages between the sectors are higher. In fact, in a
general equilibrium framework it can be conveniently demonstrated how the
gains in the high productivity segments get transmitted to other sectors in the
economy (Williamson, 1988).
1Localisation economies are external to the firm but internal to the industry and, as Henderson
(1986) describes, reflect (1) economies of intra industry specialization where greater industry
size permits greater specialization among firms in their detailed functions, (2) labour market
economies where industry size reduces search costs for firms looking for workers with specific
training relevant to that industry, (3) scale of communication among firms affecting the speed
of adoption of new innovations, and (4) scale in providing public intermediate inputs tailored
to the technical needs of a particular industry. The urbanization economies, on the other hand,
are external to both firm and industry, and result from the general level of economic activity in
that city or increase in total city population. While strong urbanization economies may lead to
the development of diversified large areas, localization economies foster specialized
metropolitan areas if these economies occur in combination with possibilities of inter-area
trade.
Athens Journal of Health March 2014
25
The technological progress that the world is witnessing at a rapid pace is
now accessible to all areas thanks to the communication technology. However,
its implementation and utilization at the fullest level is possible only when the
support structure in terms of highly skilled manpower, adequate infrastructural
facilities and the overall governance exists significantly (Mitra et. al. 2002).
Since the large cities are usually better off from this angle, the outcomes are
also more profitable. Ancillarisation and sub-contracting possibilities are
sizeable in large cities as the number of firms is large and they tend to
encourage interdependency in an attempt to pursue super-specialization and
reduce cost (Mitra, 1999 and 2000).
It has been widely observed that among the low income households the
existence of social networks for accessing job market information is widely
prevalent (Mitra, 2004). In fact, these networks are the basis of their survival
strategy. However, it has been observed when individuals operate through
close relatives and other informal networks along the lines of caste and kinship
bonds, they end up creating excess supplies of labour in certain pockets and
thus the possibility for upward mobility becomes highly limited for both the
contact person and the new entrant (Mitra, 2010). But in large cities the
possibility of diversifying the networks at a later stage subsequent to the entry
is much higher as new contacts develop through new friends, employers and so
on.
The visibility of the civil society, the general awareness of the public and
the watchful role played by the media help cultivate new networks and also
assure higher returns to the networks pursued by the low income households.
In large cities there are usually a number of labour recruitment centres
(informal), and as the new contacts develop, individuals tend to access more
than one labour recruitment centres simultaneously, which in turn raises the
options leading to occupational mobility and the possibility of accessing higher
incomes (Mitra, 2010). Better connectivity, cheap transport system and the
availability of alternative modes of transport help individuals commute faster,
which does not restrict them to secure jobs in the neighbourhood of where they
reside. Labour exploitation in large cities is less as unions and various
voluntary organizations in some form or the other safeguard the interest of the
general public. The anonymity of individuals particularly from the point of
view of those who belong to disadvantaged castes helps break the legacy of the
caste-based occupations in a large city (Kumar, Kumar and Mitra 2009). The
sense of urbanism is supposedly more prevalent in large cities which help
people overcome the barriers of caste and other social hindrances and follow a
more market oriented approach. From all this it may be inferred that
individuals across various socio-economic sections benefit in terms of
accessing sustainable livelihood more in a large urban settlement vis-à-vis
small towns.
These views are, however, one-sided. There is an equally strong
contestable literature suggesting considerable overlaps between informal sector
employment and poverty in large cities. Since it is the urban economy which is
usually supposed to provide opportunities for raising productivity by

Vol. 1, No. 1 Mitra: Agglomeration Economies and Wellbeing: Evidence from India…
26
generating employment in the high productivity industrial sector and
contributing towards eradicating abject poverty (Mills and Becker, 1986), rural
to urban migration is usually directed towards the large cities (Kundu, 2006).
The economy wide consequences of excess supplies of labour in relation to
demand are manifested in the form of open unemployment, underemployment
and low productivity, leading to large scale poverty in the cities. The rapid
spread of slums resulting not merely from the shortage of housing but also
from the low earnings of the workers engaged in low productivity activities has
become an endemic feature of the urbanization process in the developing
countries (Hoselitz, 1953 and Mitra, 1994). Also, the large cities are often
pressed by several diseconomies of scale including congestion costs and
greater land-rent prices.
Undermining the importance of agglomeration economies it is noted that
the territorial division of labour between the urban and the rural areas is on the
decline, in the developed countries especially. Similarly the differences
between the economic structure in large urban settlements and that in medium-
sized towns are about to disappear, lending little relevance to the
agglomeration literature (Kamal-Chaoui, 2012)1. However, within the
countries of Asia and the Pacific, despite a decline in poverty across the region,
there are significant disparities between urban and rural areas and between
regions within countries (United Nations, 2001). In the Indian context the
rural-urban occupational distribution of labour is significantly different: while
agriculture is still dominant in the rural areas most of the large scale
manufacturing and modern service sector firms are concentrated in the urban
localities (Mitra, 2013). In the backdrop of globalization the rural-urban
distinction in sources of livelihood has grown much sharper. Economic
globalization in an attempt to reap the cost advantages has motivated firms to
diversify the production base across different countries depending on resource
availability and this has led today to the emergence of a multi-centric world
economy, as opposed to a centre and a periphery model of the earlier phase,
and the increasingly pronounced convergence of emerging countries, led by
China, India and Brazil (Huwart and Verdier, 2013). However, this has not
resulted in any reduction in rural-urban growth differential in India and the
differences in the sources of growth across rural and urban areas. Activities
associated with economic globalization are highly dependent on infrastructure
and human capital endowment (Mitra, Varoudakis and Veganzones-
Varoudakis, 2002), which are not evenly distributed across space. Even within
the urban areas the spatial inequalities in infrastructure availability are sharp,
leading to greater concentration of activities in a handful of cities. Industrial
and services hubs have emerged in a few locations which already had rich
1Kamal-Chaoui (2012) argues that among OECD urban areas medium-sized ones outgrow the
rest since the mid-1990s. Medium-sized cities are half the economic size (GDP) of large ones;
yet, they grow faster. Focusing on medium-sized cities are likely to result in higher economic
growth and greater efficiency in metro-regions and larger urban areas, as they are often pressed
by congestion costs, greater land-rent prices and other diseconomies of scale.

Athens Journal of Health March 2014
27
infrastructural base and could subsequently attract further investment in those
areas. Bangalore and Hyderabad are some of the glaring examples of this
phenomenon. On the whole, economic globalization particularly in the Indian
context has contributed to concentration of non-agricultural activities in the
urban areas and again within the urban localities the external economies of
scale are operating only in a few locations due to unequal distribution (Mitra
and Mehta, 2011).
Given the possibilities of higher returns to investment and per capita
incomes in large cities the present paper tries to verify if the well-being levels
of those in the lower rungs are higher there compared to their counterparts in
small towns. The direct and indirect linkages (including the secondary effects)
exist through which the growth effects from one sector can percolate down to
reach other peripheral sectors. The secondary effects are not just confined to
the domain of employment generation: they may have spill-over effects in the
areas of education and health as well. As workers in large cities can afford
better quality education and health, the private suppliers of these services are
also motivated to situate their firms in these locations. Though perfect
competition does not prevail to bring down the prices of these services,
oligopoly structure ensures reduction in super normal profits. All this results in
higher wellbeing levels of the residents in large cities, including the ones
placed at the bottom of the socio-economic ladder.
The paper is organized as follows. The following section deals with some
of the demographic aspects of urbanization including the characteristics and
the structure of class 1 cities which are considered to be the most dynamic
component in the urban world. Section 3 deciphers some of the findings on
poverty and wellbeing in slums based on the micro surveys in different types
of cities, connecting the wellbeing issue to agglomeration economies. Finally
the conclusion and policy issues are included in section 4. Research
methodology includes factor analysis, explaining its relevance later in the text.
Urbanisation in India
The level of urbanization in the Indian context unlike the historical
experience of several developed countries at comparable levels of per capita
income and growth has been quite low. It increased sluggishly from 17.29 per
cent in 1951 to 27.76 per cent in 2001 and 31.16 per cent in 2011 (Table 1).
However, the rate of growth of urban population has been quite high
notwithstanding a nominal increase in the per cent urban (Table 2).
Demographers are quite concerned about this high rate of growth of urban
population as it tends to create significant pressure on the infrastructure base.
The number of cities and towns has also gone up considerably over the years,
particularly over the last decade: from 5161 in 2001 to 7935 in 2011.

Vol. 1, No. 1 Mitra: Agglomeration Economies and Wellbeing: Evidence from India…
28
Table 1. Urbanization Level and Urban Growth
Year % Urban No. of Cities
or Towns
Rate of Growth
of Pop in
Urban Areas
Rate of Growth
of Pop in All
Areas
1951 17.29 3035
1961 17.97 2657 2.37 1.97
1971 19.91 3081 3.29 2.24
1981 23.34 3981 3.87 2.23
1991 25.70 4615 3.16 2.16
2001 27.79 5161 2.75 1.97
2011 31.16 7935 2.7 Note: 1981 and 1991 figures include interpolated population estimates for Assam and Jammu
and Kashmir respectively.
Source: Census of India, 2001, 2011 and also Premi (2006).
Though the number of cities and towns went up steadily, urban population
in India is concentrated in big cities. For example, the class 1 cities (each with
a population of 100,000 and above) constituted around 70 per cent of the total
urban population in 2011. There were 384 urban agglomerations1 in 2001
which went up to 475 in 2011. Further, 42.5 per cent of the total urban
population lived in 53 metropolises (each with a population of I million and
above) in 2011. Among the class I cities population distribution again seems to
be highly unequal: only the top ten mega cities accounted for one-fourth of the
total urban population in 2011. All this tends to suggest a highly unequal size
distribution of urban population, i.e., large cities account for a large percentage
of the urban population.
The definition of urban, particularly in the Indian context, seems to be
quite broad and hence, it includes areas which still do not show any dynamism
as the term urbanization is expected to indicate. One popular view in the
context of urbanization suggests that only class 1 cities are to be considered as
representative of urban characteristics and dynamism. In this section we,
therefore, carry out a detailed study of 380 class 1 cities/urban agglomerations
(as per the 2001 population census) in order to comment on their
characteristics and asses how vibrant Indian urbanization has been. This is of
course pursued in a very indirect manner by examining the question whether
large cities offer better employment opportunities and a better demographic
profile. This could not be done for more recent year (2011) as the detailed data
are still awaited.
Keeping in view the limitations of the data we focus here on a set of
variables which capture demographic, social and economic aspects. These
variables are household size, female-male ratio, child-woman ratio, literacy,
male and female work participation rate, percentage of work force engaged in
non-agriculture activities excluding household manufacturing. Lower
household size and child-woman ratio are desirable from demographic point of
view. Literacy is likely to increase to reflect development. Similarly enhanced
1An urban agglomeration is defined as a continuous urban spread comprising one or more town
and their adjoining outgrowths.
Athens Journal of Health March 2014
29
work participation, particularly for females is indicative of higher social
development and for males, better economic opportunities.
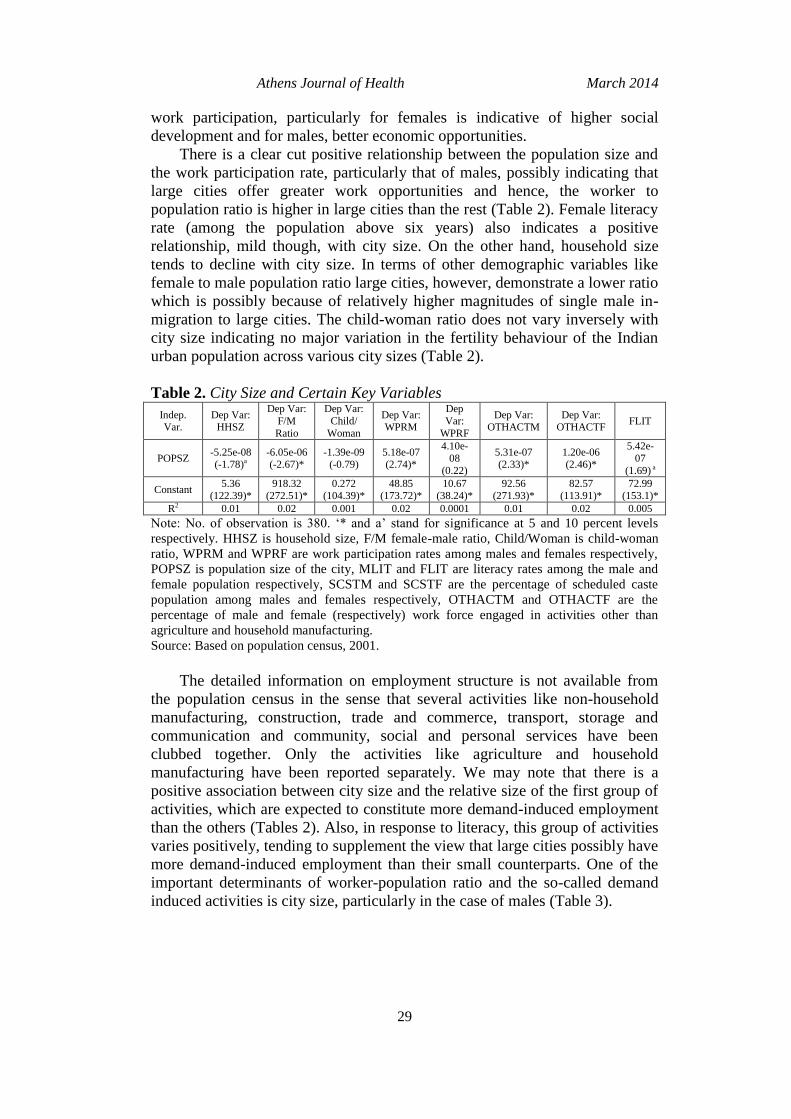
There is a clear cut positive relationship between the population size and
the work participation rate, particularly that of males, possibly indicating that
large cities offer greater work opportunities and hence, the worker to
population ratio is higher in large cities than the rest (Table 2). Female literacy
rate (among the population above six years) also indicates a positive
relationship, mild though, with city size. On the other hand, household size
tends to decline with city size. In terms of other demographic variables like
female to male population ratio large cities, however, demonstrate a lower ratio
which is possibly because of relatively higher magnitudes of single male in-
migration to large cities. The child-woman ratio does not vary inversely with
city size indicating no major variation in the fertility behaviour of the Indian
urban population across various city sizes (Table 2).
Table 2. City Size and Certain Key Variables
Indep. Var.
Dep Var: HHSZ
Dep Var:
F/M
Ratio
Dep Var:
Child/
Woman
Dep Var: WPRM
Dep
Var:
WPRF
Dep Var: OTHACTM
Dep Var: OTHACTF
FLIT
POPSZ -5.25e-08 (-1.78)a
-6.05e-06 (-2.67)*
-1.39e-09 (-0.79)
5.18e-07 (2.74)*
4.10e-
08
(0.22)
5.31e-07 (2.33)*
1.20e-06 (2.46)*
5.42e-
07
(1.69) a
Constant 5.36
(122.39)* 918.32
(272.51)* 0.272
(104.39)* 48.85
(173.72)* 10.67
(38.24)* 92.56
(271.93)* 82.57
(113.91)* 72.99
(153.1)*
R2 0.01 0.02 0.001 0.02 0.0001 0.01 0.02 0.005
Note: No. of observation is 380. „* and a‟ stand for significance at 5 and 10 percent levels
respectively. HHSZ is household size, F/M female-male ratio, Child/Woman is child-woman
ratio, WPRM and WPRF are work participation rates among males and females respectively,
POPSZ is population size of the city, MLIT and FLIT are literacy rates among the male and
female population respectively, SCSTM and SCSTF are the percentage of scheduled caste
population among males and females respectively, OTHACTM and OTHACTF are the
percentage of male and female (respectively) work force engaged in activities other than
agriculture and household manufacturing.
Source: Based on population census, 2001.
The detailed information on employment structure is not available from
the population census in the sense that several activities like non-household
manufacturing, construction, trade and commerce, transport, storage and
communication and community, social and personal services have been
clubbed together. Only the activities like agriculture and household
manufacturing have been reported separately. We may note that there is a
positive association between city size and the relative size of the first group of
activities, which are expected to constitute more demand-induced employment
than the others (Tables 2). Also, in response to literacy, this group of activities
varies positively, tending to supplement the view that large cities possibly have
more demand-induced employment than their small counterparts. One of the
important determinants of worker-population ratio and the so-called demand
induced activities is city size, particularly in the case of males (Table 3).

Vol. 1, No. 1 Mitra: Agglomeration Economies and Wellbeing: Evidence from India…
30
Table 3. Determinants of Work Participation Rates and % of Work Force
Engaged in Non-household Manufacturing, Trade and Commerce, Transport,
Storage and Communication and Community, Social and Personal Services
Indep.
Var.
Dep
Var:
WPRM
Indep.
Var.
Dep Var:
OTHACTM
Indep.
Var.
Dep
Var:
WPRF
Indep.
Var.
Dep Var:
OTHACTF
SCSTM -0.064
(-1.85) SCSTM
-0.03
(-0.81) SCSTF
0.09
(3.31)* SCSTF
0.16
(2.57)*
MLIT 0.199
(4.84)*
0.34
(6.05)* FLIT
-0.002
(-0.06) FLIT
0.67
(8.96)*
POPSZ
4.58e-
07
(2.49)*
POPSZ 5.04e-07
(2.43)* F/M
0.03
(6.59)* F/M
-0.04
(-3.95)*
HHSZ -2.19
(-3.24)*
CHILD/
WOMAN
-33.05
(-
4.83)*
CHILD/
WOMAN
-11.43
(-0.64)
WPRM -0.31
(-3.35)* WPRF
-1.55
(-12.58)*
POPSZ 4.09e-07
(1.15)
HHSZ -5.43
(-5.90)*
Constant 32.57
(9.22)* Constant
90.85
(8.45)* Constant
-6.32
(-1.02) Constant
116.26
(7.97)*
R2 0.08 0.20 0.34 0.51
Note: No. of observation is 380. For variables‟ names and other notes see Table 4a.
Source: Based on population census, 2001.
In order to highlight the association between several variables
simultaneously the factor analysis is considered to be appropriate as it does not
get into the cause-effect relationship though at the same time it churns out the
commonalities among different variables. A statistically significant factor
deciphers the variables which tend to have strong association among
themselves. This is reflected in terms of the coefficient of the variables known
as factor loadings, the absolute value of which can vary from 0 to 1. Variables
with factor loadings closer to modulus 1 are treated to be dominant and the
ones with closer to 0 are insignificant.
The results of the factor analysis (Table 4) corroborate the patterns which
we observed from the regression analysis. The work participation rate, literacy
and the dynamic component of the activities are positively associated with
each other which are in turn negatively related to household size and child-
woman ratio. In other words, the development indicators scattered over various
dimensions are in a sense inter-related. With rise in literacy the work
participation improves and so also the probability to access jobs in relatively
dynamic activities. As participation in productive jobs rises fertility tends to
decline which is reflected in lower household size and the child-woman ratio.
The cluster analysis has been carried out to examine if the groups formulated
on the basis of the magnitudes of the attributes have a geographical
correspondence. Based on the data set for 380 class 1 cities/urban
agglomerations around twenty groups can be identified. It is, however, quite
difficult to decipher any systematic pattern in relation to their geographic
location.

Athens Journal of Health March 2014
31
Table 4. Results from Factor Analysis
Variables Factor 1 Factor 2
HHSZ -0.842 0.168
F/M 0.446 -0.378
CHILD/WOMAN -0.813 0.186
MLIT 0.764 0.241
FLIT 0.825 0.176
WPRM 0.646 -0.386
WPRF 0.556 -0.465
OTHACTM 0.367 0.585
OTHACTF 0.327 0.659
SCSTM 0.178 0.563
SCSTF 0.193 0.570 Note: No. of observations: 380. % Explained: 54.09. For variables‟ names see Table 4a.
Source: Based on population census, 2001.
Well-being of the Low Income Households
The next issue relates to the well-being levels of the population in
different types of cities with the underlying hypothesis that agglomeration
economies in large cities get translated into higher wellbeing levels. Higher
agglomeration economies reflected in terms of higher productivity levels and
real earnings imply greater affordability. Nutritional status and accessibility to
education and health improve which in turn contribute to the overall wellbeing
levels of the households. Fertility behaviour for example changes and so also
the indicators of social development as education levels and health outcomes
tend to improve.
However, due to the lack of data for the total city population we had to
examine this hypothesis indirectly. The question that we pose is are the
households from low income households better off in large cities compared to
their counterparts in relatively small ones? On the aspect of poverty and well-
being not much information is available at the city level from the secondary
sources. However, under the UNDP-sponsored project on urban poverty one
survey was undertaken in four cities of different population size and economic
activities (i.e. Jaipur, Ludhiana, Mathura and Ujjain)1. These cities were picked
up from the list of sixty-four cities prepared specifically for the urban renewal
mission (JNNURM). The primary survey enables us to comment on certain
aspects of well-being of the slum dwellers in these four cities. While Jaipur
and Ludhiana are two million plus cities, Mathura and Ujjain are relatively
small in size. Again, Ludhiana is an industrial city while Jaipur being a state
capital, a tourist centre and also a trade centre has a significant spread of the
services sector. Mathura and Ujjain are both religious cities and between the
two the latter is absolutely stagnant. Such a mix of cities enables us to perceive
wellbeing of the slum dwellers in a context which involves large variations.
1This project and survey sponsored by UNDP-GOI were undertaken by the Institute of
Economic Growth, Delhi.

Vol. 1, No. 1 Mitra: Agglomeration Economies and Wellbeing: Evidence from India…
32
From the measurement point of view various dimensions of poverty,
rather than only income or consumption poverty, need to be considered to
assess well-being. However, we could consider only those dimensions which
are quantifiable. The following variables have been combined to construct the
household specific well-being index: household size (HHSZ), child-woman
ratio (CWR), per capita consumption expenditure1 (PCE), proportion of
persons in the household who reported illness (ILL), percentage of household
members who acquired at least primary level education (PRIM), percentage of
members in the age group 15 to 59, which is a proxy for adult potential earners
(PER15-59), percentage of working individuals (WM), age of the household
head/principal earner taken as a proxy for experience in the job market (AG),
health expenditure per capita (HPC), and per capita household income
(HHPCI).
Household size is likely to reduce the well-being because the earnings and
the related gains get distributed among a large number of individuals with an
increase in the number of members. Similarly households with greater child-
woman ratio indicate a higher rate of fertility and thus the economic gains get
shared among a large number of children. As the percentage of ill members in
the household rises, the income loss due to work-loss and, also, extra
expenditure for curative purposes tend to increase, reducing the wellbeing level
of the household. Health expenditure per capita on a priori basis may raise the
well-being of the household if it is incurred for protective purposes, enhancing
productivity. On the other, it may reduce well-being if it is incurred at the
expense of consumption of essential items.
The other variables are expected to improve well-being. Per capita
household income (HHPCI) and per capita consumption expenditure (PCE)
raise the wellbeing because higher income and higher consumption enhance
the accessibility to better quality life and health. Similarly with a rise in the
percentage of household members who acquired at least primary level
education (PRIM) the accessibility to better jobs and incomes and also
awareness about heath and children‟s education improves. The percentage of
members in the age group 15 to 59 which is a proxy for adult potential earners
(PER15-59), the percentage of working individuals (WM), and the age of the
household head/principal earner which is a proxy for experience in the job
market (AG) contribute to household income positively.
Since these variables are heterogeneous, it is difficult to combine them to
indicate an overall living standard of the households. Hence, factor analysis
was conducted, and using the factor loadings as weights, variables were
combined to generate a composite index of well-being, denoted as
WELLINDEX(i). This was repeated for each of the significant factors (factors
with eigenvalues greater than one):
1It excludes health expenditure.

Athens Journal of Health March 2014
33
n
j
XjiFLjiWELLINDEX1
)()(
where, FL is the factor loading, j= 1…n corresponding to the number of
variables, and i represents the ith significant factor.
In the second stage the composite indices generated on the basis of factor
loadings for each of the significant factors were combined using the proportion
of eigenvalues as weights:
)()(
)(
1
iWELLINDEXiEV
iEVWELLINDEX
k
i
nk
where, i ranges from 1 to k, the number of significant factors.
Using the varimax rotation technique (in order to obtain statistically
independent factors), results of the factor analysis are derived which suggest
the presence of only one significant factor in each of the four cities (Table 5).
The factor loading of household size takes a negative sign, which suggests that
it reduces the well-being of the households. Household income per capita and
consumption expenditure per capita both take positive factor loadings though
in terms of magnitude they are moderate like that of household size. On the
higher side are child-woman ratio, percentage of household members in the
age bracket 15 to 59 and proportion of the number of working members to the
total household size. While the child-woman ratio reduces the well-being as
reflected in terms of negative factor loadings, the other two variables take a
positive coefficient. Education, though highly moderate in terms of magnitude,
shows a positive effect except in Jaipur. Health expenditure per capita also
shows a positive effect though magnitude of the factor loadings is quite low.
Table 5. Factor Loadings from the Significant Factor
Variables Jaipur Ludhiana Mathura Ujjain
HHSZ -0.24249 -0.2870 -0.23875 -0.21306
PCE 0.31847 0.36047 0.39325 0.36662
PRIM -0.09208 0.17426 0.14379 0.14023
HHPCI 0.34237 0.30792 0.28774 0.34142
HPC 0.04937 0.10 0.15056 0.10359
CWR -0.65278 -0.84593 -0.81161 -0.79265
ILL 0.06632 0.0145 0.06734 0.03419
PER15-59 0.77230 0.78747 0.78868 0.77967
AG 0.16166 0.09205 0.20811 0.15901
WM 0.61494 0.43949 0.39971 0.32805
Eigenvalue 2.255
(22.55)
2.8278
(22.28)
2.484
(24.84)
2.4205
(24.205) Note: Figures in parentheses represent the percentage of total variation explained by the
significant factor.
The well-being index has been constructed using the factor loadings as
weights. It indicates that in Jaipur and Ludhiana 26 and 32 per cent of the slum

Vol. 1, No. 1 Mitra: Agglomeration Economies and Wellbeing: Evidence from India…
34
households respectively are located in the bottom two size classes (Table 6).
However, in Mathura and Ujjain, which are much smaller than the other two
cities and also lack growth dynamism, the corresponding figures are 57 and 61
per cent respectively. Thus the well-being index even among the low income
households seems to have a positive association with city size and it tends to
vary with the nature of the city. It is interesting to note that these figures are
substantially lower than the incidence of consumption poverty, which is 66.8
per cent in Jaipur, 43.6 per cent in Ludhiana, 75 per cent in Mathura and 88.2
per cent in Ujjain. This would tend to suggest that even when consumption
poverty is high, many other facilities which are available in the cities
contribute to the well-being of the population. However, we may note that
even in the so-called dynamic cities the percentage of slum households located
in the bottom size classes is not negligible either, suggesting that growth alone
cannot eradicate poverty.
Table 6. Size Distribution of Households as per the Well-being Index
Size Class Jaipur Ludhiana Mathura Size Class Ujjain
Upto 200 1.2 3.6 7.6 Upto 200 8
201-400 24.6 28.2 49.2 201-400 53
401-600 37.4 29.8 24 401-600 27.4
601-1000 27.8 25 14.2 601-800 8.8
1001-1500 6.6 9.2 3.6 800 and above 2.8
1501 and above 2.4 4.2 1.4
Conclusion
Large cities are said to be more productive: more demand-induced
employment opportunities are available in large cities which grow in response
to large quantum of investment undertaken therein. In terms of several socio-
economic development indicators we verified that they tend to improve with a
rise in city size. Economic globalization has not reduced the intra-urban or
rural-urban growth differentials. The agglomeration economies continue to
exist because the new forces in the present context of economic globalisation
have emerged to substitute the forces which explained their prevalence around
two decades back and have been on the decline. This is, however, not to deny
the considerable overlaps that may exist between informal sector employment,
poverty, slums and other disamenities in large cities.
In the next step we tried to assess if the wellbeing of those in the low
income households tends to vary across cities. Since the large cities are more
productive as reflected in terms of a wide range of socio-economic indicators
the low income households in large cities are likely to be better-off in large
cities relative to their counterparts in small urban settlements. Based on a wide
range of variables the wellbeing index has been computed for each of the slum
households in the sample. Micro evidence suggests that large cities tend to
improve the wellbeing of the population even among the low income

Athens Journal of Health March 2014
35
households. The percentage of slum households at the bottom size classes is
much larger in the stagnant and small urban settlements compared to the large
and relatively dynamic ones. However, several of the sample households even
in large cities are located in the bottom size classes. For them to experience an
upward mobility the urban employment programmes are pertinent. Most of the
urban specific programmes in India largely emphasize the importance of basic
amenities to the urban poor and infrastructure need of the cities. However,
safety-net for the low productivity urban informal sector workers is essential
for reducing the intensity and the incidence of urban poverty. Besides,
improvement in health and educational support can have long lasting effect on
poverty.
References
Brotchie, J. P. Newton, P. Hall and P. Nijkamp, (1985), The Future of Urban Form:
The Impact of New Technology, Routledge, London.
Fujita, M. and Thisse, J.-F. (2003). Does geographical agglomeration foster economic
growth? And who gains and loses from it? The Japanese Economic Review 54,
121-145.
Henderson, J. V. (1986). Efficiency of resource usage and city size. Journal of Urban
Economics 19, 47-70.
Hermansen, T. (1972), “Development Poles and Related Theories: A Synoptic
Review,” in N. M. Hansen (ed.) Growth Centers in Regional Economic
Development, The Free Press, New York.
Hoselitz, B. (1953) “The Role of Cities in the Economic Growth of Underdeveloped
Countries”, Journal of Political Economy, Vol. 61, No.3.
Huwart, J.Y. and L. Verdier (2013), Economic Globalisation: Origins and
Consequences, OECD Insights, OECD Publishing, http://dx.doi.org/10.1787/
9789264111899-en
Kamal-Chaoui, L. and Sanchez-Reaza, J. (eds.) (2012), “Urban Trends and Policies in
OECD Countries”, OECD Regional Development Working Papers 2012/01,
OECD Publishing, http://dx.doi.org/10.1787/5k9fhn1ctjr8-en
Krugman, P. (1991), Increasing returns and economic geography. Journal of Political
Economy 99, 483-499.
Kuchiki, A. (2005). Theory of a flowchart approach to industrial cluster policy.
Discussion Paper Series, Institute of Developing Economies-JETRO No. 36.
Kundu, Amitabh (2006), Urbanisation and Urban Governance: Search for a
Perspective Beyond Neo-Liberalism”, in A. Shaw (ed.) Indian Cities in
Transition, Orient Longman, Hyderabad.
Kumar, R., S. Kumar and Arup Mitra (2009) Social and Economic Inequalities:
Contemporary Significance of Caste in India, Economic and Political Weekly,
December 12, 2009 vol xliv no 50,
Meyer, D.R.(1998), “World Cities As Financial Centres”, in F.-C. Lo and Y. M.
Yeung (eds.) Globalization and the World of Large Cities, United Nations
University Press, Tokyo.
Mills, E. S. (1967). An aggregate model of resource allocation in a metropolitan area.
American Economic Review 57, 197-210.

Vol. 1, No. 1 Mitra: Agglomeration Economies and Wellbeing: Evidence from India…
36
Mills, E.S. and C.M. Becker (1986), Studies in Indian Urban Development, Oxford
University Press, World Bank Research Publication
Mills, E. S. and B. W. Hamilton (1994), Urban Economics, 5th Ed. Glenview, IL:
Scott Foresmen.
Mills, E. S. and Arup Mitra (1997), Urban Development and Urban Ills,
Commonwealth Publishers, Delhi.
Mitra, Arup, (1994), Urbanisation, Slums, Informal Sector Employment and Poverty:
An Exploratory Study, B. R. Publishing Corp.
Mitra, Arup (1999), “Agglomeration Economies As Manifested in Technical
Efficiency at the Firm Level”, Journal of Urban Economics, Vol. 45, 490-500.
Mitra, Arup (2000), “Total Factor Productivity Growth and Urbanization Economies:
A Case of Indian Industries,” Review of Urban and Regional Development
Studies, Vol. 12.
Mitra, Arup, Aristomene Varoudakis and Marie-Ange Veganzones- Varoudakis
(2002), “Productivity and Technical Efficiency in Indian States‟ Manufacturing:
The Role Infrastructure,” Economic Development and Cultural Change, 50.
Mitra, Arup (2007), “Industry-Urban Nexus: The Role of Agglomeration Economies,”
in A. Shaw (ed.) Indian Cities in Transition, Orient Longman, Hyderabad.
Mitra, Arup (2010), Migration, Livelihood and Well-being: Evidence from Indian
City-Slums, Urban Studies, Volume 47, No.7.
Mitra, Arup (2013), Insights into Inclusive Growth, Employment and Wellbeing in
India, Springer, Delhi.
Mitra, Arup and Barjor Mehta (2011), “Cities as the Engine of Growth: Evidence
from India”, Vol. 137, No. 2, June 1, 171–183.
Mohan, Rakesh, (1993), Industrial Location Policies and Their Implications for India,
Paper No. 9, Ministry of Industry, Office of the Economic Adviser, Government
of India.
Papola, T. S. (1981). Urban informal sector in a developing economy. Vikas
Publishing House.
Premi, M. K.(2006), Population of India: In the New Millennium: Census 2001,
National Book Trust India, New Delhi.
Sachs, Jeffrey D., Nirupam Bajpai and Ananthi Ramiah (2002), “Understanding
Regional Economic Growth in India,” CID Working Paper No. 88, Center for
International Development at Harvard University, March 2002.
United Nations (2001), Reducing Disparities: Balanced Development of Urban and
Rural Areas and Regions within the Countries of Asia and the Pacific, Economic
and Social Commission for Asia and the Pacific.
Willimason, J. (1988), “Migration and Urbanisation,” in H. Chenery and T.N.
Srinivasan (eds.) Handbook of Development Economics, Vol. I, Elsevier Science
Publishers, B.V.