Embed Size (px)
Citation preview
1
Agent Network Accelerator Survey: Senegal Country Report 2015
May 18, 2016
In partnership with:
2
Africa
Project Description
The Helix Institute of Digital Finance, founded in November 2013 as a partnership between MicroSave, the Bill & Melinda Gates Foundation, the International Finance Corporation (IFC), and the UN Capital Development
Fund (UNCDF), provides world-class training and cutting-edge data for digital financial service providers.
The Agent Network Assessment (ANA) for Senegal is funded by the UNCDF Mobile Money for the Poor (MM4P) programme, in partnership with
The MasterCard Foundation.
Research findings are disseminated through the Helix Institute of Digital Finance and the MM4P programme in Senegal.
3
Africa
Mobile Money For The Poor Programme
Mobile Money for the Poor is an international programme launched in
Senegal in 2015 by the UNCDF in partnership with the MasterCard
Foundation.
MM4P supports the development of digital financial services in Asia and
Africa. Through this programme, UNCDF aims to demonstrate that the
correct mix of financial, technical as well as institutional support can
facilitate the development of digital financial services.
MM4P’s objective is to make digital financial services accessible to low-
income people and thereby to contribute to their financial inclusion as
outlined in the Sustainable Development Goals (SDGs).
For more information on the programme: Mobile Money for the Poor.

4
The views expressed in this publication are those of the author(s) and do not necessarily represent those of the United Nations, including UNCDF, or their Member States.
Acknowledgement
Contributing Authors:
Mélissa Rousset and Irene Wagaki
With Special Thanks To:
Vera Bersudskaya
Helix is grateful for the support received from Research Solutions Africa (RSA) and the Senegalese service providers in conducting this study. Helix also
appreciates UNCDF’s logistical support.
5
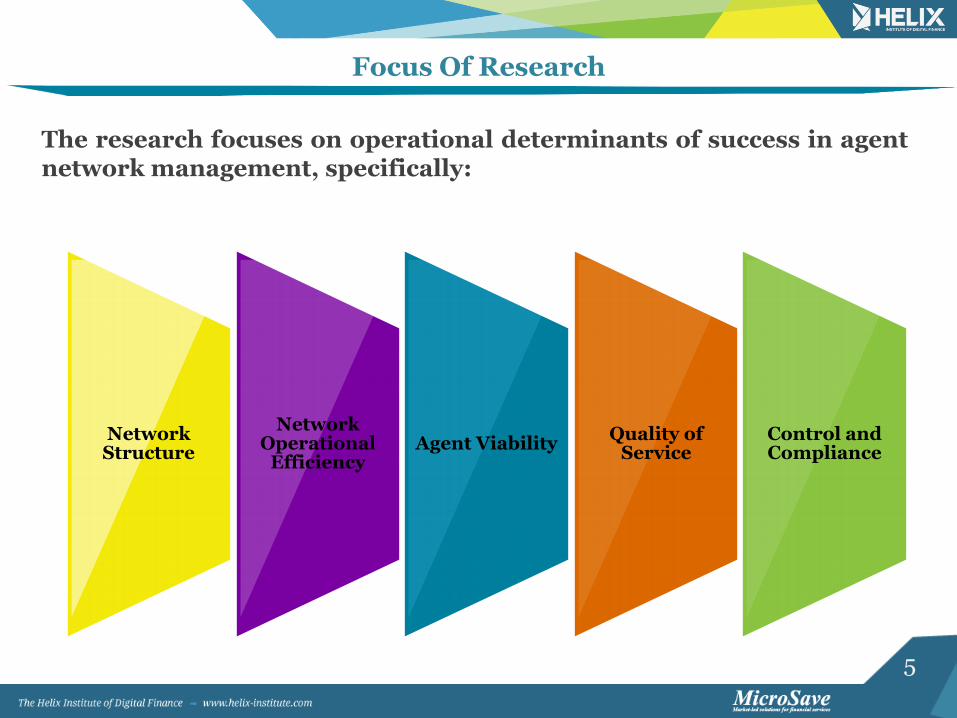
The research focuses on operational determinants of success in agent network management, specifically:
Focus Of Research
Agent Viability Control and Compliance
Quality of Service
Network Operational
Efficiency
Network Structure
6
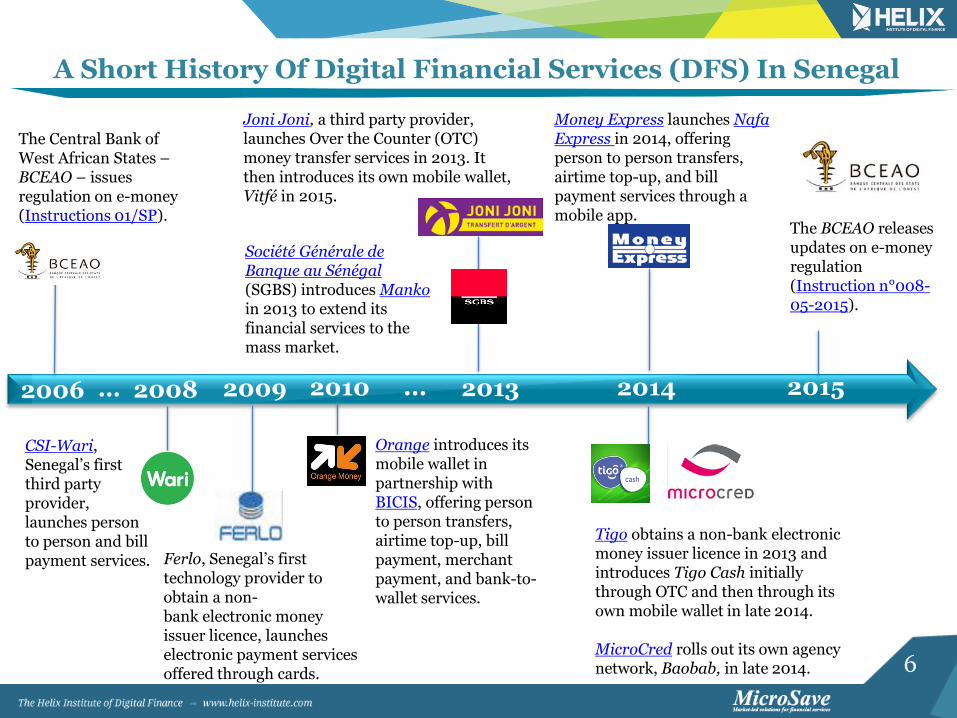
A Short History Of Digital Financial Services (DFS) In Senegal
2008 2014 ... 2006
The Central Bank of West African States –BCEAO – issues regulation on e-money (Instructions 01/SP).
Société Générale de Banque au Sénégal (SGBS) introduces Manko in 2013 to extend its financial services to the mass market.
2013
CSI-Wari, Senegal’s first third party provider, launches person to person and bill payment services.
2010 2015
The BCEAO releases updates on e-money regulation (Instruction n°008-05-2015).
Tigo obtains a non-bank electronic money issuer licence in 2013 and introduces Tigo Cash initially through OTC and then through its own mobile wallet in late 2014. MicroCred rolls out its own agency network, Baobab, in late 2014.
Joni Joni, a third party provider, launches Over the Counter (OTC) money transfer services in 2013. It then introduces its own mobile wallet, Vitfé in 2015.
… 2009
Orange introduces its mobile wallet in partnership with BICIS, offering person to person transfers, airtime top-up, bill payment, merchant payment, and bank-to-wallet services.
Ferlo, Senegal’s first technology provider to obtain a non-bank electronic money issuer licence, launches electronic payment services offered through cards.
Money Express launches Nafa Express in 2014, offering person to person transfers, airtime top-up, and bill payment services through a mobile app.
7
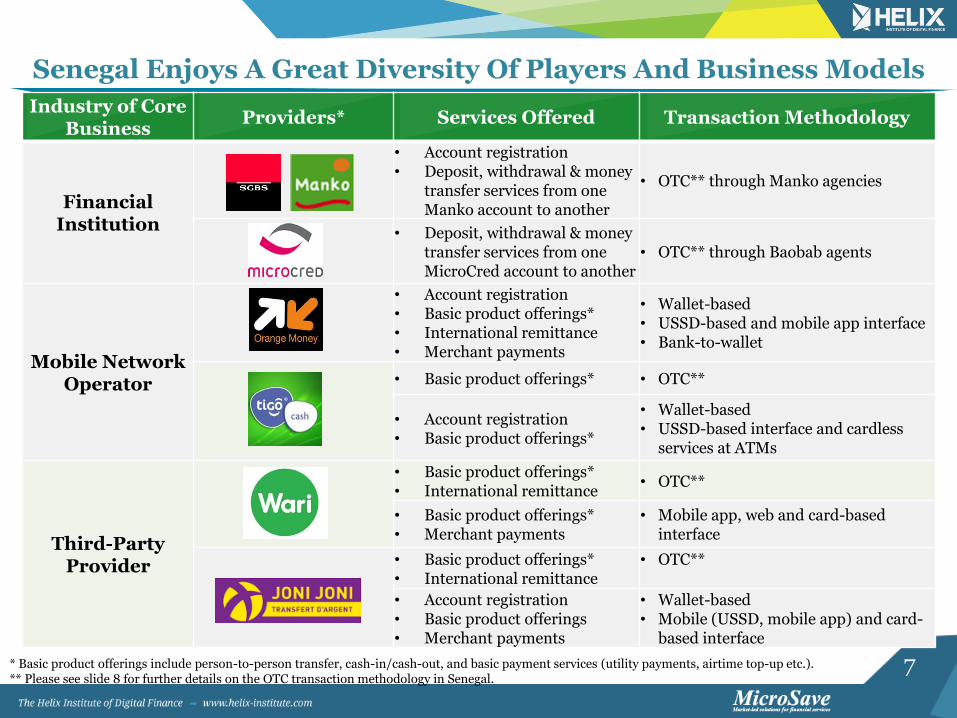
Senegal Enjoys A Great Diversity Of Players And Business Models
Industry of Core Business
Providers* Services Offered Transaction Methodology
Financial Institution
• Account registration • Deposit, withdrawal & money
transfer services from one Manko account to another
• OTC** through Manko agencies
• Deposit, withdrawal & money transfer services from one MicroCred account to another
• OTC** through Baobab agents
Mobile Network Operator
• Account registration • Basic product offerings* • International remittance • Merchant payments
• Wallet-based • USSD-based and mobile app interface • Bank-to-wallet
• Basic product offerings* • OTC**
• Account registration • Basic product offerings*
• Wallet-based • USSD-based interface and cardless
services at ATMs
Third-Party Provider
• Basic product offerings* • International remittance
• OTC**
• Basic product offerings* • Merchant payments
• Mobile app, web and card-based interface
• Basic product offerings* • International remittance
• OTC**
• Account registration • Basic product offerings • Merchant payments
• Wallet-based • Mobile (USSD, mobile app) and card-
based interface
* Basic product offerings include person-to-person transfer, cash-in/cash-out, and basic payment services (utility payments, airtime top-up etc.). ** Please see slide 8 for further details on the OTC transaction methodology in Senegal.

8
The OTC Model
Cash-In
Sender
Cash
Sender shows National Identity Card (NIC) to agent, along with phone number, receiver’s phone number, and amount to be sent.
P2P Transfer
E-Value
Cash-Out
Cash
Receiver
Agent asks Receiver for NIC and confidential PIN.
Agent takes cash from Sender, initiates transfer, and provides a receipt to Sender.
Agent's e-float goes to selected provider's pooled account.
Agent 1 Receiver
SMS including confidential PIN is sent to Receiver.
Agent 2
Agent gets e-float from the provider’s pooled account and gives cash to Receiver.
Since the transaction does not involve a wallet, Agent 1 effectively chooses the provider for each transaction and therefore carries a lot of power in the relationship with the provider, driving transactional commissions higher.
Sender gets confirmation SMS of cash withdrawn.
9
Agent Network Overview
The Senegalese digital finance market is fractured between four major players who tend to share agents, thus agents serve a median of three
providers. There is widespread adoption of the OTC transaction methodology with money transfers as the anchor product. High revenues
and low operating expenses make agents the most profitable among all ANA research countries. The Senegalese market is facing a watershed
moment, as many providers are transitioning to wallet-based products. In this transition, providers will want to maintain agent profitability as well
as support its customers—not all of whom may be ready.
Agents are optimistic about the business: the majority foresee themselves continuing as an agent in one year’s time, yet perceive service downtime as a major impediment to expanding their agency business.
Although most providers have launched e-wallet services, few agents offer account registration or wallet-based cash-in and cash-out services.
10
Network Structure
11
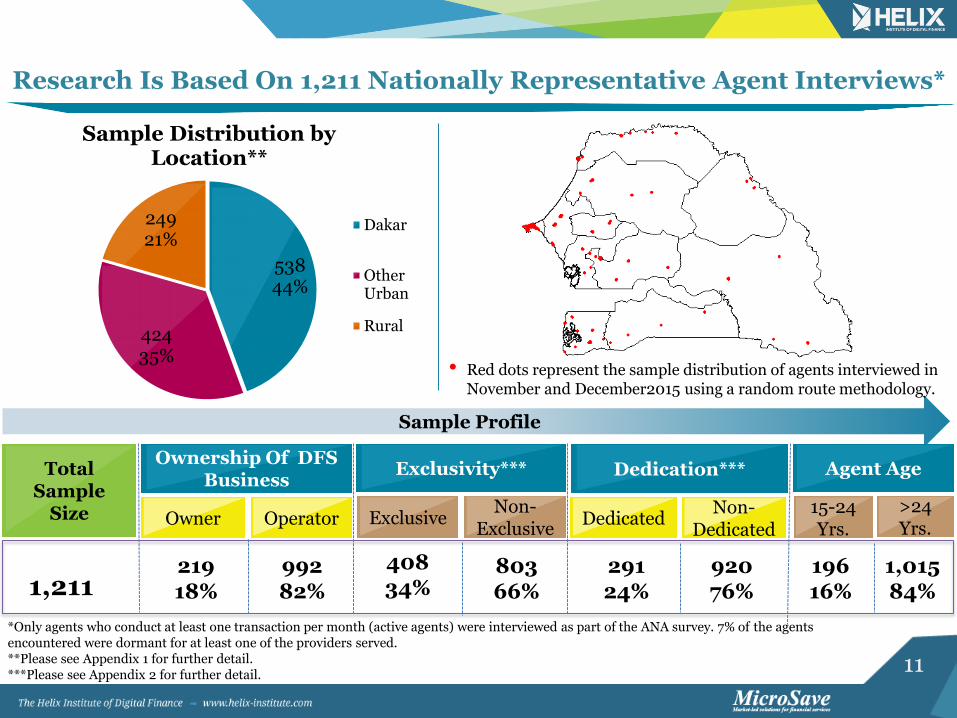
Research Is Based On 1,211 Nationally Representative Agent Interviews*
*Only agents who conduct at least one transaction per month (active agents) were interviewed as part of the ANA survey. 7% of the agents encountered were dormant for at least one of the providers served. **Please see Appendix 1 for further detail. ***Please see Appendix 2 for further detail.
538 44%
424 35%
249 21%
Sample Distribution by Location**
Dakar
OtherUrban
Rural
Total Sample
Size
Ownership Of DFS Business
Exclusivity***
920 76%
219 18%
Operator Owner Exclusive
992 82%
Dedication***
408 34%
803 66%
291 24%
Sample Profile
1,211
Agent Age
196 16%
1,015 84%
15-24 Yrs.
>24 Yrs.
Dedicated Non-
Dedicated
Non-Exclusive
• Red dots represent the sample distribution of agents interviewed in November and December2015 using a random route methodology.

12
*Agent market presence is defined as the proportion of cash-in/cash-out agents by provider. Numbers here are provided on a unique provider till basis, therefore if an agent serves three providers the agency is counted three times. If an agent has multiple tills for the same provider, on the other hand, they are counted once. **The ‘Others’ category includes Money Express (3%), ATPS (2%), Microcred (1%), PosteFinance (1%), and other providers (<1%).
The Senegalese Market Is Competitive With One Frontrunner
34%
25%
20%
11% 10%
Market Presence*
Wari
Joni-Joni
Orange
Tigo
Others**
The Senegalese market is fractured between four major players. Wari is the market leader representing a little over a third of agents in the country (34%), followed by Joni-Joni (25%), Orange (20%) and Tigo (11%).
Since they were the first provider to expand outside Dakar, Wari has the largest share of market presence in other urban and rural areas.
31%
24%
21%
12%
12%
Dakar
38%
26%
19%
10% 7%
Other Urban
38%
26%
19%
9% 8%
Rural Wari
Joni-Joni
Orange
Tigo
Others

13
Network Operational Efficiency
14
57% 23%
20%
Age of Agency
1 Year orLess
2 years
3+ Years
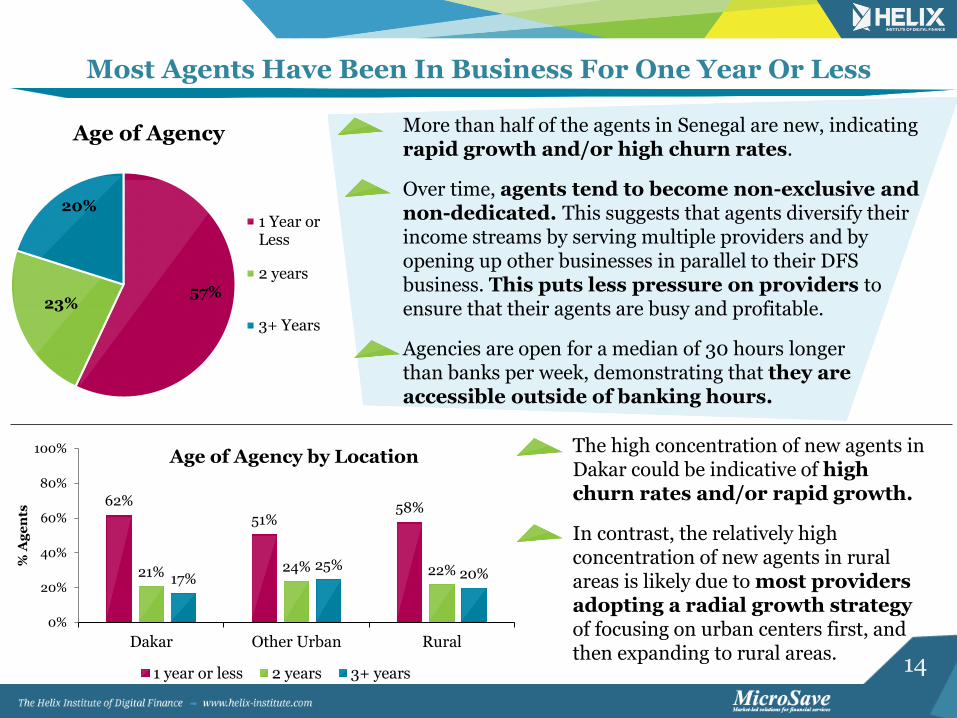
Most Agents Have Been In Business For One Year Or Less
62%
51% 58%
21% 24% 22% 17%
25% 20%
0%
20%
40%
60%
80%
100%
Dakar Other Urban Rural
% A
ge
nts
Age of Agency by Location
1 year or less 2 years 3+ years
More than half of the agents in Senegal are new, indicating rapid growth and/or high churn rates.
Over time, agents tend to become non-exclusive and non-dedicated. This suggests that agents diversify their income streams by serving multiple providers and by opening up other businesses in parallel to their DFS business. This puts less pressure on providers to ensure that their agents are busy and profitable.
Agencies are open for a median of 30 hours longer than banks per week, demonstrating that they are accessible outside of banking hours.
The high concentration of new agents in Dakar could be indicative of high churn rates and/or rapid growth.
In contrast, the relatively high concentration of new agents in rural areas is likely due to most providers adopting a radial growth strategy of focusing on urban centers first, and then expanding to rural areas.

15
Most Agents Are Non-Exclusive And Non-Dedicated
91% 89% 87%
44%
36% 34% 34% 30%
0%
10%
20%
30%
40%
50%
60%
70%
80%
90%
100%
% A
ge
nts
Exclusivity: ANA Research Countries*
Zambia India KenyaBangladesh Uganda PakistanSenegal Tanzania
67% 63%
49% 43%
36%
24% 23%
4%
0%
10%
20%
30%
40%
50%
60%
70%
80%
90%
100%
% A
ge
nts
Dedication: ANA Research Countries*
India Uganda ZambiaTanzania Kenya SenegalPakistan Bangladesh
In other urban areas, dedication levels are even lower, with 79% of agencies running a parallel business to complement revenues from their agency business.
Senegal is on par with Pakistan with regards to exclusivity and dedication levels. As Senegal is a non-exclusive OTC market, agents can influence their customers and have the ability to select which
provider they conduct transactions for. This power dynamic puts providers under pressure to offer outstanding agent support and/or loyalty programmes in order to motivate agents to sell their
services and lure new customers to their network.
66% of agents are non-exclusive serving a median of 3 providers.
*ANA surveys were conducted in 2013 in Uganda, Kenya and Tanzania; in 2014 in Bangladesh, Kenya, Pakistan, and India; and in 2015 in Zambia, Tanzania, Uganda, and Senegal. Country comparison graphs contain most recent data available.
16
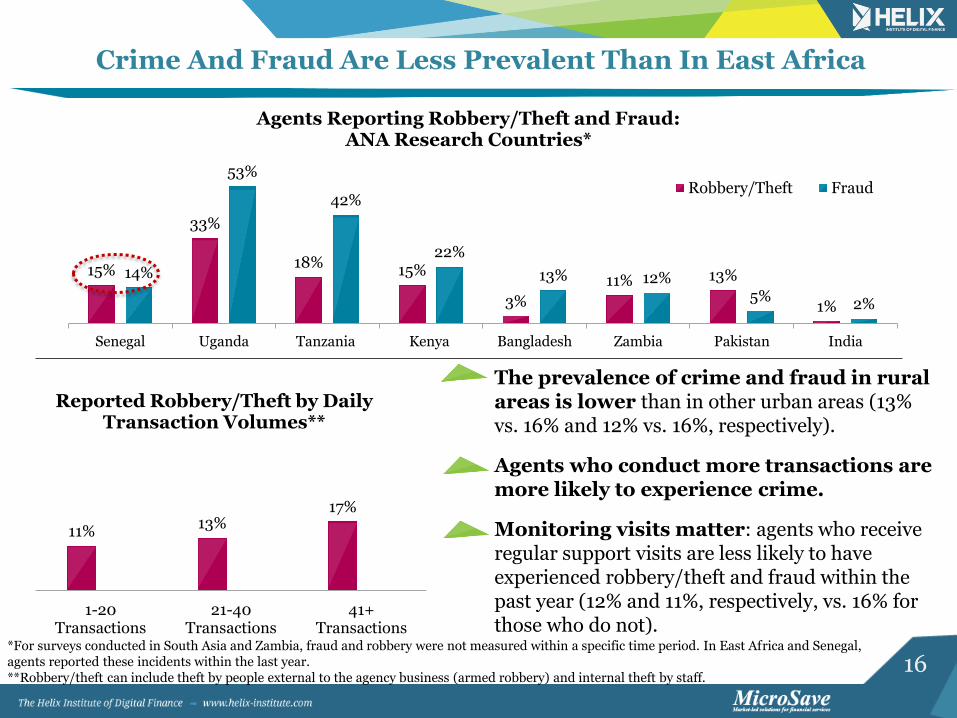
Crime And Fraud Are Less Prevalent Than In East Africa
15%
33%
18% 15%
3%
11% 13%
1%
14%
53%
42%
22%
13% 12% 5%
2%
Senegal Uganda Tanzania Kenya Bangladesh Zambia Pakistan India
Agents Reporting Robbery/Theft and Fraud: ANA Research Countries*
Robbery/Theft Fraud
*For surveys conducted in South Asia and Zambia, fraud and robbery were not measured within a specific time period. In East Africa and Senegal, agents reported these incidents within the last year. **Robbery/theft can include theft by people external to the agency business (armed robbery) and internal theft by staff.
The prevalence of crime and fraud in rural areas is lower than in other urban areas (13% vs. 16% and 12% vs. 16%, respectively).
Agents who conduct more transactions are more likely to experience crime.
Monitoring visits matter: agents who receive regular support visits are less likely to have experienced robbery/theft and fraud within the past year (12% and 11%, respectively, vs. 16% for those who do not).
11% 13%
17%
1-20Transactions
21-40Transactions
41+Transactions
Reported Robbery/Theft by Daily Transaction Volumes**
17
Agent Viability
18
23%
40% 40%
86%
66%
45%
7%
0%
20%
40%
60%
80%
100%
% A
ge
nts
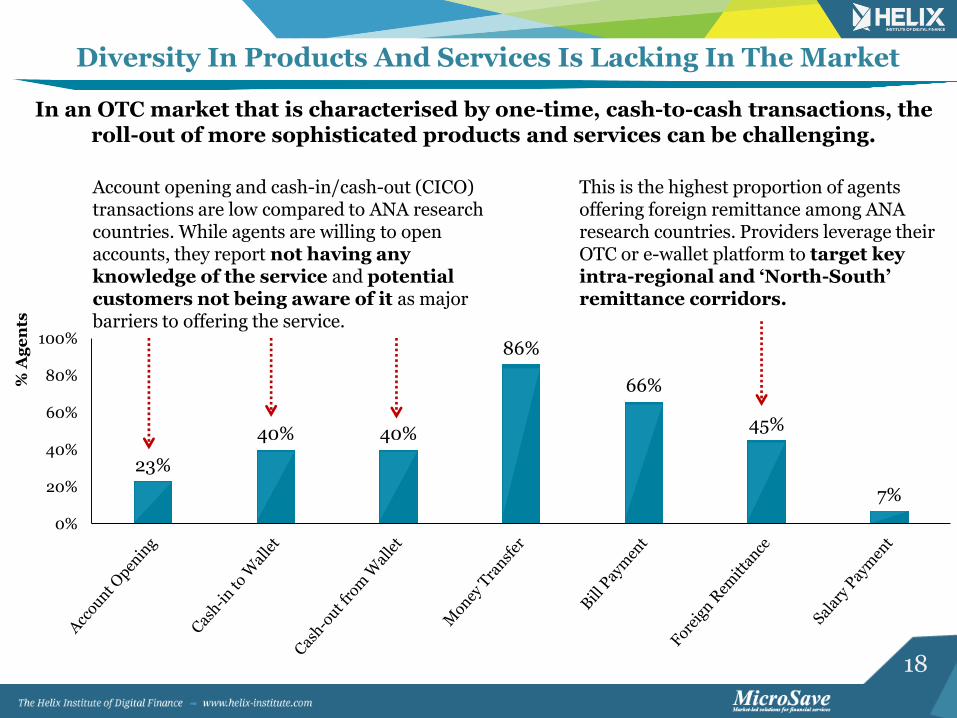
This is the highest proportion of agents offering foreign remittance among ANA research countries. Providers leverage their OTC or e-wallet platform to target key intra-regional and ‘North-South’ remittance corridors.
Diversity In Products And Services Is Lacking In The Market
Account opening and cash-in/cash-out (CICO) transactions are low compared to ANA research countries. While agents are willing to open accounts, they report not having any knowledge of the service and potential customers not being aware of it as major barriers to offering the service.
In an OTC market that is characterised by one-time, cash-to-cash transactions, the roll-out of more sophisticated products and services can be challenging.
19
45
28
20 18
15 15 13
8
0
10
20
30
40
50
Kenya Zambia Uganda Tanzania Senegal Bangladesh India Pakistan
Median Daily Transactions: ANA Research Countries**
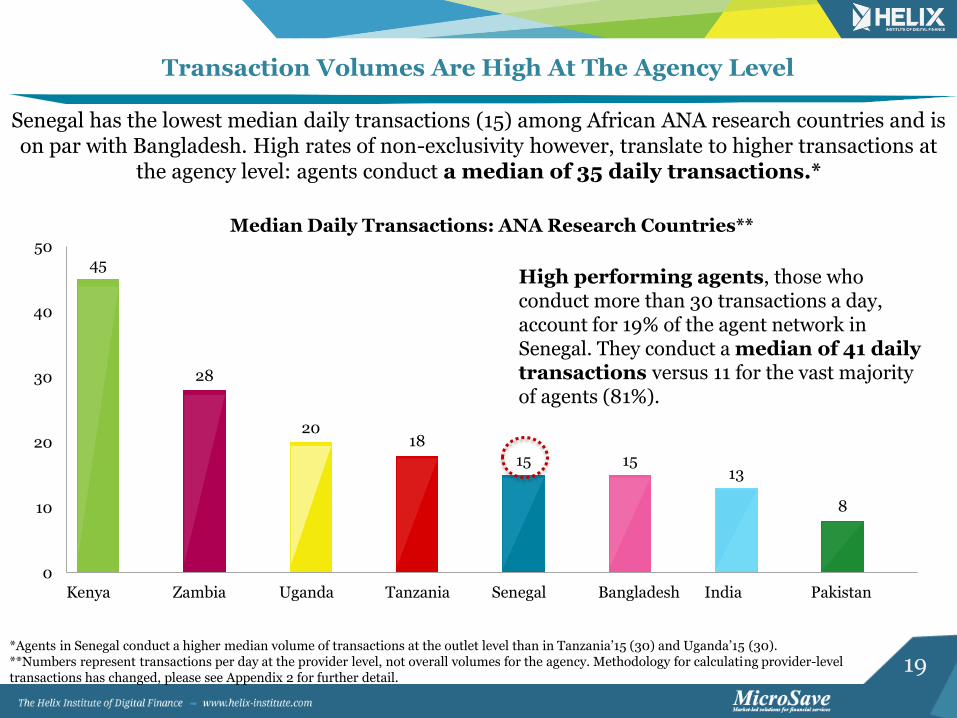
Transaction Volumes Are High At The Agency Level
*Agents in Senegal conduct a higher median volume of transactions at the outlet level than in Tanzania’15 (30) and Uganda’15 (30). **Numbers represent transactions per day at the provider level, not overall volumes for the agency. Methodology for calculating provider-level transactions has changed, please see Appendix 2 for further detail.
Senegal has the lowest median daily transactions (15) among African ANA research countries and is on par with Bangladesh. High rates of non-exclusivity however, translate to higher transactions at
the agency level: agents conduct a median of 35 daily transactions.*
High performing agents, those who conduct more than 30 transactions a day, account for 19% of the agent network in Senegal. They conduct a median of 41 daily transactions versus 11 for the vast majority of agents (81%).

20
Rural, Experienced And Non-Exclusive Agents Conduct More Transactions*
30
40
50
1 year or less 2 years 3+ years
Transactions by Age of Agency
+33% +25%
30 30
40
Dakar Other Urban Rural
Median Daily Transactions by Location
The more providers agents serve, the more transactions they conduct at the agency level.
*Because the Senegalese market is highly non-exclusive, transactions at the agency level provide a more accurate picture of an agent’s business. All figures shown on this slide are the reported total daily transactions for all providers combined (i.e. agency level).
The more experienced agents are, the more transactions they conduct. Providers may consider designing agent loyalty programs to retain agents.
25
35 40
50
1 2 3 4Number of Providers Served
Median Daily Transactions by Exclusivity
+40% +14%
+25%
At the agency level, rural agents conduct more transactions (median of 40) than at the country level (median of 35). This could be explained by the higher concentration of agents in urban areas, creating more competition among agents.

21
Daily Transactions Are Driven By Money Transfers
Overall, the average transaction values are lower for cash-in than other transactions. In fact, over two-thirds of agents report average cash-in values of $8 or less. This suggests that Senegal is largely a cash-to-cash services market, even for e-wallet users. Rural agents conduct higher average transaction values per cash-out ($29 vs. $23 in Dakar), money transfer ($25 vs. $22 in urban centres) and foreign remittance ($157 vs. $134 in Dakar). This indicates uptake of the “send money home” use case, whereby customers transfer money between the urban-rural and the North-South corridors.
Transaction Type Average
Volume Of Transactions
Average Value Of A Transaction
(US$)
Money Transfer/Day 15 $23
Cash-in to Wallet/Day 10 $17
Cash-out from Wallet/ Day 6 $24
Bill Payment/Month 9 $44
Account Opening/Month 13
19 23 22
134
13 24 22
124
16 29 25
157
0
40
80
120
160
Cash-into Wallet
Cash-outfrom Wallet
MoneyTransfer
ForeignRemittance
(US
$)
Average Value of a Transaction by Transaction Type & Location
Dakar Other urban Rural

22
120
58 75 70
51
77
42
16
240
193 188 175 170
154
105
53
0
50
100
150
200
250
300
Senegal Pakistan Uganda Tanzania Bangladesh Kenya Zambia India
Pr
ofi
ts (
US
$)
Median Profitability Comparison (in US$)
Current Prices PPP Adjusted
The non-exclusive agent network model adopted in Senegal is paying off: while exclusive agents make a median monthly profit of US$92, non-exclusive agents make a median monthly profit of US$146. Although Senegalese agents enjoy the highest profits among all ANA
countries, only 39% is somewhat or very satisfied with the profit they receive from providers. This indicates that Senegalese providers may be subject to a commission war to win agents’
loyalty, which could be increasing agents’ appetite for higher commissions.
Agent Profitability* Is Highest Among ANA Research Countries
*Profitability as shown in the graph is calculated as total earnings minus operating expenses for all countries. In the case of India, the fixed monthly component given to agents has also been considered in this calculation. This is different from other ANA research countries where commissions earned makes up the total earnings of the agent. For all countries, profits are reported for overall agent business.
23
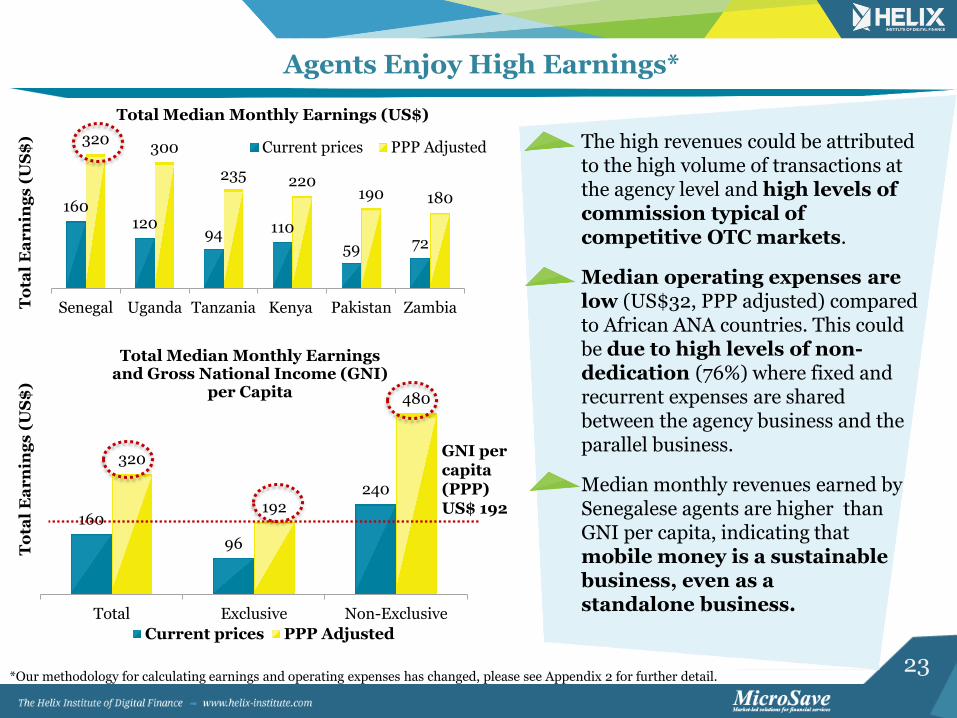
Agents Enjoy High Earnings*
160 120
94 110
59 72
320 300
235 220 190 180
Senegal Uganda Tanzania Kenya Pakistan ZambiaTo
tal
Ea
rn
ing
s (
US
$)
Total Median Monthly Earnings (US$)
Current prices PPP Adjusted
*Our methodology for calculating earnings and operating expenses has changed, please see Appendix 2 for further detail.
The high revenues could be attributed to the high volume of transactions at the agency level and high levels of commission typical of competitive OTC markets.
Median operating expenses are low (US$32, PPP adjusted) compared to African ANA countries. This could be due to high levels of non-dedication (76%) where fixed and recurrent expenses are shared between the agency business and the parallel business.
Median monthly revenues earned by Senegalese agents are higher than GNI per capita, indicating that mobile money is a sustainable business, even as a standalone business.
160
96
240
320
192
480
Total Exclusive Non-Exclusive
To
tal
Ea
rn
ing
s (
US
$)
Total Median Monthly Earnings and Gross National Income (GNI)
per Capita
Current prices PPP Adjusted
GNI per capita (PPP) US$ 192
24
Service downtime Competition from other agents Lack of resources to buy enough float
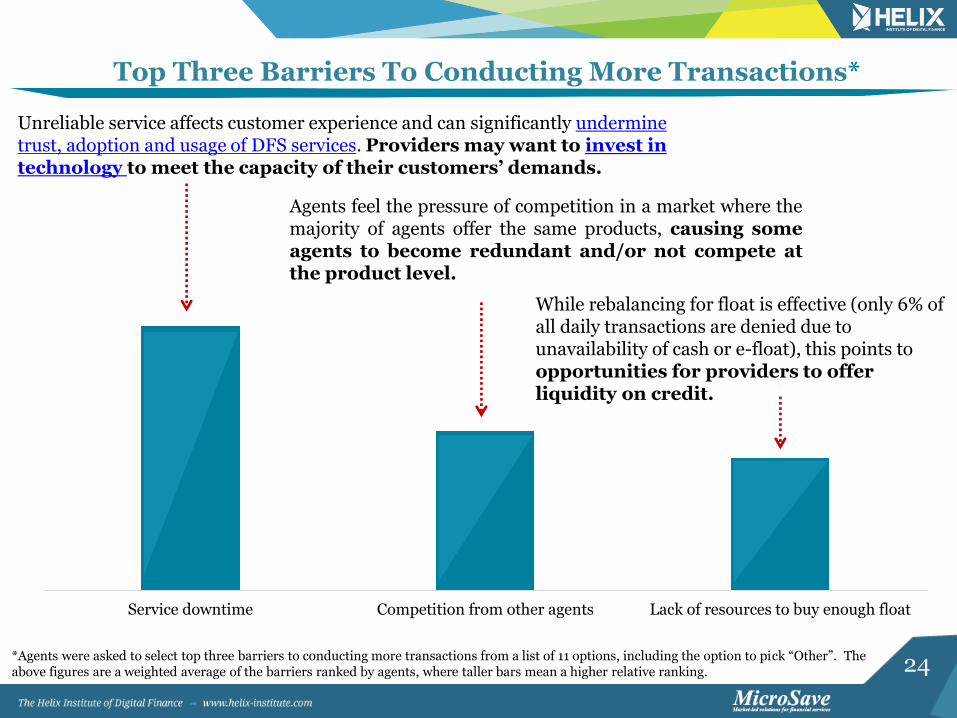
Top Three Barriers To Conducting More Transactions*
Agents feel the pressure of competition in a market where the majority of agents offer the same products, causing some agents to become redundant and/or not compete at the product level.
While rebalancing for float is effective (only 6% of all daily transactions are denied due to unavailability of cash or e-float), this points to opportunities for providers to offer liquidity on credit.
*Agents were asked to select top three barriers to conducting more transactions from a list of 11 options, including the option to pick “Other”. The above figures are a weighted average of the barriers ranked by agents, where taller bars mean a higher relative ranking.
Unreliable service affects customer experience and can significantly undermine trust, adoption and usage of DFS services. Providers may want to invest in technology to meet the capacity of their customers’ demands.
25
Quality of service
26
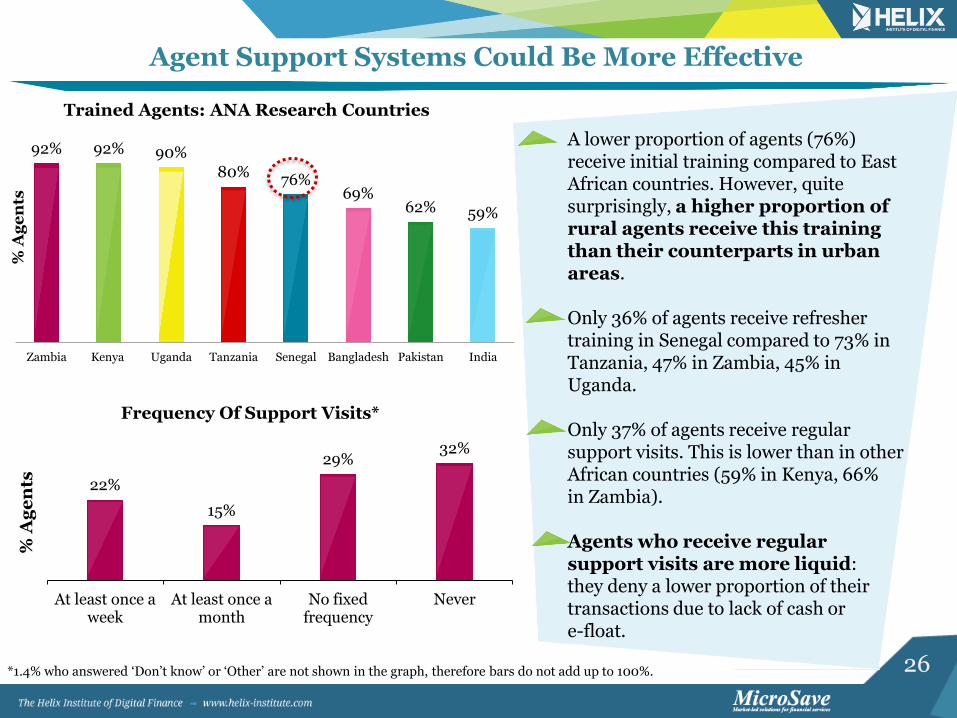
Agent Support Systems Could Be More Effective
22%
15%
29% 32%
At least once aweek
At least once amonth
No fixedfrequency
Never
% A
ge
nts
Frequency Of Support Visits*
92% 92% 90%
80% 76%
69% 62% 59%
Zambia Kenya Uganda Tanzania Senegal Bangladesh Pakistan India
% A
ge
nts
Trained Agents: ANA Research Countries
A lower proportion of agents (76%) receive initial training compared to East African countries. However, quite surprisingly, a higher proportion of rural agents receive this training than their counterparts in urban areas. Only 36% of agents receive refresher training in Senegal compared to 73% in Tanzania, 47% in Zambia, 45% in Uganda. Only 37% of agents receive regular support visits. This is lower than in other African countries (59% in Kenya, 66% in Zambia). Agents who receive regular support visits are more liquid: they deny a lower proportion of their transactions due to lack of cash or e-float.
*1.4% who answered ‘Don’t know’ or ‘Other’ are not shown in the graph, therefore bars do not add up to 100%.
27
72%
14% 6% 4% 3%
BankBranch
MicrofinanceInstitutions
(MFI)
An Aggregator’s
Office
AnotherAgent
Provider'sOffice
% A
ge
nts
Most Frequently Used Rebalancing Points*
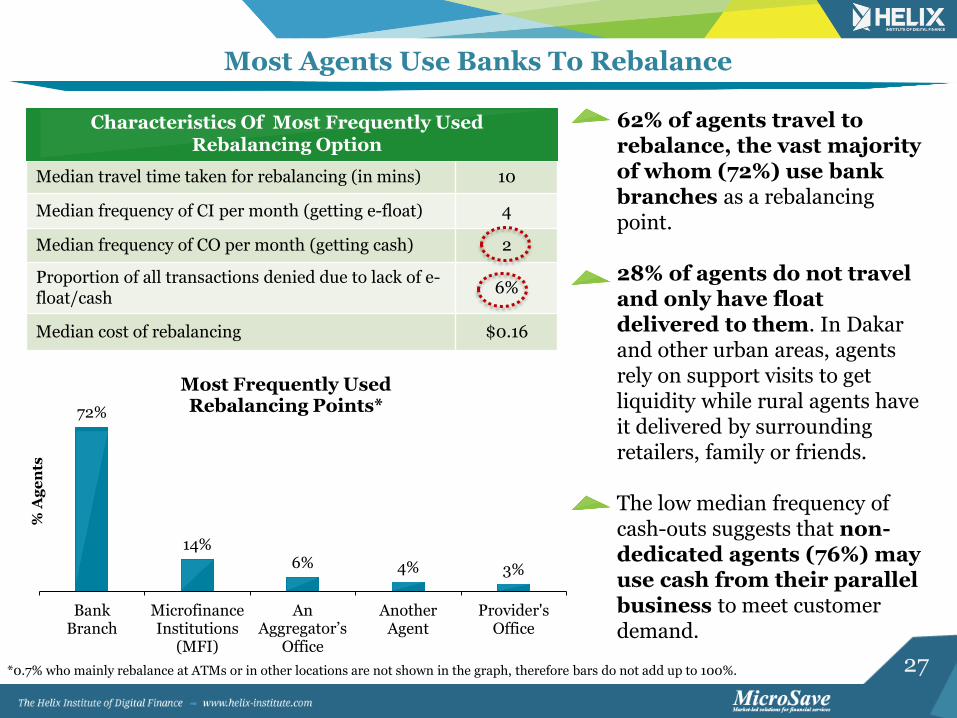
Most Agents Use Banks To Rebalance
Characteristics Of The Most Frequently Used Rebalancing Option
Median travel time taken for rebalancing (in mins) 10
Median frequency of CI per month (getting e-float) 4
Median frequency of CO per month (getting cash) 2
Proportion of all transactions denied due to lack of e-float/cash
6%
Median cost of rebalancing $0.16
Characteristics Of Most Frequently Used Rebalancing Option
62% of agents travel to rebalance, the vast majority of whom (72%) use bank branches as a rebalancing point. 28% of agents do not travel and only have float delivered to them. In Dakar and other urban areas, agents rely on support visits to get liquidity while rural agents have it delivered by surrounding retailers, family or friends. The low median frequency of cash-outs suggests that non-dedicated agents (76%) may use cash from their parallel business to meet customer demand.
*0.7% who mainly rebalance at ATMs or in other locations are not shown in the graph, therefore bars do not add up to 100%.
28
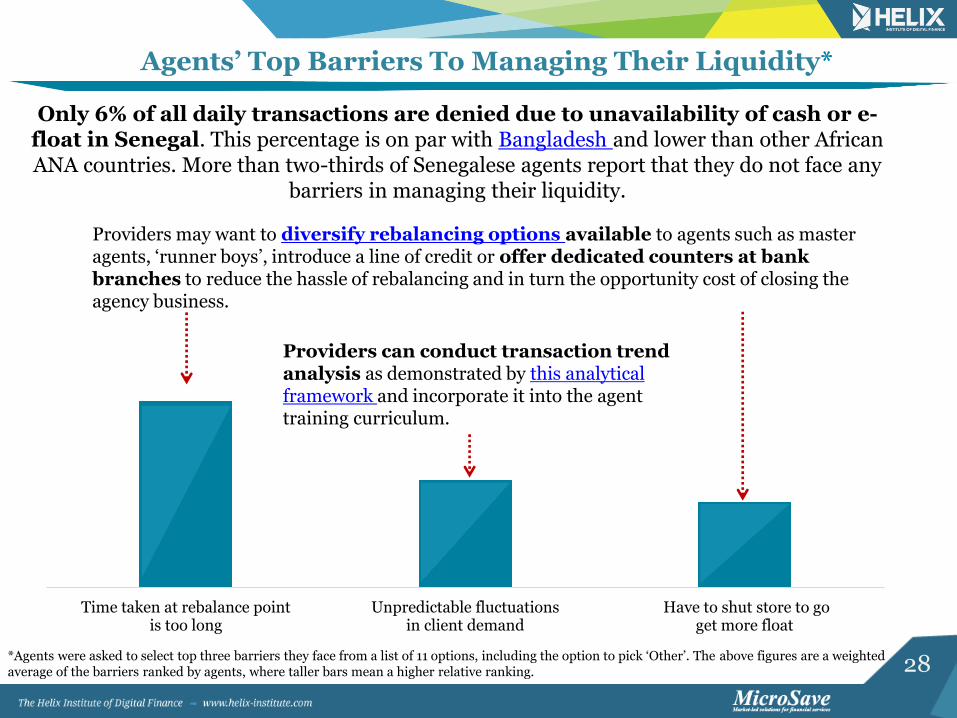
Agents’ Top Barriers To Managing Their Liquidity*
Time taken at rebalance pointis too long
Unpredictable fluctuationsin client demand
Have to shut store to goget more float
*Agents were asked to select top three barriers they face from a list of 11 options, including the option to pick ‘Other’. The above figures are a weighted average of the barriers ranked by agents, where taller bars mean a higher relative ranking.
Only 6% of all daily transactions are denied due to unavailability of cash or e-float in Senegal. This percentage is on par with Bangladesh and lower than other African ANA countries. More than two-thirds of Senegalese agents report that they do not face any
barriers in managing their liquidity.
Providers may want to diversify rebalancing options available to agents such as master agents, ‘runner boys’, introduce a line of credit or offer dedicated counters at bank branches to reduce the hassle of rebalancing and in turn the opportunity cost of closing the agency business.
Providers can conduct transaction trend analysis as demonstrated by this analytical framework and incorporate it into the agent training curriculum.

29
Control and Compliance
30
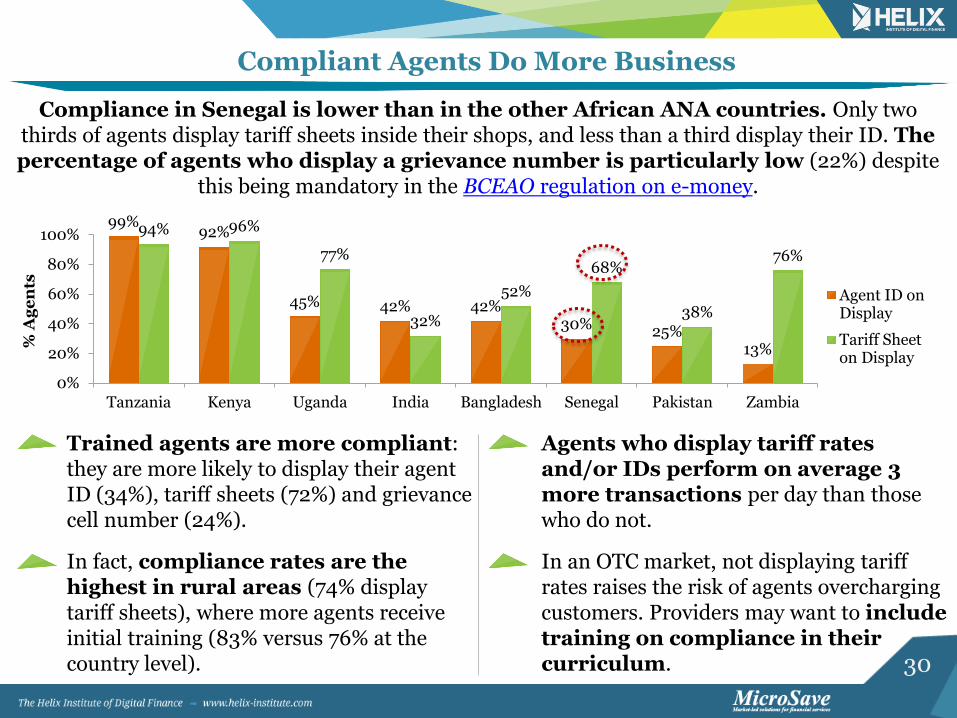
Compliant Agents Do More Business
99% 92%
45% 42% 42% 30% 25%
13%
94% 96%
77%
32%
52%
68%
38%
76%
0%
20%
40%
60%
80%
100%
Tanzania Kenya Uganda India Bangladesh Senegal Pakistan Zambia
% A
ge
nts
Agent ID onDisplay
Tariff Sheeton Display
Compliance in Senegal is lower than in the other African ANA countries. Only two thirds of agents display tariff sheets inside their shops, and less than a third display their ID. The percentage of agents who display a grievance number is particularly low (22%) despite
this being mandatory in the BCEAO regulation on e-money.
Agents who display tariff rates and/or IDs perform on average 3 more transactions per day than those who do not.
In an OTC market, not displaying tariff rates raises the risk of agents overcharging customers. Providers may want to include training on compliance in their curriculum.
Trained agents are more compliant: they are more likely to display their agent ID (34%), tariff sheets (72%) and grievance cell number (24%).
In fact, compliance rates are the highest in rural areas (74% display tariff sheets), where more agents receive initial training (83% versus 76% at the country level).

31
Outstanding Attributes Of Agent Network Management
Senegal is a competitive market with diverse digital finance players and business models. Most agents are non-dedicated and non-exclusive. Transaction volumes are high for the overall business and comparable to leading East African countries. In particular, Senegal boasts a pioneering cross-border remittance model. Rural agents perform better than their counterparts in urban areas: they conduct more transactions than at the country level.
High revenues and low operating expenses contribute to high profits. Senegalese agents are the most profitable among all ANA research countries. Liquidity management is effective as only 6% of all daily transactions are denied due to the unavailability of cash or e-float.
32
Opportunities For Improvement (1/2)
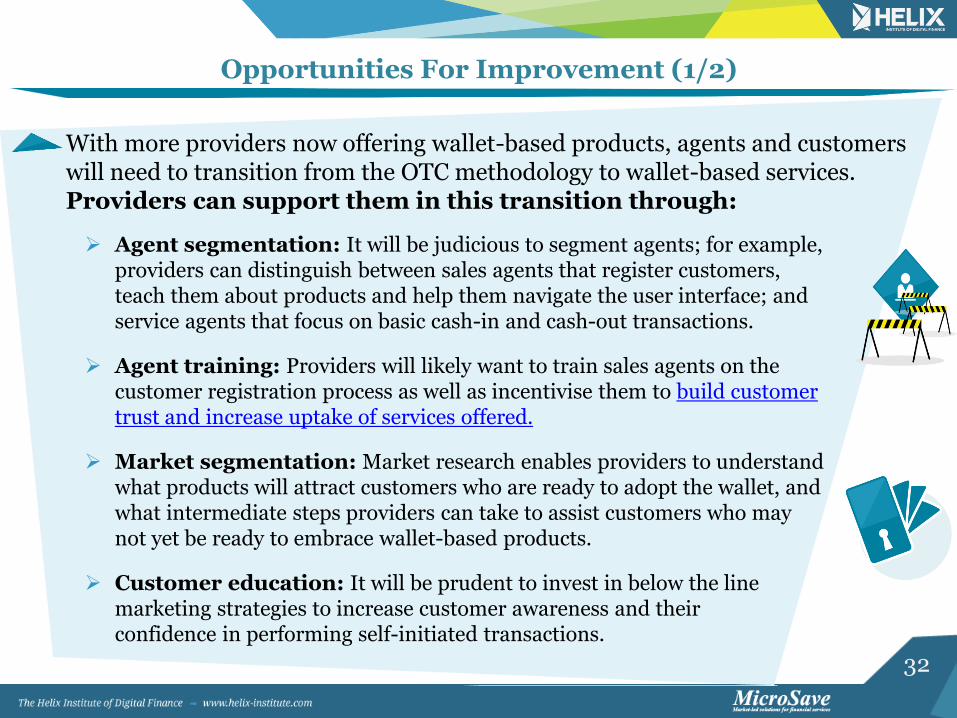
With more providers now offering wallet-based products, agents and customers will need to transition from the OTC methodology to wallet-based services. Providers can support them in this transition through:
Agent segmentation: It will be judicious to segment agents; for example, providers can distinguish between sales agents that register customers, teach them about products and help them navigate the user interface; and service agents that focus on basic cash-in and cash-out transactions.
Agent training: Providers will likely want to train sales agents on the customer registration process as well as incentivise them to build customer trust and increase uptake of services offered.
Market segmentation: Market research enables providers to understand what products will attract customers who are ready to adopt the wallet, and what intermediate steps providers can take to assist customers who may not yet be ready to embrace wallet-based products.
Customer education: It will be prudent to invest in below the line marketing strategies to increase customer awareness and their confidence in performing self-initiated transactions.
33
Opportunities For Improvement (2/2)
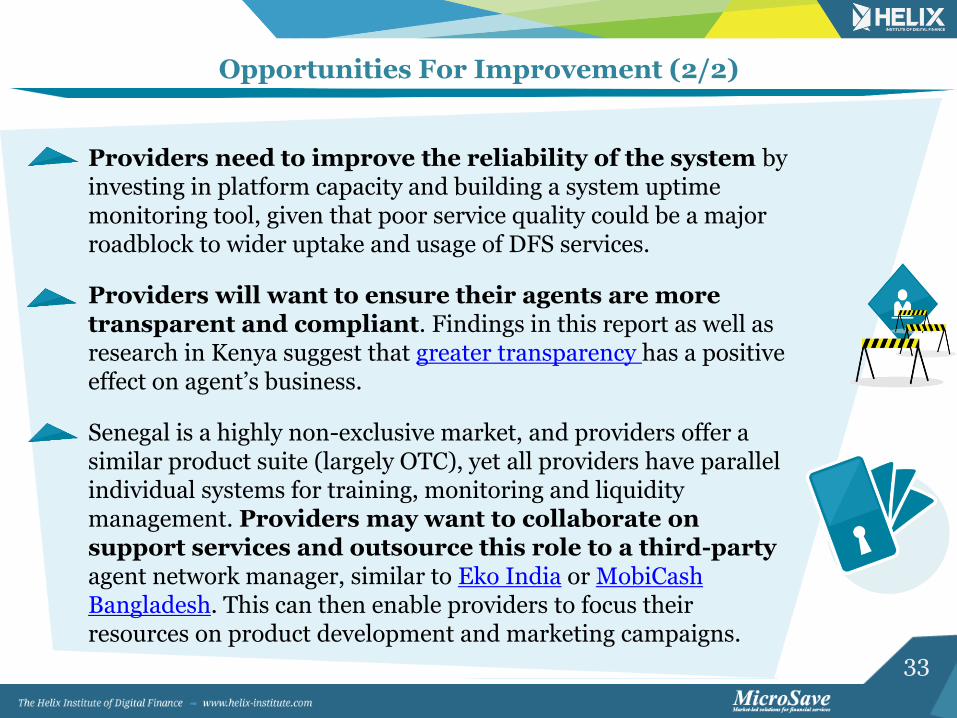
Providers need to improve the reliability of the system by investing in platform capacity and building a system uptime monitoring tool, given that poor service quality could be a major roadblock to wider uptake and usage of DFS services.
Providers will want to ensure their agents are more transparent and compliant. Findings in this report as well as research in Kenya suggest that greater transparency has a positive effect on agent’s business.
Senegal is a highly non-exclusive market, and providers offer a similar product suite (largely OTC), yet all providers have parallel individual systems for training, monitoring and liquidity management. Providers may want to collaborate on support services and outsource this role to a third-party agent network manager, similar to Eko India or MobiCash Bangladesh. This can then enable providers to focus their resources on product development and marketing campaigns.
34
Appendix

35
Appendix 1 - Methodology
The study is based on a nationally representative sample of 1,211 DFS agents. Since a country wide census of DFS agents was not available at the time of the agent network assessment, the sample frame is based on lists obtained from DFS providers with total agent counts, broken down geographically. The sample is designed to be representative at the country level, for urban and rural agents, and for the selected providers. The sampling strategy was clustered random sampling of administrative units that were stratified into metropolitan, other urban and rural prior to randomisation.
Metropolitan: Dakar region including all districts (Dakar, Guédiawaye, Pikine, Rufisque)
Other urban: regional capitals (chefs-lieux des régions) Rural: areas outside regional capitals, district capitals (chefs-lieux des
départements) and the surrounding areas. Data were collected using the random walk methodology with the skip pattern proportional to the desired sample count for a particular location. Data collection and entry was performed using an Android device. The use of an Android device allows for an additional level of randomisation and ensures the survey representativeness at the provider level. The provider an agent is interviewed for is randomly assigned by the application out of the list of all providers, for which the agent is active (i.e. has conducted at least one transaction within the last 30 days).
36
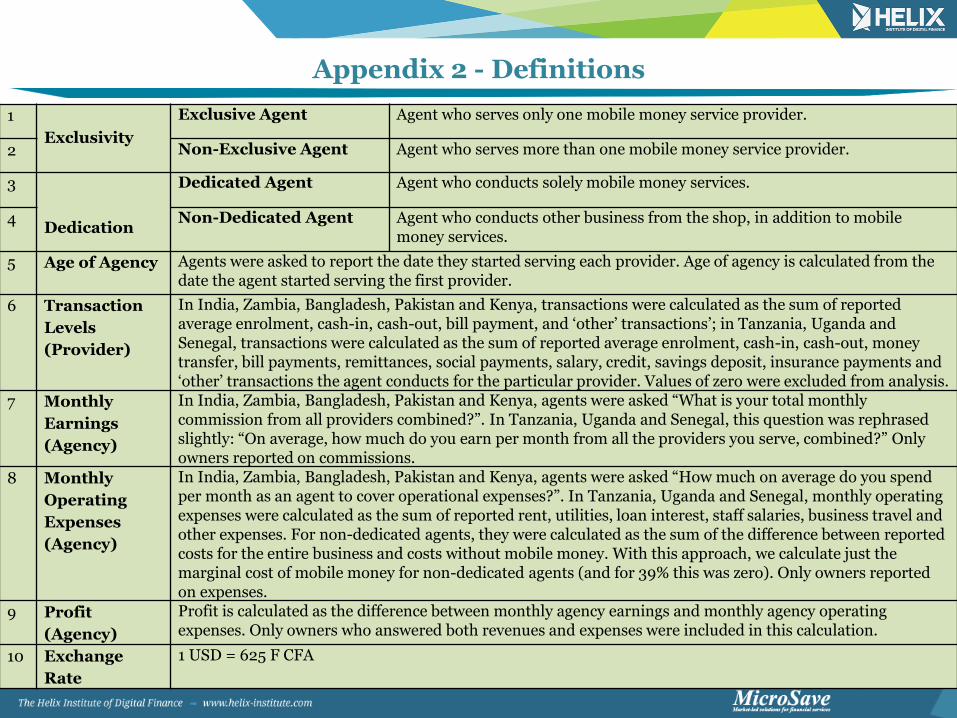
Appendix 2 - Definitions
1
Exclusivity
Exclusive Agent Agent who serves only one mobile money service provider.
2 Non-Exclusive Agent Agent who serves more than one mobile money service provider.
3
Dedication
Dedicated Agent Agent who conducts solely mobile money services.
4 Non-Dedicated Agent Agent who conducts other business from the shop, in addition to mobile money services.
5 Age of Agency Agents were asked to report the date they started serving each provider. Age of agency is calculated from the date the agent started serving the first provider.
6 Transaction
Levels
(Provider)
In India, Zambia, Bangladesh, Pakistan and Kenya, transactions were calculated as the sum of reported average enrolment, cash-in, cash-out, bill payment, and ‘other’ transactions’; in Tanzania, Uganda and Senegal, transactions were calculated as the sum of reported average enrolment, cash-in, cash-out, money transfer, bill payments, remittances, social payments, salary, credit, savings deposit, insurance payments and ‘other’ transactions the agent conducts for the particular provider. Values of zero were excluded from analysis.
7 Monthly
Earnings
(Agency)
In India, Zambia, Bangladesh, Pakistan and Kenya, agents were asked “What is your total monthly commission from all providers combined?”. In Tanzania, Uganda and Senegal, this question was rephrased slightly: “On average, how much do you earn per month from all the providers you serve, combined?” Only owners reported on commissions.
8 Monthly
Operating
Expenses
(Agency)
In India, Zambia, Bangladesh, Pakistan and Kenya, agents were asked “How much on average do you spend per month as an agent to cover operational expenses?”. In Tanzania, Uganda and Senegal, monthly operating expenses were calculated as the sum of reported rent, utilities, loan interest, staff salaries, business travel and other expenses. For non-dedicated agents, they were calculated as the sum of the difference between reported costs for the entire business and costs without mobile money. With this approach, we calculate just the marginal cost of mobile money for non-dedicated agents (and for 39% this was zero). Only owners reported on expenses.
9 Profit
(Agency)
Profit is calculated as the difference between monthly agency earnings and monthly agency operating expenses. Only owners who answered both revenues and expenses were included in this calculation.
10 Exchange
Rate
1 USD = 625 F CFA
37
Thank You
www.helix-institute.com
Helix Institute
Helix Institute of Digital Finance