Embed Size (px)
Citation preview

Agenda – Tuesday, January 14th
• Psychologist Speed Dating• Research terms– Research steps– Operational Definition
• Homework: Reading Guide #2 & Reading quiz WEDNESDAY

Speed Dating
• 1.) Introduce yourself• 2.) Share your accomplishments and other
information about yourself• 3.) Explain your prop• 4.) Listen for the question
• Be sure to take notes while listening to fellow psychologists!

Questions
• What influenced you to enter the field of Psychology?
• What are you most proud of from your career?
• If given the choice, what other psychologist(s) would you collaborate with?

Psychology = SCIENCE
• Relies on the Scientific Method– Coming up with a research question– Forming a hypothesis– Testing the hypothesis– Analyzing the results– Drawing a conclusion– Creating a theory

Psychology = SCIENCE
• Research relies on OPERATIONAL DEFINITIONS– A statement of procedures used to define research
variables• Examples– Right vs. left handed– When is homework “on time?”– Self-actualization

Agenda – Wednesday, January 15th
• Research reading quiz• Operational Definitions• Finish basic research notes– Pseudoscience– Hindsight bias– Confirmation bias

Operational Definitions
• Memory improves with regular exercise• People who use their phones in the car are
unsafe drivers• Participating in team sports builds character• Tall people are more likely to be extroverts

Pseudoscience
• Claims presented as science, but without research adequate research to support it.
• To be science, something must be falsifiable (able to be disproven)
Religious Explanations are not Falsifiable, and thus separate from Science.

Examples of Pseudoscience
• Holding Therapy for Attachment.• Vaccines cause Autism.• Telepathy exists.• Sexual-Orientation Conversion Therapy• Astrology (Events determined by placements of
planets & stars)• Freudian Thought (It used to be the best
explanation)
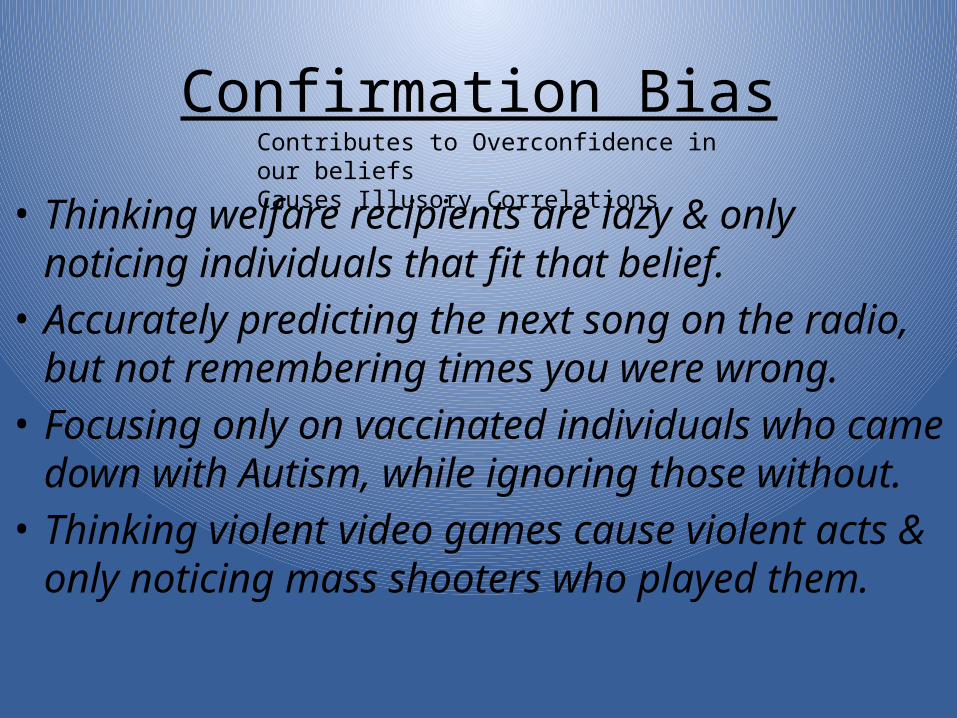
Confirmation Bias
• Thinking welfare recipients are lazy & only noticing individuals that fit that belief.
• Accurately predicting the next song on the radio, but not remembering times you were wrong.
• Focusing only on vaccinated individuals who came down with Autism, while ignoring those without.
• Thinking violent video games cause violent acts & only noticing mass shooters who played them.
Contributes to Overconfidence in our beliefsCauses Illusory Correlations

Michael Shermer (Skeptic Magazine)

Accepted Research must be…
Both Reliable & Valid• Study reporting a correlation between Mercury in Vaccines & Autism- Not replicable/Reliable• Piaget’s research criticized for confusing tasks/questions- Not valid
Reliablity: Hitting the same mark Consistently.
Reliability does not ensure Validity!!!!!!!!!!!!!
I understand the concept, but not this question?!?!?

White (84.3% = 386)
Asian (1.9% = 9)
Native American (10.6% = 49)
Hispanic (1.6% = 7)
Black (1.6% = 7)
458
804 STUDENTS

White (57.4% = 263)
Asian (20.6% = 94)
Native American (8.4% = 38)
Hispanic (5.8% = 27)
Black (7.8% = 36)
458
1,096 STUDENTS


Error vs. Bias
Error Bias Error & Bias

Scientists strive to minimize both error and bias in research.
Error, as a technical term, refers to random variability in results. Some degree of error is inevitable in psychological research, as a researcher can never precisely control all the extraneous variables that can influence a measure of behavior.
The occurrence of error does not imply that the researcher has made a mistake. Individual differences among the research subjects and imperfections in the measure of behavior, for example, contribute inevitably to error.
Because error is random, its consequences tend to disappear when averages are calculated, especially when the data set is large.
Researchers can measure error precisely, by calculating the standard deviation, and can take it into account in their inferential statistics. Therefore, error is not a devastating problem in research.
UNDERSTANDING ERROR & BIAS

Case Studies
Pros
Cons
Detailed analysis of a single or a few subjects (Ex. Freud’s Research)
Phineas Gage

Case Studies
Pros-Greater depth
-Study things that would otherwise be impossible
Cons-Individuals may be atypical
-Can’t Generalize!
Detailed analysis of a single or a few subjects (Ex. Freud’s Research)
Visual Agnosia
Phineas GageGenie

Surveysgather information on personal characteristics
Population(The ENTIRE group)
Representative Sample
(Larger=Better)
Stratified Sampling(Race, Class, Gender Proportions)
Random Selection(Everyone has = chance)
Pros
Cons

Surveysgather information on personal characteristics
Population(The ENTIRE group)
Representative Sample
(Larger=Better)
Stratified Sampling(Race, Class, Gender Proportions)
Random Selection(Everyone has = chance)
Pros-Can measure attitudes, motives, & opinions
-Can get lots of data
Cons-Wording Effect: Wording influences Answers.- Relies on honesty of participants. Ex. Social Desirability: Political Correctness.- Small response rate not representative.

Naturalistic ObservationObserve behavior in a natural setting• Can’t impact the behavior of participants!
(Otherwise a Field Experiment)Pros Cons
Paul EkmanDavid Rosenham
Parti
cipa
nt
Obs
erva
tion

Naturalistic ObservationObserve behavior in a natural setting• Can’t impact the behavior of participants!
(Otherwise a Field Experiment)Pros
-Results have real-world significance-Allows you to avoid ethical concerns.
Cons-Only descriptive in nature-No control-Hawthorne Effect: Altering your behavior as result of being watched
Paul EkmanDavid Rosenham
Parti
cipa
nt
Obs
erva
tion

Correlational Studies
Perfect Negative Correlation
Perfect Positive Correlation
•Trying to establish a relationship between 2 variables.•Helps Predict Behavior•Corelation≠Causation (Ex. Shoe Size & Intelligence)
Scatterplot 1Shows a Negative Correlation
As one variable ↓, the other ↑
Scatterplot 2 Shows a Positive Correlation
Both Variables Move Together
CC=-.63 CC=+.79
No Correlation
Correlational Coeffecient: Shows Strength of Correlation-1--------------------0--------------------1
Regression LineY’=a+bx
Closer points=stronger correlation

Experiments
Subjects should be randomly assigned
to either group
Control Group(No Ind. Var.)
Dependent Variable
Experimental Group
(Indp. Var.)
Dependent Variable
Single-Blind: Subjects uninformed of group.
Double-Blind: Researchers also uninformed.
Limits Experimenter Bias
Limits Participant Bias
Can be given a placebo.Controls for psychological effects.
The IV is what you expect to cause a change in the DV.
Only way to establish Causation!!!Subjects selected (Random or Stratified) from Population.Con: Hawthorne Effect