Embed Size (px)
Citation preview
Journal of Psychoeducational Assessment2016, Vol. 34(5) 421 –441
© The Author(s) 2015Reprints and permissions:
sagepub.com/journalsPermissions.nav DOI: 10.1177/0734282915619091
jpa.sagepub.com
Article
Age Differences and Educational Attainment Across the Life Span on Three Generations of Wechsler Adult Scales
A. S. Kaufman1, T. A. Salthouse2, C. Scheiber3, and H. Chen4
AbstractPatterns of maintenance of ability across the life span have been documented on tests of knowledge (Gc), as have patterns of steady decline on measures of reasoning (Gf/Gv), working memory (Gsm), and speed (Gs). Whether these patterns occur at the same rate for adults from different educational backgrounds has been debated. In addition, age-related research is needed to study global IQs, especially in view of the increased reliance on IQ in capital punishment court cases. In this study, large representative samples of adults tested during the standardizations of three versions of the Wechsler Adult Intelligence Scale (WAIS) served as subjects: WAIS-R (N = 1,480, ages 20-74), WAIS-III (N = 2,093, ages 20-90), and WAIS-IV (N = 1,800, ages 20-90). Based on regression analysis, patterns of aging on Full Scale IQ (FSIQ) and the four abilities (a) were essentially the same for males versus females and (b) characterized all levels of education across three generations of Wechsler’s adult scales.
Keywordsaging, FSIQ, education, WAIS-R, WAIS-III, WAIS-IV
The relationship of aging to intelligence has been studied extensively with a variety of cross-sectional and longitudinal samples (Lichtenberger & Kaufman, 2013; Salthouse, 2010). Emphasis is usually on the distinction between age differences in cognitive functioning on maintained abilities, such as crystallized knowledge (Gc), versus vulnerable abilities, such as fluid reasoning (Gf) and visual processing (Gv), using Horn’s (1989) terminology. However, the basic thrust of the aging-intelligence research does not rest on Horn’s theoretical approach or its current incarnation as the popular Cattell–Horn–Carroll (CHC) model of intelligence (Schneider & McGrew, 2012). Without relying on CHC theory or any other specific theoretical model of intelligence or cognitive neuroscience, Salthouse (2010) has summarized a wealth of cross-sectional aging data as follows:
1Yale University School of Medicine, New Haven, CT, USA2University of Virginia, Charlottesville, USA3Alliant International University, San Diego, CA, USA4National Taiwan Normal University, Taipei, Taiwan
Corresponding Author:C. Scheiber, Alliant International University San Diego, 10455 Pomerado Road, San Diego, CA 91803, USA. Email: [email protected]
619091 JPAXXX10.1177/0734282915619091Journal of Psychoeducational AssessmentKaufman et al.research-article2015
at CAL STATE UNIV SACRAMENTO on August 1, 2016jpa.sagepub.comDownloaded from

422 Journal of Psychoeducational Assessment 34(5)
On one hand, there is increase, at least until people are in their 60s, for measures representing products of processing carried out in the past, such as vocabulary or general information in which the relevant acquisition occurred earlier in one’s life. On the other hand, there is nearly linear decline from early adulthood on measures representing efficiency or effectiveness of processing carried out at the time of assessment, usually involving manipulations or transformations of abstract or familiar material. (p. 754)
This persistent finding—now known to be characteristic of longitudinal and quasi-longitudi-nal studies as well as cross-sectional investigations (Lichtenberger & Kaufman, 2013; Salthouse, 2014)—dubbed the classic aging pattern by Botwinick (1977) more than a generation ago. The pattern has been demonstrated time and again in a plethora of studies that have relied on diverse cognitive tests ranging from experimental tasks to subtests from popular standardized test batter-ies (e.g., Birren & Morrison, 1961; Craik & Salthouse, 2008; Kaufman, Reynolds, & McLean, 1989; Lichtenberger & Kaufman, 2013; Salthouse, 2010). Indeed, samples, too, have ranged from non-representative, sometimes small, groups of adults to large census-representative sam-ples stratified on major demographic variables (Lichtenberger & Kaufman, 2013; Salthouse, 1998, 2009, 2010). Regardless of the tests’ psychometric qualities (which are sometimes unknown), theoretical foundation, the representativeness of the samples, or the generation in which the cross-sectional cohorts were born and raised, the dichotomy between maintained and vulnerable abilities has persisted for more than a half-century on a diversity of cognitive vari-ables, and persists today (Kaufman, 2013; Salthouse, 2009, 2010; Salthouse, Pink, & Tucker-Drob, 2008; Salthouse & Saklofske, 2010; Singh-Manoux et al., 2012).
Wechsler’s Adult Scales
From the beginning, analyses of Wechsler’s adult scales have contributed greatly to researchers’ and clinicians’ understanding of the classic aging pattern. The popularity of the Wechsler scales can be partially explained by the varied theoretical foundations that have been applied to profile interpretation since their inception, with the earlier versions focusing on Horn’s fluid-crystallized working taxonomy and with the most recent versions of the Wechsler scales increasingly resem-bling current CHC theory.
The theoretical blueprint of the Wechsler scales is indeed advantageous, because the CHC foundation allows researchers and clinicians alike to draw meaningful conclusions from test results, thereby merging theory with practice (McGrew, 2009). This benefit arises because CHC theory offers a standardized way of describing cognitive ability—“a shared vocabulary” (McGrew, 1997)—which facilitates communication between clinicians and researchers and enables more targeted intervention planning (Flanagan, Ortiz, Alfonso, & Dynda, 2014).
Traditionally, Wechsler’s Verbal IQ (VIQ) and its crystallized or Gc subtests (CHC terminol-ogy) have emerged as maintained abilities across much of the life span whereas Performance IQ (PIQ) and its measures of spatial reasoning, fluid reasoning, and processing speed (Gv, Gf, and Gs in CHC terminology) have proved to be vulnerable to the effects of aging (and brain damage). Cross-sectional investigations of the Wechsler Adult Intelligence Scale (WAIS; Wechsler, 1955) and its revisions—the WAIS-R, WAIS-III, and WAIS-IV (Wechsler, 1981, 1997a, 2008a)—have been conducted for the past half-century, often controlling for educational attainment. The results of these cross-sectional investigations have consistently supported the dichotomous aging pattern for the WAIS (Birren & Morrison, 1961; Horn, 1985), WAIS-R (Kaufman et al., 1989), WAIS-III (Kaufman, 2001; Lee, Gorsuch, Saklofske, & Patterson, 2008), and WAIS-IV (Salthouse, 2009; Salthouse & Saklofske, 2010).
The factor-analytic tradition of Wechsler’s scales (Cohen, 1952a, 1952b, 1957a, 1957b; Kaufman, 1975) moved aging-IQ research past VIQ and PIQ to the three factors measured by early versions of Wechsler’s scales: Verbal Comprehension, Perceptual Organization, and
at CAL STATE UNIV SACRAMENTO on August 1, 2016jpa.sagepub.comDownloaded from
Kaufman et al. 423
Memory/Freedom from Distractibility (composed of the Arithmetic-Digit Span-Digit Symbol triad). The four-factor structure that was introduced with the publication of the third editions of Wechsler’s scales (e.g., WAIS-III) further extended Wechsler aging research and theoretical per-spective to address age-related changes on the four indexes: one that measured a maintained ability (Verbal Comprehension Index [VCI]) and three that measured vulnerable abilities, namely, Perceptual Reasoning Index (PRI), Working Memory Index (WMI), and Processing Speed Index (PSI). And whereas the third editions of Wechsler’s scales offered the four indexes as supple-ments to VIQ and PIQ, the fourth editions eliminated VIQ/PIQ altogether, shifting the theoretical foundation and framework to increasingly resemble current CHC theory.
Virginia Cognitive Aging Project (VCAP)
Going hand-in-hand with the Wechsler aging research has been the vast number of studies con-ducted by Salthouse and his colleagues with the VCAP battery of 16 individually administered cognitive tests, developed to measure five key cognitive domains (e.g., Salthouse, 2007, 2009; Salthouse et al., 2008). The VCAP battery, administered to thousands of adults during the past 15 years as part of their longitudinal investigations, does not necessarily follow a specific theoretical orientation, but measures the maintained ability of Vocabulary Knowledge and the vulnerable abilities of Reasoning, Spatial Visualization, Memory, and Speed. The VCAP battery includes two Wechsler subtests (Vocabulary, Digit Symbol) but, otherwise, measures the five abilities with different combinations of cognitive variables. Nonetheless, joint research with the WAIS-IV and VCAP battery yield highly similar results (Salthouse, 2009), which “is noteworthy because the Wechsler data were based on a sample selected to match demographic proportions in the United States, whereas the participants in VCAP were largely a sample of convenience” (p. 657).
Concerning the VCAP,
The reference battery of 16 cognitive tests . . . was originally selected to represent five different cognitive abilities, but the reasoning and spatial visualization abilities are highly correlated . . . and thus they were combined to form a fluid intelligence (Gf) ability construct” (Salthouse et al., 2008, pp. 472-473). That reconfiguration of the VCAP suggests that it measures the same four constructs as the WAIS-IV. And, indeed, Salthouse (2014) concludes, “correlations between the theoretically similar ability factors in the two batteries were very high (i.e., r > .84) [;] with only a few exceptions, the primary influences on the subtest scores in one battery were from the theoretically relevant ability factor in the other battery. (p. 131)
In essence, then, the aging research conducted with Wechsler’s adult scales and with the VCAP battery has cross-validated, time and again, changes with age on four basic intellectual abilities. Investigations of the well-standardized and theory-based Woodcock–Johnson and Kaufman batteries, for example, have also added to the wealth of knowledge of age-related growth and decline on an array of specific abilities (Kaufman & Horn, 1996; Kaufman, Johnson, & Liu, 2008; McArdle, Ferrer-Caja, Hamagami, & Woodcock, 2002; Salthouse, 1998, 2005; Wang & Kaufman, 1993). And that knowledge base extends to life span research conducted throughout the world (e.g., Baltes & Lindenberger, 1997; Mulder, Dekker, & Dekker, 2004; Rabbitt, 1993; Ronnlund, Nyberg, Backman, & Nilsson, 2005; Singh-Manoux et al., 2012).
Wechsler’s Full Scale IQ (FSIQ)
The research emphasis on four abilities (Kaufman, 2001; Salthouse et al., 2008; Salthouse & Saklofske, 2010), five abilities (Salthouse, 2007), or even seven abilities (Salthouse, 1998) has taken precedence over the evaluation of age differences on global indexes of intelligence such as
at CAL STATE UNIV SACRAMENTO on August 1, 2016jpa.sagepub.comDownloaded from

424 Journal of Psychoeducational Assessment 34(5)
Wechsler’s FSIQ. The logic from theory is clear: Why investigate a global score when it is a non-theoretical amalgam of multiple abilities, some of which differ strikingly in their patterns of growth and decline across the life span?
In fact, age-related changes in FSIQ over the life span have often been ignored in the aging-IQ literature on Wechsler’s scales (Birren & Morrison, 1961; Kaufman, 2001; Salthouse & Saklofske, 2010), even though the hierarchical g factor has commonly been examined (e.g., Bickley, Keith, & Wolfle, 1995; Salthouse, 2004, 2014) and found to decline rapidly with increasing age. That finding is predictable in view of the inclusion of an array of reasoning, spatial visualization, memory, and speed subtests in the comprehensive VCAP battery. Also, Salthouse (2004) pointed out the following:
It should be noted that acceptance of a hierarchical structure with a single factor at the top does not imply that individuals or groups can be characterized by one number that represents the magnitude of the highest-order factor. Instead, the results . . . indicate that different types of individual differences are associated with influences at various levels in the hierarchy. (p. 557)
Nonetheless, Wechsler’s FSIQ is a key feature of the present analyses. Although the g construct has been challenged by some eminent theorists (e.g., Horn, 1989), it has remained crucial to others (Carroll, 1997; Jensen, 1998). CHC theory typically ignores g because of the divergence between Horn and Carroll’s perspectives (Schneider & McGrew, 2012); how-ever, some psychometric researchers have advocated the supremacy of g and FSIQ when interpreting Wechsler’s scales (e.g., Canivez & Watkins, 2010a, 2010b), and these global constructs remain in the forefront of decision making for gifted assessment (Silverman, 2013).
Apart from theoretical or clinical controversies about g, there are also practical and societal reasons that urge better understanding of changes in FSIQ across the life span. The Atkins v. Virginia (2002) ruling has elevated the role of FSIQ for determining whether a person con-victed of a capital crime should be executed or given life imprisonment (individuals who are mentally retarded cannot legally be executed in the United States). Court decisions often rest on whether the FSIQ is legitimately above or below the 70 cutoff; legal controversies center around confidence intervals, practice effects, and the Flynn effect (Flynn, 2009; Kaufman, 2009; Kaufman & Weiss, 2010; Lichtenberger & Kaufman, 2013).
Also, court decisions depend on an expert witness’ integration of WAIS-R, WAIS-III, and WAIS-IV FSIQs obtained by the same person over the course of 15 or 20 years. Yet, Wechsler’s Full Scale has changed over time, changes that may affect interpretation of FSIQ. Historically, the WAIS FSIQ was based on 11 subtests, six Verbal and five Performance subtests, and these same 11 subtests comprised the WAIS-R Full Scale. Ten of the 11 were retained for the WAIS-III (with Matrix Reasoning replacing Object Assembly). However, more radical changes occurred with the publication of the WAIS-IV (Wechsler, 2008a). Verbal and Performance Scales were eliminated, replaced by four Indexes: VCI, PRI, WMI, and PSI. The WAIS-IV Full Scale was reduced from 11 subtests to 10—three subtests apiece from VCI and PRI and two apiece from WMI and PSI. Lichtenberger and Kaufman (2013) pointed out, “Of the 11 WAIS-III Full Scale subtests, only 8 are retained on the WAIS-IV Full Scale. Although this shift is not as dramatic as the change from WISC-III to WISC-IV Full Scale (which share only 5 of 10 subtests), it is none-theless notable” (p. 23).
Consequently, mean age differences across the adult life span on FSIQ need to be better understood, especially across generations because of modifications to the Full Scale. And the new four-index structure requires that mean differences in IQ across the life span, in each genera-tion, be understood for separate measures of the cognitive abilities assessed by VCI (Gc), PRI (Gf/Gv), WMI (Gsm), and PSI (Gs).
at CAL STATE UNIV SACRAMENTO on August 1, 2016jpa.sagepub.comDownloaded from
Kaufman et al. 425
Educational Attainment and Cognitive Decline
In addition, better understanding is needed regarding the relation of socioeconomic status (SES), especially educational attainment, to cognitive decline. The literature is mixed for SES level and cognitive decline. Some studies show similar patterns of aging across occupational categories. For example, the memory and intelligence of 69 eminent academics (aged 70 and older) were compared with 30 elderly blue-collar workers as part of a 5-year longitudinal study (Christensen, Henderson, Griffiths, & Levings, 1997). The researchers concluded that both groups showed similar rates of decline and that cognitive deterioration on nonverbal intelligence tests is univer-sal. Similarly, in a study of University of California at Berkeley professors, the elderly professors (M age = 64.7) scored more poorly on most cognitive tasks than did middle-aged and young professors (Shimamura, Berry, Mangels, Rusting, & Jurica, 1995).
Most studies of SES and cognitive decline use educational attainment, rather than occupation, as the measure of SES. In a Swedish cross-sectional and longitudinal investigation of WAIS-R Block Design, some variations were observed in the aging patterns for adults who differed in educational attainment. Ronnlund and Nilsson (2006) noted, “the finding of a relation between educational attainment and changes in [Block Design], in line with a hypothesis that higher levels of education may protect against time-related decline, even though the effect was small” (p. 76). That result was also reported by Evans et al. (1993) who observed that adults with little formal education had a greater decline in cognitive function than more educated peers, independent of occupation or income; other investigators, likewise, have maintained that educational attainment is “protective” against cognitive decline in old age (Albert et al., 1995; Arbuckle, Maag, Pushkar, & Chaikelson, 1998; Bosma, van Boxtel, Ponds, Houx, & Jolles, 2003; Butler, Ashford, & Snowdon, 1996; Evans et al., 1993; Farmer, Kittner, Rae, Bartko, & Regier, 1995; Lyketsos, Chen, & Anthony, 1999).
A different set of studies suggests that the relationship between education and cognitive decline is complex and may not be generalizable across tasks and different populations. Anstey and Christensen (2000), in a review of relevant research, suggested that education protected decline on mental status tests (“easy” Gc items), but not on tests of fluid reasoning. That distinc-tion was generally supported by data from a longitudinal investigation of a representative sample of Americans over age 70 (Alley, Suthers, & Crimmins, 2007), but the distinction between which abilities were protected by educational attainment, and which were not, was complicated. Much formal schooling did seem to slow cognitive decline on simple mental status tests, but the more educated elderly adults had even greater decline than the less educated in the more complex measures of verbal and working memory. The authors cautioned that their findings, though derived from samples representative on demographic variables such as ethnicity and SES, were based only on elderly individuals rather than a broader age range of adults. Like the Alley et al. (2007) study, an investigation of Mexican adults ages 16 to 85 also found a complex and interac-tive relationship between educational attainment and cognitive decline, especially for illiterate adults (Ardila, Ostrosky-Solis, Rosselli, & Gomez, 2000). Concerning illiteracy, an adult’s level of literacy was found to be a better predictor than educational attainment of cognitive decline for ethnically diverse, normal, English-speaking residents of Manhattan (Manly, Schupf, Tang, & Stern, 2005). In addition, a few studies have found quicker cognitive decline for better-educated patients with confirmed Alzheimer’s disease (Andel, Vigen, Mack, Clark, & Gatz, 2006; Stern, Albert, Tang, & Tsai, 1999). However, the seemingly quicker cognitive decline may be an artifact of better-educated adults’ ability to develop coping strategies to mask their symptoms of demen-tia, thereby delaying its diagnosis.
In contrast to the investigators who found slower cognitive decline in the highly educated, and those who found the relationship between education and decline to vary with the type of task, another set of investigators concluded that (a) yes, more educated adults score higher on all types
at CAL STATE UNIV SACRAMENTO on August 1, 2016jpa.sagepub.comDownloaded from
426 Journal of Psychoeducational Assessment 34(5)
of cognitive tasks, at all ages, than less educated adults, but (b) despite this difference in ability level (or perhaps because of it), the rate of cognitive decline is essentially the same for all adults, regardless of educational attainment, on all types of tasks (Christensen et al., 2001; Glymour, Weuve, Berkman, Kawachi, & Robins, 2005; Karlamangla et al., 2009; Tucker-Drob, Johnson, & Jones, 2009; Van Dijk, Van Gerven, Van Boxtel, Van der Elst, & Jolles, 2008; Wilson et al., 2009; Zahodne et al., 2011).
The latter set of studies used sophisticated methodology in reaching the general conclusion that cognitive decline occurs at about the same rate on a wide array of intellectual tasks for all educational groups. For example, Zahodne et al. (2011) analyzed age changes on verbal process-ing speed, working memory, verbal fluency, and verbal episodic memory in more than 1,000 adults participating in the Victoria Longitudinal Study. They used linear growth models, adjusted for confounds, and cross-validated the well-known education difference in ability, especially on Gc (verbal fluency), with the more educated outstripping those with fewer years of schooling. However, those categorized as “high educational attainment” (14-20 years of schooling) did not differ from the low attainment group (6-13 years) in their rate of change over time for any of the four cognitive domains.
Even though the more recent group of methodologically sophisticated studies suggests that cognitive decline occurs at the same rate across educational levels, and does not interact signifi-cantly with type of cognitive ability, the issue is far from resolved. As Zahodne et al. (2011) maintained, the literature is “highly conflicting” and “the effects of education on the rate of cog-nitive aging have not yet been fully established” (p. 1040).
Goals of the Study
The present study focused on global IQ in addition to specific abilities and examined the relation-ship of cognitive decline to educational attainment and gender. Age and education were variables of primary interest, but gender was studied as a second demographic that might potentially inter-act with these key variables. Data from the standardization samples of the WAIS-R, WAIS-III, and WAIS-IV were used for the analyses. These samples are representative of the United States on demographic variables, and the Wechsler scales are composed of reliable and valid verbal, nonverbal, memory, and speed subtests. The analyses and instruments, therefore, are especially useful for addressing questions about global intelligence and about interactions between cogni-tive decline and the demographic variables of gender and education. Furthermore, the use of data from three versions of Wechsler’s scales permits analysis of changes from one generation to another in the nature of the relationships under investigation.
To expand the analyses beyond FSIQ, and to understand age-related changes on the four cog-nitive abilities studied most frequently in cross-sectional and longitudinal studies of aging across the life span, the following four tasks (included in all three Wechsler scales) were analyzed: (a) Vocabulary (knowledge), Block Design (BD; reasoning), Digit Span Backward (DSB; working memory), and Coding/Digit Symbol (CD; speed). These four subtests were selected because (a) they correspond to the four indexes measured by the WAIS-IV, one known to be maintained (VCI) and three known to be vulnerable (PRI, PSI, and WMI), and (b) the four tasks remained basically the same throughout all three versions of the Wechsler scales used in this analysis, per-mitting direct comparisons across generations. DSB served as the working memory variable (rather than forward span + backward span) because Digit Span Forward measures the CHC nar-row ability of memory span rather than working memory. It is working memory, not memory span, which has proved to be especially vulnerable in aging research. From a theoretical perspec-tive, these four subtests measure the CHC abilities of Gc, Gf/Gv, Gsm, and Gs, respectively.
Because FSIQ controls for age, the present analyses used Wechsler’s “reference group” norms (ages 20-34) to compute FSIQs for all adults in each sample, regardless of their age; that
at CAL STATE UNIV SACRAMENTO on August 1, 2016jpa.sagepub.comDownloaded from
Kaufman et al. 427
procedure permits measurement on a common yardstick and allows age-to-age comparisons. Present analyses were conducted only for the adult portion of the standardization samples (ages 20 and above): WAIS-R (20-74), WAIS-III (20-90), and WAIS-IV (20-90).
The study addressed the following research questions:
Do changes in mean scores from young adulthood through old age on Wechsler’s FSIQ vary as a function of gender and educational attainment?Do changes in mean scores from young adulthood through old age on four abilities—one maintained (knowledge) and three vulnerable (reasoning, working memory, speed)—differ as a function of gender and educational attainment?Do the answers to questions 1 and 2 vary over a 40-year period (from the late 1970s to the mid-1990s to 2007)?
Method
Participants
Data from three Wechsler standardization samples were analyzed: (a) WAIS-R (N = 1,480, ages 20-74; 50% female), (b) WAIS-III (N = 2,096, ages 20-90; 50% female), and (c) WAIS-IV (N = 1,800, ages 20-90; 50% female). In addition to gender, each sample was stratified by ethnic-ity, geographic region, and educational attainment. See test manuals for details (Wechsler, 1981, 1997a, 2008a). For some analyses, the WAIS-III and WAIS-IV samples were limited to ages 20 to 74 to provide direct comparisons to the WAIS-R sample (n = 1,600 for WAIS-III and n = 1,500 for WAIS-IV). The sample for the WAIS-III is slightly larger than the standardization sample reported in the manual. The technical manual (Wechsler, 1997b) indicates that 2,050 adults ages 20 to 89 were included in the final standardization sample (n = 1,600, ages 20-74). However, the WAIS-III dataset provided by Pearson included 2,096 adults ages 20 to 90 (n = 1,629, ages 20-74). These somewhat larger stratified samples were used for the present study. Because age was missing for three elderly adults (75+), the final WAIS-III sample analyzed at ages 20 to 90 was 2,093.
Distributions of the three standardization samples on the variable of educational attainment are presented in Table 1, by age. These samples were all stratified on education based on U.S. Census data and reflect the changes over time in U.S. society. For example, the percentage of adults with less than 12 years of formal education was about 33 for WAIS-R, 25 for the WAIS-III, and 17 for the WAIS-IV. Correspondingly, the percentage of adults with at least 1 year of college has risen from about 30 to 40 to 50.
Instruments
The WAIS-R, WAIS-III, and WAIS-IV assess general intelligence and each yields a FSIQ. WAIS-R and WAIS-III Full Scales are each composed of six Verbal and five Performance subtests (10 of which are the same; WAIS-III Matrix Reasoning replaced WAIS-R Object Assembly). The WAIS-IV Full Scale is composed of three Verbal Comprehension, three Perceptual Reasoning, two Working Memory, and two Processing Speed subtests (seven of which are included among the 11 Full Scale subtests for the WAIS-III). Average internal con-sistency reliability coefficients for the FSIQ at ages 20+ are .97 for WAIS-R, .98 for WAIS-III, and .98 for WAIS-IV; standard errors of measurement are 2.4, 2.2, and 2.1 points, respectively.
Reliability coefficients are as follows for specific tasks: Vocabulary (.95 for WAIS-R, .93 for WAIS-III, .94 for WAIS-IV), BD (.87, .89, .87), CD (.84, .82, .86). Reliability for DSB (.82) is
at CAL STATE UNIV SACRAMENTO on August 1, 2016jpa.sagepub.comDownloaded from

428 Journal of Psychoeducational Assessment 34(5)
reported only for the WAIS-IV. That value reflects the best estimate for the WAIS-R and WAIS-III as well because the specific items have not been changed. Internal consistency coefficients are reported for Vocabulary, BD, and DSB; test–retest coefficients are reported for the speeded CD subtest.
For further information on the instruments, consult the WAIS-R manual (Wechsler, 1981), the technical manuals for the WAIS-III (Wechsler, 1997b) and WAIS-IV (Wechsler, 2008b), and books written on the tests (Kaufman, 1990; Kaufman & Lichtenberger, 1999, 2006; Lichtenberger & Kaufman, 2013).
Data Analysis
All FSIQs for each version of Wechsler’s adult scales were computed using Wechsler’s “refer-ence group” norms (ages 20-34) for everyone, regardless of their age. That procedure provided a common yardstick for comparing intelligence across the life span. Raw scores (rather than age-dependent scaled scores) were used for the four separate tasks; whereas reference group scaled
Table 1. Educational Distribution of Adults in the Standardization Samples of the WAIS-R, WAIS-III, and WAIS-IV, Ages 20 and Older.
0-8 9-11 12 13-15 16+
n n n n n
WAIS-R 20-24 7 27 87 59 20 25-39 28 59 176 78 99 40-59 75 74 183 57 58 60-75 156 64 103 33 37 All Ages (n = 1,480) 266 224 549 227 214 Percentage (18.0) (15.1) (37.1) (15.3) (14.5)WAIS-III 20-24 8 24 70 88 29 25-39 22 46 190 146 124 40-59 35 37 136 92 97 60-75 84 77 201 88 80 76-90 114 70 134 50 51 All Ages (n = 2,032) 263 254 731 464 381 Percentage (12.6) (12.1) (34.9) (22.2) (18.2)WAIS-IV 20-24 5 21 61 89 24 25-39 21 41 146 140 160 40-59 19 30 125 102 123 60-75 31 41 139 94 88 76-90 52 40 105 54 49 All Ages (n = 1,800) 128 173 576 479 444 Percentage (7.1) (9.6) (32.0) (26.6) (24.7)
Source. Table created using standardization data from the Wechsler Adult Intelligence Scale, Revised Edition (WAIS-R). Copyright 1981, 1955 NCS Pearson, Inc. Reproduced with permission. All rights reserved.Table created using standardization data from the Wechsler Adult Intelligence Scale, Third Edition (WAIS-III). Copyright 1997, NCS Pearson, Inc. Reproduced with permission. All rights reserved.Table created using standardization data from the Wechsler Adult Intelligence Scale, Fourth Edition (WAIS-IV). Copyright 2008, NCS Pearson, Inc. Reproduced with permission. All rights reserved.
at CAL STATE UNIV SACRAMENTO on August 1, 2016jpa.sagepub.comDownloaded from
Kaufman et al. 429
scores are provided for three of the tasks, these scaled scores did not exist for DSB. Individuals ages 16 to 19 were eliminated from each sample because their SES was determined by parents’ education rather than self-education.
To address the research questions, regression analyses were conducted in a structural equation model in which all of the predictors and their interactions were entered as simultaneous predic-tors of g or of FSIQ. Predictors were age, gender, and educational attainment, as well as the two other stratification variables of ethnicity and geographic region. Criteria were FSIQ (based on reference group norms) and raw scores on Vocabulary, BD, CD, and DSB. Educational attain-ment was organized into five categories: 0 to 8 years of schooling, 9 to 11 years, 12 years, 13 to 15 years, and 16+ years. All analyses were conducted twice for the WAIS-III and WAIS-IV—first with the complete age range (20-89 for WAIS-III, 20-90 for WAIS-IV) then with the portion of the age range that corresponds to the WAIS-R age range of 20 to 74 (see Salthouse & Ferrer-Caja, 2003, for a thorough discussion of methodological issues regarding the analysis of cognitive aging data).
Because of the large number of comparisons, an alpha level of .01 was set to determine sig-nificance in all analyses. With large sample sizes, statistical significance does not always denote meaningful differences. Therefore, only medium effect sizes in the regression analyses (stan-dardized coefficients ≥ .25) were considered important.
Results
Tables 2 and 3 present summary statistics for the regression analyses in which age, gender, and education and all interactions involving these variables were entered as predictors of FSIQ. Table 2 presents these analyses for the WAIS-III and WAIS-IV, both of which include elderly adults through age 90. Table 3 presents the analyses for all three Wechsler scales, using a common age range (20-74).
Table 2 reveals significant standardized beta coefficients between FSIQ and all three demo-graphic variables, age, gender, and education for the full age range of these two instruments (20-90). Differences favoring males, though significant, were trivial in magnitude. Differences in mean scores from early adulthood to old age on FSIQ were moderate in magnitude (about −.30), though the relationship to education was more substantial (.4-.5). The Age × Gender and Age × Education interactions were non-significant and trivial in magnitude. These results support a significant and meaningful relationship between FSIQ and both age and education. Despite the lower mean scores earned by older than younger age cohorts, and the familiar finding that more educated adults earn higher IQs than less educated adults, the key results are the trivial standard-ized beta coefficients for the Age × Gender and Age × Education interactions. They indicate that the rate of change in mean scores for age cohorts does not differ for males versus females or for adults with different levels of education.
Table 3 presents regression analysis data for all three adult Wechsler scales for the common age range of 20 to 74 years. With the elderly age group (75+) eliminated from the analyses, the decrease in mean FSIQs from younger to older age cohorts that was so evident in Table 2 virtu-ally disappeared. Although the standardized beta coefficients are significant for two of the three FSIQs, the values are all small (<.20) and of no practical importance. Similarly, the slight but significant male advantage on all three scales is of no consequence. By contrast, the standardized coefficients for education are significant and moderate-to-large in magnitude (.5 to .6).
The interactions shown in Table 3 are all non-significant and trivial. For adults ages 20 to 74, the pattern of mean differences in FSIQ with age is comparable for males and females and for adults from different educational backgrounds. The small standardized beta coefficients for Gender × Education verify that the relationship of FSIQ to educational attainment is the same for both sexes. The fact that mean FSIQs for different cohorts did not decrease notably with age
at CAL STATE UNIV SACRAMENTO on August 1, 2016jpa.sagepub.comDownloaded from

430 Journal of Psychoeducational Assessment 34(5)
for ages 20 to 74 (Table 3)—but decreased to a moderate extent with the age range extended to 90 years—indicates that the greatest decline occurred for the elderly.
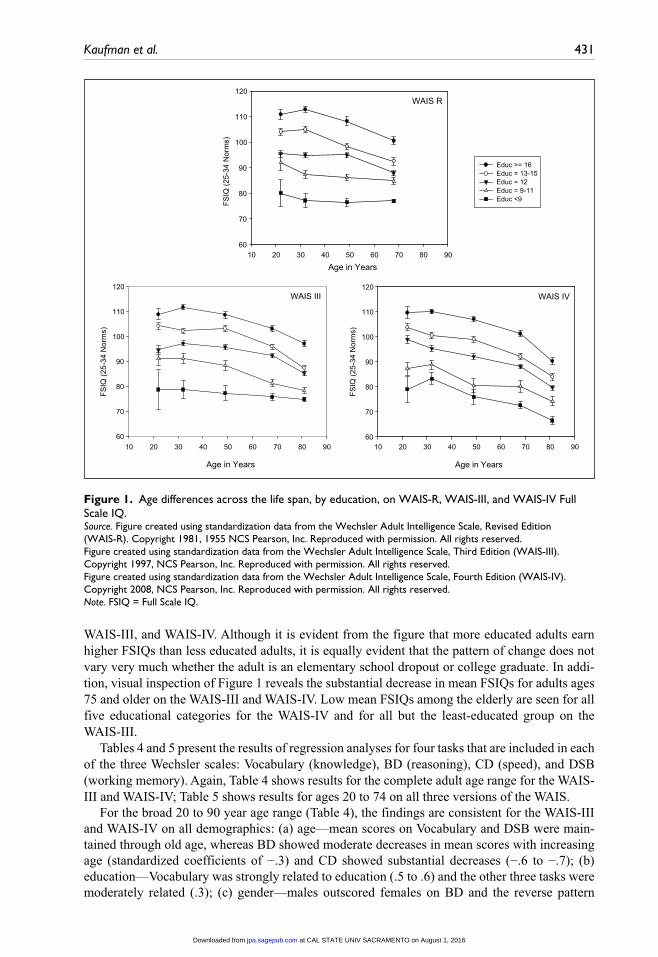
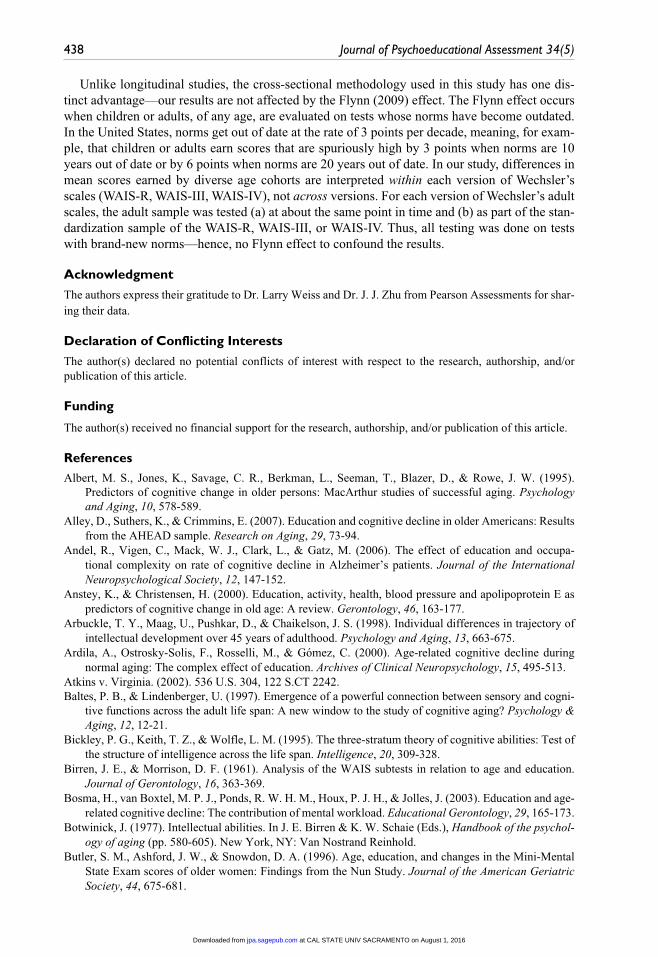
Figure 1 presents mean FSIQ (based on norms for ages 20-34), by age group, separately for each of the five educational categories, on the three adult Wechsler scales. The figure demon-strates that mean FSIQs for age cohorts are similar for each educational group on the WAIS-R,
Table 2. Standardized Beta Coefficients Predicting WAIS-III and WAIS-IV FSIQ (Age 20-34 Norms) With Age, Gender, and Education as Predictors.
WAIS-III WAIS-IV
FSIQ (20-90) (20-90)Age −.309* −.302*Education .552* .438*Gender .104* .069*Age × Education −.061 .044Age × Gender .042 −.060Education × Gender −.021 .070Age × Education × Gender .029 −.068Adjusted R2 .443 .445N 2,093 1,800M 93.9 93.8SD 15.8 16.4
Source. Table created using standardization data from the Wechsler Adult Intelligence Scale, Third Edition (WAIS-III). Copyright 1997, NCS Pearson, Inc. Reproduced with permission. All rights reserved.Table created using standardization data from the Wechsler Adult Intelligence Scale, Fourth Edition (WAIS-IV). Copyright 2008, NCS Pearson, Inc. Reproduced with permission. All rights reserved.Note. FSIQ = Full Scale IQ.*p < .01.
Table 3. Standardized Beta Coefficients Predicting WAIS-R, WAIS-III, and WAIS-IV FSIQ (Age 20-34 Norms) With Age, Gender, and Education as Predictors—Common Age Range (20-74 Years).
WAIS-R WAIS-III WAIS-IV
FSIQ (20-74) (20-74) (20-74)Age −.169* −.177* −.139Education .596* .611* .463*Gender .058* .102* .069*Age × Education −.094 .028 .044Age × Gender −.002 .019 −.101Education × Gender .073 −.071 .063Age × Education × Gender −.026 −.030 −.049Adjusted R2 .467 .366 .350N 1,480 1,629 1,500M 93.1 97.0 96.7SD 15.4 15.4 15.4
Source. Table created using standardization data from the Wechsler Adult Intelligence Scale, Revised Edition (WAIS-R). Copyright 1981, 1955 NCS Pearson, Inc. Reproduced with permission. All rights reserved.Table created using standardization data from the Wechsler Adult Intelligence Scale, Third Edition (WAIS-III). Copyright 1997, NCS Pearson, Inc. Reproduced with permission. All rights reserved.Table created using standardization data from the Wechsler Adult Intelligence Scale, Fourth Edition (WAIS-IV). Copyright 2008 NCS Pearson, Inc. Reproduced with permission. All rights reserved.Note. Coding: Gender—Female = 1, Male = 2. FSIQ = Full Scale IQ.*p < .01.
at CAL STATE UNIV SACRAMENTO on August 1, 2016jpa.sagepub.comDownloaded from
Kaufman et al. 431
WAIS-III, and WAIS-IV. Although it is evident from the figure that more educated adults earn higher FSIQs than less educated adults, it is equally evident that the pattern of change does not vary very much whether the adult is an elementary school dropout or college graduate. In addi-tion, visual inspection of Figure 1 reveals the substantial decrease in mean FSIQs for adults ages 75 and older on the WAIS-III and WAIS-IV. Low mean FSIQs among the elderly are seen for all five educational categories for the WAIS-IV and for all but the least-educated group on the WAIS-III.
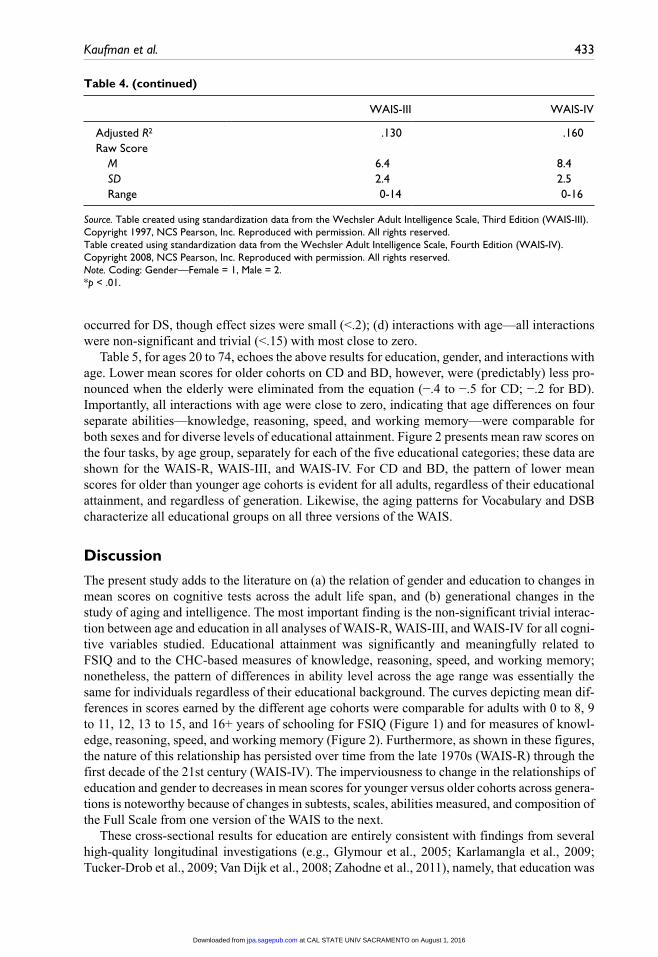
Tables 4 and 5 present the results of regression analyses for four tasks that are included in each of the three Wechsler scales: Vocabulary (knowledge), BD (reasoning), CD (speed), and DSB (working memory). Again, Table 4 shows results for the complete adult age range for the WAIS-III and WAIS-IV; Table 5 shows results for ages 20 to 74 on all three versions of the WAIS.
For the broad 20 to 90 year age range (Table 4), the findings are consistent for the WAIS-III and WAIS-IV on all demographics: (a) age—mean scores on Vocabulary and DSB were main-tained through old age, whereas BD showed moderate decreases in mean scores with increasing age (standardized coefficients of −.3) and CD showed substantial decreases (−.6 to −.7); (b) education—Vocabulary was strongly related to education (.5 to .6) and the other three tasks were moderately related (.3); (c) gender—males outscored females on BD and the reverse pattern
WAIS R
Age in Years10 20 30 40 50 60 70 80 90
FSIQ
(25-
34 N
orm
s)
60
70
80
90
100
110
120
WAIS III
Age in Years
10 20 30 40 50 60 70 80 90
FSIQ
(25-
34 N
orm
s)
60
70
80
90
100
110
120
Educ >= 16Educ = 13-15Educ = 12Educ = 9-11Educ <9
WAIS IV
Age in Years
10 20 30 40 50 60 70 80 90
FSIQ
(25-
34 N
orm
s)
60
70
80
90
100
110
120
Figure 1. Age differences across the life span, by education, on WAIS-R, WAIS-III, and WAIS-IV Full Scale IQ.Source. Figure created using standardization data from the Wechsler Adult Intelligence Scale, Revised Edition (WAIS-R). Copyright 1981, 1955 NCS Pearson, Inc. Reproduced with permission. All rights reserved.Figure created using standardization data from the Wechsler Adult Intelligence Scale, Third Edition (WAIS-III). Copyright 1997, NCS Pearson, Inc. Reproduced with permission. All rights reserved.Figure created using standardization data from the Wechsler Adult Intelligence Scale, Fourth Edition (WAIS-IV). Copyright 2008, NCS Pearson, Inc. Reproduced with permission. All rights reserved.Note. FSIQ = Full Scale IQ.
at CAL STATE UNIV SACRAMENTO on August 1, 2016jpa.sagepub.comDownloaded from
432 Journal of Psychoeducational Assessment 34(5)
Table 4. Standardized Beta Coefficients Predicting WAIS-III and WAIS-IV Vocabulary, Block Design, Coding/Digit Symbol, and Digit Span Backward, With Age, Gender, and Education.
WAIS-III WAIS-IV
Vocabulary (20-90) (20-90) Age .116 .185* Education .644* .540* Gender .042 .018 Age × Education .001 .100 Age × Gender .016 −.095 Education × Gender −.075 .027 Age × Education × Gender .019 −.077 Adjusted R2 .308 .319 Raw score M 39.7 35.6 SD 12.7 11.1 Range 2-65 4-57Block Design Age −.296* −.348* Education .286* .295* Gender .121* .133* Age × Education −.044 −.034 Age × Gender −.124 −.076 Education × Gender .024 −.014 Age × Education × Gender .008 −.017 Adjusted R2 .357 .314 Raw Score M 34.1 37.4 SD 13.0 13.6 Range 2-67 4-66Coding/Digit Symbol Age −.698* −.590* Education .313* .268* Gender −.157* −.154* Age × Education .028 .110 Age × Gender .112 .053 Education × Gender −.009 .040 Age × Education × Gender −.021 −.120 Adjusted R2 .550 .451 Raw Score M 62.5 61.1 SD 21.5 20.2 Range 0-130 3-121Digit span backward Age −.073 −.142 Education .374* .268* Gender .011 .012 Age × Education −.066 −.111 Age × Gender −.100 −.063 Education × Gender −.094 .066 Age × Education × Gender .029 .082
(continued)
at CAL STATE UNIV SACRAMENTO on August 1, 2016jpa.sagepub.comDownloaded from
Kaufman et al. 433
WAIS-III WAIS-IV
Adjusted R2 .130 .160 Raw Score M 6.4 8.4 SD 2.4 2.5 Range 0-14 0-16
Source. Table created using standardization data from the Wechsler Adult Intelligence Scale, Third Edition (WAIS-III). Copyright 1997, NCS Pearson, Inc. Reproduced with permission. All rights reserved.Table created using standardization data from the Wechsler Adult Intelligence Scale, Fourth Edition (WAIS-IV). Copyright 2008, NCS Pearson, Inc. Reproduced with permission. All rights reserved.Note. Coding: Gender—Female = 1, Male = 2.*p < .01.
Table 4. (continued)
occurred for DS, though effect sizes were small (<.2); (d) interactions with age—all interactions were non-significant and trivial (<.15) with most close to zero.
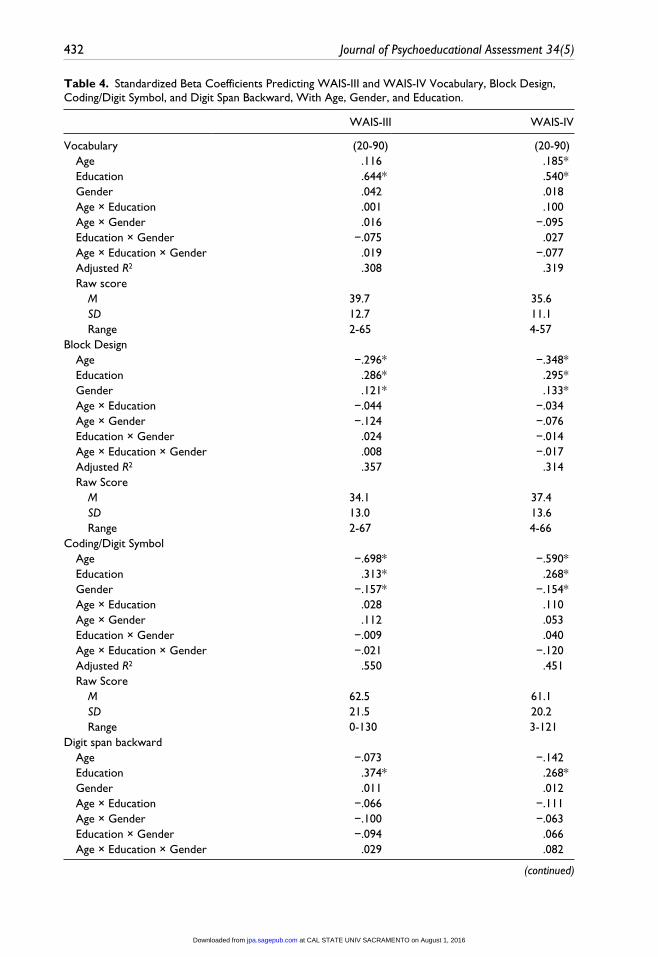
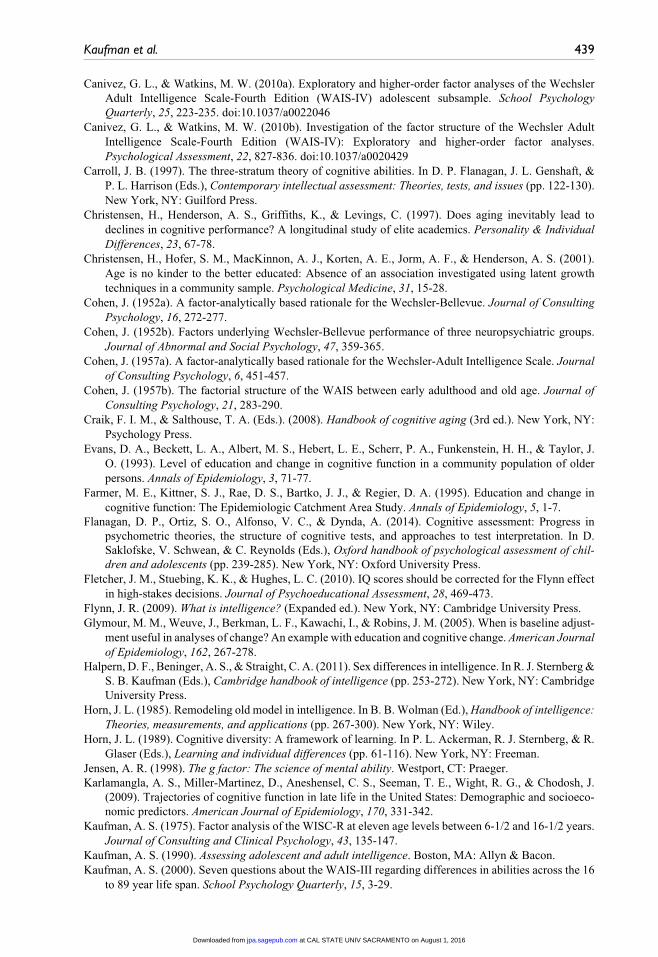
Table 5, for ages 20 to 74, echoes the above results for education, gender, and interactions with age. Lower mean scores for older cohorts on CD and BD, however, were (predictably) less pro-nounced when the elderly were eliminated from the equation (−.4 to −.5 for CD; −.2 for BD). Importantly, all interactions with age were close to zero, indicating that age differences on four separate abilities—knowledge, reasoning, speed, and working memory—were comparable for both sexes and for diverse levels of educational attainment. Figure 2 presents mean raw scores on the four tasks, by age group, separately for each of the five educational categories; these data are shown for the WAIS-R, WAIS-III, and WAIS-IV. For CD and BD, the pattern of lower mean scores for older than younger age cohorts is evident for all adults, regardless of their educational attainment, and regardless of generation. Likewise, the aging patterns for Vocabulary and DSB characterize all educational groups on all three versions of the WAIS.
Discussion
The present study adds to the literature on (a) the relation of gender and education to changes in mean scores on cognitive tests across the adult life span, and (b) generational changes in the study of aging and intelligence. The most important finding is the non-significant trivial interac-tion between age and education in all analyses of WAIS-R, WAIS-III, and WAIS-IV for all cogni-tive variables studied. Educational attainment was significantly and meaningfully related to FSIQ and to the CHC-based measures of knowledge, reasoning, speed, and working memory; nonetheless, the pattern of differences in ability level across the age range was essentially the same for individuals regardless of their educational background. The curves depicting mean dif-ferences in scores earned by the different age cohorts were comparable for adults with 0 to 8, 9 to 11, 12, 13 to 15, and 16+ years of schooling for FSIQ (Figure 1) and for measures of knowl-edge, reasoning, speed, and working memory (Figure 2). Furthermore, as shown in these figures, the nature of this relationship has persisted over time from the late 1970s (WAIS-R) through the first decade of the 21st century (WAIS-IV). The imperviousness to change in the relationships of education and gender to decreases in mean scores for younger versus older cohorts across genera-tions is noteworthy because of changes in subtests, scales, abilities measured, and composition of the Full Scale from one version of the WAIS to the next.
These cross-sectional results for education are entirely consistent with findings from several high-quality longitudinal investigations (e.g., Glymour et al., 2005; Karlamangla et al., 2009; Tucker-Drob et al., 2009; Van Dijk et al., 2008; Zahodne et al., 2011), namely, that education was
at CAL STATE UNIV SACRAMENTO on August 1, 2016jpa.sagepub.comDownloaded from

434 Journal of Psychoeducational Assessment 34(5)
Table 5. Standardized Beta Coefficients Predicting WAIS-R, WAIS-III, and WAIS-IV Vocabulary, Block Design, Digit Span Backward, and Coding/Digit Symbol, With Age, Gender, and Education as Predictors—Common Age Range (20-74 Years).
WAIS-R WAIS-III WAIS-IV
(20-74) (20-74) (20-74)
Vocabulary Age .086 .218* .269* Education .665* .684* .535* Gender .004 .020 .013 Age × Education −.038 .073 .073 Age × Gender .051 −.063 −.138 Education × Gender .022 −.128 .023 Age × Education × Gender −.004 −.040 −.054 Adjusted R2 .395 .297 .318 Raw score M 45.2 40.4 36.1 SD 14.6 12.6 11.0 Range 4-70 4-65 4-57Block design Age −.170 −.257* −.247* Education .405* .298* .287* Gender .107* .138* .137* Age × Education −.030 −.007 −.036 Age × Gender −.120 −.063 −.079 Education × Gender .041 .022 −.006 Age × Education × Gender −.033 .002 .036 Adjusted R2 .338 .265 .213 Raw score M 26.2 36.8 39.6 SD 11.6 12.8 13.2 Range 0-51 2-67 4-66Coding/digit symbol Age −.415* −.558* −.426* Education .491* .396* .291* Gender −.135* −.175* −.169* Age × Education −.033 .091 .071 Age × Gender .007 .096 .025 Education × Gender −.028 −.056 .036 Age × Education × Gender −.044 −.069 −.084 Adjusted R2 .472 .420 .310 Raw score M 49.2 68.4 65.4 SD 17.2 19.4 18.3 Range 0-93 0-130 3-121Digit span backward Age .031* −.087 −.112 Education .515* .414* .273* Gender −.043 .019 .015 Age × Education −.009 .033 −.058
(continued)
at CAL STATE UNIV SACRAMENTO on August 1, 2016jpa.sagepub.comDownloaded from

Kaufman et al. 435
WAIS-R WAIS-III WAIS-IV
(20-74) (20-74) (20-74)
Age × Gender −.044 −.049 −.043 Education × Gender −.053 −.141 .050 Age × Education × Gender −.081 −.039 .046 Adjusted R2 .179 .111 .129 Raw score M 6.8 6.6 8.6 SD 2.5 2.5 2.5 Range 0-14 0-14 0-16
Source. Table created using standardization data from the Wechsler Adult Intelligence Scale, Revised Edition (WAIS-R). Copyright 1981, 1955, NCS Pearson, Inc. Reproduced with permission. All rights reserved.Table created using standardization data from the Wechsler Adult Intelligence Scale, Third Edition (WAIS-III). Copyright 1997, NCS Pearson, Inc. Reproduced with permission. All rights reserved.Table created using standardization data from the Wechsler Adult Intelligence Scale, Fourth Edition (WAIS-IV). Copyright 2008, NCS Pearson, Inc. Reproduced with permission. All rights reserved.Note. Coding: Gender—Female = 1, Male = 2.*p < .01.
Table 5. (continued)
Block Design
Chronological Age
20 30 40 50 60 70 80 90
Sam
ple-
spec
ific
z-sc
ore
-1.0
-0.5
0.0
0.5
1.0
WAIS-R (1981)WAIS III (1997)WAIS IV (2008)
Digit Symbol
Chronological Age
20 30 40 50 60 70 80 90
Sam
ple-
spec
ific
z-sc
ore
-1.0
-0.5
0.0
0.5
1.0
WAIS-R (1981)WAIS III (1997)WAIS IV (2008)
Digit Span Backwards
Chronological Age
20 30 40 50 60 70 80 90
Sam
ple-
spec
ific
z-sc
ore
-1.0
-0.5
0.0
0.5
1.0
WAIS-R (1981)WAIS III (1997)WAIS IV (2008)
Vocabulary
Chronological Age
20 30 40 50 60 70 80 90
Sam
ple-
spec
ific
z-sc
ore
-1.0
-0.5
0.0
0.5
1.0
WAIS-R (1981)WAIS III (1997)WAIS IV (2008)
Figure 2. Age differences across the life span, by education, on WAIS-R, WAIS-III, and WAIS-IV Vocabulary, Block Design, Coding/Digit Symbol, and Digit Span Backward.Source. Figures created using standardization data from the Wechsler Adult Intelligence Scale, Revised Edition (WAIS-R). Copyright 1981, 1955, NCS Pearson, Inc. Reproduced with permission. All rights reserved.Figures created using standardization data from the Wechsler Adult Intelligence Scale, Third Edition (WAIS-III). Copyright 1997, NCS Pearson, Inc. Reproduced with permission. All rights reserved.Figures created using standardization data from the Wechsler Adult Intelligence Scale, Fourth Edition (WAIS-IV). Copyright 2008, NCS Pearson, Inc. Reproduced with permission. All rights reserved.Note. FSIQ = Full Scale IQ.
at CAL STATE UNIV SACRAMENTO on August 1, 2016jpa.sagepub.comDownloaded from

436 Journal of Psychoeducational Assessment 34(5)
not related to rates of change over time for an array of cognitive domains. In particular, the pres-ent findings support the results of the Victoria Longitudinal Study which found no relation between education and rate of change over time in each of four specific cognitive domains— verbal processing speed, working memory, verbal fluency, or verbal episodic memory—even though education was strongly related to all domains (Zahodne et al., 2011). Like these longitu-dinal studies, our cross-sectional study reinforces the notion that lower scores by older than younger age cohorts on cognitive tests is not “protected” by many years of formal schooling, contrary to the claims of some researchers (e.g., Albert et al., 1995; Evans et al., 1993; Lyketsos et al., 1999; Ronnlund & Nilsson, 2006). Nor do the present results support the claim from lon-gitudinal studies that the relation between education and cognitive decline is a function of the type of cognitive ability measured; just as Zahodne et al. (2011) observed, the relation was con-stant for all abilities studied.
Present results are consistent with the “passive cognitive reserve hypothesis,” which posits that more educated adults will continue to outperform less educated adults on cognitive tasks throughout the aging process, but that the decline will be about the same regardless of education (Stern, 2002). The findings do not support the opposing “active cognitive reserve hypothesis” proposed by those who believe that greater education is protective of the intellect, leading to slower decline.
Even though the correlation between education and the mean scores earned by different age cohorts was investigated, the directionality of the relationship cannot be determined because the variables are so interdependent. Formal learning undoubtedly leads to higher IQs, especially given the role of acquired verbal knowledge in producing high Wechsler IQs. However, it is equally true that individuals who have lower IQs at the outset will surely tend to drop out of school sooner than those with higher IQs because the schoolwork will prove to be too challenging as elementary school progresses to high school and college. There simply is no rationale for assigning cause or effect either to educational attainment or cognitive decline.
In our investigation, it is notable that the lack of interaction between age and education was found for four abilities and for global intelligence; it was found for three different instruments standardized at three different points in time; and it was found for samples stratified by the demographic variables of gender, ethnicity, geographic region, and educational attainment. Alley et al. (2007) also used a stratified sample of adults, but their sample was restricted to ages 70 and older.
This cross-sectional investigation of cognitive change on FSIQ from young adulthood to old age is the most extensive in the literature. Some previous investigations of Wechsler’s scales emphasized subtests (Birren & Morrison, 1961; Kaufman, 2000) or the four indexes (Kaufman, 2001), and ignored FSIQ altogether. The relative stability of FSIQ through age 74 on the three versions of WAIS (Figure 1) and the finding that the aging pattern of FSIQ is comparable across gender and education suggest that FSIQ is an “equal opportunity” metric when used in capital punishment cases. FSIQ on Wechsler’s scales does not unduly penalize young or middle-age men who dropped out of school, the prototypical criminals on death row. It is common for these men to have been tested a half-dozen or so times on various Wechsler scales in the course of their lives, including the WAIS-R, WAIS-III, and WAIS-IV, and for these IQs to be amalgamated and adjusted to estimate the criminal’s g to make life-and-death decisions (Fletcher, Stuebing, & Hughes, 2010; Kaufman & Weiss, 2010; Reynolds, Niland, Wright, & Rosenn, 2010). The aging data from this study will enrich the psychometric pool of information that is needed to help make these high-stakes decisions. Unequivocally, Wechsler’s FSIQ has remained a resilient yardstick over time, even though the content of the Full Scale was changed substantially for the WAIS-IV, relative to all previous versions of the Full Scale, including the Wechsler-Bellevue Form I (Wechsler, 1939). For example, the WAIS-IV Full Scale includes two measures of processing speed (20% of scale) rather than one measure (9%).
at CAL STATE UNIV SACRAMENTO on August 1, 2016jpa.sagepub.comDownloaded from

Kaufman et al. 437
The significant male advantage on BD and significant female edge on CD (both small in effect size) are consistent with a large body of research that shows better performance by males on tests of visual-spatial ability and better performance by females on tests of perceptual speed from childhood through adulthood (Halpern, Beninger, & Straight, 2011; Lichtenberger & Kaufman, 2013). So too is the finding of non-significant Age × Gender interactions in all analyses, a topic often addressed in aging research on cognitive abilities. In their meta-analysis of 25 studies, Meinz and Salthouse (1998) identified
few measures on which the age × gender interactions were significant [and that] . . . the only significant interactions on the cognitive measures in this study (on measures of speed and reasoning) were in the direction of lesser age-related declines for males than for females. (p. 56)
The similarity in aging patterns for males and females has been demonstrated in studies of Wechsler’s adult scales (Kaufman, Kaufman-Packer, McLean, & Reynolds, 1991; Ronnlund & Nilsson, 2006) and other clinical tests as well (Kaufman & Horn, 1996). Thus, despite known gender differences in cognitive ability, the patterns of maintained and vulnerable abilities across the life span are essentially the same for each sex. Singh-Manoux et al. (2012) observed gender differences in cognitive decline for some tests (e.g., vocabulary and phonemic fluency) and reported most findings separately for men and women; that approach, however, is not typical.
The cross-sectional results reported in this study accord well with findings from quasi-longitu-dinal investigations of independent samples tested on the WAIS, WAIS-R, WAIS-III, and WAIS-IV (Kaufman, 1990, 2001, 2013). In these studies, the same cohorts can be followed over time. For example, adults born between 1909 and 1913 would have been about 40 when tested in 1953 on the original WAIS, about 70 when tested in 1978 on the WAIS-R, and about 90 when tested in 1995 on the WAIS-III. Kaufman adjusted the IQs for instrument effects and cultural change, permitting the comparison of individuals from the same birth cohort across a 25-year span (1953 to 1978) or even a 42-year span (1953 to 1995).
Of particular relevance to the present cross-sectional study was Kaufman’s (2013) quasi-longitudi-nal study of the WAIS-III and WAIS-IV because that study focused on cognitive decline in four CHC abilities—Gc, Gf/Gv, Gsm, and Gs. Our cross-sectional data showed that CD, a measure of Gs, dem-onstrated the greatest decrease in mean scores when comparing younger to older age cohorts; BD (Gf/Gv) showed a moderate amount of decrease; DSB (Gsm) showed no relation to age; and Vocabulary (Gc) was maintained across the age range, even showing a moderate positive coefficient (>.2) on the WAIS-III and WAIS-IV at ages 20 to 74. Kaufman (2013, Figure 7.7) showed the PSI (Gs) to demon-strate the greatest decline across the 20 to 90 year range, followed by the PRI (Gf/Gv). The VCI (Gc) increased through the 50s and dropped gradually; 85-year-olds scored the same as 20-year-olds. The WMI (Gsm) was maintained through the 60s before dropping off, especially after age 75.
DSB did not demonstrate any age-related decline in our study, contrary to Kaufman’s (2013) finding with working memory and a wealth of studies by Salthouse (2010) that revealed memory to exhibit notable cognitive decline. That contrary finding may have been due to DSB’s lack of complexity as well as its restriction of range. The mean scores on DSB were based on very few raw score points compared with other tasks and had limited variability, as is evident in the means, SDs, and ranges for the four tasks shown in Tables 4 and 5. Other limitations of the study include the fact that only one subtest was used as representative of each of the four abilities, even though these abilities are represented by at least two subtests on all versions of Wechsler’s adult scales. The inclusion of only four subtests could have potentially influenced the reliability and validity of the measures of Gc, Gf/Gv, and Gs, just as it might have affected the results for Gsm. Finally, and importantly, the cross-sectional methodology used in the present study allowed us to com-pare mean scores earned by diverse age cohorts across a wide adult age range. However, only longitudinal or quasi-longitudinal methodologies permit a direct study of age changes across the life span, changes which often show a cognitive decline with increasing age.
at CAL STATE UNIV SACRAMENTO on August 1, 2016jpa.sagepub.comDownloaded from
438 Journal of Psychoeducational Assessment 34(5)
Unlike longitudinal studies, the cross-sectional methodology used in this study has one dis-tinct advantage—our results are not affected by the Flynn (2009) effect. The Flynn effect occurs when children or adults, of any age, are evaluated on tests whose norms have become outdated. In the United States, norms get out of date at the rate of 3 points per decade, meaning, for exam-ple, that children or adults earn scores that are spuriously high by 3 points when norms are 10 years out of date or by 6 points when norms are 20 years out of date. In our study, differences in mean scores earned by diverse age cohorts are interpreted within each version of Wechsler’s scales (WAIS-R, WAIS-III, WAIS-IV), not across versions. For each version of Wechsler’s adult scales, the adult sample was tested (a) at about the same point in time and (b) as part of the stan-dardization sample of the WAIS-R, WAIS-III, or WAIS-IV. Thus, all testing was done on tests with brand-new norms—hence, no Flynn effect to confound the results.
Acknowledgment
The authors express their gratitude to Dr. Larry Weiss and Dr. J. J. Zhu from Pearson Assessments for shar-ing their data.
Declaration of Conflicting Interests
The author(s) declared no potential conflicts of interest with respect to the research, authorship, and/or publication of this article.
Funding
The author(s) received no financial support for the research, authorship, and/or publication of this article.
ReferencesAlbert, M. S., Jones, K., Savage, C. R., Berkman, L., Seeman, T., Blazer, D., & Rowe, J. W. (1995).
Predictors of cognitive change in older persons: MacArthur studies of successful aging. Psychology and Aging, 10, 578-589.
Alley, D., Suthers, K., & Crimmins, E. (2007). Education and cognitive decline in older Americans: Results from the AHEAD sample. Research on Aging, 29, 73-94.
Andel, R., Vigen, C., Mack, W. J., Clark, L., & Gatz, M. (2006). The effect of education and occupa-tional complexity on rate of cognitive decline in Alzheimer’s patients. Journal of the International Neuropsychological Society, 12, 147-152.
Anstey, K., & Christensen, H. (2000). Education, activity, health, blood pressure and apolipoprotein E as predictors of cognitive change in old age: A review. Gerontology, 46, 163-177.
Arbuckle, T. Y., Maag, U., Pushkar, D., & Chaikelson, J. S. (1998). Individual differences in trajectory of intellectual development over 45 years of adulthood. Psychology and Aging, 13, 663-675.
Ardila, A., Ostrosky-Solis, F., Rosselli, M., & Gomez, C. (2000). Age-related cognitive decline during normal aging: The complex effect of education. Archives of Clinical Neuropsychology, 15, 495-513.
Atkins v. Virginia. (2002). 536 U.S. 304, 122 S.CT 2242.Baltes, P. B., & Lindenberger, U. (1997). Emergence of a powerful connection between sensory and cogni-
tive functions across the adult life span: A new window to the study of cognitive aging? Psychology & Aging, 12, 12-21.
Bickley, P. G., Keith, T. Z., & Wolfle, L. M. (1995). The three-stratum theory of cognitive abilities: Test of the structure of intelligence across the life span. Intelligence, 20, 309-328.
Birren, J. E., & Morrison, D. F. (1961). Analysis of the WAIS subtests in relation to age and education. Journal of Gerontology, 16, 363-369.
Bosma, H., van Boxtel, M. P. J., Ponds, R. W. H. M., Houx, P. J. H., & Jolles, J. (2003). Education and age-related cognitive decline: The contribution of mental workload. Educational Gerontology, 29, 165-173.
Botwinick, J. (1977). Intellectual abilities. In J. E. Birren & K. W. Schaie (Eds.), Handbook of the psychol-ogy of aging (pp. 580-605). New York, NY: Van Nostrand Reinhold.
Butler, S. M., Ashford, J. W., & Snowdon, D. A. (1996). Age, education, and changes in the Mini-Mental State Exam scores of older women: Findings from the Nun Study. Journal of the American Geriatric Society, 44, 675-681.
at CAL STATE UNIV SACRAMENTO on August 1, 2016jpa.sagepub.comDownloaded from
Kaufman et al. 439
Canivez, G. L., & Watkins, M. W. (2010a). Exploratory and higher-order factor analyses of the Wechsler Adult Intelligence Scale-Fourth Edition (WAIS-IV) adolescent subsample. School Psychology Quarterly, 25, 223-235. doi:10.1037/a0022046
Canivez, G. L., & Watkins, M. W. (2010b). Investigation of the factor structure of the Wechsler Adult Intelligence Scale-Fourth Edition (WAIS-IV): Exploratory and higher-order factor analyses. Psychological Assessment, 22, 827-836. doi:10.1037/a0020429
Carroll, J. B. (1997). The three-stratum theory of cognitive abilities. In D. P. Flanagan, J. L. Genshaft, & P. L. Harrison (Eds.), Contemporary intellectual assessment: Theories, tests, and issues (pp. 122-130). New York, NY: Guilford Press.
Christensen, H., Henderson, A. S., Griffiths, K., & Levings, C. (1997). Does aging inevitably lead to declines in cognitive performance? A longitudinal study of elite academics. Personality & Individual Differences, 23, 67-78.
Christensen, H., Hofer, S. M., MacKinnon, A. J., Korten, A. E., Jorm, A. F., & Henderson, A. S. (2001). Age is no kinder to the better educated: Absence of an association investigated using latent growth techniques in a community sample. Psychological Medicine, 31, 15-28.
Cohen, J. (1952a). A factor-analytically based rationale for the Wechsler-Bellevue. Journal of Consulting Psychology, 16, 272-277.
Cohen, J. (1952b). Factors underlying Wechsler-Bellevue performance of three neuropsychiatric groups. Journal of Abnormal and Social Psychology, 47, 359-365.
Cohen, J. (1957a). A factor-analytically based rationale for the Wechsler-Adult Intelligence Scale. Journal of Consulting Psychology, 6, 451-457.
Cohen, J. (1957b). The factorial structure of the WAIS between early adulthood and old age. Journal of Consulting Psychology, 21, 283-290.
Craik, F. I. M., & Salthouse, T. A. (Eds.). (2008). Handbook of cognitive aging (3rd ed.). New York, NY: Psychology Press.
Evans, D. A., Beckett, L. A., Albert, M. S., Hebert, L. E., Scherr, P. A., Funkenstein, H. H., & Taylor, J. O. (1993). Level of education and change in cognitive function in a community population of older persons. Annals of Epidemiology, 3, 71-77.
Farmer, M. E., Kittner, S. J., Rae, D. S., Bartko, J. J., & Regier, D. A. (1995). Education and change in cognitive function: The Epidemiologic Catchment Area Study. Annals of Epidemiology, 5, 1-7.
Flanagan, D. P., Ortiz, S. O., Alfonso, V. C., & Dynda, A. (2014). Cognitive assessment: Progress in psychometric theories, the structure of cognitive tests, and approaches to test interpretation. In D. Saklofske, V. Schwean, & C. Reynolds (Eds.), Oxford handbook of psychological assessment of chil-dren and adolescents (pp. 239-285). New York, NY: Oxford University Press.
Fletcher, J. M., Stuebing, K. K., & Hughes, L. C. (2010). IQ scores should be corrected for the Flynn effect in high-stakes decisions. Journal of Psychoeducational Assessment, 28, 469-473.
Flynn, J. R. (2009). What is intelligence? (Expanded ed.). New York, NY: Cambridge University Press.Glymour, M. M., Weuve, J., Berkman, L. F., Kawachi, I., & Robins, J. M. (2005). When is baseline adjust-
ment useful in analyses of change? An example with education and cognitive change. American Journal of Epidemiology, 162, 267-278.
Halpern, D. F., Beninger, A. S., & Straight, C. A. (2011). Sex differences in intelligence. In R. J. Sternberg & S. B. Kaufman (Eds.), Cambridge handbook of intelligence (pp. 253-272). New York, NY: Cambridge University Press.
Horn, J. L. (1985). Remodeling old model in intelligence. In B. B. Wolman (Ed.), Handbook of intelligence: Theories, measurements, and applications (pp. 267-300). New York, NY: Wiley.
Horn, J. L. (1989). Cognitive diversity: A framework of learning. In P. L. Ackerman, R. J. Sternberg, & R. Glaser (Eds.), Learning and individual differences (pp. 61-116). New York, NY: Freeman.
Jensen, A. R. (1998). The g factor: The science of mental ability. Westport, CT: Praeger.Karlamangla, A. S., Miller-Martinez, D., Aneshensel, C. S., Seeman, T. E., Wight, R. G., & Chodosh, J.
(2009). Trajectories of cognitive function in late life in the United States: Demographic and socioeco-nomic predictors. American Journal of Epidemiology, 170, 331-342.
Kaufman, A. S. (1975). Factor analysis of the WISC-R at eleven age levels between 6-1/2 and 16-1/2 years. Journal of Consulting and Clinical Psychology, 43, 135-147.
Kaufman, A. S. (1990). Assessing adolescent and adult intelligence. Boston, MA: Allyn & Bacon.Kaufman, A. S. (2000). Seven questions about the WAIS-III regarding differences in abilities across the 16
to 89 year life span. School Psychology Quarterly, 15, 3-29.
at CAL STATE UNIV SACRAMENTO on August 1, 2016jpa.sagepub.comDownloaded from

440 Journal of Psychoeducational Assessment 34(5)
Kaufman, A. S. (2001). WAIS-III IQs, Horn’s theory, and generational changes from young adulthood to old age. Intelligence, 29, 131-167.
Kaufman, A. S. (2009). IQ testing 101. New York, NY: Springer.Kaufman, A. S., & Horn, J. L. (1996). Age changes on tests of fluid and crystallized intelligence for females
and males on the Kaufman Adolescent and Adult Intelligence Test (KAIT) at ages 17 to 94 years. Archives of Clinical Neuropsychology, 11, 97-121.
Kaufman, A. S., Johnson, C. K., & Liu, X. (2008). A CHC theory-based analysis of age differences on cogni-tive abilities and academic skills at ages 22 to 90 years. Journal of Psychology Educational Assessment, 26, 350-381.
Kaufman, A. S., Kaufman-Packer, J. L., McLean, J. E., & Reynolds, C. R. (1991). Is the pattern of intel-lectual growth and decline across the adult life span different for men and women? Journal of Clinical Psychology, 47, 801-812.
Kaufman, A. S., & Lichtenberger, E. O. (1999). Essentials of WAIS-III Assessment. New York, NY: Wiley.Kaufman, A. S., & Lichtenberger, E. O. (2006). Assessing adolescent and adult intelligence (3rd ed.).
Hoboken, NJ: Wiley.Kaufman, A. S., Reynolds, C. R., & McLean, J. E. (1989). Age and WAIS-R intelligence in a national
sample of adults in the 20 to 74 year age range: A cross-sectional analysis with educational level con-trolled. Intelligence, 13, 235-253.
Kaufman, A. S., & Weiss, L. G. (Eds.). (2010). Special issue on the Flynn Effect. Journal of Psychoeducational Assessment, 10, 379-505.
Lee, H. F., Gorsuch, R. L., Saklofske, D. H., & Patterson, C. A. (2008). Cognitive differences for ages 16 to 89 (Canadian WAIS-III): Curvilinear with Flynn and processing speed corrections. Journal of Psychology Educational Assessment, 26, 382-394.
Lichtenberger, E. O., & Kaufman, A. S. (2013). Essentials of WAIS-IV Assessment (2nd ed.). Hoboken, NJ: Wiley.
Lyketsos, C. G., Chen, L. S., & Anthony, J. C. (1999). Cognitive decline in adulthood: An 11.5-year follow-up of the Baltimore Epidemiologic Catchment Area Study. American Journal of Psychiatry, 156, 58-65.
Manly, J. J., Schupf, N., Tang, M.X., & Stern, Y. (2005). Cognitive decline and literacy among ethnically diverse elders. Journal of Geriatric Psychiatry and Neurology, 18, 213-217.
McArdle, J. J., Ferrer-Caja, E., Hamagami, F., & Woodcock, R. W. (2002). Comparative longitudi-nal structural analyses of the growth and decline of multiple intellectual abilities over the life span. Developmental Psychology, 38, 113-142.
McGrew, K. S. (1997). Analysis of the major intelligence batteries according to a proposed comprehen-sive Gf–Gc framework. In D. P. Flanagan, J. L. Genshaft, & P. L. Harrison (Eds.), Contemporary Intellectual Assessment: Theories, tests, and issues (pp. 151-179). New York, NY: Guilford Press.
McGrew, K. S. (2009). CHC theory and the human cognitive abilities project: Standing on the shoulders of the giants of psychometric intelligence research. Intelligence, 37, 1-10.
Meinz, E. J., & Salthouse, T. A. (1998). Is age kinder to females than to males? Psychonomic Bulletin and Review, 5, 66-70.
Mulder, J. L., Dekker, R., & Dekker, P. H. (2004). Kaufman Intelligentietest voor Adolescenten en Volwassenen [Kaufman Intelligence Test for Adolescents and Adults]. Leiden, The Netherlands: PITS (Psychologische Instrumenten Tests en Services).
Rabbitt, P. (1993). Baseline changes in cognitive performance with age. In R. Levy & R. Howard (Eds.), Treatment and care in old age psychiatry (pp. 11-30). Petersfield, UK: Wrightson Biomedical.
Reynolds, C. R., Niland, J., Wright, J. E., & Rosenn, M. (2010). Failure to apply the Flynn correction in death penalty litigation: Standard practice of today maybe, but certainly malpractice of tomorrow. Journal of Psychology Educational Assessment, 28, 477-481.
Ronnlund, M., & Nilsson, L. G. (2006). Adult life-span patterns in WAIS–R Block Design performance: Cross-sectional versus longitudinal age gradients and relations to demographic factors. Intelligence, 34, 63-78.
Ronnlund, M., Nyberg, L., Backman, L., & Nilsson, L. G. (2005). Stability, growth, and decline in adult life span development of declarative memory: Cross-sectional and longitudinal data from a population-based study. Psychology and Aging, 20, 3-18.
Salthouse, T. A. (1998). Independence of age-related influences on cognitive abilities across the life span. Developmental Psychology, 34, 851-864.
Salthouse, T. A. (2004). Localizing age-related individual differences in a hierarchical structure. Intelligence, 32, 541-561.
at CAL STATE UNIV SACRAMENTO on August 1, 2016jpa.sagepub.comDownloaded from

Kaufman et al. 441
Salthouse, T. A. (2005). Effects of aging on reasoning. In K. J. Holyoak & R. G. Morrison (Eds.), Cambridge of thinking and reasoning (pp. 589-605). New York, NY: Cambridge University Press.
Salthouse, T. A. (2007). Implications of within-person variability in cognitive and neuropsychological functioning on the interpretation of change. Neuropsychology, 21, 401-411.
Salthouse, T. A. (2009). Decomposing age correlations on neuropsychological and cognitive variables. Journal of the International Neuropsychological Society, 15, 650-661.
Salthouse, T. A. (2010). Selective review of cognitive aging. Journal of the International Neuropsychological Society, 16, 754-760.
Salthouse, T. A. (2014). Evaluating the correspondence of different cognitive batteries. Assessment, 21, 131-142.
Salthouse, T. A., & Ferrer-Caja, E. (2003). What needs to be explained to account for age-related effects on multiple cognitive variables? Psychological Aging, 18, 91-110.
Salthouse, T. A., Pink, J. E., & Tucker-Drob, E. M. (2008). Contextual analysis of fluid intelligence. Intelligence, 36, 464-486.
Salthouse, T. A., & Saklofske, D. H. (2010). Do the WAIS-IV tests measure the same aspects of cognitive functioning in adults under and over age 65? In L. G. Weiss, D. H. Saklofske, D. L. Coalson, & S. E. Raiford (Eds.), WAIS-IV clinical use and interpretation (pp. 217–235). San Diego, CA: Academic Press.
Schneider, J. W., & McGrew, K. S. (2012). The Cattell-Horn-Carroll model of intelligence. In D. P. Flanagan & P. L. Harrison (Eds.), Contemporary intellectual assessment: Theories, tests, and issues (3rd ed., pp. 99-144). New York, NY: Guilford Press.
Shimamura, A. P., Berry, J. M., Mangels, J. A., Rusting, C. L., & Jurica, P. J. (1995). Memory and cognitive abilities in university professors: Evidence for successful aging. Psychological Science, 6, 271-277.
Silverman, L. K. (2013). Giftedness 101. New York, NY: Springer.Singh-Manoux, A., Kivimaki, M., Glymour, M. M., Elbaz, A., Berr, C., Ebmeier, K. P., . . . Dugravot,
A. (2012). Timing of onset of cognitive decline: Results from Whitehall II prospective cohort study. British Medical Journal, 344, Article d7622. doi:10.1136/bmj.d7622
Stern, Y. (2002). What is cognitive reserve? Theory and research application of the reserve concept. Journal of the International Neuropsychological Association, 8, 448-460.
Stern, Y., Albert, S., Tang, M. X., & Tsai, W. Y. (1999). Rate of memory decline in AD is related to educa-tion and occupation: Cognitive reserve? Neurology, 53, 1942-1947.
Tucker-Drob, E. M., Johnson, K. E., & Jones, R. N. (2009). The cognitive reserve hypothesis: A lon-gitudinal examination of age-associated declines in reasoning and processing speed. Developmental Psychology, 45, 431-446.
Van Dijk, K. R. A., Van Gerven, P. W. M., Van Boxtel, M. P. J., Van der Elst, W., & Jolles, J. (2008). No protective effects of education during normal cognitive aging: Results from the 6-year follow-up of the Maastricht Aging Study. Psychology and Aging, 23, 119-130.
Wang, J., & Kaufman, A. S. (1993). Changes in fluid and crystallized intelligence across the 20 to 90 year age range on the K-BIT. Journal of Psychoeducational Assessment, 11, 29-37.
Wilson, R. S., Hebert, L. E., Scherr, P. A., Barnes, L. L., Mendes de Leon, C. F., & Evans, D. A. (2009). Educational attainment and cognitive decline in old age. Neurology, 72, 460-465.
Wechsler, D. (1939). The measurement of adult intelligence. Baltimore, MD: Williams & Wilkins.Wechsler, D. (1955). Manual for the Wechsler Adult Intelligence Scale (WAIS). San Antonio, TX: The
Psychological Corporation.Wechsler, D. (1981). Manual for the Wechsler Adult Intelligence Scale–Revised (WAIS-R). San Antonio,
TX: The Psychological Corporation.Wechsler, D. (1997a). Wechsler Adult Intelligence Scale–Third Edition (WAIS-III) administration and
scoring manual. San Antonio, TX: The Psychological Corporation.Wechsler, D. (1997b). WAIS-III and WMS-III technical manual. San Antonio, TX: The Psychological
Corporation.Wechsler, D. (2008a). Wechsler Adult Intelligence Scale (WAIS-IV) (4th ed.). San Antonio, TX: Pearson.Wechsler, D. (2008b). WAIS-IV technical and interpretive manual. San Antonio, TX: Pearson.Zahodne, L. B., Glymour, M. M., Sparks, C., Bontempo, D., Dixon, R. A., MacDonald, S. W. S., &
Manly, J. J. (2011). Education does not slow cognitive decline with aging: 12-year evidence from the Victoria Longitudinal Study. Journal of International Neuropsychology, 17, 1039-1046. doi:10.1017/S1355617711001044
at CAL STATE UNIV SACRAMENTO on August 1, 2016jpa.sagepub.comDownloaded from