Embed Size (px)
Citation preview

Financial Results
Laurent Guillot
Paris, June 6, 2013

2012 key figures
Amounts in €m 2012 2012/2011
Sales 43,198 +2.6 %
Operating income 2,881 ‐16.3 %
Recurring* net income 1,126 ‐35.1 %
Net income 766 ‐40.3 %
Free cash flow* 895 ‐36.7 %
Free cash flow* after operating WCR 1,450 +73.2 %
Net debt 8,490 +4.9 %
* excluding capital gains and losses on disposals, exceptional asset write‐downs and material non‐recurring provisions

Sales€m
42,116
‐1.9%on a like‐for‐like basis
43,198‐3.6%
+2.7%
+1.8%
+1.7%
+2.6%
Sales prices held up well despite the volume downturn
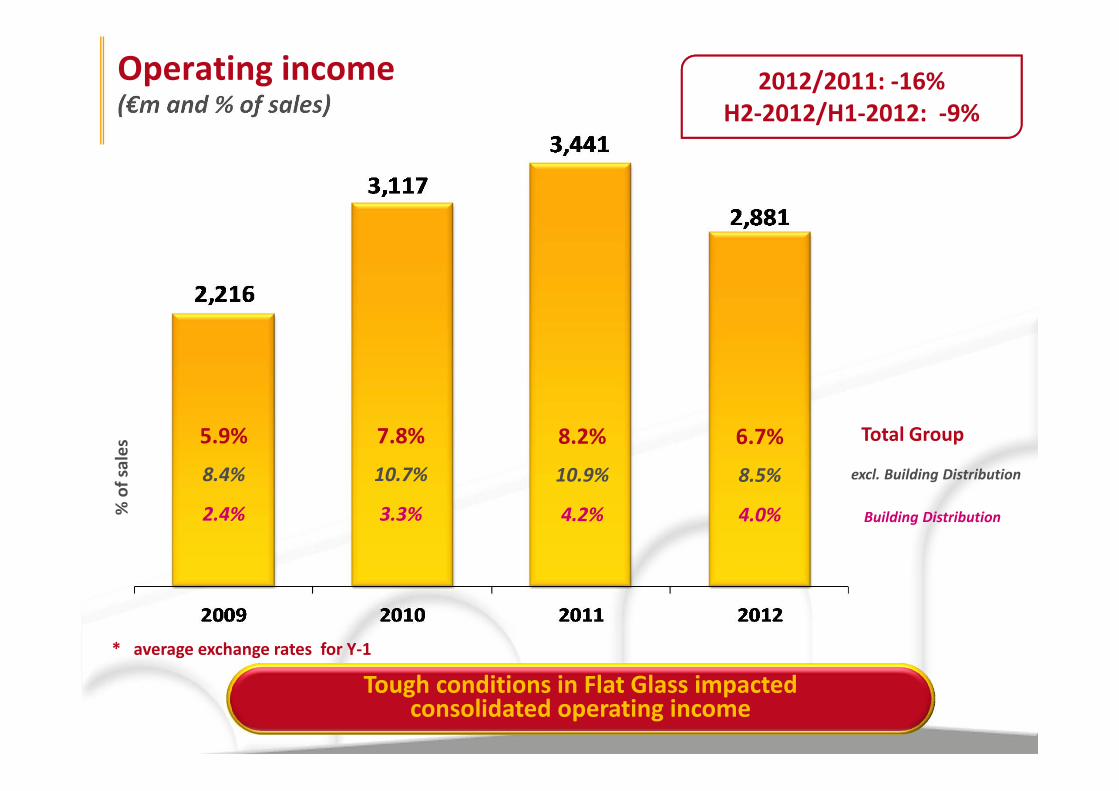
Operating income(€m and % of sales)
7.8%
10.7%
3.3%% of sales
5.9%
8.4%
2.4%
excl. Building Distribution
Total Group
Building Distribution
* average exchange rates for Y‐1
8.2%
10.9%
4.2%
6.7%
8.5%
4.0%
2012/2011: ‐16%H2‐2012/H1‐2012: ‐9%
Tough conditions in Flat Glass impacted consolidated operating income

15.7% 14.2%
8.8 %
2.0%
2011 2012
1,13011.8 %
Flat Glass
HPM
7267.7 %
Organic growth(like‐for‐like)
2012/2011
I.M. ‐ 4.4 %
Flat Glass ‐ 6.6 %
HPM ‐ 1.7 %
Nets Sales Operating Income
Innovative Materials (Flat Glass ‐ HPM) (Net sales evolution in % and Operating Income in €m and as a % of sales)

AméngtIntérieur
AméngtExtérieur 10.7%
8.3%
8.2%
8.3%
2011 2012
1,0869.5 %
9748.3 %
Organic growth(like‐for‐like)
2012/2011
C.P. ‐ 1.3 %
Int. Solutions + 1.3 %
Ext. Solutions ‐ 3.7 %
Nets Sales Operating Income
Construction Products(Net sales evolution in % and Operating Income in €m and as a % of sales)

4.2 %4.0 %
Organic growth(like‐for‐like)
2012/2011
Building Distribution ‐ 2.0 %
Nets Sales Operating Income
Building Distribution(Net sales evolution in % and Operating Income in €m and as a % of sales)

12.3 %
10.9 %
Organic growth(like‐for‐like)
2012/2011
Packaging + 3.5 %
Nets Sales Operating Income
Packaging(Net sales evolution in % and Operating Income in €m and as a % of sales)

781
1,205
574
881
648
955
683595
France Other WesternEurope
North America Asia & emergingcountries
2011 2012Organic growth
(like‐for‐like)
Geographic areas 2012/2011
France ‐ 2.5 %
Other Western Europe ‐ 4.3 %
North America + 2.3 %
Asia & emergingcountries ‐ 0.1 % 6.8 %10.2 %11.1 %10.4 %5.3 %6.7 %5.4 %6.6 %
Geographic areas(Net sales evolution in % and Operating Income in €m and as a % of sales)
Nets Sales Operating Income

Recurring* net income€m
* excluding capital gains on disposals and asset write‐downs(a) excluding treasury stock (526.2 million shares at December 31, 2012 versus 526.4 million at December 31, 2011)
‐40%
Net income
‐35%
Recurring* EPS(a): €2.14 (‐35%) EPS(a): €1.46 (‐40%)

Steep fall in operating WCR, down to an all‐time low of 29 days’ sales
Tight rein on operating WCR(at December 31, €m and no. of days)
2012/2011: ‐€555m, ‐14%

Free Cash Flow after operating WCR(€m)
+€613m+73 %
2011 2012

Capex (€1,773m) and acquisitions (€354m): highly selective operations, focused on the Group’s key growth drivers
High‐growth countries: ~€760m, mainly capital expenditure
Energy efficiency and energy markets: ~€200m:Electrochromic glass in the US (SAGE)Insulation: purchase of Celotex in the UK and acquisition of a stake in Isoroc in Russia
Consolidation in Building Distribution: ~€440m:Acquisition of Brossette in FranceBolt‐on acquisitions in Scandinavia
Focus on the Group’s key growth drivers(2/3 of total amount of capex and acquisitions)

Net debt & Shareholders’ equity€bn
Net debt/Shareholders’ equity
Net debt/EBITDA*
53%
2.3
39%
1.5
* EBITDA = operating income + operating depreciation/amortization over 12‐month period** after sale of VNA for €1.275bn
44%
1.6
12‐201112‐201012‐2009 12‐2012
47%
1.92
Balance sheet remains strong, particularly after the sale of Verallia North America
12‐2012proforma**
41%
1.77