Embed Size (px)
Citation preview
IN99Q1613
mmi!
mm
AFTC CODE FOR AUTOMATIC FAULT TREE CONSTRUCTION:USER'S MANUAL
by
Gopika Vinod, R. K. Saraf and A. K. BabarReactor Safety Division;
1999
V:,,
o BARC/1999/E/007o
$ GOVERNMENT OF INDIA£ ATOMIC ENERGY COMMISSIONONo\r—c_>cc«cco
AFTC CODE FOR AUTOMATIC FAULT TREE CONSTRUCTION:USER'S MANUAL
byGopika Vinod, R.K. Saraf and A.K. Babar
Reactor Safety Division
BHABHA ATOMIC RESEA8CH CENTREMUMBAI, INF
BARC/1999/E/007
BIBLIOGRAPHIC DESCRIPTION SHEET FOR TECHNICAL REPORT(as per IS : 9400 • 1980)
01
02
03
04
05
06
07
08
10
11
13
20
21
22
23
24
Security classification :
Distribution :
Report status :
Series:
Report type :
Report No. :
Part No. or Volume No. :
Contract No. :
Title and subtitle :
Collation :
Project No. :
Personal author(s) :
Affiliation of autkor(s) :
Corporate author(s) :
Originating unit :
Sponsor(s) Name :
Type:
Unclassified
External
New
BARC External
Technical Report
BARC/1999/E/007
AFTC Code for Automatic Fault Tree Construction: User'sManual
21 p., 7 figs., 2 tabs., 2 ills.
Gopika Vinod; R.K. Saraf; A.K. Babar
Reactor Safety Division, Bhabha Atomic Research Centre,Mumbai
Bhabha Atomic Research Centre, Mumbai - 400 085
Reactor Safety Division, BARC, Mumbai
Department of Atomic Energy
Government
Contd... (lb)-la-
30 Date of submission : March 1999
31 Publication I Issue date April 1999
40 Publisher I Distributor Head, Library and Information Division,Bhabha Atomic Research Centre, Mumbai
42 Form of distribution : Hard Copy
50 Language of text: English
51
52
Language of summary English
No. of references : 3 refs.
53 Gives data on :
60 Abstract : Fault Trees perform a predominant role in reliability and safety analysis of asystem. Manual construction of fault tree is a very time consuming task and moreover, itwon't give a formalised result, since it relies highly on analysts experience and heuristics.This necessitates a computerised fault tree construction, which is still attracting interest ofreliability analysts. AFTC software is a user friendly software model for constructing faulttrees based on decision tables. Software is equipped with libraries of decision tables forcomponents commonly used in various Nuclear Power Plant (NPP) systems. User is expectedto make a nodal diagram of the system, for which fault tree is to be constructed, from the flowsheets available. The text nodal diagram goes as the sole input defining the system flowchart. AFTC software is a rule based expert system which draws the fault tree from thesystem flow chart and component decision tables. AFTC software gives fault tree in both textand graphic format. Help is provided as how to enter system flow chart and component decisiontables. The software is developed in 'C language. Software is verified with simplified versionof the fire water system of an Indian PHWR. Code conversion will be undertaken to create awindow based version.
70 Keywords/Descriptors : FAULT TREE ANALYSIS; FLOWSHEETS; A CODES; REACTORSAFETY; REACTOR COOLING SYSTEMS; PHWR TYPE REACTORS; VALVES;NUCLEAR POWER PLANTS; FAILURE; FIRE PREVENTION; SPRAYS; ALGORITHMS;MANUALS; VALIDATION; RECOMMENDATIONS
71 Class No. : INIS Subject Category : E3400
Supplementary elements :
-1b-
ABSTRACT
Fault Trees perform a predominant role in reliability and safety analysis of a system.
Manual construction of fault tree is a very time consuming task and moreover, it won't give a
formalised result, since it relies highly on analysts experience and heuristics. This necessitates a
computerised fault tree construction, which is still attracting interest of reliability analysts.
AFTC software is a user friendly software model for constructing fault trees based on
decision tables. Software is equipped with libraries of decision tables for components commonly
used in various Nuclear Power Plant (NPP) systems. User is expected to make a nodal diagram
of the system, for which fault tree is to be constructed, from the flow sheets available. The text
nodal diagram goes as the sole input defining the system flow chart. AFTC software is a rule
based expert system which draws the fault tree from the system flow chart and component
decision tables.
AFTC software gives fault tree in both text and graphic format. Help is provided as how
to enter system flow chart and component decision tables. The software is developed in 'C
language. Software is verified with simplified version of the fire water system of an Indian
PHWR.
Code conversion will be under taken to create a window based version.
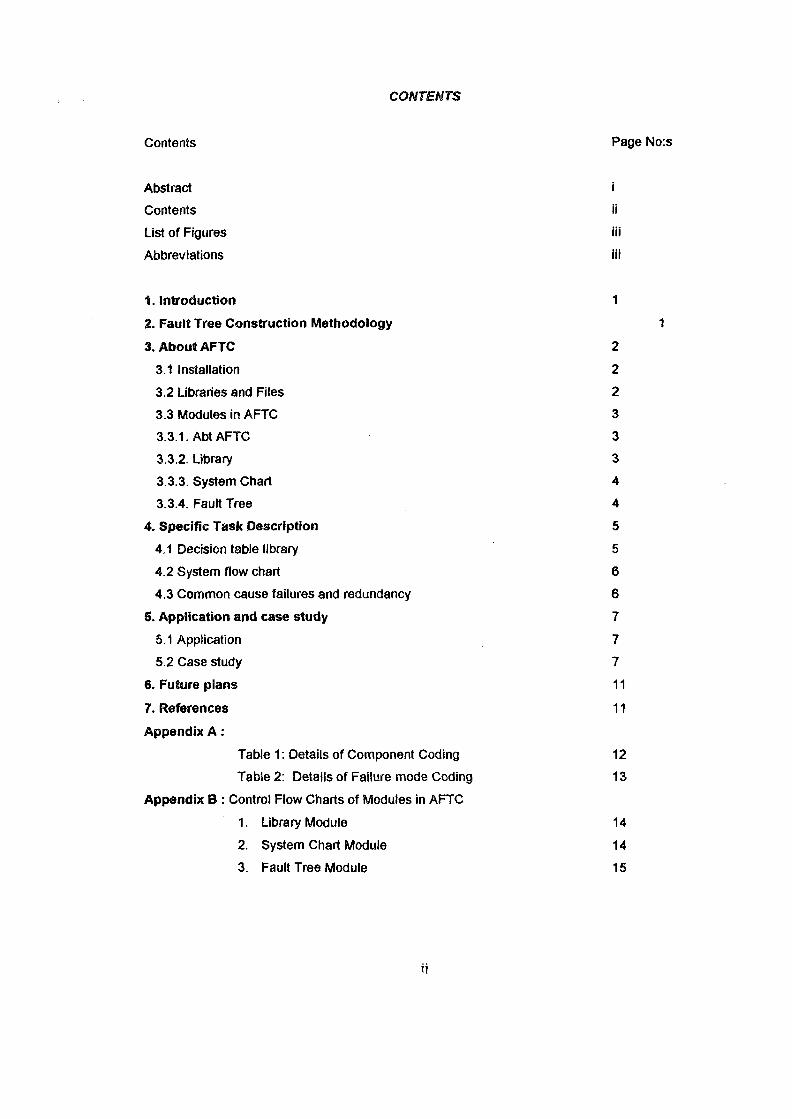
CONTENTS
Contents Page No:s
Abstract
Contents
List of Figures
Abbreviations
ii
iii
Hi
1 . introduction
2. Fault Tree Construction Methodology
3. About AFTC
3.1 Installation
3.2 Libraries and Files
3.3 Modules in AFTC
3.3.1. Abt AFTC
3.3.2. Library
3.3.3. System Chart
3.3.4. Fault Tree
4. Specific Task Descr ip t ion
4.1 Decision table library
4.2 System flow chart
4.3 Common cause failures and redundancy
5. Application and case study
5.1 Application
5.2 Case study
6. Future plans
7. References
Appendix A :
Table 1: Details of Component Coding
Table 2: Details of Failure mode Coding
Appendix B : Control Flow Charts of Modules in AFTC
1. Library Module
2. System Chart Module
3. Fault Tree Module
2
2
2
3
3
3
4
4
5
5
6
6
7
7
7
11
11
12
13
14
14
15
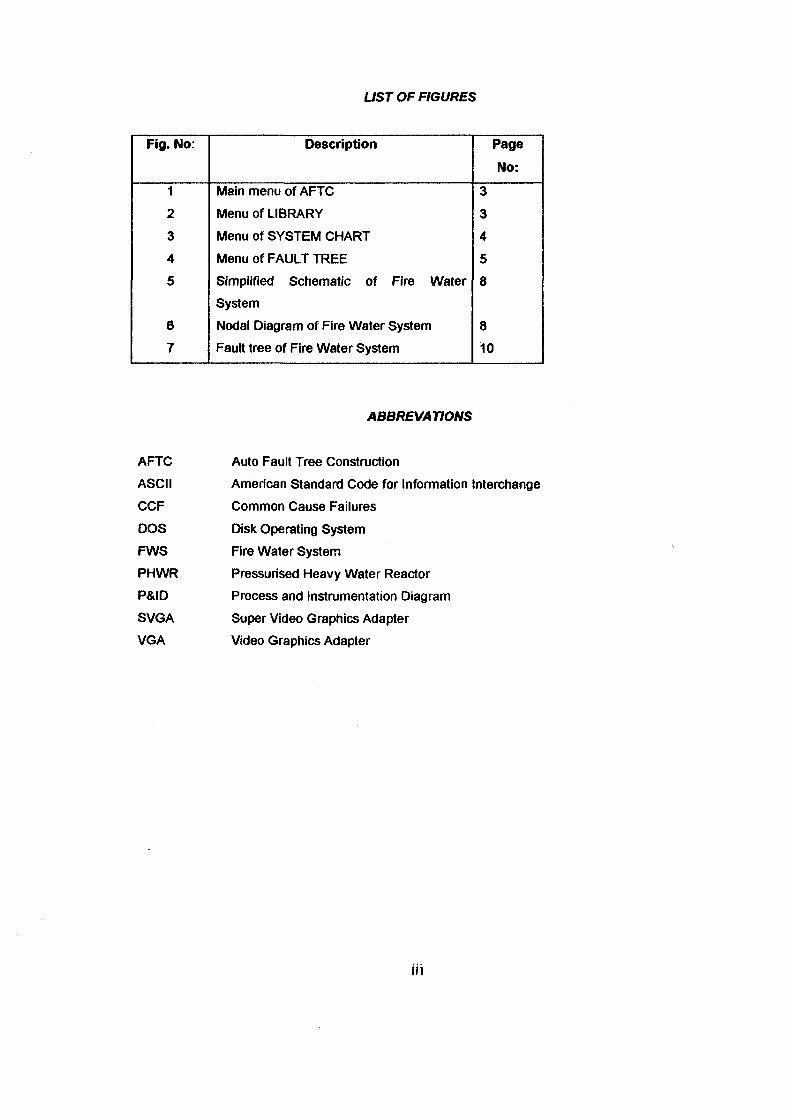
UST OF FIGURES
Fig. No:
1
2
3
4
5
6
7
Description
Main menu of AFTC
Menu of LIBRARY
Menu of SYSTEM CHART
Menu of FAULT TREE
Simplified Schematic of Fire Water
System
Nodal Diagram of Fire Water System
Fault tree of Fire Water System
Page
No:
3
3
4
5
8
8
10
ABBREVATIONS
AFTC Auto Fault Tree Construction
ASCII American Standard Code for Information Interchange
CCF Common Cause Failures
DOS Disk Operating System
FWS Fire Water System
PHWR Pressurised Heavy Water Reactor
P&ID Process and Instrumentation Diagram
SVGA Super Video Graphics Adapter
VGA Video Graphics Adapter
m
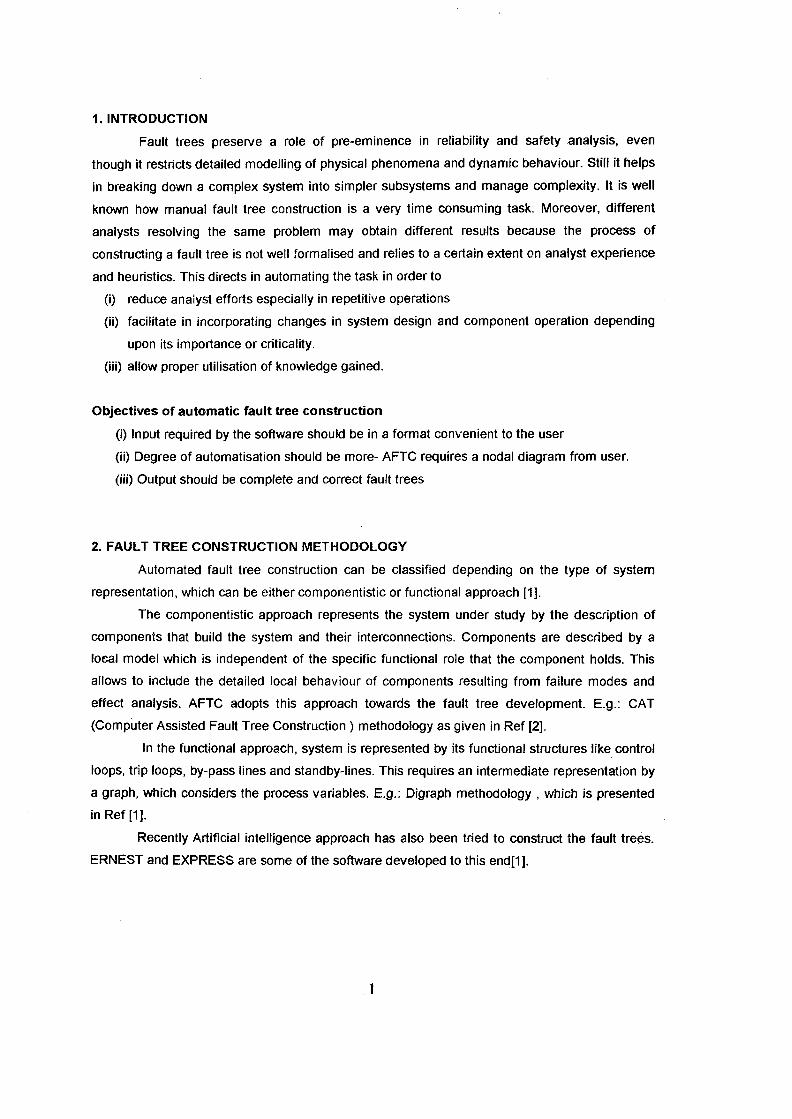
1. INTRODUCTION
Fault trees preserve a role of pre-eminence in reliability and safety analysis, even
though it restricts detailed modelling of physical phenomena and dynamic behaviour. Still it helps
in breaking down a complex system into simpler subsystems and manage complexity. It is well
known how manual fault tree construction is a very time consuming task. Moreover, different
analysts resolving the same problem may obtain different results because the process of
constructing a fault tree is not well formalised and relies to a certain extent on analyst experience
and heuristics. This directs in automating the task in order to
(i) reduce analyst efforts especially in repetitive operations
(ii) facilitate in incorporating changes in system design and component operation depending
upon its importance or criticality.
(iii) allow proper utilisation of knowledge gained.
Objectives of automatic fault tree construction
(i) Input required by the software should be in a format convenient to the user
(ii) Degree of automatisation should be more- AFTC requires a nodal diagram from user.
(iii) Output should be complete and correct fault trees
2. FAULT TREE CONSTRUCTION METHODOLOGY
Automated fault tree construction can be classified depending on the type of system
representation, which can be either componentistic or functional approach [1].
The componentistic approach represents the system under study by the description of
components that build the system and their interconnections. Components are described by a
local model which is independent of the specific functional role that the component holds. This
allows to include the detailed local behaviour of components resulting from failure modes and
effect analysis. AFTC adopts this approach towards the fault tree development. E.g.: CAT
(Computer Assisted Fault Tree Construction ) methodology as given in Ref [2].
In the functional approach, system is represented by its functional structures like control
loops, trip loops, by-pass lines and standby-lines. This requires an intermediate representation by
a graph, which considers the process variables. E.g.: Digraph methodology , which is presented
in Ref [1].
Recently Artificial intelligence approach has also been tried to construct the fault trees.
ERNEST and EXPRESS are some of the software developed to this end{1].
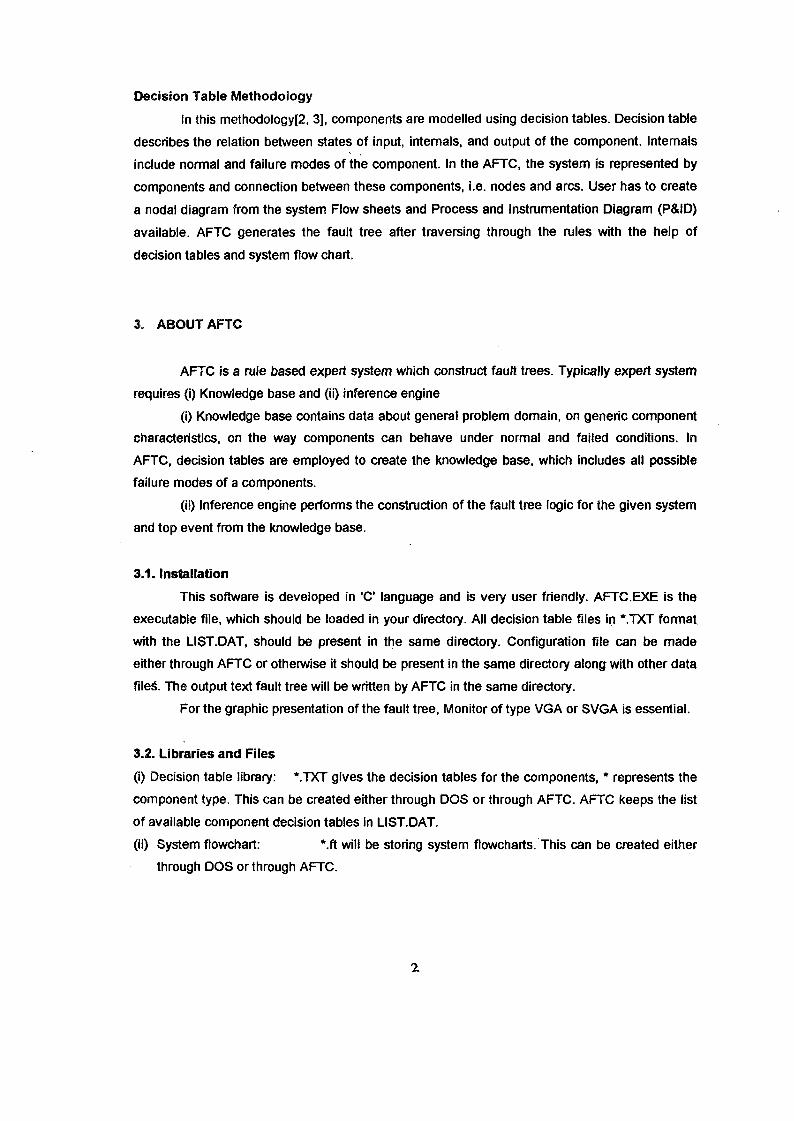
Decision Table Methodology
In this methodology[2, 3], components are modelled using decision tables. Decision table
describes the relation between states of input, internals, and output of the component. Internals
include normal and failure modes of the component. In the AFTC, the system is represented by
components and connection between these components, i.e. nodes and arcs. User has to create
a nodal diagram from the system Flow sheets and Process and Instrumentation Diagram (P&ID)
available. AFTC generates the fault tree after traversing through the rules with the help of
decision tables and system flow chart.
3. ABOUT AFTC
AFTC is a rule based expert system which construct fault trees. Typically expert system
requires (i) Knowledge base and (ii) inference engine
(i) Knowledge base contains data about general problem domain, on generic component
characteristics, on the way components can behave under normal and failed conditions. In
AFTC, decision tables are employed to create the knowledge base, which includes all possible
failure modes of a components.
(ii) Inference engine performs the construction of the fault tree logic for the given system
and top event from the knowledge base.
3.1. Installation
This software is developed in 'C language and is very user friendly. AFTC.EXE is the
executable file, which should be loaded in your directory. All decision table files in *.TXT format
with the LIST.DAT, should be present in the same directory. Configuration file can be made
either through AFTC or otherwise it should be present in the same directory along with other data
fileS. The output text fault tree will be written by AFTC in the same directory.
For the graphic presentation of the fault tree, Monitor of type VGA or SVGA is essential.
3.2. Libraries and Files
(i) Decision table library: *.TXT gives the decision tables for the components, * represents the
component type. This can be created either through DOS or through AFTC. AFTC keeps the list
of available component decision tables in LIST.DAT.
(ii) System flowchart: *.ft will be storing system flowcharts. This can be created either
through DOS or through AFTC.
For storing the text fault tree, AFTC asks user to specify the file name. This file is also a
ASCII file, which can be viewed under DOS. Graphic fault tree is drawn directly to the screen
from this file.
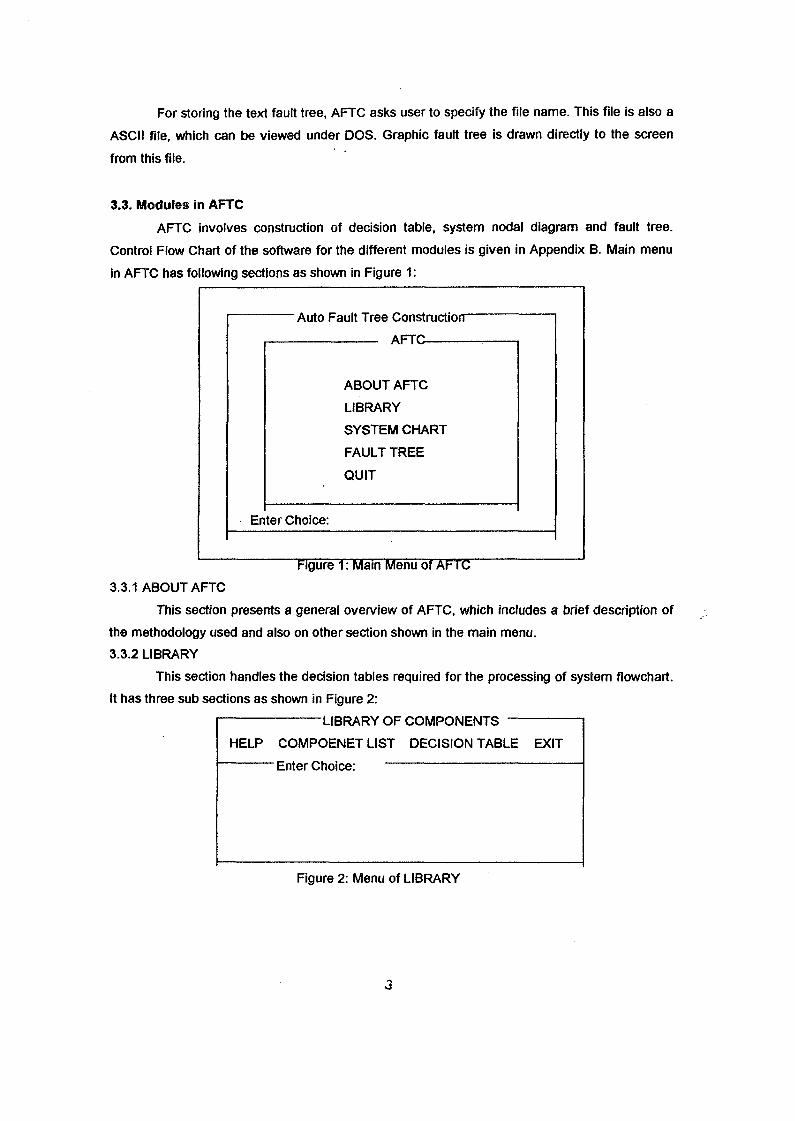
3.3. Modules in AFTC
AFTC involves construction of decision table, system nodal diagram and fault tree.
Control Flow Chart of the software for the different modules is given in Appendix B. Main menu
in AFTC has following sections as shown in Figure 1:
Auto Fault Tree Construction"
AFTC
ABOUT AFTC
LIBRARY
SYSTEM CHART
FAULT TREE
QUIT
Enter Choice:
Figure 1: Main Menu of AFTC
3.3.1 ABOUT AFTC
This section presents a general overview of AFTC, which includes a brief description of
the methodology used and also on other section shown in the main menu.
3.3.2 LIBRARY
This section handles the decision tables required for the processing of system flowchart.
It has three sub sections as shown in Figure 2:
LIBRARY OF COMPONENTS
HELP COMPOENET LIST DECISION TABLE EXIT
Enter Choice:
Figure 2: Menu of LIBRARY
(i) Help: Help directs in notation to be adopted, while designing the decision table for
new components. It gives the possible values, that input, internal and output can
adopt,
(ii) Component List: It gives the list of component decision tables already available, with
the identity number (id) assigned to each file.
(iii) Decision Table: This facilitates in entering new component decision tables.
Automatically, the new component name and its corresponding id will be recorded
into the Component List.
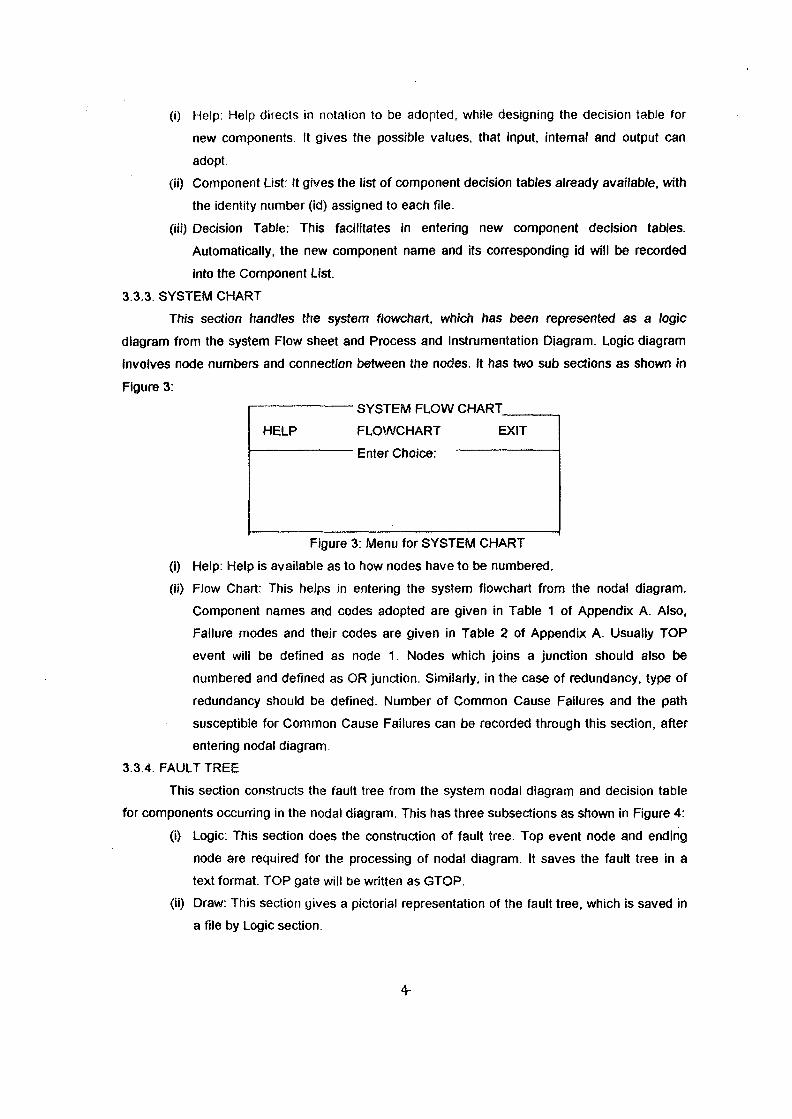
3.3.3. SYSTEM CHART
This section handles the system flowchart, which has been represented as a logic
diagram from the system Flow sheet and Process and Instrumentation Diagram. Logic diagram
involves node numbers and connection between the nodes. It has two sub sections as shown in
Figure 3:
SYSTEM FLOW CHART
HELP FLOWCHART
Enter Choice:
EXIT
Figure 3: Menu for SYSTEM CHART
(i) Help: Help is available as to how nodes have to be numbered.
(ii) Flow Chart: This helps in entering the system flowchart from the nodal diagram.
Component names and codes adopted are given in Table 1 of Appendix A. Also,
Failure modes and their codes are given in Table 2 of Appendix A. Usually TOP
event will be defined as node 1. Nodes which joins a junction should also be
numbered and defined as OR junction. Similarly, in the case of redundancy, type of
redundancy should be defined. Number of Common Cause Failures and the path
susceptible for Common Cause Failures can be recorded through this section, after
entering nodal diagram.
3.3.4. FAULT TREE
This section constructs the fault tree from the system nodal diagram and decision table
for components occurring in the nodal diagram. This has three subsections as shown in Figure 4:
(i) Logic: This section does the construction of fault tree. Top event node and ending
node are required for the processing of nodal diagram. It saves the fault tree in a
text format. TOP gate will be written as GTOP.
(ii) Draw: This section gives a pictorial representation of the fault tree, which is saved in
a file by Logic section.
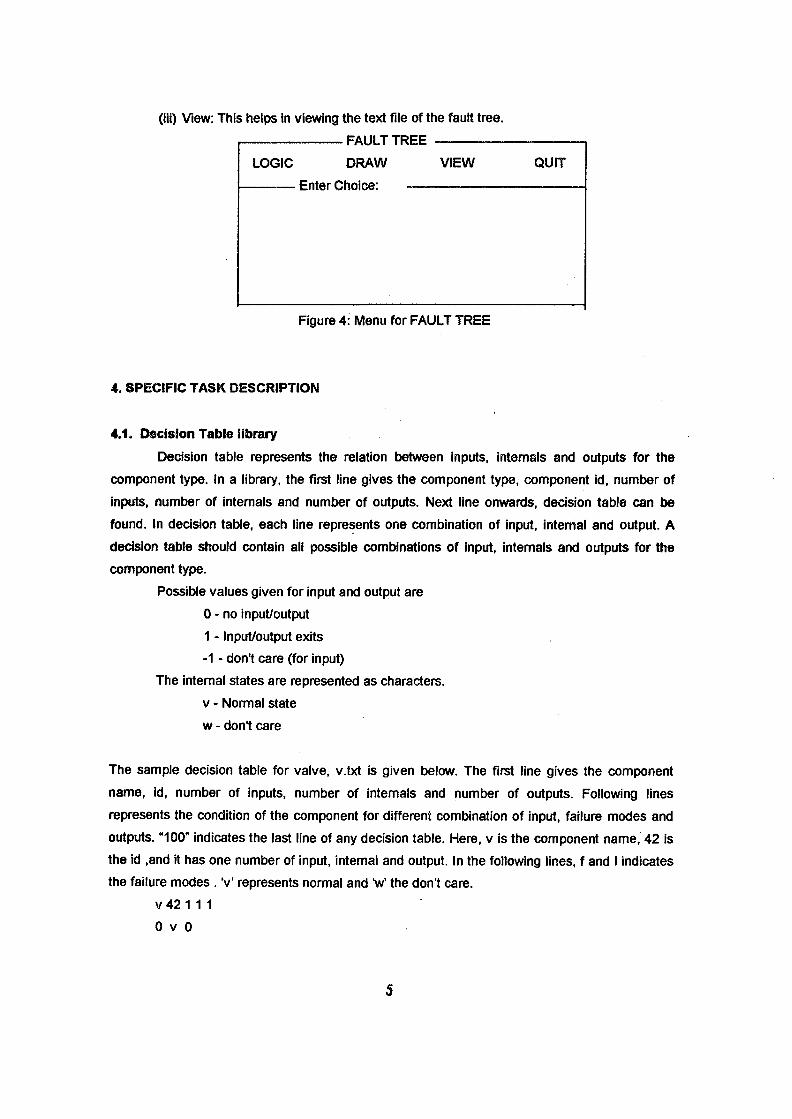
(iii) View: This helps in viewing the text file of the fault tree.
FAULT TREE
LOGIC DRAW VIEW QUIT
Enter Choice:
Figure 4: Menu for FAULT TREE
4. SPECIFIC TASK DESCRIPTION
4.1. Decision Table library
Decision table represents the relation between inputs, internals and outputs for the
component type. In a library, the first line gives the component type, component id, number of
inputs, number of internals and number of outputs. Next line onwards, decision table can be
found. In decision table, each line represents one combination of input, internal and output. A
decision table should contain all possible combinations of input, internals and outputs for the
component type.
Possible values given for input and output are
0 - no input/output
1 - Input/output exits
-1 - don't care (for input)
The internal states are represented as characters,
v - Normal state
w - don't care
The sample decision table for valve, v.txt is given below. The first line gives the component
name, id, number of inputs, number of internals and number of outputs. Following lines
represents the condition of the component for different combination of input, failure modes and
outputs. "100" indicates the last line of any decision table. Here, v is the component name, 42 is
the id ,and it has one number of input, internal and output. In the following lines, f and I indicates
the failure modes. V represents normal and V the don't care.
v 42 1 1 1
0 v 0

-1 fO
-110
1 w1
100
Table 2 of Appendix A gives the possible failure modes of a component.
4.2. System flowchart
Flowchart represents the interconnection of components in the system, which is
established through nodes. Junction is a node that has the input from more than one nodes.
Junction can be either OR or AND type(Note: this notation is not the logic OR or AND that is
commonly used in fault trees ). OR types used when alternate paths are available for producing
output. Usually, top event node is numbered as 1.
In a flow chart, each line gives the component name, component type, input node and
output node. For junctions, junction name, junction type, input nodes and output node is given. It
is very important that all component types should be familiar to AFTC to ensure the execution of
the software.
Steps required for complete fault tree analysis are:
1. Determine possible operating/ failed states of each component type, and how the
input states and internal states of the component affect the output.
2. Define the TOP event, the undesirable event to be examined. Also, define any initial
and boundary conditions for the system.
3. Construct the fault tree by considering how various components and operating/ failed
states affect the system operation and lead to the TOP.
Rules used for fault tree construction
(i) Find the lines giving no output, which gives the component failure. If more than one
combination gives no output, they have to be ORed in the fault tree.
(ii) For a particular line, input and internals should be ANDed in the fault tree in order to
obtain no output.
(iii) The internals always become basic events in the constructed fault tree
(iv) The inputs for the component should be successively developed tilt last node is reached.
(v) Start from the TOP node, which is usually denoted as node 1.
4.3. Common Cause Failure and Redundancy
The Common Cause Failures (CCFs) are dependent, multiple failures arising from a
common initiating cause. CCFs can arise from (i) Design Errors, (ii) Manufacturing Errors, (iii)
Test and Maintenance Errors and (iv) Effect from External Environment. For AFTC, Components

susceptible for CCFs should be identified by the User. This information should be entered in the
system chart file for the processing of the Fault Tree module.
Redundancies are provided at system or component level in many of the process and
safety systems. This is represented as "m/n" gates and the user should adopt a nomenclature
starting with letter 'm' for representing such type of junctions. Decision tables will be made by
AFTC, when the condition of redundancy like 2 out of 3, lout of 4 etc. is provided. Seeing letter
'm', AFTC will incorporate this gate and also draw "m/n".
5. APPLICATION AND CASE STUDY
5.1. Application
Automatic Fault Tree Construction from System Flow sheets and Process and
Instrumentation diagram has always been a challenging task, ever since fault trees has been
used in reliability analysis. Eventually, deducting fault trees from System Flow sheets and P&ID
can only be handled by persons having a background on both reliability and System functioning.
In order to computerise the heuristics used by reliability analysts towards fault tree construction,
a software, AFTC has been developed. Main applications of AFTC are in:
(i) Generalising the fault trees developed for a system
(ii) Reducing chances of committing mistakes in repetitive operations
(iii) Facilitate in incorporating changes in system design and component operation
(iv) To assist plant personnels in constructing the fault trees for the reliability analysis.
5.2. Case Study
As a illustration, Fire Water System (FWS) of an Indian Pressurised Heavy Water
Reactor (IPHWR) is taken as a case study.
FWS comprises of constantly pressurised hydrant system and sprinkler system. Water
for both hydrant and sprinkler system will be supplied by the fire water pumps from the sump
located in the cooling water pump house through a common piping network. Automatic sprinklers
have been provided for oil-filled transformers, cable vaults and cable tunnels. Hydrant system
covers the whole plant for outdoor and indoor supply of fire water.
Three fire water pumps are provided for this purpose - One electric motor driven pump
and three diesel engine driven pumps. Check valves and manual valves are provided in each
line, both at the tank and sprinkler end. Also valves are present in the common line at either
ends. Figure 5 shows the simplified schematic of the Fire Water System.
CW Tank - Cooling Water Tank DE1 ,DE2,DE3 - Diesel Engine
V1,V2,V3,V4,V5-Manual Valves P1,P2,P3- Pumps
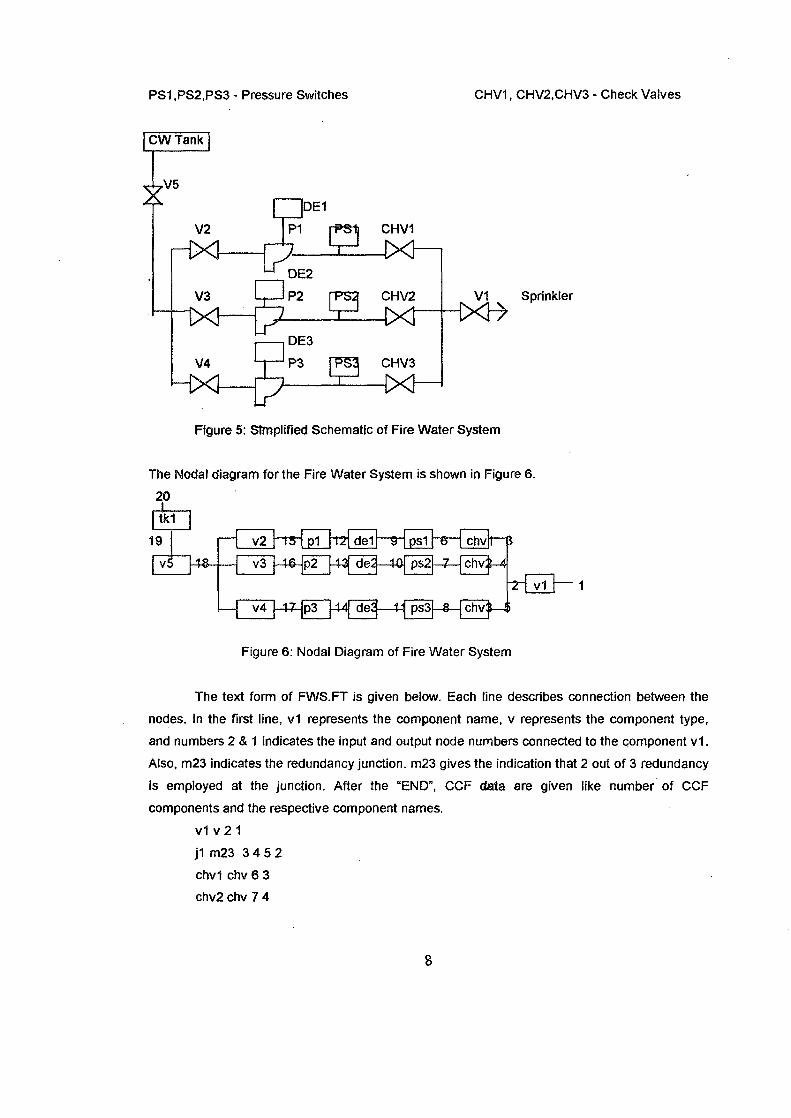
PS1.PS2.PS3 - Pressure Switches CHV1, CHV2.CHV3 - Check Valves
CWTank
X•V5
V2
DE1
P1 rPSli CHV1
V1 Sprinkler
WFigure 5: Simplified Schematic of Fire Water System
The Nodal diagram for the Fire Water System is shown in Figure 6.
20
tk1
19 Iv5 1 8 •
V2
v3
v4
-rs--46-
p1
P2
p3
43
1<l
del
dei
rie?
9
-40
V
psl
ps?
ps3
- 7 -
s
chv
chv;
chv:
f—
M
j i
3
~2r\ V1
Figure 6: Nodal Diagram of Fire Water System
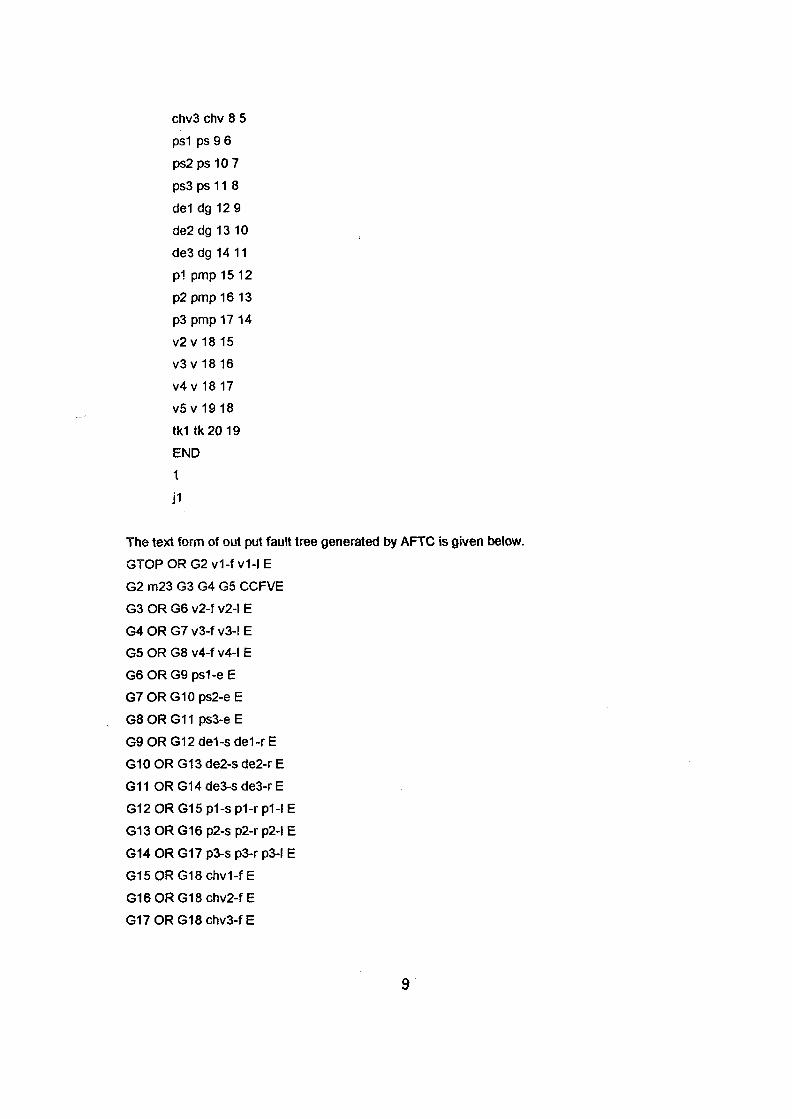
The text form of FWS.FT is given below. Each line describes connection between the
nodes. In the first line, v1 represents the component name, v represents the component type,
and numbers 2 & 1 indicates the input and output node numbers connected to the component v1.
Also, m23 indicates the redundancy junction. m23 gives the indication that 2 out of 3 redundancy
is employed at the junction. After the "END", CCF data are given like number of CCF
components and the respective component names.
v1 v 2 1
j1 m23 3 4 5 2
chv1 chv 6 3
Chv2 chv 7 4
chv3 chv 8 5
ps1 ps 9 6
ps2ps10 7
ps3 ps 11 8
del dg12 9
de2dg13 10
de3dg14 11
pi pmp15 12
p2pmp16 13
p3 pmp 17 14
v2v 18 15
v3v18 16
v4v18 17
v5v19 18
tk1 tk 20 19
END
1
J1
The text form of out put fault tree generated by AFTC is given below.
GTOPORG2v1-fv1-IE
G2 m23 G3 G4 G5 CCFVE
G3 OR G6 v2-f v2-l E
G4ORG7v3-fv3-!E
G5ORG8v4-fv4-IE
G6ORG9ps1-eE
G7ORG10ps2-eE
G8ORG11 ps3-eE
G9ORG12de1-sde1-rE
G10ORG13de2-sde2-rE
G11 ORG14de3-sde3-rE
G12ORG15p1-sp1-rp1-IE
G13 OR G16 p2-s p2-r p2-l E
G14 OR G17 p3-s p3-r p3-l E
G15ORG18chv1-fE
G16ORG18chv2-fE
G17ORG18chv3-fE
)
PS1-E PS2-E
KVE DE1-R DE2-S &E2-R DEJ-! 0E3-R
P1-L P2-S CH^2-F Pl-R P2-L P3-S CHV3-F P V R P3-L
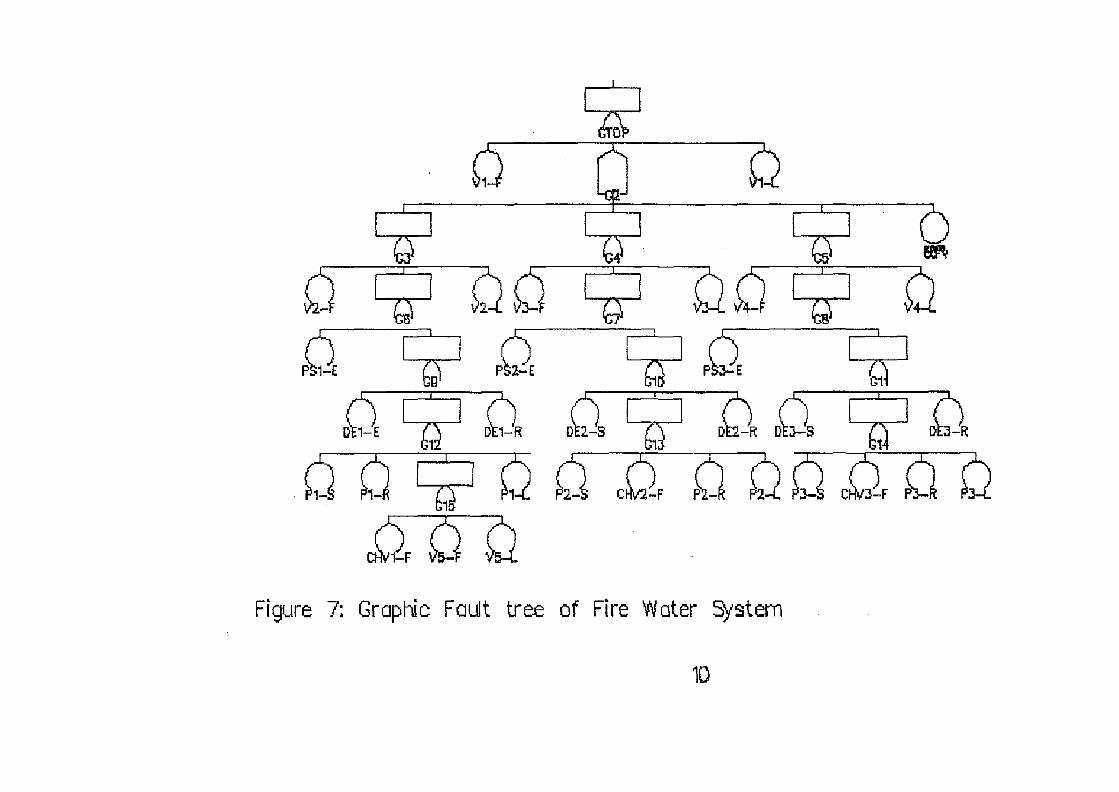
Figure 7: Graphic Fault tree of Fire Water System
10
G18ORG19v5-fv5-IE
G19ORG20tk1-IE
END
The character appearing after component names correspond to the possible failure modes of the
component. The graphical representation of the above fault tree is shown in Figure 7.
6. FUTURE PLANS
(i) Code Conversion to Visual Programming is recommended to create a window based
version.
00 Expert judgement can be included in order to choose the possible failure modes
depending on the usage of the component in the system.
7. REFERENCES
[1] A. Carpignano and A. Poucet, ' Computer assisted fault tree construction - a review of
methods and concerns', Reliability Engineering and System Safety, Vol 94. (1994).
[2] S. L. Salem, G. E. Apostolokis, and D. Okrent, 'A New Methodology for Computer aided
Construction of Fault trees', Annals of Nuclear energy, Vol 4,1977.
[3] Sang Hoon Hai, Tae Woon Kim, Young Choi and Kun Joong Yoo, 'Development of a
computer code AFTC for fault tree construction using decision table method and super
component concept', Reliability Engineering and System Safety, Vol 25. (1989).
U
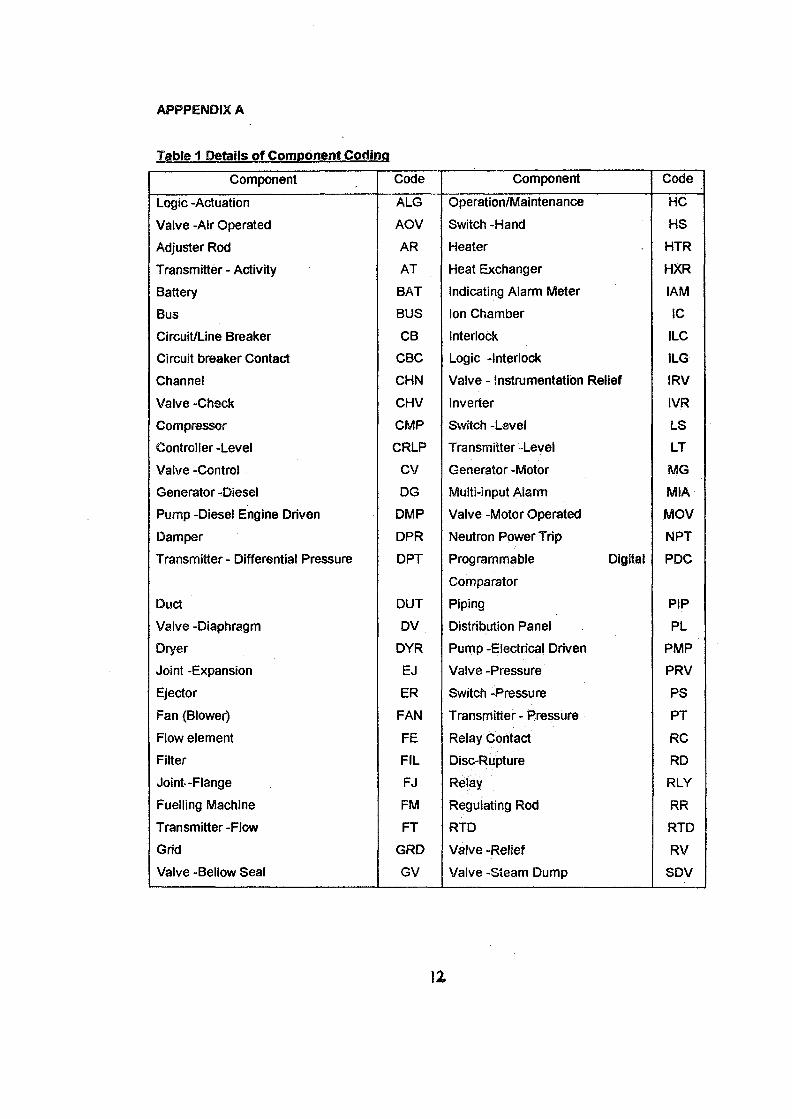
APFPENDIX A
Table 1 Details of Component Coding
Component
Logic -Actuation
Valve -Air Operated
Adjuster Rod
Transmitter - Activity
Battery
Bus
Circuit/Line Breaker
Circuit breaker Contact
Channel
Valve -Check
Compressor
Controller -Level
Valve -Control
Generator -Diesel
Pump -Diesel Engine Driven
Damper
Transmitter - Differential Pressure
Duct
Valve -Diaphragm
Dryer
Joint -Expansion
Ejector
Fan (Blower)
Flow element
Filter
Joint-Flange
Fuelling Machine
Transmitter -Flow
Grid
Valve -Bellow Seal
Code
ALG
AOV
AR
AT
BAT
BUS
CB
CBC
CHN
CHV
CMP
CRLP
CV
DG
DMP
DPR
DPT
DUT
DV
DYR
EJ
ER
FAN
FE
FIL
FJ
FM
FT
GRD
GV
Component
Operation/Maintenance
Switch -Hand
Heater
Heat Exchanger
Indicating Alarm Meter
Ion Chamber
Interlock
Logic -Interlock
Valve - Instrumentation Relief
Inverter
Switch -Level
Transmitter -Level
Generator -Motor
Multi-input Alarm
Valve -Motor Operated
Neutron Power Trip
Programmable Digital
Comparator
Piping
Distribution Panel
Pump -Electrical Driven
Valve-Pressure
Switch -Pressure
Transmitter - Pressure
Relay Contact
Disc-Rupture
Relay
Regulating Rod
RTD
Valve -Relief
Valve -Steam Dump
Code
HC
HS
HTR
HXR
1AM
iC
ILC
ILG
IRV
IVR
LS
LT
MG
MIA
MOV
NPT
PDC
PIP
PL
PMP
PRV
PS
PT
RC
RD
RLY
RR
RTD
RV
SDV
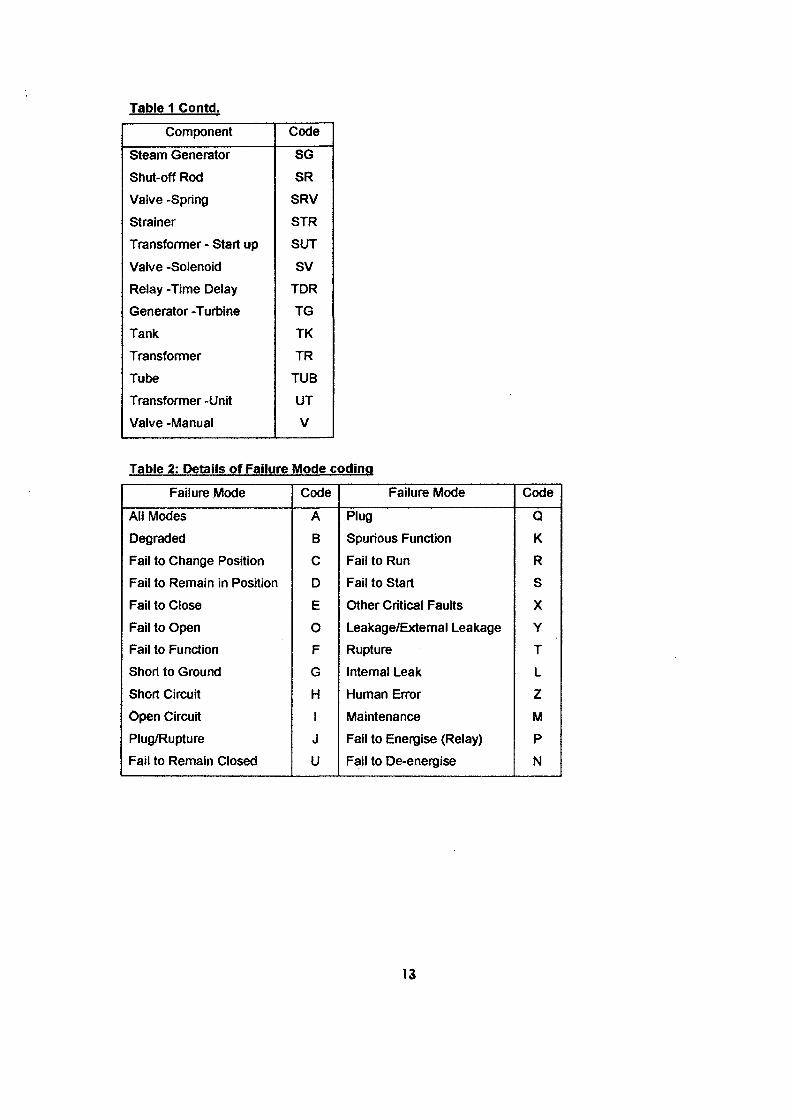
Table 1 Contd.
Component
Steam Generator
Shut-off Rod
Valve -Spring
Strainer
Transformer - Start up
Valve -Solenoid
Relay -Time Delay
Generator -Turbine
Tank
Transformer
Tube
Transformer -Unit
Valve -Manual
Code
SG
SR
SRV
STR
SUT
SV
TDR
TG
TK
TR
TUB
UT
V
Table 2: Details of Failure
Failure Mode
All Modes
Degraded
Fail to Change Position
Fail to Remain in Position
Fail to Close
Fail to Open
Fail to Function
Short to Ground
Short Circuit
Open Circuit
Plug/Rupture
Fail to Remain Closed
Mode codinq
Code
A
B
C
D
E
O
F
G
H
I
J
U
Failure Mode
Plug
Spurious Function
Fail to Run
Fail to Start
Other Critical Faults
Leakage/External Leakage
Rupture
Internal Leak
Human Error
Maintenance
Fail to Energise (Relay)
Fail to De-energise
Code
Q
KR
S
X
Y
T
L
Z
M
P
N
13
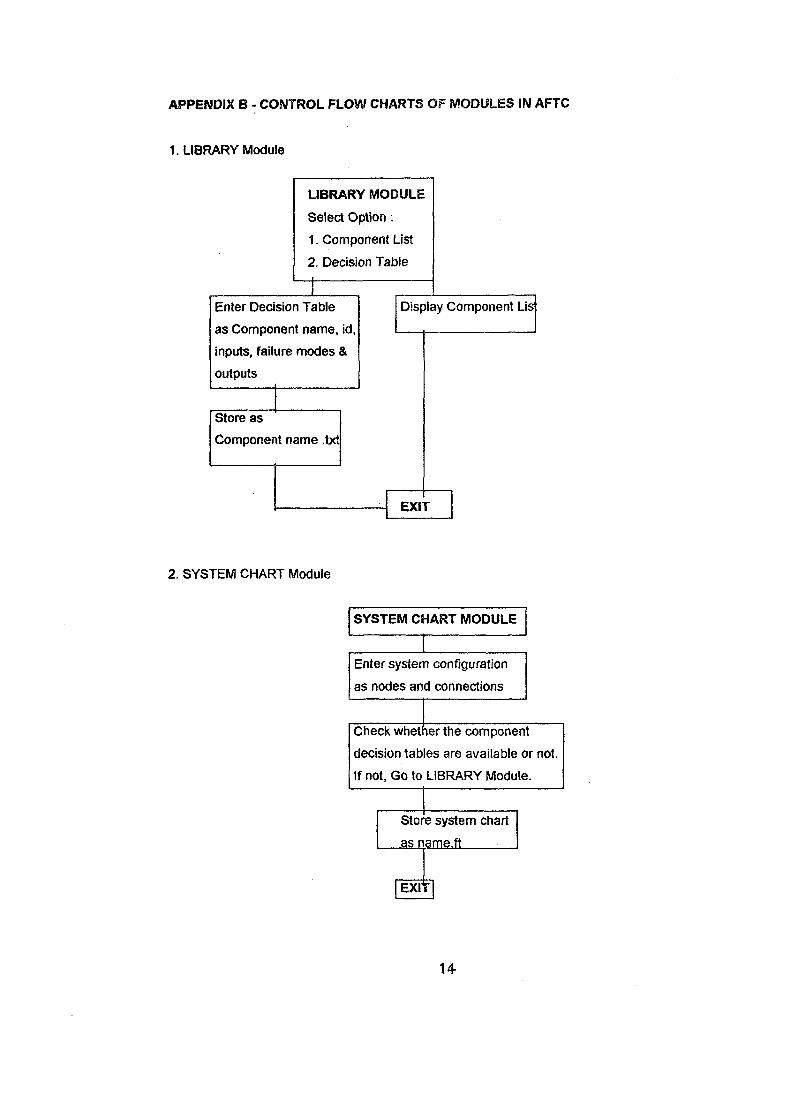
APPENDIX 8 - CONTROL FLOW CHARTS OF MODULES IN AFTC
1. LIBRARY Module
LIBRARY MODULE
Select Option:
1. Component List
2. Decision Table
Enter Decision Table
as Component name, id,
inputs, failure modes &
outputs
Store as
Component name .txt
Display Component Lis
EXIT
2. SYSTEM CHART Module
SYSTEM CHART MODULE
Enter system configuration
as nodes and connections
Check whether the component
decision tables are available or not.
If not, Go to LIBRARY Module.
Store system chart
as name.ft
EXIY
14
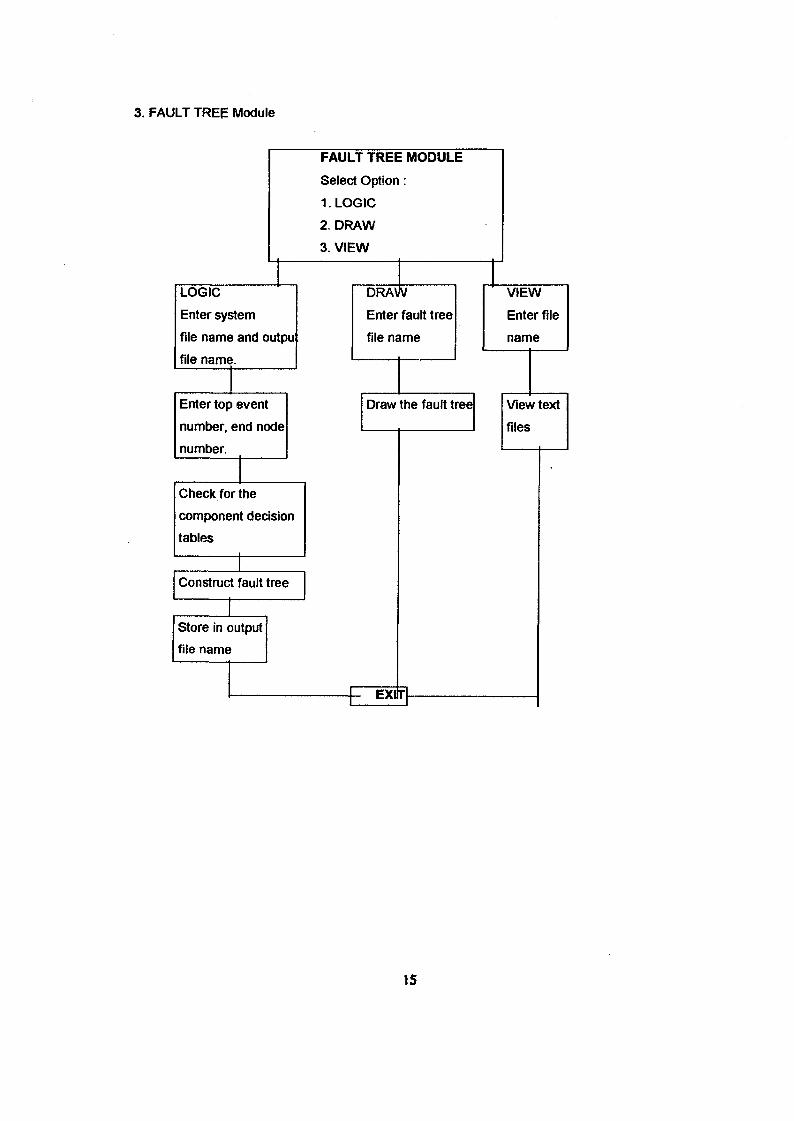
3. FAULT TREE Module
FAULT TREE MODULE
Select Option :
1. LOGIC
2. DRAW
3. VIEW
LOGIC
Enter system
file name and outpu
file name.
WV~DRA'
Enter fault tree
file name
Enter top event
number, end node
number.
VIEW
Enter file
name
Draw the fault tree
Check for the
component decision
tables
Construct fault tree
Store in output
file name
EXM
View text
files
IS

Published by: Dr. Vijai Kumar, Head Library & Information Services DivisionBhabha Atomic Research Centre, Mumbai - 400 085, India.


![Fault Tree Diagram[1]](https://img.pdfslide.us/doc/110x75/55cf8c8a5503462b138d7284/fault-tree-diagram1.jpg)