Embed Size (px)
Citation preview
AFFIRMATIVE ACTION STATUS AFFIRMATIVE ACTION STATUS REPORT TO THE BOARD OF REPORT TO THE BOARD OF
GOVERNORSGOVERNORSPresented by
Christopher Jones, DirectorOffice of Equal Opportunity
Office of Equal Opportunity February 2010

OVERVIEW
Office of Equal Opportunity February 2010
WSU is a national leader in providing equal opportunity to women and minorities
-The MMBDC awarded WSU the Corporation of the Year-Education Sector Award for the eighth time.
-Excluding HBCUs, WSU is in the top 10 of minority enrollment.
-During 2008, WSU was represented on the Editorial Board of the Affirmative Action Register, a national equal opportunity publication at the forefront of diversity recruiting.
Office of Equal Opportunity February 2010
-University Employment -Complaint Processing -University Purchasing and Supplier Diversity
Topic Areas:
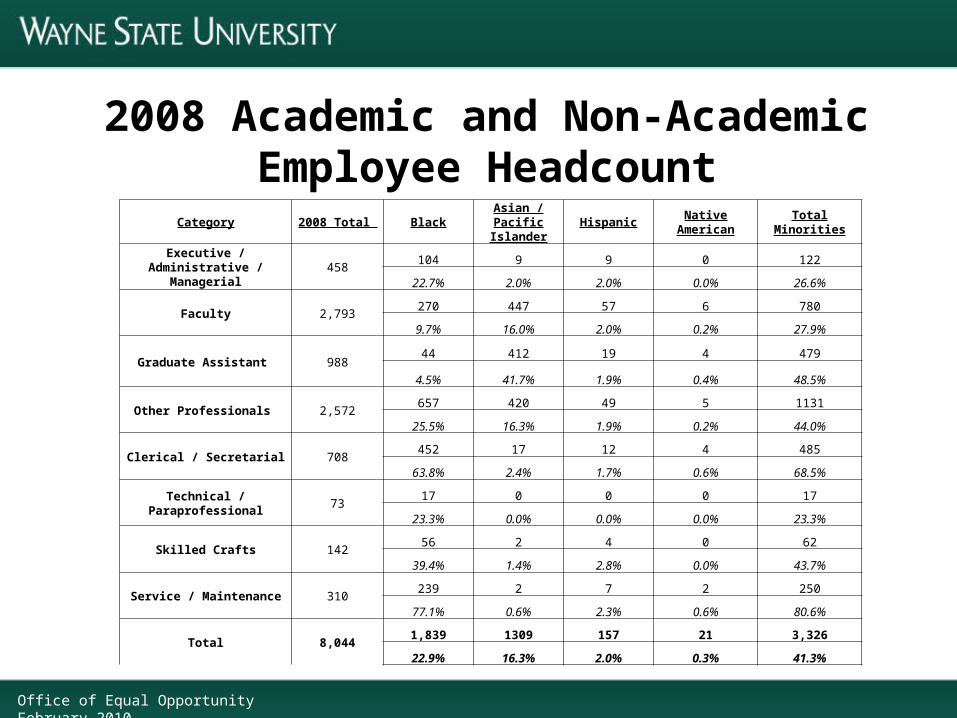
2008 Academic and Non-Academic Employee Headcount
Office of Equal Opportunity February 2010
Category 2008 Total BlackAsian / Pacific
IslanderHispanic Native American Total Minorities
Executive / Administrative / Managerial
458104 9 9 0 122
22.7% 2.0% 2.0% 0.0% 26.6%
Faculty 2,793270 447 57 6 780
9.7% 16.0% 2.0% 0.2% 27.9%
Graduate Assistant 98844 412 19 4 479
4.5% 41.7% 1.9% 0.4% 48.5%
Other Professionals 2,572657 420 49 5 1131
25.5% 16.3% 1.9% 0.2% 44.0%
Clerical / Secretarial 708452 17 12 4 485
63.8% 2.4% 1.7% 0.6% 68.5%
Technical / Paraprofessional 7317 0 0 0 17
23.3% 0.0% 0.0% 0.0% 23.3%
Skilled Crafts 14256 2 4 0 62
39.4% 1.4% 2.8% 0.0% 43.7%
Service / Maintenance 310239 2 7 2 250
77.1% 0.6% 2.3% 0.6% 80.6%
Total 8,0441,839 1309 157 21 3,326
22.9% 16.3% 2.0% 0.3% 41.3%
Office of Equal Opportunity February 2010
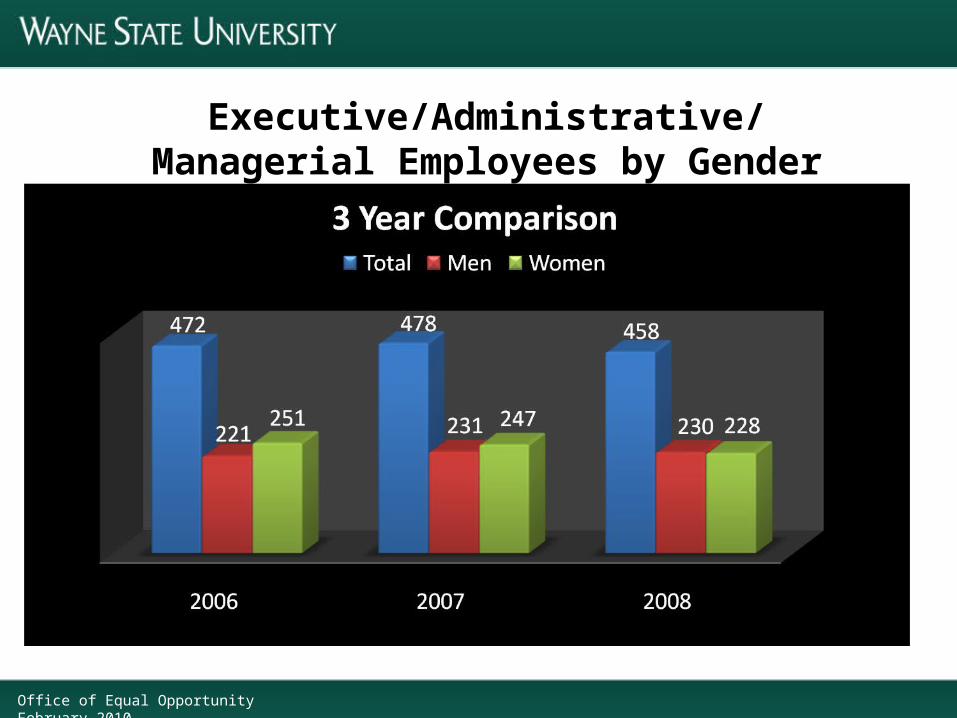
Executive/Administrative/Managerial Employees by Gender
Executive/Administrative/Managerial Employees

Office of Equal Opportunity February 2010
Executive/Administrative/Managerial Employees by Race
Executive/Administrative/Managerial Employees
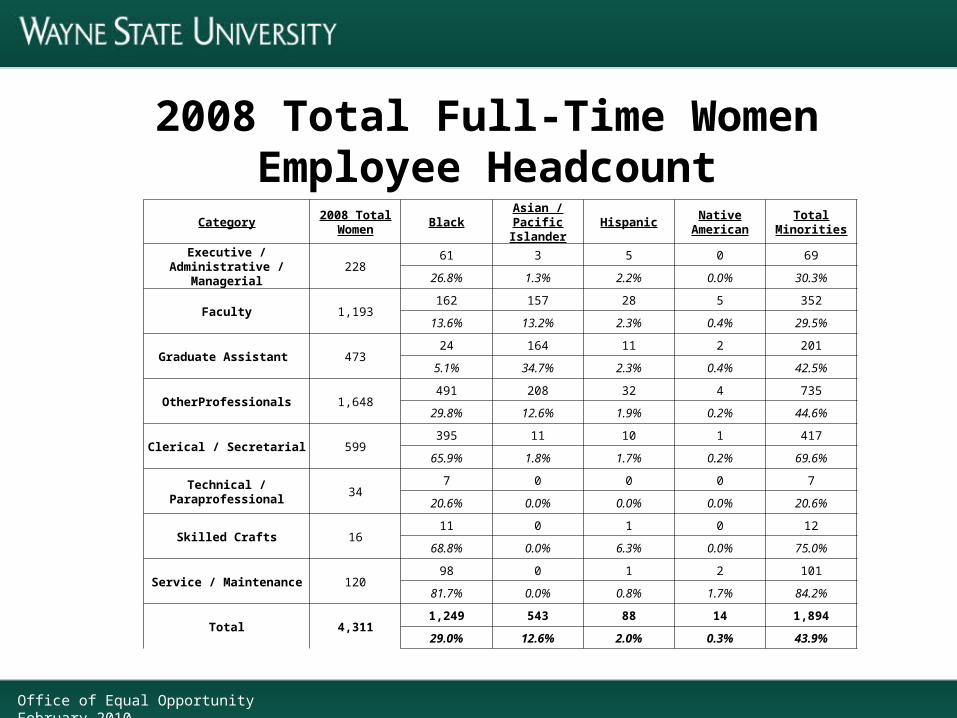
2008 Total Full-Time Women Employee Headcount
Office of Equal Opportunity February 2010
Category2008 Total
WomenBlack
Asian / Pacific Islander
HispanicNative
AmericanTotal Minorities
Executive / Administrative / Managerial
22861 3 5 0 69
26.8% 1.3% 2.2% 0.0% 30.3%
Faculty 1,193162 157 28 5 352
13.6% 13.2% 2.3% 0.4% 29.5%
Graduate Assistant 47324 164 11 2 201
5.1% 34.7% 2.3% 0.4% 42.5%
OtherProfessionals 1,648491 208 32 4 735
29.8% 12.6% 1.9% 0.2% 44.6%
Clerical / Secretarial 599395 11 10 1 417
65.9% 1.8% 1.7% 0.2% 69.6%
Technical / Paraprofessional 347 0 0 0 7
20.6% 0.0% 0.0% 0.0% 20.6%
Skilled Crafts 1611 0 1 0 12
68.8% 0.0% 6.3% 0.0% 75.0%
Service / Maintenance 12098 0 1 2 101
81.7% 0.0% 0.8% 1.7% 84.2%
Total 4,3111,249 543 88 14 1,894
29.0% 12.6% 2.0% 0.3% 43.9%
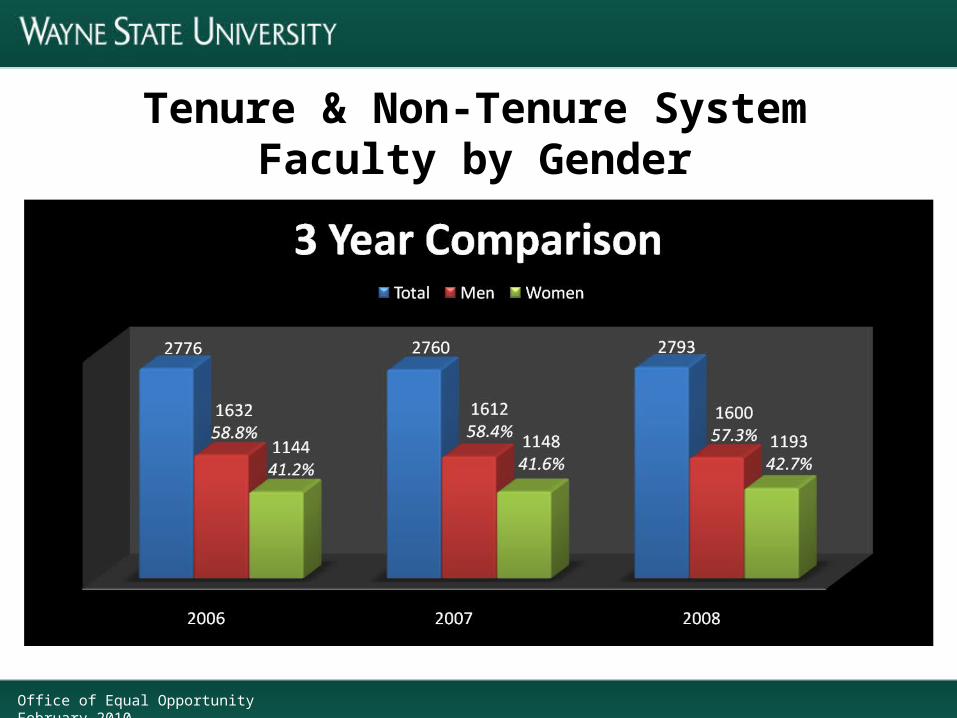
Tenure & Non-Tenure System Faculty by Gender
Office of Equal Opportunity February 2010
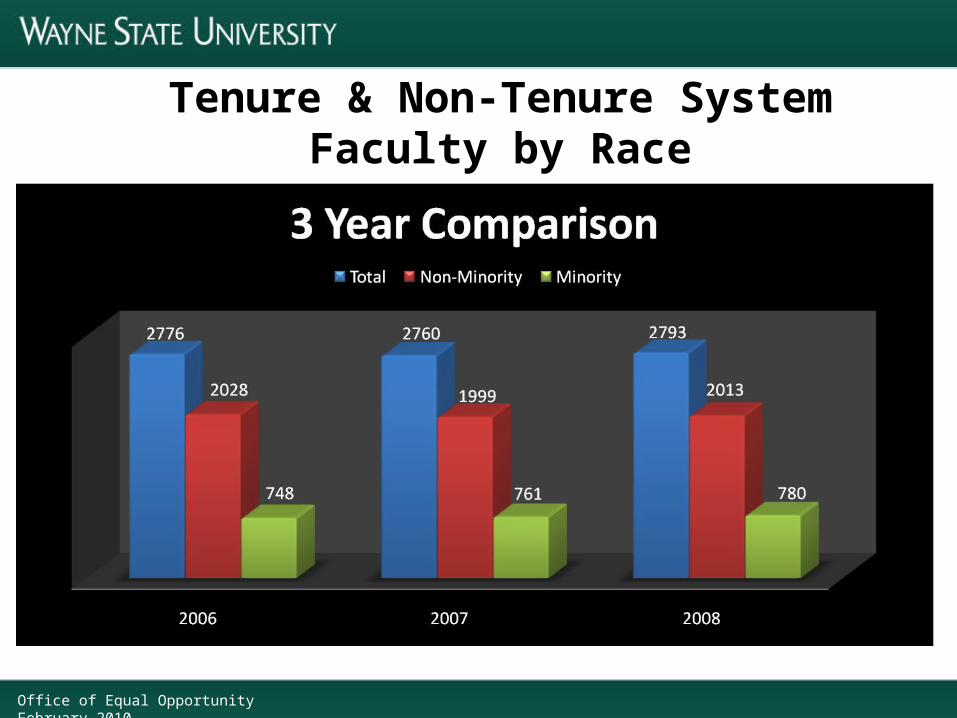
Tenure & Non-Tenure System Faculty by Race
Office of Equal Opportunity February 2010

Faculty by Rank 3 Year Comparison
Office of Equal Opportunity February 2010

Office of Equal Opportunity February 2010
Faculty by Rank 3 Year Comparison

Office of Equal Opportunity February 2010
Faculty by Rank 3 Year Comparison
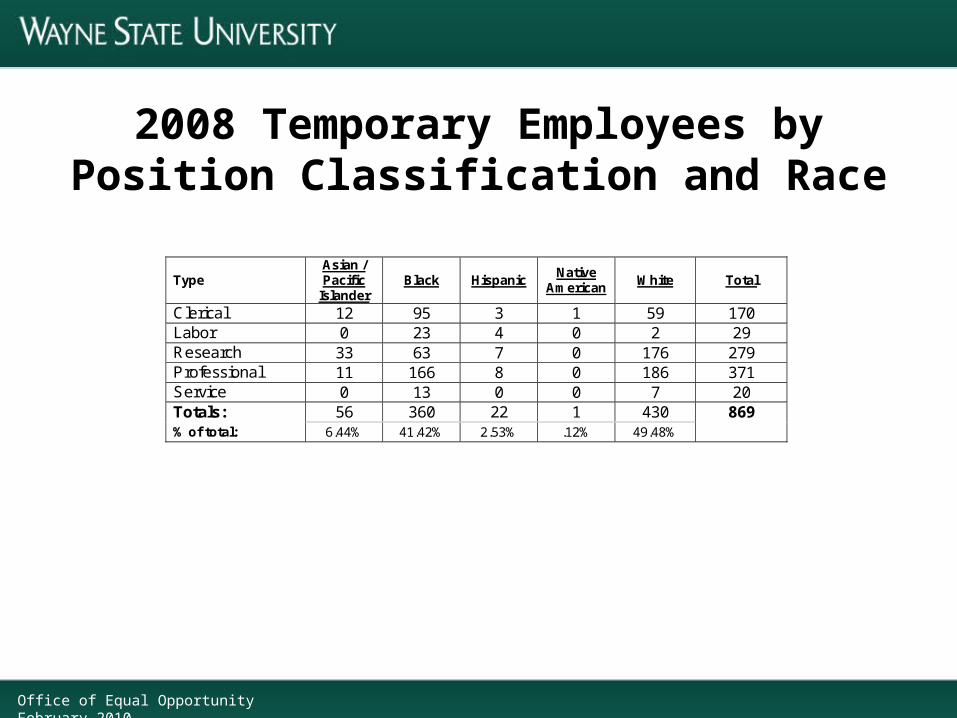
2008 Temporary Employees by Position Classification and Race
Type Asian / Pacific
Islander Black Hispanic
Native American
White Total
Clerical 12 95 3 1 59 170 Labor 0 23 4 0 2 29 Research 33 63 7 0 176 279 Professional 11 166 8 0 186 371 Service 0 13 0 0 7 20 Totals: 56 360 22 1 430 869 % of total: 6.44% 41.42% 2.53% .12% 49.48%
Office of Equal Opportunity February 2010

2008 Temporary Employees by Position Classification and Gender
Type Female Male Total Clerical 127 43 170 Labor 11 18 29 Professional 228 143 371 Research 204 75 279 Service 9 11 20 Totals: 579 290 869 % of total: 66.62% 33.37%
Office of Equal Opportunity February 2010
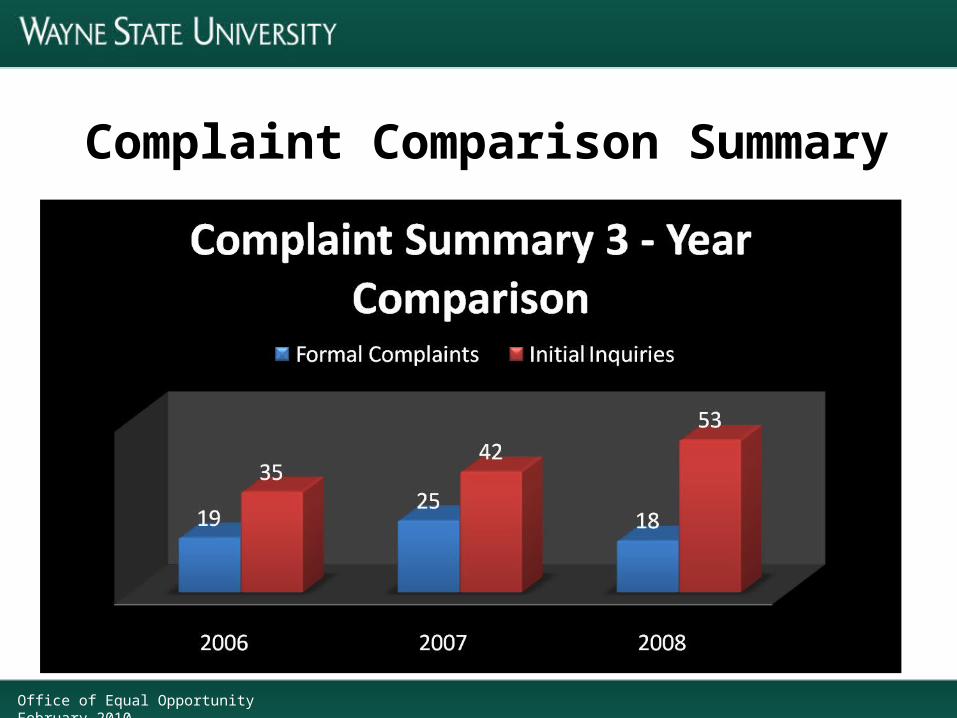
Complaint Comparison Summary
Office of Equal Opportunity February 2010
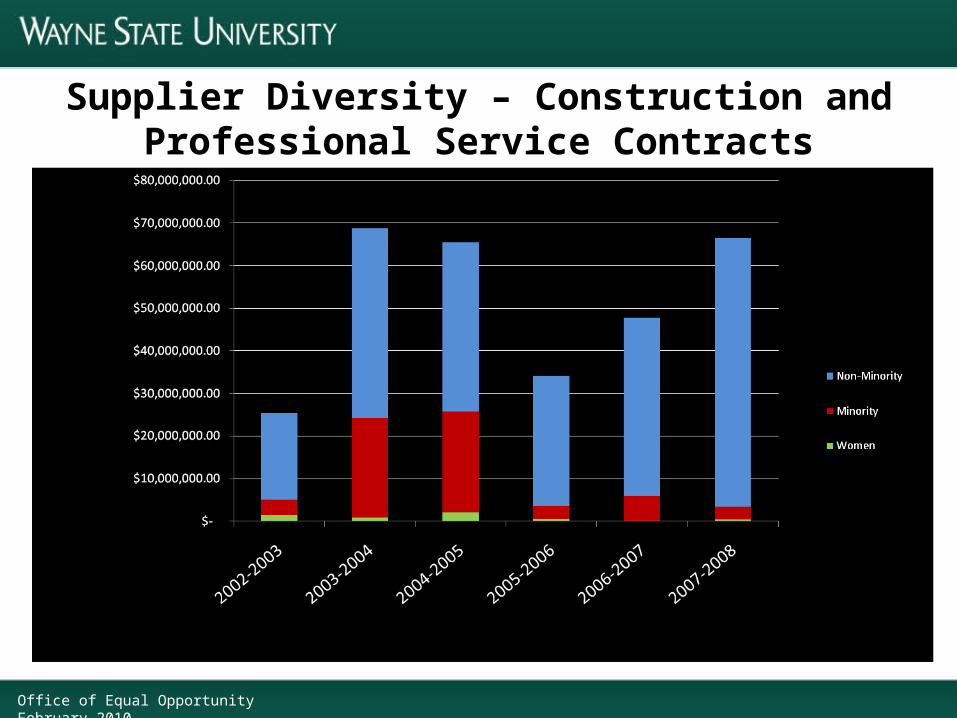
Supplier Diversity – Construction and Professional Service Contracts
Office of Equal Opportunity February 2010
Total: $66,600,000
Office of Equal Opportunity February 2010
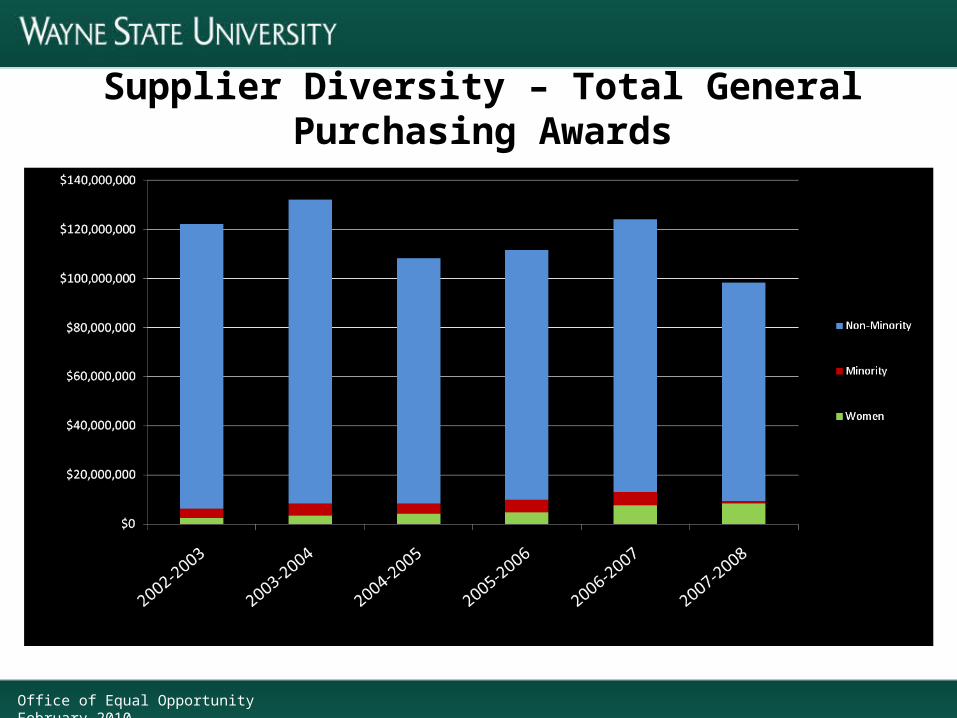
Supplier Diversity – Total General Purchasing Awards
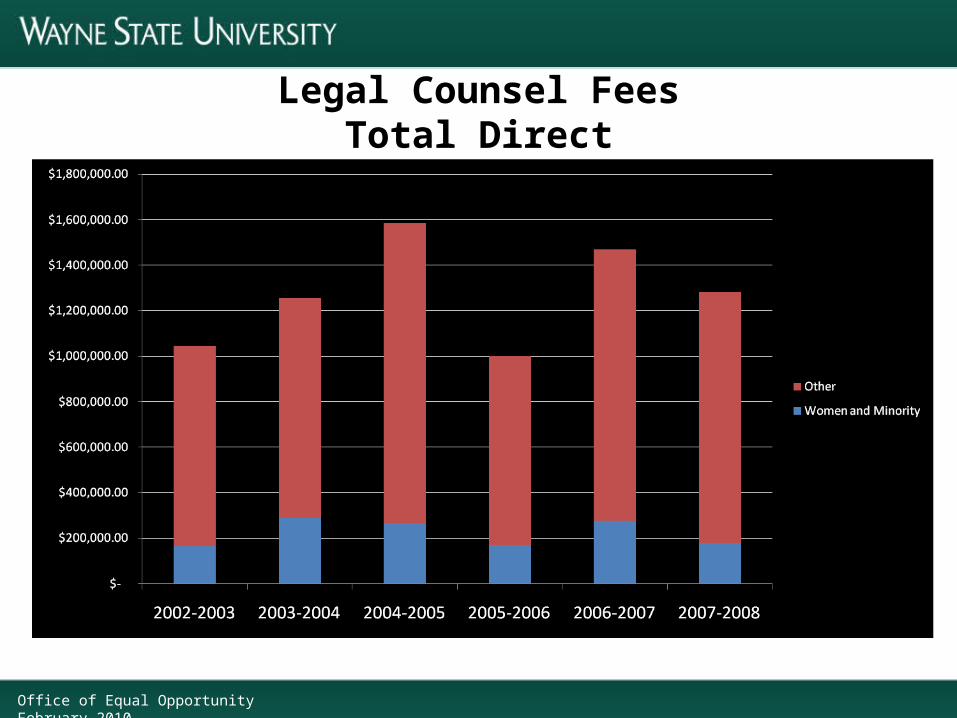
Legal Counsel FeesTotal Direct
Office of Equal Opportunity February 2010

Office of Equal Opportunity February 2010
MUSIC Insurance Expenditures
CONCLUSION
Office of Equal Opportunity February 2010