Embed Size (px)
Citation preview
2012
AFFIRMATIVE ACTION STATUS REPORT
Presented to the Wayne State University Board of Governors
Louis Lessem, Vice President and General Counsel Christopher Jones, Director, Office of Equal Opportunity
Wayne State University is an Affirmative Action/Equal Opportunity Institution. 2
TABLE OF CONTENTS
PREFACE, President Allan D. Gilmour ...................................................................................... 3
EXECUTIVE SUMMARY………………………………………………………………………....4
INTRODUCTION ................................................................................................................ 5
REPORTING REQUIREMENTS ........................................................................................ 5
I. UNIVERSITY EMPLOYMENT ....................................................................................... 6
A. FULL-TIME ACADEMIC AND NON-ACADEMIC EMPLOYMENT.................... ………..7
B. FACULTY EMPLOYMENT .................................................................................................... 9
C. UNIVERSITY NON-ACADEMIC EMPLOYEES (STAFF) ............................................... 15
D. TEMPORARY POSITIONS ....................................................................................... 16
E. COMPARISON WITH OTHER UNIVERSITIES……………………………… ............... 17
II. UNIVERSITY COMPLAINTS ..................................................................................... 34
III. WAYNE STATE UNIVERSITY SUPPLIER DIVERSITY PROGRAM ............................ 36
IV. HIGHLIGHTS OF EQUAL OPPORTUNITY ACTIVITIES ............................................. 40
APPENDICES I. Definitions of EEO Categories II. Responsibility for Affirmative Action III. Definition of Terms IV. Academic Classifications V. Other Employee Definitions VI. 2011 Data Tables VII. Five Year Comparison Graphs VIII. 2011 - 2012 Comparison by Occupational Category
Wayne State University is an Affirmative Action/Equal Opportunity Institution. 3
OFFICE OF THE PRESIDENT 4200 Faculty/Administration Building 313.577.2230 / 313.577.3200 Fax
MEMORANDUM TO: Members of the Wayne State University Community FROM: Allan D. Gilmour, President SUBJECT: 2012 Affirmative Action Status Report to the Board of Governors DATE: June 26, 2013 Wayne State University has a strong tradition of support for the principles of equal opportunity, non-discrimination and affirmative action. As a university of opportunity, we pride ourselves on providing educational opportunities for a diverse student body that varies widely in terms of age, race, ethnicity and economic status. Diversity among our faculty, students and staff is a major source of our intellectual vitality and innovative spirit. We believe that a broad spectrum of informed perspectives enhances the educational and work experience on campus, and prepares our graduates to succeed in an increasingly interdependent and multicultural world. Wayne State strives to be a place where people from varied walks of life can reach their full potential. Our commitment to the core values of diversity and inclusion are essential to the fulfillment of our mission as a model urban research institution. The report that follows presents the status of Wayne’s affirmative action efforts for 2012, summarizes our achievements, and provides direction for our future.
Wayne State University is an Affirmative Action/Equal Opportunity Institution. 4
EXECUTIVE SUMMARY The University’s Affirmative Action Status Report (AASR) serves as the definitive report on the state of diversity and inclusion and provides the collection of data regarding employment of academic and non-academic staff, discrimination and harassment complaint processing, and the University’s efforts at supplier diversity. This summary is based on the data presented in the 2012 AASR. EMPLOYMENT Overall, minorities comprise slightly over 41% of Wayne’s workforce and are represented in 90 percent of Wayne State University’s 254 departments and in 99% of the departments that employ 10 or more people. Women represent over 52% of Wayne’s full-time workforce, and are represented in 94% of all departments and 99% of all departments that employ 10 or more people. Minorities make up 29% of tenured faculty at Wayne and women comprise over 32% of tenured faculty. Among non-academic staff, nearly 47% are minorities and 59% are women. COMPLAINTS The Office of Equal Opportunity is responsible for investigating complaints that arise under the University’s internal policies of prohibiting discrimination and sexual harassment. The OEO also serves as the point of contact for complaints that are filed with external agencies, like the Equal Employment Opportunity Commission or the Michigan Department of Civil Rights. Whether arising from an internal claim or an external agency, these charges are classified as formal complaints. During 2012, there were a total of 33 formal complaints. The top three areas of claims were race, disability, and sex. SUPPLIER DIVERSITY Minority and women-owned businesses participate in various contracting opportunities through the Supplier Diversity Program. During fiscal year 2012, overall expenditures increased by 4%. Minority-owned businesses were awarded 5% of overall expenditures and women-owned businesses were awarded nearly 6% of overall expenditures.
Wayne State University is an Affirmative Action/Equal Opportunity Institution. 5
INTRODUCTION
Wayne State University is a national leader in providing equal access and employment opportunities to women and minorities. This report highlights the efforts of our schools, colleges and divisions in providing equal opportunity in employment and in enhancing diversity throughout Wayne State University. We have achieved many successes, despite challenging economic conditions. Wayne State University is the most diverse public university in the State of Michigan. The 2012 Affirmative Action Status Report (“AASR”) to the Wayne State University Board of Governors demonstrates that Wayne State University continues to lead in ensuring equality of opportunity. Our continued commitment to diversity is a significant strength in the educational experience we provide to our students. This report presents a comprehensive, cross-divisional view of Wayne State University’s performance in this important area. REPORTING REQUIREMENTS This report is prepared pursuant to Board of Governors statute (WSUCA 2.28.01.070 - 120), which requires that annually, a report be made to the Board on Wayne State University’s affirmative action efforts. In many respects, the report is derived from data compiled pursuant to federal reporting requirements. The Office of Federal Contract Compliance Programs (“OFCCP”) in the U.S. Department of Labor, which regulates federal grant expenditures, requires that federal contractors with 50 or more employees who receive $50,000 or more in federal funds have an Affirmative Action Plan (“AAP”) and prepare an annual report to the contractor’s governing board and executives. This report includes information from four major areas of University activity, with national and/or regional comparisons where available. These areas are (I) overall University employment, including detailed information on full-time, academic and non-academic staff and supplemental information on part-time and temporary employees, and also including a comparison of Wayne and other universities in the state and around the country; (II) internal and external discrimination and harassment complaints; (III) the Wayne State University Supplier Diversity Program; and (IV) highlights of campus affirmative action and equal opportunity activities. This report was compiled by the Office of Equal Opportunity (“OEO”) with input from and the collaborative efforts of many units, including the Office of the General Counsel, Office of the Provost, the Office of Budget, Planning and Analysis, and the Division of Finance and Facilities Management. Information regarding staffing levels and discrimination complaint data contained in this report are based on personnel actions reported on a calendar year basis from January 1, 2012 to December 31, 2012. Data related to supplier diversity and external financial management is reported on a fiscal year basis beginning on October 1, 2011 and ending September 30, 2012. The report includes additional headcount data tables for the previous twelve month period (January 1, 2011 – December 31, 2011) at Appendix VI. Graphs of five-year comparisons on staffing levels have been provided in Appendix VII.
Wayne State University is an Affirmative Action/Equal Opportunity Institution. 6
Finally, the report also includes a breakdown of Minority and Women Faculty by College/School/Division in Section B, Table 8. I. UNIVERSITY EMPLOYMENT Wayne State University is a major hiring force in southeastern Michigan. As of December 31, 2012, Wayne employed 7,962 persons, both full and part time, including temporary employees. While the report’s focus is on full time employees in permanent positions with the University, the report includes a snapshot of temporary employees as well. Wayne employed 5,105 persons in full time positions. Wayne recruits approximately 60% of its workforce from a four-county statistical area consisting of Macomb, Oakland, Washtenaw and Wayne counties. Wayne recruits its faculty from a national labor pool that is specific to individuals who hold doctoral and specialty degrees (Ph.D., M.F.A, etc.). Executive and some management-category positions also are recruited from a national labor employment pool. For the most part, other staff is recruited from a local labor pool. Wayne also has a large number of student employees. Wayne employs undergraduate students as student assistants through college work-study and other programs. Graduate students frequently are employed as graduate assistants and sometimes as part-time faculty. In addition, temporary employees are employed at Wayne throughout the year. The majority of these employees work in professional or research classifications. Minorities and women are represented throughout all levels of the workforce at Wayne. Over 26% of executive and managerial positions are occupied by minorities and women are represented by over 51% of these positions. In addition, minorities hold 42% of those professional jobs that require a college degree and over 60% of these positions are held by women. The workforce at Wayne exceeds the regional availability in the percentage of women, Black and Asian/Pacific Islanders. Among total full-time employees, just over 52% of Wayne’s employees are female, compared to the regional average of just below 47%. Just over 23% of Wayne’s full-time employees are Black, compared to 20.4% regional availability, and nearly 15% are Asian/Pacific Islanders, which is over four times the regional availability. Wayne has been less successful in recruiting Hispanic and American Indian/Alaskan Native employees, and lags behind regional availability with regard to both of these minority groups.
Wayne State University is an Affirmative Action/Equal Opportunity Institution. 7
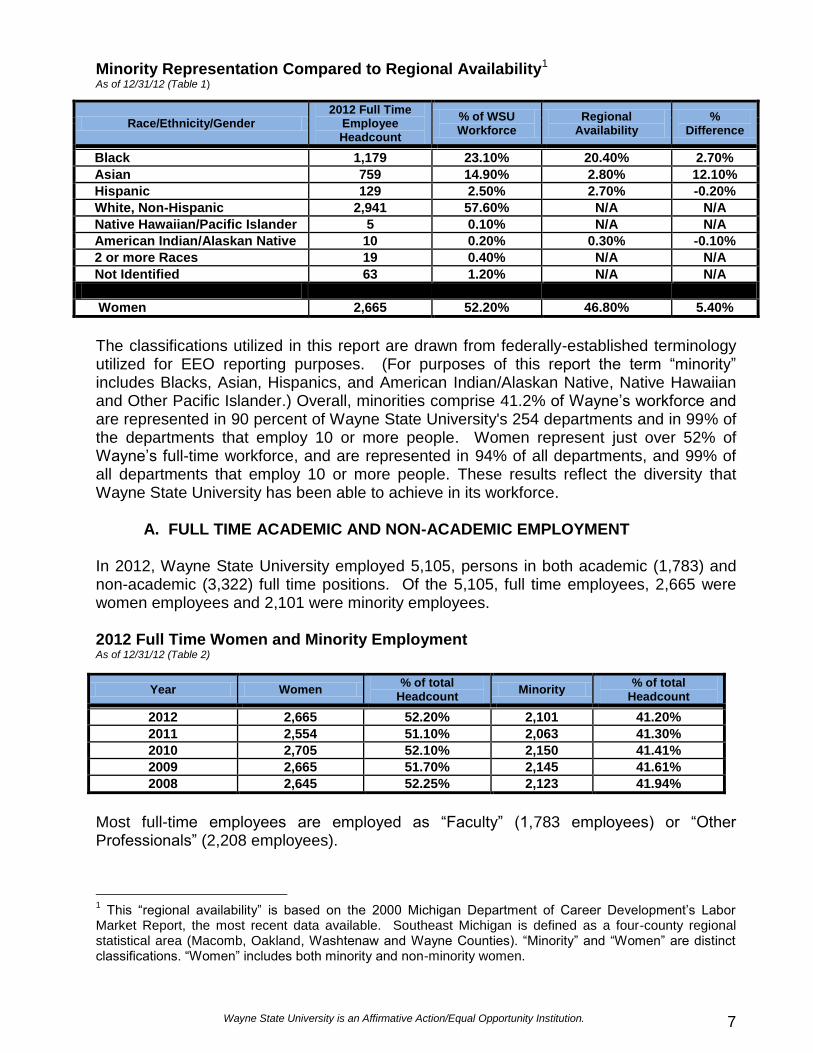
Minority Representation Compared to Regional Availability1 As of 12/31/12 (Table 1)
The classifications utilized in this report are drawn from federally-established terminology utilized for EEO reporting purposes. (For purposes of this report the term “minority” includes Blacks, Asian, Hispanics, and American Indian/Alaskan Native, Native Hawaiian and Other Pacific Islander.) Overall, minorities comprise 41.2% of Wayne’s workforce and are represented in 90 percent of Wayne State University's 254 departments and in 99% of the departments that employ 10 or more people. Women represent just over 52% of Wayne’s full-time workforce, and are represented in 94% of all departments, and 99% of all departments that employ 10 or more people. These results reflect the diversity that Wayne State University has been able to achieve in its workforce.
A. FULL TIME ACADEMIC AND NON-ACADEMIC EMPLOYMENT
In 2012, Wayne State University employed 5,105, persons in both academic (1,783) and non-academic (3,322) full time positions. Of the 5,105, full time employees, 2,665 were women employees and 2,101 were minority employees. 2012 Full Time Women and Minority Employment As of 12/31/12 (Table 2)
Year Women % of total
Headcount Minority
% of total Headcount
2012 2,665 52.20% 2,101 41.20%
2011 2,554 51.10% 2,063 41.30%
2010 2,705 52.10% 2,150 41.41%
2009 2,665 51.70% 2,145 41.61%
2008 2,645 52.25% 2,123 41.94%
Most full-time employees are employed as “Faculty” (1,783 employees) or “Other Professionals” (2,208 employees).
1 This “regional availability” is based on the 2000 Michigan Department of Career Development’s Labor
Market Report, the most recent data available. Southeast Michigan is defined as a four-county regional statistical area (Macomb, Oakland, Washtenaw and Wayne Counties). “Minority” and “Women” are distinct classifications. “Women” includes both minority and non-minority women.
Race/Ethnicity/Gender 2012 Full Time
Employee Headcount
% of WSU Workforce
Regional Availability
% Difference
Black 1,179 23.10% 20.40% 2.70%
Asian 759 14.90% 2.80% 12.10%
Hispanic 129 2.50% 2.70% -0.20%
White, Non-Hispanic 2,941 57.60% N/A N/A
Native Hawaiian/Pacific Islander 5 0.10% N/A N/A
American Indian/Alaskan Native 10 0.20% 0.30% -0.10%
2 or more Races 19 0.40% N/A N/A
Not Identified 63 1.20% N/A N/A
Women 2,665 52.20% 46.80% 5.40%
Wayne State University is an Affirmative Action/Equal Opportunity Institution. 8
2012 Total Full Time Academic and Non Academic Employee Headcount As of 12/31/12 (Table 3)
Category 2012
Total Black Asian Hispanic
American
Indian/
Alaskan
Native
Native
Hawaiian/
Pacific
Islander
2 or
More
Races
Total
Minorities Women
119 373 41 4 2 6 545 700
6.7% 20.9% 2.3% 0.2% 0.1% 0.3% 30.6% 39.3%
49 12 4 1 0 0 66 130
19.4% 4.8% 1.6% 0.4% 0.0% 0.0% 26.2% 51.6%
487 366 63 2 3 10 931 1,330
22.1% 16.6% 2.9% 0.1% 0.1% 0.5% 42.2% 60.2%
12 1 1 1 0 0 15 34
18.2% 0.0% 0.0% 0.0% 0.0% 0.0% 22.7% 51.5%
259 3 9 1 0 2 274 350
66.1% 0.8% 2.3% 0.3% 0.0% 0.5% 69.9% 89.3%
35 2 1 0 0 0 38 5
32.1% 1.8% 0.9% 0.0% 0.0% 0.0% 34.9% 4.6%
218 2 10 1 0 1 232 116
73.9% 0.7% 3.4% 0.3% 0.0% 0.3% 78.6% 39.3%
1,179 759 129 10 5 19 2,101 2,665
23.1% 14.9% 2.5% 0.2% 0.1% 0.4% 41.2% 52.2%Total
Executive /
Administrative /
Managerial
Faculty
Clerical / Secretarial
Technical /
Paraprofessional
Skilled Crafts
Service / Maintenance
Other Professionals
109
295
5,105
1,783
252
2,208
66
392
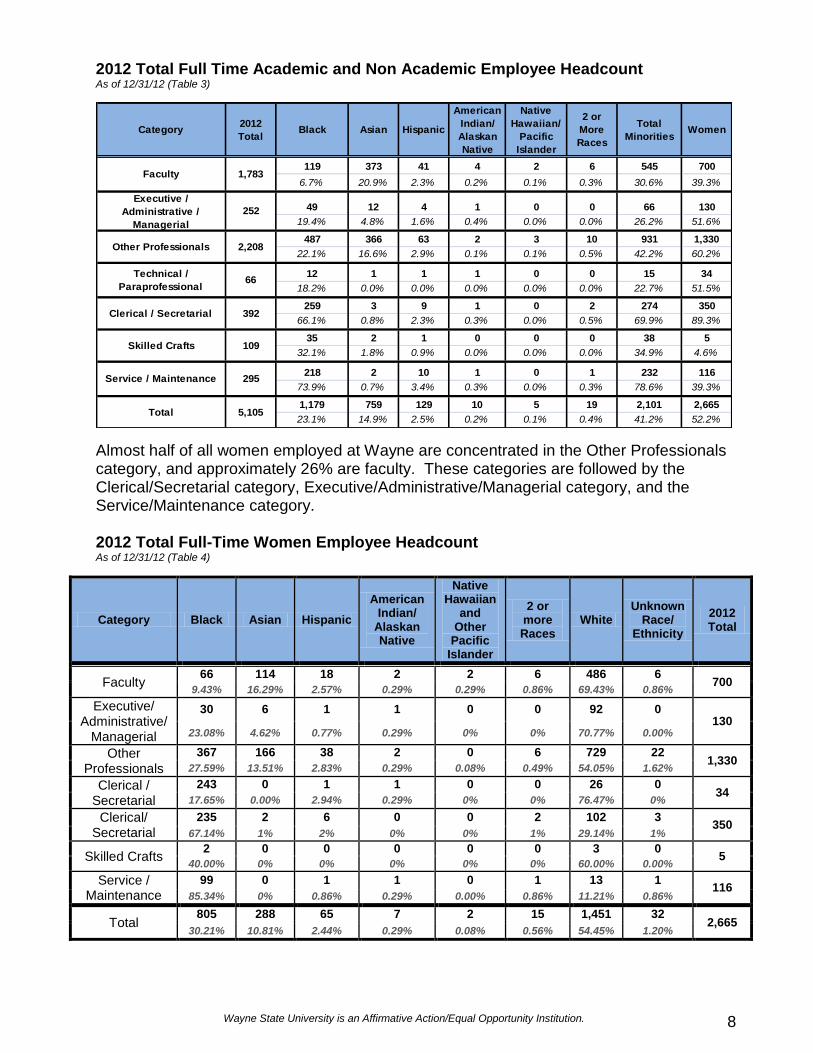
Almost half of all women employed at Wayne are concentrated in the Other Professionals category, and approximately 26% are faculty. These categories are followed by the Clerical/Secretarial category, Executive/Administrative/Managerial category, and the Service/Maintenance category. 2012 Total Full-Time Women Employee Headcount As of 12/31/12 (Table 4)
Category Black Asian Hispanic
American Indian/
Alaskan Native
Native Hawaiian
and Other
Pacific Islander
2 or more Races
White Unknown
Race/ Ethnicity
2012 Total
Faculty 66 114 18 2 2 6 486 6
700 9.43% 16.29% 2.57% 0.29% 0.29% 0.86% 69.43% 0.86%
Executive/ Administrative/
Managerial
30 6 1 1 0 0 92 0 130
23.08% 4.62% 0.77% 0.29% 0% 0% 70.77% 0.00%
Other Professionals
367 166 38 2 0 6 729 22 1,330
27.59% 13.51% 2.83% 0.29% 0.08% 0.49% 54.05% 1.62%
Clerical / Secretarial
243 0 1 1 0 0 26 0 34
17.65% 0.00% 2.94% 0.29% 0% 0% 76.47% 0%
Clerical/ Secretarial
235 2 6 0 0 2 102 3 350
67.14% 1% 2% 0% 0% 1% 29.14% 1%
Skilled Crafts 2 0 0 0 0 0 3 0
5 40.00% 0% 0% 0% 0% 0% 60.00% 0.00%
Service / Maintenance
99 0 1 1 0 1 13 1 116
85.34% 0% 0.86% 0.29% 0.00% 0.86% 11.21% 0.86%
Total 805 288 65 7 2 15 1,451 32
2,665 30.21% 10.81% 2.44% 0.29% 0.08% 0.56% 54.45% 1.20%
Wayne State University is an Affirmative Action/Equal Opportunity Institution. 9
B. FACULTY EMPLOYMENT Wayne State University strives to provide an efficient and user-friendly faculty hiring process that contributes to a diverse pool of qualified candidates. The Online Hiring System provides applicants with global access to employment opportunities 365 days of the year, 24 hours a day. The OEO is a resource for departments conducting academic searches by providing all academic departments with hiring plans to assist in identifying staffing needs and the OEO publishes information in the “Guide for Successful Searches.” Additionally, the OEO also provides diversity resources for publicizing employment opportunities and training in the faculty hiring process.
Wayne State University continues to promote diversity within its faculty. As shown in Table 5 below, the recruitment of women and minority faculty at Wayne State University has been successful in producing diversity within the faculty, despite difficult economic pressures and a highly competitive environment.
a. Full Time Faculty – Tenure/Tenure-Track and Non-Tenured
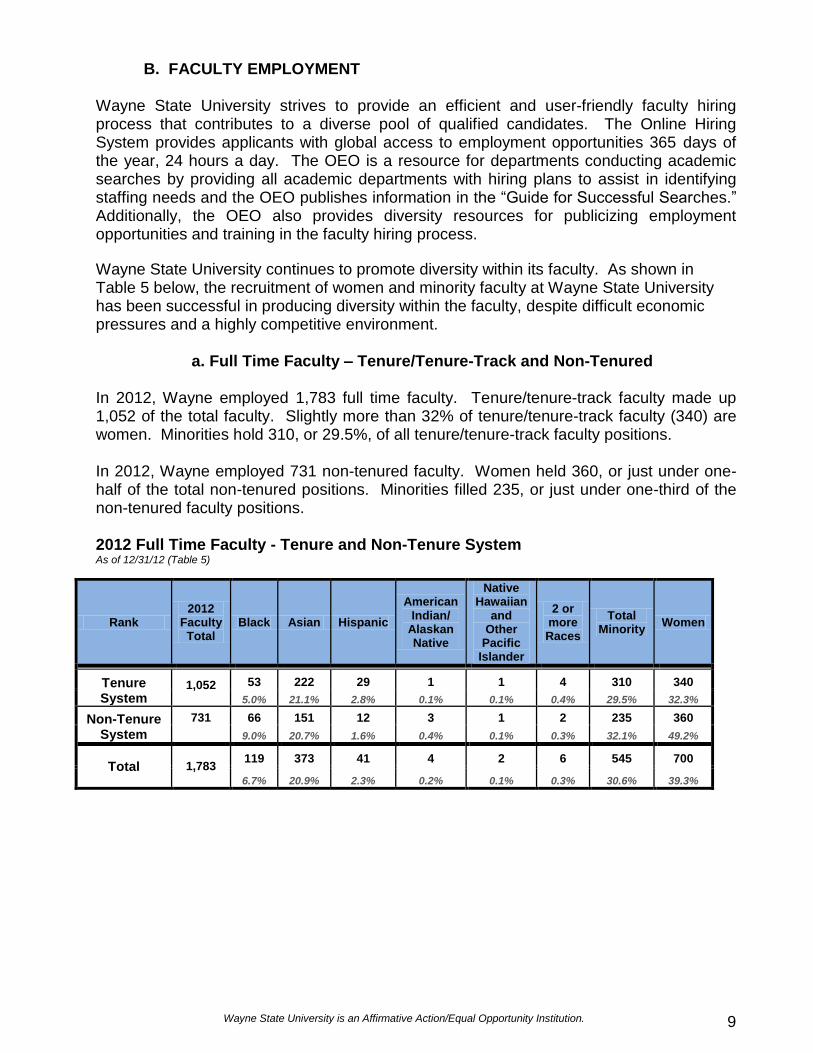
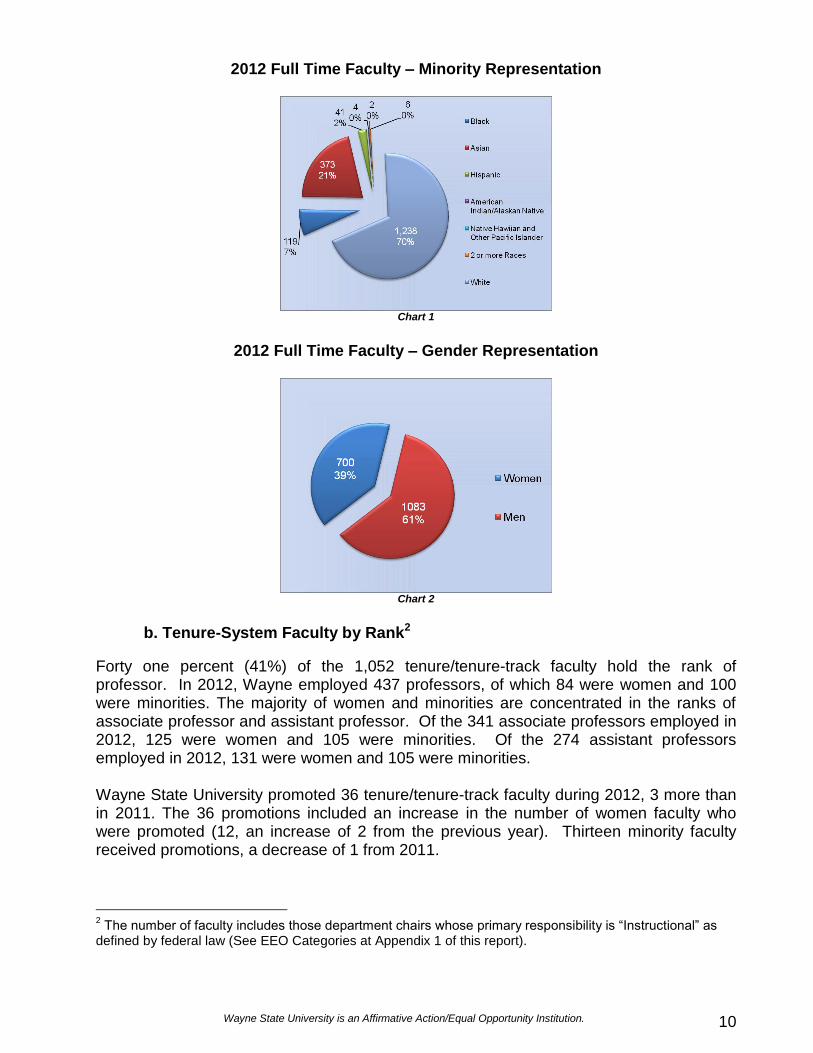
In 2012, Wayne employed 1,783 full time faculty. Tenure/tenure-track faculty made up 1,052 of the total faculty. Slightly more than 32% of tenure/tenure-track faculty (340) are women. Minorities hold 310, or 29.5%, of all tenure/tenure-track faculty positions. In 2012, Wayne employed 731 non-tenured faculty. Women held 360, or just under one-half of the total non-tenured positions. Minorities filled 235, or just under one-third of the non-tenured faculty positions. 2012 Full Time Faculty - Tenure and Non-Tenure System As of 12/31/12 (Table 5)
Rank 2012
Faculty Total
Black Asian Hispanic
American Indian/
Alaskan Native
Native Hawaiian
and Other
Pacific Islander
2 or more Races
Total Minority
Women
Tenure System
1,052
53 222 29 1 1 4 310 340
5.0% 21.1% 2.8% 0.1% 0.1% 0.4% 29.5% 32.3%
Non-Tenure System
731
66 151 12 3 1 2 235 360
9.0% 20.7% 1.6% 0.4% 0.1% 0.3% 32.1% 49.2%
Total 1,783
119 373 41 4 2 6 545 700
6.7% 20.9% 2.3% 0.2% 0.1% 0.3% 30.6% 39.3%
Wayne State University is an Affirmative Action/Equal Opportunity Institution. 10
2012 Full Time Faculty – Minority Representation
Chart 1
2012 Full Time Faculty – Gender Representation
Chart 2
b. Tenure-System Faculty by Rank2
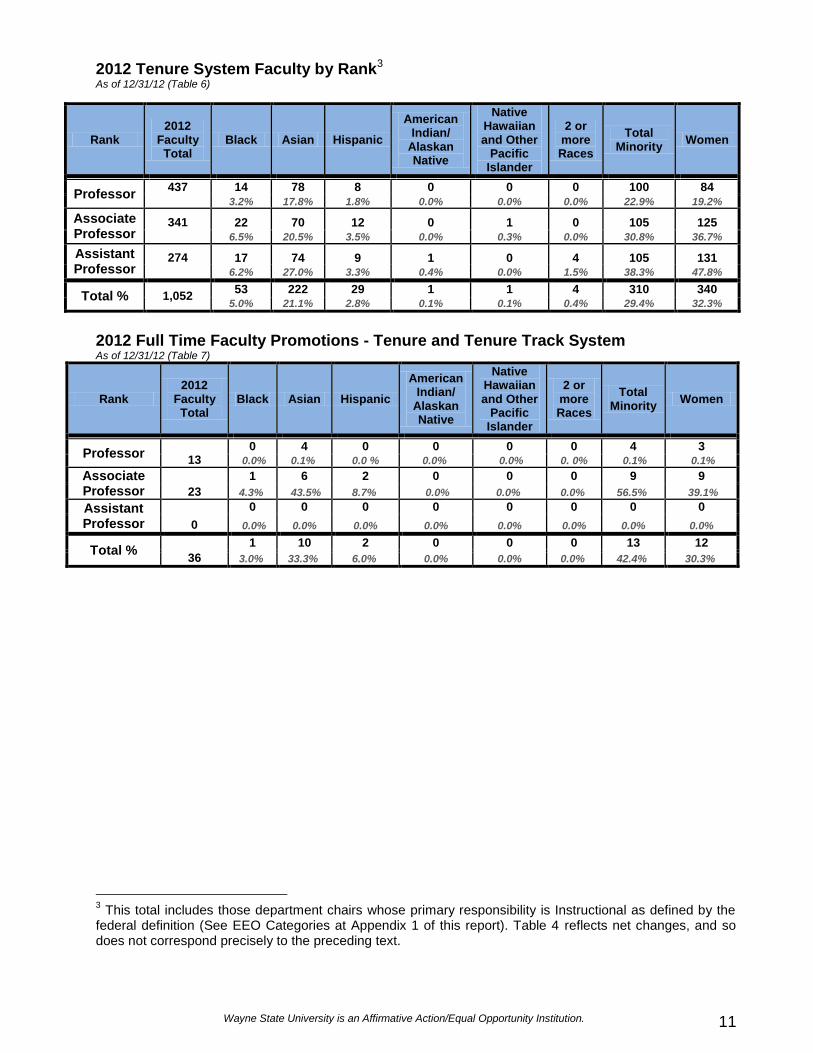
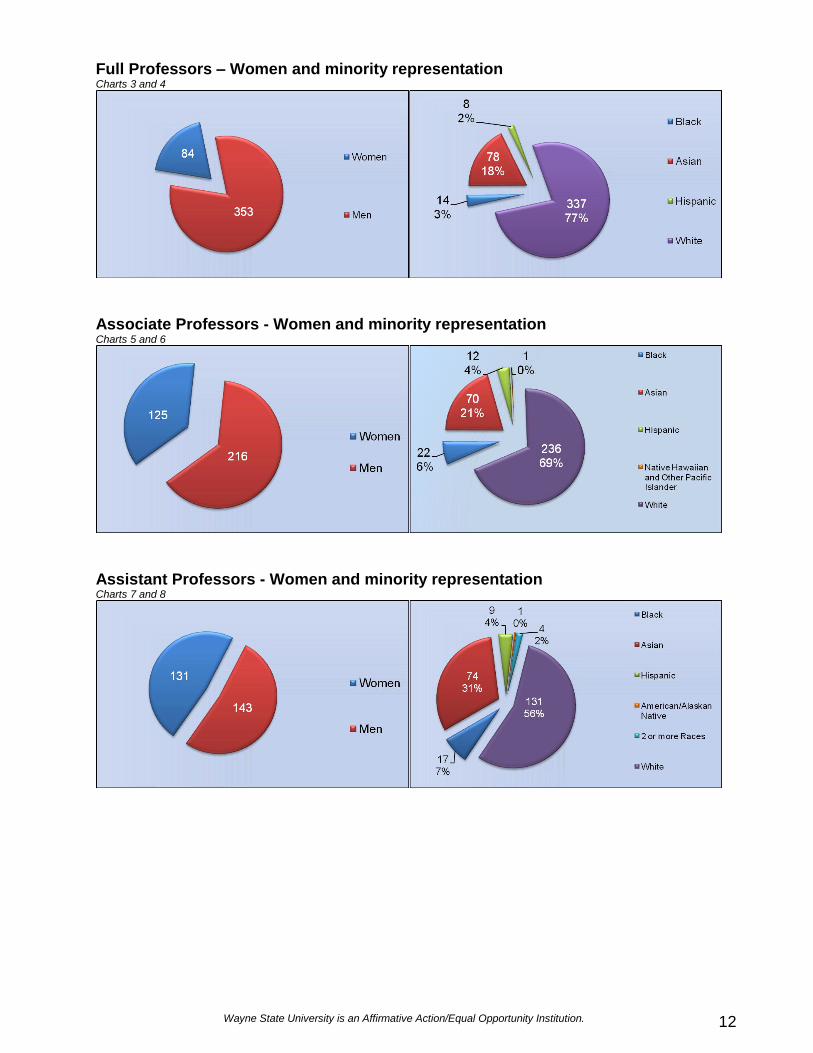
Forty one percent (41%) of the 1,052 tenure/tenure-track faculty hold the rank of professor. In 2012, Wayne employed 437 professors, of which 84 were women and 100 were minorities. The majority of women and minorities are concentrated in the ranks of associate professor and assistant professor. Of the 341 associate professors employed in 2012, 125 were women and 105 were minorities. Of the 274 assistant professors employed in 2012, 131 were women and 105 were minorities. Wayne State University promoted 36 tenure/tenure-track faculty during 2012, 3 more than in 2011. The 36 promotions included an increase in the number of women faculty who were promoted (12, an increase of 2 from the previous year). Thirteen minority faculty received promotions, a decrease of 1 from 2011.
2 The number of faculty includes those department chairs whose primary responsibility is “Instructional” as
defined by federal law (See EEO Categories at Appendix 1 of this report).
Wayne State University is an Affirmative Action/Equal Opportunity Institution. 11
2012 Tenure System Faculty by Rank3 As of 12/31/12 (Table 6)
Rank 2012
Faculty Total
Black Asian Hispanic
American Indian/
Alaskan Native
Native Hawaiian and Other
Pacific Islander
2 or more Races
Total Minority
Women
Professor 437
14 78 8 0 0 0 100 84
3.2% 17.8% 1.8% 0.0% 0.0% 0.0% 22.9% 19.2%
Associate Professor
341
22 70 12 0 1 0 105 125
6.5% 20.5% 3.5% 0.0% 0.3% 0.0% 30.8% 36.7%
Assistant Professor
274
17 74 9 1 0 4 105 131 6.2% 27.0% 3.3% 0.4% 0.0% 1.5% 38.3% 47.8%
Total % 1,052 53 222 29 1 1 4 310 340
5.0% 21.1% 2.8% 0.1% 0.1% 0.4% 29.4% 32.3%
2012 Full Time Faculty Promotions - Tenure and Tenure Track System As of 12/31/12 (Table 7)
Rank 2012
Faculty Total
Black Asian Hispanic
American Indian/
Alaskan Native
Native Hawaiian and Other
Pacific Islander
2 or more Races
Total Minority
Women
Professor 13
0 4 0 0 0 0 4 3 0.0% 0.1% 0.0 % 0.0% 0.0% 0. 0% 0.1% 0.1%
Associate Professor 23
1 6 2 0 0 0 9 9
4.3% 43.5% 8.7% 0.0% 0.0% 0.0% 56.5% 39.1%
Assistant Professor 0
0 0 0 0 0 0 0 0
0.0% 0.0% 0.0% 0.0% 0.0% 0.0% 0.0% 0.0%
Total % 36
1 10 2 0 0 0 13 12
3.0% 33.3% 6.0% 0.0% 0.0% 0.0% 42.4% 30.3%
3 This total includes those department chairs whose primary responsibility is Instructional as defined by the
federal definition (See EEO Categories at Appendix 1 of this report). Table 4 reflects net changes, and so does not correspond precisely to the preceding text.
Wayne State University is an Affirmative Action/Equal Opportunity Institution. 12
Full Professors – Women and minority representation Charts 3 and 4
Associate Professors - Women and minority representation Charts 5 and 6
Assistant Professors - Women and minority representation Charts 7 and 8
Wayne State University is an Affirmative Action/Equal Opportunity Institution. 13
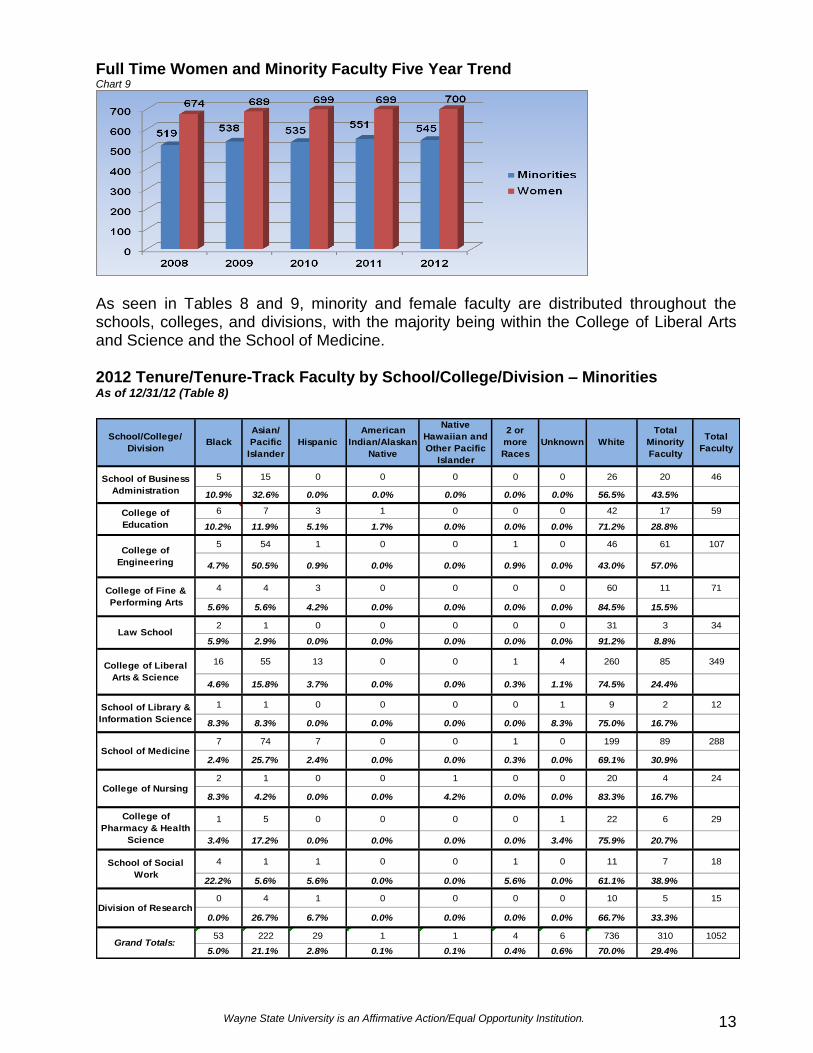
Full Time Women and Minority Faculty Five Year Trend Chart 9
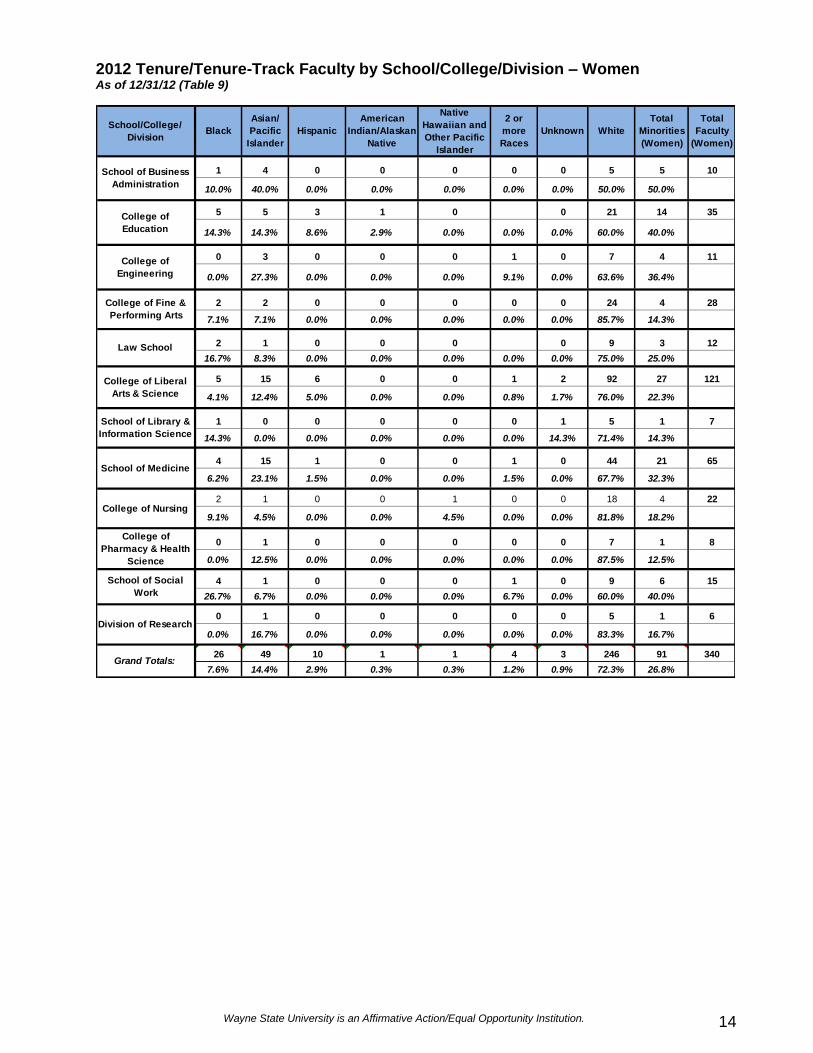
As seen in Tables 8 and 9, minority and female faculty are distributed throughout the schools, colleges, and divisions, with the majority being within the College of Liberal Arts and Science and the School of Medicine. 2012 Tenure/Tenure-Track Faculty by School/College/Division – Minorities As of 12/31/12 (Table 8)
5 15 0 0 0 0 0 26 20 46
10.9% 32.6% 0.0% 0.0% 0.0% 0.0% 0.0% 56.5% 43.5%
6 7 3 1 0 0 0 42 17 59
10.2% 11.9% 5.1% 1.7% 0.0% 0.0% 0.0% 71.2% 28.8%
5 54 1 0 0 1 0 46 61 107
4.7% 50.5% 0.9% 0.0% 0.0% 0.9% 0.0% 43.0% 57.0%
4 4 3 0 0 0 0 60 11 71
5.6% 5.6% 4.2% 0.0% 0.0% 0.0% 0.0% 84.5% 15.5%
2 1 0 0 0 0 0 31 3 34
5.9% 2.9% 0.0% 0.0% 0.0% 0.0% 0.0% 91.2% 8.8%
16 55 13 0 0 1 4 260 85 349
4.6% 15.8% 3.7% 0.0% 0.0% 0.3% 1.1% 74.5% 24.4%
1 1 0 0 0 0 1 9 2 12
8.3% 8.3% 0.0% 0.0% 0.0% 0.0% 8.3% 75.0% 16.7%
7 74 7 0 0 1 0 199 89 288
2.4% 25.7% 2.4% 0.0% 0.0% 0.3% 0.0% 69.1% 30.9%
2 1 0 0 1 0 0 20 4 24
8.3% 4.2% 0.0% 0.0% 4.2% 0.0% 0.0% 83.3% 16.7%
1 5 0 0 0 0 1 22 6 29
3.4% 17.2% 0.0% 0.0% 0.0% 0.0% 3.4% 75.9% 20.7%
4 1 1 0 0 1 0 11 7 18
22.2% 5.6% 5.6% 0.0% 0.0% 5.6% 0.0% 61.1% 38.9%
0 4 1 0 0 0 0 10 5 15
0.0% 26.7% 6.7% 0.0% 0.0% 0.0% 0.0% 66.7% 33.3%
53 222 29 1 1 4 6 736 310 1052
5.0% 21.1% 2.8% 0.1% 0.1% 0.4% 0.6% 70.0% 29.4%Grand Totals:
School of Library &
Information Science
School of Medicine
College of Nursing
College of
Pharmacy & Health
Science
School of Social
Work
Division of Research
College of Liberal
Arts & Science
2 or
more
Races
Total
Minority
Faculty
WhiteUnknown
School of Business
Administration
College of
Education
College of
Engineering
College of Fine &
Performing Arts
Law School
Total
Faculty
School/College/
DivisionBlack
Asian/
Pacific
Islander
Hispanic
American
Indian/Alaskan
Native
Native
Hawaiian and
Other Pacific
Islander
Wayne State University is an Affirmative Action/Equal Opportunity Institution. 14
2012 Tenure/Tenure-Track Faculty by School/College/Division – Women As of 12/31/12 (Table 9)
1 4 0 0 0 0 0 5 5 10
10.0% 40.0% 0.0% 0.0% 0.0% 0.0% 0.0% 50.0% 50.0%
5 5 3 1 0 0 21 14 35
14.3% 14.3% 8.6% 2.9% 0.0% 0.0% 0.0% 60.0% 40.0%
0 3 0 0 0 1 0 7 4 11
0.0% 27.3% 0.0% 0.0% 0.0% 9.1% 0.0% 63.6% 36.4%
2 2 0 0 0 0 0 24 4 28
7.1% 7.1% 0.0% 0.0% 0.0% 0.0% 0.0% 85.7% 14.3%
2 1 0 0 0 0 9 3 12
16.7% 8.3% 0.0% 0.0% 0.0% 0.0% 0.0% 75.0% 25.0%
5 15 6 0 0 1 2 92 27 121
4.1% 12.4% 5.0% 0.0% 0.0% 0.8% 1.7% 76.0% 22.3%
1 0 0 0 0 0 1 5 1 7
14.3% 0.0% 0.0% 0.0% 0.0% 0.0% 14.3% 71.4% 14.3%
4 15 1 0 0 1 0 44 21 65
6.2% 23.1% 1.5% 0.0% 0.0% 1.5% 0.0% 67.7% 32.3%
2 1 0 0 1 0 0 18 4 22
9.1% 4.5% 0.0% 0.0% 4.5% 0.0% 0.0% 81.8% 18.2%
0 1 0 0 0 0 0 7 1 8
0.0% 12.5% 0.0% 0.0% 0.0% 0.0% 0.0% 87.5% 12.5%
4 1 0 0 0 1 0 9 6 15
26.7% 6.7% 0.0% 0.0% 0.0% 6.7% 0.0% 60.0% 40.0%
0 1 0 0 0 0 0 5 1 6
0.0% 16.7% 0.0% 0.0% 0.0% 0.0% 0.0% 83.3% 16.7%
26 49 10 1 1 4 3 246 91 340
7.6% 14.4% 2.9% 0.3% 0.3% 1.2% 0.9% 72.3% 26.8%Grand Totals:
School of Library &
Information Science
School of Medicine
College of Nursing
College of
Pharmacy & Health
Science
School of Social
Work
Division of Research
College of Liberal
Arts & Science
2 or
more
Races
Total
Minorities
(Women)
WhiteUnknown
School of Business
Administration
College of
Education
College of
Engineering
College of Fine &
Performing Arts
Law School
Total
Faculty
(Women)
School/College/
DivisionBlack
Asian/
Pacific
Islander
Hispanic
American
Indian/Alaskan
Native
Native
Hawaiian and
Other Pacific
Islander
Wayne State University is an Affirmative Action/Equal Opportunity Institution. 15
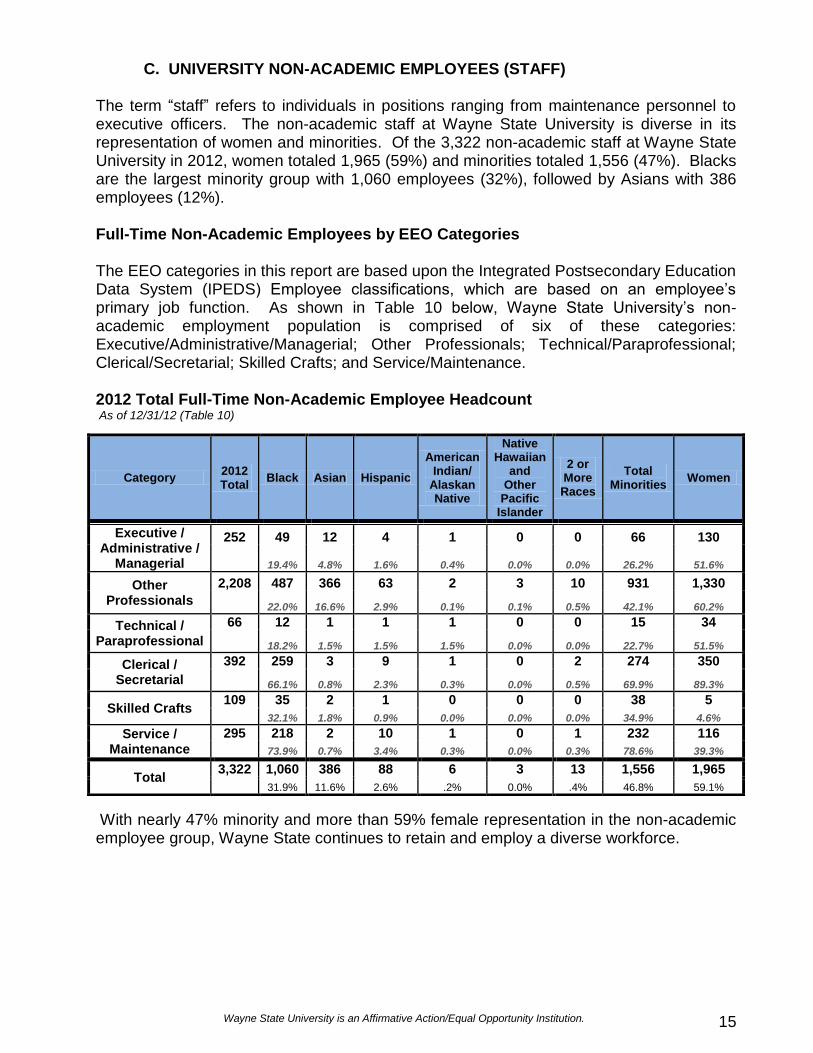
C. UNIVERSITY NON-ACADEMIC EMPLOYEES (STAFF) The term “staff” refers to individuals in positions ranging from maintenance personnel to executive officers. The non-academic staff at Wayne State University is diverse in its representation of women and minorities. Of the 3,322 non-academic staff at Wayne State University in 2012, women totaled 1,965 (59%) and minorities totaled 1,556 (47%). Blacks are the largest minority group with 1,060 employees (32%), followed by Asians with 386 employees (12%). Full-Time Non-Academic Employees by EEO Categories The EEO categories in this report are based upon the Integrated Postsecondary Education Data System (IPEDS) Employee classifications, which are based on an employee’s primary job function. As shown in Table 10 below, Wayne State University’s non-academic employment population is comprised of six of these categories: Executive/Administrative/Managerial; Other Professionals; Technical/Paraprofessional; Clerical/Secretarial; Skilled Crafts; and Service/Maintenance. 2012 Total Full-Time Non-Academic Employee Headcount As of 12/31/12 (Table 10)
With nearly 47% minority and more than 59% female representation in the non-academic employee group, Wayne State continues to retain and employ a diverse workforce.
Category 2012 Total
Black Asian Hispanic
American Indian/
Alaskan Native
Native Hawaiian
and Other
Pacific Islander
2 or More Races
Total Minorities
Women
Executive / Administrative /
Managerial
252 49 12 4 1 0 0 66 130
19.4% 4.8% 1.6% 0.4% 0.0% 0.0% 26.2% 51.6%
Other Professionals
2,208 487 366 63 2 3 10 931 1,330
22.0% 16.6% 2.9% 0.1% 0.1% 0.5% 42.1% 60.2%
Technical / Paraprofessional
66 12 1 1 1 0 0 15 34
18.2% 1.5% 1.5% 1.5% 0.0% 0.0% 22.7% 51.5%
Clerical / Secretarial
392 259 3 9 1 0 2 274 350
66.1% 0.8% 2.3% 0.3% 0.0% 0.5% 69.9% 89.3%
Skilled Crafts 109 35 2 1 0 0 0 38 5
32.1% 1.8% 0.9% 0.0% 0.0% 0.0% 34.9% 4.6%
Service / Maintenance
295 218 2 10 1 0 1 232 116
73.9% 0.7% 3.4% 0.3% 0.0% 0.3% 78.6% 39.3%
Total 3,322 1,060 386 88 6 3 13 1,556 1,965
31.9% 11.6% 2.6% .2% 0.0% .4% 46.8% 59.1%
Wayne State University is an Affirmative Action/Equal Opportunity Institution. 16
Higher Level Positions It is significant that minorities and women are heavily represented throughout all levels of job categories at Wayne State University. In 2012, 252 employees were classified in the “Executive/Administrative/Managerial” category. This category corresponds, more or less, to non-academic employees holding the rank of Director or above. Minorities represent slightly over 26% of this high-level category, or 66 of 252 employees. Women represented nearly 52% of this category, or 130 employees. Full-time employees in the “Other Professional” category include academic support personnel as well as those job assignments that require a college degree. The population of the “Other Professional” category fluctuates with enrollment and grant funding trends. Of the 2,208 employed in this category, 931 were minorities. Blacks were more heavily represented than any other minority, at 487, followed by Asians at 366. Hispanics in this category totaled 63, with American Indian/Alaskan Native and Native Hawaiian and Other Pacific Islanders totaling 2 and 3 respectively. Ten (10) employees were identified as having 2 or more races and slightly over 60% (1,330) were women.
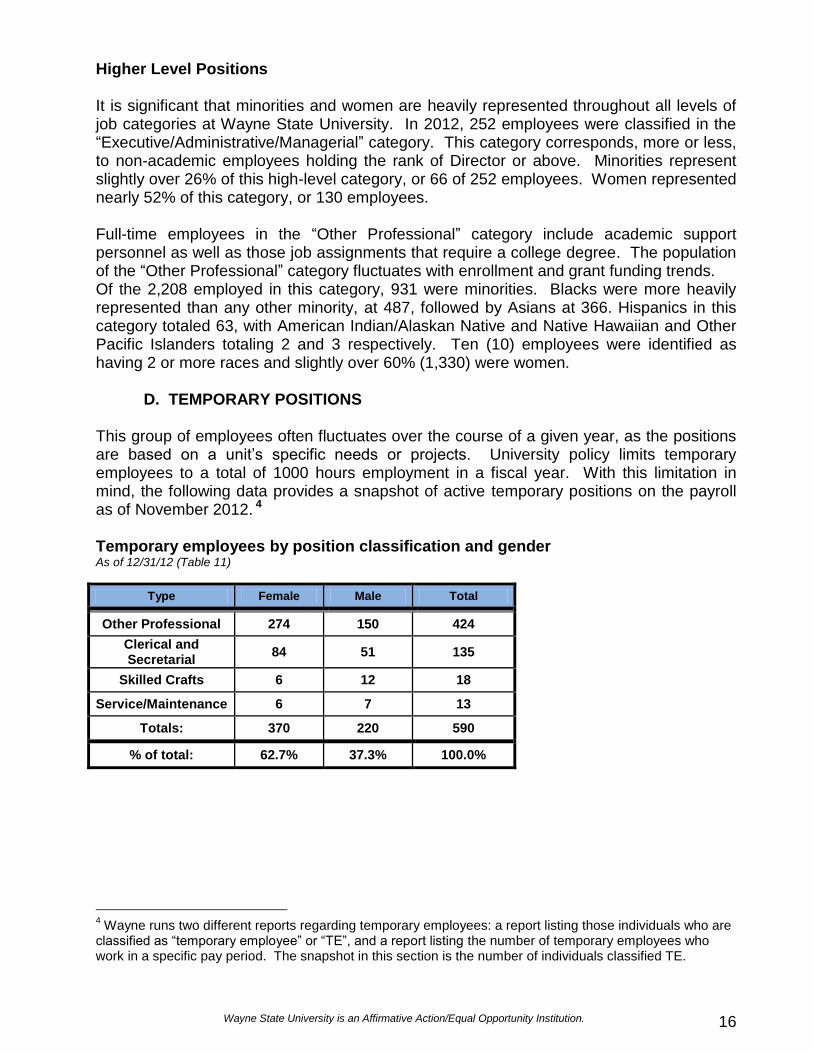
D. TEMPORARY POSITIONS This group of employees often fluctuates over the course of a given year, as the positions are based on a unit’s specific needs or projects. University policy limits temporary employees to a total of 1000 hours employment in a fiscal year. With this limitation in mind, the following data provides a snapshot of active temporary positions on the payroll as of November 2012. 4 Temporary employees by position classification and gender As of 12/31/12 (Table 11)
Type Female Male Total
Other Professional 274 150 424
Clerical and Secretarial
84 51 135
Skilled Crafts 6 12 18
Service/Maintenance 6 7 13
Totals: 370 220 590
% of total: 62.7% 37.3% 100.0%
4 Wayne runs two different reports regarding temporary employees: a report listing those individuals who are
classified as “temporary employee” or “TE”, and a report listing the number of temporary employees who work in a specific pay period. The snapshot in this section is the number of individuals classified TE.
Wayne State University is an Affirmative Action/Equal Opportunity Institution. 17
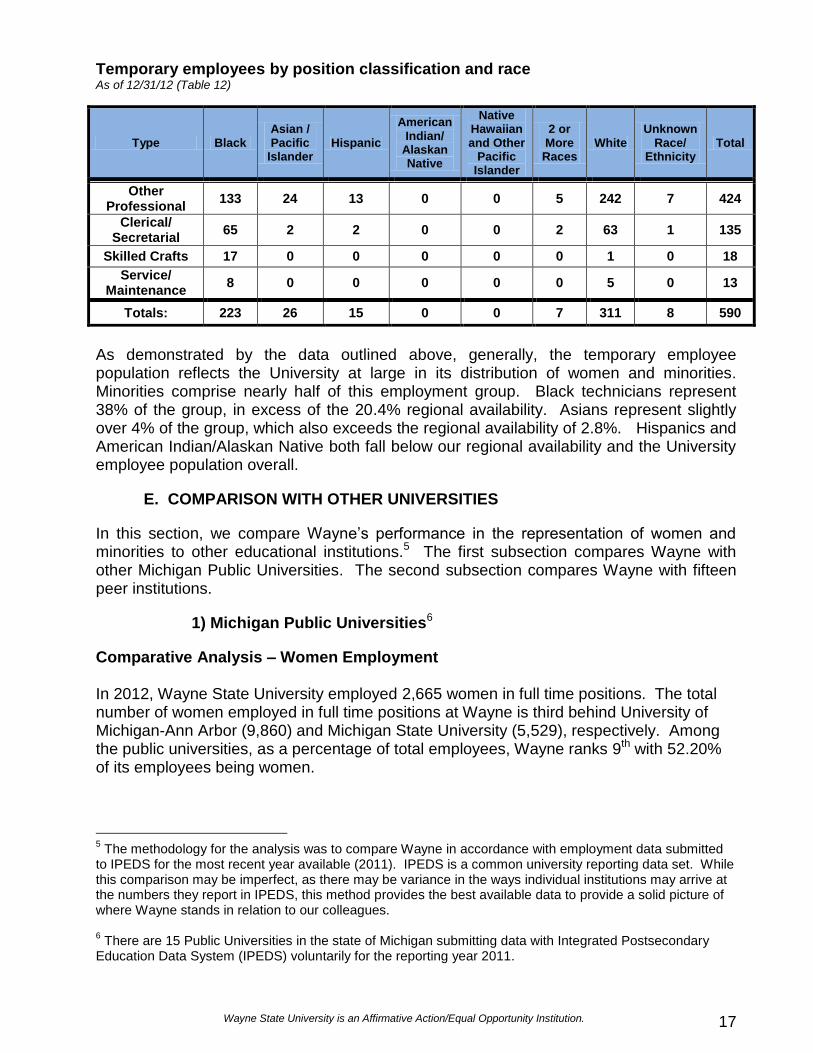
Temporary employees by position classification and race As of 12/31/12 (Table 12)
Type Black Asian / Pacific
Islander Hispanic
American Indian/
Alaskan Native
Native Hawaiian and Other
Pacific Islander
2 or More Races
White Unknown
Race/ Ethnicity
Total
Other Professional
133 24 13 0 0 5 242 7 424
Clerical/ Secretarial
65 2 2 0 0 2 63 1 135
Skilled Crafts 17 0 0 0 0 0 1 0 18
Service/ Maintenance
8 0 0 0 0 0 5 0 13
Totals: 223 26 15 0 0 7 311 8 590
As demonstrated by the data outlined above, generally, the temporary employee population reflects the University at large in its distribution of women and minorities. Minorities comprise nearly half of this employment group. Black technicians represent 38% of the group, in excess of the 20.4% regional availability. Asians represent slightly over 4% of the group, which also exceeds the regional availability of 2.8%. Hispanics and American Indian/Alaskan Native both fall below our regional availability and the University employee population overall.
E. COMPARISON WITH OTHER UNIVERSITIES
In this section, we compare Wayne’s performance in the representation of women and minorities to other educational institutions.5 The first subsection compares Wayne with other Michigan Public Universities. The second subsection compares Wayne with fifteen peer institutions.
1) Michigan Public Universities6
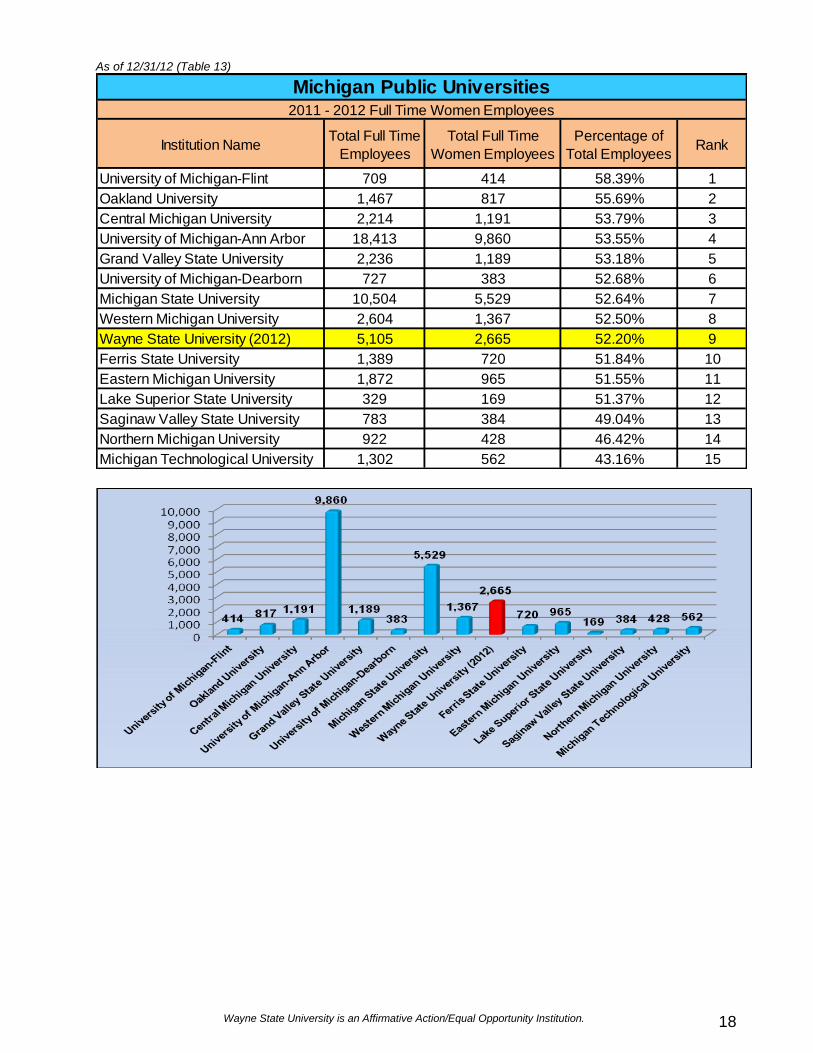
Comparative Analysis – Women Employment In 2012, Wayne State University employed 2,665 women in full time positions. The total number of women employed in full time positions at Wayne is third behind University of Michigan-Ann Arbor (9,860) and Michigan State University (5,529), respectively. Among the public universities, as a percentage of total employees, Wayne ranks 9th with 52.20% of its employees being women.
5 The methodology for the analysis was to compare Wayne in accordance with employment data submitted
to IPEDS for the most recent year available (2011). IPEDS is a common university reporting data set. While this comparison may be imperfect, as there may be variance in the ways individual institutions may arrive at the numbers they report in IPEDS, this method provides the best available data to provide a solid picture of where Wayne stands in relation to our colleagues. 6 There are 15 Public Universities in the state of Michigan submitting data with Integrated Postsecondary
Education Data System (IPEDS) voluntarily for the reporting year 2011.
Wayne State University is an Affirmative Action/Equal Opportunity Institution. 18
As of 12/31/12 (Table 13)
Institution NameTotal Full Time
Employees
Total Full Time
Women Employees
Percentage of
Total EmployeesRank
University of Michigan-Flint 709 414 58.39% 1
Oakland University 1,467 817 55.69% 2
Central Michigan University 2,214 1,191 53.79% 3
University of Michigan-Ann Arbor 18,413 9,860 53.55% 4
Grand Valley State University 2,236 1,189 53.18% 5
University of Michigan-Dearborn 727 383 52.68% 6
Michigan State University 10,504 5,529 52.64% 7
Western Michigan University 2,604 1,367 52.50% 8
Wayne State University (2012) 5,105 2,665 52.20% 9
Ferris State University 1,389 720 51.84% 10
Eastern Michigan University 1,872 965 51.55% 11
Lake Superior State University 329 169 51.37% 12
Saginaw Valley State University 783 384 49.04% 13
Northern Michigan University 922 428 46.42% 14
Michigan Technological University 1,302 562 43.16% 15
2011 - 2012 Full Time Women Employees
Michigan Public Universities
Wayne State University is an Affirmative Action/Equal Opportunity Institution. 19
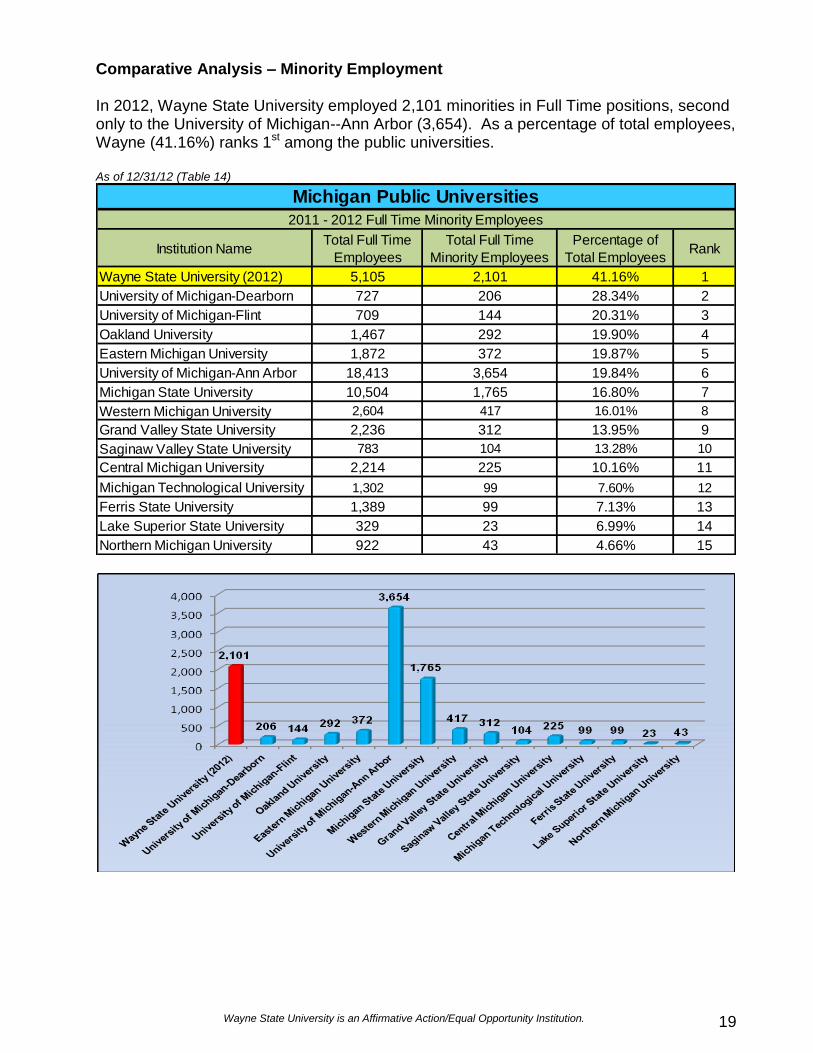
Comparative Analysis – Minority Employment In 2012, Wayne State University employed 2,101 minorities in Full Time positions, second only to the University of Michigan--Ann Arbor (3,654). As a percentage of total employees, Wayne (41.16%) ranks 1st among the public universities. As of 12/31/12 (Table 14)
Wayne State University (2012) 5,105 2,101 41.16% 1
University of Michigan-Dearborn 727 206 28.34% 2
University of Michigan-Flint 709 144 20.31% 3
Oakland University 1,467 292 19.90% 4
Eastern Michigan University 1,872 372 19.87% 5
University of Michigan-Ann Arbor 18,413 3,654 19.84% 6
Michigan State University 10,504 1,765 16.80% 7
Western Michigan University 2,604 417 16.01% 8
Grand Valley State University 2,236 312 13.95% 9
Saginaw Valley State University 783 104 13.28% 10
Central Michigan University 2,214 225 10.16% 11
Michigan Technological University 1,302 99 7.60% 12
Ferris State University 1,389 99 7.13% 13
Lake Superior State University 329 23 6.99% 14
Northern Michigan University 922 43 4.66% 15
Michigan Public Universities
2011 - 2012 Full Time Minority Employees
Institution NameTotal Full Time
Employees
Total Full Time
Minority EmployeesRank
Percentage of
Total Employees
Wayne State University is an Affirmative Action/Equal Opportunity Institution. 20
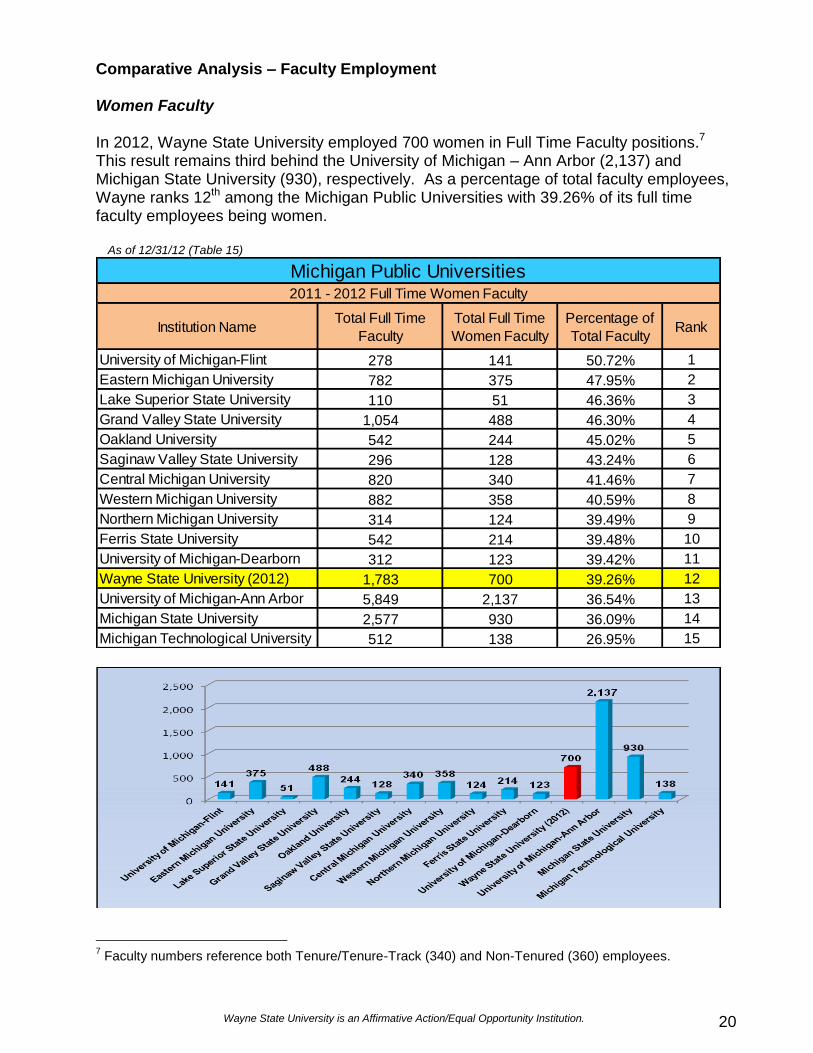
Comparative Analysis – Faculty Employment Women Faculty In 2012, Wayne State University employed 700 women in Full Time Faculty positions.7 This result remains third behind the University of Michigan – Ann Arbor (2,137) and Michigan State University (930), respectively. As a percentage of total faculty employees, Wayne ranks 12th among the Michigan Public Universities with 39.26% of its full time faculty employees being women.
As of 12/31/12 (Table 15)
Institution NameTotal Full Time
Faculty
Total Full Time
Women Faculty
Percentage of
Total FacultyRank
University of Michigan-Flint 278 141 50.72% 1
Eastern Michigan University 782 375 47.95% 2
Lake Superior State University 110 51 46.36% 3
Grand Valley State University 1,054 488 46.30% 4
Oakland University 542 244 45.02% 5
Saginaw Valley State University 296 128 43.24% 6
Central Michigan University 820 340 41.46% 7
Western Michigan University 882 358 40.59% 8
Northern Michigan University 314 124 39.49% 9
Ferris State University 542 214 39.48% 10
University of Michigan-Dearborn 312 123 39.42% 11
Wayne State University (2012) 1,783 700 39.26% 12
University of Michigan-Ann Arbor 5,849 2,137 36.54% 13
Michigan State University 2,577 930 36.09% 14
Michigan Technological University 512 138 26.95% 15
Michigan Public Universities2011 - 2012 Full Time Women Faculty
7 Faculty numbers reference both Tenure/Tenure-Track (340) and Non-Tenured (360) employees.
Wayne State University is an Affirmative Action/Equal Opportunity Institution. 21
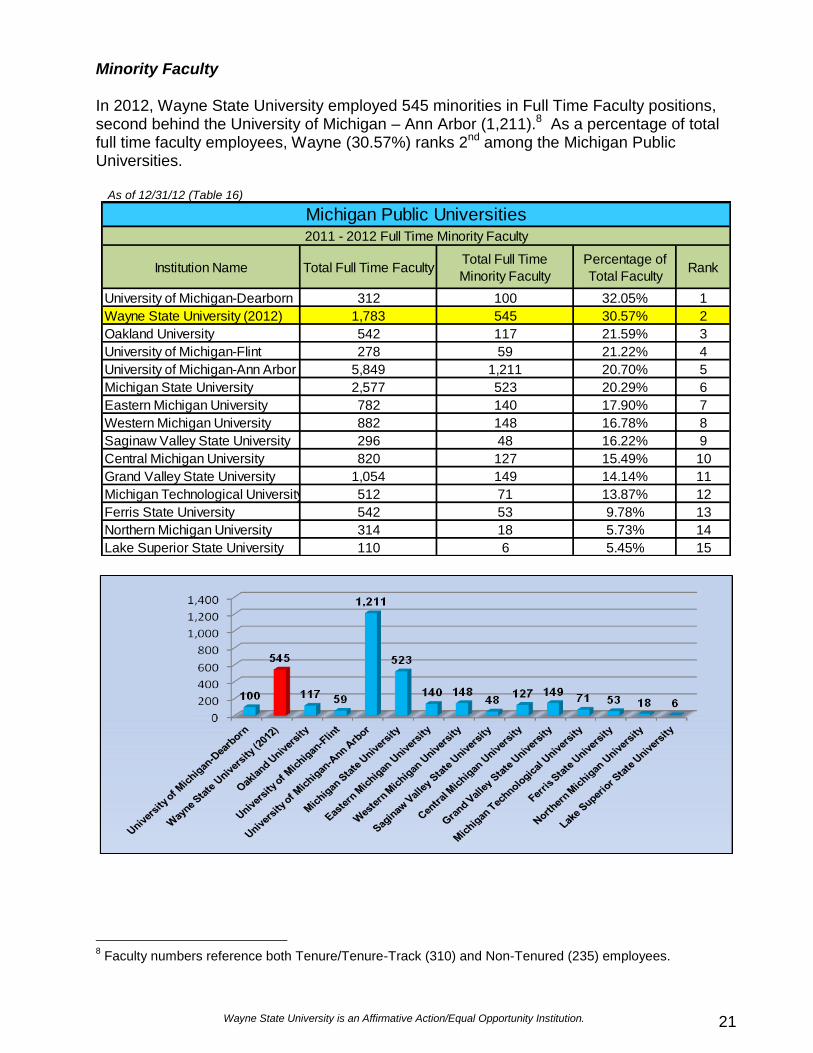
Minority Faculty In 2012, Wayne State University employed 545 minorities in Full Time Faculty positions, second behind the University of Michigan – Ann Arbor (1,211).8 As a percentage of total full time faculty employees, Wayne (30.57%) ranks 2nd among the Michigan Public Universities.
As of 12/31/12 (Table 16)
Institution Name Total Full Time FacultyTotal Full Time
Minority Faculty
Percentage of
Total FacultyRank
University of Michigan-Dearborn 312 100 32.05% 1
Wayne State University (2012) 1,783 545 30.57% 2
Oakland University 542 117 21.59% 3
University of Michigan-Flint 278 59 21.22% 4
University of Michigan-Ann Arbor 5,849 1,211 20.70% 5
Michigan State University 2,577 523 20.29% 6
Eastern Michigan University 782 140 17.90% 7
Western Michigan University 882 148 16.78% 8
Saginaw Valley State University 296 48 16.22% 9
Central Michigan University 820 127 15.49% 10
Grand Valley State University 1,054 149 14.14% 11
Michigan Technological University 512 71 13.87% 12
Ferris State University 542 53 9.78% 13
Northern Michigan University 314 18 5.73% 14
Lake Superior State University 110 6 5.45% 15
Michigan Public Universities2011 - 2012 Full Time Minority Faculty
8 Faculty numbers reference both Tenure/Tenure-Track (310) and Non-Tenured (235) employees.
Wayne State University is an Affirmative Action/Equal Opportunity Institution. 22
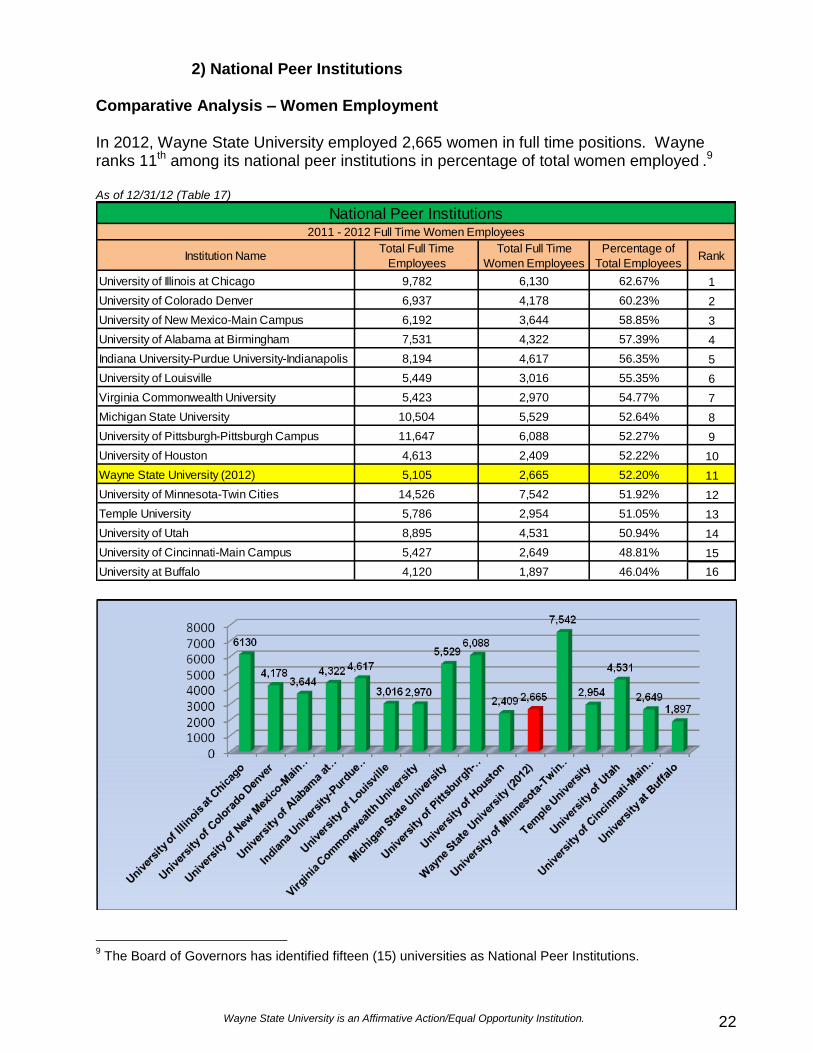
2) National Peer Institutions
Comparative Analysis – Women Employment
In 2012, Wayne State University employed 2,665 women in full time positions. Wayne ranks 11th among its national peer institutions in percentage of total women employed .9 As of 12/31/12 (Table 17)
Institution NameTotal Full Time
Employees
Total Full Time
Women Employees
Percentage of
Total EmployeesRank
University of Illinois at Chicago 9,782 6,130 62.67% 1
University of Colorado Denver 6,937 4,178 60.23% 2
University of New Mexico-Main Campus 6,192 3,644 58.85% 3
University of Alabama at Birmingham 7,531 4,322 57.39% 4
Indiana University-Purdue University-Indianapolis 8,194 4,617 56.35% 5
University of Louisville 5,449 3,016 55.35% 6
Virginia Commonwealth University 5,423 2,970 54.77% 7
Michigan State University 10,504 5,529 52.64% 8
University of Pittsburgh-Pittsburgh Campus 11,647 6,088 52.27% 9
University of Houston 4,613 2,409 52.22% 10
Wayne State University (2012) 5,105 2,665 52.20% 11
University of Minnesota-Twin Cities 14,526 7,542 51.92% 12
Temple University 5,786 2,954 51.05% 13
University of Utah 8,895 4,531 50.94% 14
University of Cincinnati-Main Campus 5,427 2,649 48.81% 15
University at Buffalo 4,120 1,897 46.04% 16
National Peer Institutions2011 - 2012 Full Time Women Employees
9 The Board of Governors has identified fifteen (15) universities as National Peer Institutions.
Wayne State University is an Affirmative Action/Equal Opportunity Institution. 23
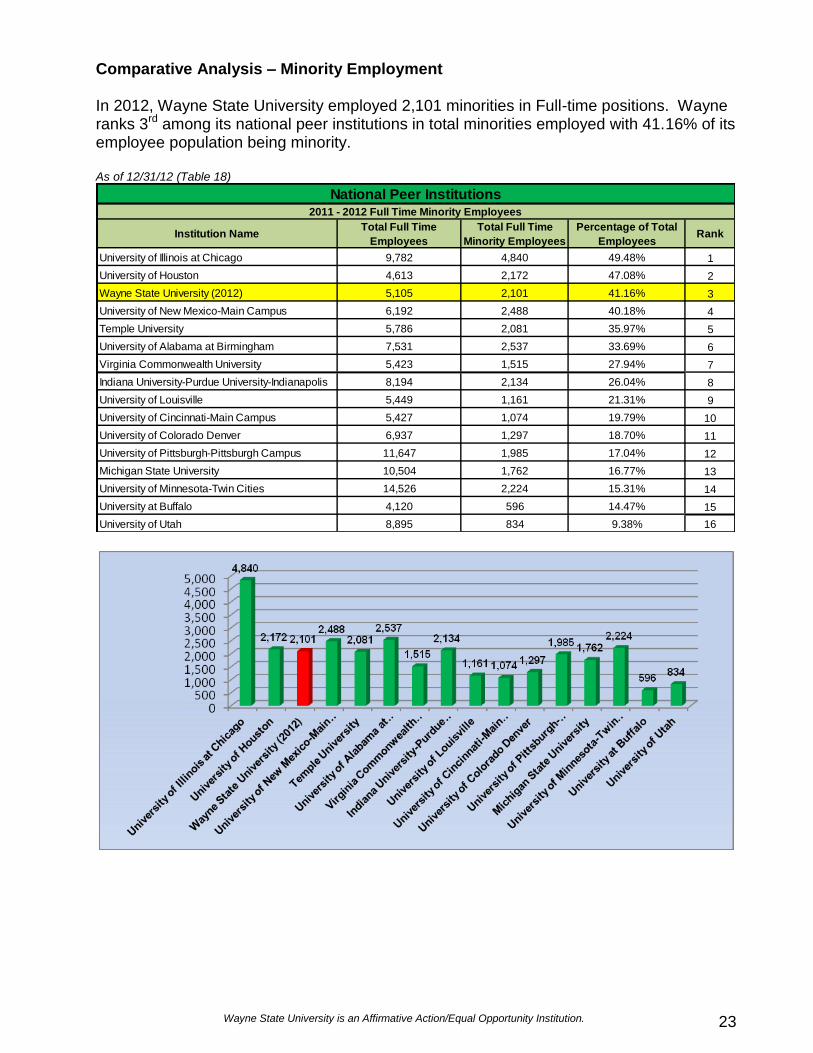
Comparative Analysis – Minority Employment
In 2012, Wayne State University employed 2,101 minorities in Full-time positions. Wayne ranks 3rd among its national peer institutions in total minorities employed with 41.16% of its employee population being minority. As of 12/31/12 (Table 18)
University of Illinois at Chicago 9,782 4,840 49.48% 1
University of Houston 4,613 2,172 47.08% 2
Wayne State University (2012) 5,105 2,101 41.16% 3
University of New Mexico-Main Campus 6,192 2,488 40.18% 4
Temple University 5,786 2,081 35.97% 5
University of Alabama at Birmingham 7,531 2,537 33.69% 6
Virginia Commonwealth University 5,423 1,515 27.94% 7
Indiana University-Purdue University-Indianapolis 8,194 2,134 26.04% 8
University of Louisville 5,449 1,161 21.31% 9
University of Cincinnati-Main Campus 5,427 1,074 19.79% 10
University of Colorado Denver 6,937 1,297 18.70% 11
University of Pittsburgh-Pittsburgh Campus 11,647 1,985 17.04% 12
Michigan State University 10,504 1,762 16.77% 13
University of Minnesota-Twin Cities 14,526 2,224 15.31% 14
University at Buffalo 4,120 596 14.47% 15
University of Utah 8,895 834 9.38% 16
National Peer Institutions2011 - 2012 Full Time Minority Employees
Institution NameTotal Full Time
Employees
Total Full Time
Minority Employees
Percentage of Total
EmployeesRank
Wayne State University is an Affirmative Action/Equal Opportunity Institution. 24
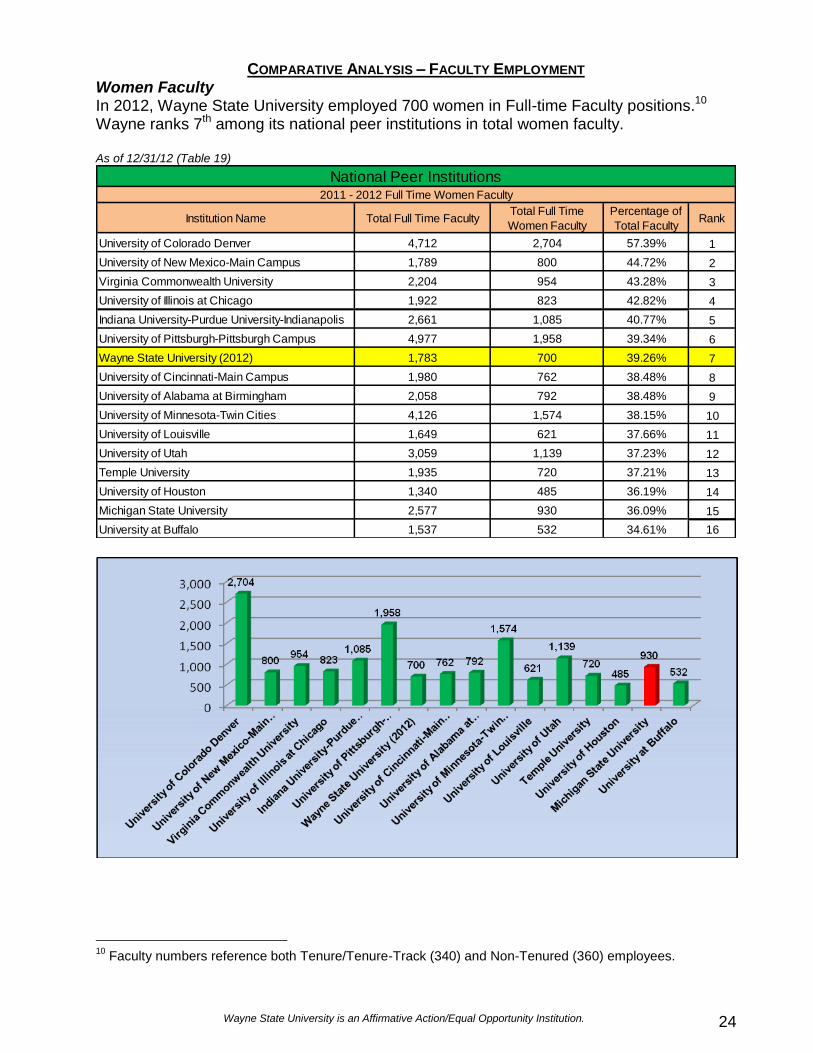
COMPARATIVE ANALYSIS – FACULTY EMPLOYMENT Women Faculty In 2012, Wayne State University employed 700 women in Full-time Faculty positions.10 Wayne ranks 7th among its national peer institutions in total women faculty. As of 12/31/12 (Table 19)
Institution Name Total Full Time FacultyTotal Full Time
Women Faculty
Percentage of
Total FacultyRank
University of Colorado Denver 4,712 2,704 57.39% 1
University of New Mexico-Main Campus 1,789 800 44.72% 2
Virginia Commonwealth University 2,204 954 43.28% 3
University of Illinois at Chicago 1,922 823 42.82% 4
Indiana University-Purdue University-Indianapolis 2,661 1,085 40.77% 5
University of Pittsburgh-Pittsburgh Campus 4,977 1,958 39.34% 6
Wayne State University (2012) 1,783 700 39.26% 7
University of Cincinnati-Main Campus 1,980 762 38.48% 8
University of Alabama at Birmingham 2,058 792 38.48% 9
University of Minnesota-Twin Cities 4,126 1,574 38.15% 10
University of Louisville 1,649 621 37.66% 11
University of Utah 3,059 1,139 37.23% 12
Temple University 1,935 720 37.21% 13
University of Houston 1,340 485 36.19% 14
Michigan State University 2,577 930 36.09% 15
University at Buffalo 1,537 532 34.61% 16
National Peer Institutions2011 - 2012 Full Time Women Faculty
10
Faculty numbers reference both Tenure/Tenure-Track (340) and Non-Tenured (360) employees.
Wayne State University is an Affirmative Action/Equal Opportunity Institution. 25
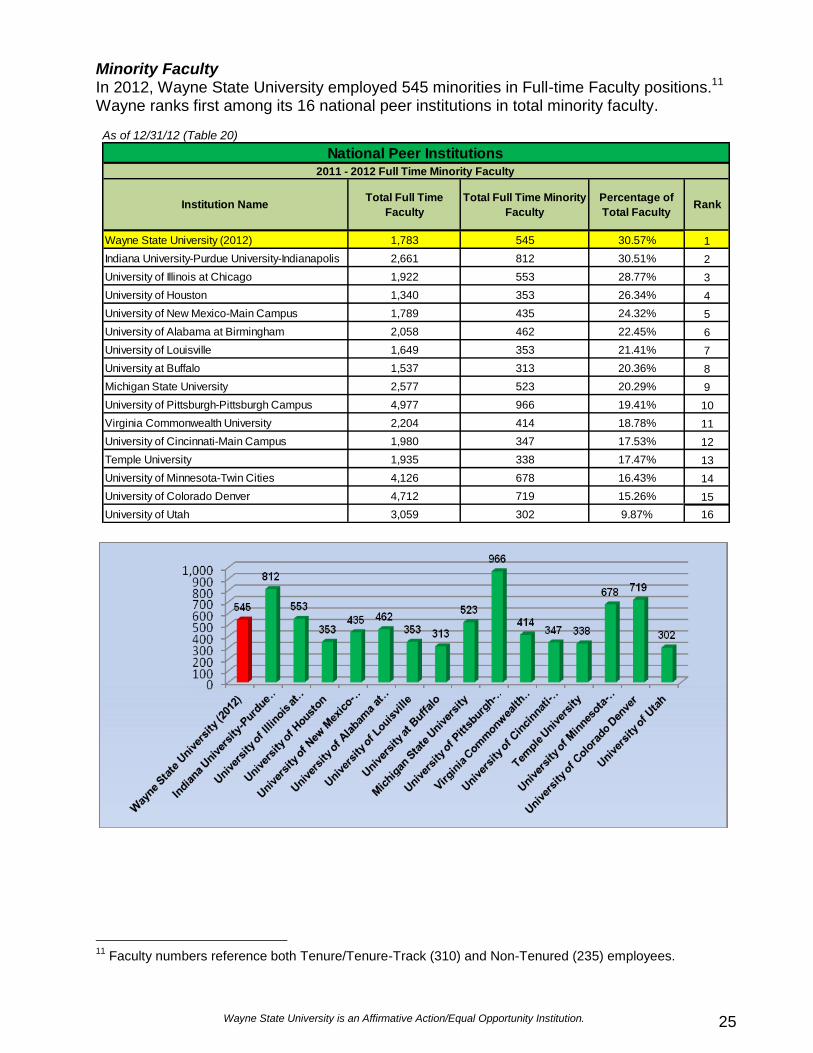
Minority Faculty In 2012, Wayne State University employed 545 minorities in Full-time Faculty positions.11 Wayne ranks first among its 16 national peer institutions in total minority faculty. As of 12/31/12 (Table 20)
Wayne State University (2012) 1,783 545 30.57% 1
Indiana University-Purdue University-Indianapolis 2,661 812 30.51% 2
University of Illinois at Chicago 1,922 553 28.77% 3
University of Houston 1,340 353 26.34% 4
University of New Mexico-Main Campus 1,789 435 24.32% 5
University of Alabama at Birmingham 2,058 462 22.45% 6
University of Louisville 1,649 353 21.41% 7
University at Buffalo 1,537 313 20.36% 8
Michigan State University 2,577 523 20.29% 9
University of Pittsburgh-Pittsburgh Campus 4,977 966 19.41% 10
Virginia Commonwealth University 2,204 414 18.78% 11
University of Cincinnati-Main Campus 1,980 347 17.53% 12
Temple University 1,935 338 17.47% 13
University of Minnesota-Twin Cities 4,126 678 16.43% 14
University of Colorado Denver 4,712 719 15.26% 15
University of Utah 3,059 302 9.87% 16
National Peer Institutions2011 - 2012 Full Time Minority Faculty
Institution NameTotal Full Time
Faculty
Total Full Time Minority
Faculty
Percentage of
Total FacultyRank
11
Faculty numbers reference both Tenure/Tenure-Track (310) and Non-Tenured (235) employees.
Wayne State University is an Affirmative Action/Equal Opportunity Institution. 26
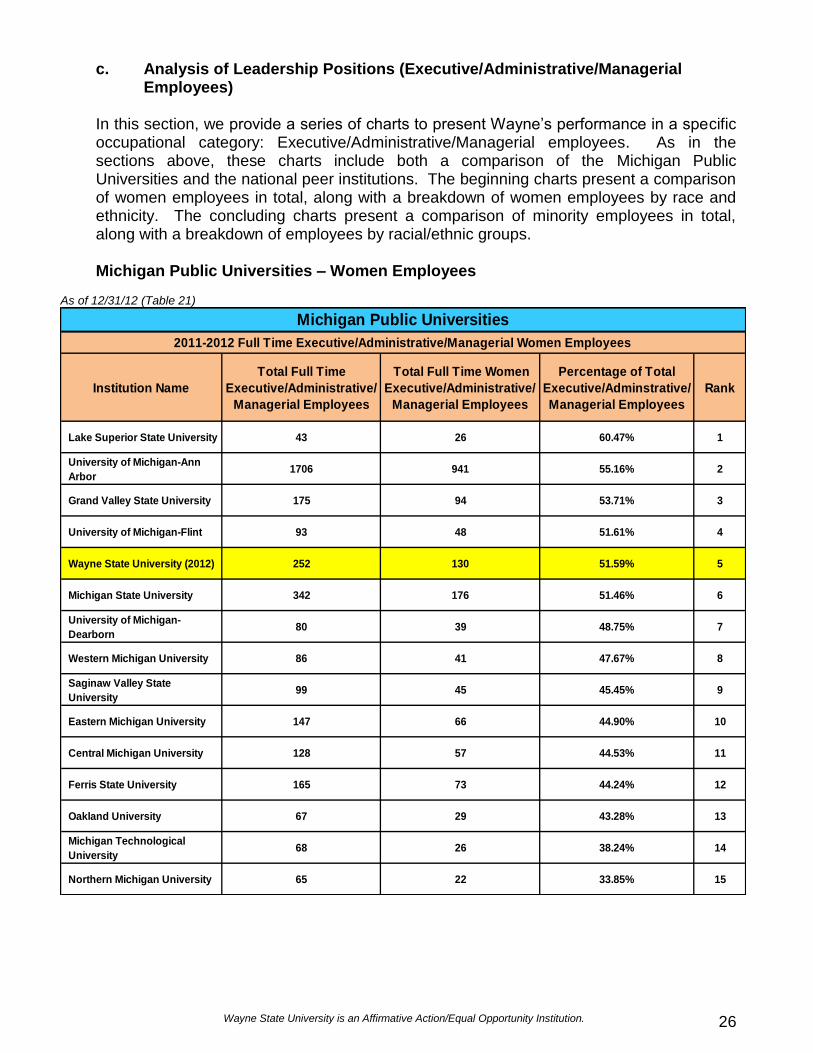
c. Analysis of Leadership Positions (Executive/Administrative/Managerial Employees)
In this section, we provide a series of charts to present Wayne’s performance in a specific occupational category: Executive/Administrative/Managerial employees. As in the sections above, these charts include both a comparison of the Michigan Public Universities and the national peer institutions. The beginning charts present a comparison of women employees in total, along with a breakdown of women employees by race and ethnicity. The concluding charts present a comparison of minority employees in total, along with a breakdown of employees by racial/ethnic groups. Michigan Public Universities – Women Employees
As of 12/31/12 (Table 21)
Institution Name
Total Full Time
Executive/Administrative/
Managerial Employees
Total Full Time Women
Executive/Administrative/
Managerial Employees
Percentage of Total
Executive/Adminstrative/
Managerial Employees
Rank
Lake Superior State University 43 26 60.47% 1
University of Michigan-Ann
Arbor1706 941 55.16% 2
Grand Valley State University 175 94 53.71% 3
University of Michigan-Flint 93 48 51.61% 4
Wayne State University (2012) 252 130 51.59% 5
Michigan State University 342 176 51.46% 6
University of Michigan-
Dearborn80 39 48.75% 7
Western Michigan University 86 41 47.67% 8
Saginaw Valley State
University99 45 45.45% 9
Eastern Michigan University 147 66 44.90% 10
Central Michigan University 128 57 44.53% 11
Ferris State University 165 73 44.24% 12
Oakland University 67 29 43.28% 13
Michigan Technological
University68 26 38.24% 14
Northern Michigan University 65 22 33.85% 15
2011-2012 Full Time Executive/Administrative/Managerial Women Employees
Michigan Public Universities
Wayne State University is an Affirmative Action/Equal Opportunity Institution. 27
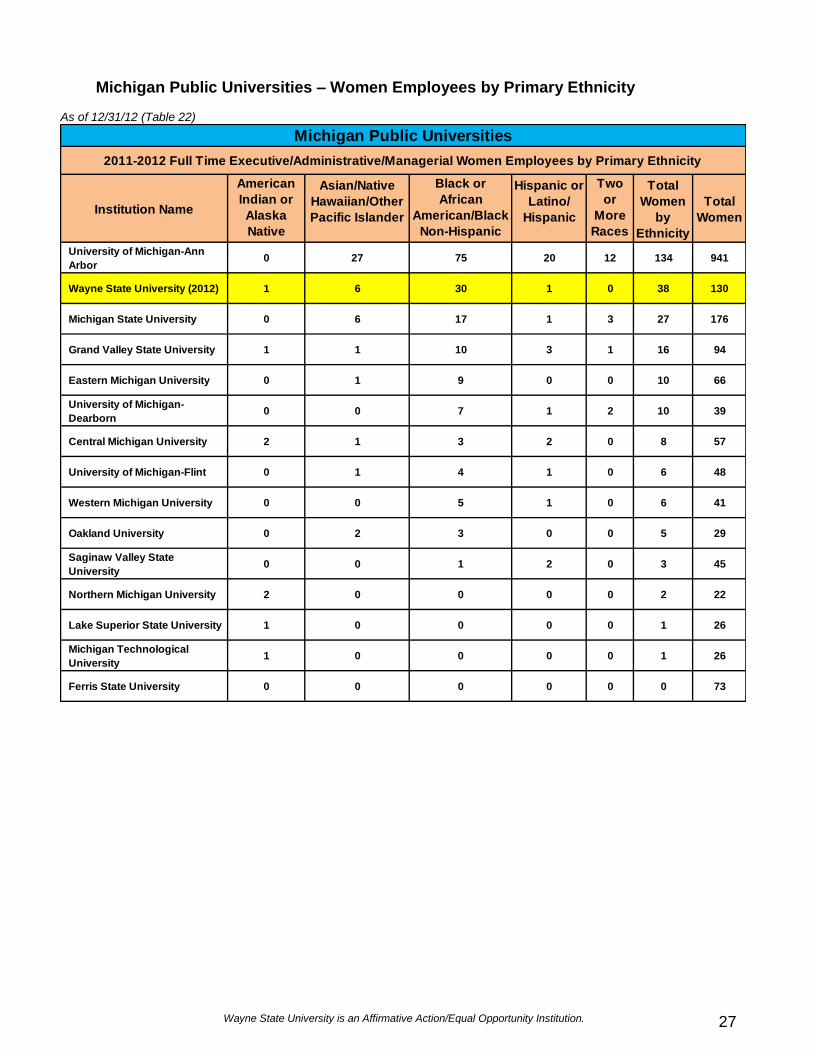
Michigan Public Universities – Women Employees by Primary Ethnicity
As of 12/31/12 (Table 22)
Institution Name
American
Indian or
Alaska
Native
Asian/Native
Hawaiian/Other
Pacific Islander
Black or
African
American/Black
Non-Hispanic
Hispanic or
Latino/
Hispanic
Two
or
More
Races
Total
Women
by
Ethnicity
Total
Women
University of Michigan-Ann
Arbor0 27 75 20 12 134 941
Wayne State University (2012) 1 6 30 1 0 38 130
Michigan State University 0 6 17 1 3 27 176
Grand Valley State University 1 1 10 3 1 16 94
Eastern Michigan University 0 1 9 0 0 10 66
University of Michigan-
Dearborn0 0 7 1 2 10 39
Central Michigan University 2 1 3 2 0 8 57
University of Michigan-Flint 0 1 4 1 0 6 48
Western Michigan University 0 0 5 1 0 6 41
Oakland University 0 2 3 0 0 5 29
Saginaw Valley State
University0 0 1 2 0 3 45
Northern Michigan University 2 0 0 0 0 2 22
Lake Superior State University 1 0 0 0 0 1 26
Michigan Technological
University1 0 0 0 0 1 26
Ferris State University 0 0 0 0 0 0 73
Michigan Public Universities
2011-2012 Full Time Executive/Administrative/Managerial Women Employees by Primary Ethnicity
Wayne State University is an Affirmative Action/Equal Opportunity Institution. 28
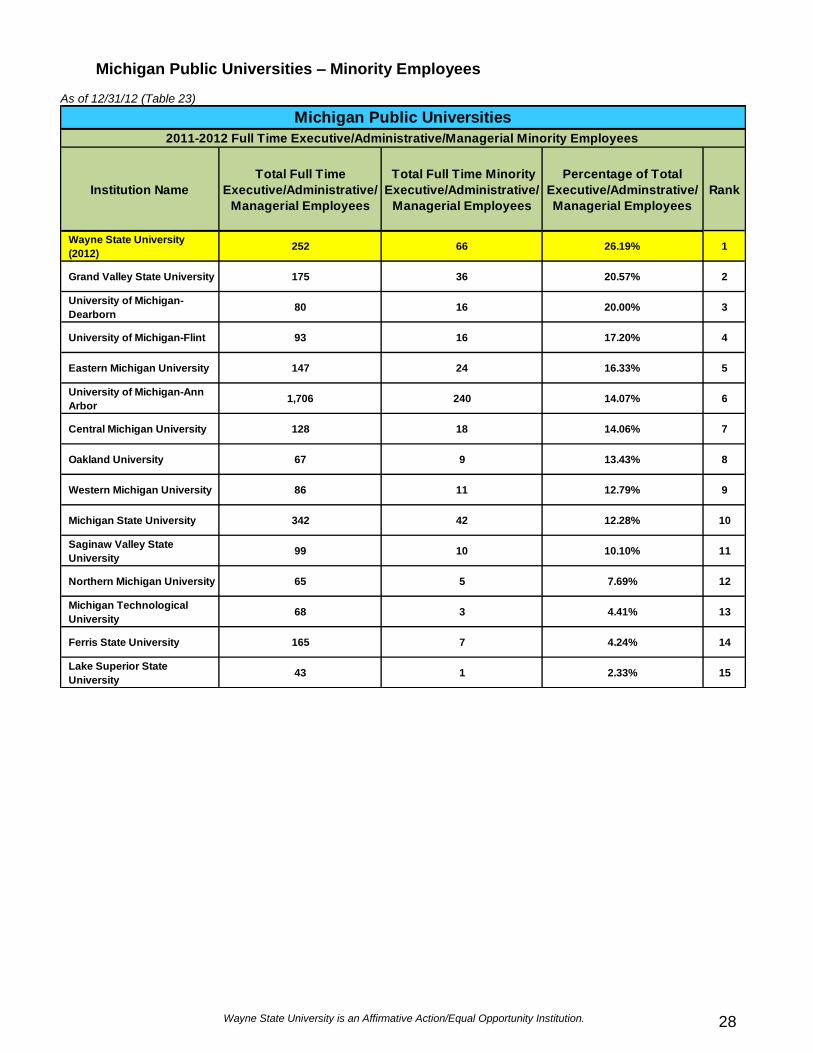
Michigan Public Universities – Minority Employees
As of 12/31/12 (Table 23)
Institution Name
Total Full Time
Executive/Administrative/
Managerial Employees
Total Full Time Minority
Executive/Administrative/
Managerial Employees
Percentage of Total
Executive/Adminstrative/
Managerial Employees
Rank
Wayne State University
(2012)252 66 26.19% 1
Grand Valley State University 175 36 20.57% 2
University of Michigan-
Dearborn80 16 20.00% 3
University of Michigan-Flint 93 16 17.20% 4
Eastern Michigan University 147 24 16.33% 5
University of Michigan-Ann
Arbor1,706 240 14.07% 6
Central Michigan University 128 18 14.06% 7
Oakland University 67 9 13.43% 8
Western Michigan University 86 11 12.79% 9
Michigan State University 342 42 12.28% 10
Saginaw Valley State
University99 10 10.10% 11
Northern Michigan University 65 5 7.69% 12
Michigan Technological
University68 3 4.41% 13
Ferris State University 165 7 4.24% 14
Lake Superior State
University43 1 2.33% 15
Michigan Public Universities
2011-2012 Full Time Executive/Administrative/Managerial Minority Employees
Wayne State University is an Affirmative Action/Equal Opportunity Institution. 29
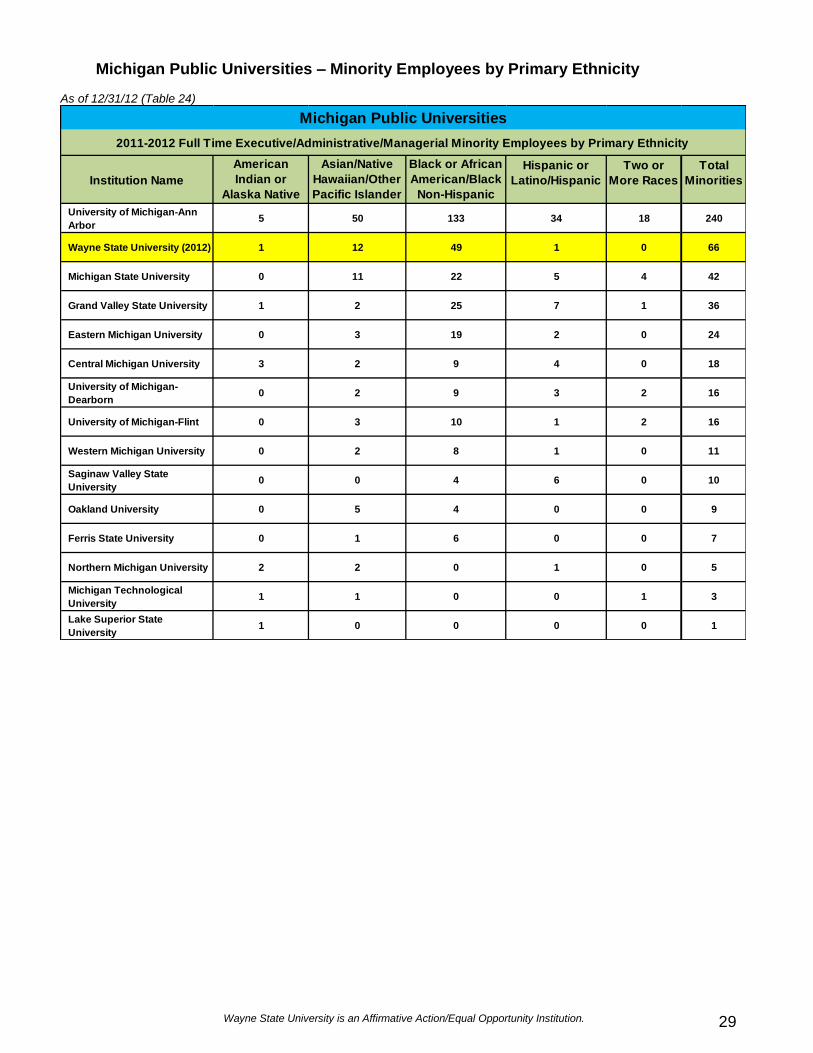
Michigan Public Universities – Minority Employees by Primary Ethnicity
As of 12/31/12 (Table 24)
Institution Name
American
Indian or
Alaska Native
Asian/Native
Hawaiian/Other
Pacific Islander
Black or African
American/Black
Non-Hispanic
Hispanic or
Latino/Hispanic
Two or
More Races
Total
Minorities
University of Michigan-Ann
Arbor5 50 133 34 18 240
Wayne State University (2012) 1 12 49 1 0 66
Michigan State University 0 11 22 5 4 42
Grand Valley State University 1 2 25 7 1 36
Eastern Michigan University 0 3 19 2 0 24
Central Michigan University 3 2 9 4 0 18
University of Michigan-
Dearborn0 2 9 3 2 16
University of Michigan-Flint 0 3 10 1 2 16
Western Michigan University 0 2 8 1 0 11
Saginaw Valley State
University0 0 4 6 0 10
Oakland University 0 5 4 0 0 9
Ferris State University 0 1 6 0 0 7
Northern Michigan University 2 2 0 1 0 5
Michigan Technological
University1 1 0 0 1 3
Lake Superior State
University1 0 0 0 0 1
2011-2012 Full Time Executive/Administrative/Managerial Minority Employees by Primary Ethnicity
Michigan Public Universities
Wayne State University is an Affirmative Action/Equal Opportunity Institution. 30
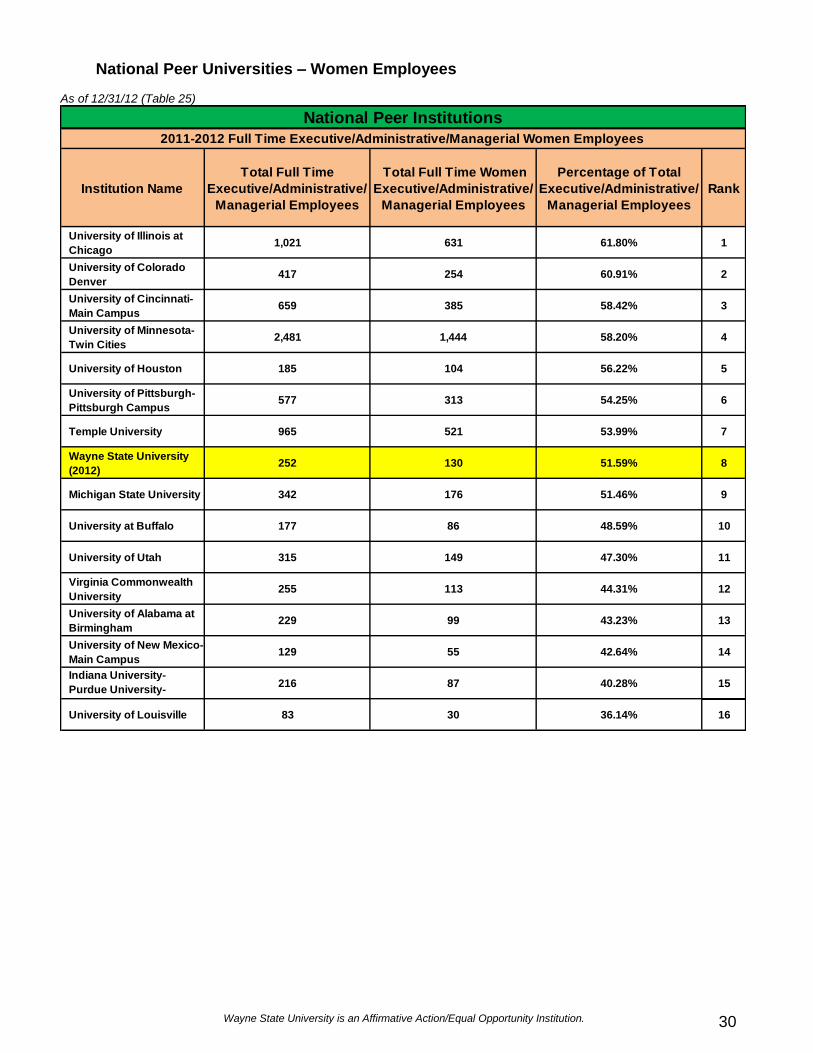
National Peer Universities – Women Employees
As of 12/31/12 (Table 25)
Institution Name
Total Full Time
Executive/Administrative/
Managerial Employees
Total Full Time Women
Executive/Administrative/
Managerial Employees
Percentage of Total
Executive/Administrative/
Managerial Employees
Rank
University of Illinois at
Chicago1,021 631 61.80% 1
University of Colorado
Denver417 254 60.91% 2
University of Cincinnati-
Main Campus659 385 58.42% 3
University of Minnesota-
Twin Cities2,481 1,444 58.20% 4
University of Houston 185 104 56.22% 5
University of Pittsburgh-
Pittsburgh Campus577 313 54.25% 6
Temple University 965 521 53.99% 7
Wayne State University
(2012)252 130 51.59% 8
Michigan State University 342 176 51.46% 9
University at Buffalo 177 86 48.59% 10
University of Utah 315 149 47.30% 11
Virginia Commonwealth
University255 113 44.31% 12
University of Alabama at
Birmingham229 99 43.23% 13
University of New Mexico-
Main Campus129 55 42.64% 14
Indiana University-
Purdue University-
Indianapolis
216 87 40.28% 15
University of Louisville 83 30 36.14% 16
National Peer Institutions
2011-2012 Full Time Executive/Administrative/Managerial Women Employees
Wayne State University is an Affirmative Action/Equal Opportunity Institution. 31
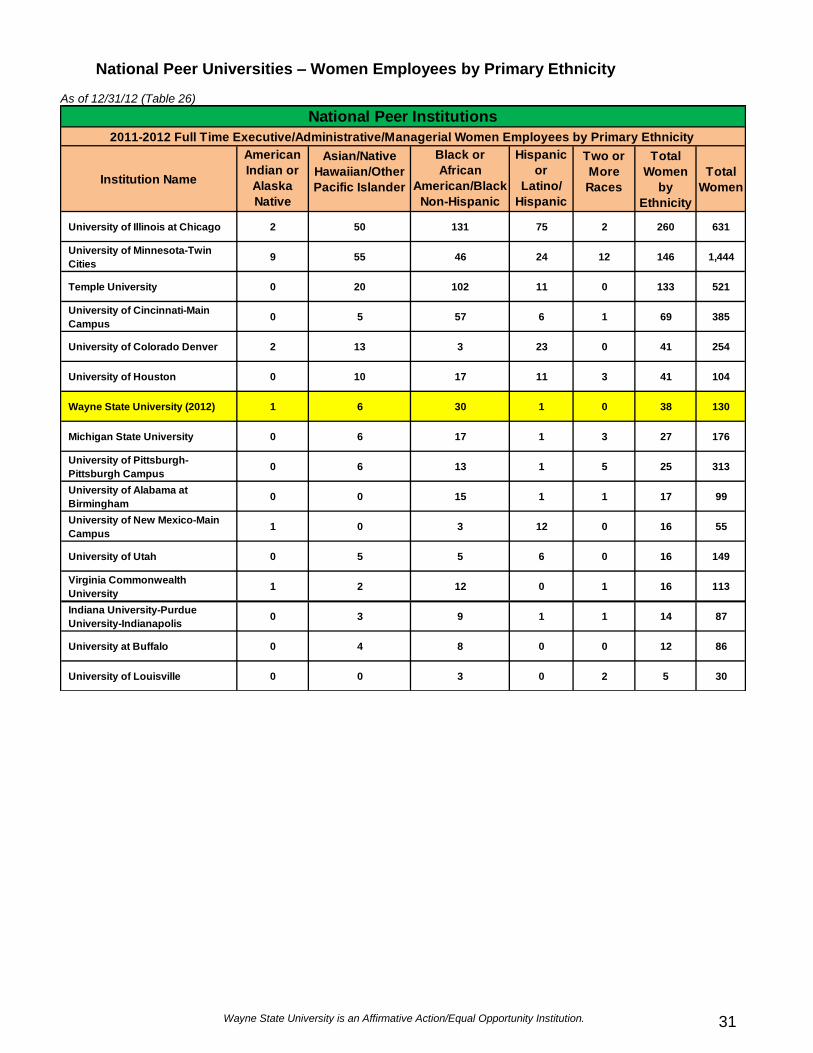
National Peer Universities – Women Employees by Primary Ethnicity
As of 12/31/12 (Table 26)
Institution Name
American
Indian or
Alaska
Native
Asian/Native
Hawaiian/Other
Pacific Islander
Black or
African
American/Black
Non-Hispanic
Hispanic
or
Latino/
Hispanic
Two or
More
Races
Total
Women
by
Ethnicity
Total
Women
University of Illinois at Chicago 2 50 131 75 2 260 631
University of Minnesota-Twin
Cities9 55 46 24 12 146 1,444
Temple University 0 20 102 11 0 133 521
University of Cincinnati-Main
Campus0 5 57 6 1 69 385
University of Colorado Denver 2 13 3 23 0 41 254
University of Houston 0 10 17 11 3 41 104
Wayne State University (2012) 1 6 30 1 0 38 130
Michigan State University 0 6 17 1 3 27 176
University of Pittsburgh-
Pittsburgh Campus0 6 13 1 5 25 313
University of Alabama at
Birmingham0 0 15 1 1 17 99
University of New Mexico-Main
Campus1 0 3 12 0 16 55
University of Utah 0 5 5 6 0 16 149
Virginia Commonwealth
University1 2 12 0 1 16 113
Indiana University-Purdue
University-Indianapolis0 3 9 1 1 14 87
University at Buffalo 0 4 8 0 0 12 86
University of Louisville 0 0 3 0 2 5 30
National Peer Institutions
2011-2012 Full Time Executive/Administrative/Managerial Women Employees by Primary Ethnicity
Wayne State University is an Affirmative Action/Equal Opportunity Institution. 32
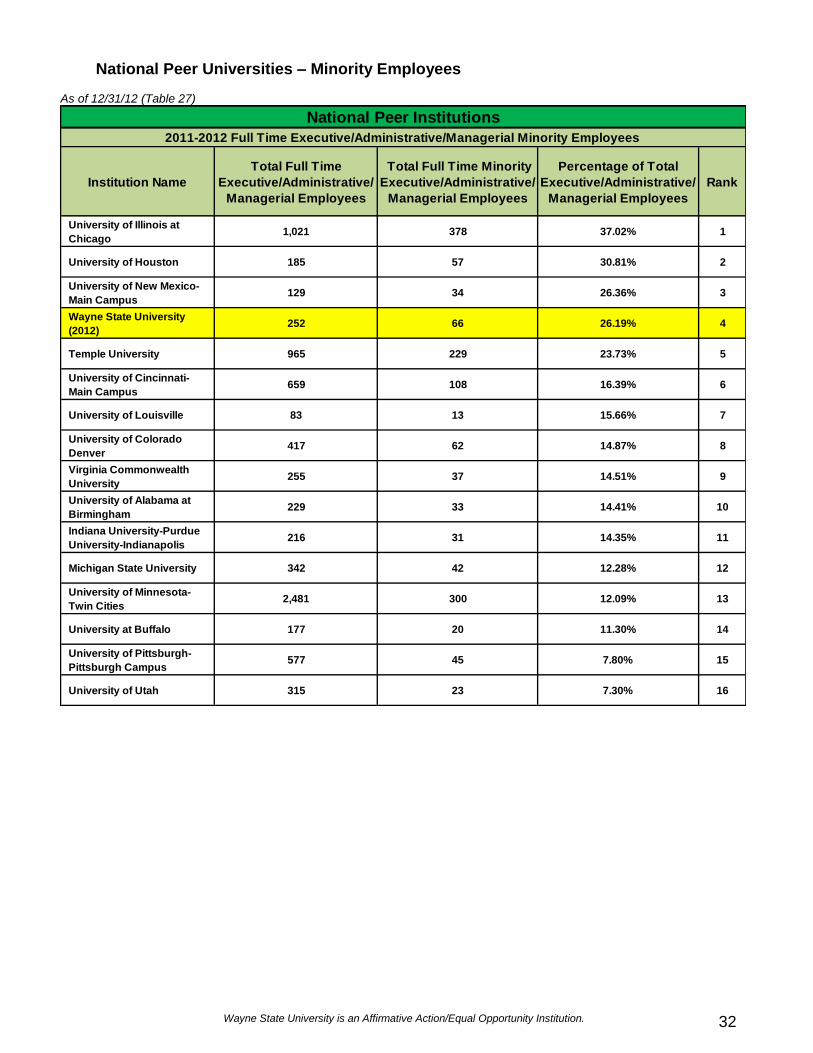
National Peer Universities – Minority Employees
As of 12/31/12 (Table 27)
Institution Name
Total Full Time
Executive/Administrative/
Managerial Employees
Total Full Time Minority
Executive/Administrative/
Managerial Employees
Percentage of Total
Executive/Administrative/
Managerial Employees
Rank
University of Illinois at
Chicago1,021 378 37.02% 1
University of Houston 185 57 30.81% 2
University of New Mexico-
Main Campus129 34 26.36% 3
Wayne State University
(2012)252 66 26.19% 4
Temple University 965 229 23.73% 5
University of Cincinnati-
Main Campus659 108 16.39% 6
University of Louisville 83 13 15.66% 7
University of Colorado
Denver417 62 14.87% 8
Virginia Commonwealth
University255 37 14.51% 9
University of Alabama at
Birmingham229 33 14.41% 10
Indiana University-Purdue
University-Indianapolis216 31 14.35% 11
Michigan State University 342 42 12.28% 12
University of Minnesota-
Twin Cities2,481 300 12.09% 13
University at Buffalo 177 20 11.30% 14
University of Pittsburgh-
Pittsburgh Campus577 45 7.80% 15
University of Utah 315 23 7.30% 16
National Peer Institutions
2011-2012 Full Time Executive/Administrative/Managerial Minority Employees
Wayne State University is an Affirmative Action/Equal Opportunity Institution. 33
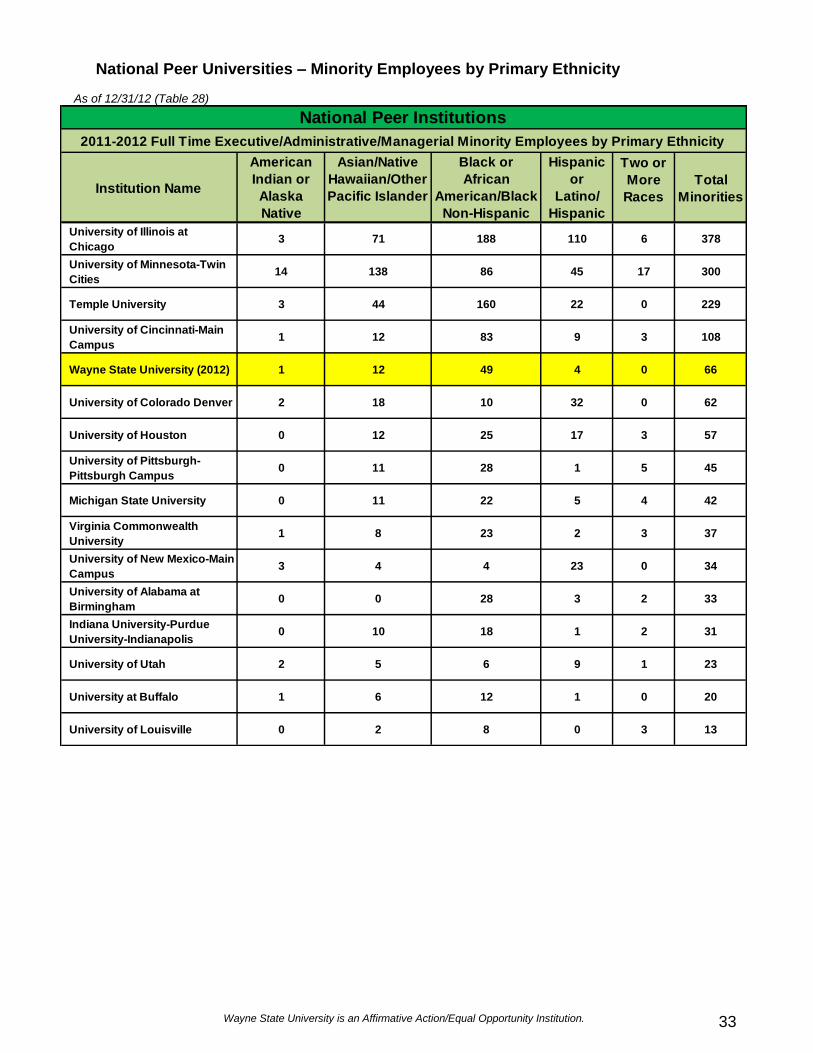
National Peer Universities – Minority Employees by Primary Ethnicity
As of 12/31/12 (Table 28)
Institution Name
American
Indian or
Alaska
Native
Asian/Native
Hawaiian/Other
Pacific Islander
Black or
African
American/Black
Non-Hispanic
Hispanic
or
Latino/
Hispanic
Two or
More
Races
Total
Minorities
University of Illinois at
Chicago3 71 188 110 6 378
University of Minnesota-Twin
Cities14 138 86 45 17 300
Temple University 3 44 160 22 0 229
University of Cincinnati-Main
Campus1 12 83 9 3 108
Wayne State University (2012) 1 12 49 4 0 66
University of Colorado Denver 2 18 10 32 0 62
University of Houston 0 12 25 17 3 57
University of Pittsburgh-
Pittsburgh Campus0 11 28 1 5 45
Michigan State University 0 11 22 5 4 42
Virginia Commonwealth
University1 8 23 2 3 37
University of New Mexico-Main
Campus3 4 4 23 0 34
University of Alabama at
Birmingham0 0 28 3 2 33
Indiana University-Purdue
University-Indianapolis0 10 18 1 2 31
University of Utah 2 5 6 9 1 23
University at Buffalo 1 6 12 1 0 20
University of Louisville 0 2 8 0 3 13
National Peer Institutions
2011-2012 Full Time Executive/Administrative/Managerial Minority Employees by Primary Ethnicity
Wayne State University is an Affirmative Action/Equal Opportunity Institution. 34
II. UNIVERSITY COMPLAINTS OF DISCRIMINATION AND HARASSMENT The Office of Equal Opportunity (“OEO”) is responsible for investigating complaints arising under the University’s Non-Discrimination Policy and Sexual Harassment Statute. When contacted by a potential Complainant, the OEO assesses first whether the allegations fall within the scope of the Non-Discrimination or Sexual Harassment policies. If not, the OEO will refer the Complainant to the proper forum to address the issue, such as Human Resources, Labor Relations, the Ombudsperson or the Dean of Students Office. If the allegations fall within OEO’s jurisdiction, the OEO conducts an initial inquiry into the complaint. Initial inquires are used to determine if there is sufficient factual support for the allegations to warrant a full investigation. In some cases, the initial inquiry itself resolves the matter. If the initial inquiry has merit, a formal complaint is initiated. Formal complaints are adjudicated by using the procedures set forth in University Policy 2005-03. The OEO also serves as the university point of contact to complaints of discrimination and harassment brought to external agencies, such as the Michigan Department of Civil Rights (“MDCR”), the United States Equal Employment Opportunity Commission (“EEOC”), the United States Department of Education, Office of Civil Rights (“OCR”), and the Department of Labor, Office of Federal Contract Compliance Programs (“OFCCP”). For purposes of this report, such charges are included as “formal complaints.”
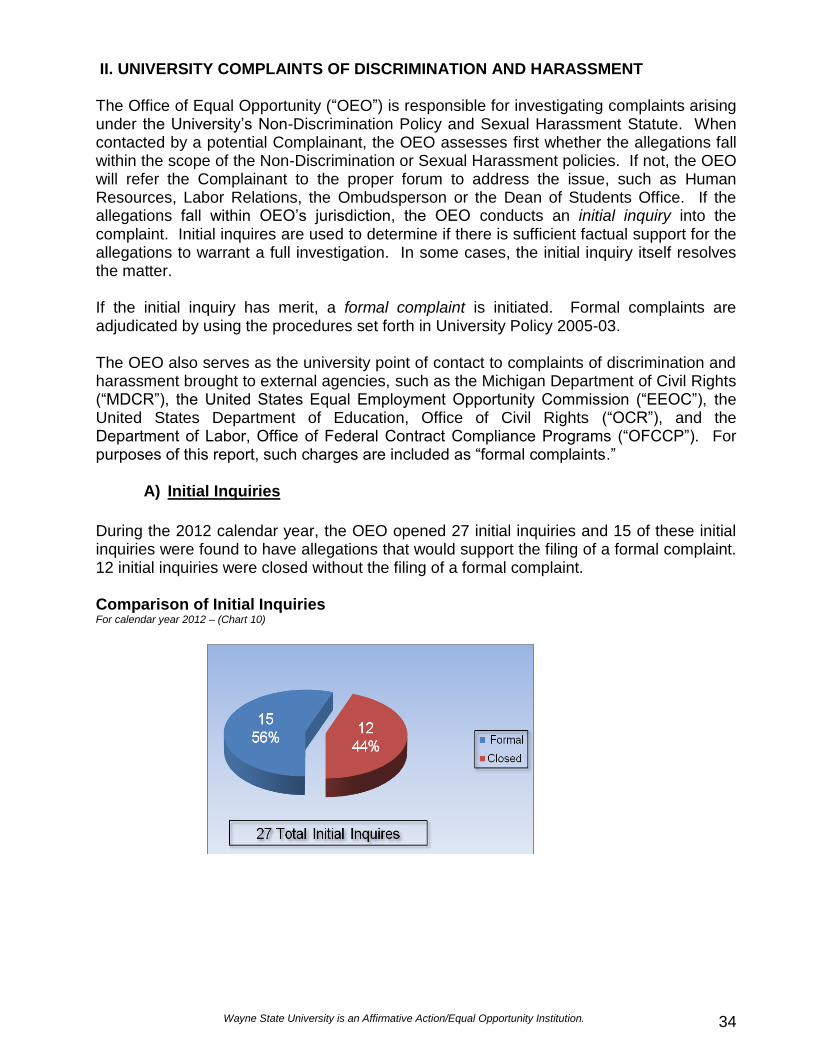
A) Initial Inquiries During the 2012 calendar year, the OEO opened 27 initial inquiries and 15 of these initial inquiries were found to have allegations that would support the filing of a formal complaint. 12 initial inquiries were closed without the filing of a formal complaint. Comparison of Initial Inquiries For calendar year 2012 – (Chart 10)
Wayne State University is an Affirmative Action/Equal Opportunity Institution. 35
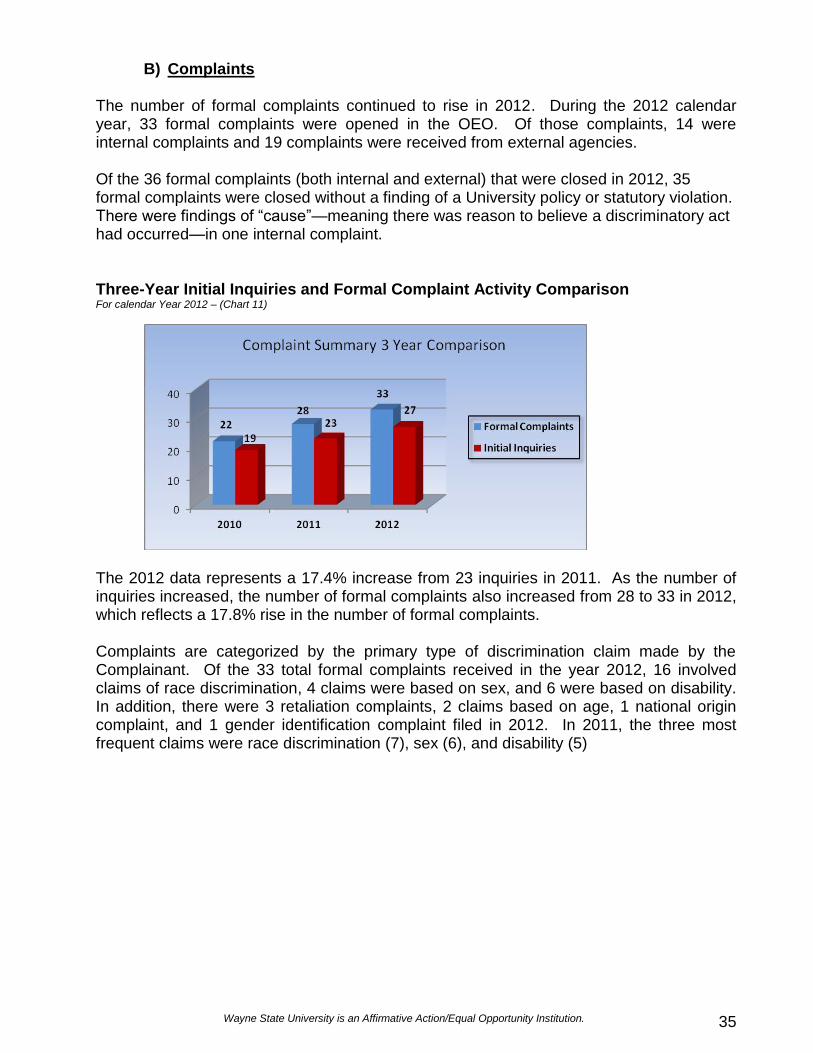
B) Complaints The number of formal complaints continued to rise in 2012. During the 2012 calendar year, 33 formal complaints were opened in the OEO. Of those complaints, 14 were internal complaints and 19 complaints were received from external agencies. Of the 36 formal complaints (both internal and external) that were closed in 2012, 35 formal complaints were closed without a finding of a University policy or statutory violation. There were findings of “cause”—meaning there was reason to believe a discriminatory act had occurred—in one internal complaint. Three-Year Initial Inquiries and Formal Complaint Activity Comparison For calendar Year 2012 – (Chart 11)
The 2012 data represents a 17.4% increase from 23 inquiries in 2011. As the number of inquiries increased, the number of formal complaints also increased from 28 to 33 in 2012, which reflects a 17.8% rise in the number of formal complaints. Complaints are categorized by the primary type of discrimination claim made by the Complainant. Of the 33 total formal complaints received in the year 2012, 16 involved claims of race discrimination, 4 claims were based on sex, and 6 were based on disability. In addition, there were 3 retaliation complaints, 2 claims based on age, 1 national origin complaint, and 1 gender identification complaint filed in 2012. In 2011, the three most frequent claims were race discrimination (7), sex (6), and disability (5)
Wayne State University is an Affirmative Action/Equal Opportunity Institution. 36
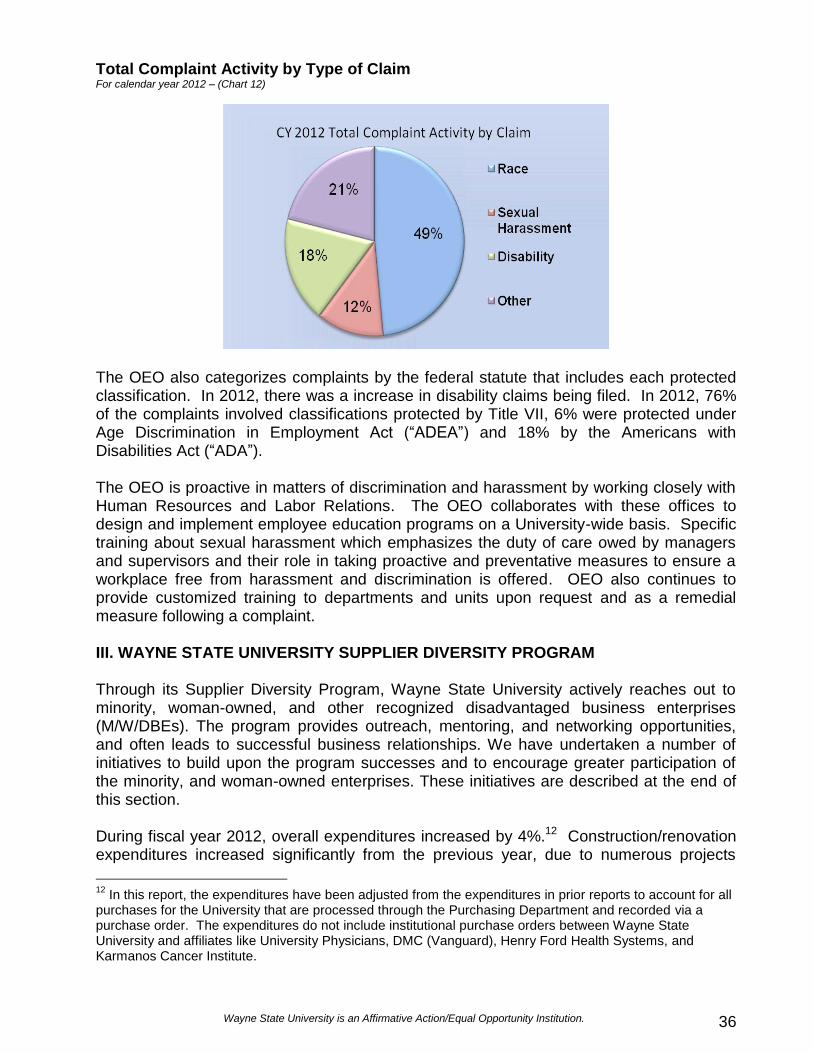
Total Complaint Activity by Type of Claim For calendar year 2012 – (Chart 12)
The OEO also categorizes complaints by the federal statute that includes each protected classification. In 2012, there was a increase in disability claims being filed. In 2012, 76% of the complaints involved classifications protected by Title VII, 6% were protected under Age Discrimination in Employment Act (“ADEA”) and 18% by the Americans with Disabilities Act (“ADA”). The OEO is proactive in matters of discrimination and harassment by working closely with Human Resources and Labor Relations. The OEO collaborates with these offices to design and implement employee education programs on a University-wide basis. Specific training about sexual harassment which emphasizes the duty of care owed by managers and supervisors and their role in taking proactive and preventative measures to ensure a workplace free from harassment and discrimination is offered. OEO also continues to provide customized training to departments and units upon request and as a remedial measure following a complaint. III. WAYNE STATE UNIVERSITY SUPPLIER DIVERSITY PROGRAM Through its Supplier Diversity Program, Wayne State University actively reaches out to minority, woman-owned, and other recognized disadvantaged business enterprises (M/W/DBEs). The program provides outreach, mentoring, and networking opportunities, and often leads to successful business relationships. We have undertaken a number of initiatives to build upon the program successes and to encourage greater participation of the minority, and woman-owned enterprises. These initiatives are described at the end of this section. During fiscal year 2012, overall expenditures increased by 4%.12 Construction/renovation expenditures increased significantly from the previous year, due to numerous projects
12
In this report, the expenditures have been adjusted from the expenditures in prior reports to account for all purchases for the University that are processed through the Purchasing Department and recorded via a purchase order. The expenditures do not include institutional purchase orders between Wayne State University and affiliates like University Physicians, DMC (Vanguard), Henry Ford Health Systems, and Karmanos Cancer Institute.
Wayne State University is an Affirmative Action/Equal Opportunity Institution. 37
such as the Multidisciplinary Biomedical Research Building (MBRB), the McGregor Pond, Physics Building Renovations, Parking Structure Renovations, and Energy Conservation projects with Siemens. General purchases for non-construction goods and services decreased by 13% when compared to 2011.
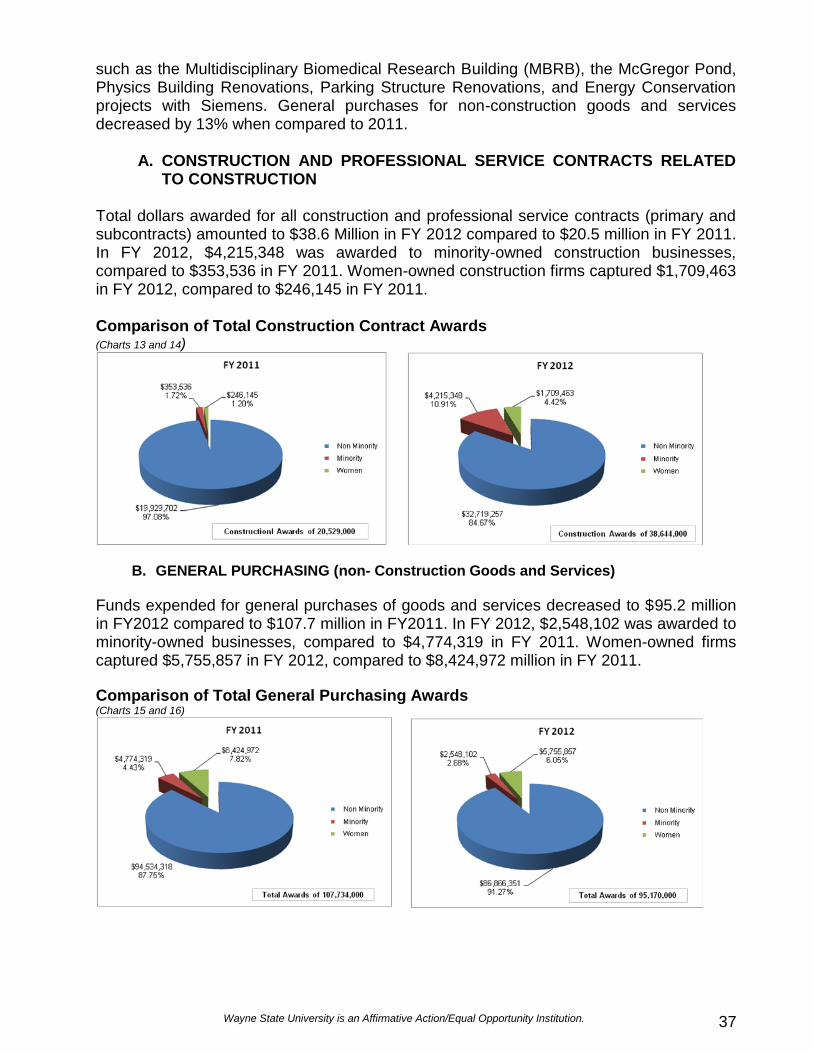
A. CONSTRUCTION AND PROFESSIONAL SERVICE CONTRACTS RELATED
TO CONSTRUCTION Total dollars awarded for all construction and professional service contracts (primary and subcontracts) amounted to $38.6 Million in FY 2012 compared to $20.5 million in FY 2011. In FY 2012, $4,215,348 was awarded to minority-owned construction businesses, compared to $353,536 in FY 2011. Women-owned construction firms captured $1,709,463 in FY 2012, compared to $246,145 in FY 2011. Comparison of Total Construction Contract Awards (Charts 13 and 14)
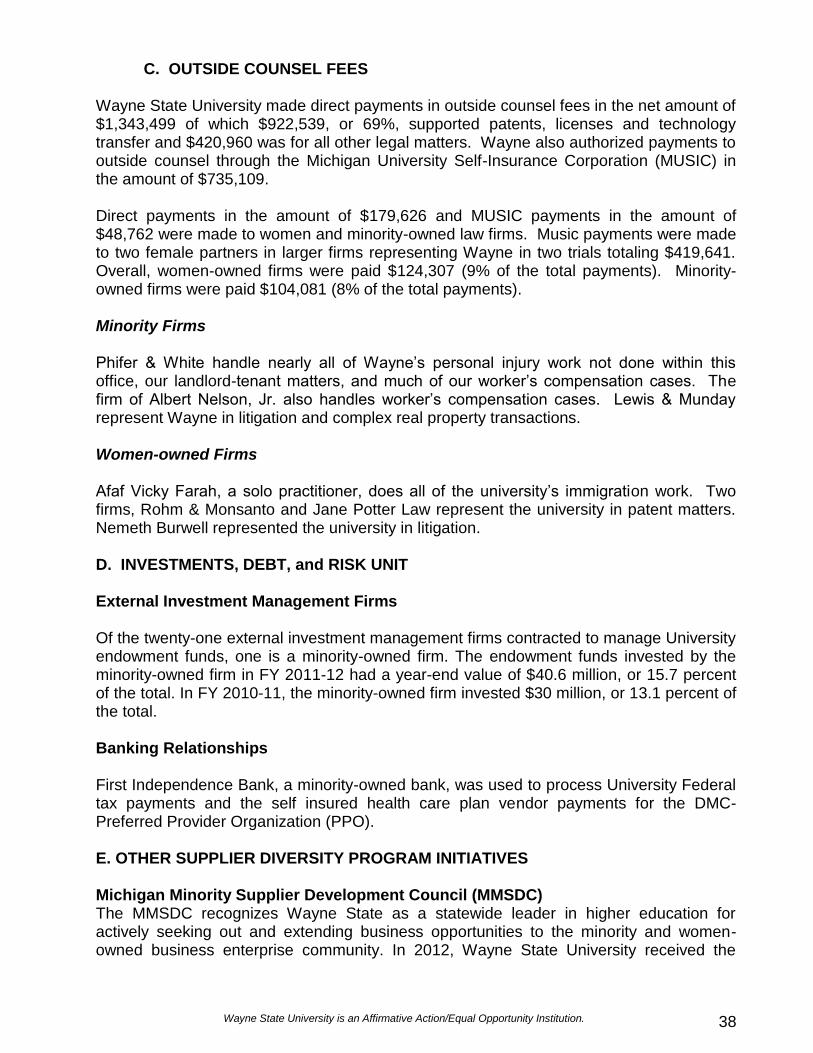
B. GENERAL PURCHASING (non- Construction Goods and Services)
Funds expended for general purchases of goods and services decreased to $95.2 million in FY2012 compared to $107.7 million in FY2011. In FY 2012, $2,548,102 was awarded to minority-owned businesses, compared to $4,774,319 in FY 2011. Women-owned firms captured $5,755,857 in FY 2012, compared to $8,424,972 million in FY 2011.
Comparison of Total General Purchasing Awards (Charts 15 and 16)
Wayne State University is an Affirmative Action/Equal Opportunity Institution. 38
C. OUTSIDE COUNSEL FEES Wayne State University made direct payments in outside counsel fees in the net amount of $1,343,499 of which $922,539, or 69%, supported patents, licenses and technology transfer and $420,960 was for all other legal matters. Wayne also authorized payments to outside counsel through the Michigan University Self-Insurance Corporation (MUSIC) in the amount of $735,109. Direct payments in the amount of $179,626 and MUSIC payments in the amount of $48,762 were made to women and minority-owned law firms. Music payments were made to two female partners in larger firms representing Wayne in two trials totaling $419,641. Overall, women-owned firms were paid $124,307 (9% of the total payments). Minority-owned firms were paid $104,081 (8% of the total payments). Minority Firms Phifer & White handle nearly all of Wayne’s personal injury work not done within this office, our landlord-tenant matters, and much of our worker’s compensation cases. The firm of Albert Nelson, Jr. also handles worker’s compensation cases. Lewis & Munday represent Wayne in litigation and complex real property transactions. Women-owned Firms Afaf Vicky Farah, a solo practitioner, does all of the university’s immigration work. Two firms, Rohm & Monsanto and Jane Potter Law represent the university in patent matters. Nemeth Burwell represented the university in litigation. D. INVESTMENTS, DEBT, and RISK UNIT External Investment Management Firms Of the twenty-one external investment management firms contracted to manage University endowment funds, one is a minority-owned firm. The endowment funds invested by the minority-owned firm in FY 2011-12 had a year-end value of $40.6 million, or 15.7 percent of the total. In FY 2010-11, the minority-owned firm invested $30 million, or 13.1 percent of the total. Banking Relationships First Independence Bank, a minority-owned bank, was used to process University Federal tax payments and the self insured health care plan vendor payments for the DMC-Preferred Provider Organization (PPO).
E. OTHER SUPPLIER DIVERSITY PROGRAM INITIATIVES Michigan Minority Supplier Development Council (MMSDC) The MMSDC recognizes Wayne State as a statewide leader in higher education for actively seeking out and extending business opportunities to the minority and women-owned business enterprise community. In 2012, Wayne State University received the
Wayne State University is an Affirmative Action/Equal Opportunity Institution. 39
MMSDC Corporation of the Year – Education Sector Award. This is the eleventh time the University has been so honored since the program’s inception in 1989, the most of any participating institution. In addition, the University received MMSDC’s Corporate ONE Award in July 2012 for meeting each of the seven criteria required for this award. Both awards are on display in the offices of Procurement & Strategic Sourcing. 24th Annual Diversity and Detroit Based Business Conference On July 13, 2012, Wayne State welcomed more than 200 minority-owned, women-owned, and Detroit based business enterprises to our annual event. We brought together representatives from across the campus to meet with Business Owners offering a wide variety of goods and services such as construction, snow removal, consulting, and technical support. Representatives from the Computing and Information Technology, Facilities Planning and Management, Housing and Procurement units engaged in networking, information gathering and business-to-business referrals for the minority business owners in attendance. We were also joined by procurement representatives from the Detroit Medical Center, Henry Ford Health Systems, the Detroit Economic Growth Corporation (DEGC) and Midtown Inc. The event is held in the Matthaei Athletic Center. Council of Supplier Diversity Professionals (CSDP) Wayne State is a member of the Council of Supplier Diversity Professionals, an organization established in 1988 that is devoted to sharing information, ideas, and issues relative to supplier diversity and to the growth and development of minority and women-owned businesses. Membership in this Council gives us access to directories, seminars, webinars and workshops that expand and enhance our relationships with minority and women owned business enterprises. Kenneth Doherty, Assistant Vice President of Procurement and Strategic Sourcing, serves on its Board of Directors as the Technology chairperson. NAWBO and CEED Wayne State’s memberships in the Women's Business Enterprise Council - Great Lakes (WBEC-GL) and the Center for Empowerment and Economic Development (CEED) provide access to the strongest and most active women business owners networking groups. Through their training and certification programs, we connect with the most viable female owned companies. These memberships reap a valuable return on our investments. Our total expenditures with women owned companies have remained strong in 2012. The University participated in the 12th Annual Great Lakes Women’s Business Conference event in October 2012, to meet women business owners and share information on how to conduct business with the University.
Wayne State University is an Affirmative Action/Equal Opportunity Institution. 40
Small & Diverse Business Workshops The University has a strong presence in the small business community. Our goal is to educate small business owners on our policies and procedures in order to work more effectively with the University. In addition to hosting the Annual Diversity and Detroit Based Business Conference (July 2012), Wayne is actively engaged in a wide variety of conferences and workshops sponsored, such as the Detroit Regional Chamber Meet the Purchasers (May and November 2012) the Michigan Minority Procurement Conference (May 2012), the CEED Entrepreneur Roundtable (May 2012), the National Association of Black Accountants Scholarship Banquet (June 2012), Michigan Minority Contractors Association meeting (August 2012), and the Procurement Technical Assistance Center (PTAC).
IV. HIGHLIGHTS OF OFFICE OF EQUAL OPPORTUNITY ACTIVITIES The Office of Equal Opportunity is led by a Director and staffed by two Equal Opportunity Specialists. The professional staff is supported by an Administrative Assistant and a student assistant. During 2012, OEO staff continued to participate in local organizations, including the Michigan Diversity Leadership Council, and national conferences. Outreach efforts continued to promote a diverse environment. OEO continued to provide Faculty Search Committee Training to Colleges and Schools upon request. This training is designed to assist the Search Committees in preparing to search for qualified faculty from a diverse pool. This training also emphasizes the use of the On-line Hiring System in implementing an automated system to execute the hiring of academic staff and the updated technology for the Applicant/Hire process, as well as the OEO Faculty Hiring Plan forms, which require each division to evaluate their full-time faculty data and national availability statistics to demonstrate our efforts to seek diversity in our academic staff. The OEO also completed an update of its on-line presence, including a reorganization of the office website and development of a periodical newsletter. The reorganization included an update of applicable laws covering affirmative action, equal opportunity, discrimination and harassment, an enhanced section addressing frequently asked questions to better assist individuals accessing OEO’s services, and on-line forms for employees to request accommodations for a disability. The newsletter, “The OEO Register,” is a collection of news and events related to diversity, inclusion, and equal opportunity that have significance to the university community. Training initiatives were continued throughout 2012. The OEO continued to provide training sessions on Sexual Harassment Prevention to both management-level personnel and other staff, in addition to Diversity Training through the Organization and Employee Development Office. In 2012, the OEO partnered with Human Resources to bring computerized sexual harassment training to all employees at Wayne. The WSU On-line Sexual Harassment Module, “Preventing Harassment on Campus,” was delivered in a format that allowed employees to complete the training at a self-directed pace, providing broader access than previous training modes. The OEO continues to serve as the ADA Title I Coordinator for Wayne. In this role, the OEO evaluates disability accommodation requests from employees, and serves as a
Wayne State University is an Affirmative Action/Equal Opportunity Institution. 41
resource regarding issues of accessibility on campus. The OEO Director also serves on the ADA Advisory Committee to address issues of accessibility at Wayne. In 2012, the OEO Director was designated as the Title IX Coordinator for Wayne, providing coordination for those reports of sex discrimination protected under the federal law and investigation of incidents that allege violations of Wayne’s non-discrimination and harassment policies.
PROPOSAL 2
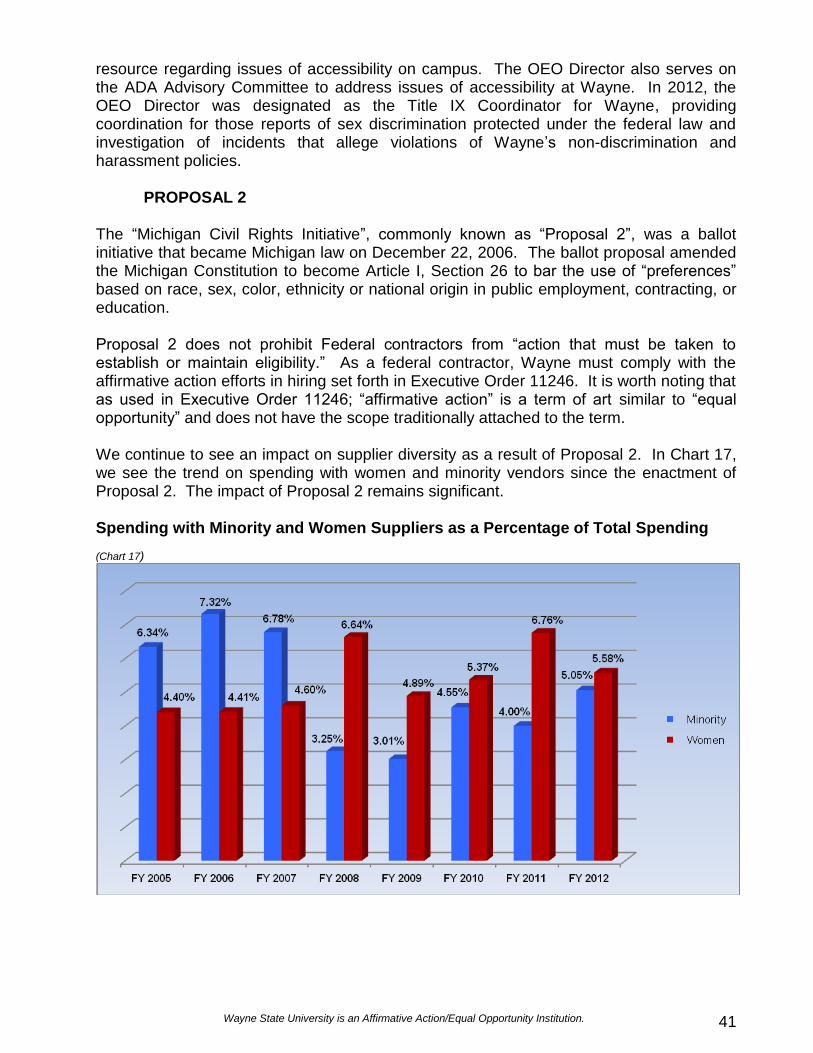
The “Michigan Civil Rights Initiative”, commonly known as “Proposal 2”, was a ballot initiative that became Michigan law on December 22, 2006. The ballot proposal amended the Michigan Constitution to become Article I, Section 26 to bar the use of “preferences” based on race, sex, color, ethnicity or national origin in public employment, contracting, or education. Proposal 2 does not prohibit Federal contractors from “action that must be taken to establish or maintain eligibility.” As a federal contractor, Wayne must comply with the affirmative action efforts in hiring set forth in Executive Order 11246. It is worth noting that as used in Executive Order 11246; “affirmative action” is a term of art similar to “equal opportunity” and does not have the scope traditionally attached to the term. We continue to see an impact on supplier diversity as a result of Proposal 2. In Chart 17, we see the trend on spending with women and minority vendors since the enactment of Proposal 2. The impact of Proposal 2 remains significant. Spending with Minority and Women Suppliers as a Percentage of Total Spending
(Chart 17)
Wayne State University is an Affirmative Action/Equal Opportunity Institution. 42
APPENDICES I. Definition of EEO Job Categories
Executive, Administrative and Managerial Persons whose assignments require primary and major responsibility for management of the institution, or a customarily recognized department or subdivision. Assignments require the performance of work directly related to management policies or general business operations of the institution department or subdivision, etc. Reported in this category are employees holding such positions as president, vice president, dean, director or the equivalent, as well as management employees such as associate and assistant deans, division and academic department heads (chairs), or the equivalent if their principal responsibilities are administrative in nature.
Faculty (Instruction / Research / Public Service) Persons whose principal responsibilities customarily are for the purpose of instruction, research or public service and who hold academic-rank titles of professor, associate professor, assistant professor, instructor, lecturer or the equivalent Reported in this category are deans, directors or the equivalent, as well as associate deans, assistant deans and executive officers of academic departments (chairs, heads, or the equivalent). This definition does not include student teaching or research assistants or medical interns or residents.
Other Professionals (Support / Service) Persons employed for the primary purpose of performing academic support, student service and institutional support activities, and whose assignments would require either college graduation or experience that would provide a comparable background. Includes positions such as librarians, accountants, personnel professionals, counselors, systems analysts, coaches and assistant general counsel.
Clerical / Secretarial Includes administrative support occupations, including all clerical-type work regardless of level of difficulty, where the activities are predominately non-manual, though some manual work not directly involved with altering or transporting the products is included.
Technical / Paraprofessional Persons whose assignments require special knowledge or skills that may be acquired through experience or academic work as offered in many two-year technical institutions and junior colleges, or through equivalent on-the-job training. Includes computer programmers and operators, drafters, engineering aides, junior engineers, mathematical aides, licensed practical or vocational nurses, dietitians, photographers, radio operators, scientific assistants, technical illustrators, technicians (medical, dental, electronic, physical sciences), and similar occupational-activity categories that are institutionally defined as technical assignments.
Wayne State University is an Affirmative Action/Equal Opportunity Institution. 43
Skilled Trades / Crafts Persons whose assignments typically require special manual skills, and a thorough and comprehensive knowledge of the processes involved in the work, as acquired through on-the-job training and experience, or through apprenticeship or other formal training programs. Includes mechanical operators and repairers, electricians, stationary engineers, skilled machinists, carpenters, compositors and typesetters, and upholsterers.
Service / Maintenance Persons whose assignments require limited degrees of previously acquired skills and knowledge. Persons who perform duties that result in or contribute to the comfort, convenience and hygiene of personnel and students, or that contribute to the upkeep and care of buildings, facilities or grounds of the institution. Includes chauffeurs, laundry and dry-cleaning operators, cafeteria and restaurant workers, truck drivers, bus drivers, garage laborers, custodial personnel, gardeners and groundskeepers, refuse collectors, construction laborers and security personnel. II. Responsibility for Affirmative Action Wayne State University’s President has overall responsibility for implementation of the Wayne State University Affirmative Action/Equal Opportunity Program. Wayne has assigned primary management responsibility and accountability for ensuring full compliance with the program to the Office of Equal Opportunity, which reports to the Vice President and General Counsel. The Director of Equal Opportunity has the authority and resources, as well as the support of and access to the executive management, to ensure effective implementation of the Affirmative Action Program. The President actively supports the program and provides assistance whenever needed, making managers and supervisors aware of the program and requesting their cooperation and assistance. Office of Equal Opportunity is responsible for the following: Developing policy statements, Affirmative Action Plan programs, methods, and
internal and external communication techniques. Policies and procedures will continue to be developed to ensure an efficient and positive interaction between the Office of Equal Opportunity and managers charged with hiring staff.
Assisting management and supervisors in devising solutions to equal employment
problems, including counseling and training, to ensure full understanding of affirmative action and equal employment opportunity (“EEO”) policies and procedures.
Designing and implementing monitoring and reporting methods to measure the effectiveness of Wayne’s program; to indicate need for remedial action; and to determine the degree to which Wayne’s goals and objectives are being met.
Providing management a working understanding of the goals and objectives in Wayne's Affirmative Action Plan.
Wayne State University is an Affirmative Action/Equal Opportunity Institution. 44
Meeting with managers, supervisors, and employees to assure that Wayne's EEO policies are being followed.
Acting as a liaison between Wayne and enforcement agencies. Acting as a liaison between Wayne and appropriate minority and women's
organizations and community action groups concerned with employment opportunities for minorities and women.
Supporting contact between Wayne and predominately female and minority high
schools, colleges, and technical schools in the area as needed.
Keeping management informed of developments in the EEO and affirmative action field.
Conducting a periodic audit to ensure that Wayne complies in the following ways:
Making sure EEO posters are properly displayed.
Making sure that all University employees have the opportunity and are encouraged to participate in University-sponsored educational, training, recreational and social activities.
III. Definition of Terms Black: A person having origins in any of the black racial groups of Africa, but not Hispanic. Asian or Pacific Islander: A person having origins in any of the original people of the Far East, Southeast Asia, the Indian subcontinent or the Pacific Islands. Hispanic: A person of Mexican, Puerto Rican, Cuban, Central or South American, or other Spanish culture or origin, regardless of race. Native American or Alaskan Native: A person having origins in any of the original peoples of North America, and who maintains cultural identification through tribal affiliation or community recognition. Caucasian or White: A person who is not included in any of the four ethnic identifications listed above. Disability: Defined by both state and federal law. Generally, refers to a person who has a physical or mental impairment that substantially limits one or more major life activities, or has a record of such impairment, or is regarded as having such impairment. Americans with Disabilities Act: In the first instance, disability status is self-identified by faculty, staff and students.
13
Wayne State University is an Affirmative Action/Equal Opportunity Institution. 45
IV. Academic Classifications Professor: Includes full professor, distinguished professor, visiting professor, university professor, and professor (clinical), professor (research). Associate Professor: Includes visiting associate professor, associate professor (clinical), associate professor (research).
Assistant Professor: Includes visiting assistant professor, assistant professor (clinical), assistant professor (research). V. Other Employee Definitions Full-time Employee: Academic staff and non-academic employees whose assignments add up to a full-time equivalency (“FTE”) of 1.0. Full-time Faculty: Faculty whose assignments are tenure or non-tenure system with a FTE of .50 or above. Tenure-System Faculty: Faculty appointed to the tenure-system or granted tenure by Board of Governors Statute. Faculty in the tenure-system may hold an academic rank of Professor, Associate Professor and Assistant Professor. Fractional-time Employee: Academic and non-academic employees whose assignments add up to a FTE of 0.50 to 0.99. Casual or Part-time Employee: Academic and non-academic employees whose assignments add up to 0.49 or less assignments add up to 0.49 or less.
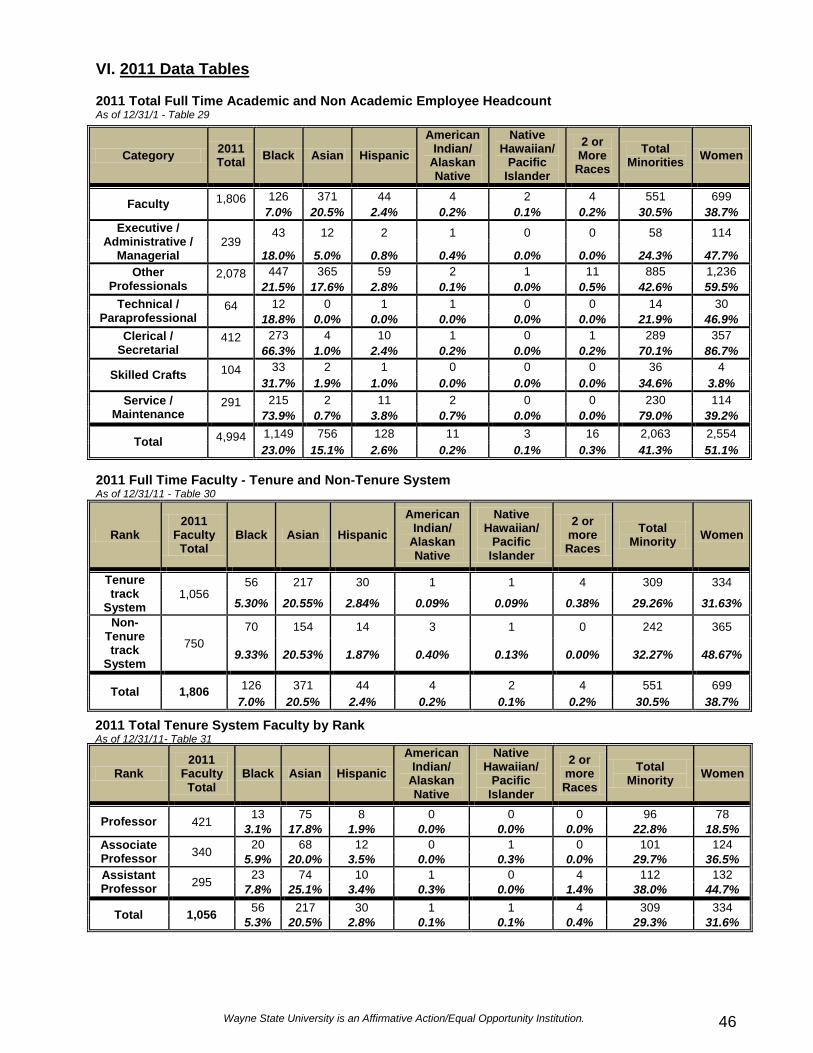
Wayne State University is an Affirmative Action/Equal Opportunity Institution. 46
VI. 2011 Data Tables 2011 Total Full Time Academic and Non Academic Employee Headcount As of 12/31/1 - Table 29
2011 Full Time Faculty - Tenure and Non-Tenure System As of 12/31/11 - Table 30
Rank 2011
Faculty Total
Black Asian Hispanic
American Indian/
Alaskan Native
Native Hawaiian/
Pacific Islander
2 or more Races
Total Minority
Women
Tenure track
System 1,056
56 217 30 1 1 4 309 334
5.30% 20.55% 2.84% 0.09% 0.09% 0.38% 29.26% 31.63%
Non-Tenure track
System
750
70 154 14 3 1 0 242 365
9.33% 20.53% 1.87% 0.40% 0.13% 0.00% 32.27% 48.67%
Total 1,806 126 371 44 4 2 4 551 699
7.0% 20.5% 2.4% 0.2% 0.1% 0.2% 30.5% 38.7%
Rank 2011
Faculty Total
Black Asian Hispanic
American Indian/
Alaskan Native
Native Hawaiian/
Pacific Islander
2 or more Races
Total Minority
Women
Professor 421 13 75 8 0 0 0 96 78
3.1% 17.8% 1.9% 0.0% 0.0% 0.0% 22.8% 18.5%
Associate Professor
340 20 68 12 0 1 0 101 124
5.9% 20.0% 3.5% 0.0% 0.3% 0.0% 29.7% 36.5%
Assistant Professor
295 23 74 10 1 0 4 112 132
7.8% 25.1% 3.4% 0.3% 0.0% 1.4% 38.0% 44.7%
Total 1,056 56 217 30 1 1 4 309 334
5.3% 20.5% 2.8% 0.1% 0.1% 0.4% 29.3% 31.6%
Category 2011 Total
Black Asian Hispanic
American Indian/
Alaskan Native
Native Hawaiian/
Pacific Islander
2 or More Races
Total Minorities
Women
Faculty 1,806
126 371 44 4 2 4 551 699
7.0% 20.5% 2.4% 0.2% 0.1% 0.2% 30.5% 38.7%
Executive / Administrative /
Managerial 239
43 12 2 1 0 0 58 114
18.0% 5.0% 0.8% 0.4% 0.0% 0.0% 24.3% 47.7%
Other Professionals
2,078
447 365 59 2 1 11 885 1,236
21.5% 17.6% 2.8% 0.1% 0.0% 0.5% 42.6% 59.5%
Technical / Paraprofessional
64
12 0 1 1 0 0 14 30
18.8% 0.0% 0.0% 0.0% 0.0% 0.0% 21.9% 46.9%
Clerical / Secretarial
412
273 4 10 1 0 1 289 357
66.3% 1.0% 2.4% 0.2% 0.0% 0.2% 70.1% 86.7%
Skilled Crafts 104
33 2 1 0 0 0 36 4
31.7% 1.9% 1.0% 0.0% 0.0% 0.0% 34.6% 3.8%
Service / Maintenance
291
215 2 11 2 0 0 230 114
73.9% 0.7% 3.8% 0.7% 0.0% 0.0% 79.0% 39.2%
Total 4,994
1,149 756 128 11 3 16 2,063 2,554
23.0% 15.1% 2.6% 0.2% 0.1% 0.3% 41.3% 51.1%
2011 Total Tenure System Faculty by Rank As of 12/31/11- Table 31
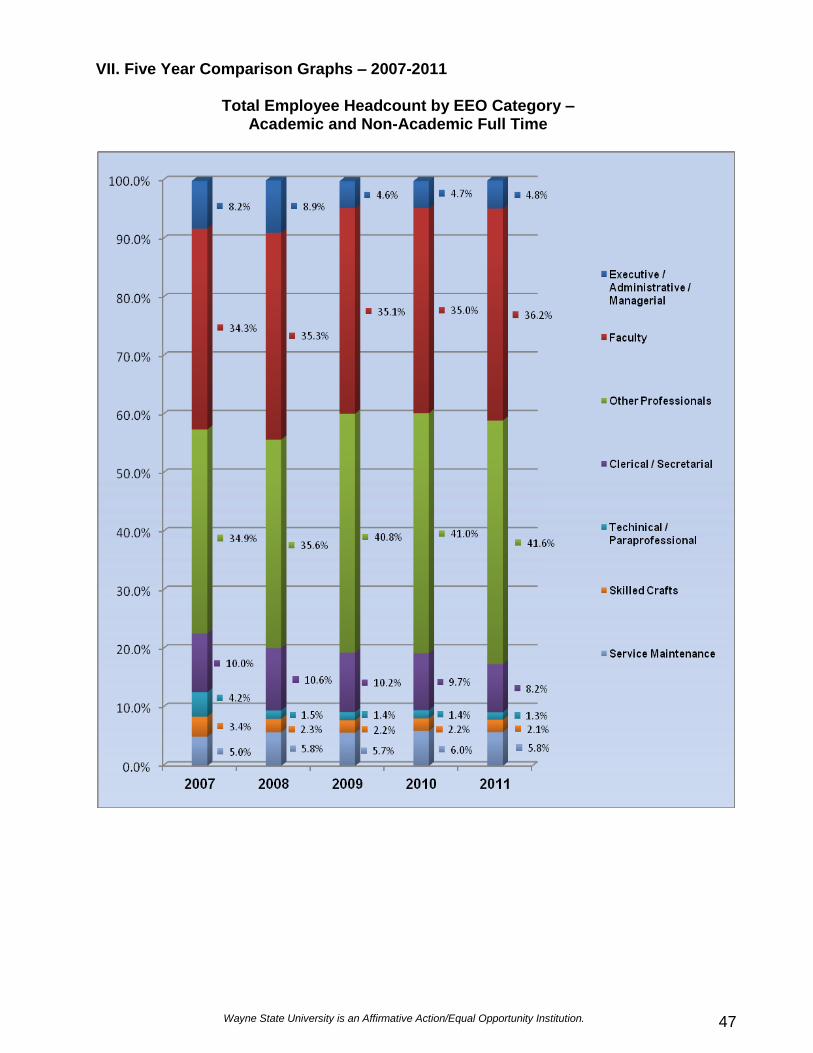
Wayne State University is an Affirmative Action/Equal Opportunity Institution. 47
VII. Five Year Comparison Graphs – 2007-2011
Total Employee Headcount by EEO Category – Academic and Non-Academic Full Time
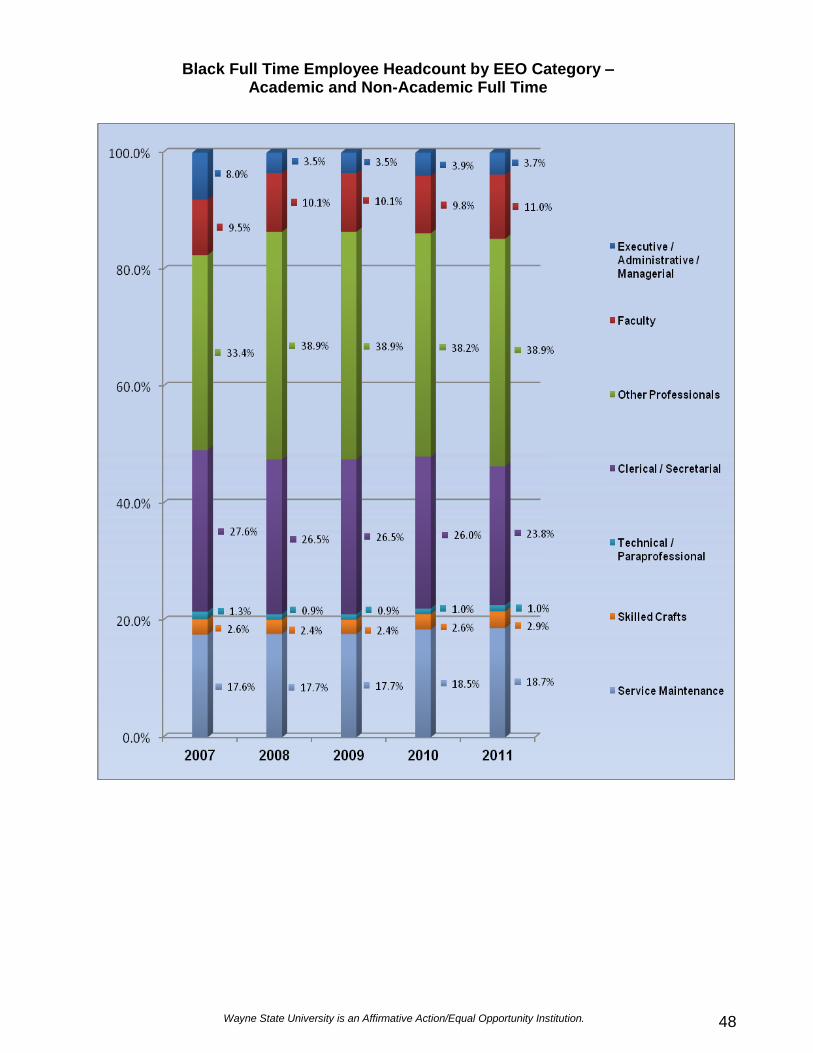
Wayne State University is an Affirmative Action/Equal Opportunity Institution. 48
Black Full Time Employee Headcount by EEO Category – Academic and Non-Academic Full Time
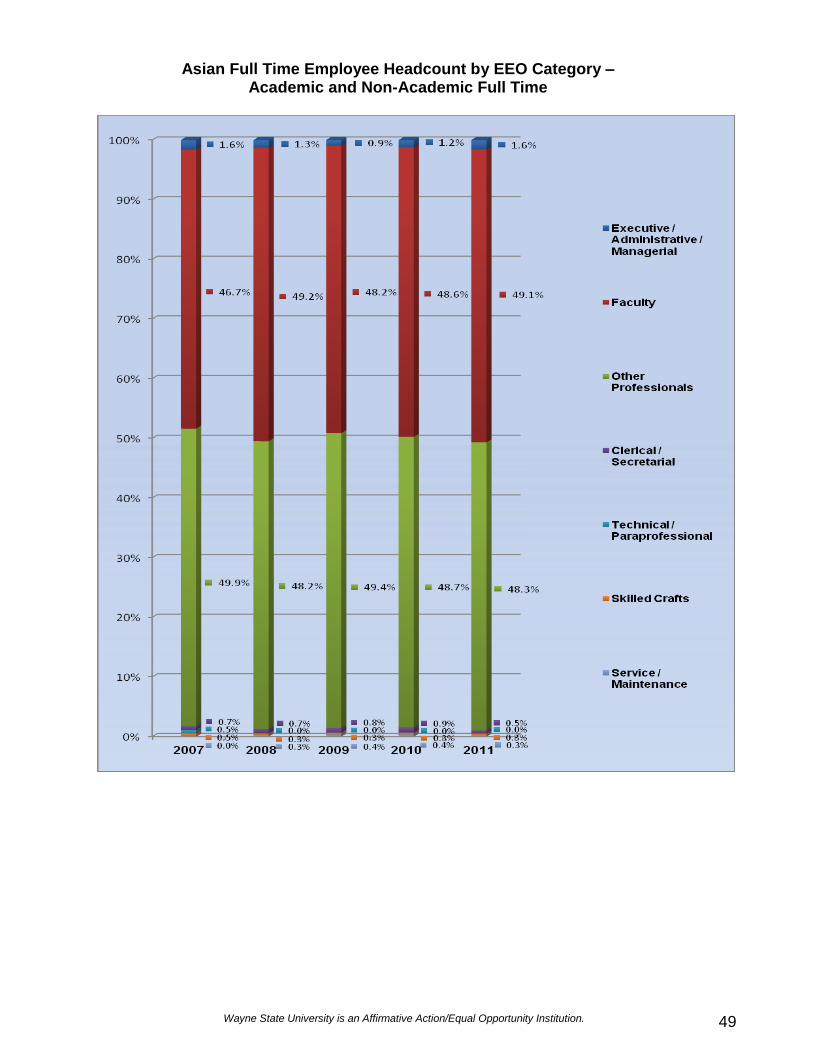
Wayne State University is an Affirmative Action/Equal Opportunity Institution. 49
Asian Full Time Employee Headcount by EEO Category – Academic and Non-Academic Full Time
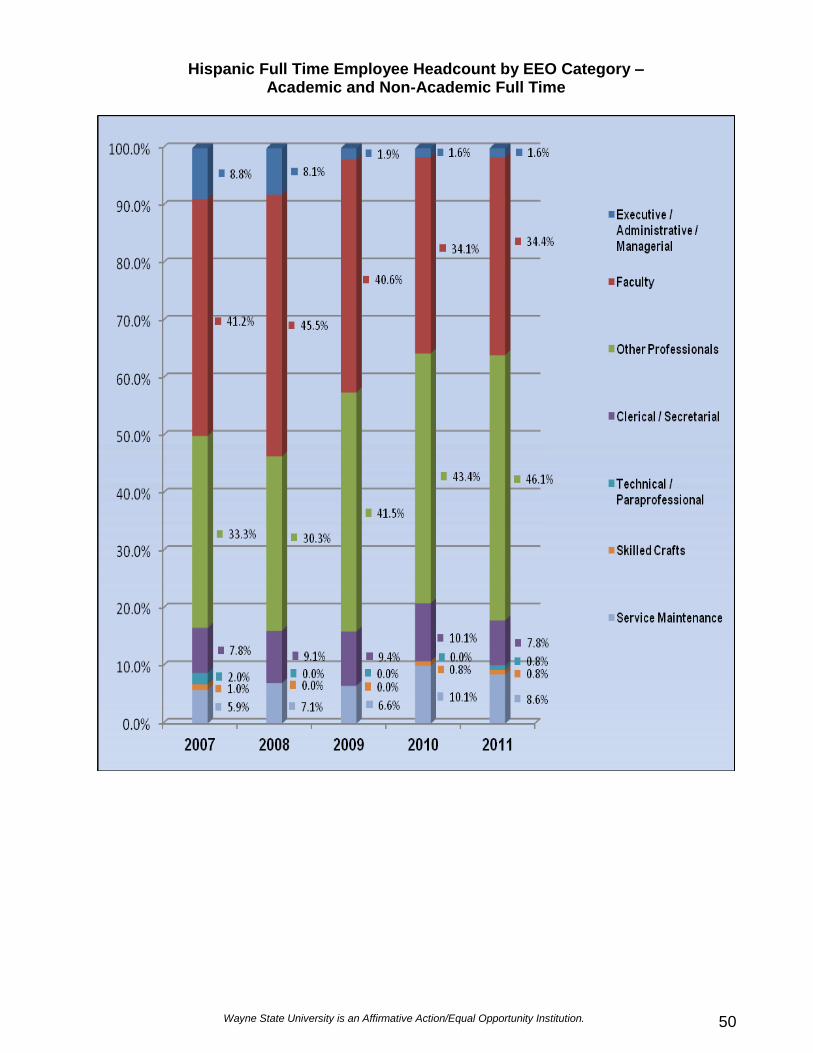
Wayne State University is an Affirmative Action/Equal Opportunity Institution. 50
Hispanic Full Time Employee Headcount by EEO Category – Academic and Non-Academic Full Time
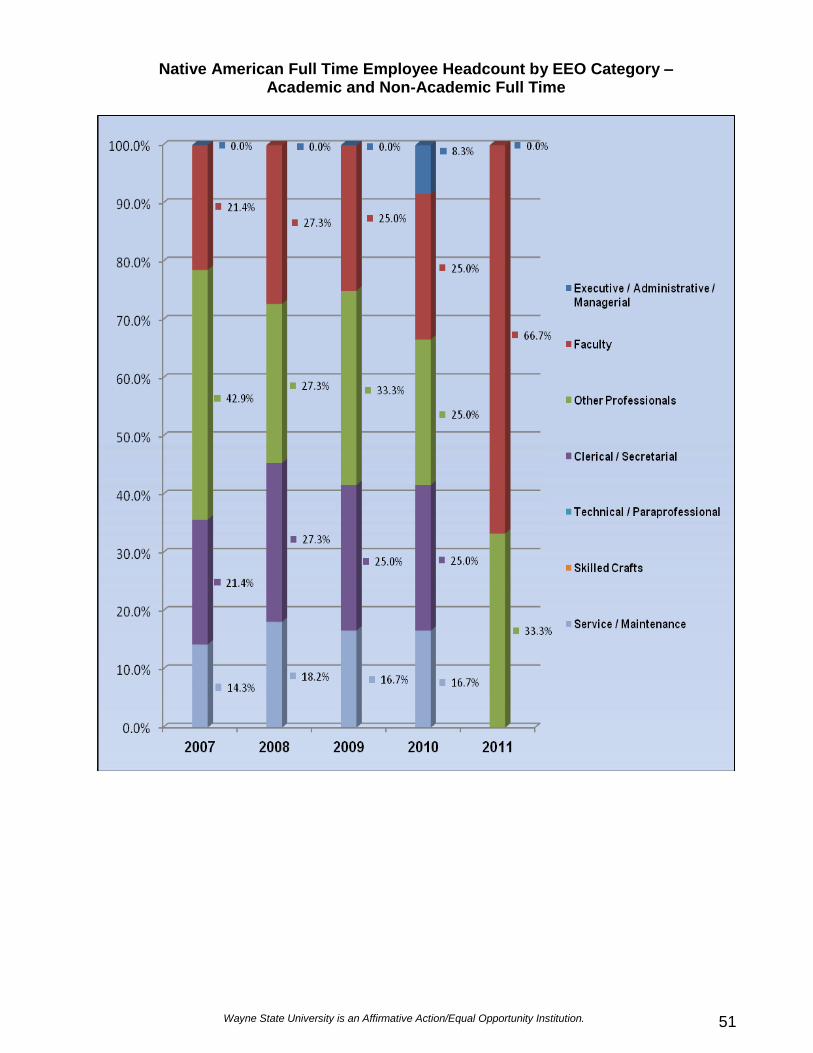
Wayne State University is an Affirmative Action/Equal Opportunity Institution. 51
Native American Full Time Employee Headcount by EEO Category – Academic and Non-Academic Full Time
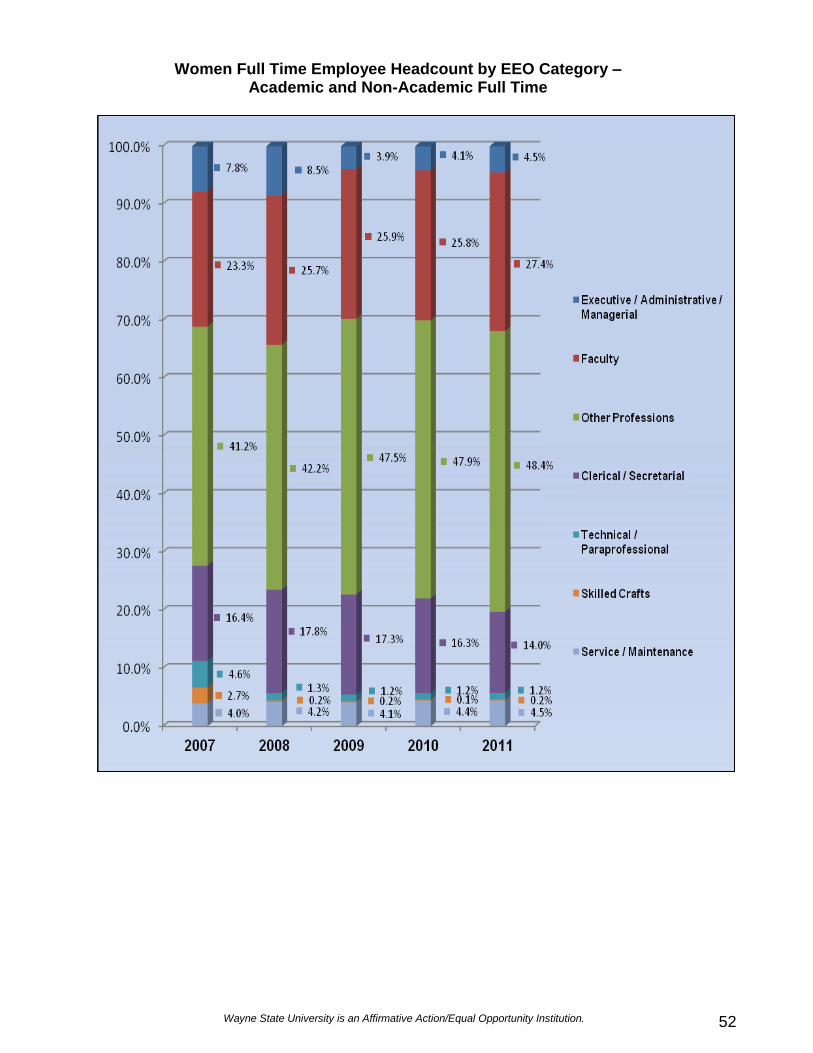
Wayne State University is an Affirmative Action/Equal Opportunity Institution. 52
Women Full Time Employee Headcount by EEO Category – Academic and Non-Academic Full Time
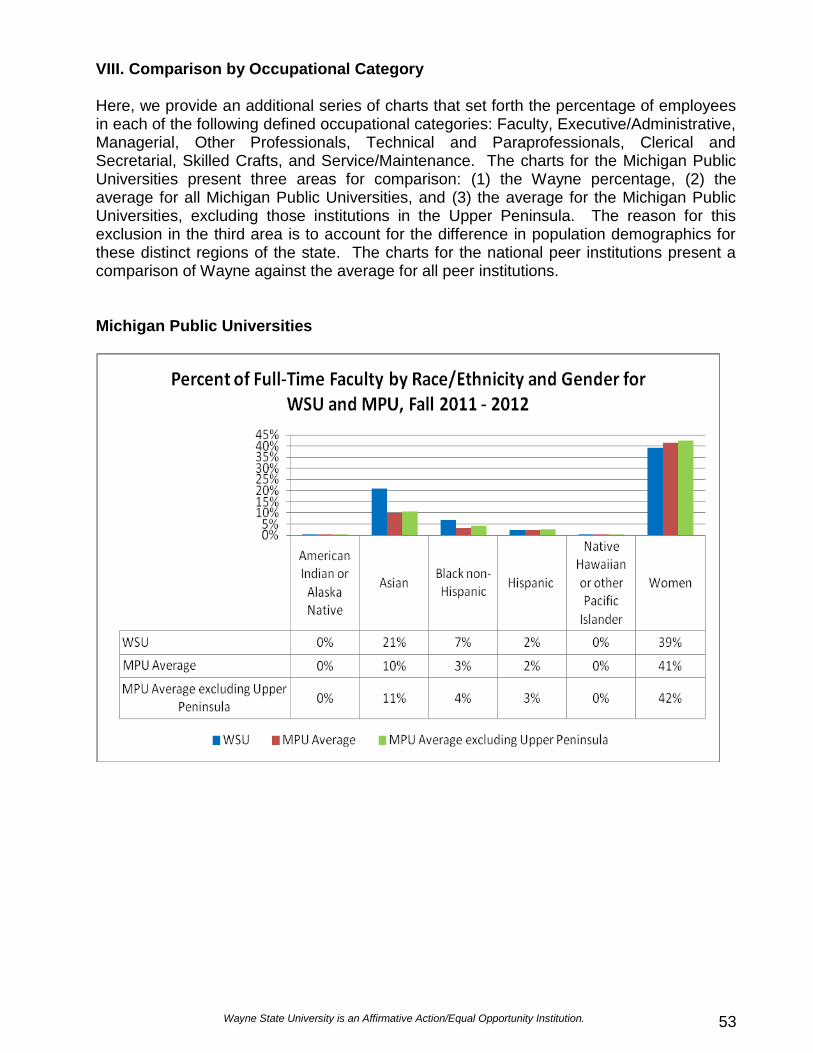
Wayne State University is an Affirmative Action/Equal Opportunity Institution. 53
VIII. Comparison by Occupational Category Here, we provide an additional series of charts that set forth the percentage of employees in each of the following defined occupational categories: Faculty, Executive/Administrative, Managerial, Other Professionals, Technical and Paraprofessionals, Clerical and Secretarial, Skilled Crafts, and Service/Maintenance. The charts for the Michigan Public Universities present three areas for comparison: (1) the Wayne percentage, (2) the average for all Michigan Public Universities, and (3) the average for the Michigan Public Universities, excluding those institutions in the Upper Peninsula. The reason for this exclusion in the third area is to account for the difference in population demographics for these distinct regions of the state. The charts for the national peer institutions present a comparison of Wayne against the average for all peer institutions. Michigan Public Universities
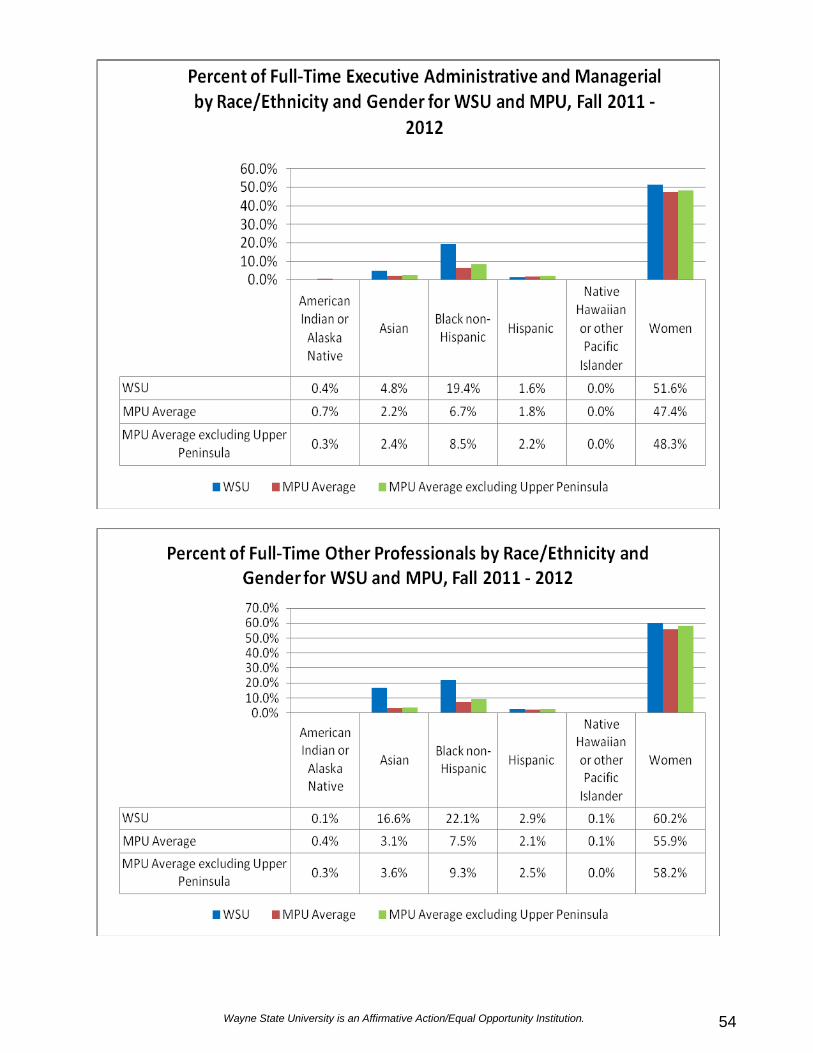
Wayne State University is an Affirmative Action/Equal Opportunity Institution. 54
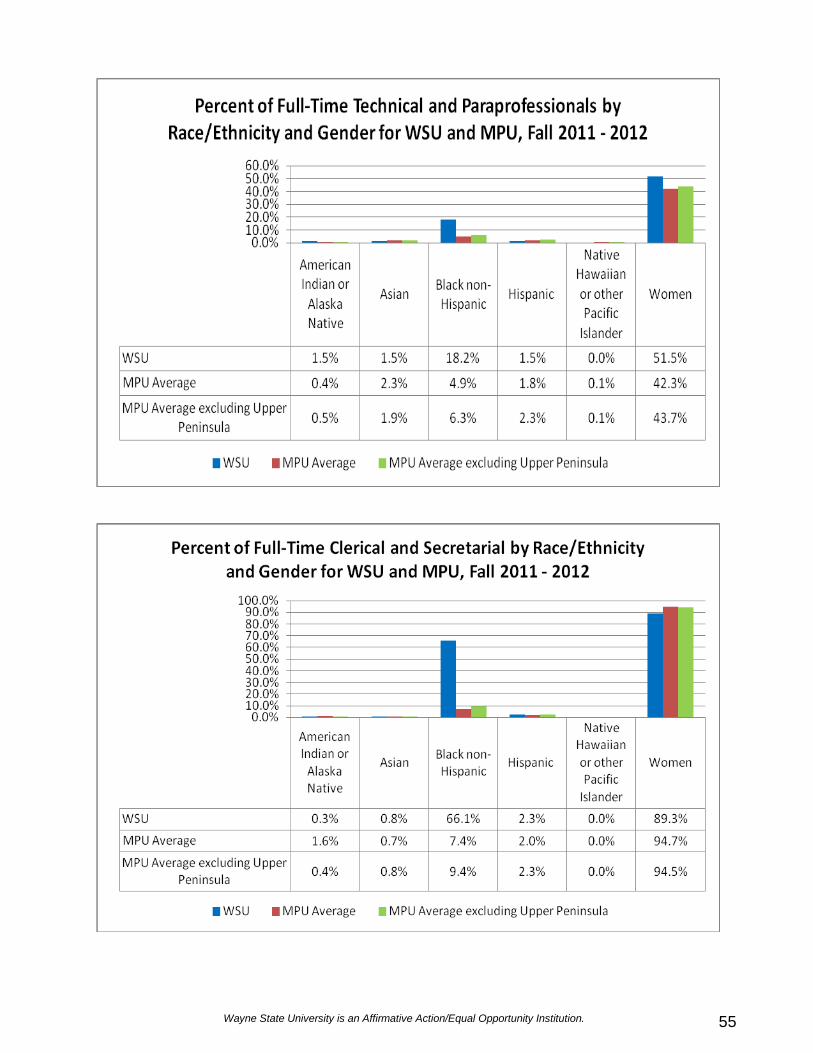
Wayne State University is an Affirmative Action/Equal Opportunity Institution. 55
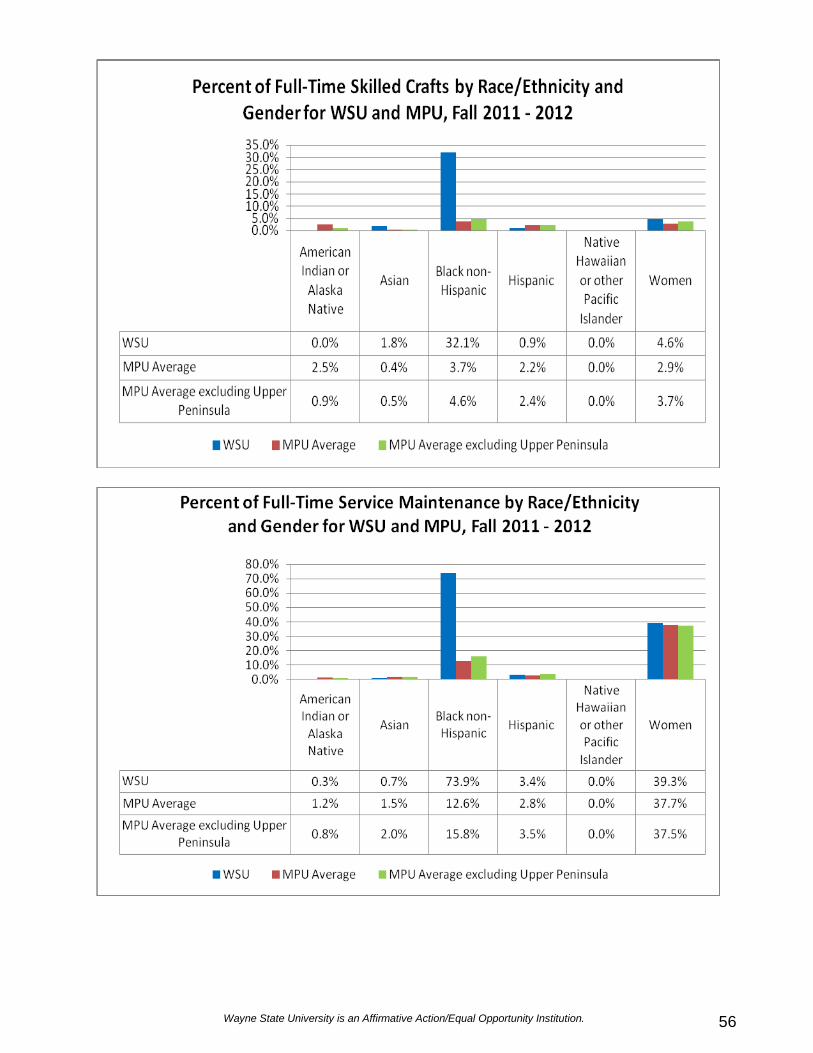
Wayne State University is an Affirmative Action/Equal Opportunity Institution. 56
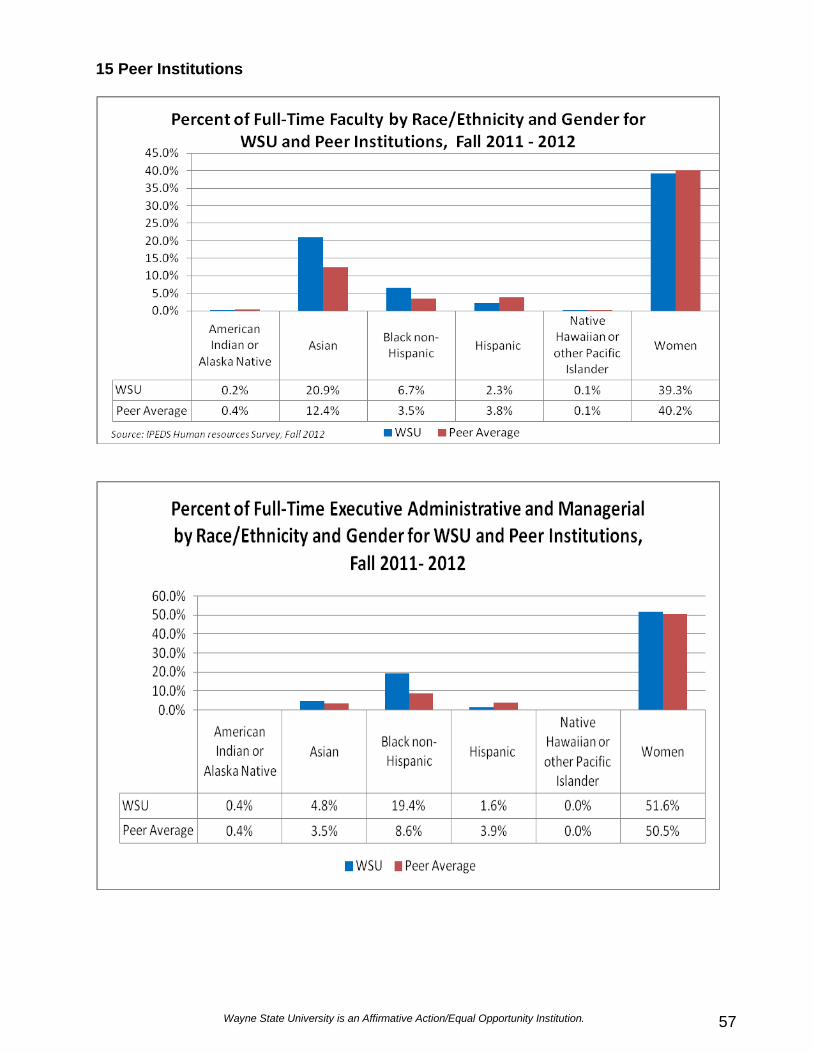
Wayne State University is an Affirmative Action/Equal Opportunity Institution. 57
15 Peer Institutions
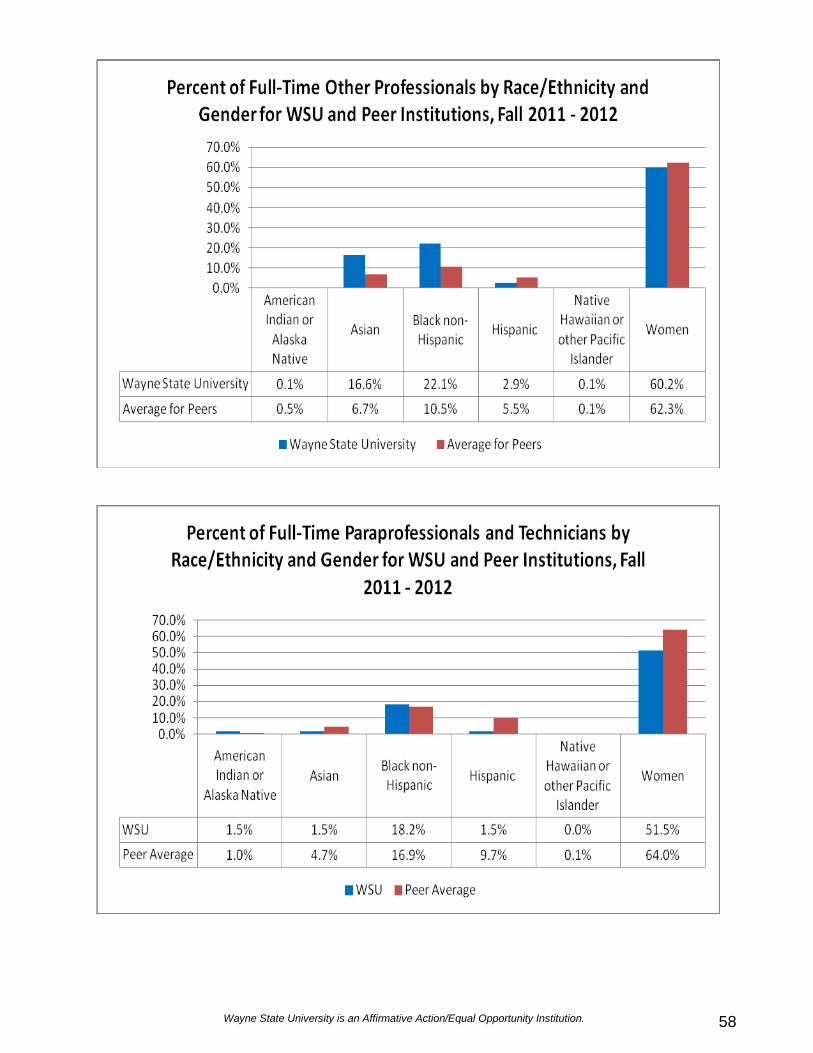
Wayne State University is an Affirmative Action/Equal Opportunity Institution. 58
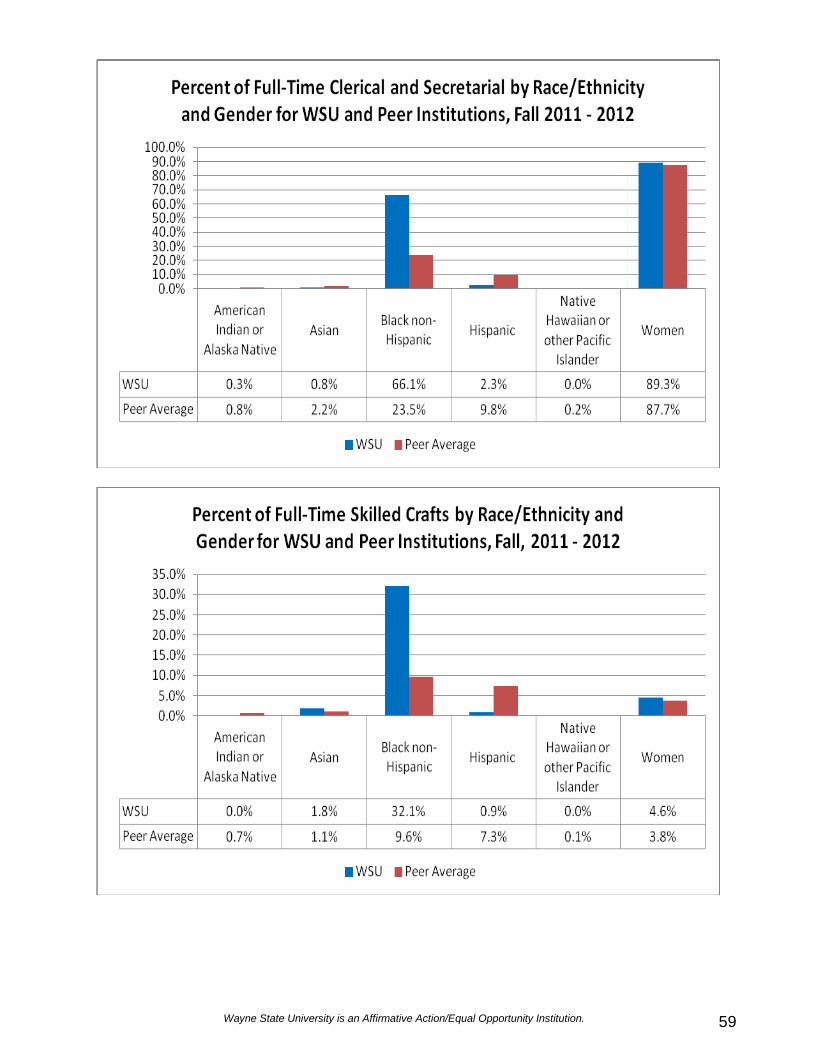
Wayne State University is an Affirmative Action/Equal Opportunity Institution. 59
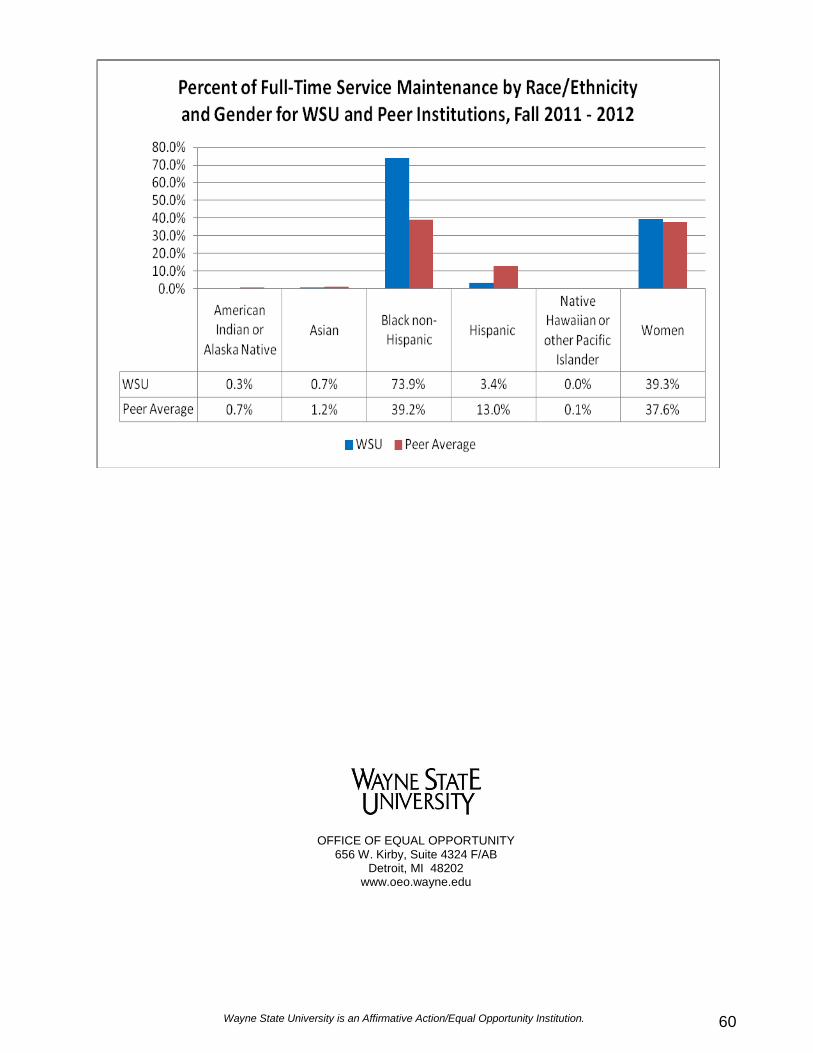
Wayne State University is an Affirmative Action/Equal Opportunity Institution. 60
OFFICE OF EQUAL OPPORTUNITY 656 W. Kirby, Suite 4324 F/AB
Detroit, MI 48202 www.oeo.wayne.edu