Embed Size (px)
Citation preview

AfDB
A f r i c a n D e v e l o p m e n t B a n k
2014www.afdb.org
E c o n o m i c B r i e f
CONTENT
1 – Introduction p.2
2 – Framework forassessing crisis resilienceand growth p.3
3 – Patterns of growth andcrisis resilience in NorthAfrica p.6
4 – Successful crisisresilience measures fromother regions p.29
5 – Conclusions,implications andrecommendations p.40
6 – Further Reading p.45
Appendix p.57
Zondo SakalaVice [email protected]
Jacob KolsterDirector ORNA [email protected]+216 7110 2065
Promoting crisis-resilient growthin North AfricaDr Gita Subrahmanyam*
This paper was prepared by Dr Gita Subrahmanyam, Research Associate with the LSE Public Policy Group at the LondonSchool of Economics, under the supervision of Vincent Castel (Chief Country Economist, ORNA) and Sahar Rad (Senior Economist, ORNA). The paper was finalised with editorial assistance from Anne Sophie Ouedraogo (Consultant, ORNA). Overallguidance was received from Jacob Kolster (Director, ORNA).
* The author would like to thank Professor Philip G Cerny from University of Manchester and Rutgers University and Dr Frederick Guy from Birkbeck College, University of London for helpful comments during the initial stages of this work. Shewould also like to thank Michela Mossetto Carini, Oliver David Burnham, Neha Rajan and Maximilian Maldacker for useful research assistance and support.
Key messages
• The Arab Spring was an internally generated crisis, the result of two interwoven processes relatingto the patterns of growth and crisis resilience in the region. While North African countries enjoyed moderately high growth between 2003 and 2010, notwithstanding the two crises (food and financial) that hit the region during that period, growth was not inclusive and benefits were not shared broadly across sectors or widely across groups. While North African governments took steps to strengthen crisis resilience at macroeconomic level, they generally failed to protect small businesses and poor households.
• Hence, instead of promoting crisis-resilient growth, North African government policies have been producing growth-inhibiting crises. The Arab Spring caused more damage to North African countries’ growth trajectories and fiscal capacities than the two previous crises combined. The internally generated crisis also weakened sectors that had previously appeared resilient to external shocks – suggesting that crisis resilience is not possible over the long term unless inclusive growth is a part of the overall strategy.
• Economic and social policies were not fundamentally changed following the political transition ignited in early 2011, so North African countries continue to be exposed to domestic instabilities that could affect their future development patterns. Moreover, their heavy reliance on Europe for trade and capital flows leaves them highly vulnerable to the eurozone debt crisis.
• This brief provides details of policy measures that other countries have successfully introduced to promote social stability, high growth and crisis resilience. Its recommendations are set out according to the constituents of crisis-resilient growth: strengthening adaptive capacity, reducing systemic vulnerability, and expanding the drivers and distribution of growth.
• To strengthen adaptive capacity, North African governments should (i) continue to implement well-balanced monetary and fiscal policies; (ii) redesign social policies and transfer programmes so that they target and protect vulnerable households; (iii) reform formal and informal education systems to deliver high-quality, relevant skills; and (iv) ensure that state institutions are more inclusive and responsive.
• To reduce systemic vulnerability, North African countries should: (i) diversify trade and financial partners; (ii) increase investments in agriculture and alternative energy sources; (iii) support the growth and development of SMEs; and (iv) develop and/or strengthen crisis monitoring tools.
• To expand the drivers and distribution of growth, North African governments should: (i) continue to pursue trade liberalisation and privatisation, but ensure that measures are in place to lower the risks associated with greater global integration; (ii) remove the legal and regulatory impediments to formal private sector growth and employment; (iii) promote diversification across sectors; and (iv) adopt policies that increase private sector productivity and competitiveness.

I. Introduction
In a book chapter titled ‘Riots and Rebellion in North Africa: PoliticalResponses to Economic Crisis in Tunisia, Morocco and Sudan’, David
Seddon (1989: 114) writes: ‘The year 1984 began in a bloody fashion
in North Africa. Violent demonstrations erupted in the impoverished
south-west and south of Tunisia at the very end of December 1983 and
spread throughout the country during the first week of January. These
followed the Tunisian government’s introduction of measures to remove
food subsidies. Bread prices suddenly doubled. The state’s response
to the demonstrations was violent. As the unrest spread, security forces
opened fire on crowds in several towns, including the capital, Tunis.
The government declared a state of emergency and a curfew on January
3, and banned public gatherings of more than three people.’
Change ‘1984’ to ‘2011’ and the similarity to recent events is striking.
Mohammed Bouazizi was born in 1984, the year that the ‘bread riots’
took place in Tunisia. While Bouazizi’s self-immolation has been credited
with igniting the 2011 uprisings in North Africa, toppling several regimes
in the region, the real cause was an unfavourable economic environment
exacerbated by global crisis spillovers on a scale not experienced since
the early 1980s. In 2008 world food and fuel prices for the first time
surpassed their peak levels of the 1980s, and in mid-2008 the world
entered the most severe global economic recession since the 1980s
(Wiggins and Levy, 2008; Imbs, 2010). Indirect effects of the current
financial crisis have led to an increase in already high unemployment
rates, particularly among youth, pushing some families below the poverty
line (Subrahmanyam, 2011). The rise in the cost of staple goods
preceding and following the onset of the financial crisis has aggravated
frustrations in the context of widening social inequalities and wasted
human capital. Thus the underlying causes of the 2011 uprisings are
the same as those identified by Seddon (1989: 133) for the 1984 bread
riots: ‘In Sudan, as in Tunisia and Morocco, the logic of economic
“liberalism” pursued over the previous decade has led directly to the
growth of inequality, unemployment, and social deprivation, which
themselves underlay the discontent and social unrest’.
Arguably, the current situation is more severe than in 1984 in several
key aspects. First, the ‘Arab Spring’ revolutions have turned a twin
crisis (world food and global financial) into a triple crisis, with political
uncertainty adding to economic problems in the region. Second, North
African countries’ main trading partners in the eurozone are facing a
debt crisis on a scale comparable to that of Latin America in 1982,
with anticipated direct impacts (Rathbone, 2010; Ortiz, 2012;
Eichengreen, 2010). Additionally, since 1984, most North African
countries have implemented IMF and World Bank economic reform
packages and, as a result, now face a difficult dilemma. Progressive
privatisation and trade liberalisation have rendered their economies
more susceptible to the spillover effects of international crises; yet the
countries need to increase their engagement in global markets to
promote growth and development.
Global economic crises are becoming increasingly common as the world
becomes more financially integrated (Bordo et al, 2001; Laeven and
Valencia, 2008). So North African (and other developing) countries need
to find ways of minimising the impacts of and building resilience to crises
that could hinder their growth and reverse the progress they have made
towards achieving their development goals. They also need to focus
on pro-poor development if they are to once and for all tackle the social
problems that have destabilised the region, both recently and as far
back as 1984.
This paper proposes strategies for promoting crisis-resilient growth in
North Africa1. It gauges the impact of recent crises on North African
countries, critically assesses government interventions for minimising
their effects and proposes options for policy makers. The paper is
structured as follows: Section 2 sets out the analytical framework, which
is based on recent studies of economic resilience, intertwined with
the concept of inclusive growth. Section 3 applies this framework in
evaluating the impact of the world food crisis, global financial crisis,
Arab Spring crisis and eurozone debt crisis in North Africa and in critically
analysing government responses to the crises. It shows that the groups
and sectors most severely affected by successive crises were afforded
little protection in government policy responses, leading to a deepening
of social and sectoral inequalities and an increase in countries’ (especially
weaker groups’) vulnerabilities to future shocks. Section 4 provides
examples of successful crisis resilience measures from other regions
and considers their relevance for crisis mitigation and prevention in
North Africa today. The final section provides a summary of the main
findings and offers specific recommendations. The paper demonstrates
that, although North African countries are facing their greatest challenge
since the early 1980s, the current situation offers unique opportunities
for more rapid, sustained and inclusive growth.
A f r i c a n D e v e l o p m e n t B a n k
2
AfDB E c o n o m i c B r i e f
2 0 1 4 • w w w . a f d b . o r g
1 For the purposes of this analysis ’North Africa’ is defined as Algeria, Egypt, Libya, Morocco and Tunisia, and not also Mauritania or Sudan.

A f r i c a n D e v e l o p m e n t B a n k
3
E c o n o m i c B r i e f
2 0 1 4 • w w w . a f d b . o r g
AfDB
Studies of economic resilience provide a framework for critically
examining North African countries’ performance during the recent
crises that have affected the region. Crisis resilience is achieved
through reducing systemic vulnerabilities and strengthening adaptive
capacity, so that external shocks have a lower impact on countries’
growth and development patterns. Simultaneously expanding the
drivers and distribution of growth can promote crisis resilience, which
is maximised in an environment of inclusive growth. The definitions
and framework set out below guide the analysis to follow in the next
section.
2.1 Defining crisis resilience
‘Resilience’ is the subject of a large and growing body of literature
concerned with countering threats to human development arising
from economic, political, social or natural shocks or stresses (Briguglio
et al, 2009; TANGO International, 2012; Guillaumont, 2009). The
concept has become central to the international development agenda
in the context of the global financial crisis and its impact on vulnerable
countries and communities (UNESCAP, 2011; Clark, 2012; Zhu, 2012).
A ‘shock’ or ‘stress’ is a disturbance that adversely unbalances a
system, where imbalances are the result of systemic vulnerabilities
(OECD, 2011). Crises stem from shocks or stresses. Hence crisis
resilience is ‘the ability of a system and its component parts to
anticipate, absorb, accommodate or recover from the effects of a
shock or stress in a timely and efficient manner’ (Mitchell and Harris,
2012). Crisis resilience is achieved through reducing systemic
vulnerabilities and strengthening adaptive capacity, so that external
shocks have a lower impact on countries’ growth and development
patterns (see Figure 1).
2. Framework for assessing crisis resilience and growth
Crisis resilience
A country’s ability to anticipate, absorb, accommodate or recover from the effects of a shock or stress in a timely and efficient manner
Adaptive capacity
A country’s access to/control of resources to deal with shocks or stresses
(Nurtured by policy)
• National level• Market level• Household level
(Structural)
• Natural resource endowments
(Structural)
• Economic openness• Export concentration• Strategic import dependence
(Nurtured by policy)
Vulnerability
The risk that a developing country’sgrowth and development will be hampered by external (or natural) shocks or stresses
Source: Adapted from Briguglio et al (2009: 232)
Figure 1: Crisis resilience - definition and determinants

A f r i c a n D e v e l o p m e n t B a n k
4
AfDB E c o n o m i c B r i e f
2 0 1 4 • w w w . a f d b . o r g
Vulnerability is ‘the risk of a (poor) country seeing its development hampered
by the natural or external shocks it faces’ (Guillaumont, 2009: 195). Crisis
vulnerability may be a product of ‘structural’ or ‘nurtured’ factors2. On the
one hand, a country’s ‘structural’ characteristics may render it vulnerable
to external or natural shocks. For developing countries, integration into
the global economy is a key cause of structural vulnerability, since trade
openness exposes countries to the spillovers of crises triggered elsewhere
– for example, trade shocks or world commodity price instabilities. Structural
vulnerability is measured by three variables: economic openness, the
extent to which a country is dependent on foreign markets or suppliers
for trade or financial flows, including foreign direct investment (FDI),
official development assistance (ODA) and migrant remittances; export
concentration, a country’s economic reliance on a narrow range of
exports; and strategic import dependence, the degree to which a country
relies on imports for key resources, such as energy, food or industrial
supplies (Briguglio and Galea, 2003; UNESCAP, 2009: 2)3. On the other
hand, a country’s vulnerability may be ‘nurtured’ by the failure of government
policy to counteract or absorb the impacts of external shocks on susceptible
groups or sectors, leading to their increased sensitivity to future shocks
and lower resilience during crises4.
A country’s ability to cope during crises is largely determined by its ‘adaptive
capacity’ – that is, its access to and control of resources to deal with
shocks or stresses. Adaptive capacity is a key aspect of crisis-resilience:
resilient institutions and individuals accumulate and maintain excess
reserves during good times for use during bad times. Adaptive capacity
may vary within a country depending on the level of aggregation, be it at
national, market or household level (TANGO International, 2012). At national
level, resilience is largely determined by ‘fiscal capacity’: the ability of
governments ’to finance large deficits without jeopardising macroeconomic
stability and debt sustainability’ (World Bank, 2009a)5. Prudent governments
build up fiscal capacity during boom periods, providing liquidity or the
capacity to take on external debt during crises. Other sources of stability
at macroeconomic level include a strong legitimate government, high-
quality institutions and valuable natural resources. At microeconomic level,
resilience hinges on the strength of markets and households. Firms thrive
in an enabling legal and regulatory environment with easy access to capital
and markets and a multi-skilled workforce that can contribute to productivity
and innovation. For households, resilience consists of a stable infrastructure,
abundant employment opportunities, access to loans or social safety nets,
and opportunities to build and apply human capital. During crises, adaptive
capacity at all levels may be enhanced by economic or other support
from external sources, such as foreign governments, NGOs or community
groups; however, external aid is more easily mobilised during rapid onset
shocks than during slow onset shocks.
Crisis vulnerability and adaptive capacity are linked: groups that are
effective in building adaptive capacity during non-critical periods and
judiciously allocating resources during crises will be less sensitive to
current and future crises, placing them on a more resilient pathway.
If they learn from their past experiences, they become highly crisis-
resilient. Conversely, poor access to resources, income-generating
opportunities or external support reduces groups’ abilities to cope
during crises and leads to their higher sensitivity to future shocks.
Depending on the duration, magnitude and frequency of shocks, this
could lead to chronic vulnerability.
Level of aggregation also plays a role in crisis resilience. Since the
costs of protection against certain external threats may be too high
for individuals and households to bear, given the complexity of
problems in a globalised world, people depend on governments to
provide collective goods that address these threats, often in return
for tax payments (United Nations, 2001)6. Governments’ role is especially
vital in the case of marginalised groups, such as the poor, who lack
key livelihood resources at the best of times, so often do not have
excess reserves that they can store in the event of a crisis. In such
situations, governments are providers of indivisible public goods as
well as guardians performing an equalising role in society. However,
governments need to adopt policies that support vulnerable groups,
yet do not render them dependent on state assistance; otherwise
the adaptive capacities of both the groups and government will
become eroded. Crisis resilience is maximised where governments
implement measures that shield vulnerable groups from the impacts
of crises but also empower them, building their adaptive capacity
and contributing to the overall strength of the political unit.
2.2 Dual imperatives: inclusive growth and crisisresilience
In developing countries, patterns of growth are linked to crisis resilience
in several ways. First, rapid economic growth is necessary for
substantially reducing poverty and enabling countries to achieve their
2 This distinction derives from the work of Guillaumont (2009) and Briguglio et al (2009).3 Briguglio and Galea (2003) cite a fourth criterion, ‘peripherality’. However, this is not relevant in the North African context, so has been excluded.4 Note that vulnerabilities can also be nurtured by government policies during non-critical periods.5 The main measures of fiscal capacity are fiscal balance, external debt, current account balance, gross savings and international reserves (UNDP, 2011: 226-228). However, inflationlevels and GDP growth rates are also important to consider, since they affect countries’ access to or costs of obtaining credit.6 Complex threats include issues such as climate change, pollution, food and water supply, etc.

Millennium Development Goals. Conversely, crises disrupt growth and
consume resources that could be better used for basic infrastructure
improvements and other essential social programmes. Second, countries
with vibrant, diverse economic sectors tend to experience more stable
growth over longer periods, since downturns in any one sector may be
offset by gains in other sectors. They also tend to be less sensitive to
exogenous shocks, since it is unlikely that every sector will be hit by crisis
impacts at the same time. Countries with well-developed domestic
economies are especially crisis resilient, since their internally-focused
sectors are largely immune to spillovers from abroad. Finally, both crisis
resilience and growth are related to the distribution of national income.
After all, inequalities in income and/or opportunities raise the potential for
social instability, which can hinder countries’ growth and development.
Inequities also weaken the adaptive capacities of less privileged groups,
rendering them less resilient during crises.
Simultaneously expanding the drivers and distribution of growth
promotes crisis resilience, which is maximised in an environment of
‘inclusive growth’ – that is, economic growth plus income equality
(see Figure 2). Inclusive growth has three main components: rapid
growth, necessary for substantial poverty reduction; broad-based
growth, across diverse economic sectors; and inclusiveness,
extending to a large part of the country’s labour force (Ianchovichina
and Lundstrom, 2009). Inclusiveness encompasses equity, equality
of opportunity and protection during market and employment
transitions (Commission on Growth and Development, 2008). Thus
defined, inclusive growth directly links the macro and micro
determinants of growth and conforms to the absolute definition of
pro-poor growth.
Juxtaposing the concepts of economic resilience with inclusive growth
allows for phenomena such as the ‘Singapore Paradox’ to be
explained – that is, how a country that is highly exposed to shocks
can still manage to achieve rapid growth – and may be useful in
identifying policies that vulnerable countries could adopt to put
themselves on a more crisis-resilient pathway (Briguglio et al, 2009;
TANGO International, 2012). Patterns of growth and crisis resilience
need to be examined alongside one another to identify serial
instabilities as well as areas of strength that should be cultivated. An
understanding of these dynamics is vital for generating policy options
for promoting crisis-resilient growth. The next section applies the
framework of crisis resilience and inclusive growth in assessing North
African countries’ performance during the recent crises that have
affected – and continue to impact – the region.
A f r i c a n D e v e l o p m e n t B a n k
5
E c o n o m i c B r i e f
2 0 1 4 • w w w . a f d b . o r g
AfDB
Inclusivegrowth
Economicgrowth
Incomeequality
InclusivenessBroad-basedgrowth
Rapidgrowth
(Household level)
• Equity• Equality of opportunity • Protection during market/ employment transitions
(Market level)(National level)
= +
Source: Ianchovichina and Lundstrom (2009)
Figure 2: Inclusive growth - definition and determinants
A f r i c a n D e v e l o p m e n t B a n k
6
3. Patterns of growth and crisis resilience in North Africa
Over the past decade North Africa has been hit by three crises and
is threatened by a fourth. Three of the four crises (the world food
crisis, global financial crisis and impending eurozone debt crisis) were
externally triggered and have affected North African countries mainly
through their structural vulnerabilities (see Figure 3). The fourth crisis, the
‘Arab Spring’, was internally generated, the result of nurtured vulnerabilities
stemming from North African governments’ failure to adequately protect
affected groups from the impacts of the earlier shocks. Since government
policies have not radically changed as a result of the Arab Spring, North
African countries are now more sensitive to external shocks, so the
eurozone debt crisis – coming on top of the world food and global financial
crises – poses a threat to the region’s recovery and future growth.
3.1 Global economic boom and world food crisis
Between 2003 and 2008 world trade grew 151%, as Asian economies
led by China and India began to play a more substantial role in global
affairs (UNCTADstat). During the same period, commodity prices –
in particular, food and fuel prices – rose rapidly, so much so that by
mid-2008 they reached their highest levels in nearly 30 years and a
‘world food crisis’ was declared7.
Impact of the global economic boom and world food crisis
The global economic boom that took place between 2003 and 2008
enabled stable, high growth across North Africa. Governments in the
region supported economic expansion by undertaking unilateral tariff reform
and signing bilateral and regional free trade agreements. As a result, North
Africa’s share of world trade increased from 0.8% in 2003 to 1.3% in 2008,
and merchandise trade accounted for a large and growing percentage of
7 The world food crisis was caused by shifts in international agricultural production and consumption patterns, speculative commodity trading, weather-related issues, higher energyprices, climate change and internal migration effects (United Nations, 2011: 66-71).
Worldfoodcrisis
Globalfinancial
crisis
Eurozonedebt crisis
ArabSpringcrisis
North African countries
Structural vulnerabilities:
• Economic openness• Export concentration• Strategic import dependence
Nurtured vulnerabilities:
• Increased sensitivity to trade and commodity price shocks• Increased sensitivity to declines in FDI and other capital flows• Increased sensitivity to declines in remittances• Higher propensity for social unrest
Figure 3: Patterns of crisis vulnerability in North Africa
AfDB E c o n o m i c B r i e f
2 0 1 4 • w w w . a f d b . o r g

A f r i c a n D e v e l o p m e n t B a n k
7
countries’ GDP (see Table 1 in the appendix). Tourism receipts also grew
everywhere but not in Libya (see Table 2 in the appendix). Hence the
countries experienced strong growth: real GDP expanded at an average
annual rate of between 4.1% and 5.5% in every country except Libya,
which grew more rapidly (see Table 3 in the appendix). On a per capita
basis, GDP growth was also good, ranging from 2.5% in Algeria to 5% in
Libya. The progress that the countries had made in opening up their markets
and privatising sectors of their economies, which even Libya began to do
after 2003, enabled them to attract higher levels of foreign direct investment
(FDI) and other private capital flows (see Table 4 in the appendix). Egypt,
Morocco and Tunisia also enjoyed an increase in market capitalisation and
stocks traded in their exchanges (see Table 5 in the appendix). The countries
further benefited from growing quantities of official development assistance
and other official flows (see Table 6 in the appendix)8.
The world food crisis, which was caused by a rapid acceleration in food
and fuel prices between 2003 and 2008, affected growth outcomes
in the region. The impact of the crisis on countries depended on
their specific structural vulnerabilities – that is, their strategic import
dependence or export concentration (see Figure 4).
The region’s net oil importers (Egypt, Morocco and Tunisia) are
dependent on imports for food and fuel, hence are sensitive to price
shocks in both commodities (see Table 7 in the appendix)9. The net oil
exporters (Algeria and Libya) are also reliant on food imports, but their
main structural vulnerability is their export concentration in oil and gas,
which constitutes over 95% of their total exports and the bulk of their
GDP (see Tables 7 and 8 in the appendix)10. They are therefore more
susceptible to fuel price shocks than to food price shocks. Because
crude petroleum prices increased at a faster pace than food prices
between 2003 and 2008 (see Figure 5), Algeria and Libya enjoyed high
merchandise trade, current account and fiscal surpluses and were able
to bolster their international reserve levels (see Tables 1 and 3 in the
appendix). The net oil importers’ exports and trade-related tax revenues
also grew, but because they had to absorb the rising costs of fuel and
food prices on the import side, the countries suffered declining
merchandise trade and current account balances (see Tables 1 and 3
in the appendix).
The combined effect of the global economic boom intersecting with the
world food crisis is that, while all North African governments used the
8 However, these flows constituted only a small proportion of GDP.9 Egypt is classified as a net oil importing country because of its current domestic consumption patterns and its commonalities with the other countries included in this category.10 Fuels accounted for 67% of GDP in Libya and 44% in Algeria in 2007 (calculated from data presented in Tables 1 and 7).
Worldfoodcrisis
Globalfinancial
crisis
Eurozonedebt crisis
ArabSpringcrisis
North African countries
Structural vulnerabilities:
• Economic openness• Export concentration• Strategic import dependence
Nurtured vulnerabilities:
• Increased sensitivity to trade and commodity price shocks• Increased sensitivity to declines in FDI and other capital flows• Increased sensitivity to declines in remittances• Higher propensity for social unrest
Figure 4: World food crisis - impact
E c o n o m i c B r i e f
2 0 1 4 • w w w . a f d b . o r g
AfDB

A f r i c a n D e v e l o p m e n t B a n k
8
momentum of the boom to build fiscal capacity – for example, by reducing
their debt burdens, increasing national savings and taking steps to manage
inflation – the net oil importing countries’ balances were being damaged
by the rising costs of food and fuel imports, which prevented them from
substantially increasing their fiscal capacities. The countries thus suffered
from weak fiscal and current account balances, high external debt and
relatively low levels of savings and reserves, despite being in the midst of
an economic boom (see Table 3 in the appendix)11. Egypt’s high food
import dependence meant that it struggled with double-digit inflation and
a very high budget deficit12. Egypt’s deteriorating public finances prompted
Moody’s to downgrade its sovereign debt rating in May 2005, raising its
costs of borrowing (Moody’s Investors Service, 2005). By contrast, the
net oil exporting countries enjoyed growing fiscal and current account
surpluses, low debt, high savings and international reserves equivalent
to over three years’ imports. They were thus able to use their excess
liquidity to start up or top up sovereign wealth funds (SWF Institute, 2012).
At market level, in both the net oil importing and exporting countries,
the growth dividends of the period were not widely shared, resulting
in inequalities between large and small firms and between formal and
informal sector workers. Large firms benefitted more than small-to-
medium-sized enterprises (SMEs) from the high flows of capital to
the region. The floods of funds to regional stock exchanges accrued
to only a few, well-capitalised companies: in 2008 the top five listed
companies accounted for around 46% of total market capitalisation
in Tunisia, 36% in Egypt and 31% in Morocco (Allen et al, 2011: 93)13.
Weak creditors’ rights, low auditing and reporting standards, and
weak contract enforcement laws meant that banks and investors
preferred lending to North African governments or larger firms, rather
than to SMEs (Allen et al, 2011: 3; World Bank, 2011b). Banks
therefore set high collateral requirements for loans, totalling 131% of
the loan amount in Egypt, 171% in Morocco, 185% in Algeria and
nearly 200% in Tunisia in 2007, which precluded most SMEs from
accessing them (World Bank, 2007; Hengel et al, 2008; AEO 2011).
This would explain why the proportion of firms using bank finance
declined in Algeria, Egypt and Morocco between 2002 and 2007, and
domestic credit to the private sector decreased in Egypt, Libya and
Tunisia between 2003 and 2007 (see Table 9 in the appendix). Low
access to business capital coupled with high costs of doing business
11 The three countries had lower current account balances and higher inflation levels in 2008 than in 2003, and Morocco and Egypt’s foreign exchange reserves in 2008 were onlytwo-thirds of what they had been in 2003. However, the countries reduced their external debt and increased national savings, which led to a net improvement in fiscal capacity.12 Egypt is deeply affected by food price shocks: a 1% rise in world food prices corresponds to a 0.45% increase in Egyptian food prices, and food price inflation is a major driver ofCPI inflation in Egypt (World Bank, 2011a: 40-43).13 Moreover, North Africa’s largest exchange, the Cairo and Alexandria Stock Exchange, progressively delisted – mainly smaller – firms that did not meet its requirements, meaningthat fewer companies benefitted from the high levels of market capital flowing into Egypt (see Table 5 in the appendix).
0
50
100
150
200
250
300
350
400
2000 2001 2002 2003 2004 2005 2006 2007 2008 2009 2010 2011
Inde
x (2
000=
100)
year
All food Crude petroleum, average of UK Brent (light) / Dubai (medium) / Texas (heavy) equally weighted ($/barrel)
Figure 5: Free market commodity price indices for key products, 2000-2011
AfDB E c o n o m i c B r i e f
2 0 1 4 • w w w . a f d b . o r g

A f r i c a n D e v e l o p m e n t B a n k
9
in an unpredictable business environment forced many SMEs into the
informal sector of the economy (Subrahmanyam, 2011).
At household level, inequalities between formal and informal sector
workers and between poor and non-poor individuals increased, even
as countries seemed on track to achieving most of their Millennium
Development Goals (MDGs)14. Every country expanded its provision
of education; however, the quality remained low, and graduates were
not equipped with the skills demanded by the labour market, leading
to blocked education-to-employment transitions. On the supply side,
red tape and the high costs of doing business – reflected in countries’
Ease of Doing Business rankings (see Table 10 in the appendix) –
deterred private sector growth and job creation. As a result,
notwithstanding the boom, none of the countries was able to
sustain GDP growth at the level required to substantially tackle
unemployment15. The net oil importers were unable to generate
sufficient jobs to absorb their ‘youth bulge’16, while the net oil exporting
countries reduced unemployment by creating short-term public sector
roles or quick-fix self-employment schemes17. Hence unemployment
continued to be high across the region, ranging from 9% in Morocco
to 14% in Tunisia in 2008, and youth unemployment even higher,
ranging from 18% in Morocco and Egypt to 31% in Tunisia
(Subrahmanyam, 2011; Angel-Urdinola and Semlali, 2010)18. Lack of
job opportunities, high corporate tax rates for firms employing labour
and rigid labour market regulations led to a growth in unregulated
informal sector employment. Combined with weak social protection
across the region, this has led to the development of a dual labour
market, where some formal sector workers enjoy good pay and high
levels of protection, while informal sector workers are employed on
low (or no) pay and precarious conditions19. As a consequence,
working poverty has increased across North Africa and was estimated
at 31% in 2008 (ILO, 2010).
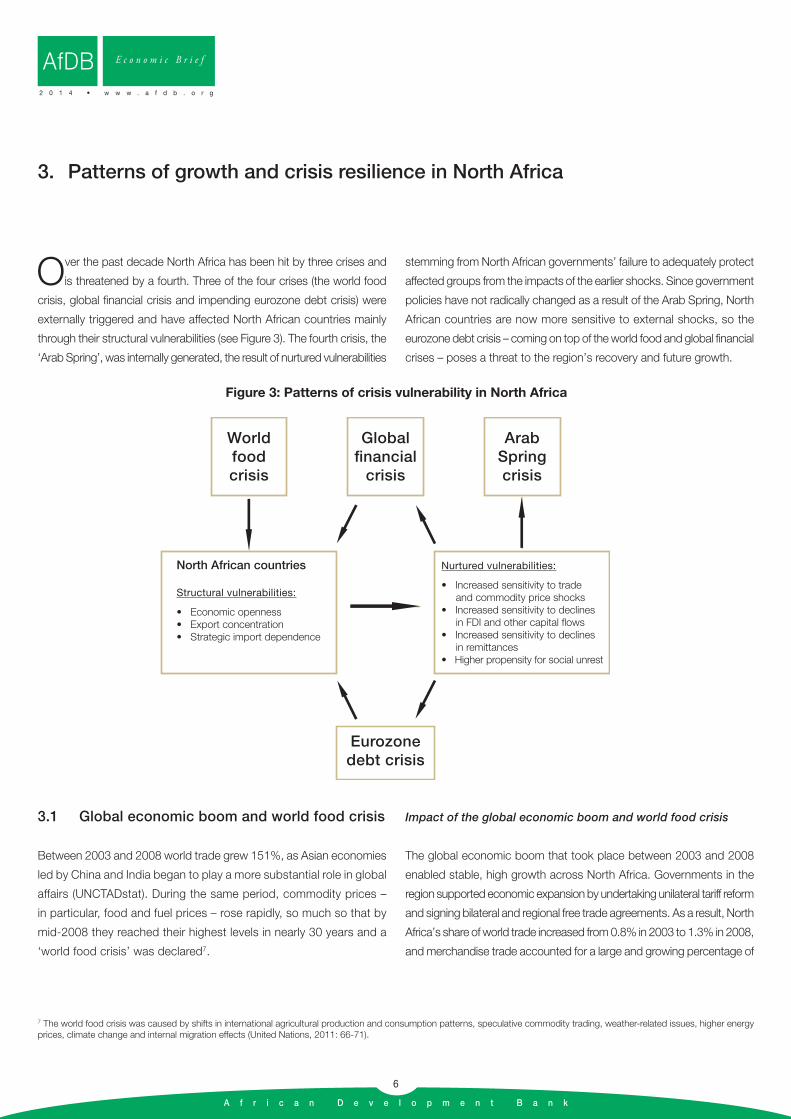
Rising food and fuel prices stemming from the world food crisis put
pressure on households in the Middle East and North Africa (MENA)
region, pushing an estimated 7.4 million people below the poverty
line (De Hoyos and Medvedev, 2009: 14)20. The cost of living increased
rapidly as cereal prices – wheat and maize in particular – grew at a
faster rate than overall food between 2000 and 2008 (see Figure 6)21.
The impact of higher living costs was more severe on certain groups,
such as women and children, and on specific regions, such as rural
areas. Although household purchasing power was boosted by
migrant remittances during this period, remittances did not keep
pace with wheat and maize prices except in Egypt (see Table 11 in
the appendix). Growing income inequality, poverty and declining living
standards explain the eruption of bread riots in Algeria, Egypt, Morocco
and Tunisia in late 2007 and early 2008 (Berazneva and Lee, 2011;
Ottaway and Hamzawy, 2011; Ciezadlo, 2011).
14 MDGs calculate progress on a national basis, so do not reflect inequalities between groups or regions within a country.15 According to Ianchovichina and Mottaghi (2011), GDP growth at 6% per annum is required to sustainably reduce unemployment in the region. This growth level would generate 6.7 million new jobs per year from 2010 to 2020 – that is, twice the annual number of new jobs created in the MENA region between 1999 and 2009.16 North African countries are in the midst of a ‘youth bulge’, meaning that the number of young people entering the labour market has been growing at an increasing pace. Cuttingunemployment therefore requires a job creation rate in excess of labour market expansion.17 Unemployment in oil-dependent countries tends to be inversely related to fuel prices, since oil and gas sectors are not labour-intensive and jobs created during oil booms are generally cut during bust periods. 18 Labour force participation is also low, especially among young women, so unemployment figures do not capture the full gravity of the problem.19 Weak enforcement of labour legislation has meant that employment protection is widely evaded and applies mainly to an elite group of workers in the public and private sectors(Angel-Urdinola and Kuddo, 2010: 6).20 In Egypt, extreme poverty – that is, daily consumption of less than US$1.25 (PPP) per day - grew by 20% between 2005 and 2008 (Jones et al, 2009: 14).21 North African households are major consumers of both grains, and Egypt is the world’s top wheat importer (FAO, 2003; Reuters, 2009).
E c o n o m i c B r i e f
2 0 1 4 • w w w . a f d b . o r g
AfDB
A f r i c a n D e v e l o p m e n t B a n k
10
Government response to the problem of soaring food prices
Unrest in the region forced governments to introduce or expand social
programmes to mitigate the effects of rising food prices on households,
but the poorest groups did not receive the greatest support (see
Table 12 in the appendix)22. Every country except Libya offered universal
food and fuel subsidies at considerable cost: in 2008 food and fuel
subsidies constituted 31% of current government spending in Egypt,
20% in Morocco, 18% in Tunisia and 7% in Algeria (Albers and Peeters,
2011: 21). Subsidies put a strain on balances, especially in the net oil
importing countries. However, untargeted subsidies benefit non-poor
consumers more than poor families, since ‘richer people can also buy
the product at the lower price’ (Albers and Peeters, 2011: 26). Hence,
in Morocco 90% of subsidised goods were purchased by non-poor
consumers (Yemtsov, 2008). In Egypt, between one-quarter and one-
third of the poor did not benefit from any subsidy, while non-poor
consumers received four-fifths of the value of food subsidies (Jones et
al, 2009: 16). Energy subsidies are the least pro-poor and encourage
overconsumption, leading to high fiscal costs and crowding out other,
more essential investment23. In Egypt, subsidised gasoline accounted
for three-quarters of the cost of all subsidies, and 93% of the benefits
went to the richest quintile of consumers (Iqbal, 2006: 65).
Tighter targeting can make social programmes more pro-poor;
however, while most North African countries implemented some form
of targeted transfers during the period24, the programmes have not
been very effective for several reasons. First, accurate targeting has
been impeded by poor data access and quality, as well as
administrative costs and capacity issues, leading to the leaking of
benefits to non-poor groups. In Egypt, over one-third of the poorest
two quintiles of the population did not have ration cards, while two-
thirds of the richest quintile did (Al-Shawarby and El-Laithy, 2010:
17). Second, funding for targeted programmes has been negligible.
Egypt devoted less than 0.1% of GDP to targeted cash transfers in
22 North African governments introduced other programmes in response to the food crisis – for example, price-oriented measures aimed at reducing domestic food prices and sup-ply-oriented interventions intended to increase domestic food production. These are indicated in Table 12. However, due to space constraints and because these other programmeswere not so central to government policy, they will not be discussed here. Readers interested in learning more about these measures and their strengths or drawbacks might find thediscussions in IFPRI (2008) or FAO (2009) useful.23 For example, if in 2005 Egypt had cut its non-kerosene energy subsidies in half (to around 4.5% of GDP) and distributed the savings evenly across the entire population as a cashtransfer, the incidence of poverty would have been cut by 6.5 percentage points, and 4.2 million people would have been lifted out of poverty (Iqbal, 2006: 65).24 Including cash transfers (Egypt, Libya and Tunisia), food ration cards (Egypt) and school feeding programmes (Morocco) – see Table 12.
AfDB E c o n o m i c B r i e f
2 0 1 4 • w w w . a f d b . o r g
0
50
100
150
200
250
300
350
2000 2001 2002 2003 2004 2005 2006 2007 2008 2009 2010 2011
Inde
x (2
000=
100)
year
All food Wheat, United States, n°2 Hard Red Winter (ordinary), FOB Gulf Maize, United States, yellow n°3, FOB Gulf
Figure 6: Free market commodity price indices for food products, 2000-2011

A f r i c a n D e v e l o p m e n t B a n k
11
2005 and Morocco only around 0.6% (World Bank, 2009b: 26). Third,
progress in poverty reduction has sometimes been obstructed by
non-poor groups: as one author put it, ‘the adoption of pro-poor
targeting as a policy objective may provoke discontent and resistance
among better-off, more vocal, and politically stronger groups who
might stand to lose from such a move’ (Iqbal, 2006: xxiii).
Algeria, Egypt and Morocco increased public sector wages as part of
their crisis mitigation measures – an expensive policy that served to
widen the wealth gap between government employees and private
sector workers or the unemployed. In Egypt, the costs of raising public
sector wages and pensions by 30% and 20%, respectively, accounted
for 89% of the increase in its 2008/9 budget, while disbursements of
food through the ration card scheme comprised only 11% (Egypt
Ministry of Finance, 2009: 3). In Algeria and Morocco, public sector
salaries grew by 15% and 5%, respectively (Saif, 2008: 4; Achy, 2009a).
Wage policies are difficult to reverse once implemented, so generally
constitute a permanent spending item, placing a strain on countries’
fiscal balances in the long term.
Patterns of growth and crisis resilience
Assessing North African countries’ performance from an inclusive growth
perspective25, we can see that, although countries experienced stable
high growth during the period, their expansion rates were neither rapid
nor sustained enough to substantially reduce unemployment or poverty.
While trade liberalisation and privatisation allowed countries to attract
higher quantities of trade, FDI and other capital flows, an unconducive
legal and regulatory framework – combining weak investor protection, an
onerous business environment and rigid labour market regulations –
deterred private sector investment and encouraged the expansion of the
informal sector, with costs to both GDP and government tax revenues,
affecting especially the net oil importing countries. In Algeria and Libya,
economic growth derived primarily from one sector and was therefore
subject to shifts in international oil prices. Moreover, the rewards of the
boom were not widely shared across groups, even in the cash-rich net
oil exporting countries; the fact that bread riots broke out in Algeria in
2008 bears testimony to this fact. An ill-suited education system, lack of
ample job opportunities and restrictive social protection legislation resulted
in high unemployment and rising poverty across North Africa, affecting
young men and women in particular. The main beneficiaries of growing
wealth in the region were large firms and formal sector workers.
Examining countries’ performance from a crisis-resilience perspective26
highlights the shortcomings of government responses to the world food
crisis. To be termed resilient, policy measures should be implemented
before the crisis has produced detrimental long-term effects, should
cushion the groups most affected by the crisis from its impacts and
should be dismantled at the end of the crisis, so that the costs of
intervention do not become a permanent drain on government
resources. These features closely correspond to the International Labour
Organisation’s recent advice, based on past evidence, that fiscal stimulus
measures during major financial and economic crises should be ‘timely,
targeted, and temporary’ (ILO, 2011a: 5-6). In contrast, North African
governments’ responses to the food crisis were slow, not well targeted
to the groups most affected by soaring food prices, and included
measures that could not be easily terminated when food prices began
to ease. Most of the measures for dealing with the crisis were put in
place in mid-to-late 2008, after the food riots had already taken place
(FAO, 2011). Crisis policies also did not effectively counteract the impact
of rising food (and fuel) prices on the growing number of poor households,
which therefore experienced a sharp decline in living standards and a
long-term loss in adaptive capacity. In Egypt, for example, while sufficient
quantities of food reached vulnerable families, its poor quality meant
that nearly half of all households suffered from malnutrition and ‘hidden
hunger’ – that is, when food consumption is unmatched by vitamin and
mineral intake – resulting in stunted child growth, productivity and
cognitive capacity (Jones et al, 2009: 9-14). MENA is the only region
in the world to have recorded an increase in the proportion of
undernourished people between 1990 and 2008 (Grember et al, 2010:
3). Moreover, countries’ subsidy systems and wage policies could not
be easily dismantled without causing further instability. So although
governments’ prudent macroeconomic policies allowed them to build
fiscal capacity during the boom period, their policy measures for
addressing the food crisis placed a strain on countries’ fiscal balances
that outlasted the immediate crisis.
Furthermore, government responses to the crisis reinforced income
inequalities rather than bridging them. The main beneficiaries of crisis
measures were public sector workers, wealthier individuals and politically
stronger groups. These were of course the groups with relatively
robust adaptive capacities entering the crisis. Most other groups
emerged from the crisis worse off – with the exception of large firms
and formal sector workers, which had benefitted from government
pre-crisis policies.
25 That is, comprising the three elements of rapid growth, broad-based growth and inclusiveness.26 That is, the extent to which shocks were counteracted or absorbed; systemic vulnerabilities were reduced; or adaptive capacities were strengthened at different levels of aggregation.
E c o n o m i c B r i e f
2 0 1 4 • w w w . a f d b . o r g
AfDB

A f r i c a n D e v e l o p m e n t B a n k
12
The nurtured vulnerabilities introduced by government crisis and
pre-crisis policies during the period (see Figure 7) include:
Greater sensitivity to international trade and commodity price
shocks: Weak investor protection legislation and an unwelcoming
business environment have depressed domestic private sector growth,
leading to a higher reliance on international trade. In addition, the high
costs of subsidies, cash transfers and wage increases have placed a
heavy burden on the public purse, especially in the net oil importing
countries. Since countries must now earn higher revenues to maintain
their fiscal balances, they are more vulnerable than before to international
trade and commodity price shocks.
Higher sensitivity to a decline in FDI and other capital flows: A
restrictive credit environment has meant that private sector firms
increasingly rely on FDI and other international flows for their capital
requirements. Employment outcomes in the region are also affected by
a decline in these flows (Subrahmanyam, 2011: 9-14).
Greater sensitivity to a fall in remittances: Weak social protection and
insufficient government funding of pro-poor programmes have rendered
North African households more dependent on remittances, which are
needed to dampen the impact of rising food prices and other living
costs (Combes et al, 2012).
Acute sensitivity to food price shocks: Rigid labour laws, high
corporate taxes and an ill-suited education system have led to higher
informal employment and working poverty, which in turn have increased
North African households’ sensitivity to food price shocks. Food
accounts for over 50% of total spending for the poorest two quintiles
of the population in Egypt and Morocco (Yemtsov, 2008). Social stability
in the region is also tightly linked to the price of food (Lagi et al, 2011).
Increased propensity for social instability: The failure of public
policies to reduce the impact of high food prices on vulnerable groups
may have led to the 2008 riots. The Egyptian government abandoned
plans to reduce its energy subsidy, while the Tunisian government
tabled reform of its subsidy system. Governments across North Africa
likely suffered some loss of legitimacy as a result of their policy reversals,
which in turn reduced their adaptive capacity.
On the other hand, some governments instituted measures to reduce
their country’s structural vulnerabilities – in particular, their dependence
on strategic imports – thereby increasing their country’s longer-term
resilience. In 2008, the Algerian government approved a rural renewal
programme for agricultural and rural development, while the Moroccan
government launched its Green Morocco Plan, which it called a ‘triple
bottom line answer to food insecurity, adaptation of agriculture to
climate change and sustainable growth of small farmers’ (Ouali, 2008;
Worldfoodcrisis
Globalfinancial
crisis
Eurozonedebt crisis
Food riots in 2008
ArabSpringcrisis
North African countries
Structural vulnerabilities:
• Economic openness• Export concentration• Strategic import dependence
Nurtured vulnerabilities:
• Increased sensitivity to trade and commodity price shocks• Increased sensitivity to declines in FDI and other capital flows• Increased sensitivity to declines in remittances• Higher propensity for social unrest
Figure 7: World food crisis - outcomes
AfDB E c o n o m i c B r i e f
2 0 1 4 • w w w . a f d b . o r g

A f r i c a n D e v e l o p m e n t B a n k
13
Kingdom of Morocco, 2010). Morocco also took steps to reduce its
dependence on fuel imports by investing in a Solar Plan and a Wind
Energy and Hydropower Development Project in 2009.
The mid-2000s were thus a period of stable, high growth across
North Africa, but also a time of rising deprivation, food insecurity and
marginalisation for many North Africans. Poverty and inequality increased
further during the global financial crisis, fuelling social tensions and
frustrations that led to the Arab Spring riots at the end of 2010.
3.2 Global financial crisis
The global financial crisis began in 2007 with the collapse of the US
subprime mortgage market, triggering an international ‘credit crunch’
and the failure of several major financial institutions (Shiller, 2008).
World trade contracted 35% between 2008 and 2009, and
international financial flows slowed as a global recession took hold
(UNCTADstat). The worst affected regions were Japan, the European
Union and the US, respectively (Said, 2011: 8).
Impact of the crisis
North African countries were initially sheltered from the impact of the
global financial crisis, because their financial and banking systems
are weakly linked with global markets (WEF, 2010: 37; Paciello, 2010:
52). However, their heavy dependence on the EU and the US for trade
and capital flows, as well as tourism, meant that there were delayed
spillover effects for the region27. The impact of the crisis reached
North Africa in 2009, when real GDP growth slowed across the region.
However, the countries were fairly resilient at macroeconomic level
and by 2010 showed signs of economic recovery (see Table 3 in the
appendix).
The countries were exposed to the crisis because of their structural
vulnerabilities – that is, their economic openness28, net oil exporters’
export concentration in fuels, and Tunisia and Morocco’s export
concentration in manufactured goods29. However, their nurtured
vulnerabilities from the world food crisis – namely, their increased
sensitivities to declines in international trade, capital flows and
remittances, as well as to food and fuel price shocks – also played
a part (see Figure 8). The decrease in demand for the region’s exports
affected the oil and gas sector in Algeria and Libya and the
manufacturing and agricultural sectors in Tunisia and Morocco.
Export volumes fell everywhere except Egypt, where they grew 3%
between 2008 and 2009, providing Egypt with a partial buffer against
the crisis (UNCTADstat). Egypt’s resilience is attributable to its
relatively low reliance on the EU and US as trade partners, limiting
its exposure to two of the most crisis-affected regions (see Table
15 in the appendix). Nevertheless, every North African country,
including Egypt, experienced a drop in export values, trade-related
tax revenues and merchandise trade in 2009 (see Table 1 in the
appendix).
27 In some cases, the effects of the recession were immediate. For example, there were huge outflows of capital from the Cairo and Alexandria Stock Exchange in 2008 (see Table 5).28 In terms of ‘economic openness’, North African countries display very high merchandise trade dependence, but only medium to low economic reliance (in percentage of GDP terms)on tourism, FDI, ODA or remittances, depending on the country and according to the standards applied by Massa et al (2011) – that is, low: <3%, medium: >3% but <10%, high: >10%.29 Fuel accounted for 62% of GDP in Libya and 35% in Algeria in 2010, while manufactured goods made up 27% of GDP in Tunisia and 12% in Morocco – but only 5% in Egypt (calculated from data in Tables 1 and 7).
E c o n o m i c B r i e f
2 0 1 4 • w w w . a f d b . o r g
AfDB

Commodity prices fell in late 2008 before resuming their upward trend in
2009, affecting balances and growth patterns across North Africa (see
Figure 5). Since fuel prices fell more sharply than food prices in late 2008,
the net oil exporters were left with weaker trade, current account and
fiscal balances; however, they recovered some lost ground when prices
moved upward again in 2009. The initial decrease in food and fuel prices
provided some relief from high import costs for the region’s net oil importers
and enabled Egypt to bring down inflation from its peak in 2008 (see
Table 1 in the appendix). However, because food and fuel prices remained
above their 2005 levels and began to rise again in 2009, the corrective
effect was minimal, and the three countries, especially Egypt, continued
to pay more for their imports than they earned on their exports, producing
merchandise trade and current account deficits (see Tables 1 and 3 in
the appendix). But while Egypt and Tunisia had wider merchandise trade
deficits in 2010 than in 2008, Morocco’s deficit contracted to below its
2008 level. Morocco was the only North Africa country to reduce its import
volumes in 2009 and 2010, possibly as a result of steps taken towards
import substitution following the world food crisis30.
Nevertheless, all the countries weathered the crisis well by maintaining
macroeconomic stability and, apart from Libya in 2009, none of the
countries went into recession (see Table 3 in the appendix). The net oil
importing countries, especially Egypt, remained resilient because their
broad economic base meant that export losses could be offset by
growth in domestic sectors (see Table 8 in the appendix)31. Moreover,
because inflation had eased, the countries had ample fiscal space to
implement countercyclical measures to combat the effects of the crisis.
The countries were forced to take on more debt to pay for their fiscal
stimulus packages (see Table 3 in the appendix)32. However, because
their sovereign credit ratings remained stable throughout the crisis, their
costs of borrowing were manageable33. The net oil exporting countries
were able to finance their crisis policies without incurring additional debt,
given their high liquidity and well-endowed stabilisation funds.
But while countries showed good resilience at macroeconomic level,
the effects of the crisis were detrimental at microeconomic level,
particularly for SMEs, informal sector workers and poorer households,
A f r i c a n D e v e l o p m e n t B a n k
14
30 Morocco had a good harvest in 2009, which accounts for its lower import volumes that year.31 For example, Egypt’s domestic construction and communications sectors were buoyant in 2009 (Shahine, 2009).32 Morocco and Tunisia increased external debt, while Egypt took on more domestic debt. Public domestic debt in Egypt grew to dangerously high levels during this period (Garcia-Kilroyand Silva, 2011: 8-10; El-Mahdy and Torayeh, 2009).33 Moody’s changed its outlook on Egypt’s foreign currency debt from stable to negative in June 2008, citing the country’s ‘soaring CPI inflation’ following the government’s climbdown on the removal of subsidies following the 2008 bread riots (Moody’s Investors Service, 2008). However, in August 2009, the ratings agency changed its outlook back tostable, stating that it was satisfied with Egypt’s lower inflation levels and ‘relative resilience...in the face of recent global economic turmoil’ (Moody’s Investors Service, 2009). Egypt’sEMBI Global yield spread consequently narrowed to -3 basis points in 2009 (see Table 9).
AfDB E c o n o m i c B r i e f
2 0 1 4 • w w w . a f d b . o r g
Worldfoodcrisis
Globalfinancial
crisis
Eurozonedebt crisis
ArabSpringcrisis
North African countries
Structural vulnerabilities:
• Economic openness• Export concentration• Strategic import dependence
Nurtured vulnerabilities:
• Increased sensitivity to trade and commodity price shocks• Increased sensitivity to declines in FDI and other capital flows• Increased sensitivity to declines in remittances• Higher propensity for social unrest
Figure 8: Global financial crisis - impact

A f r i c a n D e v e l o p m e n t B a n k
15
which had entered the crisis with already weakened adaptive capacities.
Sharp declines in FDI and other private capital flows caused major
problems for businesses, especially in Egypt, where FDI shrank from
9% of GDP in 2007 and to 3% in 2010 (see Table 4 in the appendix).
Most Egyptian firms encountered severe difficulties accessing credit,
and SMEs still could not raise capital, even via the Nile Stock Exchange
(see Table 9 in the appendix)34. In an effort to encourage private sector
growth and investment, the Egyptian and Tunisian governments funded
business sector reforms, thereby improving their rankings in the World
Bank’s Ease of Doing Business surveys (see Table 10 in the appendix)35.
Egypt was able to attract higher inflows of portfolio investment (mainly
for Treasury bill purchases) and Tunisia growing amounts of market
capital. However, only a limited number of firms benefited from the
inflows (see Tables 4 and 5 in the appendix)36.
The impacts of the crisis were harshest for poor households in the net
oil importing countries, since declining demand for exports caused
heavy job losses in the manufacturing, agriculture and tourism sectors,
disproportionately affecting women and young people (ILO, 2011b;
Subrahmanyam, 2011)37. Layoffs and hiring freezes led to an enlargement
of the informal economy, and across North Africa, working poverty
increased from 31% in 2008 to 37% in 2009 (ILO, 2010). Moreover,
rising unemployment in Europe and the US led to a decline in workers’
remittances to North Africa, which drastically reduced the purchasing
power of poorer families (see Table 11 in the appendix). Additionally,
while households did not greatly benefit from the easing of food and
fuel prices in 2008, since domestic prices did not fall in line with world
prices, they certainly felt the impact of the resurgence in commodity
prices in 2009 (Albers and Peeters, 2011)38. The combined effect was
a growth in household poverty alongside an increase in living costs.
Under such circumstances, households tend to economise, with
potential long-term consequences for family health, nutrition and
schooling (Jones et al, 2009).
Government response to the crisis
Table 13 displays the main policy measures implemented by North
African countries in response to the global financial crisis39. Thanks
to fiscal space created prior to the crisis, every North African country
was able to implement countercyclical fiscal policies, and in 2009 the
net oil importing countries devoted between 1.4% (Tunisia) and 1.5%
(Egypt and Morocco) of GDP to their fiscal stimulus packages. The
specific policies that countries adopted may be summarised under
the following headings:
• Infrastructure development: North African governments continued
to fund their pre-crisis investment plans concerned with improving
their transport, utilities, communications and industrial infrastructures.
In addition, in 2009 the Algerian government announced that it
would build two million apartments by 2014 to address the housing
crisis in the country (Haddad, 2009).
• Policies to attract FDI: To attract FDI, the net oil importing countries
accelerated implementation of their infrastructure investment plans,
while the net oil exporting countries opened their markets to foreign
firms. The Libyan government offered foreign companies a five year
exemption on income taxes and customs duties and relaxed the
requirement that 90% of employees must be Libyan to 75% (AEO
2011). Algeria passed measures allowing foreign firms to invest in
the country, but continued to place limits on their entry40.
• Support for the export sector: Every country modernised and
simplified its customs and tax procedures to reduce time
and costs. To help firms cope with the decrease in external demand,
the net oil importers provided dedicated support to export
industries, including preferential access to credit and loan
guarantees, manufacturing subsidies and tax ‘holidays’ or
reimbursements, lower customs duties and sales taxes (Egypt and
Tunisia), logistical support (Tunisia and Morocco), reduced-cost
marketing services (Morocco) and funded skills programmes to
raise competitiveness (Egypt). The Libyan government offered
companies a freeze on taxes and customs duties, while Algeria
offered tax exemptions to tourism firms. Between 2008 and 2010,
private sector lending grew everywhere except Egypt (see Table 9
in the appendix).
• Support for SMEs: Egypt and Tunisia set up new microcredit lines
and increased the amount of capital available to SMEs, while the
Algerian government provided guarantees and interest rate
E c o n o m i c B r i e f
2 0 1 4 • w w w . a f d b . o r g
AfDB
34 The Nile Stock Exchange was set up in 2008 to help Egyptian SMEs raise non-bank capital; but because of restrictive minimum capital requirements, only nine firms were listedwhen trading finally began in mid-2010 (MENA Financial News, 2010; Abdellatif, 2011).35 For further information, see Sabaudia Consulting (2009) and Oxford Business Group (2007).36 Market capitalisation in Morocco also grew (See tables 5 and 10).37 Poor people in the net oil exporting countries also felt the effects of fluctuations in food and fuel prices.38 Commodity prices in North Africa tend to be sticky upwards, meaning that they increase in proportion to a rise in world prices, but do not decline to the same degree when worldprices decrease. Reasons for this include: countries’ inflexible, outdated and costly procurement legislation; poor logistics; lack of supply-side monitoring; poor forecasting; inade-quate stockpiling; and insufficient use of financial instruments to hedge risks by creating virtual stockpiles (World Bank, 2011a: 40-43). Exchange rate depreciation also plays a rolein food inflation in Tunisia and Algeria, but not in the other North African countries.39 In the interests of space and relevance, countries’ monetary policies will not be covered in detail here, although the measures are indicated in Table 13. Suffice to say that monetarypolicy in the net oil importing countries was expansionary and generally supportive of fiscal policy, while the net oil exporting countries focused mainly on financial market reforms.40 Firms had to have domestic partners and could hold no more than a 49% stake in any Algerian company.

A f r i c a n D e v e l o p m e n t B a n k
16
subsidies for microcredit loans to young entrepreneurs. However,
credits to SMEs continued to be low across North Africa, given
continuing problems of high collateral requirements for bank loans
and the paucity of non-bank funding sources..
North African countries also implemented several new social measures
to mitigate the impacts of the crisis on particular groups:
• Public sector wages/benefits: Civil service wages in Morocco rose
an additional 5% in 2009, meaning that wages for government
employees increased 10% over two years. In Libya, public sector
workers were granted exemption from income tax, effectively raising
their salaries, while in Algeria civil servants were offered subsidised
1% interest rate mortgages.
• Private sector wages/benefits: Algeria, Morocco and Tunisia
increased their minimum wage. The Moroccan government also
cut the marginal income tax by 4 percentage points (IMF, 2010).
Algeria granted special tax exemptions to agricultural producers and
landlords renting their homes to low-income families (IMF, 2011b).
• Active labour market programmes: Algeria, Egypt, Morocco and
Tunisia reformed their active labour market programmes and
added new youth-specific interventions. The Algerian government
expanded the number of public sector jobs to address
unemployment, while the Tunisian government encouraged private
sector firms to retain workers part-time to avoid job cuts.
• Subsidies and transfers: Countries continued to rely on
social subsidies and transfers. Plans to cut subsidies on key items
in Egypt and Tunisia were scrapped as a result of the 2008 riots,
leading to higher-than-expected outlays. Around one-seventh of
Libya’s total budget was used to fund subsidies for basic foods,
fuel, electricity and housing (AfDB et al, 2011c). The cost of subsidies
grew across the region, and in 2009 subsidies amounted to 13.5%
of GDP in Algeria, 8.3% in Egypt, 2.6% in Tunisia and 2.8% in
Morocco (see Table 14 in the appendix).
• Consumer credit: To stimulate private household consumption,
Egypt's two largest state-owned banks committed LE 10 billion
in funds for consumer personal loans, car loans and purchases of
durable goods (Egypt Ministry of Finance, 2009). In August 2009,
the Algerian government banned bank lending to consumers,
apart from mortgages – rendering those with limited means more
dependent on state provision. This explains part of the decline in
domestic credit to the private sector in Algeria in 2010 (see Table
9 in the appendix).
Patterns of growth and crisis resilience
Assessing North African countries’ performance from an inclusive growth
perspective, countries showed good resilience during the global financial
crisis: while they all experienced slowdowns in growth, only Libya posted
a decline in GDP and, even then, for only one year. The countries that
performed best – the net oil importing countries – had a broader base
of growth, which enabled their domestic sectors to offset declines in
export volumes. Egypt was the most resilient, combining a lower reliance
on external trade (see Table 1 in the appendix), a greater diversification
of trade partners (see Tables 15 and 16 in the appendix) and a broader
sectoral contribution to GDP (see Table 8 in the appendix) than the other
countries. By contrast, the net oil exporting countries continued to
depend heavily on their oil and gas sector, which accounted for the bulk
of GDP and rendered their growth patterns subject to volatility in
international oil prices41. The countries’ recovery in 2010 had a lot to
do with oil prices having begun to rise again. Across North Africa, the
impact of the crisis fell disproportionately on smaller firms, informal
sector workers, unemployed youth and women, and poorer families –
that is, the groups that had entered the crisis with the lowest adaptive
capacities.
Examining performance from a crisis-resilience perspective, North
African countries’ responses to the global financial crisis were slow,
poorly targeted and included measures that could not be easily
dismantled at the end of the crisis. IMF’s Executive Board deemed
Tunisia’s implementation of its fiscal package slow and inefficient
(IMF, 2009), while Algeria’s emergency package was termed ‘striking
not only because it is late, but also because its design and content
are of questionable value for effectively dealing with Algeria’s structural
imbalances’ (Achy, 2009b). In terms of targeting, aside from
infrastructure programmes providing public sector jobs to the
unemployed and active labour market programmes assisting people
to find private sector work, countries’ crisis measures – and the bulk
of their spending – were not dedicated to the groups most in need
of crisis intervention. Export firms were inundated with funds and
guaranteed loans, while SMEs were offered only credit and still
continued to experience difficulties obtaining loans42. Yet in some
countries, like Egypt, SMEs were worse affected than larger firms by
loss of sales during the crisis (World Bank, 2009c: 7). Public sector
and formal sector workers were supported by salary increases, a
higher minimum wage and income tax exemptions43. Meanwhile,
informal sector workers and the unemployed were left to fend for
41 Algeria’s sectoral breakdown was little different in 2010 than in 2005, apart from a greater emphasis on construction and government services – the result of its fiscal stimulus package.42 A recent report on Tunisia stated: ‘In essence, the government swamped companies with cash and guaranteed loans’ (Oxford Business Group, 2010: 28).43 Informal workers are not subject to minimum wage and income tax legislation.
AfDB E c o n o m i c B r i e f
2 0 1 4 • w w w . a f d b . o r g

themselves44. Non-poor groups continued to benefit more than the
poor from social transfer and subsidy schemes, which remained largely
untargeted across North Africa45. In Algeria and Egypt, consumer credit
policies provided loans to wealthier groups but not to the poor, further
diminishing their capacity for coping during the crisis. Furthermore,
although North African governments had stored up sufficient fiscal
capacity to implement countercyclical policies, the cost of crisis
measures, coming on top of higher import costs, weighed heavily on
the balances of the net oil importing countries. Egypt’s position was
the weakest: its fiscal capacity in 2010 was worse than it had been in
2000. The World Bank (2009c: 9) said in its assessment of Egypt during
the crisis that, ‘as long as the stimulus program is temporary, Egypt’s
fiscal situation will continue to be sustainable’. However, increased
wages and subsidies are difficult to reduce once awarded, so are rarely
temporary measures.
The crisis policies employed by North African governments deepened
the nurtured vulnerabilities of the world food crisis period, rather than
reducing them (see Figure 9). After all, the social policies implemented
in relation to the global financial crisis were an expansion of the measures
introduced for dealing with the world food crisis. Moreover, a sizeable
portion of the countries’ fiscal stimulus packages was directed towards
supporting international trade and export firms, rather than domestic
companies or domestic development, which meant that North African
economies became in effect more trade dependent than before –
rendering them more sensitive to shocks in international trade46.
However, the crisis served as an impetus for North African countries to
readjust their trade and financial relationships – a move that could
contribute to countries’ increased resilience to trade shocks in the future.
The US became a less important trading partner for Algeria, Egypt
and Libya, while Tunisia and Morocco diversified away from Europe
(see Table 15 in the appendix). All the countries expanded their links
with regional partners and other emerging market economies (see
Table 16 in the appendix). Diversification of trade partners reduces a
country’s structural vulnerabilities and increases its resilience,
regardless of the country’s level of economic openness, while
regionalisation may provide some protection from the spillovers of
crises originating in the developed world, as well as offering numerous
growth and trade opportunities with reduced shipping (and potentially
other) costs.
It is also worth noting that tourism was a fairly resilient sector during
the crisis. In 2008 the sector posted growth despite the global recession,
and in 2009 tourism receipts constituted a larger share of total exports
than in 2008 – meaning that tourism grew relative to all other exports
of goods and services (see Table 2 in the appendix). Tourism arrivals
increased in Algeria and Morocco in 2009 and decreased only slightly
in all the other countries; in every case, the value of receipts remained
above 2007 levels. So while the tourism sector suffered losses as a
result of the recession, it remained resilient compared to all other export
sectors across North Africa.
The global financial crisis may have had a mild impact on countries’
overall growth patterns, but it had far-reaching consequences for poor
households, which were not well supported by government crisis
measures and therefore suffered a further reduction in their adaptive
capacities. Lower living standards, higher unemployment, growing
inequality and political grievances boiled over into the riots and revolutions
that destabilised North Africa in 2011.
A f r i c a n D e v e l o p m e n t B a n k
17
44 While some governments invested in active labour market programmes to reduce unemployment, a combination of constraints to long-term job creation and weaknesses in theskills sets of the labour pool meant that they had limited success (Subrahmanyam, 2011).45 Algeria’s tax concessions to landlords and landowners further increased the gap between the ‘haves’ and ‘have-nots’.46 For example, one-third of the value of Egypt’s fiscal stimulus packages was devoted to stimulating export trade, while only one-fifteenth accrued to domestic development projects(Egypt Ministry of Finance, 2009).
E c o n o m i c B r i e f
2 0 1 4 • w w w . a f d b . o r g
AfDB

3.3 Arab Spring crisis
A worldwide ‘growth pause’ took place in late 2010, causing a slump
in global demand for non-oil exports and a slowdown in international
tourism and remittance flows (World Bank, 2011c: 102-106). It coincided
with an asymptotic rise in food and fuel prices.
Impact of the crisis
The ‘Arab Spring’ riots and revolutions that erupted across North Africa
at the end of 2010 and early 2011 were triggered by countries’ nurtured
characteristics – that is, poorer households’ acute sensitivity to an
increase in food prices and to a fall in remittances, as well as various
groups’ propensities for social instability as a means of gaining policy
attention from government (see Figure 10 ). The crisis stemmed from
North African governments’ failure to adequately protect vulnerable
groups from the impacts of earlier crises, which – in an environment
of further food price accelerations – drove young men like Mohammed
Bouazizi to desperate acts. The ‘known correlation’ between food
prices and political unrest in North Africa had as much to do with a
growth in relative deprivation caused by government policies as it did
with food prices having reached the ‘tipping point’ of 21047. The crisis
resulted in a severe loss of legitimacy for several North African regimes.
As Lagi et al (2012: 24-25) note: ‘When the ability of the political system
to provide security for the population breaks down, popular support
disappears. Conditions of widespread threat to security are particularly
present when food is inaccessible to the population at large… The loss
of support occurs even if the political system is not directly responsible
for the food security failure, as is the case if the primary responsibility
lies in the global food supply system.’
A f r i c a n D e v e l o p m e n t B a n k
18
47 Lagi et al (2012: 26) identify this as the FAO price index threshold above which there is ‘persistent and increasing global unrest’.
AfDB E c o n o m i c B r i e f
2 0 1 4 • w w w . a f d b . o r g
Worldfoodcrisis
Globalfinancial
crisis
Eurozonedebt crisis
ArabSpringcrisis
North African countries
Structural vulnerabilities:
• Economic openness• Export concentration• Strategic import dependence
Nurtured vulnerabilities:
• Increased sensitivity to trade and commodity price shocks• Increased sensitivity to declines in FDI and other capital flows• Increased sensitivity to declines in remittances• Higher propensity for social unrest
Figure 9: Global financial crisis - outcomes

The Arab Spring has highlighted the fact that, once one aspect of
adaptive capacity (such as legitimacy) is lost or damaged, it is easy
for other aspects (such as fiscal capacity) to become exhausted as
well. The demonstrators raged against a lack of jobs, poor living
standards and a shortage of housing, and demanded political reform.
The riots disrupted production, trade and other economic activities
in every country. However, the extent to which social unrest depleted
countries’ fiscal capacities depended on three factors: (1) whether
the country is a net oil exporter or importer; (2) whether the country
underwent or avoided political transition; and (3) the level of violence
involved in governmental responses (see Table 17 in the appendix).
The rapid onset of the crisis demanded an immediate governmental
response: however, since the net oil importing countries had emerged
cash-strapped from the two previous crises, their governments had
fewer options than in the net oil exporting countries for dealing with
the riots and demonstrations48. This may explain why President Ben
Ali of Tunisia and President Mubarak of Egypt ceded power within
one month of the start of demonstrations. The net oil exporters had
wider scope for action. The Algerian government responded with
generous wage hikes, job creation schemes and higher food subsidies,
while the Libyan government cracked down on demonstrators and
carried out a lengthy, violent campaign against opposition groups49.
The costs of intervention in both cases were high, but the countries
had the funds to meet them, given that oil prices had risen nearly
continuously over the past decade.
Where social unrest was brought to an end fairly swiftly and decisively,
production and trade resumed at (close to) normal volumes
more quickly, and the impact of the Arab Spring on countries’
macroeconomic fundamentals was relatively mild. Non-transition
explains a good deal of why real GDP growth rates in Algeria and
Morocco in 2011 were 2.4% and 4.6%, respectively, close to African
Development Bank projections before the protests had taken place
(AfDB et al, 2013: 191, 257; AfDB et al, 2011a; AfDB et al, 2011d).
The non-transition countries were also able to reap the benefits of
commodity price increases for their key exports: oil and gas for Algeria
and phosphates for Morocco50. Morocco enjoyed an additional ‘peace
A f r i c a n D e v e l o p m e n t B a n k
19
48 After all, lengthy engagements or brutal responses require greater resources than short or conciliatory ones.49 The Algerian government also officially lifted its state of emergency that had been in place since 1992. 50 Phosphate prices have grown faster than food or fuel prices since 2006, and Morocco holds 85% of the world’s phosphate reserves (UNCTADstat; Borrell and Grushkin, 2010).
E c o n o m i c B r i e f
2 0 1 4 • w w w . a f d b . o r g
AfDB
Worldfoodcrisis
Globalfinancial
crisis
Eurozonedebt crisis
‘Growth pause’and new world
food crisis
ArabSpringcrisis
North African countries
Structural vulnerabilities:
• Economic openness• Export concentration• Strategic import dependence
Nurtured vulnerabilities:
• Increased sensitivity to trade and commodity price shocks• Increased sensitivity to declines in FDI and other capital flows• Increased sensitivity to declines in remittances• Higher propensity for social unrest
Figure 10: Arab Spring crisis - impetus and impact
bonus’, as tourists quickly flooded back and investors once again
regarded the country as a safe haven. Hence Morocco’s tourism
receipts in 2011 were only slightly lower than in 2010. The country
also enjoyed higher inflows of FDI (Njau, 2011)51.
Meanwhile, political transition lengthened disruptions to countries’ economic
activities beyond the date that leaders were overthrown. GDP growth rates
in transition countries in 2011 were far below pre-revolution projections:
Egypt grew only 1.8%, while Tunisia contracted 1.9% (AfDB et al, 2013:
221, 289). Direct damage to companies, sit-ins and strikes caused delays
in returning to full production (Shahin and Zreik, 2011). Tourists and foreign
investors fled countries experiencing social turbulence and violence, and
did not return until they were convinced that the situation had stabilised
– generally after parliamentary elections had passed in a peaceful manner.
The economic and social costs to the countries undergoing transition were
huge. In Egypt, tourism fell by almost half in the first quarter of 2011,
costing Egypt about $1 billion per month; factories were reportedly working
at half capacity even after the fall of Mubarak; FDI plunged from $6.4 billion
to $500 million; and unemployment reached double-digit levels (Hakimian,
2011; The Economist, 2012). The selloff of shares in Egypt in 2011 was
so strong that the benchmark EGX30 index lost nearly half of its market
capitalisation (Wiggleworth et al, 2012). In Tunisia, 120 foreign firms left
the country, leading to a loss of 40,000 jobs. Tunisia and Egypt furthermore
had their sovereign credit ratings downgraded, raising their costs of
borrowing (Rogers et al, 2011)52. In Libya, FDI plummeted from $3.8 billion
to almost nothing (The Economist, 2012).
In Libya, oil production ground to a near-halt during the eight-month
battle between rebel and pro-government forces, affecting the country’s
fiscal and current account balances (World Bank, 2011a: 24). Because
the National Transitional Council took international loans to fund its
campaign against the Gaddafi regime, Libya emerged from the Arab
Spring with higher external debt (CNN, 2011). The costs of the campaign
strained public finances: according to the IMF, Libya’s funds were so
depleted as a result of the revolution that the country was having
difficulties financing its imports (Donati, 2011). Libya’s GDP contracted
by 60% in 2011 (AfDB, 2013: 245). Had the country not descended
into civil war, Libya would have instead posted high growth in a rising
oil price year.
For transition and non-transition countries alike, the riots and
revolutions forced North African governments to increase social
spending to ease unemployment and lower the impact of rising food
and fuel prices on households. But while Algeria’s oil revenues more
than covered the costs of higher social transfers, for the net oil
importing countries the added expenditure resulted in wider fiscal
deficits53. The costs were especially burdensome for the transition
countries, which had lower revenues as a result of riot-related business
disruptions and higher expenditures relating to post-conflict
reconstruction. Increases in overall and youth unemployment in Egypt
and Tunisia further raised their costs. Moreover, civil war in Libya
added to problems in Egypt and Tunisia: the return of migrant workers
from Libya resulted in decreased remittance flows and higher
unemployment in the two countries, especially Egypt, while the influx
of Libyan refugees raised unemployment and social expenditure costs
(Mohapatra et al, 2011: 12).
New social measures implemented in response to the crisis
The Arab Spring forced North African governments to become more
responsive to the needs of the poor and unemployed, but public
policies continued to benefit mainly non-poor groups. Table 18 shows
the new social measures implemented by North African governments
in 201154. It demonstrates that many of the ‘new policies’ were in
fact increases in the provision of existing measures, hence presenting
the same drawbacks as before (see Figure 11). Every country increased
its food (and fuel) subsidies; but the programmes continued to be
badly targeted, and non-poor groups benefited more than the poor.
Algeria, Egypt and Morocco raised public sector salaries as a means
of addressing the rise in the cost of living, which widened the wealth
gap between public sector workers and everyone else55. In Tunisia,
major export firms continued to enjoy benefits not available to smaller
or informal sector firms.
However, there were some departures from previous policies. Tunisia
and Egypt provided targeted cash transfers to the families of migrants
returning from Libya. Tunisia’s new government passed a series of
measures providing cash and other benefits to constituents known to
have played a role in the revolution – notably the educated young
A f r i c a n D e v e l o p m e n t B a n k
20
51 Increased FDI was also a product of business sector enhancements, reflected in Morocco’s improved ranking in Doing Business 2011 (see Table 10). But relative peace enabledMorocco to make these improvements.52 Egypt was downgraded four times in 2011, and in April 2012 was ranked the eighth most-likely country to default on its sovereign debt (Markit Credit Research, 2012).53 Net oil importers’ current account deficits also increased, since their export income did not cover the higher costs of food and fuel imports.54 Some of the measures shown in Table 18 were implemented in response to the global financial crisis rather than the Arab Spring crisis, so less attention will be paid to those measures in this subsection.55 Egypt and Morocco increased public sector wages and pensions.
AfDB E c o n o m i c B r i e f
2 0 1 4 • w w w . a f d b . o r g

A f r i c a n D e v e l o p m e n t B a n k
21
56 According to one account, the reason why Algeria and Morocco were better able to maintain control during the Arab Spring was that their leaders were in a position to release vitalfood supplies before the riots turned into revolutions (Bullion, 2011).57 This can be seen from the bottom half of Table 20 since, had the comparison been between 2009 and 2010, the metrics would have been vastly better than the 2009-to-2011comparison provided on the table.
E c o n o m i c B r i e f
2 0 1 4 • w w w . a f d b . o r g
AfDB
Worldfoodcrisis
Globalfinancial
crisis
Eurozonedebt crisis
ArabSpringcrisis
North African countries
Structural vulnerabilities:
• Economic openness• Export concentration• Strategic import dependence
Nurtured vulnerabilities:
• Increased sensitivity to trade and commodity price shocks• Increased sensitivity to declines in FDI and other capital flows• Increased sensitivity to declines in remittances• Higher propensity for social unrest
Figure 11: Arab Spring crisis - outcomes
unemployed and poorer households. Tunisia and Algeria created new
government posts to reduce youth unemployment in the short term,
but also invested in longer-term solutions for sustainable job creation
in telecommunications (Tunisia) and agriculture (Algeria). Nevertheless,
only the final measure is targeted at increasing crisis resilience by
reducing dependence on strategic imports, in the case of Algeria, and
by broadening the sectors that contribute to growth, in the case of
Tunisia. The other measures instituted across North Africa are expensive,
short-term fixes that may reinforce group propensities for social
instability, especially if commodity prices continue to increase56.
Crises are often referred to as ‘normal accidents’, because their
causes reside within the system but remain undetected or are ignored
until crisis erupts (Perrow, 1999; Sagan, 2004; Wolf and Sampson,
2007). This was clearly the case with the Arab Spring uprisings, since
the warning signals were palpable during the 2008 food riots – and
perhaps even earlier. The revolutions are a classic example of Albert
Hirschman’s ‘exit, voice, loyalty’ hypothesis (Hirschman, 1970). Since
North African political systems did not allow for sufficient ‘voice’
mechanisms, so that issues could be raised from the bottom-up,
when people’s ‘loyalties’ to their governments waned and ‘exit’ was
not an option (due to restricted migration opportunities, for example),
the only outlet left was angry demonstrations that in some cases
turned into revolutions. The Arab Spring riots caused more damage
to North African countries’ growth trajectories and fiscal capacities
than the world food crisis and global financial crisis combined57. The
most vulnerable countries, with the least spare capacity to shoulder
further shocks, were the net oil importing countries.
On a more positive note, recent studies have shown that countries
undergoing democratic transition experience GDP contractions
averaging 3-4 percentage points during their first year of transition, after
which growth quickly resumes or exceeds pre-transition rates and then
stabilises with less volatility at the higher rate (World Bank, 2011a: 7-
8). If that is the case, then the constitutional and social reforms taking
place in North Africa could provide countries with greater long-term

stability and developmental capacity. However, the new regimes will
need to shift away from past policies for this to happen.
3.4 Eurozone debt crisis: vulnerabilities andimplications
The eurozone debt crisis could jeopardise North African countries’
recovery from the Arab Spring as well as their longer-term growth
prospects. The crisis was triggered in Greece in late 2009. At the centre
of the crisis are five euro area countries – Greece, Portugal, Ireland, Italy
and Spain – with unsustainably high debt burdens and large fiscal
deficits, prompting fears that they will default. These countries owe
hundreds of billions of euros to banks in other European countries –
notably, France, Germany and the United Kingdom (see Table 19 in the
appendix). Every euro area country apart from Germany has had its
sovereign risk rating downgraded or been put on ‘negative outlook’ by
the major credit rating agencies because of its own excessive debt
burden or its high exposure to other countries’ debt. This has raised
the borrowing costs of every eurozone country, including Germany, and
has led to a widespread policy of fiscal austerity across Europe. Greece
is the weakest of the countries, having already received two bailout
packages. At the time of writing, there is speculation about a possible
Greek exit from the monetary union – which would spell disaster for the
European Union and for the global economy.
North African countries are highly exposed to the eurozone crisis
because of their economic openness – more specifically, their strong
trade and financial links with Europe (see Figure 12). A contraction
in European demand for North African goods and services would
damage fiscal balances in the region and could affect North African
countries’ abilities to meet their spending commitments – in
particular, their costly food and fuel subsidies and hefty public sector
wage bill58. For transition countries, such a situation could produce
further unrest or, potentially, state failure. However, countries differ in
their specific vulnerabilities to the eurozone threat (see Table 20 in the
appendix). Egypt would be most resilient to a fall in European demand
for North African goods, since it is least dependent on merchandise
trade from either Europe or the euro area (see Tables 15 and 20 in the
appendix). Meanwhile, Libya is the most vulnerable: it exports nearly
half of its goods to Italy and Spain, two of the most-troubled eurozone
A f r i c a n D e v e l o p m e n t B a n k
22
Worldfoodcrisis
Globalfinancial
crisis
Eurozonedebt crisis
ArabSpringcrisis
North African countries
Structural vulnerabilities:
• Economic openness• Export concentration• Strategic import dependence
Nurtured vulnerabilities:
• Increased sensitivity to trade and commodity price shocks• Increased sensitivity to declines in FDI and other capital flows• Increased sensitivity to declines in remittances• Higher propensity for social unrest
Figure 12: Eurozone debt crisis - impact
AfDB E c o n o m i c B r i e f
2 0 1 4 • w w w . a f d b . o r g
58 North African countries’ output growth trends would also be affected, since every country apart from Egypt derives half or more of its GDP from merchandise trade, conducted primarily with Europe (see Table 1).

countries (see Table 21 in the appendix)59. Egypt, Morocco and Tunisia
would suffer most from a drop in the number of European visitors to
North Africa, since Europeans make up the bulk of the countries’ tourists
(see Table 20 in the appendix).
However, the extent to which lower trade volumes would affect public
finances in North Africa would also be determined by the direction of
commodity prices, given the sensitivity of North African countries to
food and fuel price shocks. Since the EU accounts for 25% of global
oil imports, a fall in import demand by Europe could lead to lower crude
prices, and therefore also lower food prices (Mottaghi, 2011)60. In this
scenario, the net oil importing countries would benefit from lower import
costs and reduced expenses relating to food and fuel subsidies. Hence
a decrease in export volumes, while producing lower trade-related tax
revenues, would probably not have such a detrimental impact on their
balances. Egypt would be the most resilient of the net oil importers,
given its relatively low reliance on the EU as a trading partner and its
strong links to Arab League economies, notably Saudi Arabia (see Tables
16 and 21 in the appendix). For the net oil exporting countries, a fall in
crude prices combined with decreased trade volumes would damage
their trade, current account and fiscal balances. Libya would be worst
affected, given its heavy trade reliance on the EU and because it has
emerged from the Arab Spring in a much weaker position than Algeria.
Libya’s resilience in such a situation would depend on the extent to
which its stabilisation fund and other liquid resources would cover its
trade deficit and social programme costs, in addition to its other financial
commitments. Algeria would likely have sufficient liquidity to cover its
losses, at least in the short term.
If instead crude prices were to rise, as they have since 2009, Algeria
would be the best off of all the countries, since its relatively low reliance
on Europe as a trading partner, combined with the higher per-unit
values that it would earn for its exports, would most likely result in
improved balances – or, if not, in its government being able to
comfortably cover any losses with high cash surpluses. Libya’s position
would depend on the extent to which decreased demand from Europe
would be offset by an increase in oil prices; but the country would
likely remain buoyant in a rising oil price scenario. Hikes in food and
fuel prices would prove most challenging to the net oil importing
transitional countries – in Tunisia via exports, given its high trade
dependence on the EU, and Egypt via imports, given its high sensitivity
to rising food prices61. Egypt and Tunisia would likely need to borrow
funds to cover their financial commitments, since spending cuts or
tax increases could reignite social tensions and undermine their
recovery from the Arab Spring. Moreover, their worsened fiscal
capacities compared to 2009 (see bottom half of Table 20 in the
appendix) and the perceived risks associated with their political
transition may make it difficult for the countries to access funds – as
Egypt’s recent experience in obtaining an IMF loan demonstrates
(Saleh and Khalaf, 2013).
International capital markets would likely tighten in the event of a
worsening of the crisis, making it even more difficult for North African
governments to secure affordable loans. Concerns of a potential Greek
default have already put pressure on European banks to retain more
capital and lend less, and have raised the costs of borrowing across
North Africa. Interest rates on sovereign debt have risen sharply over
the past two years: for example, the yield on a one-year Treasury bill
in Egypt increased from 10.5% in October 2010, to nearly 14% in
October 2011 and to around 16% in May 2012 (World Bank, 2011d;
Pfeiffer, 2012). Higher debt servicing costs would add to fiscal pressures
for countries with already high costs.
A deepening of the crisis would also have severe consequences for
small businesses and poor households across North Africa. North
African firms, in particular SMEs, would experience problems in
accessing capital and credit if European banks and investors decide
to concentrate their resources at home62. The debt crisis has already
led to a collapse in investor appetite and the deepest panic in 31 years,
as measured by the Credit Suisse Global Risk Appetite Index (Dimson
et al, 2012). An outflow of FDI could stunt private sector growth,
especially in the net oil importing countries. After all, the EU supplies
80% of FDI in Morocco, 61% in Egypt and 58% in Tunisia (see Table
20 in the appendix). Morocco is the most exposed of the North African
countries to contagion from the European banking sector, since foreign
(mainly European) banks control over one-third of its total bank assets
(see Table 22 in the appendix)63.
The crisis could affect North African households in several ways. First,
higher unemployment in Europe could result in lower remittances to
North African households. Families in Algeria, Morocco and Tunisia
would be most affected, since around 90% of their remittances originate
A f r i c a n D e v e l o p m e n t B a n k
23
E c o n o m i c B r i e f
2 0 1 4 • w w w . a f d b . o r g
AfDB
59 Algeria and Morocco also trade heavily with Italy and Spain (see Table 21).60 The prices of the two commodities are tightly linked, because oil is a key input in agricultural production, and agricultural products are often used for biofuels (World Bank, 2011a: 33).61 Morocco would also incur trade losses, but may be less sensitive to food and fuel price shocks, given its import substitution programmes – so would likely be the most resilient of thenet oil importing countries.62 SMEs suffer more than larger firms during a ’credit crunch’, as banks and depositors exhibit a flight to quality that penalises SMEs, even potentially profitable ones (Ding et al, 1998: 12-13).63 Tunisia and Egypt are less at risk of a ‘credit crunch’ in their banking sector, since European banks comprise less of their foreign bank exposure.

A f r i c a n D e v e l o p m e n t B a n k
24
AfDB E c o n o m i c B r i e f
2 0 1 4 • w w w . a f d b . o r g
in the EU (see Table 20 in the appendix)64. Second, a fall in European
demand for North African products could lead to job losses, especially
in the net oil importing countries’ tourism, manufacturing and agricultural
sectors. Third, some European countries have responded to the crisis
by introducing financial incentives to encourage jobless migrants to
return home (Jones et al, 2009: 22-23). If successful, these schemes
could add to unemployment problems in North Africa. The combined
effect of a collapse in remittances and a spike in unemployment would
be detrimental for poorer households, and North African countries
without the spare fiscal capacity to increase social spending to respond
to these pressures could face social unrest, especially if food prices
were to rise at the same time.
However, there is a chance that these eurozone threats will not fully
materialise or that their impacts will be offset by several factors. First,
the new mood in Europe – that is, the rejection of the ‘fiscal austerity
pact’ in favour of a ‘growth compact’ – could boost European demand
for foreign exports, reinvigorating global growth and world trade (Atkins
et al, 2012)65. Second, investors may reallocate their portfolios from
the EU to North Africa, viewing especially the transition countries as
attractive venues with future growth potential. Stock markets in Egypt
and Tunisia began to rise following the countries’ parliamentary
elections in 2011 and continued to escalate through the early part of
2012 (see Figure 13)66. At the time of writing, it is too early to tell
whether this is a post-Arab Spring market correction or instead a
genuine ‘transition premium’ (Miller and Hunter, 2012). However, if the
countries are able to achieve internal stability, they will likely enjoy
higher inflows of investment from abroad (World Bank, 2011a: 7-8)67.
Third, the transition countries may be able to (literally) capitalise on
the post-revolution euphoria to boost their income levels. Remittances
to Egypt grew 30% in 2010/11, owing to the successful ’Save Egypt’
online campaign, urging Egyptians abroad to transfer funds to their
bank accounts at home (Zohry, 2011). The countries may wish to
explore further possibilities for financial as well as practical involvement
by their overseas diaspora as a way of keeping down costs during
their recovery period.
But even if North African countries are able to survive the threat of the
eurozone debt crisis, they will still need to make substantial changes
to their longstanding policies to avoid the worst effects of future shocks
and place themselves on a more crisis-resilient pathway. This means
learning from their past experiences.
64 Egypt, although one of the world’s top remittance recipients, would be least affected, since 59% of its remittances come from Arab countries and only 12% from Europe (MigrationPolicy Institute, 2011).65 Some commentators are sceptical about the viability of this new economic solution (see, for example, Kassandra, 2012).66 Egypt’s EGX 30 index was the world’s second-best performer in first-quarter 2012, while Tunisia’s Tunindex nearly reached its 18 December 2010 level. Meanwhile, Morocco’s MASIindex has been on a downward trend since early 2011.67 Uncertainty about Egypt’s presidential elections led to sell-offs of stock market shares in May and early June 2012.

A f r i c a n D e v e l o p m e n t B a n k
25
E c o n o m i c B r i e f
2 0 1 4 • w w w . a f d b . o r g
AfDB
EGYPT STOCK MARKET (EGX 30)
MOROCCO STOCK MARKET (MASI)
TUNISIA STOCK MARKET (TUNINDEX)
Figure 13: Two-year graphs of the benchmark indexes for Egypt, Morocco and Tunisia

3.5 Patterns of growth and crisis resilience in NorthAfrica
The analyses presented in this section produce a picture of both growth
patterns and crisis performance across North Africa over the past decade.
From 2003 to 2010, North African countries enjoyed stable, high growth,
notwithstanding the impact of the global financial crisis. Their improved
record compared with previous periods may be attributed to a few beneficial
policies that the countries implemented at macroeconomic level:
• Trade liberalisation and privatisation enabled the countries to
capitalise on the gains of the global economic boom by increasing
North Africa’s share of world trade and attracting higher flows of
capital to the region.
• Prudent macroeconomic management allowed the countries to
build fiscal capacity, enabling them to implement countercyclical
policies during the global financial crisis.
However, none of the countries was able to achieve sustained, rapid
growth at the levels required to substantially reduce poverty and
unemployment, for several reasons:
• In the net oil exporting countries, growth was not broad-based
but concentrated in a single sector, rendering the countries’ expansion
patterns vulnerable to international fuel price volatility.
• In the net oil importing countries, unconducive regulatory and
legal frameworks deterred formal private sector growth and
investment, limiting countries’ expansion, even though they had a
broader base of economic sectors contributing to GDP.
• Across North Africa, weak investor protection restricted firms’,
especially SMEs’, access to capital, which in turn limited their
contribution to overall growth and employment.
• Skills mismatches between the outputs of education and the
needs of the labour market impeded the development of high-
productivity sectors that could lead to accelerated growth and
educated employment in the region.
As a result of these growth-inhibiting policies, a large informal sector has
developed across North Africa, in which many workers are subject to poor
pay and bad conditions. Weak enforcement of labour legislation across
the region has meant that even many formal sector workers are not
protected during market and employment transitions. A shortage of decent
jobs has deterred both productivity and growth, contributing to a vicious
cycle of unrealised potential and an increase in working poverty.
Furthermore, growth has not been inclusive: the most vulnerable groups
benefited little, if at all, from the rewards of the economic boom, but bore
a disproportionate share of the losses during the global financial crisis.
Tensions built up as a result of these policies and practices boiled over
into the Arab Spring riots and revolutions, disrupting growth across the
region. The governments that had accumulated the right kinds of
resources – mainly legitimacy and food supplies – were able to avoid
transition and put their countries back on a reasonable growth path. For
the others, political instability has led to uncertain growth patterns. The
overall picture is one where, instead of promoting crisis-resilient growth,
North African countries’ policies have produced growth-inhibiting crises.
Across the region and in every country, the cost of new social measures
implemented to restore order following the Arab Spring, coming on top
of programmes already in place to deal with the world food crisis and the
global financial crisis, has weakened countries’ fiscal capacities. Even the
cash-rich net oil exporting countries are challenged by the current situation,
since their ability to fund their programmes is reliant on oil prices continuing
to rise. Therefore every North African country needs to shift its policies
to navigate toward a more stable and productive future pathway.
Since global economic crises are becoming more common as the world
becomes more financially integrated, North African countries need to
devise ways of minimising the impacts of and forming resilience to crises
that could hinder their recovery from the Arab Spring as well as their
future growth path. The countries are currently threatened by the brewing
eurozone debt crisis, so they need to act quickly. As mentioned at the
start of this section, crisis resilience is achieved through reducing systemic
vulnerabilities, strengthening adaptive capacities and expanding the
drivers and distribution of growth. An understanding of these dynamics
is vital for generating policy options for promoting crisis-resilient growth.
Table 23 synthesises information presented in this section to highlight
North African countries’ systemic vulnerabilities and other weaknesses/
threats, as well as the factors that have contributed to growth and crisis
resilience in the countries over the past decade. North African countries’
key structural vulnerabilities may be summarised as follows:
Economic openness: This category can be broken down into three
components for better understanding of the issues affecting specific
countries.
• Merchandise trade dependence – International integration is a
source of growth for developing countries, so a healthy measure of
trade openness is desirable. However, too high a dependence on
foreign markets signals that domestic markets are thin and that
growth may not be sustainable in the event of a trade shock.
All the countries except Egypt display heavy merchandise trade
dependence: over half of their GDP derives from external trade
in goods.
A f r i c a n D e v e l o p m e n t B a n k
26
AfDB E c o n o m i c B r i e f
2 0 1 4 • w w w . a f d b . o r g

• FDI dependence – FDI and international private capital flows account
for 3-5% of GDP in the net oil importing countries and in Libya.
However, the significance of these flows is higher than their
contribution to growth suggests, because of the shortage of
domestic capital available to firms in North Africa.
• Remittance dependence – Before the global financial crisis,
remittances accounted for 8% of GDP in Morocco and 5% in Egypt
and Tunisia. North African households are heavily dependent on
remittances to meet their living costs, given high levels of poverty
across the region and low alternative support mechanisms available
to poorer families.
Export concentration: Algeria and Libya’s high dependence on oil
exports makes them extremely sensitive to fuel price shocks. While the
countries have benefited from crude prices having risen for most of the
past decade, fuel prices will decline – potentially sharply – in future, at
which point the countries’ high reserve levels and large stabilisation funds
may not provide them with long-term immunity from fiscal breakdown.
Moreover, because the countries have increased their spending on social
programmes since 2008, the breakeven oil price that they now require
to achieve fiscal balance has become very high (World Bank, 2011a:
28). Tunisia and Morocco, although economically diversified, exhibit
export concentration in manufactured goods.
Food import dependence: All North African countries, in particular
Egypt, are reliant on food imports because they struggle with climate
change and water scarcity issues68. They are therefore very sensitive to
food price shocks, which are a constant issue for net oil importing
countries, given that domestic food prices tend to be ‘sticky upwards’,
but can also represent a problem for net oil exporters during periods of
falling commodity prices69.
Fuel import dependence: The net oil importers rely on fuel imports,
which render them vulnerable to oil price and supply shocks. However,
while Morocco’s fuel import dependence is due a shortage of domestic
energy sources, Egypt’s derives largely from its fuel subsidy system,
which encourages overconsumption.
Other factors pose a threat to these countries’ future growth and
development patterns:
European exposure: The eurozone debt crisis has drawn attention to
North African countries’ heavy reliance on the EU for trade and capital
flows. Egypt is the least dependent on Europe for trade, although it
does rely on EU countries for tourism and FDI flows, while Tunisia and
Morocco are the most dependent on European sources for four key
income areas70.
Political uncertainty: Transition has resulted in volatile growth patterns
and fluctuating capital flows for Libya, Egypt and Tunisia. Until the
countries are able to achieve some measure of internal stability, they
will continue to experience future growth challenges.
Weak fiscal capacity: The net oil importing countries have emerged
from the three crises with significantly reduced fiscal positions. Given
their higher fiscal costs as a result of expanded subsidies and increased
wages, unless the countries find ways of bolstering their financial
positions, they could experience further social unrest in future.
Weak private sector: All of the countries have large informal economies,
and private sector development has been impeded by firms’ low access
to capital and credit. Strengthening the private sector would expand the
drivers and therefore also the pace of growth.
Weak human capital: A shortage of useful vocational skills among a
large percentage of the workforce, combined with high unemployment
and labour market disengagement, has deterred growth across North
Africa and has implications for future growth. The rise in poverty and
food insecurity also threatens the progress the region has made towards
achieving their MDGs.
Table 23 also highlights factors that have contributed to growth and
crisis resilience over the past decade. These factors include:
Valuable natural resources: Libya and Algeria’s crisis resilience during
the world food crisis and the global financial crisis is attributable to the
growing prices the countries received for their oil and gas products.
However, resilience based on a single commodity is rarely everlasting
and the countries’ dependence on their crude oil reserves makes them
highly sensitive to depletion in their oil supplies. Oil is a finite resource,
and world oil supplies are forecast to run out between 2049 and 2069,
A f r i c a n D e v e l o p m e n t B a n k
27
E c o n o m i c B r i e f
2 0 1 4 • w w w . a f d b . o r g
AfDB
68 Only between 8% and 18% of land in Algeria, Libya, Morocco and Tunisia is irrigated; these countries depend on rain-fed agriculture for over 50% of all arable land (World Bank,2009b). Egypt’s farmland is nearly 100% irrigated, but the country nevertheless needs to import a large portion of its food requirements.69 Fuel prices are more volatile than food prices, so they rise and fall at a faster rate. Net oil exporters’ petroleum revenues more than cover their food costs in times of rising prices,but do not when the prices of both commodities fall.70 That is, trade, tourism, FDI and remittances (see Table 23).

depending on the rate of investment in alternative energy sources
(Mohaddes, 2012). Energy depletion in North Africa could occur sooner:
Algeria’s hydrocarbon sector has been projected to enter permanent
decline in 2030 (Mitchell et al, 2008: 15). Morocco’s resilience during
the global financial crisis and Arab Spring crisis may be partly ascribed
to its large phosphate reserves, which earned peak prices in 2008 and
rose in value from late 2009 to the beginning of 2012. Morocco’s
phosphate exports are forecast to grow in the short- to medium-term,
since other countries’ reserves have shrunk and global demand for the
mineral has increased (Handfield, 2012).
Political stability: Algeria and Morocco survived the Arab Spring crisis,
so have enjoyed the rewards associated with political stability. However,
leaders in both countries will need to decisively address the issues of
poverty, inequality and unemployment.
Tourism: Until the Arab Spring riots and revolutions dispersed tourists
from the region, tourism was a source of resilience for the net oil
importing countries. For example, during the global financial crisis,
European tourists chose to travel to North Africa rather than to more
distant destinations, and the sector continued to contribute around
9% to the countries’ GDP. A recent study by the World Bank suggests
that trade in services in general is more crisis-resilient than trade in
goods, because demand for services is less cyclical and less reliant
on external finance (Bochert and Mattoo, 2009). However, North African
countries have experienced issues in this sector because of terrorism
and political instability associated with widening poverty and inequality
(Gurr, 2006).
Diversified economic sectors: The net oil importing countries, in
particular Egypt, showed good resilience during the global financial
crisis, because their broad economic base meant that export losses
could be offset by growth in domestic sectors. Egypt has the most
developed domestic market out of all the North African countries.
Diversified trade partners: Egypt was resilient during the global
financial crisis owing to its relatively low reliance on the EU and US
as trade partners. The crisis caused every North African country to
readjust its trade and financial relationships, so that by 2010 each
had at least one non-European country among its top-five export
partners (see Table 21 in the appendix). Egypt and Tunisia have
significantly increased their regional trade ties, thus reducing their
exposure to external shocks (see Table 16 in the appendix).
Import substitution: Algeria and Morocco’s investments in agriculture
may have enabled them to survive the Arab Spring. Morocco has also
undertaken investment in renewable energy sources as a means of
reducing its reliance on fuel imports. Libya and Egypt have invested in
agriculture in other countries – for example, the Sudan – to decrease
their dependence on food imports.
The overall picture presented in this section and summarised in Table
23 is that, while North African governments took steps to increase
growth and improve crisis resilience over the past decade, the
measures they implemented did not extend far enough into society,
so that benefits were shared broadly across sectors or widely across
groups. Over time this resulted in weakened adaptive capacities for
marginalised sectors and groups, rendering them highly sensitive to
external shocks and fuelling frustrations that eventually produced a
crisis from within – the Arab Spring. The internal crisis in turn weakened
sectors that had earlier been fortified by government policies and
appeared resilient to external shocks – demonstrating that crisis
resilience is not possible over the long term unless inclusive growth
is a part of the overall strategy. Given that North African countries are
now more vulnerable to external shocks and have weaker adaptive
capacities at all levels, the next crisis – be it the eurozone debt crisis
or some other external event – could debilitate the region unless
governments act soon. Recovery from the Arab Spring will involve
radical changes in policy and a rebalancing of power and resources.
Inequalities need to be reduced and trust needs to be restored if
countries are to gain the stability and strength required to build
resilience to future global shocks and attain the rapid, sustained
growth needed to substantially reduce unemployment and poverty
in the region.
Specific recommendations to promote crisis-resilient growth will be
provided in the concluding section. The next section examines
examples of successful crisis resilience measures from other regions
and assesses their relevance for crisis mitigation and prevention in
North Africa today.
A f r i c a n D e v e l o p m e n t B a n k
28
AfDB E c o n o m i c B r i e f
2 0 1 4 • w w w . a f d b . o r g
A f r i c a n D e v e l o p m e n t B a n k
29
E c o n o m i c B r i e f
2 0 1 4 • w w w . a f d b . o r g
AfDB
The country examples included here provide good policy models for
addressing the main challenges facing North African countries today
(see Table 24 in the appendix). They illustrate how reforms aimed at
overcoming problems at each level of aggregation – beginning with
household level, then market, then macro – can engender more inclusive
growth and greater crisis resilience at all levels.
4.1 Strengthening crisis resilience through socialpolicy: Argentina from the Mexican Tequila crisis to theglobal financial crisis
Today Argentina seems the model of crisis-resilient growth. Following
rapid economic expansion at an average annual rate of 8.8% between
2003 and 2007, Argentina’s growth slowed during the global financial
crisis to 6.8% in 2008 and 0.9% in 2009, before quickly rebounding
to 9% in both 2010 and 2011 (IILS, 2011; World Development
Indicators). Unemployment was also contained during the crisis,
briefly rising to 8.7% in 2009 before declining to pre-crisis levels of
below 8% in both 2010 and 2011(IILS, 2011; World Development
Indicators). Yet only a few years earlier, in 2001, Argentina had
experienced the worst crisis in its history: its economy collapsed;
unemployment and poverty levels approached 20% and 40%,
respectively; violent protests broke out across the country amid calls
for political reform; and in December that year, Argentina’s president
fled the country (Stiglitz, 2002; Gasparini, 2007: 38). The 2001 crisis
was generated by economic policy failures – in particular, an over-
reliance on foreign debt and capital flows – but was exacerbated by
government’s long-term neglect of the country’s growing social
problems. Nevertheless, Argentina’s recovery from the crisis was
remarkably swift: by 2003 its economy was growing at a sustained
rapid pace, and by 2006 its unemployment and poverty levels had
declined to 9% and 27%, respectively (Gasparini, 2007: 38; 56). A
key aspect of Argentina’s resurgence and resilience is the social
measures that its government adopted following the 2001 crisis.
Argentina’s reforms could therefore provide a good policy example
for North African countries today.
Case relevance
Argentina in 2002 faced many of the same problems that North African
countries do today; and, as in North Africa, these issues had built up
over time. Structural adjustment in the early 1990s – encompassing
trade liberalisation, privatisation of state-run companies and
administrative cutbacks – gave Argentina an impressive macroeconomic
record but led to deteriorating social conditions. Unemployment in
Argentina leapt from 7.5% in 1990 to 18.5% in 1995, but the
unemployment insurance scheme that its government introduced in
1991 did not serve as a social safety net for the poor (Lodola, 2003:
3-7). It extended to less than 8% of the unemployed, mainly middle-
class workers. Informal sector workers – who comprised 40% of
Argentina’s labour force – were not covered by the scheme, since it
was financed by payroll taxes. Up to 2002, Argentina invested very
little in social programmes: spending on these programmes did not
exceed 0.1% of GDP (Lodola, 2003: 7). So when spillovers of the
Mexican Tequila crisis hit Argentina in 1995, while the country displayed
good resilience at macroeconomic level – in particular, stable strong
growth and single-digit inflation – it was not resilient at microeconomic
level. Government policies did not mitigate the impacts of shocks on
vulnerable groups, so many households were badly affected by the
crisis (IILS, 2011: 12). The government’s unwavering focus on improved
macroeconomic performance as a means of attracting foreign
investment to Argentina meant that it had ignored the country’s growing
social problems (Stiglitz, 2002). Rising poverty, inequality and
unemployment led to social tensions, and in 1997 riots broke out in
the southern oil enclave of Cutral-Có/Plaaza Huincul. Unrest forced
the government to turn its attention to social policy, and later that year
it launched an emergency employment programme called Plan Trabajar
(see Box 1).
4. Successful crisis resilience measures from other regions

A f r i c a n D e v e l o p m e n t B a n k
30
AfDB E c o n o m i c B r i e f
2 0 1 4 • w w w . a f d b . o r g
Key features of Plan Trabajar
Plan Trabajar was a self-targeting programme designed to tackle
poverty and unemployment. Programme participants were required
to work 30-40 hours per week on projects to upgrade the infrastructure
in their local community. Trabajar was a well-designed programme
and successful in terms of targeting, impact on workers’ incomes
and peripheral infrastructure benefits. The programme’s low wage
rate served to attract the correct pool of applicants: over 50% of
programme participants were from the poorest decile of the population,
and 80% were from the poorest quintile (Jalan and Ravallion, 2003).
Trabajar’s work requirement was tightly enforced, and 400,000 people
participated in 16,000 public works projects benefiting poor
communities (Galasso and Ravallion, 2004; Grosh et al, 2008: 301).
Projects were generally well run: the federal government provided
clear and transparent guidelines for the conduct of projects, which
local and municipal governments implemented. Moreover, because
costs were shared between the two levels of government, with the
federal government bearing labour costs and municipalities paying
for materials, poorer municipalities had an incentive to propose labour-
intensive projects – thereby extending programme benefits to as wide
a beneficiary pool as possible. On average, labour costs accounted for
between 40% and 60% of total project costs across all Trabajar
projects (Grosh, et al, 2008: 301).
The main drawbacks of Trabajar were that too little was spent on it,
and its rollout was too late to mitigate the effects of the Tequila crisis
on Argentina’s vulnerable populations. Trabajar was implemented in
1997, two years after the Tequila crisis hit Argentina. So, by the time
it was in place, Argentina’s poor had already suffered negative impacts
of the crisis. Less than 0.1% of GDP was allocated to Trabajar, so
the programme extended to only 7.5% of Argentina’s unemployed –
too small a beneficiary pool to make a real difference (Grosh et al,
2008: 90). Hence, when contagion from the East Asian financial crisis
hit Argentina in mid-1998, sinking the country into depression, its
impact on the poor and unemployed was severe. The situation was
not helped by the government’s decision to adopt fiscal austerity
from 2000 to 2001 in a failed bid to restore investor confidence in
the Argentine economy. By the end of 2001, unemployment affected
nearly one-fifth of Argentina’s economically active population, informal
employment accounted for over half of all jobs, and nearly two-fifths
of the population was poor (Stiglitz, 2002; Gasparini, 2007: 38).
Following the 2001 internal crisis that toppled the government,
unemployment and poverty levels rose further, reaching highs of 21.5%
and 57.5%, respectively, by May 2002 (Rofman and Ringold, 2008).
Argentina’s new government realised that a programme more extensive
than Trabajar was required to restore social order, so in 2002 they
replaced Trabajar with Plan Jefes y Jefas de Hogar Desocupados – a
larger and more targeted programme (see Box 2).
Box 1: Trabajar (To Work)
Objectives To provide short-term work opportunities to
unemployed poor workers; and to upgrade and improve the
local infrastructure in poor areas
Start date 1997; ended 2001
Targeting criteria None. Self-targeting via low wage rate, sup-
plemented by a project selection process that geographically
targets poor areas to receive projects.
Work requirement 30–40 hours per week
Wage levelWpr = Wmin < Wmk; Lowered in 2000:
Wpr < Wmin < Wmk
Expenditure 1998–2001: about US$200 million per year
(approximately 0.07% of GDP)
Coverage About 240,000 people (August 1998–October
1999) – about 1.5% of the economically active population or
7.5% of the unemployed
Source: Grosh et al (2008: 90; 486); Lodola (2003)
Notes: Wpr = programme wage; Wmin = minimum wage;
Wmk = market wage

A f r i c a n D e v e l o p m e n t B a n k
31
E c o n o m i c B r i e f
2 0 1 4 • w w w . a f d b . o r g
AfDB
Key features of Plan Jefes
Plan Jefes was aimed at households with dependents below the age
of 18 whose heads had become unemployed as a result of spillovers
from the Asian financial crisis (Grosh et al, 2008: 433-435). Its work
requirement was 20 hours per week and could be met through private
sector work, community work, training activities or school attendance.
The programme successfully targeted Argentina’s poorest groups via
its low wage rate: one-third of the population in the poorest quintile
participated in Jefes, and 80% of programme benefits were received
by the poorest 40% of the population (Rofman and Ringold, 2008).
Jefes also attracted groups that tend to be most affected during crises:
women constituted 71% of programme beneficiaries and young people
below 35 years of age 47% (Kostzer, 2008: 21).
Jefes was successful in mitigating the impacts of the crisis on
vulnerable groups at a fairly low cost. At its peak in 2003, the
programme provided jobs to nearly two million workers – that is,
around 5% of Argentina’s total population – at a cost of around 1%
of GDP (Wray and Tcherneva, 2005: 3). Jefes’ below-minimum wage
rate played a role in keeping programme costs low while expanding
the pool of beneficiaries. During its four-year operation, the programme
successfully reduced poverty and long-term unemployment among
participants. Poverty among participants decreased from 82% to
70%, and an additional 10% of beneficiaries were prevented from
falling into extreme poverty (Galasso and Ravallion, 2004: 393-4).
Around 50% of Jefes participants were incorporated into formal sector
employment; of these, half (male and female) had previously been
unemployed, and half (mainly women) had been economically inactive
(Galasso and Ravallion, 2004: 389).
Furthermore, the programme empowered participants and increased
their sense of belonging to a community (Wray and Tcherneva, 2005:
11-12). 87% of Jefes beneficiaries worked in community projects.
40% claimed that the programme gave them the confidence that they
‘can do something’, and an additional 12% remarked that it allowed
them to ‘help the community’. 9% said that the programme provided
them with learning opportunities. Over 70% of participants reported
feeling ‘respected’ when applying for the programme, and 90% said
they were ‘satisfied’ or ‘very satisfied’ with the programme.
A major factor in Jefes’ success was its large and rapid rollout, made
possible by the government’s previous experience in running a similar
programme – that is, Plan Trabajar. Jefes was up and running within 5
months, and continuity allowed for its administrative costs to be kept low,
at just 1.6% of total programme costs (Wray and Tcherneva, 2005: 4;
Grosh et al, 2008: 413). Jefes was scaled down after 2003, when the
crisis had subsided (Grosh et al, 2008). Some beneficiaries left the
programme because they had found formal employment. Some were
removed because they no longer met programme eligibility criteria. Others
were transferred to the two new programmes that replaced Jefes: Familias,
a conditional cash transfer programme offering a basic income to
households with three or more children, and Seguro de Capacitacion y
Empleo, a non-contributory unemployment benefit programme offering
skills training and employment services.
Jefes helped to end social unrest and spur economic recovery in Argentina
through its wider effects on poverty, unemployment, and domestic
consumption (IILS, 2011: 20). Between 2002 and 2006, poverty in Argentina
fell 30 percentage points, unemployment 12 percentage points and
women’s economic inactivity 21-27 percentage points – largely as a result
of the Jefes programme (Gasparini, 2007; Galasso and Ravallion, 2004:
Box 2: Plan Jefes y Jefas de Hogar Desocupados
(Unemployed Heads of Household)
Objectives To provide impoverished heads of households
affected by the East Asian financial crisis with direct income
support.
Start date 2002; ended 2006
Targeting criteria Beneficiaries must be unemployed; be the
head of a household; or live in a household with at least one
minor below the age of 18, a pregnant woman, or a handicapped
person of any age.
Work requirementWork or participate in training or education
activities for 4–6 hours a day (no less than 20 hours a week).
Wage levelWpr < Wmin < Wmk; wages were set at Arg $150
(approx. US$50) per month.
Expenditure 2004: US$1,255 million (0.82% of GDP).
Coverage2002: 574,000 beneficiaries (about 3.3% of economically
active population); 2003: nearly 2 million (about 11.3%); 2004:
1.7 million (about 9.5%); 2006: 1.2 million (about 6.4%).
Source: Grosh et al (2008: 486)
Notes: Wpr = programme wage; Wmin = minimum wage;
Wmk = market wage

A f r i c a n D e v e l o p m e n t B a n k
32
AfDB E c o n o m i c B r i e f
2 0 1 4 • w w w . a f d b . o r g
389). Jefes also had an ‘overwhelmingly positive’ macroeconomic impact:
through multiplier effects, the wages earned by Jefes workers contributed
an annual addition of 2.5% to GDP (Wray and Tcherneva, 2005: 5).
Social policy during the current global financial crisis
Lessons learned following the 2001 crisis helped Argentina to avoid the
worst effects of the current global financial crisis (IILS, 2011: 1-2). Its
government understood that social policies must play a central role in
crisis mitigation and that employment plays a key role in strengthening
households’ resilience to crises. Hence, during the current financial
crisis, Argentina’s government has devoted over one-third of its fiscal
stimulus package to social programmes, of which 63% is earmarked
for labour and income policies. The crisis response has also been rapid,
since the administrative infrastructure for implementation – a legacy of
Trabajar and Jefes – is already in place.
Applicability to North African countries
A programme modelled on Jefes/Trabajar, modified to fit each country’s
specific circumstances, could be applied in North Africa and would present
a number of advantages over the countries’ current social programmes.
Cost and targeting: Jefes cost 1% of GDP and benefited 5% of Argentina’s
population, with most participants coming from the poorest sections of
society. By contrast, North African countries’ food and fuel subsidies cost
between 3% and 14% of GDP, with the bulk of benefits accruing to non-
poor groups (see Table 14 in the appendix). If North African countries were
to shift from their subsidy systems to a programme like Jefes, they would
more accurately target benefits to vulnerable groups and still have funds
left over for other necessary programmes. However, the switch would
require strong political will and commitment, as well as administrative
controls to prevent corruption or unfairness in the allocation of programme
benefits.
Multi-purpose versus single-purpose: North African countries’ social
programmes have tended to serve a single purpose (such as income
support) rather than multiple aims. By contrast, Argentina’s Jefes
programme was designed to tackle unemployment, skills mismatches,
poverty and inequality, and Trabajar strengthened individuals’ capacities
while improving the country’s infrastructure.
Automatic stabiliser effect: North African countries have been slow in
responding to crises, which has produced periodic instability in the region.
Moreover, their reliance on subsidies and wage increases has meant that
measures are not temporary, but instead a ‘permanent’ burden on public
spending. By contrast, the Jefes programme was rolled out quickly and
then gradually scaled down once the crisis had passed. Argentina’s
experience demonstrates that, once in place, good social programmes
can act as automatic stabilisers, enabling governments to take immediate
action when crisis strikes (Rofman and Ringold, 2008).
Social empowerment: North African countries’ subsidy systems and
cash transfer schemes render beneficiaries dependent on social services,
increasing their vulnerability to future cuts in such provision. By contrast,
a programme like Jefes empowers individuals by providing them with
employment and training opportunities, as well as control over their
income, outputs and assets (Tcherneva, 2012).
Social stabilisation: North African governments’ crisis responses have
tended to reinforce the propensities for social unrest by contributing to
wider income inequalities between poor and non-poor groups. By contrast,
Argentina’s Jefes programme reduced social exclusion and marginalisation
– a chief cause of social unrest – by providing income support to poor
households, boosting participants’ confidence, promoting community
engagement, and increasing labour force participation and formal sector
employment among its beneficiary pool.
Associated measures: Argentina’s high growth rates since 2003 are
partly attributable to the country’s structural advantages – namely, its rich
natural resources and highly literate population. While North African
countries also possess lucrative natural resources (for example, oil/gas
and phosphates), their literacy rates are lower than Argentina’s. Hence,
to capitalise on their full growth potential, they should invest in reforms
to raise their standard of education. Additionally, the success of a
programme like Jefes, which provides opportunities to build and apply
human capital, is threatened if there are barriers to formal sector job
creation. North African governments should therefore consider aiding
formal sector employment generation in two ways: first, by supporting
private sector – in particular, SME – development; and second, by creating
a more conducive climate for business investment and growth.
4.2 Supporting SMEs as a route to crisis-resilientgrowth: Taiwan during the Asian financial crisis
The Taiwanese government’s comprehensive support of SMEs aided
the country’s rapid growth from 1950-2000, as well as its remarkable
resilience during the East Asian financial crisis (Harvie and Lee, 2002:
17). Taiwan’s economy grew at an average annual rate of 8.1%
between 1950 and 2000. In those 50 years, Taiwan was transformed
from an agrarian, low wage society to a global manufacturer of products
ranging from computer motherboards to bicycles, with its people
enjoying a high standard of living. While many countries went into
recession during the Asian financial crisis, Taiwan’s growth slowed

A f r i c a n D e v e l o p m e n t B a n k
33
E c o n o m i c B r i e f
2 0 1 4 • w w w . a f d b . o r g
AfDB
only marginally, from 6.8% in 1997 to 4.8% in 1998, before regaining
momentum at 5.3% in 1999 and 6.7% in 2000 (Ngui, 2002: 280). Its
SME sector played a large role in the country’s crisis resilience. SMEs
constitute around 98% of all businesses and over 75% of all private
sector jobs in Taiwan (Tzeng, 2009). The durability of Taiwan’s SMEs
is demonstrated by their longevity: over 60% have been operating for
more than 5 years, and over 40% have been in business for more than
ten years (Lai, 2010: 1; Hsu, 2008: 3). Their average size has also
grown over time: in 1954, 91% of Taiwanese SMEs had fewer than
10 employees; but by 1996, only 70% did (Wu and Huang, 2003: 11).
Taiwan’s approach to SMEs could provide a good policy model for
North African countries.
Case relevance
Taiwanese SMEs in the 1950s experienced many of the same obstacles
that North African SMEs face today. First, access to finance via the formal
financial system was a problem, given lack of collateral. Therefore most
SMEs were forced to resort to the underground credit market, where
interest rates were more than double the bank rates (Wu and Huang,
2003: 8). To survive, many SMEs relied on low-paid or unpaid labour,
which negatively affected the adaptive capacities of those workers and
their families. Second, government policy favoured large firms and actively
promoted the growth of capital-intensive basic industries, which
dominated the domestic market71. This put SMEs at a competitive
disadvantage, restricting their growth as well as their potential contribution
to GDP. Up to 1980, the Taiwanese government’s support for SMEs
took the form of provisional guidance on a very limited scale. However,
in 1981, the government decided to provide more targeted support to
SMEs as a means of promoting private sector growth and development.
Key features of Taiwan’s SME policies
In 1981 the government established the Small and Medium Enterprise
Administration (SMEA) to provide dedicated support to SMEs. Its initial
role was to assist SMEs in improving their operational environment and
access to funding and to advise them on automation, production
technology and personnel training. In 1997 SMEA gained constitutional
recognition, and its remit was extended. SMEA currently assists SMEs
in eleven key areas: finance, management, production technology,
research and development, information management, industrial safety,
pollution control, marketing, mutual support and cooperation, quality
enhancement, and business start-up and incubation (Hsu, 2008). Its
support for SMEs is holistic, focused on nurturing them from inception
to maturity. Moreover, SMEA directs SME development by ‘[taking] the
lead in developing long-term visions and feasible action plans to meet
the needs of SMEs’ (Hsu, 2008: 33).
Specific measures that have contributed to Taiwan’s growth and crisis
resilience include:
Financial assistance
• Over 80% of SMEA’s annual budget is earmarked for the SME Credit
Guarantee Fund (SMEG), which provides loan guarantees to SMEs
with strong business plans (Tzeng, 2009). There are small SMEG
offices across Taiwan, so that entrepreneurs in all areas can apply for
financial assistance.
• In addition, SMEA provides strategic project loans and offers courses
in finance and accounting.
Management and technology assistance
• The China Productivity Centre (CPC), the Industrial Technology
Research Institute (ITRI) and a range of other technology centres were
established to help SMEs improve their technical capabilities and
productivity. The government covers 50-70% of the costs incurred
by SMEs for management and technical consultancy services
(Lall, 2000).
• SMEs are also granted special access to factors of production – for
example, capital-intensive equipment – at over 100 colleges and
universities, as well as state-of-the-art technology through the national
research institutes (Tzeng, 2009).
Research and development (R&D) assistance
• Various technology research institutes provide R&D support to SMEs.
ITRI is the most important of these institutes and conducts R&D on
projects deemed too risky for the private sector (Lall, 2000: 19).
• SMEs are encouraged to contract research to universities: around
half of the National Science Council’s research grants is used to
provide matching funds for such contracts (Lall, 2000: 20). This
arrangement deepens the collaborative links between education and
industry.
Information technology assistance
• SMEA offers training programmes to enhance SMEs’ information
technology knowledge and efficiency in a number of areas, including:
supply chain management, online sales, knowledge management,
71 In the 1950s, Taiwan adopted a policy of import substitution. Government regulations forced large enterprises to serve the domestic market, so Taiwanese SMEs developed as export firms and became internationally competitive through cost-savings in production (Tzeng, 2009).

A f r i c a n D e v e l o p m e n t B a n k
34
AfDB E c o n o m i c B r i e f
2 0 1 4 • w w w . a f d b . o r g
e-Operation, e-Commerce, communication and networking, and
talent cultivation.
• In addition, SMEA maintains an information portal for online training
and upgrading.
Market assistance and technology transfer
• SMEA promotes innovation by surveying market needs in other
countries and encouraging SMEs to develop products to meet that
demand. SMEA also assists SMEs with international marketing and
brand management.
• SMEA maintains close contact with foreign companies with
leading-edge technologies to promote technology transfer. It also
provides incentives to foreign corporations to encourage them to
create R&D centres in Taiwan.
Mutual support and cooperation assistance
• SMEA encourages SMEs in the same or similar industries to form
‘clusters’, often in the same industrial park, so that they can exchange
knowledge, collaborate on products, share marketing and distribution
costs, and attract buyers to a single location. Export processing zones
and science-based industrial parks were a key factor in Taiwan’s
rapid economic growth between 1970 and 2000 (Wu and Huang,
2003: 5).
• SMEA also promotes the establishment of centre-satellite systems,
where a number of SMEs act as subcontractors to a large principal
factory or company. This practice has created backward linkages
and upgraded the technological and business capabilities of SMEs.
Business start-up and incubation
• SMEA established incubation centres to provide start-up firms with
office space, instruments, equipment, R&D technology, financial
assistance, management consulting and other business services,
thus reducing their costs and risks in the early stages of business
development.
• SMEA provides entrepreneurship services ranging from advice and
information, to training courses (such as business plan drafting), to
databases of successful business cases. Dedicated guidance is
available to encourage entrepreneurship by women.
Local and micro business development
• SMEA encourages the development of SMEs that utilise local
resources and characteristics by providing strategic project loans for
start-ups of local cultural industries.
• In addition, SMEA runs a micro business start-up programme for the
middle-aged unemployed, to encourage wider entrepreneurship
and upgrade older peoples’ skills and knowledge.
Award and commendation
• To encourage innovation and excellence, SMEA offers awards to
top-performing SMEs.
• Awards fall in four categories: business model/quality (National Award
for Outstanding SMEs), market share (Rising Star Award), R&D
(Industry Contribution Awards) and innovation (Taiwan SMEs Innovation
Award and Business Start-Up Award).
International representation
• To assist SMEs in coping with the challenges of globalisation, SMEA
attends international trade organisation conferences, where it
promotes SME welfare and cooperation.
• SMEA also promotes SME welfare through bilateral cooperation
mechanisms.
Crisis mitigation assistance
• During the Asian financial crisis, the government implemented specific
policies to protect SMEs. These measures are credited with helping
Taiwanese SMEs to remain resilient during the crisis.
• Risk avoidance tools were used to analyse previous crises, and SMEs
were given advice on strategies for reducing the impacts of the
crisis. In addition, legislation was passed to allow government agencies
to assist SMEs in tendering for public sector contracts (Ngui,
2002:285).
Applicability to North African countries
North African governments’ failure to better support small businesses
was a main cause of the Arab Spring crisis, so Taiwan’s approach to
SMEs could provide a good policy model. However, several factors
need to be taken into account before Taiwan’s SME strategy can be
applied in North Africa.
Domestic development versus export-led growth: SMEs in Taiwan
developed as export firms, because large firms dominated the domestic
market72. By contrast, large firms in North Africa tend to be export-
oriented, so countries should support SMEs as a route to domestic
development. Doing so would enable countries to both reduce their
export dependence and broaden the sectors contributing to economic
72 Taiwan’s relatively poorer performance during the current global financial crisis has been attributed to its SMEs having lost their natural niche (Tzeng, 2009). SMEs in Taiwan haddeveloped as export firms at a time when government regulations forced large enterprises to serve the domestic markets. So when government restrictions were relaxed and largefirms could compete in the international arena, SMEs were crowded out and their role reduced to subcontractors of parts and materials to the large enterprises. During the currentcrisis, large firms have passed on their risk to SMEs, by eliminating SME-provided services rather than laying off their own staff.

A f r i c a n D e v e l o p m e n t B a n k
35
E c o n o m i c B r i e f
2 0 1 4 • w w w . a f d b . o r g
AfDB
growth, thereby promoting greater crisis resilience. The policies outlined
above for Taiwan would need to be adapted to fit this new requirement.
In addition, North African governments would need to (1) gather
information about the needs of domestic consumers and (2) find ways
of stimulating domestic demand.
Costs and benefits: The costs of such a comprehensive programme of
support are very high: SMEA’s annual budget is NT$8 billion, or around
US$250 million (Tzeng, 2009). However, the benefits are also significant
and could contribute to structural change in North African countries for
a number of reasons. First, substantial government assistance to SMEs
would likely lead to a growth in formalisation, since the benefits to be
gained from such assistance would outweigh the costs of tax and labour
charges. In Taiwan, the informal sector shrank from 51% in 1967, to 31%
in 1981, and to 25% in 1996 (Amin, 2002: 20). Second, successful SME
support would increase the pace and breadth of economic growth,
particularly if start-ups were promoted in underrepresented sectors. Finally,
programmes to encourage innovation and entrepreneurship could foster
the development of higher value-added industries, while simultaneously
reducing educated unemployment. It should be noted that the costs of
some measures are negligible, yet hold the potential for high impact: for
example, encouraging mutually beneficial partnerships between universities
and businesses could promote the growth of high productivity sectors,
on the one hand, and enable a smoother education to employment
transition, on the other.
Associated measures: Contributing to the success of Taiwan’s SME
interventions were the associated measures that the government put
in place to create a more favourable business environment. First, in
the early 1950s, the Taiwanese government passed several laws to
promote FDI, by removing constraints on the scope of foreign
investment and permitting the repatriation of capital and profits (Wu
and Huang, 2003: 7-8). This shift in policy provided local SMEs with
greater access to credit and enabled the transfer of advanced
production technologies to Taiwan. Second, the government lowered
the barriers to entry for starting a business, simplified the bureaucratic
procedures, and usefully applied tax exemptions and credits to
encourage private sector growth and investment. North African
countries seeking to emulate the success of Taiwan’s SME policies
should consider implementing similar reforms.
4.3 Improving the investment climate and crisis-resilience: Estonia’s post-transition economic reforms
Radical reforms following its transition to democracy in mid-1991 have
enabled Estonia to achieve sustained high growth and good crisis
resilience. The ‘Baltic Tiger’ economy expanded at an average annual
rate of 5% between 1995 and 2000, accelerating to 8.2% between
2001 and 2007 (Erixon, 2010: 12; OECD 2010: 172). Estonia’s swift
transformation from a closed centrally planned economy to an open
market economy has allowed the country to develop new growth areas,
most notably a dynamic IT sector, earning the country the moniker
‘E-stonia’. It has also enabled Estonia to ‘catch up’ with Western Europe:
in 1996 Estonian GDP per capita was 35% of the European average;
in 2007 it was 65% (Laar, 2007: 10). Estonia’s monetary policy, fiscal
discipline, business-friendly environment and flexible labour market have
also played a role in Estonia’s resilience during the 1998-99 Russian
ruble crisis and the current global financial crisis. Although Estonia
entered a shallow recession in 1999 and a deep recession in 2008 and
2009 as a result of contagion from the crises, in both cases the country
staged a strong recovery, with real GDP growth quickly resuming at
pre-crisis levels. Estonia looks set to remain resilient in the face of the
impending eurozone debt crisis: it is running a budget surplus, its national
debt is a mere 6% of GDP and its exposure to the most-troubled
eurozone countries is low (Ames, 2012). The key to Estonia’s impressive
performance has been the clear vision and determined actions of its
political leaders, who have pushed through reforms that were sometimes
painful, yet managed to retain high levels of popular support. Estonia’s
economic reforms could therefore provide a useful policy ‘blueprint’ for
North Africa.
Case relevance
Like North African transition countries today, Estonia in 1992 had recently
emerged as a democracy, and its people looked to their newly elected
leaders to navigate the country to growth and prosperity. However, the
Estonian economy was in poor shape following the breakdown of the
Soviet Union (Erixon, 2010: 9-11). Industrial production fell sharply,
sparking a macroeconomic crisis in 1992, as GDP plummeted 21%
following two years of heavy decline. High inflation in 1991 turned to
hyperinflation in 1992, as price liberalisation in Russia – Estonia’s main
trading partner – meant that Russian exports of energy and raw materials
to Estonia were charged at world market prices, rather than subsidised
rates. Fuel prices in Estonia rose by more than 10,000%, while overall
price inflation increased 1,076% (Laar, 2007: 2). At the same time, real
wages fell 45%. The impact of rapidly rising prices on Estonian
households was severe, and government subsidies to cushion the shock
strained public finances. Currency shortages in the ruble zone added
to inflationary pressures, while production subsidies to Estonia’s inefficient
state-owned enterprises further stretched government resources.
Estonia’s private sector was small and contributed very little to GDP;
so the only ‘institution’ that functioned efficiently in the country was its
thriving informal market. Estonia’s economic system needed to be
entirely reformed; but radical changes carried the threat of social

A f r i c a n D e v e l o p m e n t B a n k
36
AfDB E c o n o m i c B r i e f
2 0 1 4 • w w w . a f d b . o r g
instability, which could further damage the economy and lead to state
failure.
Key features of Estonia’s reforms
Nevertheless, Estonia’s new leaders were determined to seize the
‘narrow window of opportunity’ provided by transition to push through
radical reforms. As Mart Laar, Estonia’s Prime Minister from 1992 to
1994 and from 1999 to 2002, put it: ‘[A] radical economic program
launched as quickly as possible after the breakthrough has a much
greater chance of being accepted than either a delayed radical program
or a non-radical alternative that introduces difficult measures gradually...
Transition countries that do not take advantage of the period of
“extraordinary politics” to launch a radical economic programme still
face the challenge of making the transition to a market economy, but
under more difficult economic conditions. The countries that miss this
opportunity risk macroeconomic instability, excessive and chaotic state
regulation, and massive corruption.’ (Laar, 2007: 2-3).
The first step was to develop a cohesive and comprehensive reform
package as quickly as possible. Since time was of the essence, the
government enlisted the help of several international and domestic think
tanks, including The Heritage Foundation, the Adam Smith Institute and
Timbro. Their input allowed for a package of well-designed policies to
be formulated and implemented almost immediately. As Laar later
commented: ‘Without these think tanks, the fast and effective buildup
of a government action plan would probably not have been possible’
(Laar, 2007: 4). The country’s reform agenda was based around a few
guiding principles: simplicity, openness, equality and transparency.
The second step was to build a democratic consensus around the
package (Laar, 2007: 4-7). To gain political backing, the government
assembled an inter-party coalition with a ‘firm and stable’ majority in
parliament73. Every member of the coalition signed an agreement
pledging to support the passage of the reforms into law. To garner
popular support, government ministers presented their reform agenda
at public events and took part in frank discussions about the rationale
for and potential consequences of proposed policies. According to Laar
(2007: 5): ‘[W]e were honest with our partners and the public… We said
that the first years of reform would be extremely difficult.’ Finally, the
government engaged in social dialogue, holding trilateral meetings with
the newly liberalised trade unions and employers to negotiate aspects
of the reform package (for example, privatisation). These three strands
of government outreach ensured that, while there was some opposition
to specific policies, social unrest was not an issue even during the most
painful stages of the reform process.
The main features of Estonia’s economic reforms were:
Monetary reform
In June 1992, Estonia left the ruble zone and introduced its own currency.
The government pegged the Estonian kroon to the Deutsche mark using
a currency board arrangement, for several reasons (Erixon, 2010: 15-
24). First, the arrangement was simple: the peg was fixed and supported
by foreign reserves of 100%, so Estonia’s new and inexperienced central
bank officials could easily operate the system. Second, the arrangement
imposed a monetary restraint: since authorities could not print money
without increasing the underlying level of reserves, their potential to
dilute the kroon and create inflation was reduced. Third, the Deutsche
mark was a strong and stable anchor that lent credibility to the Estonian
economy. It also ensured the kroon’s full convertibility, which opened
up Estonia to foreign trade and investment. Monetary reform paid off,
and by 1998, inflation had been reduced to single-digit levels, where it
has remained, apart from one year during the global financial crisis
(World Development Indicators). Monetary reform also enabled Estonia
to avoid the worst effects of the Russian ruble crisis.
Fiscal discipline
Estonia’s fiscal policy is constrained by its monetary policy. Because
public spending cannot be met simply by printing new money,
government programmes must be funded by revenues or borrowing.
In 1992, borrowing was not a viable option given the sorry state of
the Estonian economy, and raising taxes was also difficult given the
country’s high poverty levels. So the Estonian government was forced
to cut costs, which it did by abolishing virtually all subsidies and price
supports74. In 1993, the government passed a law stating that only
a balanced budget could be presented to parliament (Laar, 2007: 4).
While this ‘fiscal rule’ has not always been strictly followed, Estonia
has maintained budget surpluses every year since 1994, apart from
seven: from 1995 to 1996 during the reform period, from 1998 to
2000 during the Russian ruble crisis, and from 2008 to 2009 during
the global financial crisis (Raudla, 2009: 274; Erixon, 2010: 26).
Savings from budget surpluses have often been used to strengthen
fiscal capacity, by paying off government debt or topping up the
Stabilisation Reserve Fund, which Estonia established in 1997.
Estonia’s fiscal conservatism has played a role in the country’s quick
73 The Pro Patria government had a majority of just one vote (Laar, 2007: 4).74 There was considerable opposition to the abolition of subsidies on commodities, but the government’s command of a majority in parliament enabled the measure to be passed nonetheless.

A f r i c a n D e v e l o p m e n t B a n k
37
E c o n o m i c B r i e f
2 0 1 4 • w w w . a f d b . o r g
AfDB
recovery during the current global financial crisis. Instead of taking
out loans, the government adopted a position of extreme austerity –
a decision that was endorsed by the Estonian people, who later re-
elected their leaders (Bromund and Bourne, 2012)75.
Trade liberalisation
Until 1992, Estonia relied on Russia for 90% of its trade, including the
raw materials for its industries. Supply shortages were endemic, and
the situation became worse following the collapse of the Soviet Union.
There was an urgent need to resuscitate the Estonian economy, so in
1992 the government took the bold step of unilaterally abolishing nearly
all tariff and non-tariff barriers and restrictions, transforming Estonia into
a free-trade zone (Laar, 2007: 6). In 1993 Estonia had the lowest average
weighted tariff rate in the former Soviet bloc – just 1.4% – and by 1997
this rate had been reduced to 0% (Erixon, 2010: 35). Estonia’s trade
sector grew 56% between 1991 and 1994, and its trade focus shifted
to Western Europe. The initial impetus for trade liberalisation in Estonia
had been to gain access to key commodities, especially equipment and
technical goods for production76. However, after 1994, the country’s
trade policy shifted to securing markets for its growing export sector.
Toward this end, Estonia entered into a number of bilateral, regional
and multilateral trade agreements, culminating in membership of the
World Trade Organisation in 1999 and accession to the EU in 2004. EU
membership effectively ended Estonia’s free trade era by imposing over
10,000 new tariffs on the country (Erixon, 2010: 38).
Privatisation and FDI promotion
In 1992, the Estonian economy was dominated by large, inefficient
state-owned enterprises that frequently required government bailouts
and production subsidies (Erixon, 2010: 40). The country’s private sector
was small, partly because it was crowded out by state-owned firms
and partly because there was little domestic capital or market knowledge
to fuel entrepreneurship and innovation. Estonia’s privatisation
programme was launched both to end the expensive system of
production subsidies and to stimulate competition by attracting foreign
capital and expertise to the country. Estonia’s 1991 Law on Foreign
Investments entitled foreign investors to compete for privatised assets
on an equal basis with domestic buyers77. The law allowed foreigners
to purchase and fully own companies, buildings and land in Estonia, as
well as to repatriate profits and capital without restriction. Between 1992
and 2000, virtually all of Estonia’s state-owned enterprises were
privatised78. Foreign buyers accounted for a large share of the purchases,
and FDI stock to GDP in Estonia increased from 21% in 1995 to 60%
in 2000 (Lumiste et al, 2008: 12). Estonia continued to attract FDI after
2000, and wholly or partly foreign-owned companies now account for
one-third of Estonia’s GDP and over half of its exports (Price and
Wörgötter, 2011: 11). Foreign investors have played a major role in
modernising the Estonian economy and making it more competitive.
Whereas in 1991 Estonia had 10,000 small enterprises engaged in low-
scale production and representing less than 10% of GDP, by 1997 it
had more than 61,000 companies producing a wide range of goods
and services and contributing 70% to GDP (Erixon, 2010: 45).
Business-friendly environment
Estonia maintains a favourable business climate. Its costs and
procedures for starting and running a business are lower than in most
OECD high-income countries, and its bureaucratic procedures are
streamlined and transparent (World Bank, 2013a: 16). Estonia’s
judiciary is independent and strictly enforces private property and
intellectual property rights – creating a safe environment for business
investment (UNCTAD, 2011: 20-21). While Estonia offers no special
incentives to foreign investors, who have exactly the same rights and
obligations as domestic investors, it maintains four free zones where
companies can enjoy duty-free status for imports and re-exports. Its
minimum wage is set at a fairly low rate, and Estonia has the lowest
labour tax wedge among the newer EU countries (Liebfritz, 2011:
24-25). Since 2004, Estonia has put in place measures to tackle
bribery and corruption – internally through its ‘Honest State’
programme and externally through its adherence to the OECD
Anti-Bribery Convention79. Estonia’s business-friendly environment
has been recognised in international rankings: Estonia is ranked 21st
out of 185 countries in the World Bank’s Doing Business 2013 report
and 34th out of 144 countries in the World Economic Forum’s 2012-
13 Global Competitiveness Index. Estonia also ranks 32nd out of 174
countries in Transparency International’s Corruption Perceptions
Index – rendering it the ‘cleanest’ among former Soviet countries.
Political and social stability also make Estonia an attractive venue for
investment.
Flat-rate tax regime
The crowning feature of Estonia’s business environment is its tax system.
In January 1994, Estonia became the first country in Europe to introduce
75 To maintain public trust while reducing spending during the crisis, government ministers cut their own salaries by 20% and civil servants’ salaries only 10% (Ames, 2012).76 Trade reform was also driven by the need for a pared-down system: because Estonia’s new government was inexperienced in applying trade policy, protectionism could lead tostate capture (Erixon, 2010: 36).77 Domestic buyers competing for privatised assets had one advantage over foreign buyers: they could pay by instalment over ten years. This concession encouraged foreign-domestic partnerships (Lumiste et al, 2008: 11).78 Only a few enterprises remain under government ownership: the country’s main port, power plants, postal system and national lottery (UNCTAD, 2011: 17). 79 However, instances of favouritism and corruption are still ’not uncommon’ (UNCTAD, 2011: 20).

A f r i c a n D e v e l o p m e n t B a n k
38
AfDB E c o n o m i c B r i e f
2 0 1 4 • w w w . a f d b . o r g
a flat tax rate (currently 21%), replacing three separate rates on both
personal and corporate income. The same rate applies to businesses
and individuals, and the only difference between the two groups is that
retained profits are exempt from corporate tax – a measure that
encourages local investment and capital accumulation. Estonia’s tax
system circumvents complex calculations, closes loopholes and reduces
the time it takes to file a return. As a result, it has increased tax
compliance: unreported employment in Estonia fell from 20% of GDP
in 1998, to 10% in 2002, to 7% in 2004 (Liebfritz, 2011: 23). It has also
reduced informality: Estonia has the smallest informal economy among
the newer EU member states (Leibfritz, 2011: 4). Its tax regime has
been credited with promoting start-ups in Estonia: in 1995, newly
founded companies accounted for 50% of Estonia’s GDP (Erixon, 2010:
47). Estonia’s experience of the flat tax has been so successful that the
system has been introduced in other Eastern European countries,
beginning with Lithuania and Latvia in 1994-1995, and later extending
to Russia, Slovakia, Ukraine, Georgia and Romania.
Applicability to North African countries
Estonia’s post-transition experience offers a few hopeful lessons for
North Africa’s transition countries: (1) that it is possible to achieve
sustained high growth rates within a few years of transition; (2) that a
positive business environment combined with macroeconomic
discipline80 can strengthen crisis resilience through building adaptive
capacity at national and market levels; and (3) that extensive reforms
can be undertaken – and expensive, inefficient subsidies abolished –
without seriously undermining social stability, so long as policies are
supported by a democratic majority. In other words, inclusiveness is
at the heart of legitimacy: government programmes must benefit a
broad base of people; otherwise majority support is unlikely.
However, North African countries should consider implementing several
associated measures to ensure the success of a programme based on
Estonia’s reform package:
Educational reforms: One of Estonia’s key draws in terms of attracting
FDI is the country’s well-educated and highly skilled labour force.
Estonians exceed the OECD average for secondary school completion
and for reading literacy, math and science81. By contrast, North African
countries suffer from skills mismatch issues, so would need to invest
in programmes to raise their quality of education if they are to benefit
from FDI inflows to the extent that Estonia has.
Targeted social programmes: Estonia’s economic reforms have
improved conditions at macro and market levels, but vulnerabilities still
persist at household level. Unemployment in Estonia fell from 14% in
2000 to 5% in 2007, but then shot up to 19% during the global financial
crisis and remains high at around 13% (OECD, 2012). Moreover, its
youth unemployment levels are nearly double the overall rate, and Estonia
suffers from high levels of long-term unemployment. Poverty and
inequality are also issues for Estonia: a considerable wealth gap exists
between the top 20% and bottom 20% of its population, and absolute
poverty levels in the country reached 12% during the recent crisis.
Therefore, a targeted social programme addressing both poverty and
unemployment, such as Argentina’s Plan Jefes/Trabajar, would be a
desirable complement to Estonia’s economic reforms – both for Estonia
and for any North African countries replicating its policies82.
Diversification of trade/financial partners: Estonia’s reform model
places too much emphasis on foreign trade and capital as engines of
growth, which renders the country vulnerable to trade and capital shocks.
While Estonia’s tax exemption on retained profits acts as a partial brake
on outflows of FDI, the country is nevertheless susceptible to boom-
and-bust cycles. Estonia’s deep recession during the global financial
crisis was caused by the bursting of its real estate bubble – which had
been fuelled by foreign investment – followed by large outflows of FDI.
Similarly, Estonia’s vulnerability to the eurozone debt crisis stems from
its heavy dependence on European countries for trade and capital flows.
Hence, Estonia – and any North African country basing its policies on
Estonia’s reform model – would be well advised to diversify its trade
and financial partners as a form of risk mitigation.
4.4 Relevance and lessons for North Africa
The best-practice examples highlight a few broad trends that link to
earlier findings regarding crisis resilience. First, crises demand rapid
and decisive action: policy measures should be implemented in a
timely fashion before the crisis has produced detrimental long-term
effects. The examples included in this section show how different
countries have responded to the need for immediate action – by
commissioning policy assistance from think tanks (Estonia), by utilising
existing networks between government and market institutions to
disseminate crisis avoidance advice (Taiwan), and by having effective
social programmes in place that can be quickly adapted and expanded
in times of crisis (Argentina). Second, crisis measures should be tightly
targeted to vulnerable groups and sectors, rather than universally
80 Including low debt – which is the main difference between Argentina in the 1990s and Estonia today.81 As measured by student performance in the 2009 Programme for International Student Assessments (PISA website - see http://www.oecd.org/pisa/46643496.pdf).82 A programme based on Jefes/Trabajar would be appropriate for Estonia, since unemployment mainly affects young people with less than secondary education (Unt, 2012: 3).

A f r i c a n D e v e l o p m e n t B a n k
39
E c o n o m i c B r i e f
2 0 1 4 • w w w . a f d b . o r g
AfDB
available. Targeted programmes tend to be more affordable than
universal programmes and – as the Argentine example illustrates –
can be designed so that a large pool of participants receives multiple
benefits at a fairly low cost. Moreover, programmes aimed at vulnerable
groups and sectors can reduce social exclusion and marginalisation,
thereby lessening social tensions and the propensities for violent
unrest. The example from Argentina demonstrates that good social
programmes can build community spirit and individual confidence, in
addition to providing income support, while the example from Estonia
shows that including groups in the government decision-making
process can increase political legitimacy and group compliance to even
traditionally unpopular measures. Third, crisis policies should empower
groups and build their long-term adaptive capacity, so that at some
point they no longer require government support. The best practice
examples illustrate how countries have achieved this requirement: in
Argentina poor households were provided with jobs and training, rather
than unconditional cash transfers, and in Taiwan the government
strengthened SMEs by giving them practical assistance and
encouraging the formation of clusters for mutual support, instead
of subsidising their operations. Empowering groups to function
independently means that programmes can be scaled down once the
crisis has passed – thus freeing up state resources for other uses. In
this way, fiscal capacity is also enhanced, putting the country in a better
position to face future shocks.

A f r i c a n D e v e l o p m e n t B a n k
40
AfDB E c o n o m i c B r i e f
2 0 1 4 • w w w . a f d b . o r g
5.1 Main conclusions
Over the past decade North African countries have been hit by
three crises and are threatened by a fourth. The world food crisis
intersected with the global economic boom from 2003 to 2008 and
produced mixed growth performances in the region. While every
country benefited from the boom – both because world trade
expanded rapidly and because the countries had opened their
borders to international trade and capital flows – the region’s net oil
exporters enjoyed accelerated growth as a result of rising crude
prices, while the net oil importers’ gains were offset by the growing
costs of food and fuel imports. Nonetheless, through prudent
macroeconomic management, all the countries were able to use the
momentum of the boom to build fiscal capacity, which enabled them
to remain resilient at macroeconomic level during the global financial
crisis, which began in 2008. However, at microeconomic level, the
countries were not so resilient: the rewards of the boom were not
broadly distributed across sectors or groups, leading to widening
inequalities between large and small firms and between non-poor and
poor individuals. Social tensions arising from these dynamics were
the prime cause of the Arab Spring riots and revolutions that
displaced some governments in the region in 2011. The Arab Spring
caused more damage to countries’ growth trajectories and fiscal
capacities than the world food crisis and global financial crisis
combined. As a result, the countries are now more sensitive to
external shocks, so the brewing eurozone debt crisis poses a virulent
and direct threat to the region’s recovery and future growth.
The Arab Spring was an internally generated crisis, the result of two
interwoven processes relating to the patterns of growth and crisis
resilience in the region:
• While North African countries enjoyed stable high growth between
2003 and 2010, notwithstanding the two crises that hit the region
during that period, their expansion rates were not rapid enough to
contribute to a substantial reduction in unemployment or poverty.
Instead, unemployment and poverty levels increased, since
the countries’ regulatory and legal frameworks deterred formal
private sector growth and their ill-suited education systems
blocked youth transitions to the labour market. A lack of decent
job opportunities, particularly for educated youth, and an increase
in working poverty and unemployment as a result of growth-
inhibiting government policies fuelled social frustrations across
the region.
• While North African governments took steps to strengthen crisis
resilience by building fiscal capacity at macroeconomic level, they
failed to protect small businesses and poor households from the
impacts of successive crises. Over time, this weakened the
groups’ capabilities to independently cope during crises and
rendered them highly sensitive to external shocks. So when food
prices rose sharply in late 2010 – reaching their highest levels in
30 years – at the same time that the international capital flows
and remittances on which these groups depended slowed, the
consequences were severe and the groups turned on their
governments for having neglected their welfare.
The overall picture is this: while North African governments implemented
policies to boost growth, they did not ensure that it was inclusive; and
while they took steps to increase crisis resilience, they did not protect the
groups most in need of intervention. As a result, instead of promoting
crisis-resilient growth, they have produced growth-inhibiting crises.
North African government policies have not fundamentally altered in
light of the Arab Spring, so the countries continue to be exposed to
internal instabilities that can affect their future development patterns.
This state of affairs threatens not only the transition net oil importing
countries, which are weakest both in terms of finances and political
stability, but also the other countries in the region. The net oil exporting
countries are also not immune, since their ability to fund their social
programmes is dependent on oil prices remaining at current levels or
continuing to rise.
Thus, for every country, recovery from the Arab Spring requires
radical changes in policy, as well as a rebalancing of power and
resources. Inequalities between groups need to be narrowed, trust
in government restored, and poverty and unemployment reduced if
the countries are to navigate toward a more stable, productive
pathway that is also more resilient to future global shocks.
The best-practice examples included in Section 4 give details of
programmes that countries outside of the region have introduced,
5. Conclusions, implications and recommendations

A f r i c a n D e v e l o p m e n t B a n k
41
E c o n o m i c B r i e f
2 0 1 4 • w w w . a f d b . o r g
AfDB
which has led to their increased peace, growth and crisis resilience.
Adapted to and implemented in North Africa, these programmes
could produce favourable outcomes for the region. A number of key
lessons emerge from the country examples:
• Need for timely response. Crises demand rapid and decisive
action. Policy measures need to be implemented in a timely
fashion before the crisis has produced detrimental long-term
effects. Examples from Estonia, Taiwan and Argentina highlight
the mechanisms that other countries have applied to respond to
the need for immediate action: by commissioning policy
assistance from think tanks (Estonia), by utilising existing networks
between government and market institutions (Taiwan), and by
having effective programmes in place that can be quickly adapted
and expanded in times of crisis (Argentina).
• Focus on vulnerable groups and sectors. Crisis mitigation
measures should be tightly targeted to those groups and sectors
that are most susceptible to negative crisis impacts. Policies
aimed at vulnerable groups can reduce social exclusion and
marginalisation, thus lessening propensities for social unrest.
Targeted programmes tend to be more affordable than universal
programmes, and well-designed programmes can deliver multiple
benefits to a large pool of participants at a fairly low cost. The
Argentina example demonstrates how effective programmes can
strengthen community cohesion and individual confidence, while
the Estonia example shows how including groups in government
decision-making can increase political legitimacy and compliance.
• Importance of adaptive capacity-building. Government crisis
policies should build groups’ long-term adaptive capacities, rather
than rendering them dependent on state support. In Argentina
poor households were provided with jobs and training, rather than
unconditional cash transfers, and in Taiwan SMEs were provided
with practical assistance and support, rather than subsidies.
Empowering groups to function independently means that crisis-
related programmes can be scaled down once the crisis has
passed – thus freeing up state resources for other uses.
A tailored policy package combining features from the programmes
highlighted in the best-practice examples could help North African
countries to overcome the key challenges that they face today (see
Table 24 in the appendix). An employment-intensive infrastructure
programme modelled on Argentina’s Plan Jefes could enable
countries to tackle poverty, inequality and unskilled unemployment.
The added benefit of improvements to their infrastructure would be
especially useful for North Africa’s transition countries, given the
considerable damage that they suffered during the Arab Spring.
Providing dedicated support to SMEs, incorporating some of the
features of Taiwan’s comprehensive programme, could help to reduce
informality and educated unemployment in North Africa, while
increasing private sector durability and productivity. Economic reforms
following Estonia’s example could enhance macroeconomic stability,
raise the competitiveness and dynamism of North African industries,
and boost formal private sector growth and investment. If North
African countries were also to adopt Estonia’s practice of including
a wide range of groups in political decision-making, as well as
Argentina’s model of social inclusion through community projects,
they would likely enjoy greater social and political stability. But to
realise the full benefits of these policies, North African countries should
undertake the associated measures highlighted in the best practice
examples. Programmes to upgrade their standard of education and
steps toward diversifying their trade and financial partnerships would
increase the countries’ overall growth and crisis resilience.
5.2 Implications and recommendations
Each North African country faces distinct challenges and opportunities
in future. Hence, the recommendations proposed below apply to the
region as a whole and need to be adapted to the unique circumstances
of each country. They should be viewed as general policy options that
can be used as a roadmap for promoting crisis-resilient growth in the
short- to medium-term.
The recommendations are set out according to the constituents of
crisis-resilient growth – that is, strengthening adaptive capacity,
reducing systemic vulnerability, and expanding the drivers and
distribution of growth. The categories are not mutually exclusive; for
example, SME support policies advocated under ‘reducing systemic
vulnerability’ could equally have been placed under ‘strengthening
adaptive capacity’. However, measures have been placed within the
categories most suited to their suggested application in North Africa.
Following the recommendations, I give practical suggestions for how
governments can obtain funding and support in implementing these
measures.
Strengthening adaptive capacity
• Countries should continue to exercise monetary and fiscal
restraint, but not as an unwavering goal. Prudent macroeconomic
management builds fiscal capacity, which allows governments to
run deficits, borrow funds and/or implement countercyclical
measures during crises without damaging countries’ macroeconomic
stability or debt sustainability. However, monetary and financial

A f r i c a n D e v e l o p m e n t B a n k
42
AfDB E c o n o m i c B r i e f
2 0 1 4 • w w w . a f d b . o r g
authorities should not unwaveringly pursue nominal targets.
Macroeconomic policies need to be flexible and supportive of
broader development aims and structural reforms. Moreover,
building adaptive capacity at macroeconomic level without
strengthening groups and sectors at microeconomic level can
result in nurtured vulnerabilities that can eventually produce a crisis
from within – as evidenced in Argentina in 2001 and in North Africa
in 2011.
• Social policies and programmes should be re-designed to
tightly target, strengthen and protect vulnerable households,
both during and between crises. Historically, North African
social policies and programmes have tended to benefit non-poor
groups more than poor groups and formal sector workers more
than informal sector workers. They have also eroded countries’
fiscal capacities through creating dependence. The good practice
example from Argentina provides a pro-poor alternative that is
cheaper than North African countries’ current schemes, extends
to a wider number of beneficiaries, empowers individuals and their
communities, and provides participants with a route to formal
sector employment – thus limiting their need for long-term
government support. North African countries’ social insurance
systems also need to be reconfigured, so that more households
are protected during labour market transitions.
• Formal and non-formal education systems should be
reformed, so that they deliver the skills demanded by the
labour market. A greater emphasis should be placed on job-
relevant skills to reduce the mismatches that are currently
complicating the education to employment transition in North
Africa. Apprenticeship schemes, involving private sector firms in
curriculum design and class activities, and placing greater
emphasis on problem solving and creative group work are some
ways of achieving this goal. For groups outside the formal
education system, public-private partnerships in vocational
training and in the design of active labour market programmes
can increase the success of initiatives and improve workers’
technical and core skills, which could in turn fuel innovation
(Subrahmanyam, 2011).
• State institutions need to become more inclusive and
responsive to restore trust in government and enable a full
recovery from the Arab Spring. The Arab Spring highlighted the
importance of voice and accountability mechanisms in maintaining
social stability and averting internally generated crises. Full
recovery from the Arab Spring thus entails North African
governments including a broader set of groups in public policy
processes and reacting to bottom-up pressures in a productive
manner. The best practice example from Estonia demonstrates
that political inclusiveness can increase government legitimacy
and contribute to more peaceful outcomes, since key
stakeholders as well as ordinary citizens are brought ‘on board’ as
partners in solving problems.
Reducing systemic vulnerability
• Diversification of trade and financial partners should be
undertaken to spread risk and reduce countries’ vulnerability
to shocks arising from a single country or region. North African
countries’ heavy reliance on Europe for trade and capital flows
was a main reason why the global financial crisis affected the
region and why countries are highly vulnerable to the eurozone
debt crisis. Strengthening ties with regional partners and/or other
emerging market economies can protect countries from shocks
originating in the developed world. Regional integration can
provide numerous benefits, including cost savings related to
proximity and increased bargaining power in international trade
negotiations. North Africa is currently the least economically
integrated region in the world: intra-regional trade accounts for
less than 4% of total trade (Kolster, 2012: 9). This is therefore an
area worth developing in future.
• Investments in agriculture and alternative energy sources
should take place to reduce countries’ strategic import
dependence. Over the past decade, the net oil importing
countries’ fiscal balances have been damaged by the rising costs
of food and fuel imports. Escalating food prices have also affected
the net oil exporters and explain why the Arab Spring spread
across North Africa. Programmes focused on domestic agricultural
production and alternative energy sources could insulate countries
from vacillations in world food and fuel prices and contribute to
their long-term food and energy security, especially if countries
were to also adopt measures to tackle climate change, water
scarcity and fuel depletion issues. Agricultural investment could
also benefit small farmers and their families, who form a large
share of North Africa’s vulnerable and food-insecure populations
(IFPRI, 2012: 3).
• Countries should support local SME development to reduce
their exposure to external shocks. A central platform of any
domestic development strategy should be supporting SMEs,
especially those catering to the local market. SMEs can reduce an
economy’s exposure to external shocks by strengthening sectors
that are less exposed to fluctuations in international capital flows,

A f r i c a n D e v e l o p m e n t B a n k
43
E c o n o m i c B r i e f
2 0 1 4 • w w w . a f d b . o r g
AfDB
as well as commodity and foreign currency markets (Griffith-Jones
et al, 2011: 7). Comprehensive support for SMEs – that is,
providing smaller businesses with access to capital and other
factors of production, as well as technical, research and market
assistance – can not only aid the development of innovative
products and sectors, but can also induce informal sector firms to
join the formal sector. The best practice example from Taiwan
provides concrete suggestions for how governments can promote
SME growth and development.
• Crisis monitoring tools should be developed and/or strengthened
so that countries can learn from their past experiences. The
social conditions that led to the 1984 bread riots were the same
as those that caused the 2011 Arab Spring riots and revolutions
– which means that North African countries have not learned from
their past experiences. To improve countries’ future performance,
governments need to ensure that there is accurate and reliable
information regarding the causes of past crises, their transmission
channels and their impacts on specific groups and sectors. This
is not yet available: for example, lack of good-quality economic
data made it impossible for researchers to assess the employment
impact of trade shocks on Egypt during the global financial crisis
(Klau, 2010: 29). Countries should also collate information from
other regions, so that lessons can be learned without undergoing
hardships.
Expanding the drivers and distribution of growth
• Countries should continue to pursue trade liberalisation and
privatisation, but should ensure that measures are in place
to lower the risks associated with closer global integration.
Opening up their markets enabled North African countries to
attract higher quantities of trade, FDI and other capital flows
during the global economic boom. Hence, further steps are
encouraged as a means of achieving the growth levels needed to
substantially reduce poverty and unemployment. However, countries
should ensure that measures are in place to lower the risks
associated with economic and financial openness, such as capital
controls and financial sector regulations. The best practice example
from Estonia shows how countries can usefully apply tax exemptions
to deter outflows of FDI, without imposing restrictions that could
block FDI or providing preferential treatment to foreign investors
that could deter domestic investment.
• The legal and regulatory impediments to formal private
sector growth and employment need to be removed to enable
sustained rapid economic expansion. Key areas include lowering
the costs of doing business, strengthening private property rights
and contract enforcement legislation, and making labour market
regulations more flexible while still providing adequate protection
for workers. A more business-friendly environment can encourage
domestic and foreign investment and lead to higher formal sector
job creation. It can also induce informal sector firms to join the
formal sector, which could boost government revenues and result
in better conditions for workers (Ramalho, 2007). The best practice
example from Estonia shows how strong investor protections, low
barriers to entry, streamlined and transparent bureaucratic
procedures, and low business costs can foster the development
of a fast-growing and dynamic private sector.
• Governments should promote sectoral diversification for
more broad-based economic growth. The Algerian and Libyan
governments should support the development of non-energy
sectors to reduce economic concentration in oil. They should also
invest in alternate energy sources to prevent the countries from
becoming fuel import-dependent in future (Erickson von Allmen,
2010: 4). Libya’s proven oil reserves will deplete in around 40
years, while Algeria’s hydrocarbon outputs will begin to decline
after 2012 – so they need to act fast (Goodland, 2008: 152;
Mitchell et al, 2008). Governments in the net oil importing
countries should promote investment in labour-intensive
industries, such as agriculture and services, both to reduce
unemployment and because those sectors were resilient during
the global financial crisis. However, they should also support
high-productivity areas, such as manufacturing and
telecommunications.
• Policies to promote private sector productivity and
competitiveness should be adopted to encourage innovation
and enable more rapid economic growth. Policies that persuade
firms to undertake research and development, invest in staff
training and adopt new technologies can promote higher productivity
growth and innovation. Governments can also encourage higher
value-added activities and industrial competitiveness by supporting
international knowledge exchanges, technology transfer and
cluster upgrading, as well as facilitating greater cooperation
between businesses and universities or research institutes. The
best practice example from Taiwan provides suggestions for how
governments can aid private sector growth and innovation.
A final question, after surveying these vast and costly recommendations,
is how will they be funded? After all, Egypt and Tunisia are facing
grave financial difficulties. Morocco is also fiscally constrained. Libya’s
financial wellbeing is contingent on its ability to achieve internal

A f r i c a n D e v e l o p m e n t B a n k
44
AfDB E c o n o m i c B r i e f
2 0 1 4 • w w w . a f d b . o r g
stability, while Algeria’s fiscal capabilities are reliant on oil prices
remaining at a high level. Below are suggestions for how countries
can boost the level of funds and practical support at their disposal.
• Involve a wide range of local and international partners.
Involving a wide range of partners in policy formulation and
implementation can increase the financial, technical and personal
support available, thus ensuring the success of programmes. Key
partners include civil society organisations, academic institutions,
diaspora groups, multinational corporations, foreign governments
and international agencies. However, the effectiveness of multilateral
partnerships is contingent on interventions being well coordinated
and integrated. The Deauville Partnership is a post-Arab Spring
clustering that offers North Africa’s transition countries and Morocco
access to partnership funds and technical assistance for projects
relating to economic stabilisation, job creation, regional integration
and political participation.
• Explore the scope for innovative funding sources. In recent
years, countries such as Nepal, Ethiopia and Kenya have issued
‘diaspora bonds’ – that is, sovereign bonds marketed to migrant
populations – to fund infrastructure and other large development
projects (Okonjo-Iweala and Ratha, 2011). A key benefit of
diaspora investments is that they are less cyclical than other forms
of international capital, since migrants’ homeland bias and lower
perception of sovereign risk make them less likely to withdraw
funds during economic downturns. Another idea that North
Africa’s transition countries may wish to consider is the possibility
of creating new financial instruments backed by stolen assets – in
other words, ‘asset recovery backed securities’. There may be
scope to issue such instruments: after all, Libya’s National
Transitional Council was able to secure international loans
collateralised by Colonel Gaddafi’s frozen assets (Conley and
Dukkipati, 2011).
The recommendations contained in this paper call for far-reaching
changes. Some of the measures require strong political will and
commitment, while others require significant funding and support.
However, in the fallout of the Arab Spring, North African governments
may have an easier time passing difficult, but ultimately worthwhile,
measures. Indeed, a recent study has shown that political crises are
more conducive to radical structural reforms, such as labour market
deregulation and trade liberalisation, than economic crises (Campos et
al, 2010). Crises represent difficult challenges, but they also provide
opportunities for significant positive change. The Arab Spring may be
the impetus that North African governments need to make the changes
required to achieve more inclusive, broad-based and rapid growth,
which is the basis of long-term crisis resilience.

A f r i c a n D e v e l o p m e n t B a n k
45
E c o n o m i c B r i e f
2 0 1 4 • w w w . a f d b . o r g
AfDB
Abdellatif, R. (2011) ‘Egypt eases regulations to promote Nilex trading’, Daily News Egypt, November 13, 2011, 5:00 pm – available at
http://www.thedailynewsegypt.com/stock-market/egypt-eases-regulations-to-promote-nilex-trading-dp3.html (accessed 21 April 2012).
Achy, L. (2010) Trading High Unemployment for Bad Jobs: Employment Challenges in the Maghreb (Washington DC: Carnegie Endowment
for World Peace).
Achy, L. (2009a) ‘Fiscal Adjustment in Non-oil Producing MENA Countries: Painful but Healthy!’, Web Commentary, 8 October 2009
(Washington DC: Carnegie Endowment for World Peace).
Achy, L. (2009b) ‘Algeria’s Belated and Inadequate Response to the Economic Crisis’, Al Hayat, 20 August 2009.
African Development Bank, OECD, UNECA and UNDP (2013) African Economic Outlook 2013: Structural Transformation and Natural
Resources (Tunis: African Development Bank).
African Development Bank (2011) ‘Capacity Challenges in Post-Global Financial Crisis Era in Africa’, Africa Capacity Development Brief,
vol. 2, issue 4 (December).
African Development Bank, OECD, UNECA and UNDP (2011a) African Economic Outlook 2011: Africa and its Emerging Partners – Algeria
Full Country Note (Tunis: African Development Bank).
African Development Bank, OECD, UNECA and UNDP (2011b) African Economic Outlook 2011: Africa and its Emerging Partners – Egypt Full
Country Note (Tunis: African Development Bank).
African Development Bank, OECD, UNECA and UNDP (2011c) African Economic Outlook 2011: Africa and its Emerging Partners – Libya Full
Country Note (Tunis: African Development Bank).
African Development Bank, OECD, UNECA and UNDP (2011d) African Economic Outlook 2011: Africa and its Emerging Partners – Morocco
Full Country Note (Tunis: African Development Bank).
African Development Bank, OECD, UNECA and UNDP (2010a) African Economic Outlook 2010 – Egypt Full Country Note (Tunis: African
Development Bank).
African Development Bank, OECD, UNECA and UNDP (2010b) African Economic Outlook 2010 – Tunisia Full Country Note (Tunis: African
Development Bank).
Africa Partnership Forum (2012) ‘Session IV: Asset Recovery’, 19th Meeting of the Africa Partnership Forum, 3 December 2012, Cotonou Benin
– Document APF/COTONOU-2012/7.
Aita, S. (2008) Employment and Labour Law in the Arab Mediterranean Countries and the Euro-Mediterranean Partnership (Madrid: Fundación
Paz y Solidaridad Serafín Aliaga de Comisiones Obreras).
6. Further reading

A f r i c a n D e v e l o p m e n t B a n k
46
AfDB E c o n o m i c B r i e f
2 0 1 4 • w w w . a f d b . o r g
Albers, R. and Peeters, M. (2011) ‘Food and energy prices, government subsidies and fiscal balances in south Mediterranean countries’,
European Commission Economic Papers, no. 437 (February).
Ali, S. (2009) ‘Minimum wage increase leaves Moroccan workers unsatisfied’, Magharebia, 8 July 2009 – available on www.magharebia.com.
Allen, F., Otchere, I. and Senbet, L.W. (2011) African financial systems: A review. Review of Development Finance, vol. 1, no. 2, pp. 79-113.
Al-Shawarby, S. and El-Laithy, H. (2010) Egypt’s Food Subsidies: Benefit Incidence and Leakages (Washington DC: World Bank).
Amereller (2013) Doing business in Libya - Opportunities and challenges of the transition (Tripoli: Amereller Associates).
Ames, P. (2012) ‘Yes, they use the euro. And the economy is booming’, The Global Post, 5 June 2012 5:15am.
Amin, A.T.M.N. (2002) ‘The informal sector in Asia from the decent work perspective’, ILO Working Paper on the Informal Economy, no. 2002/4
(Geneva: ILO).
Ancharaz, V. (2011) ‘The impact of the US credit rating downgrade and European debt crisis on Africa’, AfDB Brief (Tunis: African Development Bank).
Angel-Urdinola, D.F. and Kuddo, A. (2010) ‘Key Characteristics of Employment Regulation in the Middle East and North Africa’, World Bank
SP Discussion Paper, no. 1006, July 2010.
Angel-Urdinola, D.F. and Semlali, A. (2010) Labor Markets and School-to-Work Transition in Egypt: Diagnostics, Constraints, and Policy
Framework (Washington DC: World Bank).
Atkins, R., Carnegy, H. and Peel, Q. (2012) ‘Draghi calls for Europe “growth compact”’, Financial Times, April 25, 2012 6:55 pm – available
at http://www.ft.com/cms/s/0/fc894164-8ead-11e1-ac13-00144feab49a.html#axzz1uyKJYyIv.
BBC News (2011) ‘Eurozone debt web: Who owes what to whom?’, BBC News Business, 18 November 2011 09:20 – available at
http://www.bbc.co.uk/news/business-15748696 (accessed 10 April 2012).
Berazneva, J. and Lee, D.R. (2011) ‘Explaining the African Food Riots of 2007-2008: An Empirical Analysis’, Paper presented at the Centre
for the Study of African Economies’ Annual Conference 2011: ‘Economic Development in Africa’, 20-22 March, St Catherine's College, Oxford
University.
Bordo, M., Eichengreen, B., Klingebiel, D. and Martinez-Peria, M.S. (2001) ‘Is the Crisis Problem Growing More Severe?’, Economic Policy,
vol. 16, no. 32, pp. 53-82.
Borrell, B. and Grushkin, D. (2010) ‘Morocco Plans 800 Acre Resort Hotel Funded by Fertilizer Cash’, Bloomberg News, Nov 5, 2010 3:15
PM GMT – available at http://www.bloomberg.com/news/2010-11-05/morocco-plans-800-acre-resort-hotel-funded-by-fertilizer-cash.html
(accessed 30 April 2012).
Briguglio, L., Cordina, G., Farrauglia, N. and Vella, S. (2009) ‘Economic Vulnerability and Resilience: Concepts and Measurement’, Oxford
Development Studies, vol. 37, no. 3, pp. 229-247.
Briguglio, L. and Galea, W. (2003) ‘Updating the Economic Vulnerability Index’, Occasional Chapters on Islands and Small States (Malta:
Islands and Small States Institute of the University of Malta).

A f r i c a n D e v e l o p m e n t B a n k
47
E c o n o m i c B r i e f
2 0 1 4 • w w w . a f d b . o r g
AfDB
Brixiova, Z., Kamara, A. and Ndikumana, L. (2010) ‘Containing the Impact of the Global Crisis and Paving the Way to Strong Recovery in Africa’,
African Development Bank Policy Brief on the Financial Crisis, no. 2, February 2010.
Bromund, T. and Bourne, R. (2012) ‘As Spain and Greece Burn, Estonia Offers a Lesson’, The Foundry, 28 Spetember 2012 5:16pm.
Bullion, A. (2011) ‘Are social scientists correct in predicting further food riots?’, Brussels Blog at http://brusselsblog.agra-net.com/2011/are-
social-scientists-correct-in-predicting-further-food-riots/
Campos, N.F., Hsiao, C. and Nugent, J.B. (2010) ‘Crises, What Crises? New Evidence on the Relative Roles of Political and Economic Crises
in Begetting Reforms’, Journal of Development Studies, vol. 46, no. 10, pp. 1670-1691.
Chemingui, M.A. and Sanchez, M. V. (2011) Assessing Development Strategies to Achieve the MDGs in The Republic of Tunisia (New York: UN).
Ciezadlo, A. (2011) ‘Let Them Eat Bread: How Food Subsidies Prevent (and Provoke) Revolutions in the Middle East’, Foreign Affairs, 23
March 2011.
Claessens, S. and van Horen, N. (2012) ‘Foreign Banks: Trends, Impact and Financial Stability’, IMF Working Paper, no. WP/12/10, January
2012 (Washington DC: IMF).
Clark, H. (2012) ‘Putting resilience at the heart of development’, China Daily, 19 May 2012 07:30 – available here:
http://www.chinadaily.com.cn/cndy/2012-05/19/content_15335883.htm.
CNN (2011) ‘Libya's disappearing dinars and funding a revolution’, October 19, 2011 -- Updated 2300 GMT (0700 HKT) – available at
http://edition.cnn.com/2011/10/18/world/africa/libya-ntc-finances/index.html (accessed 27 April 2012).
Combes, J., Ebeke, C., Etoundi,M.N. and Yogo, T. (2012) ‘Are Foreign Aid and Remittance Inflows a Hedge against Food Price Shocks?’, IMF
Working Paper, no. WP/12/67, March 2012 (Washington DC: IMF).
Commission on Growth and Development (2008) Growth Report: Strategies for Sustained Growth and Inclusive Development (Washington
DC: World Bank).
Conley, H.A. and Dukkipati, U. (2011) ‘Leading from the Front: Europe and the New Libya', Center for Strategic and International Studies
Blog, 1 September 2011.
De Bock, R., Florea, D. and Toujas-Bernate, J. (2010) ‘Spillovers from Europe into Morocco and Tunisia’, IMF Working Paper, no WP/10/238 (October).
De Hoyos, R.E. and Medvedev, D. (2009) Poverty Effects of Higher Food Prices: A Global Perspective (Washington DC: World Bank).
Dimson, E., Marsh, P., Staunton, M. McGinnie, P. and Wilmot, J. (2012) Credit Suisse Global Investment Returns Yearbook 2012 (Zurich: Credit Suisse).
Ding, W., Domac, I. And Ferri, G. (1998) ‘Is there a credit crunch in East Asia?’, World Bank Policy Research Working Paper, no. 1959
(Washington DC: World Bank).
Donati, J. (2011) ‘Libya owes $1 bln for fuel for revolution’, Reuters, Thu Oct 13, 2011 5:21pm GMT.
Economic and Social Commission for Western Asia (2009) ‘The Impacts of the Financial Crisis on ESCWA Member Countries: Challenges and
Opportunities’ (ESCWA).

A f r i c a n D e v e l o p m e n t B a n k
48
AfDB E c o n o m i c B r i e f
2 0 1 4 • w w w . a f d b . o r g
Egypt Ministry of Finance (2009) Egypt Response to the Global Crises (Nasr City: Macro Fiscal Policy Unit, Ministry of Finance).
Eichengreen, B. (2010) ‘Latin Lessons for the Euro Zone’ – available at http://emlab.berkeley.edu/~eichengr/latin_lessons_1-16-11.pdf
(accessed 1 April 2012).
El Amrani, I. (2012) ‘Morocco’s second spring’, The Guardian, Tuesday 17 April 2012 22.00 BST – available on
http://www.guardian.co.uk/commentisfree/2012/apr/17/morocco-second-spring-king-revolution (accessed 27 April 2012).
El-Din, G.E. (2005) ‘US guarantees Egyptian bond issue’, Al-Ahram Weekly Online, issue no. 765, 20-26 October – available at
http://weekly.ahram.org.eg/2005/765/ec2.htm (accessed 27 April 2012).
El-Mahdy, A.M. and Torayeh, N.M. (2009) ‘Debt Sustainability and Economic Growth in Egypt’, International Journal of Applied Econometrics
and Quantitative Studies, Vol. 6, No. 1, pp. 25-55.
El Ouali, A. (2012) ‘”Green Morocco Plan” Fails to Confront Climate Change’, IPS News Mar. 15, 2012 – available at
http://ipsnews.net/news.asp?idnews=107090.
Erickson von Allmen, U. (2010) ‘The Structural Manifestation of the “Dutch Disease”: The Case of Oil Exporting Countries’, IMF Working Paper, no. WP/10/103.
Erixon, F. (2010) ‘Baltic Economic Reforms: A Crisis Review of Baltic Economic Policy’, ECIPE Working Paper, no. 04/2010 (Brussels: European
Centre for International Political Economy).
European Investment Bank (2005) Study on improving the efficiency of workers’ remittances in Mediterranean countries (Rotterdam: Ecorys).
Food and Agricultural Organisation of the United Nations (2011) ‘Country Policy Monitoring – Main Food-related Policy Measures’, Global
Watch GIEWS Country Briefs – available via the FAO website.
Food and Agricultural Organisation of the United Nations (2009) ‘Country responses to the food security crisis: Nature and preliminary
implications of the policies pursued’, Initiative on Soaring Food Prices (Rome: FAO).
Food and Agricultural Organisation of the United Nations (2003) ‘Annex 3: Trade flows for wheat, maize, rice, palm oil and soybean oil’,
Financing Normal Levels of Commercial Imports of Basic Foodstuffs in the context of the Marrakesh Decision on least-developed and net food-
importing developing countries (Rome: FAO).
Galasso, E. and Ravallion, M. (2004) ‘Social Protection in a Crisis: Argentina’s Plan Jefes y Jefas’, The World Bank Economic Review, vol. 18,
no. 3, pp. 367-399.
Garcia-Kilroy, C. and Silva, A.C. (2011) ‘Reforming Government Debt Markets in MENA’, World Bank Policy Research Working Paper, No. 5611.
Gasparini, L. (2007) ‘Monitoring the Socio-Economic Conditions in Argentina, 1992-2006’, in Gasparini, L., Pizzolito, G. and Tornarolli, L. (eds)
Monitoring the socio-economic conditions in Argentina, Chile, Paraguay and Uruguay (Buenos Aires: Center for Distributional, Labor and
Social Studies at Universidad Nacional de La Plata and World Bank).
Goodland, R. (2008) ‘How Libya could become environmentally sustainable’, Libyan Studies, vol. 39, pp. 145-160.
Grember, K. von, Fritschel, H.. Nestorova, B., Olofinbiyi, T., Pandya-Lorch, R. and Yisehac, Y. (2010) ‘The Challenge of Hunger: The 2008 Global
Hunger Index’, IFPRI Issue Brief, no. 54, October (Washington DC: International Food Policy Research Institute).

A f r i c a n D e v e l o p m e n t B a n k
49
E c o n o m i c B r i e f
2 0 1 4 • w w w . a f d b . o r g
AfDB
Griffith-Jones, S., Tyson, J. and Calice, P. (2011) ‘The European Investment Bank and the SMEs: Key Lessons for Latin America and the
Caribbean’, Serie Financiamiento del desarrollo, no 236 (Santiago: UN).
Griffith-Jones, S. and Ocampo, J.A. (2009) ‘The Financial Crisis and its Impact on Developing Countries’, International Policy Centre for
Inclusive Growth Working Paper, no 53, April (Brasilia: UNDP).
Grosh, M., del Ninno, C., Tesliuc, E. and Ouerghi, A. (2008) For Protection and Promotion: the Design and Implementaion of Effective Safety
Nets (Washington DC: World Bank).
Guillaumont, P. (2009) ‘An Economic Vulnerability Index: Its Design and Use for International Development Policy’, Oxford Development Studies,
vol. 37, no. 3, pp. 193-228.
Gurr, T.R. (2006) ‘Economic Factors’, in Richardson, L. (ed) The Roots of Terrorism (New York: Routledge).
Haddad, G. (2009) ‘Algeria injects $150 bln to stimulate national economy’, Global Arab Network, Friday, 25 December 2009 23:57.
Hakimian, H. (2011) ‘The Economic Prospects of the ‘Arab Spring’: A Bumpy Road Ahead’, Development Viewpoint, no. 63 (June), Centre
for Development Policy and Research, School of Oriental and African Studies.
Handfield, R. (2012) ‘The Global Phosphate Supply Market: Risky and Getting Riskier’, North Carolina State University, Supply Chain Resource
Cooperative Blog, 24 April 2012.
Harvie, C. and Lee, B. (2002) ‘East Asian SMEs: Contemporary Issues and Development – An Overview’, in Harvie, C. and Lee, B. (eds) The
Role of SMEs in National Economies in East Asia (Cheltenham: Edward Elgar).
Headey, D. and Fan, S. (2010) Reflections on the Global Food Crisis: How did it happen? How has it hurt? (Washington DC: IFPRI).
Hengel, E., Kechida, S., Koldertsova, A. and Sultan, S. (2008) ‘Access to Finance in the MENA Region – Recent developments
and Challenges’, OECD Working Group on SME Policy, Entrepreneurship and Human Capital Development Presentation, Manama,
18 November 2008.
Hirschman, A.O. (1970) Exit, voice, and loyalty: Responses to decline in firms, organizations, and states (Cambridge MA: Harvard University Press).
Hsu, D. (2008) ‘Taiwan SME Policies: Formulation and Development Strategies’, Presentation to Confederation of Asia-Pacific Chambers of
Commerce and Industry, Taipei, 25-30 August 2008 – available at
http://www.cacci.org.tw/Journal/2008Special/DavidHsuSME2008.pdf.
Ianchovichina, E. and Mottaghi, L. (2011) Employment-growth scenarios for the Middle East and North Africa region (Washington DC: World Bank).
Ianchovichina, E. and Lundstrom, S. (2009) ‘What is Inclusive Growth?’ (Washington DC: World Bank).
Ibrahim, M.A. (2011) ‘The determinants of international tourism demand for Egypt: Panel data evidence’, European Journal of Economics,
Finance and Administrative Sciences, issue 30, pp. 50-58.
Imbs, J. (2010) ‘The First Global Recession in Decades’, IMF Economic Review, vol. 58, pp. 327–354.
International Food Policy Research Institute (2012) Reducing the Risk of Food and Nutrition Insecurity among Vulnerable Populations
(Washington DC: IFPRI).

A f r i c a n D e v e l o p m e n t B a n k
50
AfDB E c o n o m i c B r i e f
2 0 1 4 • w w w . a f d b . o r g
International Food Policy Research Institute (2008) Global Food Crises: Monitoring and Assessing Impact to Inform Policy Responses
(Washington DC: IFPRI).
International Institute of Labour Studies (2011) ‘Argentina – Case study of past crises’, EC-IILS Joint Discussion Paper Series, no. 3 (Geneva: ILO).
International Labour Organisation (2011a) ‘A Review of Global Fiscal Stimulus’, EC-IILS Joint Discussion Paper Series, no. 5 (Geneva: ILO).
International Labour Organisation (2011b) Global Employment Trends 2011: The challenge of a jobs recovery (Geneva: ILO).
International Labour Organisation (2010) Global Employment Trends 2010 (Geneva: ILO).
International Monetary Fund (2012) Global Financial Stability Report: The Quest for Lasting Stability (Washington DC: IMF).
International Monetary Fund (2011a) Regional Economic Outlook: Middle East and Central Africa (Washington DC: IMF).
International Monetary Fund (2011b) ‘Algeria: Selected Issues Paper’, IMF Country Report, No. 11/41, February 2011 (Washington DC: IMF).
International Monetary Fund (2010) ‘Morocco: 2009 Article IV Consultation – Staff Report’, IMF Country Report, No. 10/58, March 2010
(Washington DC: IMF).
International Monetary Fund (2009) ‘Tunisia: 2009 Article IV Consultation – Staff Report’, IMF Country Report, No. 09/329, December 2009
(Washington DC: IMF).
International Monetary Fund (2008) Food and Fuel Prices – Recent Developments, Macroeconomic Impact and Policy Responses (Washington
DC: IMF).
Iqbal, F. (2006) Sustaining Gains in Poverty Reduction and Human Development in the Middle East and North Africa (Washington DC: World
Bank).
Islam, Y. (2010) ‘Elements of a pro-employment macroeconomic framework: an exploratory note’, Presentation at an IMF workshop,
Washington DC, 22 October 2010.
Jalan, J. and Ravallion, M. (2003) ‘Estimating the Benefit Incidence of an Anti-Poverty Program’, Journal of Business and Economic Statistics,
vol. 21, no. 1, pp. 19-30.
Jebnoun, S.A. and Zarrouk, H. (2012) ‘The Impact of the Recent Financial Crisis on Arab Countries: Transmission Channels and Lessons’,
European Journal of Economics, Finance and Administrative Sciences, issue 46, pp. 97-106.
Jones, N., Harper, C., Pantuliano, S. and Pavanello, S. (2009) ‘Impact of the economic crisis and food and fuel price volatility on children and
women in the MENA region’, ODI Working Paper, no. 310 (London: Overseas Development Institute and UNICEF).
Kamara, A., Masufire, A., Castel, V., Kurzwell, M., Vencatachellum, D. and Pla, L. (2009) ‘Soaring Food Prices and Africa’s Vulnerability and
Responses: An Update’, African Development Bank Working Paper No. 97, July 2009.
Kang, G.S., Kamara, A.B. and Brixiova, Z. (2010) ‘The European Debt Crisis: Risks for Africa?’, African Development Bank Group Chief
Economist Complex Market Brief, vol. 1, no. 2.
A f r i c a n D e v e l o p m e n t B a n k
51
E c o n o m i c B r i e f
2 0 1 4 • w w w . a f d b . o r g
AfDB
Kasekende, L., Brixiova, Z. and Ndikumana, L. (2010) ‘Africa: Africa’s Counter-Cyclical Policy Responses to the Crisis’, Journal of Globalization
and Development, vol. 1, no. 1, article. 16.
Kassandra (2012) ‘European growth compact; or how to turn a molehill into a mountain’, New Europe Online, 15 May 2012 21:21 – available at
http://www.neurope.eu/article/european-growth-compact-or-how-turn-molehill-mountain.
Kingdom of Morocco (2010) Green Morocco Plan (2010 – 2020) (Rabat: Ministry of Agriculture and Maritime Fisheries, Morocco).
Klau, A. (2010) Impact of the Economic Crisis on Trade, Foreign Investment and Employment in Egypt (Cairo: ILO).
Kolster, J. (2012) ‘Preface’, in Santi, E., Romdhane, S.B. and Shaw, W. (eds) Unlocking North Africa’s Potential through Regional Integration:
Challenges and Opportunities (Tunis: African Development Bank).
Kostzer, D. (2008) ‘Argentina: A Case Study on the Plan Jefes y Jefas de Hogar Desocupados, or the Employment Road to Economic
Recovery’, The Levy Economics Institute Working Paper, no. 534, May 2008.
Laar, M. (2007) ‘The Estonian Economic Miracle’, Backgrounder, no. 2060, 7 August 2007 (Washington DC: The Heritage Foundation).
Laeven, L. and Valencia, F. (2008) ‘Systemic Banking Crises: A New Database’, IMF Working Paper, no. WP/08/224, January (Washington DC: IMF).
Lagi, M., Bar-Yam, Y., Bertrand, K. Z. and Bar-Yam, Y. (2012) Economics of Food Prices and Crises (Cambridge MA: New England Complex Systems Institute).
Lagi, M., Bertrand, K. Z. and Bar-Yam, Y. (2011) ‘The Food Crises and Political Instability in North Africa and the Middle East’, New England
Complex Systems Institute Paper, no. arXiv:1108.2455, August 2011.
Lai, R.S.Q. (2010) ‘The Financial Assistance Policies for SMEs in Taiwan’, Presentation to the World Congress of Accountants, Kuala
Lumpur, 9 November 2010 – available at
http://www.wcoa2010kualalumpur.com/presentationslides/Dr%20Robert%20Sun-Quae%20Lai.pdf.
Lall, S. (2000) ‘Strengthening SMEs for International Competitiveness’, Egyptian Centre for Economic Studies Workshop on ‘What Makes
Your Firm Internationally Competitive?’, Cairo, 6-8 March 2000.
Liebfritz, W. (2011) ‘Undeclared Economic Activity in Central and Eastern Europe: How Taxes Contribute and How Countries Respond to the
Problem’, Policy Research Working Paper, no. 5923 (Washington DC: World Bank).
Lodola, G. (2003) ‘Popular Mobilisation and Geographic Distributive Paths: The Case of Argentine Plan Trabajar’, Paper delivered at the Latin
American and Caribbean Economic Association Fifth Annual Meeting, Cartagena de Indias (Colombia), 25-26 September 2003.
Lumiste, R., Pefferly, R. and Purju, A. (2008) ‘Estonia’s Economic Development: Trends, Practices and Sources - A Case Study’, Commission
on Growth and Development Working Paper, no. 25 (Washington DC: World Bank).
Markit Credit Research (2012) Markit Sovereign Report March 2012 (London: Markit Group Limited).
Massa, I., Keane, J. and Kennan, J. (2011) The euro zone crisis: risks for developing countries (London: Overseas Development Institute).
MENA Financial News (2010) ‘Trading at Egypt’s Nilex to begin soon’, MENA Financial News, Mon, 07 May 2012 13:21:46 GMT – available
at http://www.menafn.com/menafn/1093312006/Trading-at-Egypts-Nilex-to-begin-soon (accessed 27 April 2012).

A f r i c a n D e v e l o p m e n t B a n k
52
AfDB E c o n o m i c B r i e f
2 0 1 4 • w w w . a f d b . o r g
MercoPress (2012) ‘IMF warns Euro Zone crisis is dragging down world economy’, MercoPress, 25 January 2012 04:06 UTC – available at
http://en.mercopress.com/2012/01/25/imf-warns-euro-zone-crisis-is-dragging-down-the-world-economy (accessed 5 April 2012).
Migration Policy Institute (2011) MPI Data Hub – Remittances Profile: Egypt (Washington DC: MPI).
Miller, L. and Hunter, G. (2012) ‘Markets bounce back from grim year’, The National, 1 April 2012 – available at
http://www.thenational.ae/thenationalconversation/industry-insights/markets/markets-bounce-back-from-grim-year.
Minto, R. (2012) ‘Libya: stock market reopens, slowly’, Financial Times, 15 March 2012 5:58pm –available at http://blogs.ft.com/beyond-
brics/2012/03/15/libya-stock-market-reopens-slowly/#axzz1uxeN7G2N.
Mitchell, T. and Harris, K. (2012) ‘Resilience: A risk management approach’, Overseas Development Institute Background Note, 12 January 2012.
Mitchell, J., Stevens, P. and Cassinadri, E. (2008) ‘Resource Depletion, Dependence and Development: Algeria’, Chatham House Working
Paper, no. EEDP 11/08 (London: Chatham House).
Mohaddes, K. (2012) ‘Econometric Modelling of World Oil Supplies: Terminal Price and the Time to Depletion’, Cambridge Working Papers in
Economics, no. CWPE 1212 (Cambridge: Cambridge University).
Moody’s Investors Service (2005) ‘Moody’s downgrades Egypt local currency bond rating to Baa3, negative outlook’, 18 May 2005 – available
at http://www.moodys.com/research/MOODYS-DOWNGRADES-EGYPT-LOCAL-CURRENCY-BOND-RATING-TO-Baa3-NEGATIVE--PR_96923.
Moody’s Investors Service (2008) ‘Rating Action: Moody's changes Egypt's rating outlooks to negative’, 23 June 2008 - available at
http://www.moodys.com/research/Moodys-changes-Egypts-rating-outlooks-to-negative--PR_157829.
Moody’s Investors Service (2009) ‘Rating Action: Moody's changes outlook on Egypt's sovereign ratings to stable from negative’, 19 August
2009 - available at http://www.moodys.com/research/Moodys-changes-outlook-on-Egypts-sovereign-ratings-to-stable-from--PR_185180.
Mohapatra, S., Ratha, D. and Silwal, A. (2011) ‘Outlook for Remittance Flows 2012-14’, World Bank Migration and Development Brief, No.
17 (1 December 2011).
Mottaghi, L. (2011) ‘Why growth in MENA is so volatile’, Voices and Views: World Bank MENA Blog, 5 December 2011 – available at
http://menablog.worldbank.org/why-growth-mena-so-volatile.
Ngui, M. (2002) ‘Government Policies and Programs for SMEs in Taiwan’, in Harvie, C. and Lee, B. (eds) The Role of SMEs in National
Economies in East Asia (Cheltenham: Edward Elgar).
Njau, B. (2011) ‘Morocco provides haven from revolutions and recession’, FDI Intelligence, 05/12/2011 6:24 pm – available at
http://www.fdiintelligence.com/Special-Reports/2011/Morocco-makes-its-move/Morocco-provides-haven-from-revolutions-and-recession.
Nuqudy (2012) ‘Morocco Hosts Renewable Energy Event’, Nuqudy, 16/05/2012 11:37 – available at
http://english.nuqudy.com/North_Africa/Morocco_Hosts_Renew-1885.
Okonjo-Iweala, N. and Ratha, D. (2011) ‘A Bond for the Homeland’, Foreign Policy, 24 May 2011.
Organisation for Economic Co-operation and Development (2012) OECD Economic Survey: Estonia – October 2012 Overview (Paris: OECD).

A f r i c a n D e v e l o p m e n t B a n k
53
E c o n o m i c B r i e f
2 0 1 4 • w w w . a f d b . o r g
AfDB
Organisation for Economic Co-operation and Development (2011) Future Global Shocks: Improving Risk Governance (Paris: OECD).
Organisation for Economic Co-operation and Development (2010) OECD Science, Technology and Industry Outlook 2010 (Paris: OECD).
Ortiz, G. (2012) ‘What Can the Developed World Learn from the Latin American Debt and Mexican Peso Crisis?’, Business Economics, vol.
47, pp. 2-13.
Ortiz, I., Chai, J. and Cummins, M. (2011) ‘Escalating Food Prices: The threat to poor households and policies to safeguard a Recovery for
All’, UNICEF Social and Economic Policy Working Paper, February 2011 (New York: UNICEF).
Ottaway, M. and Hamzawy, A. (2011) ‘Protest Movements and Political Change in the Arab World’, Carnegie Endowment for International Peace
Policy Outlook, 28 January 2011.
Ouali, M. (2008) ‘Algeria launches Rural Renewal Programme’, Magharebia, 31 January 2008.
Oxford Business Group (2010) The Report: Tunisia 2010 (London: Oxford Business Group).
Oxford Business Group (2007) The Report: Emerging Tunisia 2007 (London: Oxford Business Group).
Paciello, M.C. (2010) ‘The Impact of the Economic Crisis on Euro-Mediterranean Relations’, The International Spectator, vo. 45, no. 3, pp. 51-69.
Perrow, C. (1999) Normal Accidents: Living with High-Risk Technologies (Princeton: Princeton University Press).
Pfeiffer, T. (2012) ‘Egypt misses treasury bill sale target, yields rise’, Reuters, Friday 4 May 2012 6:24am GMT – available at
http://af.reuters.com/article/investingNews/idAFJOE84300Y20120504.
Price, R. and Wörgötter, A. (2011) ‘Estonia: Making the Most of Globalisation’, OECD Economics Department Working Papers, no. 876 (Paris:
OECD Publishing).
PwC, World Bank and IFC Paying Taxes Team (2013) Paying Taxes 2013: The global picture (London: PwC).
Radwan, S. (2007) ‘Good Jobs, Bad Jobs and Economic Performance: A View from the Middle East and North Africa Region’, in Paci, P. and
Serneels (eds) Employment and Shared Growth: Rethinking the Role of Labor Mobility for Development (Washington DC: World Bank).
Ramalho, R. (2007) ‘Adding a million taxpayers’, in World Bank (ed) Celebrating Reform 2007: Doing Business Case Studies (Washington DC:
World Bank).
Rathbone, J. P. (2010) ‘Eurozone can learn grim Latin lessons’, Financial Times Europe, December 21, 2010 11:20 pm.
Raudla, R. (2009) Constitution, Public Finance, and Transition: Theoretical Developments in Constitutional Public Finance and the Case of
Estonia (Frankfurt: Peter Lang).
Reinhart, C. and Rogoff, K.S. (2011) This Time is Different: Eight Centuries of Financial Folly (Princeton, NJ: Princeton University Press).
Rettig, J. (2011) ‘The Death Toll of the “Arab Spring” Revolutions’, US News and World Report, November 9, 2011 – available at
http://www.usnews.com/news/articles/2011/11/09/the-death-toll-of-the-arab-spring-revolutions (accessed 1 May 2012).
A f r i c a n D e v e l o p m e n t B a n k
54
AfDB E c o n o m i c B r i e f
2 0 1 4 • w w w . a f d b . o r g
Reuters (2009) ‘TABLE - The world top ten wheat importers and exporters’, Mon 13 Jul 2009 2:44pm IST – available at
http://in.reuters.com/article/2009/07/13/wheat-trade-idINSP49082020090713 (accessed 7 April 2012).
Rofman, R. and Ringold, D. (2008) ‘Argentina: Income Support Policies Towards the Bicentennial’, En Breve, no. 28, July 2008 (Washington
DC: World Bank).
Rogers, S., Sedghi, A. and Burn Murdoch, J. (2011) ‘Credit ratings: how Fitch, Moody's and S&P rate each country’, The Guardian, Thursday
15 March 2012 17.30 GMT – available on http://www.guardian.co.uk/news/datablog/2010/apr/30/credit-ratings-country-fitch-moodys-
standard (accessed 27 April 2012).
Sabaudia Consulting (2009) Egypt Private Sector Country Profile (Tunis: African Development Bank).
Sagan, S. D. (2004) ‘Learning from Normal Accidents’, Organization and Environment, pp. 15–19.
Said, S. (2011) ‘Potential Effects of the World Economic Crisis on the MENA’s Foreign Trade and Regional Economic Integration’, Paper
presented at the 10th International Conference of the Middle East Economic Association in collaboration with the Center for Research on the
Economics of the Mediterranean, Barcelona Graduate School of Economics, June 23-24.
Saif, I. (2008) ‘The Food Price Crisis in the Arab Countries: Short Term Responses to a Lasting Challenge’, Carnegie Endowment for
International Peace web commentary, June 2008.
Saleh, H. and Khalaf, R. (2013) ‘Egypt hits problems over IMF loan’, Financial Times Middle East and North Africa, 10 May 2013 4:48pm –
available at http://www.ft.com/intl/cms/s/0/4ffaf59e-8977-11e2-ad3f-00144feabdc0.html#axzz2YjDuRz8e.
Santi, E., Romdhane, S.B. and Shaw, W. (2012) Unlocking North Africa’s Potential through Regional Integration: Challenges and Opportunities
(Tunis: African Development Bank).
Seddon, D. (1989) ‘Riots and Rebellion in North Africa: Political Responses to Economic Crisis in Tunisia, Morocco and Sudan’, in Berberoglu,
B. (ed.) Power and Stability in the Middle East (London: Zed Books).
Shahin, H. and Zreik, N. (2011) ‘The Impact of Egypt’s Revolution on the Corporate Sector’, Zawya Equity Capital Markets Research, July 2011
– available at http://www.zawya.com/viewFullPdfStory.cfm/sidpdf_040711073220 (accessed 1 April 2012).
Shahine, A. (2009) ‘Egypt Seeks 15% Export Growth in 2009, Minister Says’, Bloomberg, 7 September 2009 12:43 EDT.
Shiller, R.J. (2008) The Subprime Solution: How Today’s Global Financial Crisis Happened, and What to Do about It (Princeton, NJ: Princeton
University Press).
Stiglitz, J. (2002) ‘Argentina, shortchanged: Why the nation that followed the rules fell to pieces’, Washington Post, 12 May 2002.
Subrahmanyam, G. (2011) ‘Tackling youth unemployment in the Maghreb’, North Africa Policy Series Economic Brief (Tunis: African
Development Bank).
SWF Institute (2012) ‘Sovereign Wealth Fund Rankings: Largest Sovereign Wealth Funds by Assets Under Management’ - available at
http://www.swfinstitute.org/fund-rankings/ (accessed 25 April 2012).

A f r i c a n D e v e l o p m e n t B a n k
55
E c o n o m i c B r i e f
2 0 1 4 • w w w . a f d b . o r g
AfDB
TANGO International (2012) ‘Developing a Strategic Framework for Resilience in the Horn of Africa’, Technical Assistance for NGOS presentation
at ‘Secure the Future’ Planning Session, 14-16 February 2012, Nairobi, Kenya.
Tcherneva, P. (2012) ‘What do Poor Women Want: Public Employment or Cash Transfers? Lessons from Argentina’, Levy Economics Institute
Working Paper Collection, Working Paper No. 705 (Annandale-on-Hudson, NY: Levy Economics Institute).
The Economist (2012) ‘Arab Spring Economies: Unfinished Business, The Economist, 2 February 2012 – available at
http://www.economist.com/node/21546018 (accessed 25 April 2012).
Tzeng, P. (2009) ‘The Lost Paradigm: Taiwan’s SME Sector’, American Chamber of Commerce Taiwan Business TOPICS, vol. 39, no. 9.
United Nations (2011) The Global Social Crisis: Report on the World Social Situation 2011 (New York: UN Department of Economic and Social Affairs).
United Nations (2009) The Global Economic and Financial Crisis: Regional Impacts, Responses and Solutions (New York: UN).
United Nations (2001) World Public Sector Report: Globalization and the State 2001 (New York: UN Department of Economic and Social Affairs).
United Nations Conference on Trade and Development (2011) ‘How to Attract and Benefit from FDI in Small Countries: Lessons from Estonia
and Jamaica’, Investment Advisory Series, Series B, no. 6 (New York and Geneva: UNCTAD).
United Nations Development Programme (2011) Towards Human Resilience: Sustaining MDG Progress in an Age of Economic Uncertainty
(New York: UNDP).
United Nations Economic and Social Commission for Africa (2012) Overview of Economic and Social Conditions in Africa in 2011 (Addis
Ababa: UNECA).
United Nations Economic and Social Commission for Africa (2011) Assessing Progress in Africa toward the Millennium Development Goals:
MDG Report 2011 (Addis Ababa: UNECA).
United Nations Economic and Social Commission for Asia and the Pacific (2011) ‘Concept Note: High-level Regional Policy Dialogue on Asia-
Pacific economies after the global financial crisis: Lessons learnt, challenges for building resilience, and issues for global reform’, 6-8 September
2011, Manila, Philippines.
United Nations Economic and Social Commission for Asia and the Pacific, Asian Development Bank and United Nations Development
Programme (2009) Achieving the Millennium Development Goals in an Era of Global Uncertainty: Asia-Pacific Regional Report 2009/10 (New
York: UNESCAP).
Unt, M. (2012) Boom and Bust Effects on Youth Unemployment in Estonia (Berlin: Friedrich-Ebert-Stiftung).
Uppsala Conflict Data Program (2011) 'Arabian Spring 2010-11: background narrative’ (Uppsala: Department of Peace and Conflict
Research, Uppsala University) - available at
http://www.pcr.uu.se/digitalAssets/87/87709_Background_narrative_arabian_spring.pdf.
Wiggins, S. and Levy, S. (2008) ‘Rising food prices: A global crisis’, ODI Briefing Paper, No. 37 (April) (London: Overseas Development Institute).
Wiggleworth, R., Saleh, H. and Ross, A. (2012) ‘Egyptian bourse leads the world this year’, Financial Times, February 21, 2012 8:16 pm - available at
http://www.ft.com/cms/s/0/7ba2b808-5c82-11e1-8f1f-00144feabdc0.html#axzz1uqWVUeRi.

A f r i c a n D e v e l o p m e n t B a n k
56
AfDB E c o n o m i c B r i e f
2 0 1 4 • w w w . a f d b . o r g
Wolf, F. and Sampson, P. (2007) ‘Evidence of an Interaction Involving Complexity and Coupling as Predicted by Normal Accident Theory’,
Journal of Contingencies and Crisis Management, vol. 15, no. 3, pp. 123–133.
World Bank (2013) Doing Business 2013: Smarter Regulations for Small and Medium-Size Enterprises (Washington DC: World Bank and
International Finance Corporation).
World Bank (2013a) ‘Economy Profile: Estonia’, Doing Business 2013: Smarter Regulations for Small and Medium-Size Enterprises (Washington
DC: World Bank and International Finance Corporation).
World Bank (2011a) Regional Economic Update May 2011: MENA Facing Challenges and Opportunities (Washington DC: World Bank).
World Bank (2011b) Doing Business 2011 (Washington DC: World Bank and International Finance Corporation).
World Bank (2011c) Global Economic Prospects June 2011: Regional Annex (Washington DC: World Bank).
World Bank (2011d) ‘Eurozone Storm on the Horizon’, MENA Monitor, no. 1 (November).
World Bank (2010) MENA Regional Outlook October 2010 (Washington DC: World Bank).
World Bank (2009a) The Global Economic Crisis: Assessing Vulnerability with a Poverty Lens (Washington DC: World Bank).
World Bank (2009b) Improving Food Security in Arab Countries (Washington DC: World Bank).
World Bank (2009c) Egypt and the Global Economic Crisis: A Preliminary Assessment of Macroeconomic Impact and Response, Volume 1:
Main Report (Washington DC: World Bank).
World Bank (2007) Enterprise Survey 2007 (Washington DC: World Bank).
World Economic Forum (2010) The Global Competitiveness Report 2010-2011 (Geneva: World Economic Forum).
Wray, L.R. and Tcherneva, P.R. (2005) ‘Employer of Last Resort: A Case Study of Argentina’s Jefes Program’, Centre for Full Employment and
Price Stability Working Paper, no. 41 (1 April 2005) – available at
http://www.cfeps.org/pubs/wp-pdf/WP41-Tcherneva-Wray-all.pdf.
Wu, R.I. and Huang, C.C. (2003) ‘Entrepreneurship in Taiwan: Turning point to restart’, Paper presented at The Global Forum –
Entrepreneurship in Asia: 4th US-Japan dialogue, April 16 – available at
http://www.mansfieldfdn.org/backup/programs/program_pdfs/ent_taiwan.pdf.
Yemtsov, R. (2008) ‘The Food Crisis: Global Perspectives and Impact on MENA, Fiscal and Poverty Impact’, Middle East and North Africa
Poverty Reduction and Economic Management Department (Washington, DC: World Bank).
Zhu, M. (2012) ‘Enhancing Resilience to Shocks and Fostering Inclusive Growth in the Pacific Islands’, Address by Deputy Managing Director
of the IMF at the co-hosted IMF and Government of Samoa Pacific Islands Conference, Apia, Samoa, 23 March 2012.
Zohry, A. (2011) ‘The View from Abroad: A look at the trends in one of Egypt’s largest sources of foreign currency’, Business Today Egypt, 12
December 2011 6:50am – available at
http://businesstodayegypt.com/news/display/article/artId:232/The-View-From-Abroad/secId:7


A f r i c a n D e v e l o p m e n t B a n k
58
Exports of goods
Country 2000 2001 2002 2003 2004 2005 2006 2007 2008 2009 2010Algeria 22.0 19.1 18.8 24.7 32.1 46.0 54.6 60.2 79.3 45.2 57.1 Egypt 4.7 4.1 4.7 6.2 7.7 10.7 13.7 16.2 26.2 23.1 26.4 Libya 12.7 11.3 9.9 14.6 20.4 30.9 39.4 43.6 61.8 37.1 46.3 Morocco 7.2 7.1 7.9 8.8 9.9 11.2 12.7 15.3 20.3 14.1 17.6 Tunisia 5.9 6.6 6.9 8.0 9.7 10.5 11.7 15.2 19.3 14.4 16.4
Imports of goodsCountry 2000 2001 2002 2003 2004 2005 2006 2007 2008 2009 2010Algeria 9.1 9.9 12.0 13.5 18.3 20.4 21.5 27.6 39.5 39.3 41.0 Egypt 13.9 12.8 12.5 10.9 12.8 19.8 20.7 27.1 48.8 44.9 52.9 Libya 4.0 4.4 5.5 6.1 8.7 11.2 10.3 13.0 19.7 21.2 24.7 Morocco 11.5 11.0 11.9 14.3 17.8 20.8 24.0 32.0 42.4 32.9 35.5 Tunisia 8.6 9.5 9.5 10.9 12.8 13.2 15.0 19.1 24.6 19.2 22.2
Merchandise trade balanceCountry 2000 2001 2002 2003 2004 2005 2006 2007 2008 2009 2010Algeria 12.9 9.2 6.8 11.2 13.8 25.6 33.1 32.6 39.8 5.9 16.1 Egypt (9.2) (8.7) (7.8) (4.7) (5.1) (9.1) (7.0) (10.9) (22.6) (21.8) (26.5)Libya 8.7 6.9 4.4 8.5 11.7 19.7 29.1 30.6 42.1 15.9 21.6 Morocco (4.3) (3.9) (4.0) (5.5) (7.9) (9.6) (11.3) (16.7) (22.1) (18.8) (17.9)Tunisia (2.7) (2.9) (2.6) (2.9) (3.1) (2.7) (3.3) (3.9) (5.3) (4.8) (5.8)
Merchandise trade (% of total exports of goods and services)Country 2000 2001 2002 2003 2004 2005 2006 2007 2008 2009 2010Algeria 95.8 95.2 93.5 94.0 94.5 94.8 95.5 95.5 95.8 93.8 94.0 Egypt 32.3 31.3 33.5 35.8 35.1 42.1 45.9 44.8 51.3 51.7 52.6 Libya 98.7 98.4 96.1 97.1 97.9 98.3 98.8 99.8 99.7 99.0 99.1 Morocco 70.3 63.9 64.3 61.6 59.7 58.0 56.6 55.8 60.3 53.3 58.3 Tunisia 67.9 69.5 71.9 73.2 72.7 72.3 73.1 75.5 76.3 72.4 73.9
Merchandise trade (% of GDP)Country 2000 2001 2002 2003 2004 2005 2006 2007 2008 2009 2010Algeria 56.9 52.7 54.2 56.2 59.0 64.3 64.9 65.0 69.3 61.2 61.8 Egypt 19.5 18.6 19.9 23.0 25.9 32.3 31.9 32.7 45.5 36.2 36.9 Libya 42.7 46.1 65.2 72.3 80.3 81.4 82.5 80.3 87.1 80.1 79.0 Morocco 50.6 48.2 48.8 46.2 48.7 53.7 55.9 62.9 70.6 51.4 58.0 Tunisia 67.1 73.2 70.9 69.0 72.2 73.3 77.8 88.1 98.1 77.4 87.3
Total exports of goods and services (% of GDP)Country 2000 2001 2002 2003 2004 2005 2006 2007 2008 2009 2010Algeria 42.0 36.4 35.4 38.6 39.8 47.0 48.8 46.6 48.3 34.9 38.2 Egypt 15.1 14.5 16.2 23.3 27.6 26.8 27.7 27.3 31.0 23.7 23.3 Libya 33.5 33.8 46.9 57.5 62.6 69.3 72.4 69.7 76.2 63.7 64.9 Morocco 27.6 29.6 30.2 28.6 29.2 32.4 34.3 36.6 38.0 28.9 32.9 Tunisia 40.1 43.2 41.3 39.9 42.7 45.0 46.5 51.6 56.5 45.8 50.2
Total imports of goods and services (% of GDP)Country 2000 2001 2002 2003 2004 2005 2006 2007 2008 2009 2010Algeria 19.8 21.1 23.8 22.6 24.3 22.8 20.9 23.8 27.7 34.7 31.3 Egypt 21.3 20.7 20.9 22.2 25.0 30.4 28.4 29.7 37.9 29.4 28.9 Libya 12.0 15.8 27.2 22.5 24.8 18.5 15.6 15.0 16.5 25.7 23.1 Morocco 33.8 32.5 33.0 32.1 34.9 38.6 40.4 46.3 51.4 40.7 43.8 Tunisia 42.4 46.2 44.1 42.4 44.2 44.4 47.4 52.4 58.1 47.5 53.8
Total trade in merchandise and services (% of GDP)Country 2000 2001 2002 2003 2004 2005 2006 2007 2008 2009 2010Algeria 61.7 57.5 59.1 61.2 64.0 69.8 69.7 70.4 76.0 69.6 69.5 Egypt 36.4 35.2 37.1 45.5 52.7 57.2 56.1 57.0 68.9 53.1 52.2 Libya 45.5 49.7 74.1 80.0 87.4 87.8 88.0 84.7 92.7 89.4 88.1 Morocco 61.4 62.2 63.2 60.7 64.1 71.0 74.8 82.9 89.4 69.5 76.7 Tunisia 82.5 89.4 85.4 82.4 86.9 89.3 93.9 104.0 114.6 93.3 104.0
Table 1: Merchandise trade balance and overall trade contribution to growth in North Africa, 2000-2010 (Amounts in billions of US dollars at current prices unless otherwise stated)
Source: Author's computations from UNCTADstat data. Data for Morocco includes Western Sahara.
AfDB E c o n o m i c B r i e f
2 0 1 4 • w w w . a f d b . o r g

A f r i c a n D e v e l o p m e n t B a n k
59
International tourism, receipts (current US$ billions)
Country 2000 2001 2002 2003 2004 2005 2006 2007 2008 2009 2010Algeria 0.10 0.10 0.11 0.11 0.18 0.48 0.39 0.33 0.47 0.38
Egypt 4.66 4.12 4.13 4.70 6.33 7.21 8.13 10.33 12.10 11.76
Libya 0.08 0.09 0.20 0.24 0.26 0.30 0.24 0.10 0.10 0.16
Morocco 2.28 2.97 3.16 3.80 4.54 5.43 6.90 8.31 8.89 7.98 8.18
Tunisia 1.98 2.06 1.83 1.94 2.43 2.80 3.00 3.37 3.91 3.53
International tourism, number of arrivals (in millions)
Country 2000 2001 2002 2003 2004 2005 2006 2007 2008 2009 2010Algeria 0.87 0.90 0.99 1.17 1.23 1.44 1.64 1.74 1.77 1.91
Egypt 5.12 4.36 4.91 5.75 7.80 8.24 8.65 10.61 12.30 11.91
Libya 0.04 0.08 0.04 0.04 0.03
Morocco 4.28 4.38 4.45 4.76 5.48 5.84 6.56 7.41 7.88 8.34
Tunisia 5.06 5.39 5.06 5.11 6.00 6.38 6.55 6.76 7.05 6.90
International tourism, receipts (% of total exports of goods and services)
Country 2000 2001 2002 2003 2004 2005 2006 2007 2008 2009 2010Algeria 1.0 0.7 0.5 0.6 0.8
Egypt 27.6 25.6 25.1 23.4 23.9 23.5 22.2 23.3 22.1 26.4
Libya 0.7 0.8 2.0 1.8 1.5 1.0 0.6 0.2 0.2 0.4
Morocco 21.8 26.6 25.9 26.7 27.3 28.9 31.8 30.4 26.3 30.2 27.1
Tunisia 23.0 21.6 19.2 17.6 18.3 19.1 18.8 16.8 15.5 17.7
Travel and tourism, direct contribution to GDP (%)
Country 2000 2001 2002 2003 2004 2005 2006 2007 2008 2009 2010 2011Algeria 3.5 3.5 3.7 3.7 4.2 4.3 4.1 3.8 3.7 4.2 4.0 4.0
Egypt 6.8 6.6 6.7 8.0 9.4 9.1 8.9 9.1 8.8 8.2 8.1 6.6
Libya 2.6 2.6 3.2 2.9 3.1 3.4 2.1 1.8 1.7 2.1 1.6 1.6
Morocco 6.3 7.6 7.6 7.6 8.0 9.0 10.1 10.5 9.6 8.8 8.9 8.9
Tunisia 9.1 9.1 8.1 7.5 8.2 9.1 9.2 9.1 9.0 8.8 8.6 6.5
Travel and tourism, total contribution to GDP (%)
Country 2000 2001 2002 2003 2004 2005 2006 2007 2008 2009 2010 2011Algeria 6.3 6.9 7.4 7.8 8.9 8.5 9.2 8.6 7.8 8.8 7.9 7.7
Egypt 14.1 14.1 14.6 16.5 19.1 19.0 19.0 19.5 19.0 17.9 17.5 14.8
Libya 5.7 5.6 6.3 5.6 5.9 6.4 4.1 3.7 3.5 4.1 3.3 3.2
Morocco 12.1 14.8 14.7 14.6 16.3 18.5 20.8 22.4 21.0 19.2 19.4 18.9
Tunisia 19.4 19.8 17.6 16.7 17.8 19.4 19.9 19.5 18.9 18.5 17.8 14.2
Travel and tourism, direct contribution to employment (%)
Country 2000 2001 2002 2003 2004 2005 2006 2007 2008 2009 2010 2011Algeria 3.1 3.1 3.3 3.3 3.7 3.9 3.7 3.4 3.3 3.8 3.6 3.6
Egypt 5.8 5.7 5.7 6.8 8.0 7.8 7.6 7.8 7.5 7.1 7.0 5.7
Libya 2.5 2.5 3.1 2.8 3.0 3.3 2.1 1.8 1.7 2.0 1.6 1.5
Morocco 5.5 6.6 6.6 6.6 7.0 7.8 8.8 9.1 8.4 7.7 7.8 7.8
Tunisia 8.0 8.1 7.1 6.7 7.3 8.1 8.2 8.2 8.1 7.9 7.8 5.9
Travel and tourism, total contribution to employment (%)
Country 2000 2001 2002 2003 2004 2005 2006 2007 2008 2009 2010 2011Algeria 5.7 6.1 6.6 7.0 8.0 7.7 8.2 7.8 7.1 7.9 7.1 7.0
Egypt 12.4 12.4 12.8 14.5 16.8 16.7 16.7 17.2 16.7 15.8 15.4 13.1
Libya 5.4 5.2 5.9 5.3 5.6 6.1 4.0 3.5 3.3 3.9 3.2 3.0
Morocco 10.7 13.2 13.0 13.0 14.5 16.4 18.5 19.8 18.6 17.1 17.3 16.8
Tunisia 17.3 17.7 15.8 15.0 16.0 17.5 17.9 17.6 17.1 16.7 16.1 12.8
Table 2: International tourism in North Africa - receipts and economic contribution, 2000-2010
Source: World Bank Africa Development Indicators database; World Travel and Tourism Council database.
E c o n o m i c B r i e f
2 0 1 4 • w w w . a f d b . o r g
AfDB

A f r i c a n D e v e l o p m e n t B a n k
60
Real gross domestic product (GDP) growth (annual change %) Average Average Average
Country 2000 2001 2002 2003 2004 2005 2006 2007 2008 2009 2010 2000-02 2003-08 2009-10Algeria 2.2 2.7 4.7 6.9 5.2 5.1 2.0 3.0 2.4 2.4 3.3 3.2 4.1 2.8 Egypt 5.4 3.5 3.2 3.2 4.1 4.5 6.8 7.1 7.2 4.7 5.2 4.0 5.5 4.9 Libya 3.7 (4.3) (1.3) 13.0 4.4 10.3 6.7 7.5 2.4 (2.3) 4.2 (0.6) 7.4 0.9 Morocco 1.6 7.6 3.3 6.3 4.8 3.0 7.8 2.7 5.6 4.9 3.7 4.2 5.0 4.3 Tunisia 4.3 4.9 1.7 5.5 6.0 4.0 5.7 6.3 4.5 3.1 3.7 3.6 5.3 3.4
Real GDP per capita growth (annual change %) Average Average Average
Country 2000 2001 2002 2003 2004 2005 2006 2007 2008 2009 2010 2000-02 2003-08 2009-10Algeria 0.7 1.1 3.2 5.3 3.6 3.5 0.5 1.4 0.9 0.6 1.5 1.7 2.5 1.0 Egypt 3.5 1.7 0.5 1.3 2.2 2.6 4.9 5.2 5.3 2.9 3.3 1.9 3.6 3.1 Libya 1.8 (6.1) (3.2) 10.8 2.4 7.7 3.7 3.7 1.7 0.3 2.7 (2.5) 5.0 1.5 Morocco 0.3 6.3 2.1 5.1 3.6 1.9 6.6 1.6 4.5 3.7 2.6 2.9 3.9 3.1 Tunisia 3.1 3.7 0.6 4.9 5.0 3.0 4.6 5.3 3.5 2.0 2.6 2.5 4.4 2.3
Inflation, consumer prices (annual change %) Average Average Average
Country 2000 2001 2002 2003 2004 2005 2006 2007 2008 2009 2010 2000-02 2003-08 2009-10Algeria 0.3 4.2 1.4 4.3 4.0 1.4 2.3 3.7 4.9 5.7 3.9 2.0 3.4 4.8 Egypt 2.7 2.3 2.7 4.5 11.3 4.9 7.6 9.3 18.3 11.8 11.3 2.6 9.3 11.5 Libya (2.9) (8.8) (9.8) (2.2) (2.2) 2.7 3.4 6.3 10.4 2.8 4.7 (7.2) 3.0 3.8 Morocco 1.9 0.6 2.8 1.2 1.5 1.0 3.3 2.0 3.7 1.0 1.0 1.8 2.1 1.0 Tunisia 3.0 2.0 2.7 2.7 3.6 2.0 4.5 3.4 4.9 3.5 4.4 2.5 3.5 4.0
Budget surplus/deficit (% of GDP) Average Average Average
Country 2000 2001 2002 2003 2004 2005 2006 2007 2008 2009 2010 2000-02 2003-08 2009-10Algeria 9.7 3.7 1.2 4.9 6.9 11.9 13.9 6.1 9.1 (6.8) (3.9) 4.9 8.8 (5.4)Egypt (1.2) (2.2) (9.2) (9.0) (8.3) (8.4) (9.2) (7.6) (7.8) (7.1) (8.2) (4.2) (8.4) (7.7)Libya n/a n/a n/a 14.8 17.4 33.9 33.5 29.7 25.9 5.4 8.7 - 25.9 7.1 Morocco (2.2) (4.3) (3.7) (4.3) (3.8) (4.2) (1.0) 1.5 1.2 (2.2) (4.6) (3.4) (1.8) (3.4)Tunisia (2.6) (2.3) (2.4) (2.5) (2.4) (3.1) (2.9) (2.2) (0.7) (3.1) (1.3) (2.4) (2.3) (2.2)
External debt (% of GDP) Average Average Average
Country 2000 2001 2002 2003 2004 2005 2006 2007 2008 2009 2010 2000-02 2003-08 2009-10Algeria 46.3 40.9 40.1 34.6 26.0 16.3 4.9 4.4 3.5 3.9 3.3 42.4 14.9 3.6 Egypt 30.3 31.0 34.0 41.0 39.2 32.0 28.4 25.7 20.2 17.7 16.2 31.8 31.1 17.0 Libya n/a n/a n/a 23.2 18.3 13.4 10.1 8.1 5.8 9.5 7.8 - 13.2 8.7 Morocco 55.8 49.8 44.5 36.5 29.6 27.2 27.1 27.3 23.4 26.0 27.8 50.0 28.5 26.9 Tunisia 52.7 58.3 66.7 66.8 62.5 55.4 54.2 52.5 46.4 49.9 48.8 59.2 56.3 49.3
Current account balance (% of GDP) Average Average Average
Country 2000 2001 2002 2003 2004 2005 2006 2007 2008 2009 2010 2000-02 2003-08 2009-10Algeria 16.7 12.9 7.7 13.0 13.0 20.5 24.7 22.8 20.2 0.3 7.9 12.4 19.0 4.1 Egypt (1.2) (0.0) 0.7 2.4 4.3 3.2 1.6 2.1 0.6 (2.4) (2.0) (0.2) 2.4 (2.2)Libya 29.8 12.3 3.0 21.9 24.3 41.8 51.0 43.2 38.9 16.0 14.4 15.0 36.8 15.2 Morocco (1.3) 4.3 3.7 3.2 1.7 1.8 2.2 (0.1) (5.2) (5.4) (4.3) 2.2 0.6 (4.9)Tunisia (3.8) (4.6) (3.2) (2.7) (2.4) (0.9) (1.8) (2.4) (3.8) (2.8) (4.8) (3.9) (2.3) (3.8)
Gross national savings (% of GDP) Average Average Average
Country 2000 2001 2002 2003 2004 2005 2006 2007 2008 2009 2010 2000-02 2003-08 2009-10Algeria 41.7 39.7 38.5 43.3 46.3 51.9 54.7 57.2 58.6 50.3 52.3 39.9 52.0 51.3 Egypt 18.4 18.2 19.0 19.4 21.3 21.2 20.4 22.9 22.9 16.8 16.9 18.5 21.4 16.9 Libya 39.6 58.8 52.9 54.1 53.3 65.2 73.6 69.8 66.1 50.8 50.2 50.4 63.7 50.5 Morocco 24.2 30.4 29.6 30.5 30.8 30.6 31.6 32.4 32.9 30.2 30.8 28.1 31.5 30.5 Tunisia 22.3 21.6 20.6 20.6 20.8 20.8 21.6 21.5 22.1 21.9 21.6 21.5 21.2 21.8
Total reserves in months of imports Average Average Average
Country 2000 2001 2002 2003 2004 2005 2006 2007 2008 2009 2010 2000-02 2003-08 2009-10Algeria 16.1 22.1 23.5 29.6 28.6 33.4 43.7 48.0 43.6 45.7 48.6 20.6 37.8 47.1 Egypt 7.0 7.5 8.3 8.6 6.6 7.3 7.4 7.0 6.0 7.4 6.7 7.6 7.1 7.0 Libya 26.7 25.9 18.2 26.0 27.5 32.1 40.2 43.7 38.7 43.0 38.6 23.6 34.7 40.8 Morocco 4.4 7.7 8.6 9.9 9.5 8.3 9.1 8.2 5.7 7.1 6.7 6.9 8.5 6.9 Tunisia 2.2 2.1 2.5 2.8 3.1 3.3 4.5 4.2 3.7 5.8 4.4 2.3 3.6 5.1
Table 3: Key macroeconomic and fiscal capacity indicators for North Africa, 2000-2010
Source: World Bank national accounts data; OECD National Accounts data files; IMF International Financial Statistics and data files;UNCTADstat database;World Bank Global Development Finance; and Africa Development Indicators.
AfDB E c o n o m i c B r i e f
2 0 1 4 • w w w . a f d b . o r g

A f r i c a n D e v e l o p m e n t B a n k
61
Foreign direct investment, net inflows
Country 2000 2001 2002 2003 2004 2005 2006 2007 2008 2009 2010
Algeria 0.44 1.20 1.07 0.63 0.88 1.08 1.80 1.66 2.60 2.76 2.29
Egypt 1.24 0.51 0.65 0.24 1.25 5.38 10.04 11.58 9.49 6.71 6.39
Libya 0.14 (0.13) 0.15 0.14 0.36 1.04 2.06 4.69 4.11 1.71 3.83
Morocco 0.22 0.14 0.08 2.31 0.79 1.62 2.37 2.81 2.47 1.97 1.24
Tunisia 0.75 0.49 0.82 0.59 0.64 0.72 3.27 1.53 2.64 1.60 1.40
Portfolio investment in equity and bonds, net inflows
Country 2000 2001 2002 2003 2004 2005 2006 2007 2008 2009 2010
Algeria - - - - - - - - - - -
Egypt 0.27 1.54 (0.22) 0.04 (0.07) 1.98 0.50 (2.56) (0.67) 0.39 3.22
Libya - - - - - - - - - - -
Morocco (0.01) (0.04) (0.04) 0.42 0.56 0.02 (0.30) (0.06) (0.44) (0.00) 1.46
Tunisia (0.39) 0.44 0.66 0.65 0.31 0.12 0.01 0.03 (0.04) (0.40) (0.03)
Total private capital, net inflows
Country 2000 2001 2002 2003 2004 2005 2006 2007 2008 2009 2010
Algeria 0.44 1.20 1.07 0.63 0.88 1.08 1.80 1.66 2.60 2.76 2.29
Egypt 1.50 2.05 0.43 0.27 1.18 7.36 10.54 9.02 8.82 7.10 9.61
Libya 0.14 (0.13) 0.15 0.14 0.36 1.04 2.06 4.69 4.11 1.71 3.83
Morocco 0.21 0.11 0.04 2.74 1.34 1.64 2.07 2.74 2.03 1.97 2.70
Tunisia 0.36 0.92 1.48 1.23 0.95 0.85 3.29 1.57 2.60 1.19 1.37
Foreign direct investments, net inflows (% of GDP)
Country 2000 2001 2002 2003 2004 2005 2006 2007 2008 2009 2010
Algeria 0.8 2.2 1.9 0.9 1.0 1.1 1.5 1.2 1.5 2.0 1.4
Egypt 1.2 0.5 0.7 0.3 1.6 6.0 9.3 8.9 5.8 3.6 2.9
Libya 0.4 (0.5) 0.7 0.6 1.1 2.4 3.7 7.5 5.1 4.6 5.4
Morocco 0.6 0.4 0.2 4.6 1.4 2.7 3.6 3.7 2.8 2.2 1.4
Tunisia 3.5 2.2 3.6 2.1 2.1 2.2 9.5 3.9 5.9 3.7 3.2
Total private capital, net inflows (% of GDP)
Country 2000 2001 2002 2003 2004 2005 2006 2007 2008 2009 2010
Algeria 0.8 2.2 1.9 0.9 1.0 1.0 1.5 1.2 1.5 2.0 1.4
Egypt 1.6 2.3 0.5 0.4 1.5 7.8 9.8 6.8 5.4 3.8 4.5
Libya 0.4 (0.5) 0.7 0.6 1.1 2.4 3.7 7.5 5.1 4.6 5.4
Morocco 0.6 0.3 0.1 5.5 2.4 2.8 3.2 3.6 2.3 2.2 2.9
Tunisia 1.7 4.2 6.4 4.5 3.0 2.6 9.6 4.0 5.8 2.7 3.1
Table 4: Private capital flows and investment to North African countries, 2000-2010(amounts in billions of US dollars at current prices unless otherwise stated)
Source: IMF, World Economic Outlook data; World Bank World Development Indicators data; UNCTADstat data.
E c o n o m i c B r i e f
2 0 1 4 • w w w . a f d b . o r g
AfDB
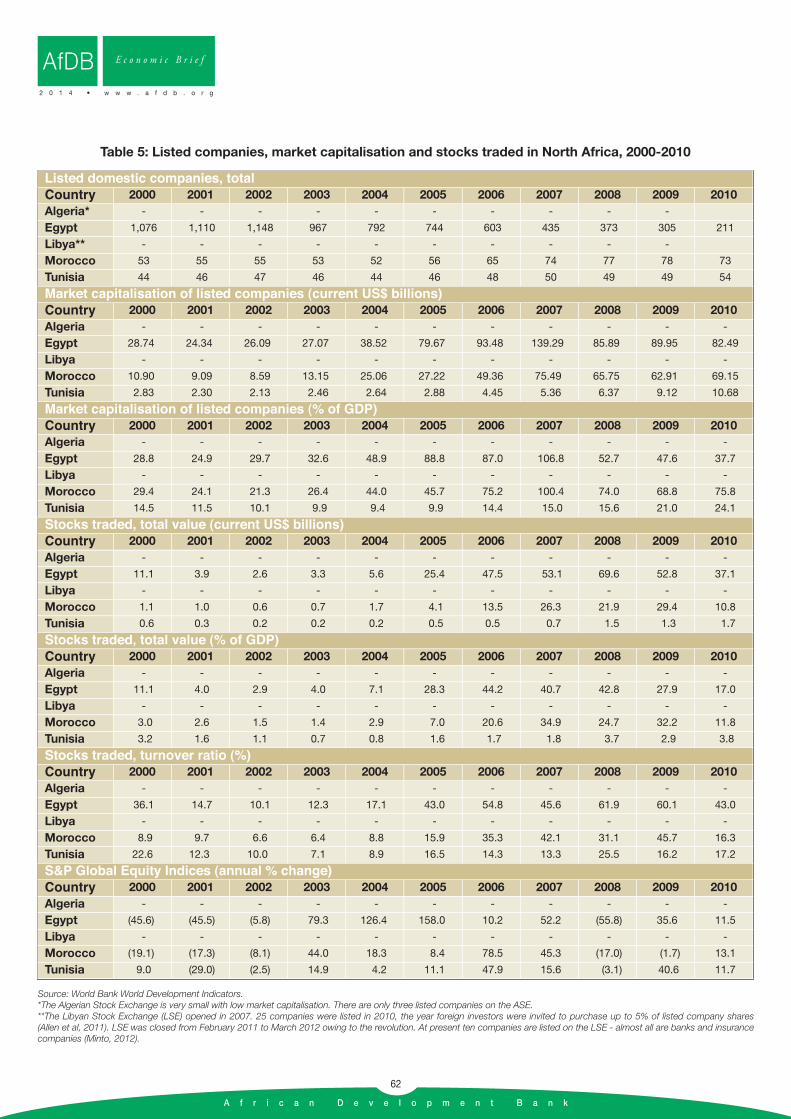
A f r i c a n D e v e l o p m e n t B a n k
62
Listed domestic companies, total
Country 2000 2001 2002 2003 2004 2005 2006 2007 2008 2009 2010Algeria* - - - - - - - - - -
Egypt 1,076 1,110 1,148 967 792 744 603 435 373 305 211
Libya** - - - - - - - - - -
Morocco 53 55 55 53 52 56 65 74 77 78 73
Tunisia 44 46 47 46 44 46 48 50 49 49 54
Market capitalisation of listed companies (current US$ billions)
Country 2000 2001 2002 2003 2004 2005 2006 2007 2008 2009 2010Algeria - - - - - - - - - - -
Egypt 28.74 24.34 26.09 27.07 38.52 79.67 93.48 139.29 85.89 89.95 82.49
Libya - - - - - - - - - - -
Morocco 10.90 9.09 8.59 13.15 25.06 27.22 49.36 75.49 65.75 62.91 69.15
Tunisia 2.83 2.30 2.13 2.46 2.64 2.88 4.45 5.36 6.37 9.12 10.68
Market capitalisation of listed companies (% of GDP)
Country 2000 2001 2002 2003 2004 2005 2006 2007 2008 2009 2010Algeria - - - - - - - - - - -
Egypt 28.8 24.9 29.7 32.6 48.9 88.8 87.0 106.8 52.7 47.6 37.7
Libya - - - - - - - - - - -
Morocco 29.4 24.1 21.3 26.4 44.0 45.7 75.2 100.4 74.0 68.8 75.8
Tunisia 14.5 11.5 10.1 9.9 9.4 9.9 14.4 15.0 15.6 21.0 24.1
Stocks traded, total value (current US$ billions)
Country 2000 2001 2002 2003 2004 2005 2006 2007 2008 2009 2010Algeria - - - - - - - - - - -
Egypt 11.1 3.9 2.6 3.3 5.6 25.4 47.5 53.1 69.6 52.8 37.1
Libya - - - - - - - - - - -
Morocco 1.1 1.0 0.6 0.7 1.7 4.1 13.5 26.3 21.9 29.4 10.8
Tunisia 0.6 0.3 0.2 0.2 0.2 0.5 0.5 0.7 1.5 1.3 1.7
Stocks traded, total value (% of GDP)
Country 2000 2001 2002 2003 2004 2005 2006 2007 2008 2009 2010Algeria - - - - - - - - - - -
Egypt 11.1 4.0 2.9 4.0 7.1 28.3 44.2 40.7 42.8 27.9 17.0
Libya - - - - - - - - - - -
Morocco 3.0 2.6 1.5 1.4 2.9 7.0 20.6 34.9 24.7 32.2 11.8
Tunisia 3.2 1.6 1.1 0.7 0.8 1.6 1.7 1.8 3.7 2.9 3.8
Stocks traded, turnover ratio (%)
Country 2000 2001 2002 2003 2004 2005 2006 2007 2008 2009 2010Algeria - - - - - - - - - - -
Egypt 36.1 14.7 10.1 12.3 17.1 43.0 54.8 45.6 61.9 60.1 43.0
Libya - - - - - - - - - - -
Morocco 8.9 9.7 6.6 6.4 8.8 15.9 35.3 42.1 31.1 45.7 16.3
Tunisia 22.6 12.3 10.0 7.1 8.9 16.5 14.3 13.3 25.5 16.2 17.2
S&P Global Equity Indices (annual % change)
Country 2000 2001 2002 2003 2004 2005 2006 2007 2008 2009 2010Algeria - - - - - - - - - - -
Egypt (45.6) (45.5) (5.8) 79.3 126.4 158.0 10.2 52.2 (55.8) 35.6 11.5
Libya - - - - - - - - - - -
Morocco (19.1) (17.3) (8.1) 44.0 18.3 8.4 78.5 45.3 (17.0) (1.7) 13.1
Tunisia 9.0 (29.0) (2.5) 14.9 4.2 11.1 47.9 15.6 (3.1) 40.6 11.7
Table 5: Listed companies, market capitalisation and stocks traded in North Africa, 2000-2010
Source: World Bank World Development Indicators.*The Algerian Stock Exchange is very small with low market capitalisation. There are only three listed companies on the ASE.**The Libyan Stock Exchange (LSE) opened in 2007. 25 companies were listed in 2010, the year foreign investors were invited to purchase up to 5% of listed company shares (Allen et al, 2011). LSE was closed from February 2011 to March 2012 owing to the revolution. At present ten companies are listed on the LSE - almost all are banks and insurancecompanies (Minto, 2012).
AfDB E c o n o m i c B r i e f
2 0 1 4 • w w w . a f d b . o r g

A f r i c a n D e v e l o p m e n t B a n k
63
Official development assistance, net inflows
Country 2000 2001 2002 2003 2004 2005 2006 2007 2008 2009
Algeria 0.20 0.20 0.19 0.24 0.32 0.35 0.21 0.39 0.32 0.32
Egypt 1.33 1.26 1.23 0.98 1.51 0.99 0.87 1.11 1.34 0.93
Libya 0.01 0.01 0.01 0.01 0.01 0.02 0.04 0.02 0.06 0.04
Morocco 0.42 0.48 0.35 0.55 0.71 0.69 1.04 1.07 1.06 0.91
Tunisia 0.22 0.37 0.22 0.30 0.35 0.36 0.43 0.32 0.33 0.47
Other official flows, net transfers
Country 2000 2001 2002 2003 2004 2005 2006 2007 2008 2009
Algeria (0.24) (0.00) (0.21) (0.26) (1.58) (1.51) (4.34) (0.15) (0.28) (0.20)
Egypt 0.04 0.22 0.13 0.20 0.54 1.07 0.31 1.51 0.31 0.67
Libya - - - - - - - - - -
Morocco (0.14) (0.31) (0.15) (0.67) (0.23) 0.34 0.21 0.29 0.41 0.38
Tunisia (0.02) 0.31 0.17 0.12 0.17 (0.07) (0.33) 0.22 (0.17) 0.26
Total net official flows
Country 2000 2001 2002 2003 2004 2005 2006 2007 2008 2009
Algeria (0.04) 0.20 (0.02) (0.03) (1.26) (1.16) (4.13) 0.24 0.04 0.12
Egypt 1.37 1.49 1.36 1.18 2.04 2.06 1.18 2.62 1.66 1.59
Libya 0.01 0.01 0.01 0.01 0.01 0.02 0.04 0.02 0.06 0.04
Morocco 0.28 0.17 0.21 (0.12) 0.48 1.03 1.25 1.36 1.47 1.30
Tunisia 0.21 0.68 0.39 0.42 0.53 0.29 0.10 0.54 0.17 0.74
Official development assistance, net inflows (% of GDP)
Country 2000 2001 2002 2003 2004 2005 2006 2007 2008 2009
Algeria 0.4 0.4 0.3 0.3 0.4 0.3 0.2 0.3 0.2 0.2
Egypt 1.3 1.3 1.4 1.2 1.9 1.1 0.8 0.8 0.8 0.5
Libya 0.0 0.0 0.0 0.0 0.0 0.1 0.1 0.0 0.1 0.1
Morocco 1.1 1.3 0.9 1.1 1.2 1.2 1.6 1.4 1.2 1.0
Tunisia 1.1 1.8 1.0 1.2 1.3 1.3 1.4 0.9 0.8 1.2
Total net official flows (% of GDP)
Country 2000 2001 2002 2003 2004 2005 2006 2007 2008 2009
Algeria (0.1) 0.4 (0.0) (0.0) (1.5) (1.1) (3.5) 0.2 0.0 0.1
Egypt 1.4 1.6 1.6 1.6 2.6 2.2 1.1 2.0 1.0 0.8
Libya 0.0 0.0 0.0 0.0 0.0 0.1 0.1 0.0 0.1 0.1
Morocco 0.7 0.5 0.5 (0.2) 0.8 1.7 1.9 1.8 1.7 1.4
Tunisia 1.0 3.1 1.7 1.5 1.7 0.9 0.3 1.4 0.4 1.7
Table 6: Official development assistance and other official flows to North African countries, 2000-2009(amounts in billions of US dollars at current prices unless otherwise stated)
Sources: IMF, World Economic Outlook data; World Bank, World Development Indicators data; UNCTADstat data.'Other official flows' are transactions by the official sector whose grant element is below the 25% threshold which would make them eligible to be recorded as ODA. The categoryincludes official export credits, official sector equity and portfolio investment, and debt reorganisation undertaken by the official sector at non-concessional terms.
E c o n o m i c B r i e f
2 0 1 4 • w w w . a f d b . o r g
AfDB

A f r i c a n D e v e l o p m e n t B a n k
64
Algeria Egypt Libya Morocco Tunisia
EXPORTS 2000 2002 2007 2010 2000 2002 2007 2010 2000 2002 2007 2010 2000 2002 2007 2010 2000 2002 2007 2010
Fuels 98.1 96.9 98.4 98.3 43.1 37.1 62.4 28.8 94.6 94.8 96.2 95.8 4.1 3.6 4.6 3.9 12.1 9.4 16.6 15.2
Agricultural rawmaterials
0.0 0.0 0.0 0.0 5.2 8.9 2.0 2.9 0.1 0.1 0.0 0.0 2.0 1.5 1.3 1.6 0.7 0.7 0.5 0.6
Food products 0.2 0.2 0.2 0.6 8.2 9.6 9.4 16.6 0.3 0.1 0.1 0.3 20.9 21.9 20.8 20.4 8.7 6.8 9.8 9.8
Minerals, oresand metals
0.3 0.4 0.5 0.3 4.0 5.1 3.3 6.0 0.0 0.1 0.2 0.1 8.6 7.6 9.8 11.4 1.5 1.4 1.4 1.9
Precious stones and non-monetarygold
0.0 0.0 0.0 0.0 0.0 0.5 0.7 3.9 0.0 0.1 0.5 0.8 0.1 0.3 0.0 0.6 0.1 0.1 0.0 0.0
Manufacturedproducts
1.4 2.5 0.9 0.8 39.5 38.8 22.2 41.8 4.9 4.8 3.0 2.9 64.4 65.1 63.5 62.1 76.9 81.6 71.7 72.4
Total 100.0 100.0 100.0 100.0 100.0 100.0 100.0 100.0 100.0 100.0 100.0 100.0 100.0 100.0 100.0 100.0 100.0 100.0 100.0 100.0
IMPORTS 2000 2002 2007 2010 2000 2002 2007 2010 2000 2002 2007 2010 2000 2002 2007 2010 2000 2002 2007 2010
Fuels 1.4 1.2 1.1 2.1 7.9 4.4 17.4 13.4 7.8 5.7 10.8 9.4 17.7 15.5 20.0 23.0 10.5 9.4 12.9 10.9
Agricultural rawmaterials
2.6 2.1 2.3 1.6 5.1 4.9 4.4 3.2 0.5 0.4 0.8 0.7 3.1 3.3 2.6 2.2 3.1 2.9 2.2 2.1
Food products 28.2 25.1 19.8 16.3 26.4 30.9 24.1 19.1 23.8 18.5 17.3 17.0 13.7 14.0 12.3 11.5 8.2 10.3 9.9 8.5
Minerals, oresand metals
1.2 1.3 1.9 1.5 2.5 3.7 4.1 4.2 2.4 1.7 2.5 3.0 2.5 2.5 3.5 3.3 2.5 2.2 3.5 4.2
Precious stones and non-monetarygold
0.0 0.0 0.0 0.0 0.1 0.0 0.0 0.1 0.2 0.0 0.1 0.1 0.1 0.2 0.1 0.0 0.2 0.4 0.2 0.1
Manufacturedproducts
66.6 70.3 74.9 78.4 58.0 56.1 50.0 59.9 65.3 73.7 68.5 69.7 62.9 64.5 61.5 60.0 75.4 74.8 71.3 74.2
Total 100.0 100.0 100.0 100.0 100.0 100.0 100.0 100.0 100.0 100.0 100.0 100.0 100.0 100.0 100.0 100.0 100.0 100.0 100.0 100.0
Table 7: Structure of foreign trade in North Africa by broad product categories, 2000-2010(figures shown represent percentage of total trade)
Source: Author's computations from UNCTADstat data. Data for Morocco includes Western Sahara.
AfDB E c o n o m i c B r i e f
2 0 1 4 • w w w . a f d b . o r g

A f r i c a n D e v e l o p m e n t B a n k
65
Algeria Egypt Libya Morocco Tunisia
Agriculture 2000 2005 2010 2000 2005 2010 2000 2005 2010 2000 2005 2010 2000 2005 2010
Agriculture, hunting, forestry, fishing
8.8 8.1 7.9 13.5 14.1 14.0 6.5 2.2 2.7 14.2 14.7 14.2 11.1 10.1 7.9
Sub-total 8.8 8.1 7.9 13.5 14.1 14.0 6.5 2.2 2.7 14.2 14.7 14.2 11.1 10.1 7.9
Industry 2000 2005 2010 2000 2005 2010 2000 2005 2010 2000 2005 2010 2000 2005 2010
Mining and quarrying 0.1 0.1 0.2 9.4 13.8 14.5 0.2 0.2 0.2 2.0 1.9 3.7 0.7 0.7 1.0
Electricity, gas and water 1.0 1.0 1.0 0.9 1.3 1.6 1.3 1.3 1.5 3.4 3.1 2.9 6.2 6.2 8.2
Manufacturing 6.0 4.7 4.2 17.5 17.0 16.9 5.5 4.7 4.9 17.5 16.6 14.4 18.1 17.3 17.7
Hydrocarbon/oil 42.2 47.4 42.4 0.0 0.0 0.0 52.7 65.6 60.6 0.0 0.0 0.0 0.0 0.0 0.0
Construction 7.4 7.0 8.8 4.6 4.1 4.6 7.0 3.9 5.7 4.9 6.7 6.3 4.8 5.0 4.8
Sub-total 56.7 60.2 56.6 32.4 36.1 37.6 66.6 75.7 72.9 27.7 28.3 27.3 29.8 29.2 31.7
Services 2000 2005 2010 2000 2005 2010 2000 2005 2010 2000 2005 2010 2000 2005 2010
Wholesale, retail trade, restaurants and hotels
12.2 12.1 11.3 16.8 15.9 15.1 6.3 3.9 3.8 15.8 14.6 13.4 15.0 14.7 14.1
Transport, storage and communications
7.0 9.0 9.4 8.3 9.2 9.6 6.0 3.6 3.9 6.6 7.3 7.1 11.7 13.2 13.2
Finance, real estate and business services
1.9 1.9 2.0 10.1 9.9 9.7 7.5 7.5 8.4 15.2 17.5 23.5 0.0 0.0 0.0
General government services (admin, educ,health)
13.5 8.7 12.8 12.0 10.0 10.0 7.0 7.0 8.2 10.5 10.1 10.0 16.4 16.8 16.4
Other services 0.0 0.0 0.0 7.0 4.8 4.0 0.1 0.1 0.1 10.0 7.5 4.5 16.0 16.0 16.8
Sub-total 34.6 31.7 35.5 54.2 49.8 48.4 26.9 22.1 24.4 58.0 57.0 58.6 59.1 60.7 60.5
Total 100.0 100.0 100.0 100.0 100.0 100.0 100.0 100.0 100.0 100.0 100.0 100.0 100.0 100.0 100.0
Table 8: Sectoral contribution to GDP by broad sectors, 2000-2010(figures shown represent percentage of GDP)
Source: UNCTADstat and African Economic Outlook 2011 data. Data for Morocco includes Western Sahara.
E c o n o m i c B r i e f
2 0 1 4 • w w w . a f d b . o r g
AfDB

A f r i c a n D e v e l o p m e n t B a n k
66
Firms using banks to finance investment (% of firms)Country 2000 2001 2002 2003 2004 2005 2006 2007 2008 2009 2010Algeria - - 27.16 - - - - 8.88 - - -
Egypt - - - - 10.50 - - 8.67 5.57 - -
Libya - - - - - - - - - - -
Morocco - - - - 26.48 - - 12.29 - - -
Tunisia - - - - - - - - - - -
Domestic credit to private sector (% of GDP)Country 2000 2001 2002 2003 2004 2005 2006 2007 2008 2009 2010Algeria 6.0 8.0 12.2 11.4 11.2 12.1 12.3 13.4 13.2 16,2 15.8
Egypt 52.0 54.9 54.7 53.9 54.0 51.2 49.3 45.5 42.8 36.1 33.1
Libya 23.1 23.5 17.8 14.0 10.3 7.7 6.6 6.0 6.8 10.9 -
Morocco 51.0 44.3 43.4 42.4 42.6 46.2 48.6 58.4 63.2 64.7 68.8
Tunisia 60.0 61.5 62.3 60.7 59.0 58.3 57.3 57.8 59.9 62.2 68.8
Financing via international capital markets (gross inflows, % of GDP)Country 2000 2001 2002 2003 2004 2005 2006 2007 2008 2009 2010Algeria - 0.0 0.3 0.2 0.1 - 0.0 - 1.0 0.0 0.1
Egypt 1.1 2.1 0.8 2.9 0.8 6.8 1.4 2.0 3.3 1.4 3.7
Libya - - - - - - - 0.0 - - -
Morocco 0.2 0.0 - 0.9 1.4 - 0.4 2.4 0.5 - 1.5
Tunisia 2.9 2.6 3.9 1.8 3.3 2.0 1.4 1.2 0.4 0.0 0.2
Emerging Market Bond Index Global Yield Spreads (basis points)Country 2000 2001 2002 2003 2004 2005 2006 2007 2008 2009 2010Egypt - - - - - - 52 178 385 -3 221
Table 9: Access to finance for sovereign and corporate borrowers in North Africa, 2000-2010
Table 10: Ease of Doing Business rankings for North African countries, 2006-2012
Table 11: Workers' remittances to North African countries, 2000-2010
Source: World Bank World Development Indicators; International Monetary Fund (2012).
Source: World Bank World Development Indicators
Source: World Bank Doing Business surveys (various years).Figures shown represent rankings out of 155 economies in 2006, 175 in 2007, 178 in 2008, 181 in 2009, and 183 economies from 2010 to 2012.
Ease of Doing Business ranking
Country 2006 2007 2008 2009 2010 2011 2012
Algeria 123 116 125 134 136 143 148
Egypt 165 165 126 116 106 108 110
Libya - - - - - - - Morocco 117 115 129 130 128 115 94
Tunisia 77 80 88 73 69 40 46
Migrant remittance inflows (current US$ billions)Country 2000 2001 2002 2003 2004 2005 2006 2007 2008 2009 2010Algeria 0.8 0.7 1.1 1.8 2.5 2.1 1.6 2.1 2.2 2.1 2.0
Egypt 2.9 2.9 2.9 3.0 3.3 5.0 5.3 7.7 8.7 7.1 7.7
Libya - - - - - - - - - - -
Morocco 2.2 3.3 2.9 3.6 4.2 4.6 5.5 6.7 6.9 6.3 6.5
Tunisia 0.8 0.9 1.1 1.3 1.4 1.4 1.5 1.7 2.0 2.0 2.0
Migrant remittance inflows (% of GDP)Country 2000 2001 2002 2003 2004 2005 2006 2007 2008 2009 2010Algeria 1.4 1.2 1.9 2.6 2.9 2.0 1.4 1.6 1.3 1.5 1.3
Egypt 2.9 3.0 3.3 3.6 4.2 5.6 5.0 5.9 5.3 3.8 3.5
Libya - - - - - - - - - - -
Morocco 5.8 8.6 7.1 7.3 7.4 7.7 8.3 8.9 7.8 6.9 7.1
Tunisia 4.1 4.6 5.1 5.0 5.1 4.8 4.9 4.8 4.8 5.0 4.4
AfDB E c o n o m i c B r i e f
2 0 1 4 • w w w . a f d b . o r g

A f r i c a n D e v e l o p m e n t B a n k
67
Country
Price-oriented policies Supply-oriented policies Social policies
Reducedimporttariffs orothertaxes onfood
Exportrestrictions(price/quantity)
Pricecontrolson food
Public procurement
and managementof food reserves
Minimumsupportprices forfarmers
Productionor inputsubsidiesto farmers
Otherproductionsupport
Consumerfood andfuel
subsidies
Targetedcash
transfers
Food aid(ration
cards) andschoolfeedingschemes
Publicsectorwages/benefit increases
Algeria X X X X X X
Egypt X X X X X X X
Libya X X X X X
Morocco X X X X X X
Tunisia X X X X X X X
Table 12: Policy measures taken by North African governments in response to the world food crisis, 2006-2008
Table 13: Policy measures taken by North African governments in response to the global financial crisis,2008-2010
Source: IFPRI (2008); Kamara et al (2009: 27); FAO (2009); Saif (2008); Jones et al (2009); World Bank (2009b).
Source: UNECA and AU Commission (2009); Kasekende et al (2010); Jebnoun and Zarrouk (2012); Jones et al (2009); IMF (2010)Chemingui and Sanchez (2011); World Bank (2010); World Trade Indicators 2009/10; African Economic Outlook 2011
MONETARY POLICY
Country
Changesto key
interest rates
Change inminimum reserverequirements
Recapitalisationof banks and
liquidity injections
State guaranteeof commercialbank deposits
Strengthening offinancial marketregulations
Algeria X X
Egypt X X X
Libya X X X X
Morocco X X X X
Tunisia X X X
FISCAL POLICY
Country
Infrastructuredevelopment
Measures toimprove accessto credit for firms
Lowering customsduties, exportfees and taxes
Simplificationof customs andtax processes
Subsidies, tax breaksand other support for major export firms
Algeria X X X X
Egypt X X X X X
Libya X X X X X
Morocco X X X X
Tunisia X X X X X
SOCIAL POLICY
Country
Increase inpublic sectorwages/benefits
Increase inprivate sectorwages/benefits
Youth-centred andgeneral active labour market programmes
Increase in or non-reduction of socialtransfers & subsidies
Changes toconsumer creditarrangements
Algeria X X X X X
Egypt X X X
Libya X X
Morocco X X X X
Tunisia X X X
E c o n o m i c B r i e f
2 0 1 4 • w w w . a f d b . o r g
AfDB

A f r i c a n D e v e l o p m e n t B a n k
68
Algeria Total cost % of GDP
All subsidies 18.8 13.5
Egypt Total cost % of GDP
Food 3.8 2.0
Energy 11.3 6.0
Other 0.5 0.3
Morocco Total cost % of GDP
Food 0.6 0.7
Fuel 1.0 1.1
Tunisia Total cost % of GDP
Food 0.5 1.2
Energy 0.4 1.0
Transport 0.2 0.4
Table 14: Cost of subsidies provided by North African governments in 2009(amounts in billions of US dollars at current prices unless otherwise stated)
Source: World Bank (2011a: 14).
Greece Italy, Spain,Portugal, Ireland
Germany, France,
United Kingdom
Euro area EU27 USA Total EUandUSA
Exports to: 2000 2007 2010 2000 2007 2010 2000 2007 2010 2000 2007 2010 2000 2007 2010 2000 2007 2010 2010
Algeria 0.5 0.3 0.5 31.8 23.7 27.5 19.5 9.9 9.6 60.0 40.9 46.4 63.1 43.6 49.1 15.6 30.1 24.2 73.3
Egypt 1.8 1.1 1.1 24.0 21.2 15.6 13.2 8.3 9.1 37.7 26.1 26.2 40.9 29.1 30.3 10.2 7.5 6.1 36.4
Libya 2.1 2.6 3.3 55.8 50.5 45.6 24.4 20.4 24.2 83.0 75.2 73.6 85.4 77.8 77.4 0.0 7.8 4.7 82.1
Morocco 0.7 0.9 0.1 19.7 28.8 24.0 45.5 32.3 26.3 61.7 61.9 54.0 72.1 68.4 58.4 0.0 3.2 4.1 62.5
Tunisia 0.3 0.2 0.1 30.0 29.6 22.6 43.1 45.8 41.8 77.4 74.4 65.9 80.3 79.3 72.9 0.0 1.1 2.5 75.4
Table 15: North African countries' trade dependence on Europe and USA, selected years, 2000-2010(figures shown represent percentage of total trade)
Source: Author's computations from UNCTADstat data. Data for Morocco includes Western Sahara.
AfDB E c o n o m i c B r i e f
2 0 1 4 • w w w . a f d b . o r g

A f r i c a n D e v e l o p m e n t B a n k
69
China India Brazil Turkey Asian NICs North Africa League ofArab States
Exports to: 2000 2007 2010 2000 2007 2010 2000 2007 2010 2000 2007 2010 2000 2007 2010 2000 2007 2010 2000 2007 2010
Algeria 0.1 1.8 2.1 0.2 2.6 2.7 6.8 3.0 4.2 6.1 3.4 4.7 0.7 2.1 2.3 1.2 1.9 3.0 1.4 2.1 3.5
Egypt 1.0 1.0 1.7 4.0 14.5 4.8 0.7 0.2 0.7 2.1 3.5 3.9 5.1 4.5 5.1 2.6 3.7 7.9 12.8 15.3 31.4
Libya 0.2 2.8 7.6 0.1 1.6 1.1 0.1 0.6 0.2 5.6 1.9 2.0 0.4 1.3 0.7 3.2 2.0 2.2 4.1 3.1 3.7
Morocco 0.6 1.7 2.2 4.2 3.4 5.2 1.0 3.3 3.9 0.8 1.1 2.2 2.1 3.0 4.0 1.8 1.4 2.0 3.5 3.3 4.6
Tunisia 0.0 0.1 0.7 1.9 1.0 1.8 0.5 0.8 0.8 1.0 1.2 1.7 0.3 0.2 0.6 5.6 8.2 11.9 7.4 9.1 13.3
Table 16: North African countries' trade with selected emerging market economies, 2000-2010(figures shown represent percentage of total trade)
Source: Author's computations from UNCTADstat data. Data for Morocco includes Western Sahara.'Asian NICs' includes Hong Kong, Taiwan, Republic of Korea, Indonesia (including East Timor), Malaysia, Philippines and Thailand.'North Africa' includes Algeria, Egypt, Libya, Morocco and Tunisia.'League of Arab States' includes Algeria, Bahrain, Comoros, Djibouti, Egypt, Iraq, Jordan, Kuwait, Lebanon, Libya, Mauritania, Morocco, Occupied Palestinian Territory, Oman, Qatar,Saudi Arabia, Somalia, Sudan, Syria, Tunisia, United Arab Emirates and Yemen.
Country Startdate
End date*
Protestors' maindemands
Level ofviolence**
Event markingofficial end
Final outcome
Parliamentaryelectiondate
Algeria 29-Dec-10 15-Mar-11Lower food prices, morejobs/housing, end to emergencyrule
Low Social reforms passed Non-transition
Egypt 25-Jan-11 21-Nov-11Better living standards, jobs foreducated youth, political reforms
Medium Military resigned Transition 28-Nov-11
Libya 17-Feb-11 20-Oct-11Comprehensive economic andpolitical reforms
High Gaddafi captured Transition 19-Jun-12
Morocco 20-Feb-11 01-Jul-11Lower food prices, lower unem-ployment, political reforms
LowNew constitution
passedNon-transition
Tunisia 18-Dec-10 14-Jan-11Lower unemployment, betterliving standards, political reforms
Medium Ben Ali fled country Transition 23-Oct-11
Table 17: Characteristics of the Arab Spring uprisings in North Africa
Sources: Uppsala Conflict Data Program (2011) 'Arabian Spring 2010-11: background narrative’ ; Zoubir (2011); El Amrani (2012).*End date for Egypt signifies when the military resigned, not when President Mubarak resigned (which was 11 February 2011).**Level of violence is measured by the number of human casualties (Low=less than 100; Medium=100 to 999; High=over 1000), as reported by Rettig (2011).
E c o n o m i c B r i e f
2 0 1 4 • w w w . a f d b . o r g
AfDB
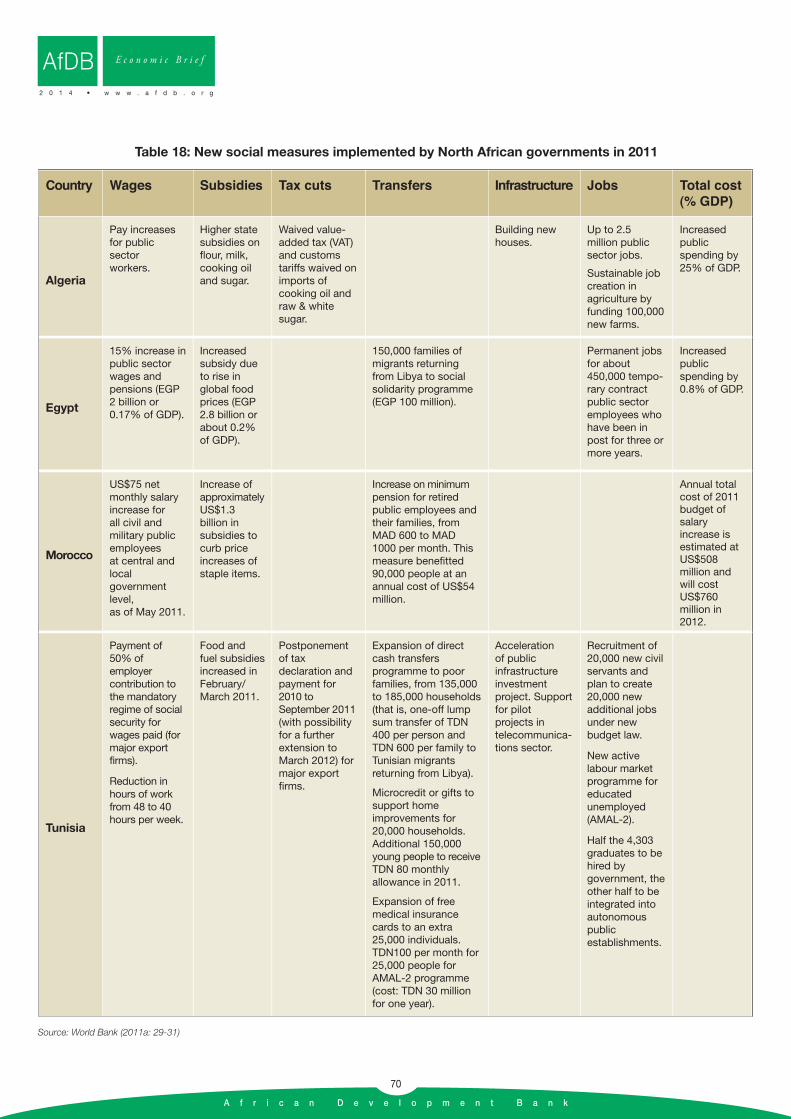
A f r i c a n D e v e l o p m e n t B a n k
70
Table 18: New social measures implemented by North African governments in 2011
Source: World Bank (2011a: 29-31)
Country Wages Subsidies Tax cuts Transfers Infrastructure Jobs Total cost
(% GDP)
Algeria
Pay increasesfor publicsector workers.
Higher statesubsidies onflour, milk,cooking oiland sugar.
Waived value-added tax (VAT)and customs tariffs waived onimports of cooking oil andraw & whitesugar.
Building newhouses.
Up to 2.5 million publicsector jobs.
Sustainable jobcreation in agriculture byfunding 100,000new farms.
Increasedpublicspending by25% of GDP.
Egypt
15% increase in public sectorwages andpensions (EGP 2 billion or0.17% of GDP).
Increasedsubsidy dueto rise in global foodprices (EGP2.8 billion orabout 0.2%of GDP).
150,000 families of migrants returningfrom Libya to socialsolidarity programme(EGP 100 million).
Permanent jobsfor about450,000 tempo-rary contractpublic sectoremployees whohave been inpost for three ormore years.
Increasedpublic spending by0.8% of GDP.
Morocco
US$75 netmonthly salaryincrease for all civil and military publicemployees at central andlocal governmentlevel, as of May 2011.
Increase of approximatelyUS$1.3 billion in subsidies tocurb price increases ofstaple items.
Increase on minimumpension for retired public employees andtheir families, fromMAD 600 to MAD1000 per month. Thismeasure benefitted90,000 people at an annual cost of US$54million.
Annual totalcost of 2011budget of salary increase isestimated atUS$508 million andwill costUS$760 million in2012.
Tunisia
Payment of50% of employer contribution tothe mandatory regime of social security forwages paid (formajor exportfirms).
Reduction inhours of workfrom 48 to 40hours per week.
Food andfuel subsidies increased inFebruary/March 2011.
Postponementof tax declaration andpayment for2010 to September 2011(with possibilityfor a further extension toMarch 2012) formajor exportfirms.
Expansion of directcash transfers programme to poor families, from 135,000to 185,000 households(that is, one-off lumpsum transfer of TDN400 per person andTDN 600 per family toTunisian migrantsreturning from Libya).
Microcredit or gifts tosupport home improvements for20,000 households.Additional 150,000young people to receiveTDN 80 monthly allowance in 2011.
Expansion of free medical insurancecards to an extra25,000 individuals.TDN100 per month for25,000 people forAMAL-2 programme(cost: TDN 30 millionfor one year).
Acceleration of public infrastructure investment project. Supportfor pilot projects in telecommunica-tions sector.
Recruitment of20,000 new civilservants andplan to create20,000 new additional jobsunder new budget law.
New active labour marketprogramme foreducated unemployed(AMAL-2).
Half the 4,303 graduates to behired by government, theother half to beintegrated intoautonomous public establishments.
AfDB E c o n o m i c B r i e f
2 0 1 4 • w w w . a f d b . o r g

A f r i c a n D e v e l o p m e n t B a n k
71
Debtorcountries
Main creditor countries Total foreign debt(trillions of euros)
Foreign debtto GDP (%)France Germany UK USA
Greece 41.4 15.9 9.4 6.2 0.4 252
Italy 309.0 120.0 54.7 34.8 2.0 163
Spain 112.0 131.7 74.9 49.6 1.9 284
Portugal 19.1 26.6 18.9 3.9 0.4 251
Ireland 23.8 82.0 104.5 39.8 1.7 1,093
Total due 505.3 376.2 262.4 134.3 6.4
Table 19: Eurozone debt crisis - key euro area debtors and their top creditors(amounts in billions of euros unless otherwise stated)
Source: BBC News (2011).Figures reflect debt owed by governments and individuals in debtor country to banks in creditor country on 30 June 2011.
Table 20: Vulnerability of North African countries to the eurozone debt crisis
Source: adapted from Table 2 in Massa et al (2011: 5).High vulnerability areas (defined as >50%) are highlighted in red.* Figures for Egypt from Ibrahim (2011); Morocco & Tunisia from De Bock et al (2010).** Figures for Egypt and Libya from AfDB et al (2011b; 2011d); Morocco and Tunisia from De Bock et al (2010: 7).*** Figures for Algeria from EIB (2005); Egypt from Zohry (2011); Morocco and Tunisia from De Bock et al (2010: 7).**** Fiscal space: fiscal balance/GDP (%); 2011 levels from IMF (2011b).***** Current account balance/GDP (%): 2011 levels from IMF (2012b).****** Gross public debt: gross public debt/GDP (%); 2011 levels based on projections from IMF (2011a: 94).******* Gross official reserves from IMF (2011a: 100); 2011 figures based on IMF projections.
Key indicator Algeria Egypt Libya Morocco Tunisia
Trade dependence on EU 49% 30% 77% 58% 73%
Tourism dependence on EU* - 75% - 79% 85%
FDI dependence on EU** - 61% >50% 80% 58%
Remittances dependence on EU*** 95% 12% - 87% 88%
Fiscal balance (surplus/deficit) deficit deficit - deficit deficit
Fiscal space in 2011 compared to 2009**** improved worsened - worsened worsened
Current account balance (surplus/deficit) surplus deficit - deficit deficit
Current account balance in 2011 compared to 2009***** improved improved - worsened worsened
Gross public debt in 2011 compared to 2009****** worsened worsened - worsened improved
Official reserves in 2011 compared to 2009******* improved worsened - worsened worsened
E c o n o m i c B r i e f
2 0 1 4 • w w w . a f d b . o r g
AfDB

A f r i c a n D e v e l o p m e n t B a n k
72
Country
Import partners Export partners
2000 % of trade 2010 % of trade 2000 % of trade 2010 % of trade
Algeria France 24 France 15 Italy 20 USA 24
USA 11 China 11 USA 16 Italy 15
Italy 9 Italy 10 France 13 Spain 10
Germany 8 Spain 6 Spain 11 Netherlands 7
Spain 6 Germany 6 Netherlands 8 France 7
Top 5 total 58 Top 5 total 48 Top 5 total 68 Top 5 total 63
Egypt USA 16 USA 9 Italy 19 Italy 9
Germany 9 China 9 USA 10 Spain 6
Saudi Arabia 8 Germany 8 Netherlands 8 Saudi Arabia 6
Italy 7 Italy 6 France 7 USA 6
China 5 Saudi Arabia 4 Israel 7 India 5
Top 5 total 45 Top 5 total 36 Top 5 total 51 Top 5 total 32
Libya Italy 26 Italy 16 Italy 43 Italy 34
Germany 10 China 10 Germany 18 France 11
UK 8 Turkey 10 Spain 12 Germany 9
France 7 Rep of Korea 7 Turkey 6 Spain 9
Tunisia 5 France 7 France 4 China 8
Top 5 total 56 Top 5 total 50 Top 5 total 83 Top 5 total 71
Morocco France 24 France 16 France 31 France 20
Spain 10 Spain 11 Spain 12 Spain 19
UK 6 China 8 UK 9 India 5
USA 6 USA 7 Italy 7 Italy 4
Saudi Arabia 5 Saudi Arabia 6 Germany 6 USA 4
Top 5 total 51 Top 5 total 48 Top 5 total 65 Top 5 total 52
Tunisia France 27 France 21 France 28 France 27
Italy 19 Italy 21 Italy 24 Italy 17
Germany 10 Germany 9 Germany 13 Germany 10
USA 5 Spain 5 Spain 6 Libya 6
Spain 4 China 5 Belgium 5 UK 6
Top 5 total 65 Top 5 total 61 Top 5 total 76 Top 5 total 66
Table 21: North African countries' top five merchandise trade partners, 2000 and 2010(figures shown represent percentage of total trade)
Source: Author's computations from UNCTADstat data. Data for Morocco includes Western Sahara.
AfDB E c o n o m i c B r i e f
2 0 1 4 • w w w . a f d b . o r g

A f r i c a n D e v e l o p m e n t B a n k
73
Foreign bank presence in North Africa (% of total banks)
Country 2000 2001 2002 2003 2004 2005 2006 2007 2008 2009
Algeria 45 56 53 53 53 57 57 64 64 64
Egypt 16 19 19 19 19 24 44 52 52 52
Libya* - - - - - - - - - -
Morocco 38 38 33 40 44 40 40 40 40 50
Tunisia 38 38 44 44 44 50 50 50 50 50
Foreign bank assets (% of total bank assets)
Country 2000 2001 2002 2003 2004 2005 2006 2007 2008 2009
Algeria - - - - 5 8 8 7 8 14
Egypt - - - - 10 12 21 25 25 23
Libya - - - - - - - - - -
Morocco - - - - - - - 19 18 34
Tunisia - - - - 20 29 27 27 28 -
Table 22: Foreign exposure of banks in North Africa, 2000-2009
Source: Claessens and van Horen (2012)* In August 2010, Italian bank Unicredit became the first foreign bank to set up a subsidiary in Libya (Allen et al, 2011).
E c o n o m i c B r i e f
2 0 1 4 • w w w . a f d b . o r g
AfDB

A f r i c a n D e v e l o p m e n t B a n k
74
Table 23: Systemic vulnerabilities and factors contributing to growth and crisis resilience in North Africa
Country
Systemic vulnerabilities and other threats to crisis resilience andinclusive growth
Factors that havecontributed to growth and crisis resilience over past
decade
Structuralvulnerabilities
Worldcommodity
price exposure
Europeanexposure
Other areas of weakness/ threats to crisis resilience/inclusive growth
Algeria
Merchandise trade dependence
Export concentration (oil)
Food import dependence
Fuel (exports)
Food (imports)
Trade
Remittances
Weak private sector
Weak human capital
Oil depletion
Climate change/water scarcity
Valuable natural resources (oil)
Political stability (survived Arab Spring)
Long-term investment in agriculture
Prudent macroeconomic management
Trade liberalisation and privatisation
Egypt
FDI dependence
Remittance dependence
Food import dependence(high)
Fuel import dependence
Food and fuel(imports)
Tourism
FDI
Political uncertainty
Weak fiscal capacity
Weak private sector
Weak human capital
Climate change/water scarcity
Tourism
Diversified economic sectors
Diversified trade partners
Investment in agricultural land abroad
Prudent macroeconomic management
Trade liberalisation and privatisation
Libya
Merchandise tradedependence
FDI dependence
Export concentration (oil)
Food import dependence
Fuel (exports)
Food (imports)
Trade
FDI
Political uncertainty
Weak private sector
Weak human capital
Oil depletion
Climate change/water scarcity
Valuable natural resources (oil)
Investment in agricultural land abroad
Prudent macroeconomic management
Trade liberalisation and privatisation
Morocco
Merchandise trade dependence
FDI dependence
Remittance dependence
Export concentration (manufacturing)
Food import dependence
Fuel import dependence(high)
Food and fuel(imports)
Trade
Tourism
FDI
Remittances
Weak fiscal capacity
Weak private sector
Weak human capital
Climate change/water scarcity
Tourism
Diversified economic sectors
Political stability (survived Arab Spring)
Valuable natural resources (phosphates)
Long-term investment in agriculture
Long-term investment in renewableenergy
Prudent macroeconomic management
Trade liberalisation and privatisation
Tunisia
Merchandise trade dependence
FDI dependence
Remittance dependence
Export concentration(manufacturing)
Food import dependence
Fuel import dependence
Food and fuel(imports)
Trade
Tourism
FDI
Remittances
Political uncertainty
Weak fiscal capacity
Weak private sector
Weak human capital
Climate change/water scarcity
Tourism
Diversified economic sectors
Regional trade partners
Prudent macroeconomic management
Trade liberalisation and privatisation
AfDB E c o n o m i c B r i e f
2 0 1 4 • w w w . a f d b . o r g

A f r i c a n D e v e l o p m e n t B a n k
75
Key challenges Specific measures Relevant country example(s)
To build adaptive capacity insectors/groups that have been
damaged over time
Dedicated support for SMEs Taiwan SME support
Measures to reduce poverty and inequality Argentina Plan Jefes/Trabajar
Measures to reduce unemploymentArgentina Plan Jefes/Trabajar
Taiwan SME support
To create a sustainable basis for sustained rapid growth
Improvements in the investment climateEstonia post-transition reformsAssociated measures (Taiwan)
Improvements in the standard of educational provision Associated measures (Argentina/Estonia)
Broadening the economic sectors contributing to growth
Taiwan SME supportEstonia post-transition reforms
To reduce vulnerability to trade/capital shocks
Measures to supportdomestic economic development
Taiwan SME support
Diversification of trade and financial partners Associated measures (Estonia)
Table 24: Key challenges facing North Africa and Section 4 country examples relating to those issues
E c o n o m i c B r i e f
2 0 1 4 • w w w . a f d b . o r g
AfDB

A f r i c a n D e v e l o p m e n t B a n k
© 2010 - AfDB - Design, External Relations and Com
munication Unit/YAL