Embed Size (px)
Citation preview

Aegis Group
Aegis Group plc is the global media communications and market research group employing approximately 8,000 staff in over 60 countries. Headquartered in London and listed on the London Stock Exchange (AGS.L) the Group is structured around
two core business areas: Aegis Media, which includes Carat, Vizeum, MMA, Isobar and Posterscope and a range of communications businesses; and Synovate, which
is a leading global market research company

Global access to local insights
Offices Countries Staff Revenue
108 60 8,000+ $574m

Synovate in Hungary
A hub for Hungary, Czech Republic and Slovakia
Office established in 1991
Around 40 full-time staff, 15 researchers
58,140 interviews, 395 focus groups and in-depth interviews in 2005
Regional coordinating centre for Central Europe

Business Climate Barometer
Joint Survey of The BCCH & Synovate

Form
online and self administered survey
single interview lasted approx. 15-20 min.
Respondents
senior management of foreign companies investing in Hungary industries like agriculture, tobacco, construction, business services, education, food & beverages, automotive, trade, real estate, communications, finance and hotels
Timing
Interviews were conducted between September 25 – October 16, 2006
Methodology

Investors are rather negative towards the prevailing business environment in Hungary in the near future.
56
-39
16
-100
-80
-60
-40
-20
0
20
40
60
80
100
2003. Oct 2004. May 2006. Oct
* Average score on the scale -100 ..+100, where -100 means definitely less favourable, 0 means the same as today, and +100 means definitely more favourable
Q1
2006. Oct
Definitely less favourable
Definitely more favourable
Expectations towards business environment

The negative sentiment is widespread, but particularly strong amongst large enterprises.
33 16 16
10
56 57 5363
-48-31-38-39
-100
-80
-60
-40
-20
0
20
40
60
80
100
2003. Oct 2004. May 2006. Oct
Q1
Definitely less favourable
Definitely more favourable
Total Small Business Mid-size Business Large Business
* Average score on the scale -100 ..+100, where -100 means definitely less favourable, 0 means the same as today, and +100 means definitely more favourable
Expectations towards business environment

Expectations towards business environment
The construction/real estate and manufacturing/trade sectors were the most pessimistic sectors in the economy.
26 20
7259
0 3 16
27
56
28
9280
-29-33-42-50-58-39
-100
-80
-60
-40
-20
0
20
40
60
80
100
2003. Oct 2004. May 2006. Oct
Q1
Definitely less favourable
Definitely more favourable
Total Manufacturing, Trade
Construction, Real Estate
OtherFinancial services
Professional Services
* Average score on the scale -100 ..+100, where -100 means definitely less favourable, 0 means the same as today, and +100 means definitely more favourable

24
1
-30
-100
-80
-60
-40
-20
0
20
40
60
80
100
2003. Oct 2004. May 2006. Oct
Government’s performance in supporting investors
Q2
* Average score on the scale -100 ..+100, where -100 means making things much worse, 0 means neither better nor worse and 100 means making things much better
The Government is not seen as taking positive steps to improve the business environment. In fact, opinion is that it is making
things worse!
Making things much worse
Making things much better
2006. Oct
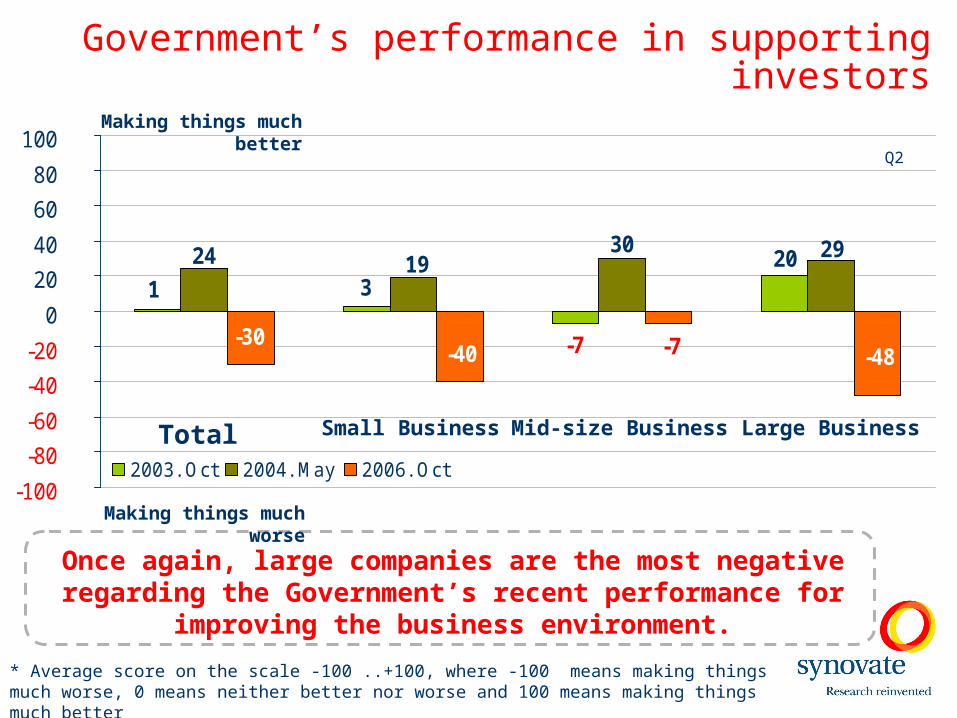
Government’s performance in supporting investors
Once again, large companies are the most negative regarding the Government’s recent performance for improving the
business environment.
20 3 1
-7
24 1930 29
-48-7-40-30
-100
-80
-60
-40
-20
0
20
40
60
80
100
2003. Oct 2004. May 2006. Oct
Q2
Making things much better
Total Small Business Mid-size Business Large Business
Making things much worse
* Average score on the scale -100 ..+100, where -100 means making things much worse, 0 means neither better nor worse and 100 means making things much better

Government’s performance in supporting investors
Although the manufacturing/trade firms had shown pessimism about the business environment, its clear that they don’t blame the
Government for it. However, the construction/real estate sectors strongly believe that the Government is making things worse.
-5
47
162
-8
0 1
27 24 30 25
7
-29-33-25-50
8
-30
-100
-80
-60
-40
-20
0
20
40
60
80
100
2003. Oct 2004. May 2006. Oct
Q2
Total Manufacturing, Trade
Construction, Real Estate
OtherFinancial services
Professional Services
Making things much better
Making things much worse
* Average score on the scale -100 ..+100, where -100 means making things much worse, 0 means neither better nor worse and 100 means making things much better

Impact of Gyurcsány restrictive package
Investors formed the same opinion about Hungary’s competitiveness in terms of the Gyurcsány restrictive package as for the government's performance, with large companies being the
most negative.
-22 -33 -25
0
-100
-80
-60
-40
-20
0
20
40
60
80
100
Total Small Business Mid-size Business Large Business
* Average score on the scale -100 ..+100, where -100 means much less competitive, 0 means neither better nor worse and 100 means much more competitive
Q3
Much less competitive
Much more competitive
Average Small Business Mid-size Business Large Business
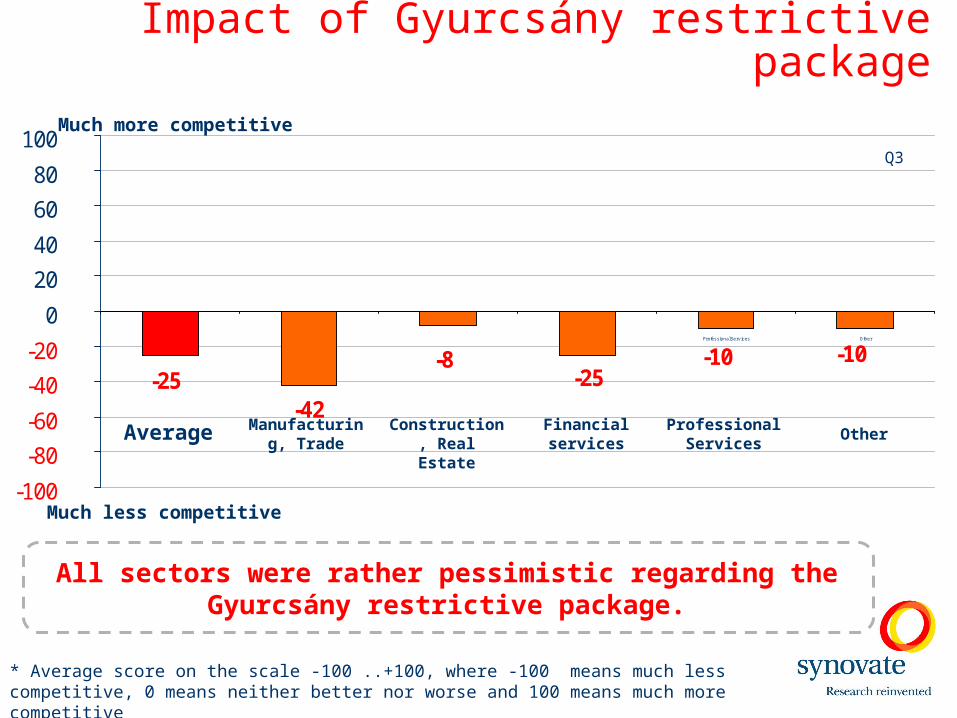
Impact of Gyurcsány restrictive package
All sectors were rather pessimistic regarding the Gyurcsány restrictive package.
-10 -10 -25
-42 -25
-8
-100
-80
-60
-40
-20
0
20
40
60
80
100
TOTAL Manufacturing, Trade Construction, Real Estate Financial serv ices Profess ional Serv ices Other
Q3
Average Manufacturing, Trade
Construction, Real Estate
OtherFinancial services
Professional Services
Much less competitive
Much more competitive
* Average score on the scale -100 ..+100, where -100 means much less competitive, 0 means neither better nor worse and 100 means much more competitive

Yes21%
No66%
DK/NA13%
Q4
Impact of Gyurcsány restrictive package
Yes37%
No48%
DK/NA15%
Plan any reduction in staff work force
Plan to revise staff benefit package
It is clear that the Gyurcsány restrictive package will definitely have an impact on both staff levels as well as on staff benefit
packages. In fact, 1 in 5 companies will reduce their number of staff, whilst almost 2 in 5 will revise staff benefits. There is also a sizeable number of companies that have not yet made a decision.
Q5

Operating sector’s dynamism
Over the next 2-3 years, most companies do not see any change in the dynamism of the sector that they are operating in. However, in
line with other perceptions, large companies are the most pessimistic.
11
-14
9 14
-100
-80
-60
-40
-20
0
20
40
60
80
100
Total Small Business Mid-size Business Large Business
Q7
Average Small Business Mid-size Business Large Business
Much less dynamic
Much more dynamic
* Average score on the scale -100 ..+100, where -100 means much less dynamic, 0 means neither better nor worse and 100 means much more dynamic
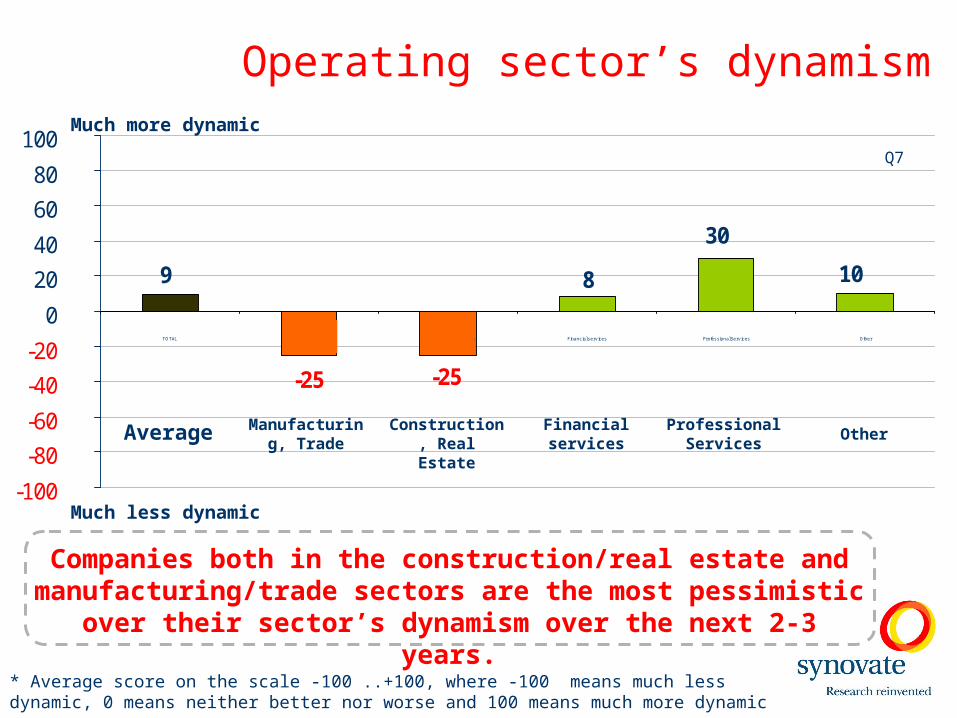
Operating sector’s dynamism
Companies both in the construction/real estate and manufacturing/trade sectors are the most pessimistic over their
sector’s dynamism over the next 2-3 years.
10
30
8
-25
9
-25
-100
-80
-60
-40
-20
0
20
40
60
80
100
TOTAL Manufacturing, Trade Construction, Real Estate Financial serv ices Profess ional Serv ices Other
Q7
Average Manufacturing, Trade
Construction, Real Estate
OtherFinancial services
Professional Services
Much less dynamic
Much more dynamic
* Average score on the scale -100 ..+100, where -100 means much less dynamic, 0 means neither better nor worse and 100 means much more dynamic

3,7
3,2
3,0
2,9
1,6
3,3
2,6
4,2
0 1 2 3 4 5
Bureaucracyand red tape
Corruption
High cost offinance
Slow internaldemand
Quality ofmanagement
Poorinfrastructure
Shortage ofskilled staff
Militant tradeunions
3,7
3,3
3,0
3,0
1,8
3,7
2,9
3,4
0 1 2 3 4 5
Shortage ofskilled staff
Bureaucracyand red tape
High cost offinance
Corruption
Quality ofmanagement
Poorinfrastructure
Slow internaldemand
Militant tradeunions
Barriers to business growthQ8
Average
May 2004 October 2006
Over the past 2 years, bureaucracy and corruption have become bigger threats to business activity in Hungary.
Interestingly, shortage of skilled staff is less of an issue! However, the size of the internal market has become a more decisive point.
In relative scores:
1 = totally insignificant
3 = significant
5 = extremely significant

Q12
%
18%
11%
9%
9%
21%
15%
17%
0% 5% 10% 15% 20% 25% 30%
Economicenvironment
Skilled labour
Low Cost/taxes
Profit
Growth
Infrastructure
Other
Average
Most frequently mentioned points when making a decision on new / further investments

Q12
%
21%
14%
7%
7%
24%
10%
17%
0% 5% 10% 15% 20% 25% 30%
Profit
Growth
Low Cost/taxes
Skilled labour
Economicenvironment
Infrastructure
Other
Average
Most important points when making a decision on new / further investments

Anticipation of any unexpected change
3%
36%
18%
33%
10%
0%
10%
20%
30%
40%
50%
60%
70%
80%
90%
100%
Definitely yes (2)Rather yes (1)No idea (0)Rather not (-1)Definitely not (-2)
Q19
43% of those interviewed believe that there will be some unexpected changes in the next 6 months regarding the
economy or its legal regulations.

Neither significant nor insignificant
Extremely significant
Totally insignificant
Significance of source of information about business environment
1,1
0,3
-0,2
0,6
1,4
1,6
-2 -1 0 1 2
Business organisations
International media
Relatives/ friends
Business organisations
Other companies investing in Hungary
International media
Government offices
Relatives/ friends
Hungarian media
The 2 most important sources of information about the business environment appeared to be the business
organisations and other companies investing in Hungary.
Q20
0,6
0,3
0,3
0,3
0,3
0,3
0,1
-0,2
-0,4
-0,7
0,4
0,8
0,9
-2 -1 0 1 2
Financing options
EU Overall
Employment policies
Return on Investment
Corruption
Competition
Taxation
Much worse Much better
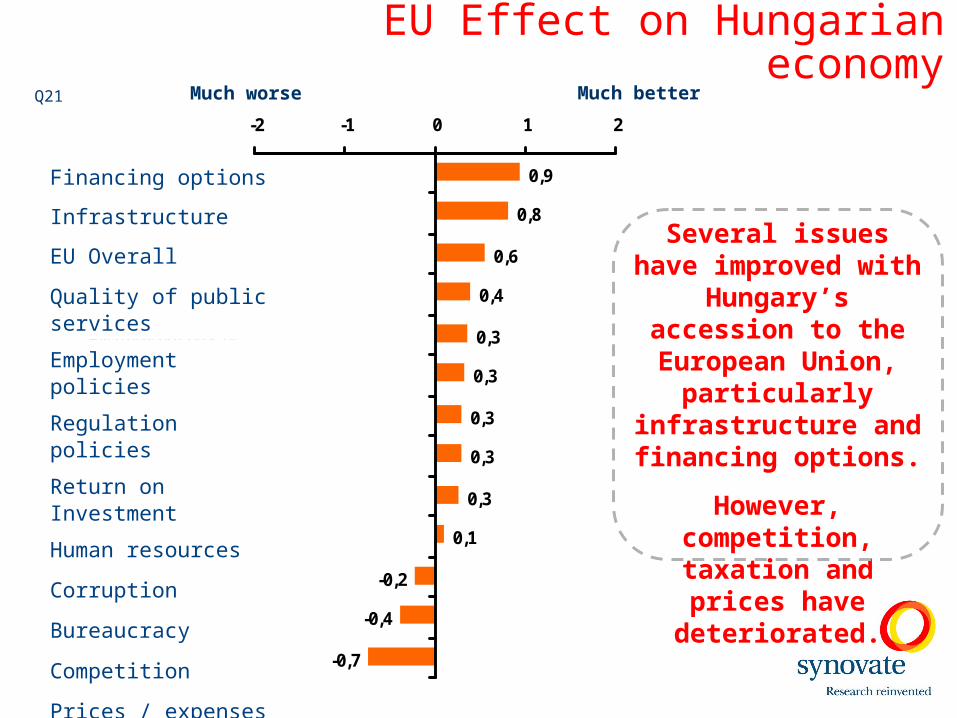
EU Effect on Hungarian economy
Financing options
Infrastructure
EU Overall
Quality of public services
Employment policies
Regulation policies
Return on Investment
Human resources
Corruption
Bureaucracy
Competition
Prices / expenses
Taxation
Several issues have improved with
Hungary’s accession to the European Union,
particularly infrastructure and financing options.
However, competition, taxation and prices have deteriorated.
Q21

Analysis of Critical Business Drivers

Preferred Countries for Investment in Central/ Eastern European
Q16
10%
7%
4%
4%
31%
27%
6%
9%
0% 5% 10% 15% 20% 25% 30% 35%
Czech Republic
Romania
Hungary
Slovakia
Poland
Baltic Countries
None of these
DK/NA

LEGAL ENVIRONMENT
Efficient administrationSimple procedures/ no bureaucracy
Just/impartial judicial systemNo corruption
ECONOMIC ENVIRONMENTHigh internal demand
Transparent information on the business environment
High quality of managementWell developed infrastructureWell developed financial sector
Low costs of finance
Business Drivers
ATTITUDE TO FOREIGNERS
Foreigners are treated equallyBenefits for foreign investors

Business Drivers in Order of Importance
Mostimportant
Leastimportant
54
51
8
1
100
88
87
84
77
32
93
87
0 20 40 60 80 100
Well developed financial sector
Benefits for foreign investors
High internal demand
Foreigners are treated equally
Transparent information on the business environment
Well developed infrastructure
High quality of management
Just/impartial judicial system
Efficient administration
Low costs of finance
Simple procedures/ no bureaucracy
No corruption

Hig
hM
ediu
mL
ow
STANDARDISED PERFORMANCE
Weak Average Strong
DIS
CR
IMIN
AT
OR
S
Low costs of finance
High internal demand
High quality of management
Well developed infrastructure
Well developed financial sector
Transparent information on the
business environment
Just/impartial judicial system
No corruption
Simple procedures/ no bureaucracy
Efficient administration
Benefits for foreign investors Foreigners are
treated equally
Strategic Matrix – Hungary

Key findings (1)• Expectations towards the business environment appear to be fairly
pessimistic and there is quite a decrease versus sentiments expressed when the survey was first launched 2 years ago.
• Opinion on the government's policies toward improving the business environment has also become more pessimistic compared to the previous waves.
• Opinion on the Gyurcsány restrictive package is also negative.
• The most important barrier to business growth is „ Bureaucracy and red tape” followed by „Corruption”. The third biggest factor is “High cost of finance”.
• Taxation rules, unpredictable political steps and lack of purchasing power are mentioned as other important factors hindering business growth.

Key findings (2)• Political predictability, fair taxation rules and lower bureaucracy are
mentioned as top priorities in improving the attractiveness of Hungary for investment.
• Participants agree that EU membership had positive effects on the Hungarian economy especially in terms of financing options, infrastructure and quality of public services.
• EU membership had less positive effect as expected in terms of EU regulations, higher prices/expenses and new competition.
• Hungary is perceived strong in terms of having a well developed financial sector but week in terms of offering benefits for foreign investors and having high internal demand. There is room for improvement in terms of transparency of the business environment and equal treatment of foreigners which are also important drivers for future investment.

Questions