Embed Size (px)
Citation preview
AEGIS GROUP PLC
2009 FULL YEAR RESULTS
18 March 2010
AGENDA
INTRODUCTION
John Napier, Chairman and acting Interim CEO
BUSINESS REVIEW AND OUTLOOK
Aegis Media - Jerry Buhlmann, CEO Aegis Media
Synovate - Robert Philpott, CEO Synovate
FINANCIAL REVIEW
Nick Priday, CFO
GROUP OUTLOOK
John Napier
Q&A
Aegis Group plc | Page 2
2009 summary
STRONG PERFORMANCE IN A CHALLENGING MARKET
Aegis Group plc| Page 3
• Underlying profit of £170.3m (2008: £177.0m)
• A strong operating performance in difficult markets due to conditions:
• Strategy of cost reduction and other actions, initiated at the start of 2009
• Further action taken during the year to combat more challenging custom research market
• Margins broadly maintained at 12.6% (2008:of 13.2%) despite 8.7% revenue fall
Financial highlights
REVENUE & PROFITS
Aegis Group plc| Page 4
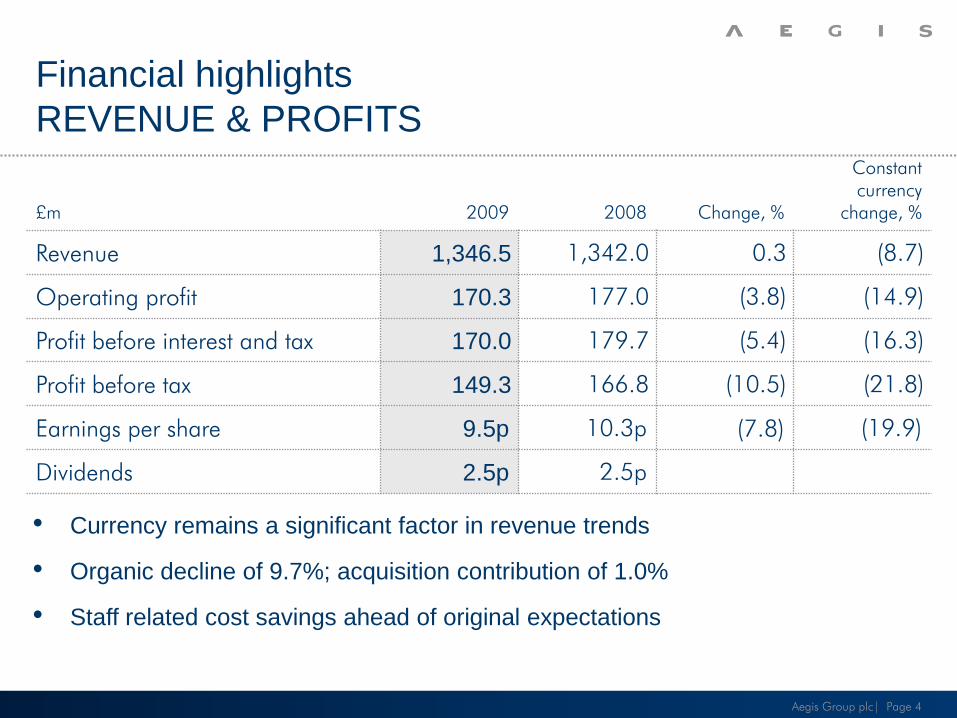
• Currency remains a significant factor in revenue trends
• Organic decline of 9.7%; acquisition contribution of 1.0%
• Staff related cost savings ahead of original expectations
£m 2009 2008 Change, %
Constant
currency
change, %
Revenue 1,346.5 1,342.0 0.3 (8.7)
Operating profit 170.3 177.0 (3.8) (14.9)
Profit before interest and tax 170.0 179.7 (5.4) (16.3)
Profit before tax 149.3 166.8 (10.5) (21.8)
Earnings per share 9.5p 10.3p (7.8) (19.9)
Dividends 2.5p 2.5p
2009 highlights
SYNOVATE
Aegis Group plc| Page 5
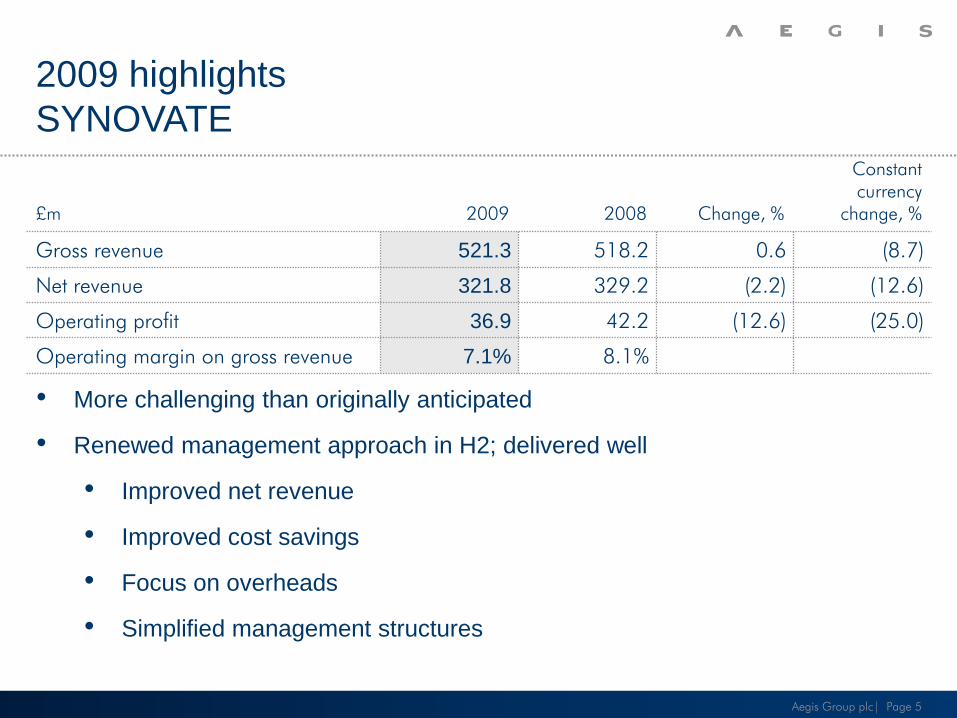
• More challenging than originally anticipated
• Renewed management approach in H2; delivered well
• Improved net revenue
• Improved cost savings
• Focus on overheads
• Simplified management structures
£m 2009 2008 Change, %
Constant
currency
change, %
Gross revenue 521.3 518.2 0.6 (8.7)
Net revenue 321.8 329.2 (2.2) (12.6)
Operating profit 36.9 42.2 (12.6) (25.0)
Operating margin on gross revenue 7.1% 8.1%
2009 highlights
AEGIS MEDIA
Aegis Group plc| Page 6
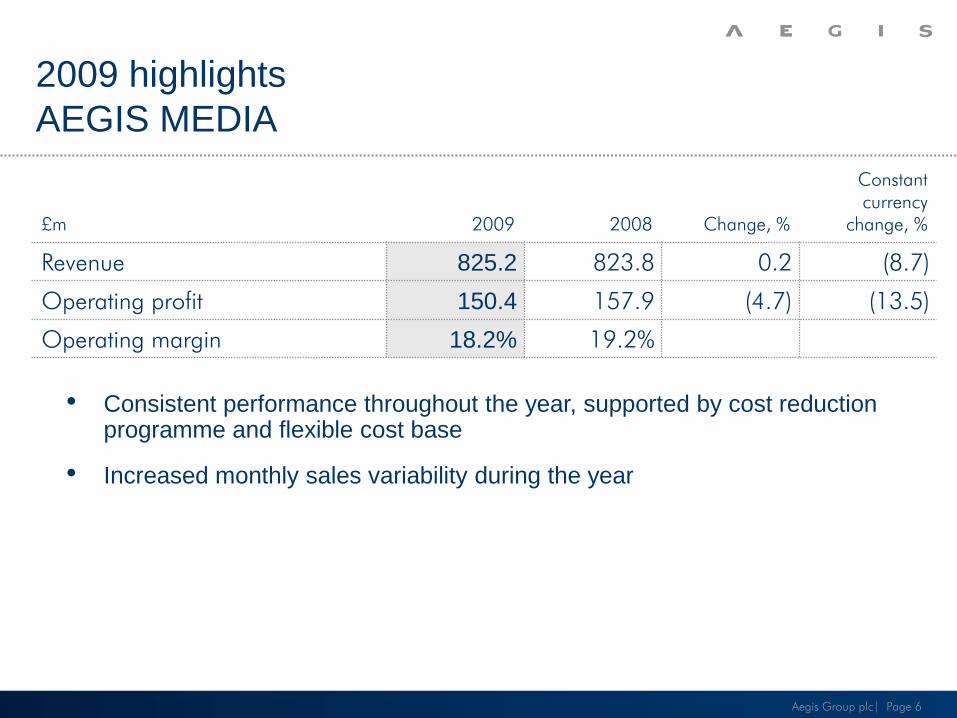
• Consistent performance throughout the year, supported by cost reduction programme and flexible cost base
• Increased monthly sales variability during the year
£m 2009 2008 Change, %
Constant
currency
change, %
Revenue 825.2 823.8 0.2 (8.7)
Operating profit 150.4 157.9 (4.7) (13.5)
Operating margin 18.2% 19.2%
BUSINESS REVIEW
AEGIS MEDIA
Jerry Buhlmann
CEO, Aegis Media
£m 2009 2008 Change, %
Constant
currency
change, %
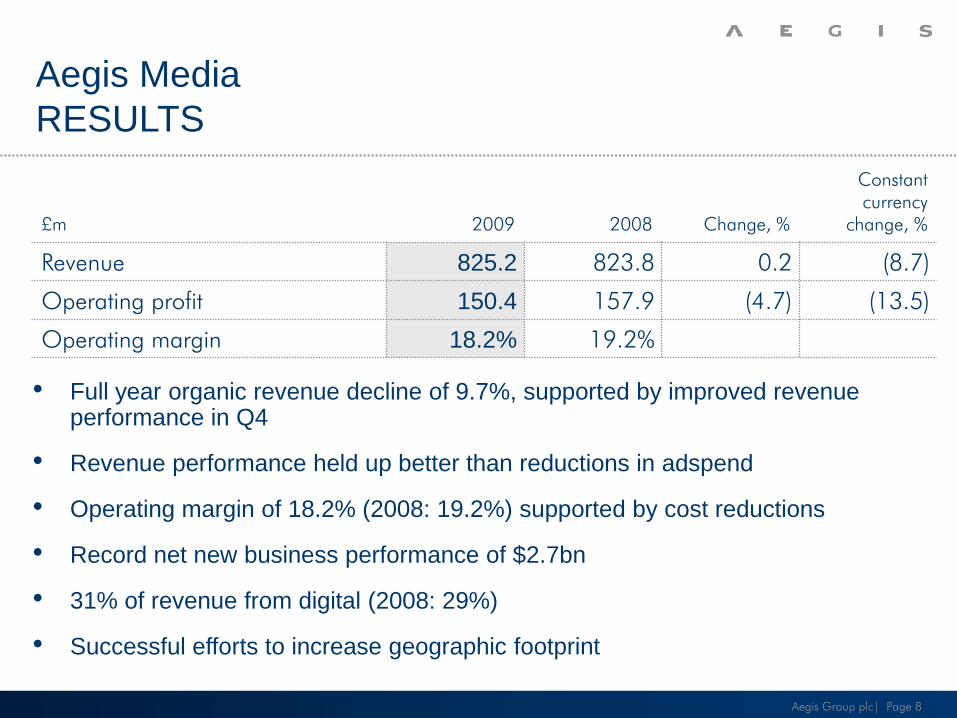
Revenue 825.2 823.8 0.2 (8.7)
Operating profit 150.4 157.9 (4.7) (13.5)
Operating margin 18.2% 19.2%
Aegis Media
RESULTS
Aegis Group plc| Page 8
• Full year organic revenue decline of 9.7%, supported by improved revenue performance in Q4
• Revenue performance held up better than reductions in adspend
• Operating margin of 18.2% (2008: 19.2%) supported by cost reductions
• Record net new business performance of $2.7bn
• 31% of revenue from digital (2008: 29%)
• Successful efforts to increase geographic footprint
Aegis Media
QUARTERLY PERFORMANCE
Aegis Group plc| Page 9
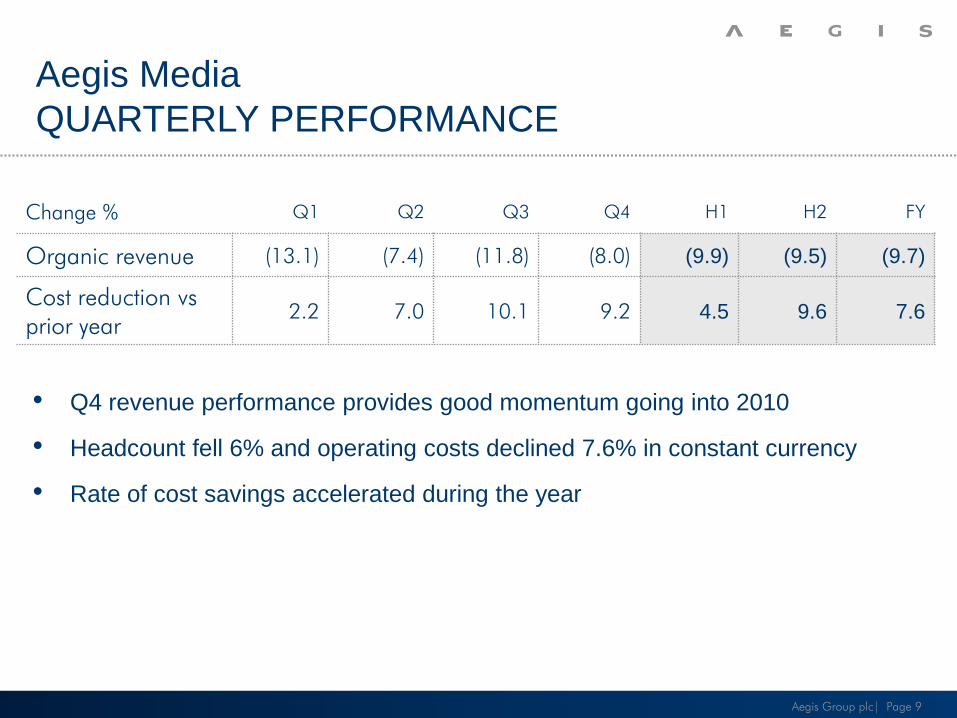
• Q4 revenue performance provides good momentum going into 2010
• Headcount fell 6% and operating costs declined 7.6% in constant currency
• Rate of cost savings accelerated during the year
Change % Q1 Q2 Q3 Q4 H1 H2 FY
Organic revenue (13.1) (7.4) (11.8) (8.0) (9.9) (9.5) (9.7)
Cost reduction vs
prior year2.2 7.0 10.1 9.2 4.5 9.6 7.6
£m 2009 2008 Change, %
Constant
currency
change, %
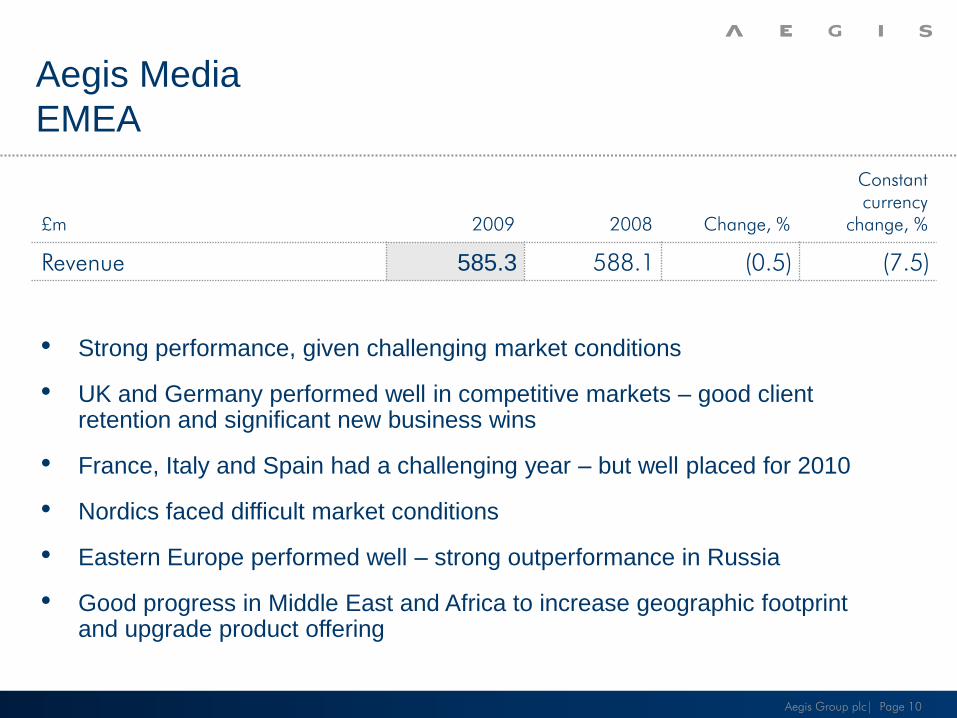
Revenue 585.3 588.1 (0.5) (7.5)
Aegis Media
EMEA
Aegis Group plc| Page 10
• Strong performance, given challenging market conditions
• UK and Germany performed well in competitive markets – good client retention and significant new business wins
• France, Italy and Spain had a challenging year – but well placed for 2010
• Nordics faced difficult market conditions
• Eastern Europe performed well – strong outperformance in Russia
• Good progress in Middle East and Africa to increase geographic footprint and upgrade product offering
£m 2009 2008 Change, %
Constant
currency
change, %
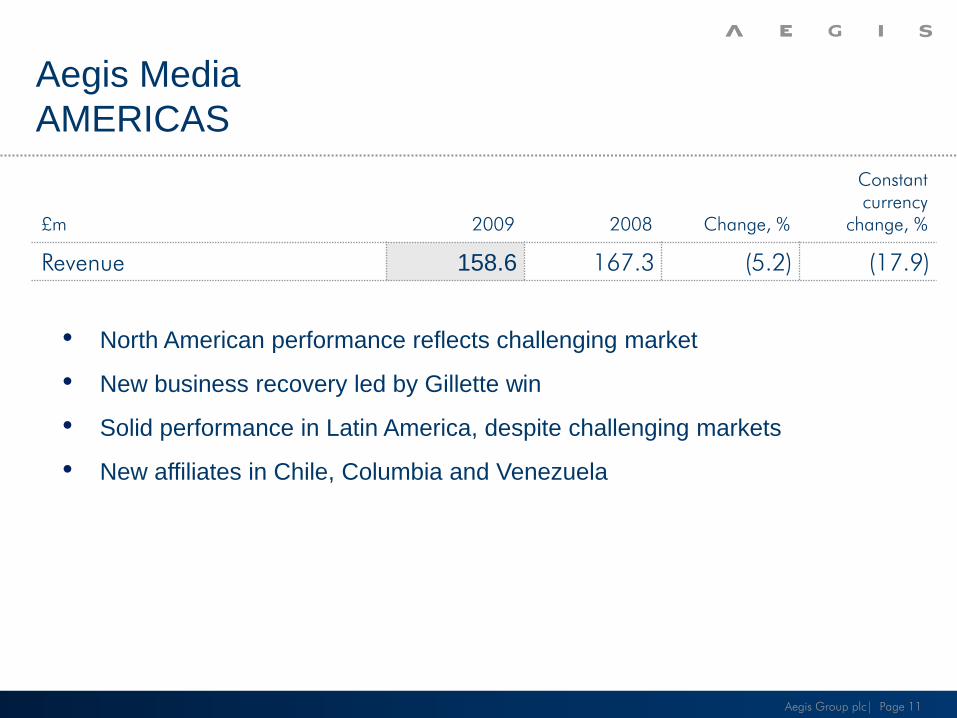
Revenue 158.6 167.3 (5.2) (17.9)
Aegis Media
AMERICAS
Aegis Group plc| Page 11
• North American performance reflects challenging market
• New business recovery led by Gillette win
• Solid performance in Latin America, despite challenging markets
• New affiliates in Chile, Columbia and Venezuela
£m 2009 2008 Change, %
Constant
currency
change, %
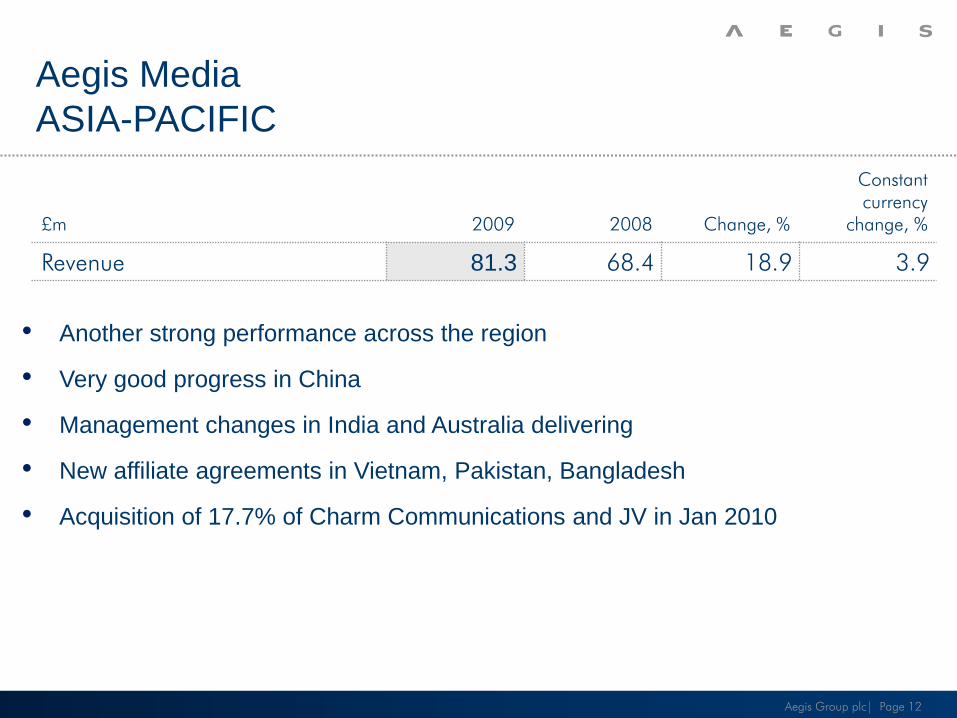
Revenue 81.3 68.4 18.9 3.9
Aegis Media
ASIA-PACIFIC
Aegis Group plc| Page 12
• Another strong performance across the region
• Very good progress in China
• Management changes in India and Australia delivering
• New affiliate agreements in Vietnam, Pakistan, Bangladesh
• Acquisition of 17.7% of Charm Communications and JV in Jan 2010
Aegis Media
SUMMARY
Aegis Group plc| Page 13
• Resilient performance in a recessionary year
• Effective cost reduction programme
• Good strategic progress in both China and North America
• Record net new business wins – well placed for 2010
BUSINESS REVIEW
SYNOVATE
Robert Philpott
CEO, Synovate
£m 2009 2008 Change, %
Constant
currency
change, %
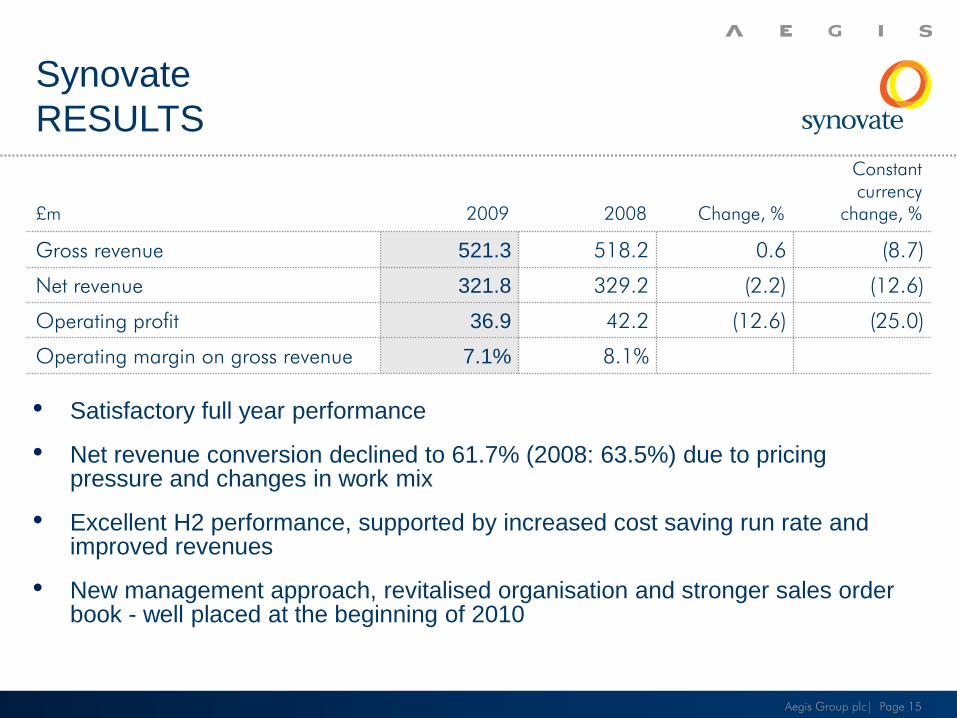
Gross revenue 521.3 518.2 0.6 (8.7)
Net revenue 321.8 329.2 (2.2) (12.6)
Operating profit 36.9 42.2 (12.6) (25.0)
Operating margin on gross revenue 7.1% 8.1%
Synovate
RESULTS
Aegis Group plc| Page 15
• Satisfactory full year performance
• Net revenue conversion declined to 61.7% (2008: 63.5%) due to pricing pressure and changes in work mix
• Excellent H2 performance, supported by increased cost saving run rate and improved revenues
• New management approach, revitalised organisation and stronger sales order book - well placed at the beginning of 2010
Synovate
QUARTERLY PERFORMANCE
Aegis Group plc| Page 16
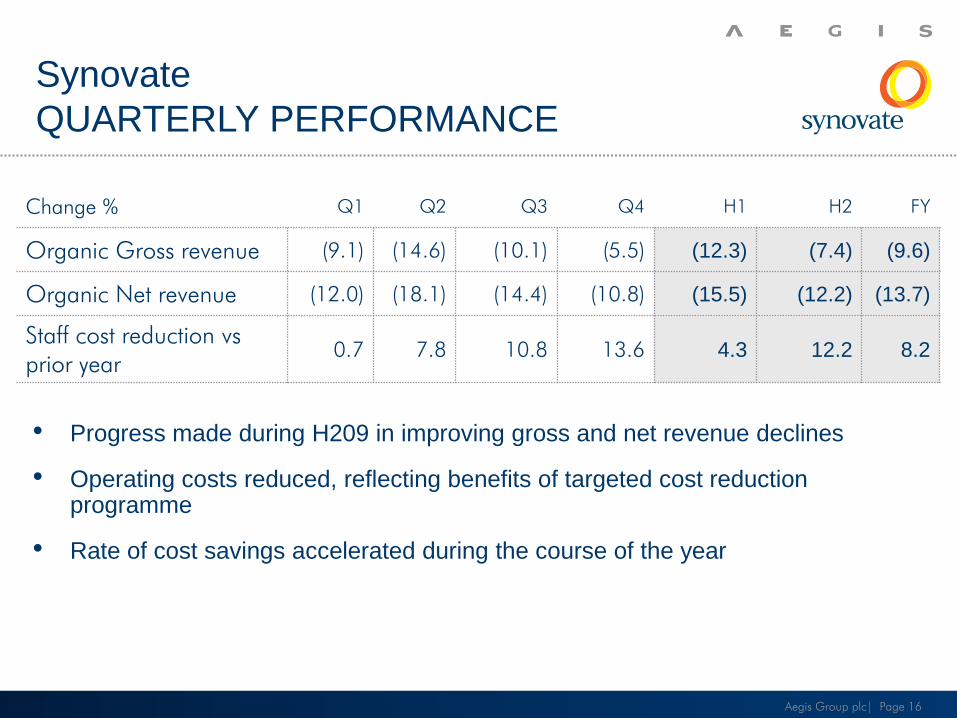
• Progress made during H209 in improving gross and net revenue declines
• Operating costs reduced, reflecting benefits of targeted cost reduction programme
• Rate of cost savings accelerated during the course of the year
Change % Q1 Q2 Q3 Q4 H1 H2 FY
Organic Gross revenue (9.1) (14.6) (10.1) (5.5) (12.3) (7.4) (9.6)
Organic Net revenue (12.0) (18.1) (14.4) (10.8) (15.5) (12.2) (13.7)
Staff cost reduction vs
prior year0.7 7.8 10.8 13.6 4.3 12.2 8.2
£m 2009 2008 Change, %
Constant
currency
change, %
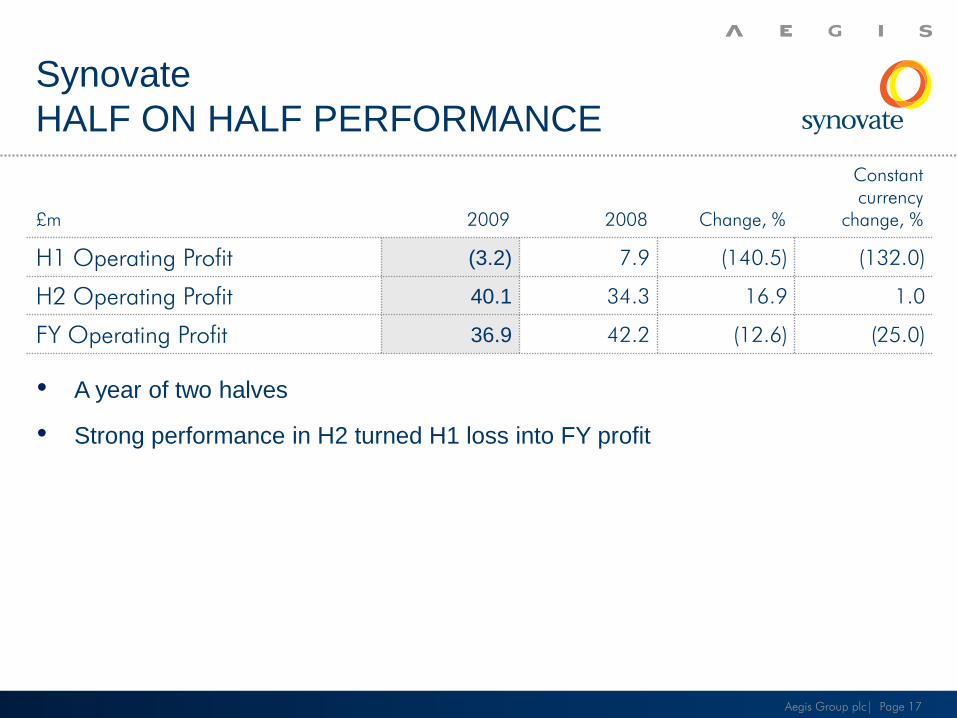
H1 Operating Profit (3.2) 7.9 (140.5) (132.0)
H2 Operating Profit 40.1 34.3 16.9 1.0
FY Operating Profit 36.9 42.2 (12.6) (25.0)
Synovate
HALF ON HALF PERFORMANCE
Aegis Group plc| Page 17
• A year of two halves
• Strong performance in H2 turned H1 loss into FY profit
£m 2009 2008 Change, %
Constant
currency
change, %
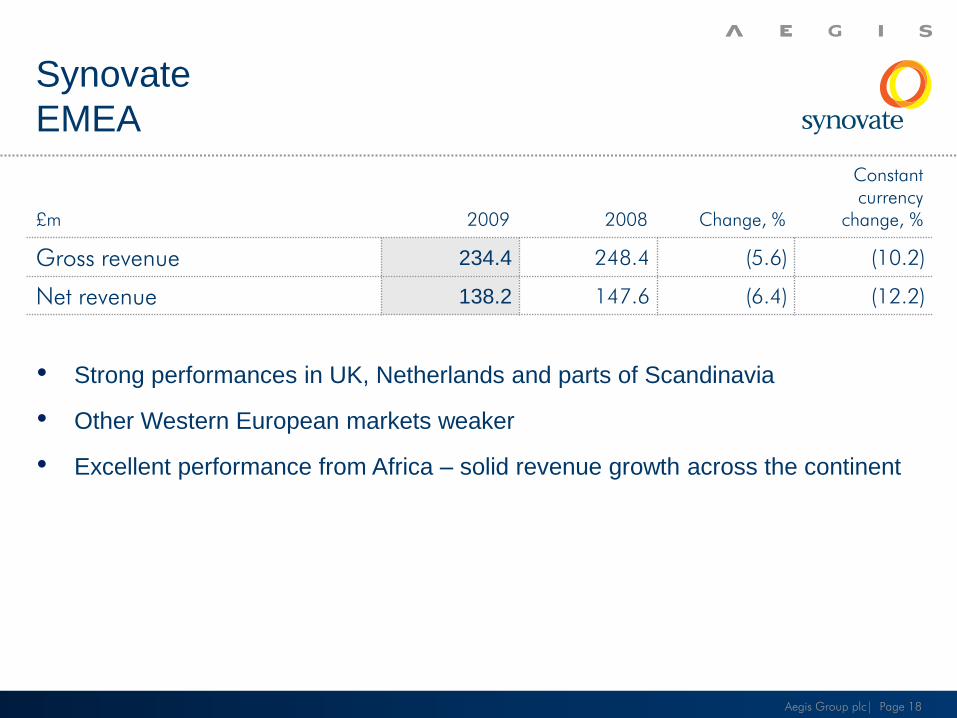
Gross revenue 234.4 248.4 (5.6) (10.2)
Net revenue 138.2 147.6 (6.4) (12.2)
Synovate
EMEA
Aegis Group plc| Page 18
• Strong performances in UK, Netherlands and parts of Scandinavia
• Other Western European markets weaker
• Excellent performance from Africa – solid revenue growth across the continent
£m 2009 2008 Change, %
Constant
currency
change, %
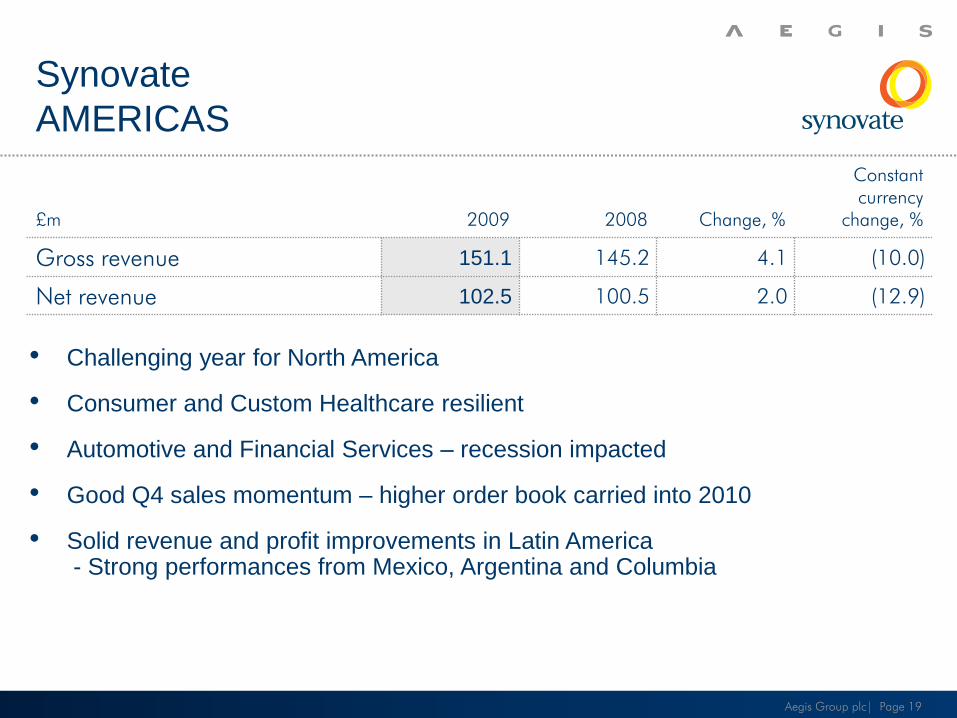
Gross revenue 151.1 145.2 4.1 (10.0)
Net revenue 102.5 100.5 2.0 (12.9)
Synovate
AMERICAS
Aegis Group plc| Page 19
• Challenging year for North America
• Consumer and Custom Healthcare resilient
• Automotive and Financial Services – recession impacted
• Good Q4 sales momentum – higher order book carried into 2010
• Solid revenue and profit improvements in Latin America - Strong performances from Mexico, Argentina and Columbia
£m 2009 2008 Change, %
Constant
currency
change, %
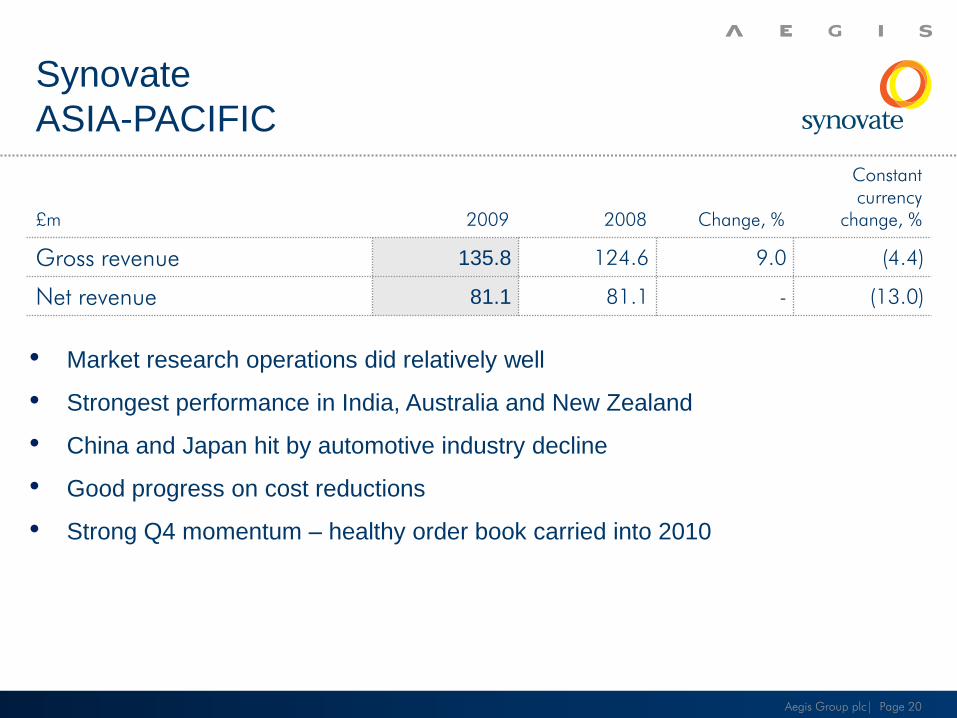
Gross revenue 135.8 124.6 9.0 (4.4)
Net revenue 81.1 81.1 - (13.0)
Synovate
ASIA-PACIFIC
Aegis Group plc| Page 20
• Market research operations did relatively well
• Strongest performance in India, Australia and New Zealand
• China and Japan hit by automotive industry decline
• Good progress on cost reductions
• Strong Q4 momentum – healthy order book carried into 2010
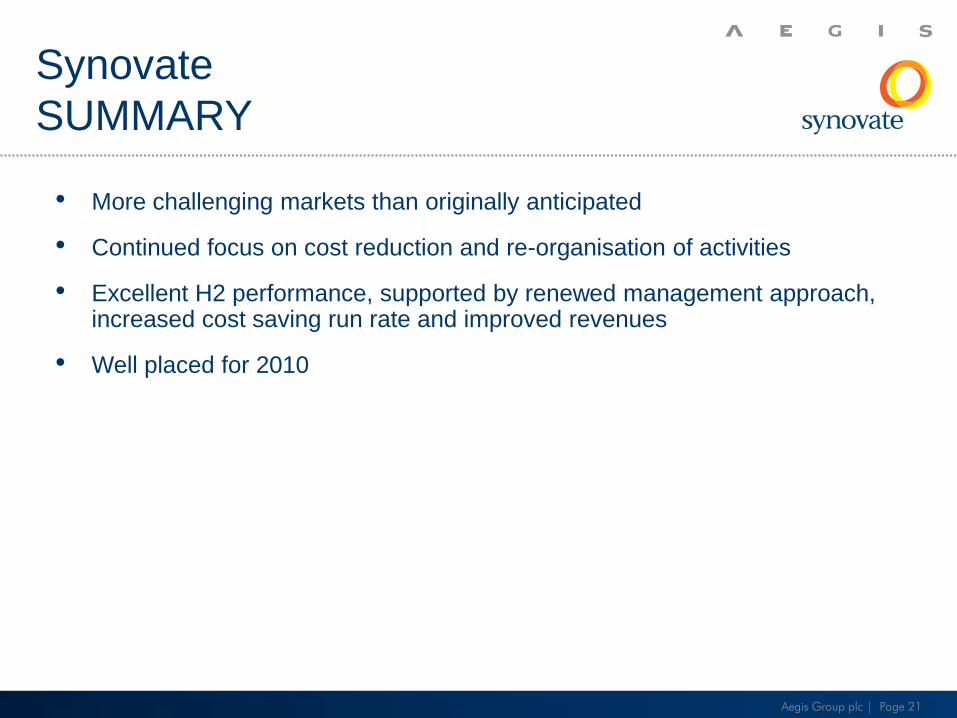
• More challenging markets than originally anticipated
• Continued focus on cost reduction and re-organisation of activities
• Excellent H2 performance, supported by renewed management approach, increased cost saving run rate and improved revenues
• Well placed for 2010
Synovate
SUMMARY
Aegis Group plc | Page 21
FINANCIAL REVIEW
Nick Priday
CFO
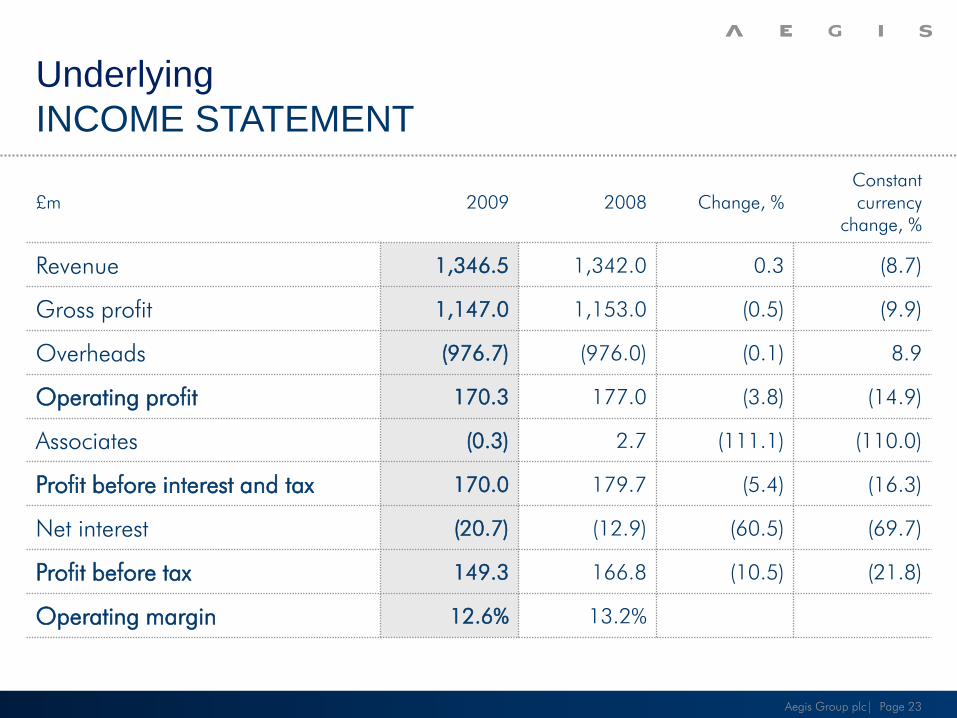
Underlying
INCOME STATEMENT
£m 2009 2008 Change, %
Constant
currency
change, %
Revenue 1,346.5 1,342.0 0.3 (8.7)
Gross profit 1,147.0 1,153.0 (0.5) (9.9)
Overheads (976.7) (976.0) (0.1) 8.9
Operating profit 170.3 177.0 (3.8) (14.9)
Associates (0.3) 2.7 (111.1) (110.0)
Profit before interest and tax 170.0 179.7 (5.4) (16.3)
Net interest (20.7) (12.9) (60.5) (69.7)
Profit before tax 149.3 166.8 (10.5) (21.8)
Operating margin 12.6% 13.2%
Aegis Group plc| Page 23
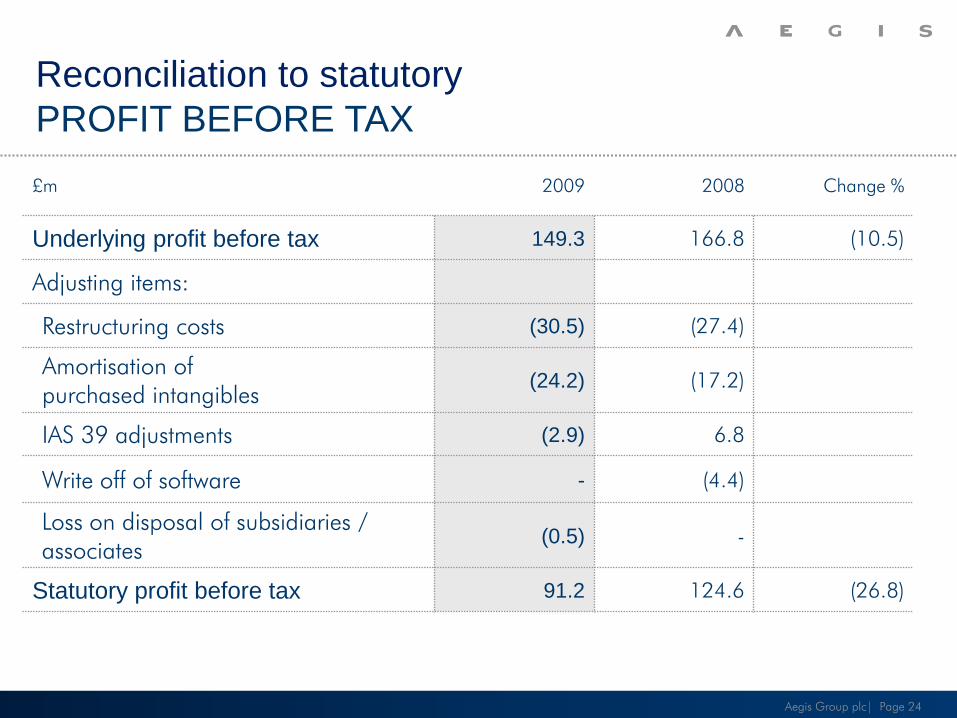
Reconciliation to statutory
PROFIT BEFORE TAX
£m 2009 2008 Change %
Underlying profit before tax 149.3 166.8 (10.5)
Adjusting items:
Restructuring costs (30.5) (27.4)
Amortisation of
purchased intangibles(24.2) (17.2)
IAS 39 adjustments (2.9) 6.8
Write off of software - (4.4)
Loss on disposal of subsidiaries /
associates(0.5) -
Statutory profit before tax 91.2 124.6 (26.8)
Aegis Group plc| Page 24
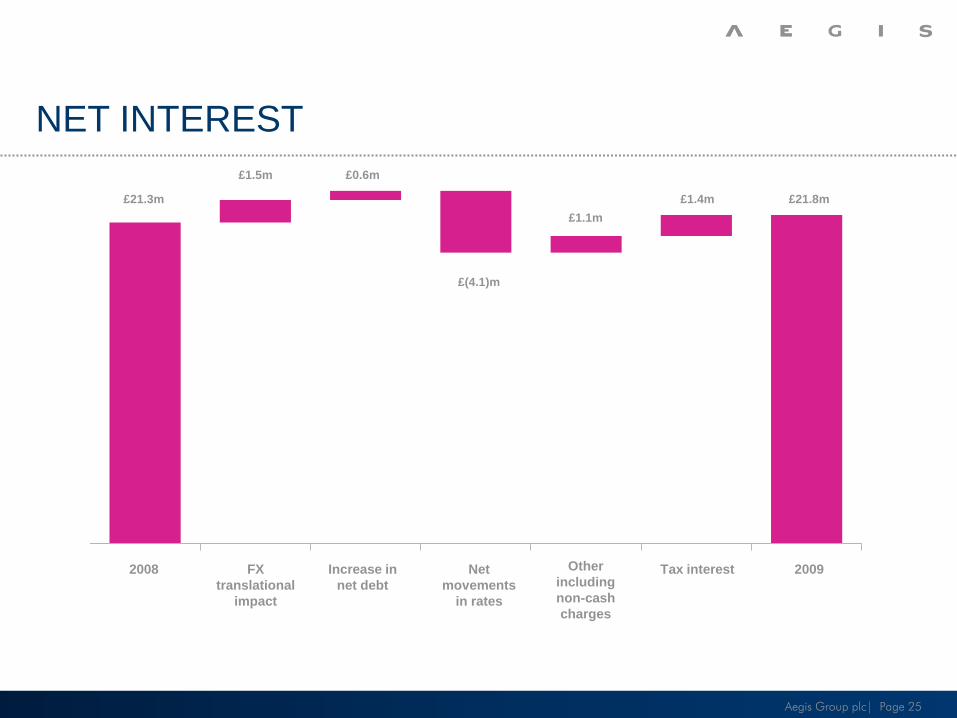
NET INTEREST
Aegis Group plc| Page 25
2008 Increase in
net debt
Net
movements
in rates
Other
including
non-cash
charges
Tax interest 2009FX
translational
impact
£21.3m
£1.5m
£(4.1)m
£1.1m
£1.4m £21.8m
£0.6m
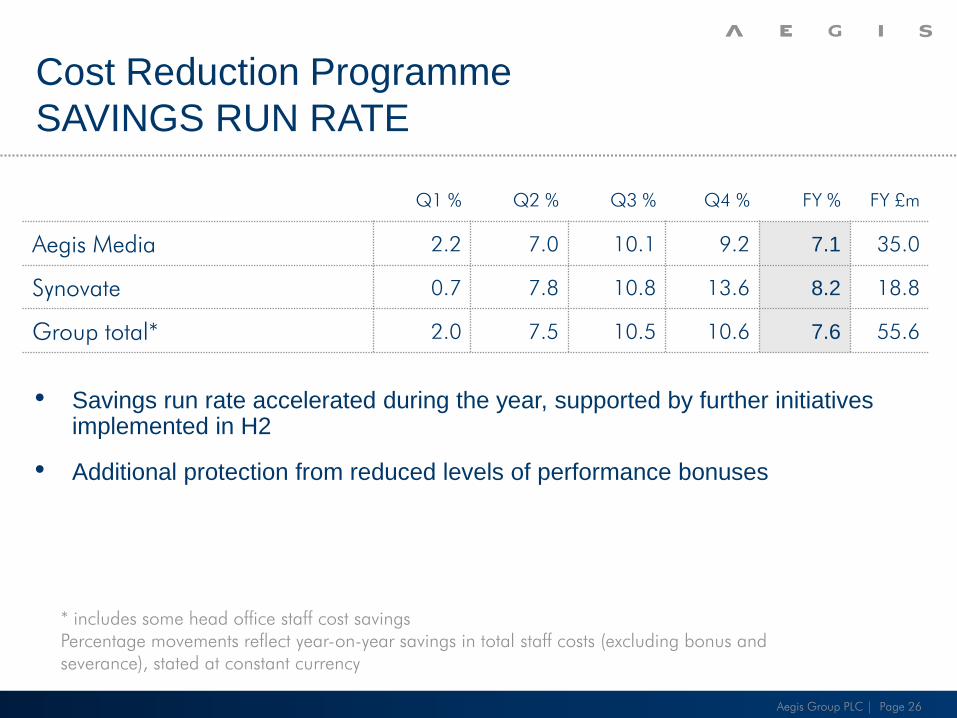
Cost Reduction Programme
SAVINGS RUN RATE
Aegis Group PLC | Page 26
Q1 % Q2 % Q3 % Q4 % FY % FY £m
Aegis Media 2.2 7.0 10.1 9.2 7.1 35.0
Synovate 0.7 7.8 10.8 13.6 8.2 18.8
Group total* 2.0 7.5 10.5 10.6 7.6 55.6
* includes some head office staff cost savings
Percentage movements reflect year-on-year savings in total staff costs (excluding bonus and
severance), stated at constant currency
• Savings run rate accelerated during the year, supported by further initiatives implemented in H2
• Additional protection from reduced levels of performance bonuses
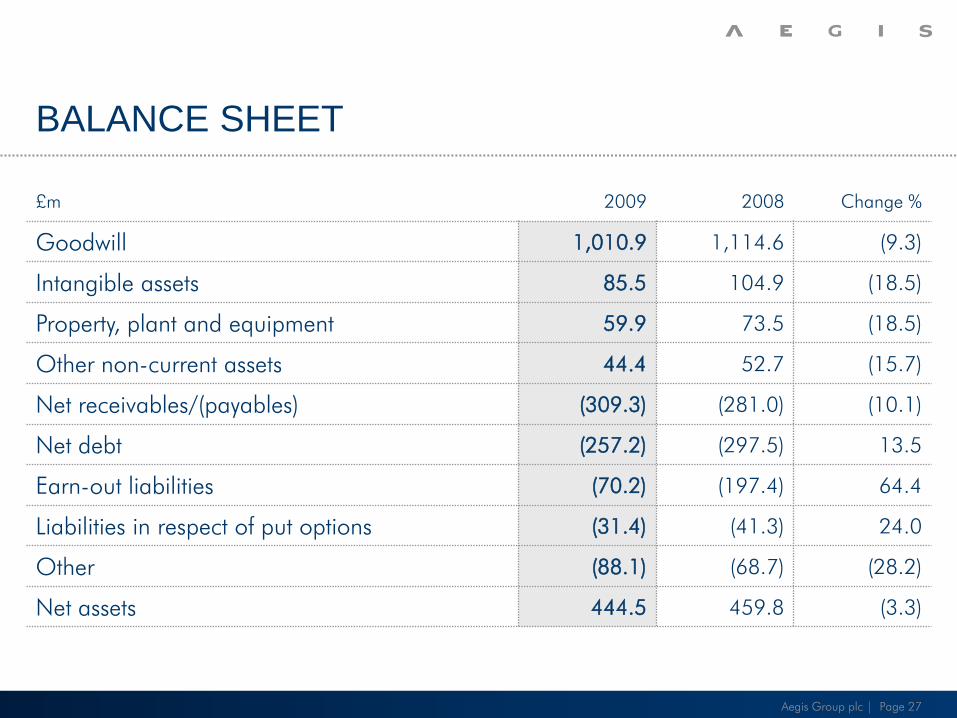
BALANCE SHEET
Aegis Group plc | Page 27
£m 2009 2008 Change %
Goodwill 1,010.9 1,114.6 (9.3)
Intangible assets 85.5 104.9 (18.5)
Property, plant and equipment 59.9 73.5 (18.5)
Other non-current assets 44.4 52.7 (15.7)
Net receivables/(payables) (309.3) (281.0) (10.1)
Net debt (257.2) (297.5) 13.5
Earn-out liabilities (70.2) (197.4) 64.4
Liabilities in respect of put options (31.4) (41.3) 24.0
Other (88.1) (68.7) (28.2)
Net assets 444.5 459.8 (3.3)
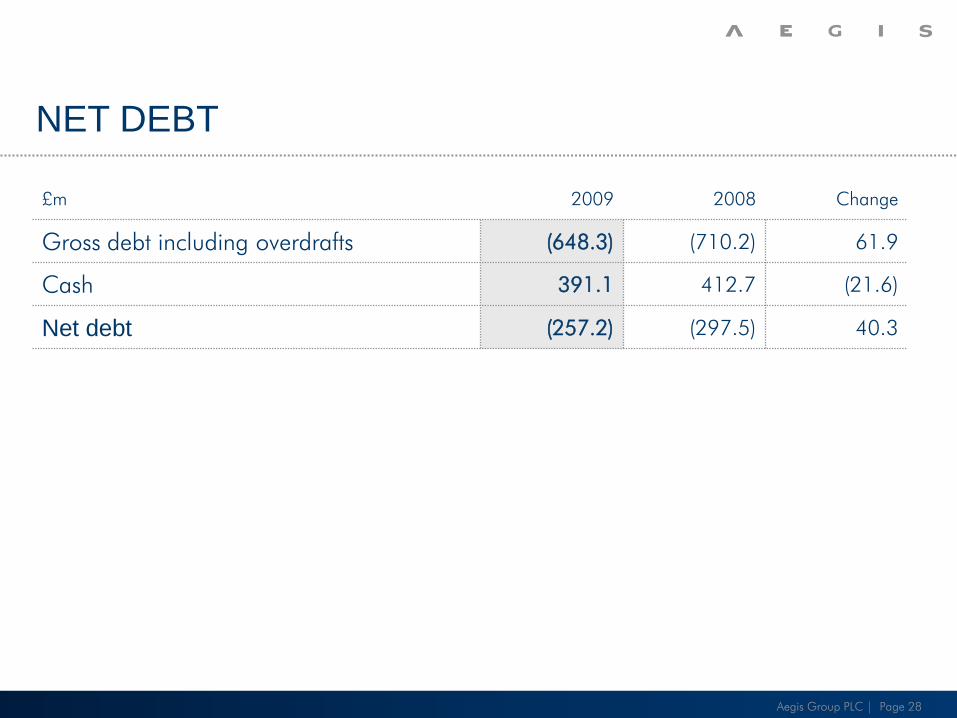
NET DEBT
Aegis Group PLC | Page 28
£m 2009 2008 Change
Gross debt including overdrafts (648.3) (710.2) 61.9
Cash 391.1 412.7 (21.6)
Net debt (257.2) (297.5) 40.3
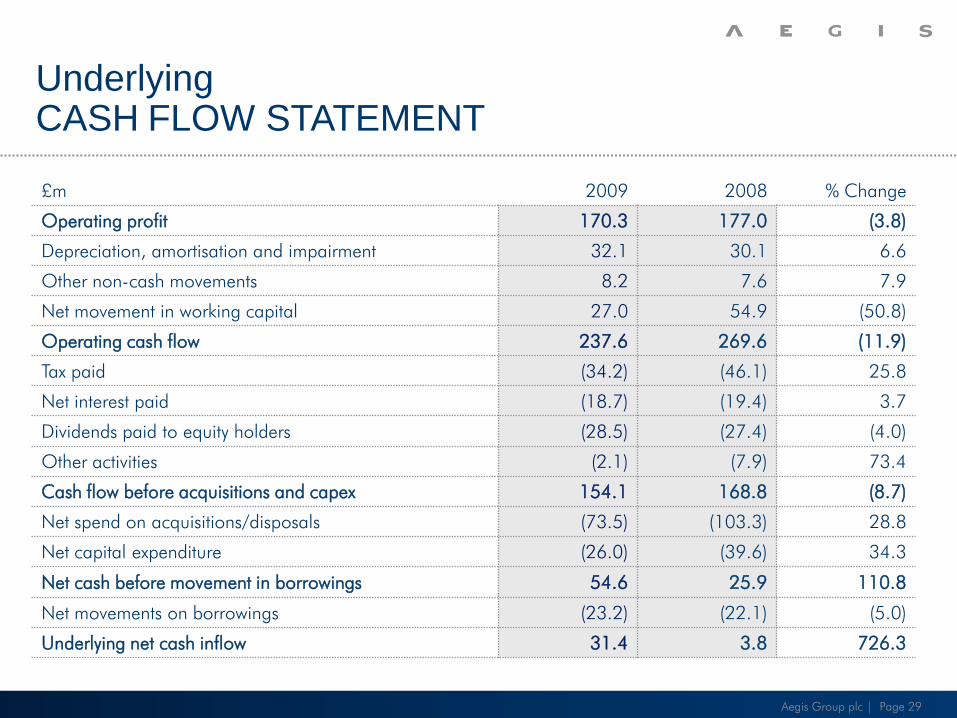
UnderlyingCASH FLOW STATEMENT
Aegis Group plc | Page 29
£m 2009 2008 % Change
Operating profit 170.3 177.0 (3.8)
Depreciation, amortisation and impairment 32.1 30.1 6.6
Other non-cash movements 8.2 7.6 7.9
Net movement in working capital 27.0 54.9 (50.8)
Operating cash flow 237.6 269.6 (11.9)
Tax paid (34.2) (46.1) 25.8
Net interest paid (18.7) (19.4) 3.7
Dividends paid to equity holders (28.5) (27.4) (4.0)
Other activities (2.1) (7.9) 73.4
Cash flow before acquisitions and capex 154.1 168.8 (8.7)
Net spend on acquisitions/disposals (73.5) (103.3) 28.8
Net capital expenditure (26.0) (39.6) 34.3
Net cash before movement in borrowings 54.6 25.9 110.8
Net movements on borrowings (23.2) (22.1) (5.0)
Underlying net cash inflow 31.4 3.8 726.3
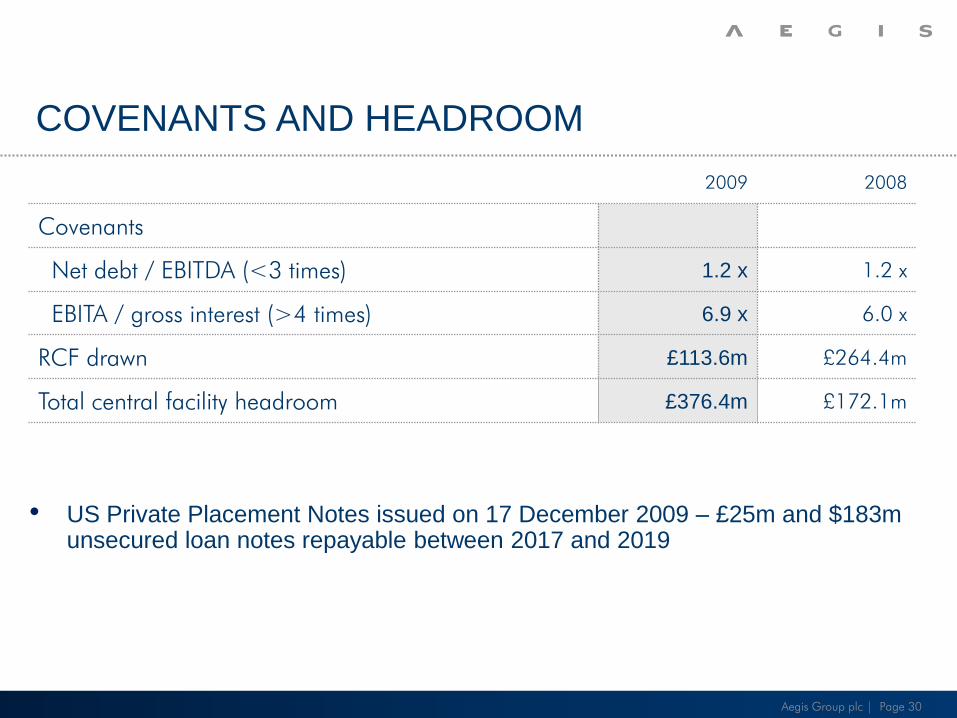
COVENANTS AND HEADROOM
Aegis Group plc | Page 30
2009 2008
Covenants
Net debt / EBITDA (<3 times) 1.2 x 1.2 x
EBITA / gross interest (>4 times) 6.9 x 6.0 x
RCF drawn £113.6m £264.4m
Total central facility headroom £376.4m £172.1m
• US Private Placement Notes issued on 17 December 2009 – £25m and $183m unsecured loan notes repayable between 2017 and 2019
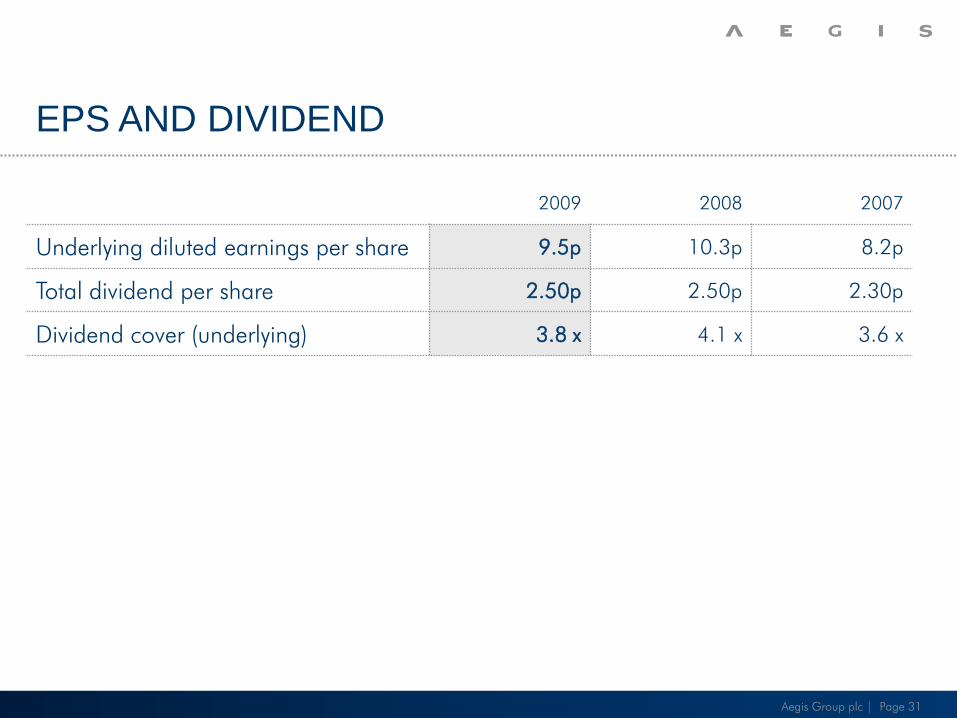
EPS AND DIVIDEND
Aegis Group plc | Page 31
2009 2008 2007
Underlying diluted earnings per share 9.5p 10.3p 8.2p
Total dividend per share 2.50p 2.50p 2.30p
Dividend cover (underlying) 3.8 x 4.1 x 3.6 x
DEVELOPMENT
AND OUTLOOK
John Napier
Chairman and Interim CEO
Aegis
OUTLOOK
• Strong performance in 2009 despite recession
• Sales recovery in Synovate, positive impact in 2010
• Aegis Media well placed in 2010, following strong new business performance in 2009
• More expenditure focus on bolt-on acquisitions and complementary investments
• Gained momentum
Aegis Group plc | Page 33
Macro Economic
OUTLOOK
• Global economy has improved but significant regional variations remain
• Significant soft spots in Europe, including Russia, the Baltics and Spain
• Emerging markets, including China, remain the highest growth
• US economy is recovering
• Unprecedented policy initiatives
Aegis Group plc | Page 34
Aegis View
• Momentum and continuity in 2009
• Successful action
• Good start to year
• Aspiration
• Return to modest growth
Aegis Group plc | Page 35

Q & A
APPENDIX
Aegis Group PLC | Page 37
Aegis Group PLC | Page 38
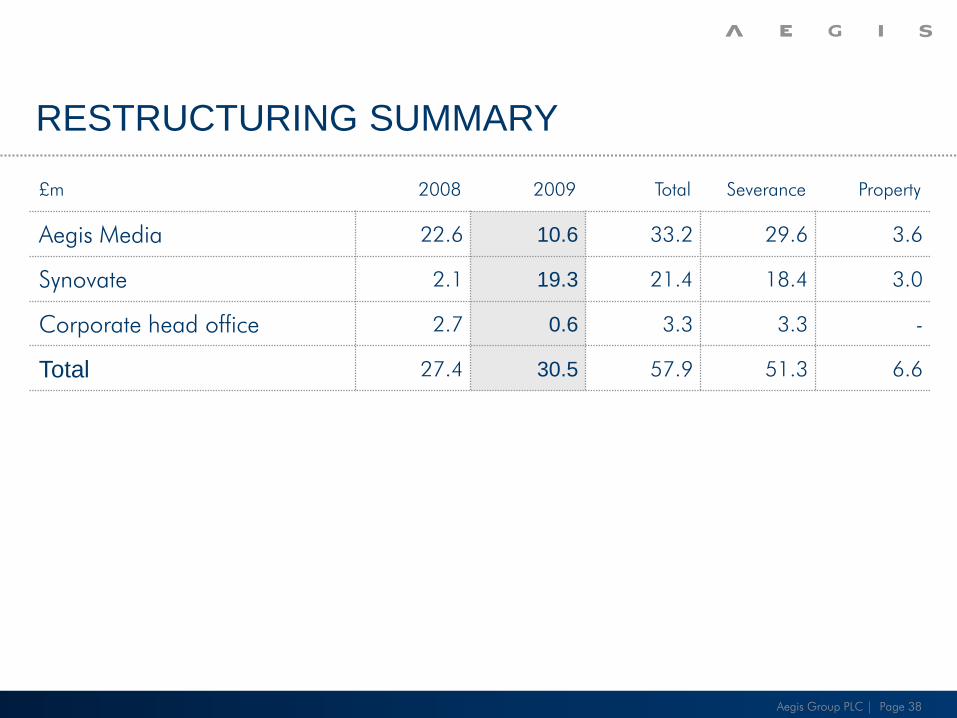
RESTRUCTURING SUMMARY
£m 2008 2009 Total Severance Property
Aegis Media 22.6 10.6 33.2 29.6 3.6
Synovate 2.1 19.3 21.4 18.4 3.0
Corporate head office 2.7 0.6 3.3 3.3 -
Total 27.4 30.5 57.9 51.3 6.6
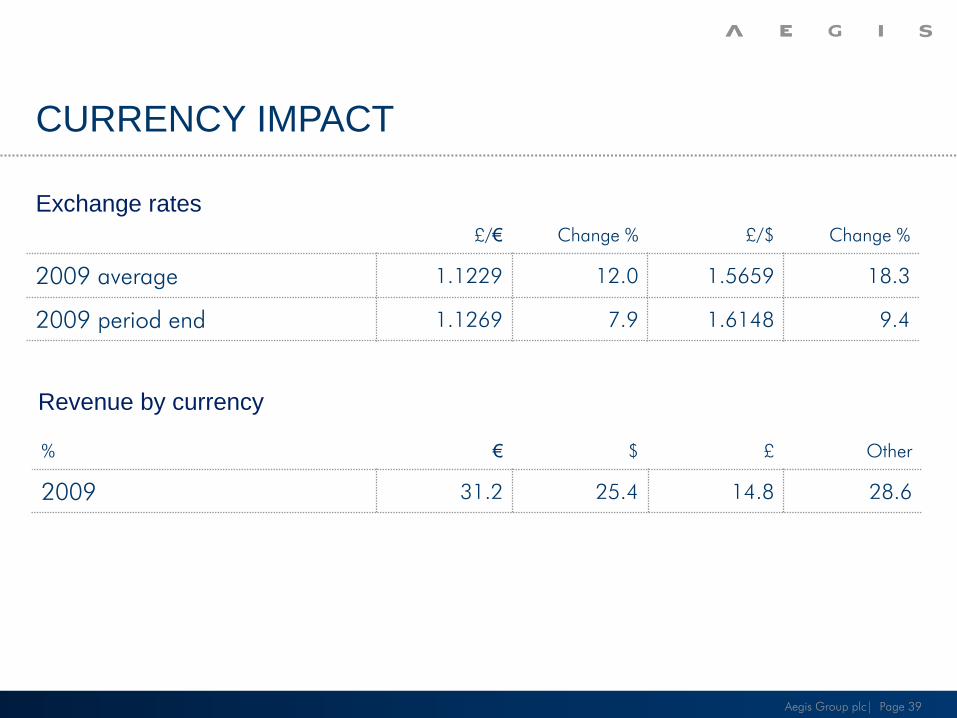
CURRENCY IMPACT
Exchange rates
£/€ Change % £/$ Change %
2009 average 1.1229 12.0 1.5659 18.3
2009 period end 1.1269 7.9 1.6148 9.4
Aegis Group plc| Page 39
% € $ £ Other
2009 31.2 25.4 14.8 28.6
Revenue by currency
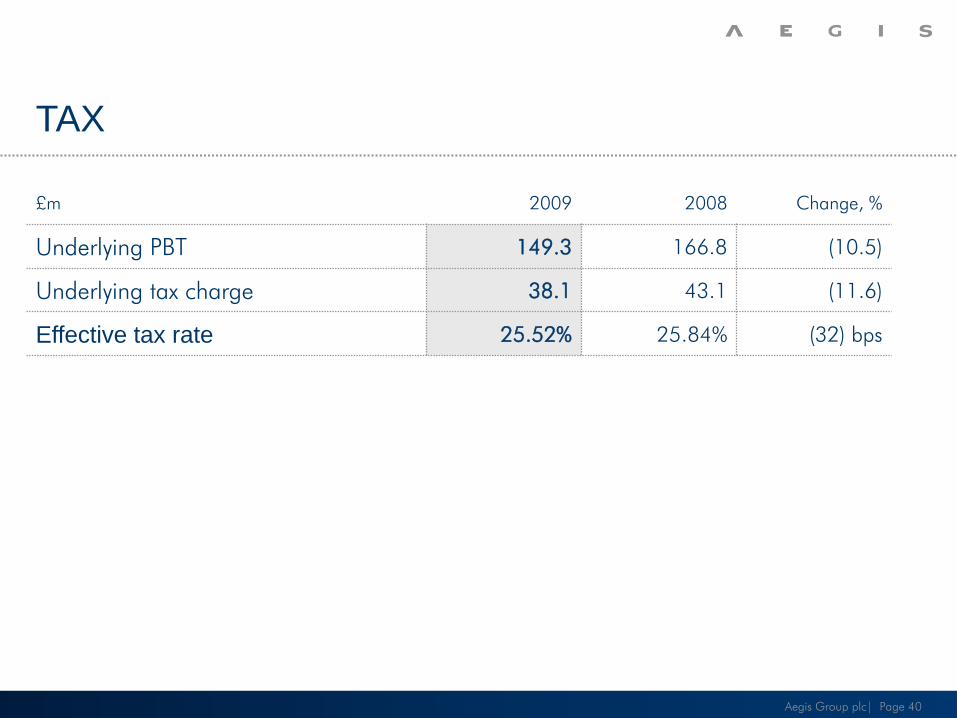
TAX
Aegis Group plc| Page 40
£m 2009 2008 Change, %
Underlying PBT 149.3 166.8 (10.5)
Underlying tax charge 38.1 43.1 (11.6)
Effective tax rate 25.52% 25.84% (32) bps
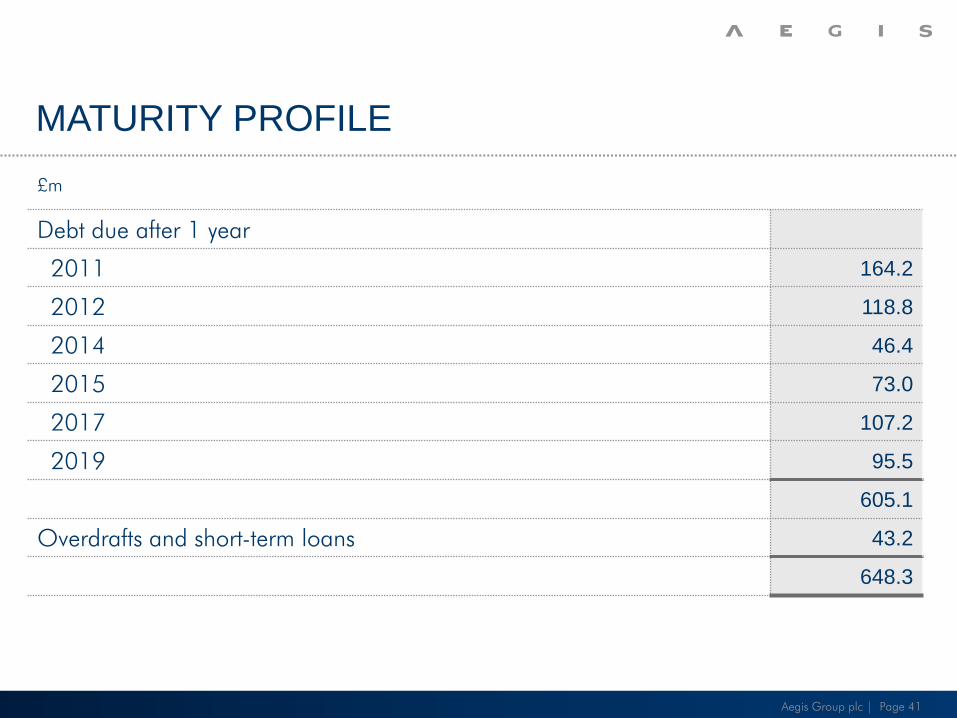
MATURITY PROFILE
Aegis Group plc | Page 41
£m
Debt due after 1 year
2011 164.2
2012 118.8
2014 46.4
2015 73.0
2017 107.2
2019 95.5
605.1
Overdrafts and short-term loans 43.2
648.3
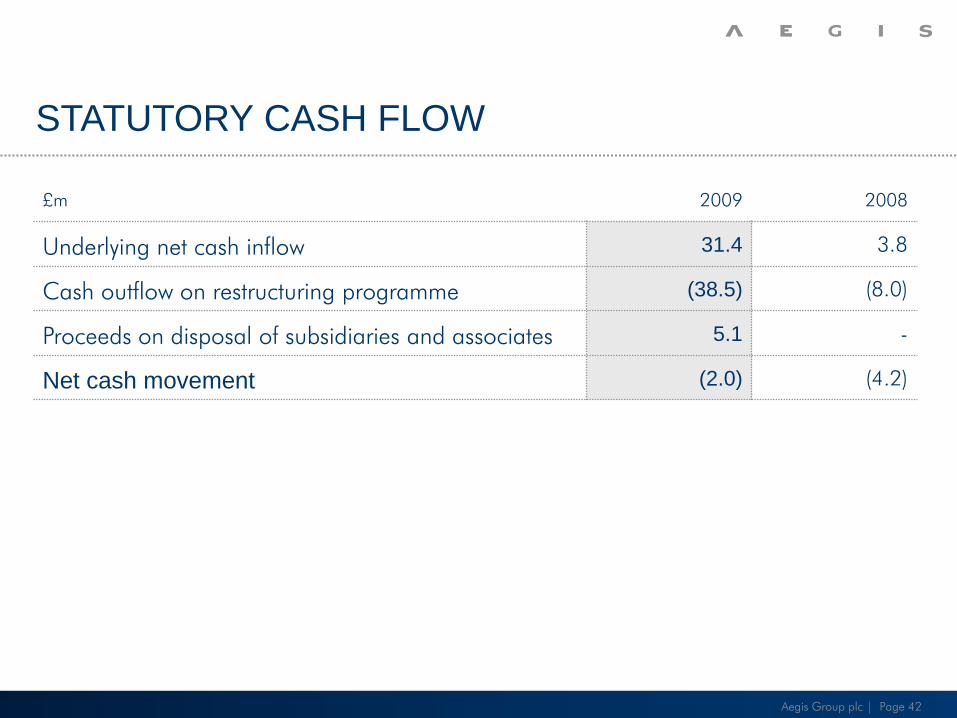
STATUTORY CASH FLOW
Aegis Group plc | Page 42
£m 2009 2008
Underlying net cash inflow 31.4 3.8
Cash outflow on restructuring programme (38.5) (8.0)
Proceeds on disposal of subsidiaries and associates 5.1 -
Net cash movement (2.0) (4.2)