Embed Size (px)
Citation preview
ADVERTISING TRENDSQ4 2015
A
P
P
E
L
I
B
O
M
Publication Date: March 2016

© 2015 Kenshoo Ltd. | CO-04-0004-EN 2 2© 2016 Kenshoo Ltd. | CO-04-0004-EN
Executive Summary and Key Metrics . . . . . . . . . . . . . . . . . . . . . . . . . . . . . . . . . . . . . . . . . . . . . . . . . . . . . . . . . . . . . 3
Introduction . . . . . . . . . . . . . . . . . . . . . . . . . . . . . . . . . . . . . . . . . . . . . . . . . . . . . . . . . . . . . . . . . . . . . . . . . . . 4
Top Trends . . . . . . . . . . . . . . . . . . . . . . . . . . . . . . . . . . . . . . . . . . . . . . . . . . . . . . . . . . . . . . . . . . . . . . . . . . . . 5
Ad Spend and Overall Cost per Install . . . . . . . . . . . . . . . . . . . . . . . . . . . . . . . . . . . . . . . . . . . . . . . . . . . . . . . . 5
Cost per Install Trends . . . . . . . . . . . . . . . . . . . . . . . . . . . . . . . . . . . . . . . . . . . . . . . . . . . . . . . . . . . . . . . . . 6
CPM and CPC Trends . . . . . . . . . . . . . . . . . . . . . . . . . . . . . . . . . . . . . . . . . . . . . . . . . . . . . . . . . . . . . . . . . . 7
Regional Trends . . . . . . . . . . . . . . . . . . . . . . . . . . . . . . . . . . . . . . . . . . . . . . . . . . . . . . . . . . . . . . . . . . . . . 9
Engagement Trends . . . . . . . . . . . . . . . . . . . . . . . . . . . . . . . . . . . . . . . . . . . . . . . . . . . . . . . . . . . . . . . . . . 10
Focus On . . . . . . . . . . . . . . . . . . . . . . . . . . . . . . . . . . . . . . . . . . . . . . . . . . . . . . . . . . . . . . . . . . . . . . . . . . . . . 11
Conclusion and Methodology . . . . . . . . . . . . . . . . . . . . . . . . . . . . . . . . . . . . . . . . . . . . . . . . . . . . . . . . . . . . . . . . 14
ontentsC
Ad Spend and Overall Cost per Install
Cost per Install Trends
CPM Trends
CPC Trends
5
5
8
8
6
6
9
7
7
Click-through Rate
8
9
Click-to-Install Rate
8
10
Operating System
11
Gaming
12
13

© 2015 Kenshoo Ltd. | CO-04-0004-EN 3 3© 2016 Kenshoo Ltd. | CO-04-0004-EN
Executive Summary
F Total spending increased +155% over Q4 of 2014, while the volume of mobile app installs increased by +196% . This resulted in an overall decrease in the cost per install year-over-year (YoY) .
F Several key trends showed little variation through the end of 2015, indicating that the app install market is not subject to the same seasonal effects as other areas within digital marketing .
F We don’t see evidence of ad price inflation as a result of the competition in the app install market . In fact, the cost basis for app install ads has remained fairly stable for the last three quarters of 2015, and prices are actually down overall compared to Q4 of 2014 .
F We continue to see lower click-through rates for gaming apps than other types, but these apps then have a higher likelihood of being installed after clicking on an ad .
F App install ads on Instagram already comprise over 20% of all paid social app install ad clicks in Q4, despite being
enshoo Mobile App Advertising Trends
PERCENT CHANGE YOY (Q4 2015 VS. Q4 2014)
Source: Kenshoo Mobile App Advertising Trends© 2016 Kenshoo Ltd., All Rights Reserved.
-11%+155% +187% +280% +196% -14% -33%
Spend Impressions Clicks Mobile App Installs
Cost per Install (CPI)
Cost per Thousand
(CPM)Cost per Click
(CPC)Click-through
Rate (CTR)
+32%
Key Metrics
K
a newer, and therefore smaller, ad platform. While Instagram app install ads have a lower level of engagement than the rest of paid social, they do provide a lower acquisition cost for marketers.

© 2016 Kenshoo Ltd. | CO-04-0004-EN 4
As mobile apps become more and more ubiquitous, the advertising ecosystem surrounding them continues to grow, with app install ads taking on a critical role for app developers to gain more visibility in a crowded market . To further punctuate this, Business Insider predicts that mobile app install ad revenue will hit $5 .4 Billion in the US in 2016 .
As social media publishers, new ad types, optimization strategies, and audience targeting capabilities are introduced at a rapid clip, successful advertisers are adopting these innovations into their marketing programs in order to seamlessly meet the needs of today’s super-connected consumer and make the most of the advertising opportunity .
Since early 2015, Kenshoo has been tracking the performance of these agile marketers' mobile apps within social advertising in our Mobile App Trends series to better understand the trends and developments in this new and exciting market .
With this release, Kenshoo has broadened the scope of our research . Previous reports looked at all social ad spending from advertisers who exist primarily, or even solely, to sell and market mobile applications on what is now known as the Kenshoo Gaming platform (formerly Adquant) . Now, we will be looking at all paid social ad spend on mobile app install and carousel app install ad types across both the Kenshoo Gaming and the Kenshoo Social platforms .
ntroductionI

© 2015 Kenshoo Ltd. | CO-04-0004-EN 5 5© 2016 Kenshoo Ltd. | CO-04-0004-EN
Spending on mobile app ads in social media continues to grow at a steady pace . The fourth quarter of 2015 more than doubled the spending of the fourth quarter in 2014, increasing by 155% . Compared to the previous quarter, spending was up 7% . While Q4 of this past year was the peak period over the last five quarters, the increase in spending from Q4 2014 to Q2 2015 demonstrates that this growth likely has more to do with the organic growth of the channel than any seasonal trends .
The volume of app installs tracks fairly closely with the spending trend, with an almost linear increase from Q4 to Q2 before leveling out through the second half of the year .
We can look at the overall efficacy of mobile app ad spending by seeing just how many apps were installed per advertising dollar . Here, the trend had been mostly flat for three quarters before rising 20% in Q4, but compared to the previous year, cost per install actually declined by 14% as the volume of app installs grew faster than spending .
Source: Kenshoo Mobile App Advertising Trends© 2016 Kenshoo Ltd., All Rights Reserved.
AD SPEND AND OVERALL COST PER INSTALL TRENDS
IND
EXED
VO
LUM
E (2
014
Q4=
1.00)
COST PER IN
STALL (CPI)
2014 Q4 2015 Q1 2015 Q2 2015 Q3 2015 Q40.00
0.50
1.00
1.50
2.00
2.50
$0.00
$0.50
$1.00
$1.50
$2.00
$2.50
3.00
3.50
Cost per Install (CPI)Indexed Ad Spend Indexed Mobile App Installs
op TrendsT
Ad Spend and Overall Cost per Install
$

6© 2016 Kenshoo Ltd. | CO-04-0004-EN
Source: Kenshoo Mobile App Advertising Trends© 2016 Kenshoo Ltd., All Rights Reserved.
COST PER INSTALL TREND
2014 Q4 2015 Q1 2015 Q2 2015 Q3 2015 Q4
$0.00
$0.50
$1.00
$1.50
$2.00
$2.50
Cost per install is down 14% from 2014, but is slightly up after three quarters of very little change . This overall rise was driven primarily by increases for iOS and consumer apps, which in turn helped both iOS and consumer apps maintain a higher CPI than Android and gaming apps in the quarter, respectively .
Cost per Install Trends
Source: Kenshoo Mobile App Advertising Trends© 2016 Kenshoo Ltd., All Rights Reserved.
CPI BY OPERATING SYSTEMQ4 2015
$0.00
$0.50
$1.00
$1.50
$2.00
$2.50
Android iOS
Source: Kenshoo Mobile App Advertising Trends© 2016 Kenshoo Ltd., All Rights Reserved.
CPI BY TYPEQ4 2015
$0.00
$0.50
$1.00
$1.50
$2.00
$2.50
Consumer Gaming
$3.00

7© 2016 Kenshoo Ltd. | CO-04-0004-EN
Source: Kenshoo Mobile App Advertising Trends© 2016 Kenshoo Ltd., All Rights Reserved.
CPM BY OPERATING SYSTEMQ4 2015
Android iOS
$0.00
$1.00
$2.00
$3.00
$4.00
$5.00
$6.00
Source: Kenshoo Mobile App Advertising Trends© 2016 Kenshoo Ltd., All Rights Reserved.
COST PER THOUSAND TREND
$0.00
$1.00
$2.00
$3.00
$4.00
$5.00
$6.00
2014 Q4 2015 Q1 2015 Q2 2015 Q3 2015 Q4
The overall trend for CPM is similar to what we saw for CPI, with a Q4 increase after a period of stability, but a decrease from the previous year . App Install ads for iOS carried about a one dollar premium over Android apps in Q4, while gaming apps were priced higher per 1000 impressions than their consumer counterparts .
CPM Trends
Source: Kenshoo Mobile App Advertising Trends© 2016 Kenshoo Ltd., All Rights Reserved.
CPM BY TYPEQ4 2015
Consumer Gaming
$0.00
$2.00
$4.00
$6.00
$8.00

8© 2016 Kenshoo Ltd. | CO-04-0004-EN
Source: Kenshoo Mobile App Advertising Trends© 2016 Kenshoo Ltd., All Rights Reserved.
COST PER CLICK TREND
$0.00
$0.10
$0.20
$0.30
$0.40
$0.50
$0.60
$0.70
$0.80
2014 Q4 2015 Q1 2015 Q2 2015 Q3 2015 Q3
The volume of clicks saw a much bigger increase from Q4 of 2014 to Q1 of 2015 than both the increases in spend and impressions over the same period, which dropped the cost of those clicks below $0 .50 for all of 2015 and bent the curve for CPC more than that of CPM . Once again, iOS and gaming apps maintain a price premium when compared to Android and consumer apps .
CPC Trends
Source: Kenshoo Mobile App Advertising Trends© 2016 Kenshoo Ltd., All Rights Reserved.
CPC BY OPERATING SYSTEMQ4 2015
Android iOS
$0.00
$0.10
$0.20
$0.30
$0.40
$0.50
$0.60
$0.00
$0.20
$0.40
$0.60
$0.80
Source: Kenshoo Mobile App Advertising Trends© 2016 Kenshoo Ltd., All Rights Reserved.
CPC BY TYPEQ4 2015
Consumer Gaming

9© 2016 Kenshoo Ltd. | CO-04-0004-EN
Source: Kenshoo Mobile App Advertising Trends© 2016 Kenshoo Ltd., All Rights Reserved.
CTR BY OPERATING SYSTEMQ4 2015
Android iOS
0.0%
0.2%
0.4%
0.6%
0.8%
1.0%
1.2%
Overall, click-through rate has been fairly stable for the past three quarters after engagement levels with app install ads increased for the first half of the reporting period . The heavy competition in gaming apps may be one factor in that app type showing lower initial engagement .
Source: Kenshoo Mobile App Advertising Trends© 2016 Kenshoo Ltd., All Rights Reserved.
CLICK-THROUGH RATE TREND
0.0%
0.2%
0.4%
0.6%
0.8%
1.0%
1.2%
2014 Q4 2015 Q1 2015 Q2 2015 Q3 2015 Q4
Click-through Rate
Source: Kenshoo Mobile App Advertising Trends© 2016 Kenshoo Ltd., All Rights Reserved.
CTR BY TYPEQ4 2015
Consumer Gaming
0.0%
0.2%
0.4%
0.6%
0.8%
1.0%
1.2%

10© 2016 Kenshoo Ltd. | CO-04-0004-EN
Source: Kenshoo Mobile App Advertising Trends© 2016 Kenshoo Ltd., All Rights Reserved.
CLICK-TO-INSTALL BY TYPEQ4 2015
Consumer Gaming
0%
10%
20%
30%
40%
50%
Source: Kenshoo Mobile App Advertising Trends© 2016 Kenshoo Ltd., All Rights Reserved.
CLICK-TO-INSTALL BY OPERATING SYSTEMQ4 2015
Android iOS0%
5%
10%
15%
20%
25%
Source: Kenshoo Mobile App Advertising Trends© 2016 Kenshoo Ltd., All Rights Reserved.
CLICK-TO-INSTALL RATE TREND
0%
5%
10%
15%
20%
25%
30%
35%
2014 Q4 2015 Q1 2015 Q2 2015 Q3 2015 Q4
We can calculate a more app-based conversion rate for mobile app advertisers by looking at the rate by which apps are installed, relative to the total number of clicks on those app ads . Android and iOS apps show little difference when viewed this way, and while we have seen that getting gaming apps from impression to click is a bit more difficult than for consumer apps, once consumers have clicked on a gaming app ad, they are much more likely to install .
Click-to-Install Rate

11© 2016 Kenshoo Ltd. | CO-04-0004-EN
ocus On...F
Android had greater increases in both QoQ and YoY spend, but iOS is growing at comparable, if somewhat smaller rates, and still comprises nearly ²⁄₃ of mobile app ad spend . iOS also brought clicks and app installs more into alignment with that share of spending, areas where Android had more parity at the same point last year .
Across the board, iOS commands a price premium over Android whether on the basis of app installs, impressions, or clicks . On the engagement side, Android is at least as good or better, with a comparable click-to-install rate and a slightly higher CTR .
Source: Kenshoo Mobile App Advertising Trends© 2016 Kenshoo Ltd., All Rights Reserved.
SHARE OF VOLUME BY OPERATING SYSTEM
0%
10%
20%
30%
40%
50%
60%
70%
80%
90%
100%
2014 Q4 2015 Q4
Impressions
2014 Q4 2015 Q4
Clicks
2014 Q4 2015 Q4
Speed
2014 Q4 2015 Q4
App Install
Android iOS
Operating System

12© 2016 Kenshoo Ltd. | CO-04-0004-EN
Source: Kenshoo Mobile App Advertising Trends© 2016 Kenshoo Ltd., All Rights Reserved.
CLICK-TO-INSTALL RATE BY TYPEQ4 2015
Consumer Gaming0%
10%
20%
30%
40%
50%
Click-to-install Rate is really the tip of the iceberg for proving out the return on ad spend in the mobile app ecosystem, as mobile app engagement, in-app advertising, and in-app purchases all play large roles in establishing lifetime value for this class of mobile app .
Source: Kenshoo Mobile App Advertising Trends© 2016 Kenshoo Ltd., All Rights Reserved.
Cost Per Install
$0.00
$1.00
$2.00
$3.00
$4.00
$5.00
$6.00
$7.00
PRICE METRICS BY TYPEQ4 2015
CPM CPC
As we build out our analysis to include more non-gaming apps, the particular behavior of those gaming apps becomes more clear . Specifically, the higher rate gaming app advertisers pay for both impressions and clicks speaks to the value placed on both eyeballs and ad clicks, and this value is borne out by the fact that gaming apps convert to app installs at a much greater rate than regular consumer apps . This results in gaming apps actually have a lower CPI than consumer apps, which goes a long way to negate any sticker shock associated with those higher prices .
Gaming
13© 2016 Kenshoo Ltd. | CO-04-0004-EN
Source: Kenshoo Mobile App Advertising Trends© 2016 Kenshoo Ltd., All Rights Reserved.
INSTAGRAM PRICE METRICS COMPARISONQ4 2015
Cost Per Install
$0.00
$1.00
$2.00
$3.00
$4.00
$5.00
$6.00
$7.00
CPM CPC
All Other Placements Instagram
Source: Kenshoo Mobile App Advertising Trends© 2016 Kenshoo Ltd., All Rights Reserved.
INSTAGRAM INSTALL RATE COMPARISONQ4 2015
All other Placements Instagram0%
10%
20%
25%
35%
40%
5%
15%
Source: Kenshoo Mobile App Advertising Trends© 2016 Kenshoo Ltd., All Rights Reserved.
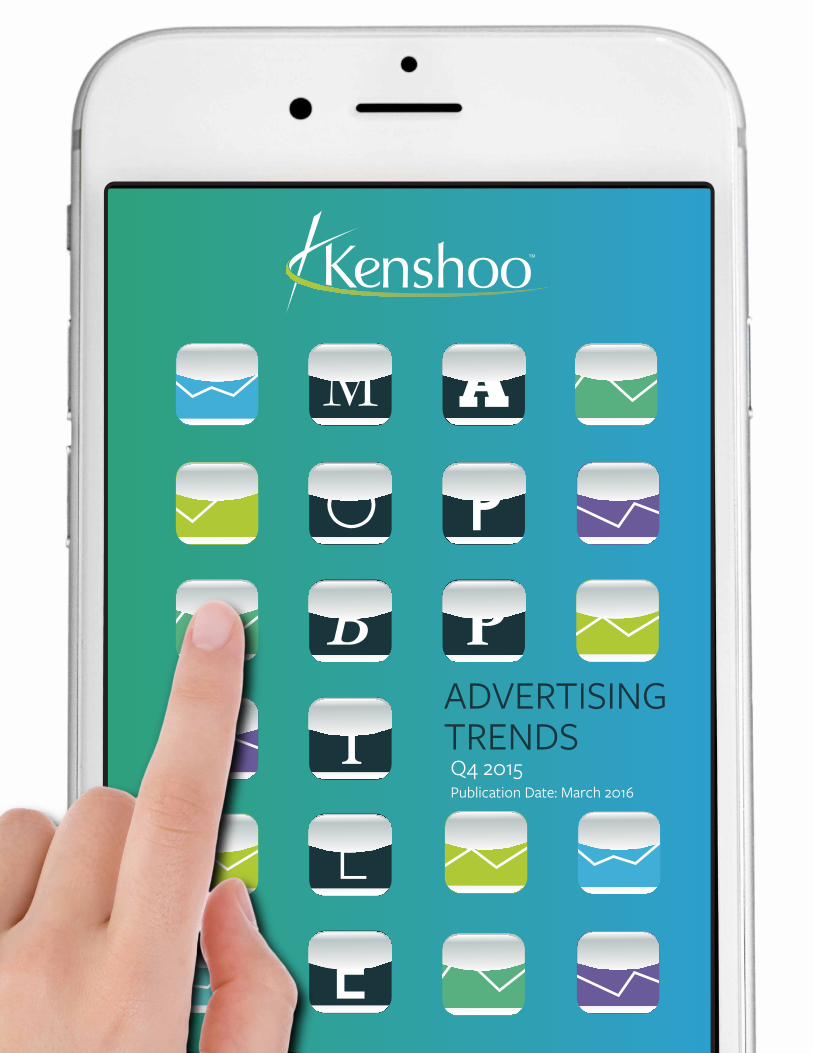
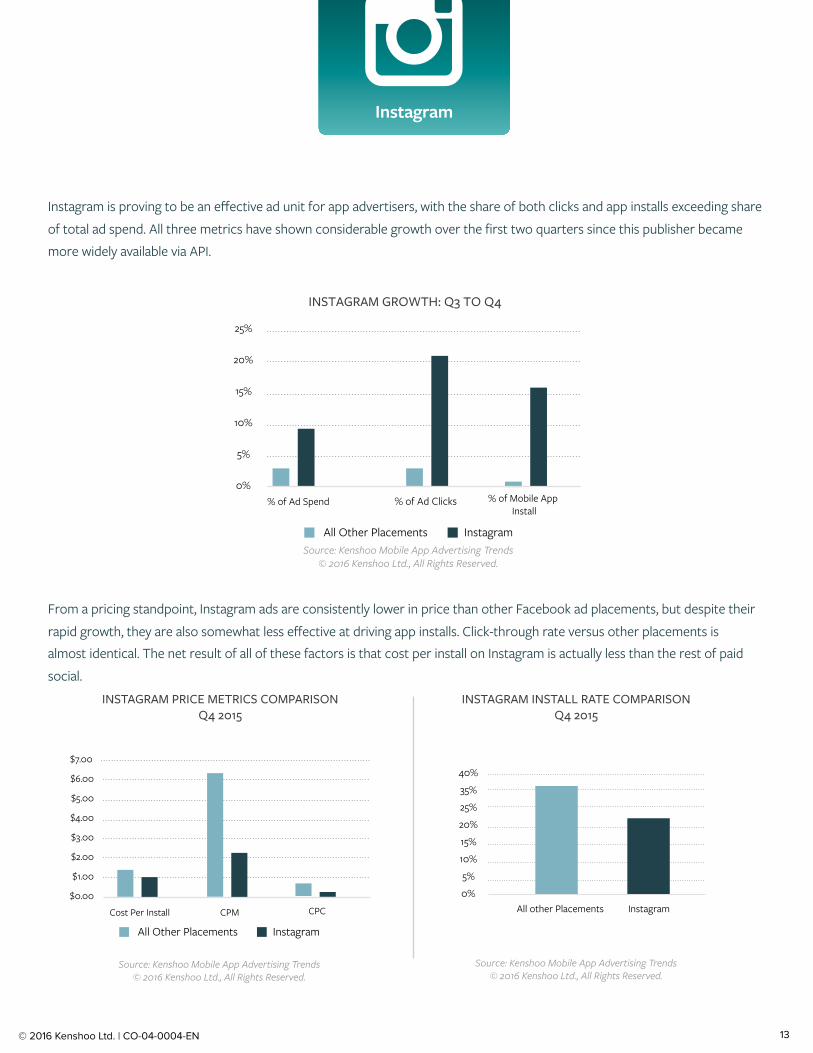
From a pricing standpoint, Instagram ads are consistently lower in price than other Facebook ad placements, but despite their rapid growth, they are also somewhat less effective at driving app installs . Click-through rate versus other placements is almost identical . The net result of all of these factors is that cost per install on Instagram is actually less than the rest of paid social.
% of Ad Clicks0%
5%
10%
15%
20%
25%
% of Ad Spend % of Mobile App Install
All Other Placements Instagram
Instagram is proving to be an effective ad unit for app advertisers, with the share of both clicks and app installs exceeding share of total ad spend . All three metrics have shown considerable growth over the first two quarters since this publisher became more widely available via API .
INSTAGRAM GROWTH: Q3 TO Q4

© 2016 Kenshoo Ltd. | CO-04-0004-EN 14
As the ecosystem around mobile apps continues to evolve, the only thing the agile marketer can really count on is change . More ad types, more publishers, and more ways to reach audiences are being released at a regular clip . By focusing on some of the primary cost and engagement metrics, marketers can start to achieve a greater understanding of how the pieces fit together in this fragmented world .
For marketers, the key takeaways from these latest findings include:
• App install ads have not seen notable price inflation, so the risk of starting, continuing or expanding appadvertising campaigns remains low .
• iOS and Android apps are moving towards parity in terms of share across multiple metrics, although iOS stillholds an advantage . If the iOS audience is somewhat larger in this view, that does come at a premium forimpressions and clicks .
• Instagram provides an opportunity for app advertisers to acquire new customers at a lower cost than othersocial ads .
• For the gaming segment, don’t be deterred by CPM and CPC rates, as the target market for these apps have ahigh propensity to follow through to actual installation .
The trends presented here hope to unlock a greater understanding of this space, but as we have emphasized previously, your mileage may vary . Incorporating additional elements of the app experience like in-app engagement and lifetime value (LTV) are other ways to optimize app campaigns to your specific goals and maximize the app opportunity . An “apportunity,” perhaps?
The report includes five quarters of data from October 2014 through December 2015, and reflects spending and performance specifically on the Mobile App Install ad type from advertisers across the Kenshoo Gaming (formerly Adquant) and Kenshoo Social platforms on the Facebook® Audience Network . The resulting data set comprises over $85 million (USD) in advertiser spend, and over 45 million app installs, targeted across over 100 countries worldwide .
onclusionC
ethodologyM
14© 2016 Kenshoo Ltd. | CO-04-0004-EN