Embed Size (px)
Citation preview

ADVERTISINGAND ECONOMIC GROWTH
WORLD FEDERATIONOF ADVERTISERS
UNIONDES ANNONCEURS

All rights reserved - Union des annonceursReproduction permitted conditional on inclusion of note
“Advertising and economic growth – UDA”Legal submission 2nd term 2006
ADVERTISING AND ECONOMIC GROWTH
Doctorate Thesis in Economics
submitted by Maximilien Nayaradou to the University of Paris 9 - Dauphine
Synthesis and principal conclusions drafted by the author
The English translation was prepared by and is the sole responsibility of the World Federation of Advertisers (WFA)
UDA – UNION DES ANNONCEURS(French Association of Advertisers)
A D V E R T I S I N G A N D E C O N O M I C G R O W T H 3
Doctorate Thesis in Economics
Thesis Director
Jean-Hervé LORENZI, Professor at the University of Paris 9 - Dauphine
Jury
Rapporteurs
Xavier GREFFE, Professor at the University of Paris 1Pierre KOPP, Professor at the University of Paris 1
Voting Members of Jury
Laurent BENZONI, Professor at the University of Paris 2Jean-Marie CHEVALIER, Professor at the University of Paris 9
Gérard NOËL, Vice-President and Director General of UDA

5A D V E R T I S I N G A N D E C O N O M I C G R O W T H
Tabl
e of
Con
tent
s7
9
11
17
29
35
39
The mechanisms by which advertising has an effect on economic growth
Correlations between advertising spend and economic growth
Preamble
Introduction
Investment in advertising and the economic stakes involved
Media space and advertising spend
Conclusion

6 J U N E 2 0 0 6

7A D V E R T I S I N G A N D E C O N O M I C G R O W T H
Paradoxically, while advertising represents a major intangible investment on the part of com-panies, very little is known about its wider economic role. Economists, who have long been praising the virtues of R&D as a lever for economic growth, are practically silent on advertising spend, while the latter probably represents a greater amount (in the region of 700 billion euros per annum globally)! Addressing this omission has become a matter of urgency.
Maximilien Nayaradou, the author of a doctorate thesis for the University of Paris-Dauphine, undertook this task under the guidance of his thesis director Professor Jean-Hervé Lorenzi, Pre-sident of the French ‘Cercle des économistes’. There was one simple objective: to contribute to a better understanding by economic and political actors of the mechanisms by which com-pany investments in commercial communications influence the economic growth of developed countries.
Because his approach was interesting and original, the UDA (the Union des Annonceurs or French Advertisers’ Association), a body that had long been wishing to study this question, decided to actively support and finance his work. This work also benefited from the support and financing of the Ministry of Research, the World Federation of Advertisers (WFA) and the IREP (Institute of Advertising Research and Studies).
This thesis, officially submitted in 2004, was graded “with great distinction, with the Jury’s con-gratulations”, the highest possible award.
Interesting as they may be, academic works are often inaccessible to the ordinary reader, be-cause they are voluminous (in some cases running to 750 pages). Accordingly, our request to Maximilien Nayaradou was to condense his work and to deliver the essential aspects of the con-clusions to which it led in a “boiled down” format. However, should the reader wish to refer back to the original document – the thesis as it was initially presented – it is available upon simple request to the UDA.
By introducing Maximilien Nayaradou’s principal findings in this document, our wish is to pro-mote knowledge and understanding of the economic mechanisms essential for growth and to encourage researchers to pursue this subject in greater depth.
Finally, it should be taken into account that the work carried out by Maximilien Nayaradou adopts a macroeconomic point of view. Its findings are therefore valid only from this perspective and not from a microeconomic perspective. Indeed, each company taken in isolation has its own criteria for analysing the opportunity presented by advertising investments and the effectiveness of such investments.
Union des annonceurs
Dominique Reiniche Gérard Noël Françoise RenaudPresident (2004-2006) Vice-President & Director General Marketing Research Director
Preamble

8 J U N E 2 0 0 6

9A D V E R T I S I N G A N D E C O N O M I C G R O W T H
The following findings were obtained using the tools available in economic sciences (macroeco-nomics, industrial economics, statistical analysis, econometrics) following an in-depth analysis of the theories and studies available on both sides of the Atlantic – for the years 1990 to 2000. Then demonstrate the positive impact investments in advertising have on growth by means of four key mechanisms:
• Consumption: the sectors in which advertising investments are highest are also those in which consumption is growing the most in terms of volume. Accordingly, they contribute pro-portionally more to economic growth in general than other sectors;
• Innovation: the sectors in which investment is above average both in advertising and in in-novation and R&D, are also those in which the growth of added value is highest. The con-tribution of those sectors to growth is therefore significantly greater than that made by the sectors in which investment activity is limited to innovation and R&D. To obtain the best levels of economic performance, investment in innovation and R&D must go hand-in-hand with a similar effort in terms of advertising;
• Competition: those sectors in which the advertising investment rate is highest are also those in which the market shares of companies are least rigid and in which competition, a recogni-sed driver of growth, is liveliest;
• Sectoral leverage effect: as an economic sector in its own right, advertising is a multiplier of economic growth. In this sector, added value is increasing twice as fast as it is in the economy as a whole and its contribution to employment growth is four times greater than the average for the overall economy. This sector therefore exerts a positive leverage effect on growth.
One of the contributions of this study is the unveiling of positive correlations between “advertising investments” and “economic growth”, which sheds fresh light on the relationship between the two. It demonstrates a positive correlation between the advertising investment rate and pro-ductive efficiency (itself an original indicator of the efficiency of economic growth). The greater the increase in the advertising investment rate, the greater the increase in productive efficien-cy (and vice versa). Economic growth is significantly weaker in those developed countries where there is relatively low investment in advertising. The conclusion is that advertising investment, and in particular media advertising investment, improves the economic efficiency of material investments.
These findings should help those public authorities responsible for regulating the advertising market to take better account of the impact of an increase or a fall in the advertising investment rate in respect of general economic performance. Statistics demonstrate that the more extensive the advertising space available, the higher the rate of investment in media advertising and the greater the strength of economic growth. From a strictly economic point of view, it is therefore appropriate to promote the emergence of a wide advertising offer to ensure that advertising investment is used to boost economic growth in the best possible way.
Introduction

10 J U N E 2 0 0 6
Finally, two essential comments:
• While in the past the majority of economic studies have been limited to media advertising, this study covers the entire field of advertising, namely that of traditional media advertising (press, radio, TV, posters, cinema, Internet, etc.) and non-traditional media (direct marke-ting, promotions, event-related, directories, public relations, sponsorship, etc.). This ap-proach thus also represents an enrichment of the economic knowledge available – extremely insufficient to date – in respect of non-traditional media investment. Regrettably, however, the reliability of the data available is inadequate and there is a lack of proven and standardised me-thodologies for understanding the weighting of non-traditional media elements in the various countries;
• This research work is based primarily on the French and American economies, however data relating to the other European countries and Japan have also been used, in particular in eva-luating the various correlations.

11A D V E R T I S I N G A N D E C O N O M I C G R O W T H
INVESTMENT IN ADVERTISING ANDTHE ECONOMIC STAKES INVOLVED
Advertising investment is becoming an increasingly significant element in the
GDP of the industrialised world, even if all countries have not yet reached the
same level of development. Along with traditional media, non-traditional media
communication has developed considerably. Non-traditional media and the Inter-
net are making progress at the expense of the traditional media. To date, there
has still been little analysis of these trends by economists, divided as they are into
pro-advertising and anti-advertising camps.
The economic stakes involvedBefore analysing the impact of advertising investment on the economy, we should refer back to the basic data relating to advertising markets throughout the world.A few figures suffice to summarise the importance of advertising in the modern economy and in the creation of wealth.
• In 2002, companies’ advertising expenditure already exceeded 700 billion euros worldwide, i.e. 2% of GDP.
• With 29 billion euros invested in advertising in France in 2002, i.e. the equivalent of 1.9% of the wealth created, the advertising investment rate (ratio of advertising expenditure to GDP) was halfway between that of the United States (2.66% of GDP) and that of Japan (1.13%).
• In France, the volume of advertising expenditure is thus much greater than the defence budget (1% of GDP) and practically the same as the expenditure on research and development (public and private sector).
Media and non-traditional media advertising investment and GDP in 2002 Proportion of advertising Total spent on advertising investment in GDP in billions of euroWorld 2.06%1 7141
Main European countries 1.95%2 142.52
United States 2.66% 295France 1.90% 29Japan 1.13% 48
Sources: Cnuced, Ad Barometer, Warc
1 Estimates produced on the basis of data from Cnuced and hypotheses on the global total of non-traditional media advertising investment.
2 Total of advertising expenditure for the year 2002 for the following countries: Germany, France, the United Kingdom, Spain and Italy.
tabl
e 1

12 J U N E 2 0 0 6
Taking media advertising expenditure strictly on its own, the following table illustrates its volume in 2004.
From an economic point of view, advertising is an element of investment referred to as “intan-gible”, a category which also includes patents, licences, R&D expenditure, software, training, technology purchases, etc. In modern economies, these intangible investments are becoming increasingly significant. Accordingly, over the period 1990 to 2000 in France, they developed at a rate 2.4 times faster than traditional material investment. Consequently, for the second half of this decade (1995-2000), intangible investment already represented almost one third of total investment in France (in the United States, the figure is well above this).Now, this dynamism in intangible investment is currently being supported by advertising invest-ment, which is a major component of it: in France, + 45% over the period from 1994 to 2000. Ac-cordingly, since 1990, investment in advertising in France has been rising 1.7 times more rapidly than traditional material investment, today representing 15% of the total volume of investment (material and intangible).
SIGNIFICANT DIFFERENCES BETWEEN COUNTRIES
Advertising is a feature of a rich and developed society: those countries with high advertising expenditure display a high level of GDP per capita.
Media advertising investment and GDP in 2004 Proportion of media Amount spent on media advertising investment in GDP advertising in billions of euroMain developed countries 0.92% 208Main European countries 0.77%1 59United States 1.12% 106France 0.54% 11Japan 0.87% 32
Sources: Ad Barometer
1 Total advertising expenditure for the year 2004 for the following countries: Germany, France, the United Kingdom, Spain and Italy.
tabl
e 2
Comparison of advertising investment rate (media and non-traditional media) in 2002Advertising investment rate Total Media Non-traditional media Base: 100, United States United States 100 100 100Germany 79 60 92United Kingdom 74 78 71France 64 53 73Spain 58 64 53Italy 46 56 40Japan 41 70 19
Sources: Ad Barometer
tabl
e 3

13A D V E R T I S I N G A N D E C O N O M I C G R O W T H
However, even in countries with extremely similar levels of development, one can discern great differences in terms of ad spend to GDP ratios.As can be seen in Table 3, which compares the volume of advertising as a percentage of GDP in the major industrialised countries, the advertising investment rate in the United States is 2.5 times higher than in Japan and more than twice that of Italy. These differences are considerable and may be viewed as surprising. Indeed, one would have thought that the increase in exchanges between countries of similar development levels would have brought the share of advertising as a part of GDP more closely into line.
Comparison of media advertising investment rate in 2002 and 2005Comparison of advertising investment rate 2002 2005 Base: 100, United States United States 100 100Germany 60 65United Kingdom 78 90France 53 60Spain 64 71Italy 56 64Japan 70 80China - 55Russia - 68
Sources: Ad Barometer
tabl
e 4
And these differences do not blur over time, as is shown in Table 4, even if it would seem that the developed countries (Europe, Japan) are gradually tending to fall into line with the American mo-del. We can see even clearer differences between these countries when the advertising market is broken down into its two major components: media and non-traditional media (see Graph 1). In certain countries, the non-traditional media element accounts for two thirds of the advertising market (68% in Germany, 65% in France). Conversely, in Japan it is media investment (73% of the total), which enjoys the lion’s share. The relationship is more balanced in the United States, in the United Kingdom and in the Latin countries such as Italy and Spain.
Media/non-traditional media split in 2002
Sources: Ad Barometer
grap
h 1
����� ���������������������
�������������
�������
��������������
������
������
�����
�����
�����
��������
��������
��������
��������
��������
��������
��������
��������

14 J U N E 2 0 0 6
On the other hand, two basic trends are discernible throughout.
1. Non-traditional media advertising investment is growing more rapidly (see Table 5). This is a massive phenomenon and, over the period 1992-2002, has been identified in equal measure in those countries in which non-traditional media was already predominant as in those in which it was already on the wane.
Development of the proportions of media and non-traditional media advertising expenditure (1992/2002) Media Non-traditional media 1992 2002 1992 2002United States 68% 42% 32% 58%Germany 40% 32% 60% 68%United Kingdom 52% 44% 48% 56%France 38% 35% 62% 65%Spain 54% 47% 46% 53%Italy 55% 50% 45% 50%Japan 75% 73% 25% 27%
Sources: Ad Barometer
tabl
e 5
2. The growth in advertising investment benefits two specific areas in particular: non-traditional media (see Table 5) and television (see Table 6). The fact that media investment is less buoy-ant in comparison with non-traditional media is due to the significant and general decline of advertising investment in the printed press.
Development of the proportion of advertising expenditure by media, excluding Internet (1990/2002) Press TV Radio Posters CinemaUnited States - 17% + 12% + 16% - 4% -Germany - 16% + 37% - 1% + 33% - 7%United Kingdom - 20% + 4% + 105% + 95% + 141%France - 13% + 23% + 10% - 16% + 34%Spain - 26% + 31% - 9% + 4% 0%Italy - 19% + 15% + 43% - 27% + 67%Japan - 10% + 22% - 27% - 24% -
Sources: Ad Barometer
tabl
e 6

15A D V E R T I S I N G A N D E C O N O M I C G R O W T H
Summary of post-war economic literature:existing theories
Do economists consider advertising a factor in economic growth or not? They are far from reaching an agreement on it and their differences of opinion cut across the major schools of thought.
Those economists who stress the positive impact of advertising on economic growth claim that it tends to promote:• competition• the spread of information available within the economy• consumption• a reduction in production costs• the arrival of new competitors offering innovative products.
In contrast, those economists with a less favourable view of advertising underline that the condi-tions required for advertising to exert a positive influence on growth rarely occur together. Accor-ding to these economists, advertising has a negative impact on growth, as it tends to promote:• an increase in costs and therefore in consumer prices,• the dominant companies,• superfluous investments to the detriment of genuinely productive investments,• the proliferation of falsely differentiated products.
If pro-advertising economists are more post-Keynesian or ultra-liberal, their anti-advertising opponents, on the other hand, tend rather to be institutionalist economists and in some cases neo-classicists.• among the liberals, the Chicago neo-classicists (the ultra-liberals such as Stigler) tend to be
pro-advertising, while the Harvard neo-classicists (the moderate liberals such as Comanor and Wilson) tend to be rather anti-advertising,
• in the interventionist camp, the Keynesians (Kaldor) are more pro-advertising, while the insti-tutionalists (such as Galbraith) are more anti-advertising.
Ideological quarrels aside, in the final analysis we are able to judge the validity of these theories by putting them to the test in terms of facts and figures and, in doing so, answering in an empi-rical manner the central question of whether advertising represents a positive or negative factor in economic growth.

16 J U N E 2 0 0 6

17A D V E R T I S I N G A N D E C O N O M I C G R O W T H
THE MECHANISMS BY WHICH ADVERTISING HAS AN EFFECT ON ECONOMIC GROWTH
The analysis of statistical data from the main industrialised countries shows that
advertising investment has a positive effect on economic growth via four mecha-
nisms: it stimulates growth in consumption, accelerates the spread of innovation,
promotes competition, and the dynamism inherent in the advertising sector in
turn boosts the average GDP growth rate.
The more a company disseminates information about its products, the more it can hope to sell them. By undertaking greater or lesser levels of advertising, it achieves an expectation, greater or lesser, of prospective sales.
So while accountants always treat them as expenditure, the sums dedicated to advertising may be considered as an investment, a specific, intangible investment. Indeed, advertising expenditure allows a company to acquire an asset that is otherwise very difficult to obtain: “symbolic capital”, an intangible value based on its general profile, reputation and the image it has acquired.
In today’s economy, where companies are engaged in a global competition and a search for in-creasing returns (the more production rises, the more unit costs are reduced), advertising in-vestment becomes necessary to win or defend market shares. The more “symbolic capital” a company has, the better the chances its efforts will be crowned with success. The value placed on strong brand names today and the care taken to preserve them bear witness to this.
Advertising facilitates the emergence and spread of new consumer standards, as it affects the perception held by consumers of the utility, quality and advantages of a product. This impact af-fords it its own productivity, over and above the classic functions of traditional investment.
These specific characteristics of advertising investment also explain – in spite of the great pro-gress made in recent years – why it is difficult to quantify its effectiveness accurately beforehand. For a company, having an expectation of additional prospective sales is not the same as having the certainty of selling more products. This is only a probability. In some cases, the increase in volumes does not match the agreed level of advertising investment.

18 J U N E 2 0 0 6
It is precisely because advertising is an investment that is inherently productive that it is possible to study how it impacts on economic growth.Accordingly, it is possible to identify four mechanisms by which investment in advertising com-munication has an indirect, but unquestionable, impact on economic growth, thanks to four levers recognised by most economists as being stimulating factors in terms of economic growth:• consumption (in a developed country such as France, it accounts, on average, for 47% of growth in GDP),• innovation (particularly the speed at which it is spread),• competition,• the financing of dynamic economic sectors associated with advertising: advertising activities in
the strict sense, but also support media and non-traditional media service providers, etc.
First mechanism:Advertising stimulates the growth of consumption.
Three correlations provide evidence of the genuine impact of advertising investment on con-sumption, one of the key elements of economic growth.
Correlation between the consumption propensity of households and the rate of media advertising investment (averages for the period 1991-2000)
Sources: World Bank, Ad Barometer, Warc
���
���
���
���
�
���
���
���
���
���
�� �� ��� �� �� ��
�������������������������������������������������
��������������������������������������������
���������
�������
�������
�������
������
������������
��������������������
������
��������������
�������������
grap
h 2

19A D V E R T I S I N G A N D E C O N O M I C G R O W T H
FIRST CORRELATIONTHE COUNTRIES IN WHICH THE MEDIA ADVERTISING INVESTMENT RATE IS HIGHEST ARE THOSE IN WHICH THE PROPENSITY FOR CONSUMPTION IS ALSO HIGHEST
A comparison of a dozen industrialised countries (the United States, Japan, Australia and nine Eu-ropean countries, see Graph 2) shows that for the period 1991-2000, a strong correlation exists between a high media advertising investment rate (media advertising investment expenditure/GDP) and a high propensity for consumption (the proportion of income reserved for consumption).
A simple correlation certainly does not explain causality, and does not indicate what is acting upon what. Nevertheless, it is probable that the two elements of the correlation have an impact on each other.
SECOND CORRELATIONAN INCREASE IN THE ADVERTISING INVESTMENT RATE IS FOLLOWED SOME MONTHS LATER BY A RISE IN CONSUMPTION
Analysis of very short-term variations (monthly variations) in consumption in France in a number of key sectors for the period 1998-2001 (automobile, clothing, household electricals, retail distri-bution and furniture) is very revealing: here, increases in consumption have been systematically preceded – one to three months earlier – by a rise in advertising investment.
If deprived of their advertising investments, French companies would therefore not achieve the sales figures achieved. Advertising investment sustains the propensity to consume. Without ad-vertising, the level of consumption reached in the country would not be the same – and this to the detriment of growth. This conclusion is underlined by the sector-based analysis of advertising investment in France during the 1990s.
THIRD CORRELATIONTHE SECTORS WHICH EITHER UNDERTAKE EXTENSIVE ADVERTISING OR WHICH HAVE INCREASED THEIR EFFORTS IN THIS FIELD ARE EXPERIENCING GREATER GROWTH
A sector is said to be one of a “high advertising investment rate” or to be an “over-advertiser” if its share of total advertising investment is significantly higher than its share of global consumption. For example, the beauty products sector, which accounted for 9% of French media advertising investment in the 1990s, while only accounting for 2% of household consumption, is regarded as an over-advertising sector.
Analysis of the statistical data for the French economy for the period 1992-1999 throws up two striking results.
1. Those sectors with the strongest volume of growth in consumption (1.5 to 2.4 times higher than the average growth in consumption) are those sectors in which the advertising investment rate was highest. These sectors of a high advertising investment rate, “over-contributing” to the growth in consumption and the growth of added value are:
20 J U N E 2 0 0 6
• telecommunications,• services (banking, insurance, etc.),• culture and leisure activities (games, toys, etc.).• finance (financial products, financial information, etc.),• industrial services with high added value (the environment, security, etc.).
2. The other sectors that also have a high advertising investment rate have a growth in consump-tion in terms of volume or a growth in added value that is 1.3 to 2 times higher, on average, than the growth in GDP:• household appliances,• maintenance,• beauty products,• audio, photographic, computing,• sports equipment and hardware.
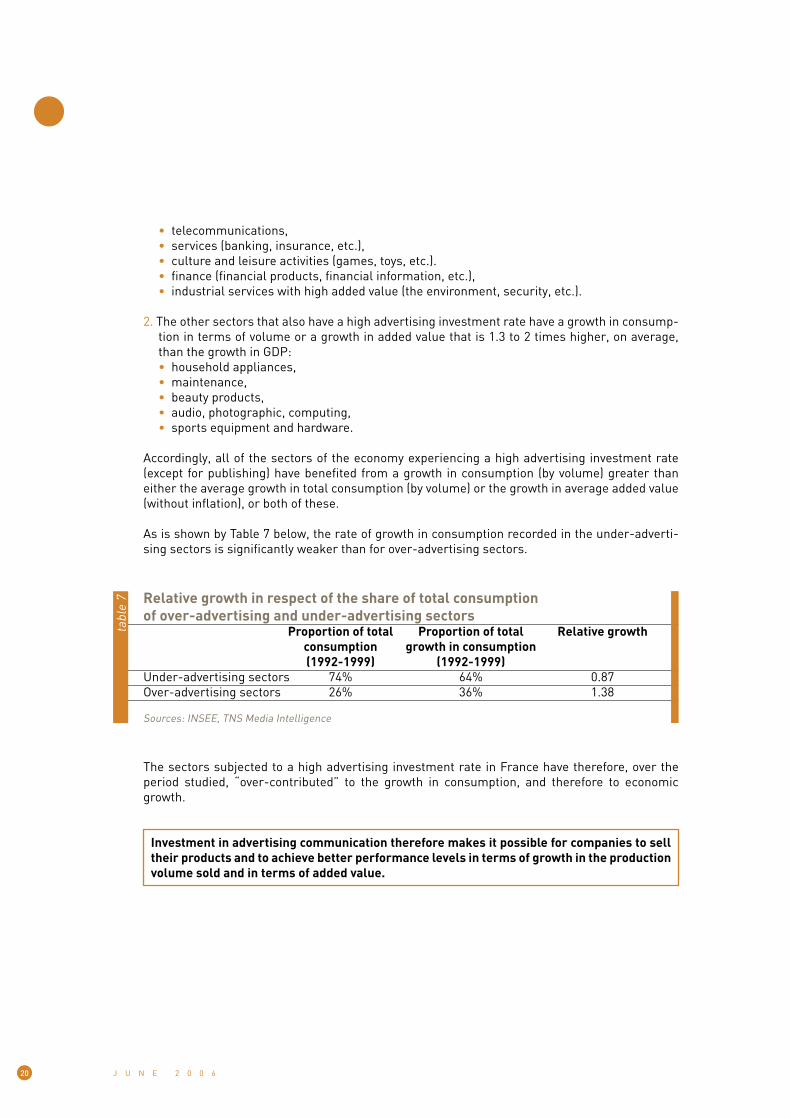
Accordingly, all of the sectors of the economy experiencing a high advertising investment rate (except for publishing) have benefited from a growth in consumption (by volume) greater than either the average growth in total consumption (by volume) or the growth in average added value (without inflation), or both of these.
As is shown by Table 7 below, the rate of growth in consumption recorded in the under-adverti-sing sectors is significantly weaker than for over-advertising sectors.
Relative growth in respect of the share of total consumption of over-advertising and under-advertising sectors Proportion of total Proportion of total Relative growth consumption growth in consumption (1992-1999) (1992-1999) Under-advertising sectors 74% 64% 0.87Over-advertising sectors 26% 36% 1.38
Sources: INSEE, TNS Media Intelligence
tabl
e 7
The sectors subjected to a high advertising investment rate in France have therefore, over the period studied, “over-contributed” to the growth in consumption, and therefore to economic growth.
Investment in advertising communication therefore makes it possible for companies to sell their products and to achieve better performance levels in terms of growth in the production volume sold and in terms of added value.

21A D V E R T I S I N G A N D E C O N O M I C G R O W T H
Second mechanism:Advertising speeds up the spread of innovation
For economists, innovation is a fundamental element of a dynamic economy. Advertising is a lever facilitating the conversion of R&D expenditure into profits. In fact, it plays an essential role in speeding up the transformation of technological progress, always susceptible to being left un-exploited, into a profit-making product innovation, because it allows for demand to be tailored to supply as quickly as possible.
INNOVATION AND ADVERTISING INVESTMENT GO HAND IN HAND
Analysis of the sectoral statistics for the French secondary sector produces a double finding: the more a sector undertakes innovation, the more it will tend to increase its investment in adverti-sing; and the more a sector invests in advertising, the more it will increase the share of turnover dedicated to innovation. We can, in fact, identify a double correlation:• a strong correlation between a high level of advertising and increased innovation,• a strong correlation between a high level of innovation and increased advertising.
To go into these results in more depth, the ratios measuring the intensity of innovation work (innovation expenditure/turnover and R&D expenditure/turnover) have been juxtaposed, for 14 sectors of industry, with the ratio measuring advertising pressure in each respective sector.
More or less innovative sectors
The ratios of innovation expenditure/turnover and R&D expenditure/turnover have been de-veloped with the help of figures taken from the Ministry of Research’s annual study of the resources devoted to research and development by companies in 2000 and its study of the financing of innovation.These sectors can be classified into three categories based on the higher or lower percentage of companies stating that they are involved in innovative markets:• innovative sectors: more than 50% of companies in the sector state that they are involved in
innovative markets,• averagely innovative sectors: between 35% and 50% of companies in the sector state that
they are involved in innovative markets,• non-innovative sectors: less than 35% of companies in the sector state that they are in-
volved in innovative markets.
THE INNOVATION - ADVERTISING INVESTMENT PAIRING IS EFFECTIVE
Do those sectors that invest more than average in both advertising and innovation/R&D reap the benefits, and do they report better performance levels than the others? In fact, those sectors that increase their level of advertising investment at the same time as their level of innovation/R&D do not necessarily do more advertising and innovation than average.

22 J U N E 2 0 0 6
To answer this question, the various sectors have been positioned in relation to two axes, Adver-tising and R&D/Innovation. For this purpose, “analysis in terms of main component” has been used, allowing the sectors to be split into the four quadrants shown in Graph 3.
Analysis in terms of main component makes it possible to synthesise the relationships bet-ween quantitative data and to represent them graphically on sectoral plans. Essentially, this is a technique for visualising relationships between variables.
Analysis in terms of main component and classification: ADVERTISING/TURNOVER, INNOVATION/TURNOVER, R&D/TURNOVER
���������������������
����������
��������
�����������
��������
����������������
���������������������
��������������������� ��������
����������
���������������
�������������������
����������
��������
���
�����
���
�����
���
�����
�
���
�
���
�
���
�
����� ��� ����� ��� ����� � ��� � ��� � ���
���������������������������������������������
�����������������������
��������
�����
�����
�����
����� �����
�����
���������� ����������
���������� ����������
grap
h 3

23A D V E R T I S I N G A N D E C O N O M I C G R O W T H
The contribution towards growth made by each of these groups of sectors in relation to its total weighting in the relevant activity is examined in the table below.
Coefficient of contribution towards growth of added value (AV) and use of advertising in relation to innovation
Way in which
advertisingis used
Coeff. of contributionto growth of
AV (3)=(2)/(1)
Proportionof entiregrowth in
AV (2)
Proportionof entire
AV (1)
Level ofinvestment
in advertising
and R&D in
relation toaverage level
Quadrant 2(pharmacy and
perfumery, household goods,
electroniccomponents,automobile)Quadrant 4(electronicappliances,mechanicalappliances, chemistry,aviation,
metallurgy)Quadrant 3
(textiles, wood and paper,
mineral products)Quadrant 1(clothing,
publishing)
ADV+,INNO+
ADV-,INNO+
ADV-,INNO-
ADV+,INNO-
31.0%
48.5%
12.2%
8.3%
39.5%
52.5%
6%
2%
1.3
1.1
0.5
0.25
Advertising as factor for financing, protection and spread
of innovation
Advertising as factor forprotection
and financinginnovation
No particular use of
innovation and advertisingAdvertising substituting
for innovation
tabl
e 8
1. By comparing their coefficients of contribution towards the growth of added value (1.3/1.1), it is established that those sectors investing proportionally more than the average both in terms of advertising and innovation/research and development (those belonging to Quadrant 2, pharmacy and perfumery, household goods, electronic components, automobile) grow – in relationship to their weighting in GDP – 1.2 times (1.3/1.1) more quickly than those which, while certainly making a similar effort in terms of innovation and research and development, conversely do less in terms of advertising than the average (those belonging to Quadrants 4, electronic equipment, mechanical equipment, chemistry, aeronautics, metallurgy).
For the first group of sectors (Quadrant 2), it is necessary not only to finance innovation, but also to spread it and protect it. It is here that the pairing of innovation/advertising is particularly effective. Conversely, for the second group of sectors (Quadrant 4), it is possible to hypothesise that, for various reasons (the customer base is professional and therefore well-informed, etc.), there is relatively less need for advertising to spread the innovation.

24 J U N E 2 0 0 6
2. Advertising can sometimes serve to compensate for the lack of technological innovation. In-deed, in mature sectors where the advertising investment rate is above the average, but where there is less investment in R&D (the sectors grouped within Quadrant 1: clothing, publishing), it appears that the lack of genuine technological innovation results in a situation where it is less about discovering an innovative product than reminding the consumer of the actual exi-stence of the product.
This way of using advertising remains limited to two sectors (clothing and publishing) out of the six undertaking more advertising than average (Quadrants 1 and 2 combined) and with a relatively low weighting: 8.3% of the added value of the industry as opposed to 31% for the other four sectors in Quadrant 2.
In conclusion, it is therefore clear that a large proportion of industry uses the double lever of innovation/advertising to grow more rapidly and enjoy the benefit of an above-average level of dynamism. As there is no spontaneous spread of innovation, these sectors rely on adverti-sing to create awareness of the actual existence of the innovation among consumers.

25A D V E R T I S I N G A N D E C O N O M I C G R O W T H
Third mechanism:Advertising stimulates competition
As with innovation, economists agree that competition stimulates economic growth. It is the-refore essential to establish whether advertising promotes competition or if, on the contrary, it hinders it.To answer this question properly, we must start from the actual situation. According to the sec-tors studied, competition may be:• strong (arrival of new players, fluctuations in the distribution of market shares),• in decline over the long-term (increasing concentration, the leaders enhancing their market
shares, with few new players emerging),• almost non-existent (absence of new players, stable market shares).
FIRST STATEMENTADVERTISING DOES NOT HOLD BACK COMPETITION
The correlation analysis of the secondary sector in France has made it possible to demonstrate that a high or a growing level of concentration is a good indicator of competition becoming progressive-ly more rigid. Now, the sectors in which concentration is high, or rising, are not those in which the advertising investment rate is the highest. In other words, there is no correlation between a high advertising investment rate and a high, or growing, level of concentration. So there are no sectors with a high advertising investment rate in which competition will be weak or declining. And, at the same time, we will not see any increase in advertising expenditure where there is a high, or gro-wing, level of control over the market retained in the hands of the dominant companies.
In the “secondary” sector, advertising investment does not therefore act as a brake on compe-tition. It remains to be established whether advertising investment can, conversely, accelerate competition.
SECOND STATEMENTADVERTISING PROMOTES COMPETITION
It is possible to check the positive effect of advertising on competition in the home and personal care sectors, two sectors where market shares can be examined in detail and where advertising is frequently regarded as being profitable only for the dominant companies.
Accordingly, we note that in those sectors in which the leader companies are seeing a reduction in their share of the market, the advertising investment rate is higher than elsewhere (with adverti-sing used here both by challengers looking to grow and by leaders defending their positions).
An in-depth analysis of the statistics available shows that:• In those markets in which the advertising investment rate is high, market shares fluctuate
severely, with advertising helping to challenge the dominance of the leading companies;• In those markets where, conversely, positions are stable (a sign of weaker competition), the
advertising investment rate is twice as low as elsewhere.In other words, the more competitive the sector is, the higher the advertising investment rate.
Furthermore, it appears that advertising not only stimulates horizontal competition (companies belonging to the same sector) but also vertical competition.

26 J U N E 2 0 0 6
Over the period 1997-2002, an overview of the food and drink sector shows that market shares fluctuate, above all, between the dominant industrial companies and the brands of retailers (who are new entrants). Advertising is therefore a factor intensifying vertical competition between pro-ducers and distributors. The fluctuation of market shares does not take place between the domi-nant companies in the sector, but between these companies and the retailers.
Within the framework of this vertical competition, the higher the advertising investment rate, the lower the shares of the market held by retailers. It therefore seems that in this sector advertising is being used as a defensive element making it possible to confront competition from the retai-lers. The more that concentration and competitive pressure from retailers intensify, the more the industrial company is encouraged to increase its advertising spend in order to maintain or develop the customer base that is least sensitive to price variation and most sensitive to quality and the attraction of a product that is strongly promoted and therefore considered better than retailer products. The company is also motivated to increase its advertising spend to persuade the retailer to stock its products.
Advertising plays its full role when a sector is subject to competition that plays simultaneously on the variety of supply, quality and prices (according to the segment). It makes it possible to safe-guard the competitiveness of companies with quality rather than price as the priority concern. It also makes it possible to segment the customer base in accordance with objective criteria: low prices on the one hand, higher quality on the other. This therefore provides the consumer with choice.
THIRD STATEMENTAN EFFICIENCY FACTOR IN TIMES OF RECESSION
Advertising is particularly effective in stimulating competition in times of recession. This finding, which arises out of a study carried out in 2003 by the Boston Consulting Group in Germany, is confirmed by the research carried out in France – within the context of this thesis – on an even wider sample: in 75% of the sectors studied, companies that increased their advertising effort in a period of recession achieved increased market shares.
In conclusion, it is clearly shown that companies’ effort to gain market share, supported by a high advertising investment rate, encourages competition and prompts them to increase the quality and volume of the offer, therefore tending to stimulate economic growth across the board.
27A D V E R T I S I N G A N D E C O N O M I C G R O W T H
Fourth mechanism:The dynamism of the advertising sector enhancesthe growth of the economy
As we have seen, advertising contributes to economic growth as a result of its positive effects on consumption, innovation and competition. But, as a sector, does it add anything to the average growth of GDP, and in any significant way? Does it contribute towards the growth of value added in greater proportion to its share of GDP? In this last case, it would therefore be in the public interest to encourage (or at least not to discourage) its expansion as a sector and not solely for its indirect effects as analysed above.
To answer this question, we may consider the advertising sector in either its narrower or wider sense.In the first case, according to public authority figures1, it includes primarily media agencies and consultancy agencies (advertising, promotion, direct marketing, etc.). Its value added accounts for 0.44% of GDP.In the wider sense, it includes all of those activities which, in whole or in part, owe their existence to income originating from advertising, and it therefore includes media financing2 and activities of non-traditional media service providers3. Its value added then reaches the overall figure of 1.18% of GDP.The examination of the advertising sector in the wider sense was carried out by weighting the economic results from these sectors on a pro rata basis in respect of their effective activity as-sociated with advertising.
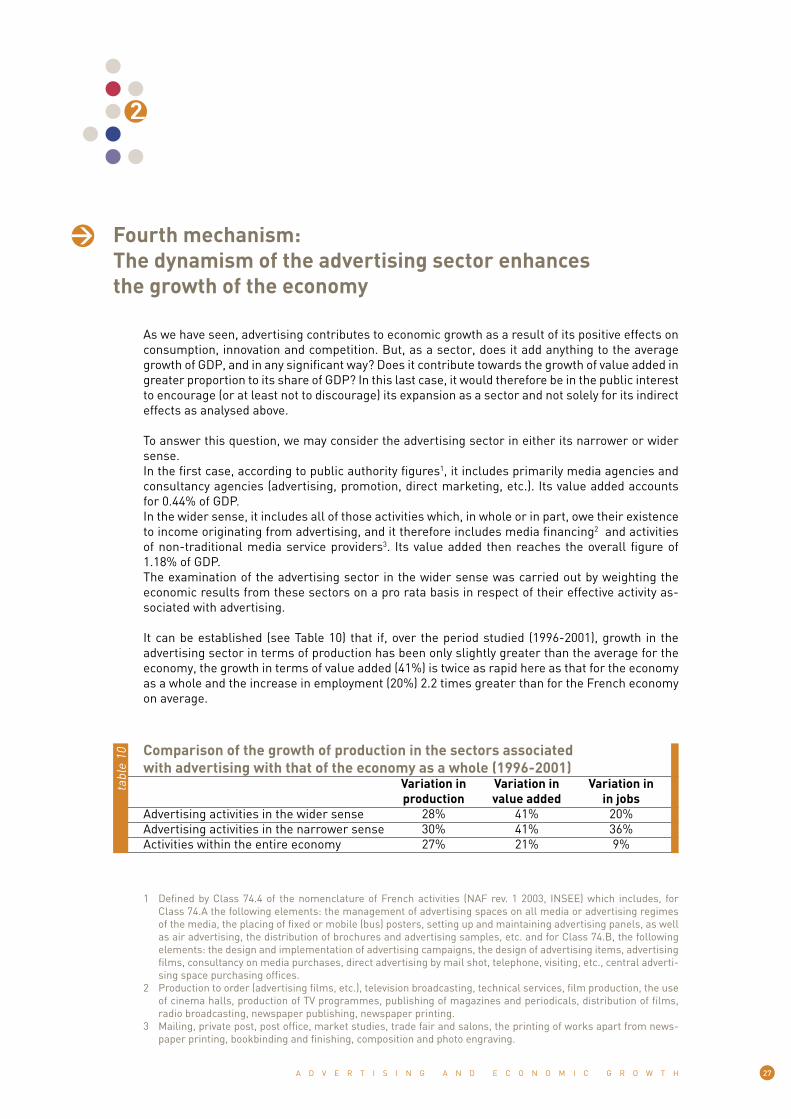
It can be established (see Table 10) that if, over the period studied (1996-2001), growth in the advertising sector in terms of production has been only slightly greater than the average for the economy, the growth in terms of value added (41%) is twice as rapid here as that for the economy as a whole and the increase in employment (20%) 2.2 times greater than for the French economy on average.
Comparison of the growth of production in the sectors associated with advertising with that of the economy as a whole (1996-2001) Variation in Variation in Variation in production value added in jobsAdvertising activities in the wider sense 28% 41% 20%Advertising activities in the narrower sense 30% 41% 36%Activities within the entire economy 27% 21% 9%
tabl
e 10
1 Defined by Class 74.4 of the nomenclature of French activities (NAF rev. 1 2003, INSEE) which includes, for Class 74.A the following elements: the management of advertising spaces on all media or advertising regimes of the media, the placing of fixed or mobile (bus) posters, setting up and maintaining advertising panels, as well as air advertising, the distribution of brochures and advertising samples, etc. and for Class 74.B, the following elements: the design and implementation of advertising campaigns, the design of advertising items, advertising films, consultancy on media purchases, direct advertising by mail shot, telephone, visiting, etc., central adverti-sing space purchasing offices.
2 Production to order (advertising films, etc.), television broadcasting, technical services, film production, the use of cinema halls, production of TV programmes, publishing of magazines and periodicals, distribution of films, radio broadcasting, newspaper publishing, newspaper printing.
3 Mailing, private post, post office, market studies, trade fair and salons, the printing of works apart from news-paper printing, bookbinding and finishing, composition and photo engraving.

28 J U N E 2 0 0 6
In addition, in multi-activity sectors, the activities associated with advertising are frequently the most dynamic: for example advertising mailing as opposed to press mailing, or the production of films and programmes to order, in relation to the production of cinema films.
The investments made by advertisers contribute towards the financing of particularly dynamic economic activities.
• In the Anglo-Saxon countries, receipts from advertising finance from 25% to practically 100% of costs for the press, depending on the titles. Non-cable commercial TV channels and radio stations are almost 100% financed by advertising.
• Advertising financing makes it possible to supplement the financing of public TV channels (in France this represents at least 35% of their revenue), without increasing the tax burden (licence fees) imposed on the population.
• It also finances numerous cultural and sporting activities (sponsorship and patronage).• The growth in value added for the activities directly or indirectly associated with adverti-
sing investment over the period (1996-2001) was twice that within the economy including all sectors. Growth in terms of employment is two to four times higher, depending on the perimeter applied.
ConclusionIn conclusion, whether for its impact on consumption, competition and the spread of inno-vation or for the stimulating effect of the growth of the advertising sector on average GDP growth, advertising investment has positive impact on the economy. The in-depth analysis of the statistics and data currently available generally comes out in support of the views of pro-advertising economists.

29A D V E R T I S I N G A N D E C O N O M I C G R O W T H
CORRELATIONS BETWEEN ADVERTING INVESTMENTSAND ECONOMIC GROWTH
A number of statistical methods for processing data demonstrate the positive
correlation between a lower or higher advertising investment rate in a country
and its economic growth. The more advertising investment grows, the more the
productive efficiency of a country increases (and vice versa). And those countries
in which relatively little is invested in advertising are also those in which econo-
mic growth is weakest.
The preceding pages have made it possible to demonstrate the existence of correlations between higher or lower advertising investment in industrial sectors and their economic performance le-vels. Can one assume for the same period (the 1990s) similar correlations at global level between the economic performances of the industrialised countries and a higher or lower advertising investment rate within their economies?
For this, it is necessary to study comparable countries, namely newcomers at approximately the same level of development and in which tertiary activity has an equivalent weighting within the economy. This last point is essential because analysis shows that the greater the weight of the tertiary sector within an economy, the more highly developed advertising in the economy is. This is probably because the more important the tertiary sector is in an economy, the more it achieves growing returns and the more the problem becomes one of selling and not producing and there-fore investing in advertising.
In order to calculate the correlations between media advertising investment and economic growth, the data from 14 countries (the United States, Japan, Australia and 11 European countries inclu-ding the five major states: Germany, France, United Kingdom, Italy and Spain, the Netherlands, Sweden, Denmark, Belgium, Austria and Finland) have been used.To undertake the same work for non-traditional media, only the data for nine countries could be used. These were the United States, Japan and seven European countries: Germany, France, the United Kingdom, Italy, Spain, the Netherlands and Sweden.
30 J U N E 2 0 0 6
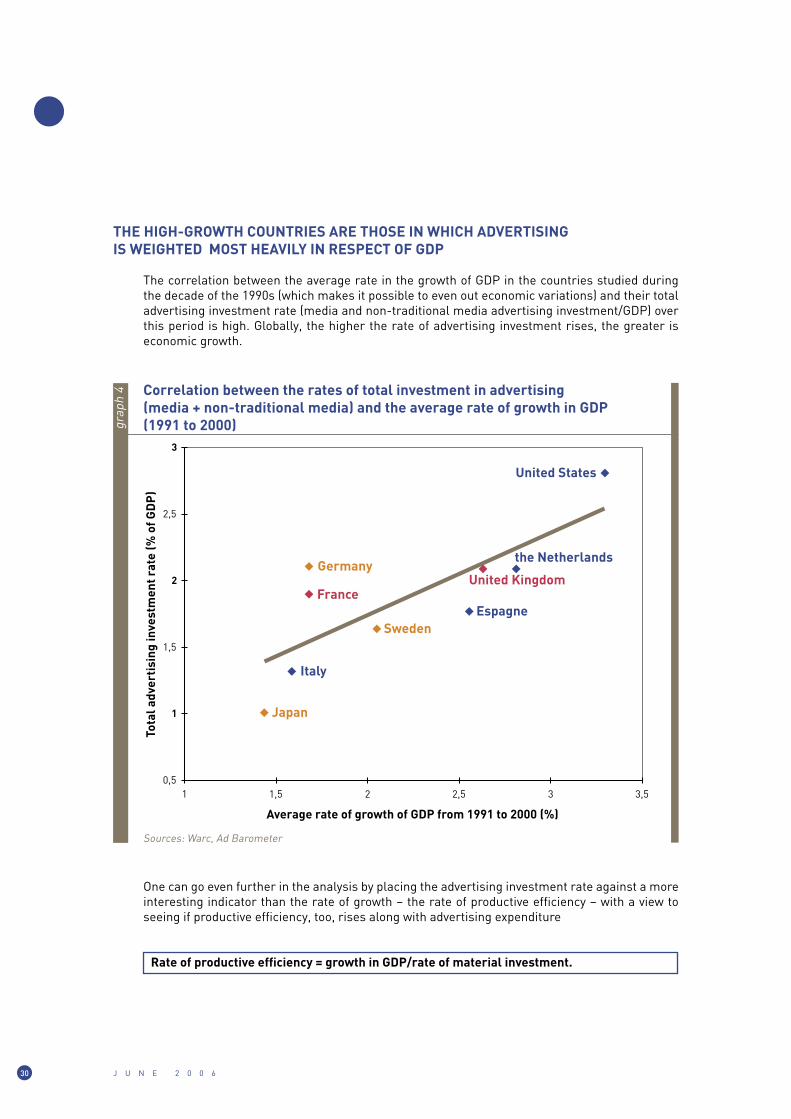
THE HIGH-GROWTH COUNTRIES ARE THOSE IN WHICH ADVERTISING IS WEIGHTED MOST HEAVILY IN RESPECT OF GDP
The correlation between the average rate in the growth of GDP in the countries studied during the decade of the 1990s (which makes it possible to even out economic variations) and their total advertising investment rate (media and non-traditional media advertising investment/GDP) over this period is high. Globally, the higher the rate of advertising investment rises, the greater is economic growth.
Correlation between the rates of total investment in advertising (media + non-traditional media) and the average rate of growth in GDP (1991 to 2000)
Sources: Warc, Ad Barometer
���
�
���
�
���
�
� ��� � ��� � ���
���������������������������������������������������
��������������������������������������������
�����
�����
�������������
���������������
���������������������
�������������
������
grap
h 4
One can go even further in the analysis by placing the advertising investment rate against a more interesting indicator than the rate of growth – the rate of productive efficiency – with a view to seeing if productive efficiency, too, rises along with advertising expenditure
Rate of productive efficiency = growth in GDP/rate of material investment.

31A D V E R T I S I N G A N D E C O N O M I C G R O W T H
THE COUNTRIES WITH EFFICIENT GROWTH ARE THOSE IN WHICH ADVERTISING IS WEIGHTED HEAVILY
Why the rate of productive efficiency?
As our starting point, we must take the economic definition of ‘investment in advertising’. This is an intangible investment with the specific feature of only assuming its value when complementing the material investments of a company. From the economic point of view, advertising is aimed at making material investment more effective. Taken in isolation, the last factor is insufficient in terms of guaranteeing the survival of the company in a moderate and competitive economy.
This explains why it is interesting to juxtapose advertising investment against an indicator of eco-nomic efficiency for the material investments undertaken: the rate of productive efficiency, which is the ratio between the rate of growth in GDP and the rate of investment in means of production (referred to as “material”). This is a particularly significant indicator of the growth of an economy and of its productivity.
Indeed, what counts in the concept of productive efficiency is economic growth in relation to the total of material investment carried out: the lower the latter in relation to high results in terms of economic growth, the greater productive efficiency is, and vice versa.A country undertaking much investment but achieving low growth has what is called low-ef-ficiency growth. This was the case in Japan during the 1990s. Conversely, if a country invests little but achieves strong growth (Australia over the same period), it will display a high rate of productive efficiency.
Table 11 sets out the comparative results for two important industrialised countries during the 1990s: the country displaying the weakest productive efficiency (Japan) is the one in which the advertising investment rate (the ratio of advertising expenditure to GDP) is low for both media and non-traditional media. Conversely, the country in which productive efficiency is strongest (the United States) is also the one in which the advertising investment rate is highest (media and non-traditional media).
The different ratios for Japan and the United States (1991-2000) Japan United StatesRate of productive efficiency Growth in GDP/Rate of material investment 0.2 0.86Rate of media advertising investment Media advertising expenditure/total GDP 0.8 1.62Rate of non-traditional media advertising investment Non-traditional media advertising investment/total GDP 0.22 1.25
tabl
e 11
By comparing the total advertising investment rate (media and non-traditional media) for the nine countries studied during the decade of the 1990s, with, in this case, the average rate of ef-ficiency of their growth, the level of correlation is even better.

32 J U N E 2 0 0 6
The total advertising investment rate as a function of productive efficiency over the period 1991-2000
Sources: Warc, Ad Barometer
�
���
�
���
�
���
�
� ��� ��� ��� ��� ��� ��� ��� ��� ��� �
���������������������������������������������
��������������������������������������������
�����
�����
������
�����������
������������������������������������
�������������
grap
h 5
Correlation between productive efficiency and advertising investment rates
If the correlation between the global rate of advertising investment and productive efficiency (see Graph 5) is correct, what about the correlation between productive efficiency and each of the two elements making up the rate of advertising investment: the rate of media advertising investment and that for non-traditional media investment?
The two graphs below display these positive correlations and prove that the concept of productive efficiency explains the rate of advertising investment achieved by the different countries better than growth in GDP.If this applies for the rate of media advertising investment, it applies even more for the rate of non-traditional media advertising investment: the growth in GDP is as unhelpful in explaining the rate of non-traditional media advertising investment in terms of statistics as productive efficiency is helpful in allowing for a better explanation of this investment rate.
Accordingly, the concept of productive efficiency makes it possible to take account of the specific productivity of intangible investments as represented by media and non-traditional media adver-tising investments.

33A D V E R T I S I N G A N D E C O N O M I C G R O W T H
The rate of media advertising investment as a function of productive efficiency over the period 1991-2000
Sources: Warc, Ad Barometer
�
���
���
���
���
�
���
���
���
� ��� ��� ��� ��� ��� ��� ��� ��� ��� �
���������������������������������������������
��������������������������������������������
�����
�����������
������ �������
����� ���������������
��������������
��������������
�������������
�������
���������
�������
grap
h 6
The rate of non-traditional media advertising investment as a function of productive efficiency over the period 1991-2000
Sources: Warc, Ad Barometer
�
���
���
���
���
�
���
���
���
� ��� ��� ��� ��� ��� ��� ��� ��� ��� �
���������������������������������������������
������������������������������������������������������������
�����
�����
������
������
�����
���������������
��������������
��������������������
grap
h 7

34 J U N E 2 0 0 6
In what way does the correlation between productive efficiency and advertising investment rate, in both media and non-traditional media advertising, play a role? Seemingly, in both areas the correlation plays a role. The one invokes the other, as is the case for research and development and innovation. Certainly, economic growth is accompanied by investments in capacity and ad-vertising investments but advertising investments – as for investments in capacity – also play a role in driving forward growth, as we have seen from the four mechanisms previously analysed (consumption, innovation, competition and the dynamic advertising sector).
ConclusionThe results presented clearly demonstrate that, overall, growth in GDP – estimated by means of an appropriate indicator, namely productive efficiency – and media and non-traditional me-dia advertising investment are correlated. In particular, strong and lasting economic growth is necessarily associated with a high rate of media advertising investment and one that grows in a sustainable manner. Indeed, statistical results are particularly “robust” in respect of media advertising investments for which the correlation is strong and significant.Over the long term, this rate of media advertising investment is twice as high in an economy established in a system of high growth than in those in which this growth is weak, as is shown in particular by the results for the United States compared with those for Japan.In order to move from a position of average growth to one of strong growth, we therefore re-quire an increase in media advertising investment. This is one of the conditions for accelerating growth.
35A D V E R T I S I N G A N D E C O N O M I C G R O W T H
MEDIA SPACE AND INVESTMENTS INADVERTISING
What leverage tools are available to public authorities when they wish to use
advertising investments to foster economic growth? We know that in many
cases they regulate the space available for advertising, in particular in the
audiovisual media. It is therefore important to check whether there is any
correlation between the level of advertising investment and the space available.
The volume of media advertising investment within an economy depends on a number of pheno-mena: cultural habits, the level, of activity among companies, but also on the quantity of available advertising space.
The increase in the role of television advertising within the major industrialised countries offers a good basis in terms of comparable data. One may reasonably assume that television has the effect of pulling other media along in its wake.
THE GREATER THE AVAILABLE ADVERTISING SPACE,THE LOWER THE PRICES
The space available for advertising is partly regulated, directly or indirectly, by the authorities. The differences revealed between countries in terms of available advertising space correspond to differences in terms of advertising investment volume and conditions for use. The greater the amount of available space, the lower the cost of the media (defined as cost per thousand).In economics, prices are a good indicator of relative scarcity. In the case of the audiovisual me-dia, the cost per thousand is therefore a good indicator of the abundance of available adverti-sing space. A country like the United States, where advertising space is enormous, features, for example, among those countries in which the cost per thousand for radio/TV is lowest.
Accordingly, in 1998 the United States is numbered among the three least expensive countries (among the 14 countries studied previously: the United States, Australia, United Kingdom, the Netherlands, Finland, Spain, Denmark, Sweden, Germany, Austria, France, Belgium, Italy and Japan), for advertising screening in prime-time television, advertising screening in off-peak times on television and prime-time on radio.

36 J U N E 2 0 0 6
THE MORE ABUNDANT ADVERTISING SPACE, THE HIGHER THE RATE OF MEDIA ADVERTISING INVESTMENT
In the countries in which advertising space is extensive (the maximum total number of minutes authorised on television is an indicator of this, for example), and with a low cost per thousand, companies are encouraged to invest in the media and the global rate of media advertising invest-ment is high. Conversely, it is in those countries in which advertising space is most restricted, with a high cost per thousand, that the rate of investment in media advertising is lowest.
Correlation between the rate of media advertising investment and the maximum number of minutes of advertising authorised per hour covering all channels (non-cable television and major cable channels)
Sources: Informa Media Group, BIPE, Kagan’s World Media LTD, Média&Société (retired)
�
��
���
���
���
���
���
���
��� ��� ��� � ��� ��� ���
��������������������������������������������������
����������������������������������������
������������������������������������������
�������
���������
������� �������
�����
�������������
�����
�����������������������������
������
�������������
�����
grap
h 8
Graph 8 shows the correlation between the maximum number of advertising minutes authorised per hour across all non-cable channels and the major, generalist cable channels1 and the adver-tising investment rate (ratio of ad spend to GDP) recorded in each of the 14 countries studied.The position of the United States in the graph is revealing: the rate of media advertising invest-ment (as a percentage of GDP) is highest; the number of minutes of advertising authorised per hour is also highest in this country.
Increasing the available advertising space is therefore a simple and inexpensive means of increa-sing the rate of media advertising investment: a classic example of the supply available resulting in falling prices and stimulated demand.
1 Taken into account are the generalist cable channels with a large audience in the countries in which the rate of cable equipment is approaching 100% (the Scandinavian countries, United States, Belgium, etc.).

37A D V E R T I S I N G A N D E C O N O M I C G R O W T H
Any increase in media advertising investment is directed towards television as a priority. When an economy is expanding and enjoying a growing productive efficiency, it requires greater ad-vertising space and an effective means of responding to this situation is therefore to facilitate an increase in the advertising investment rate in television: as was demonstrated in the first section (refer to Table 6), television today represents the main source of absorption of the growth of media and advertising investment. This may be implemented, in particular, by increasing the number of authorised minutes at high-audience times or by increasing the number of powerful channels (non-cable or cable channels broadcasting to a wide audience).The other media also benefit from dynamic investments on the part of advertisers. In particular, all of those countries enjoying strong productive efficiency are also countries in which the press holds an extremely significant share of media advertising.
RESTRICTED MEDIA ADVERTISING SPACE FAVOURS THE NON-TRADITIONAL MEDIA
If the media advertising space on offer is insufficient, we find development in the non-traditional media sector. Indeed, at certain levels of productive efficiency, there is a process of substitution between media and non-traditional media: when the rate of growth in media investment stagna-tes, the share of non-traditional media investment grows vigorously; when the rate of growth in media investments increases, the share attributable to non-traditional media is reduced.
Certainly, non-traditional media investments favour economic growth and grow along with pro-ductive efficiency. However, the allocation of advertising resources runs the risk of being less than optimal if there is excessive growth in non-traditional media, to the detriment of media. Indeed, the positive correlation established between productive efficiency and media advertising investment is stronger and more significant than the correlation between productive efficiency and non-traditional media advertising investment. This means that media advertising investment participates with a greater degree of certainty in achieving high levels of productive efficiency. It would therefore appear prudent, from a global economic point of view, to direct advertising in-vestment towards those media where they have the greatest chance of being efficient; in the case in point, towards the media, as opposed to non-traditional media sector.
The statistical data make it clear: the greater the availability of media advertising space, the more advertisers use this means of communication and the less the rate of non-traditional media ad-vertising increases. France and Germany are two countries in which, conversely, the rate of non-traditional media advertising investment has grown due to restricted media advertising space.
ConclusionWhen the space made available to advertisers in the media is too restricted, it is the non-tra-ditional media sector which is favoured.However, this is significantly less correlated to the efficiency of economic growth. It is there-fore preferable, in the light of the statistical information available to us today, to encourage the development of media advertising investment, which is more directly associated with gro-wing productive efficiency.
38 J U N E 2 0 0 6
Analysis of all of the objective data relating to the developed countries clearly demonstrates that the media and non-traditional media advertising investments carried out by companies stimulate and promote consumption, innovation, competition and the dynamism of specific economic sec-tors associated with advertising: media service providers, non-traditional media, etc.
From a macro-economic point of view, the statistical processing of this data demonstrates that these investments thus contribute to the dynamism of economic growth, as they promote better use of, and better productivity from, material investments (referred to here as “productive ef-ficiency”).
In order to promote growth, the public authorities should therefore encourage advertising invest-ment in all of its forms, as this improves the productive efficiency of an economy.
Companies should, in particular, be encouraged to invest in media advertising, as this displays a more specific correlation with productive efficiency, and therefore with economic growth.
Public authorities wishing to optimise their country’s growth potential should therefore ensure that their policy for regulating the media provides companies with an adequate volume of adverti-sing space to allow it to be accessible to the greatest number of these companies, under the best possible conditions of flexibility and cost.
Certainly, national economic growth does depend on a number of variables other than media advertising space. However, the results of this research demonstrate that similarly to other de-termining factors (for example research and development expenditure), access to adequate ad-vertising space, allowing for an increase the rate of media advertising investment, is a necessary condition for the economy to achieve high and sustainable performance levels. Such a policy presents the additional advantage of being rapid to implement and low in cost.
This conclusion appears to apply to all developed countries.
Conclusion

To order a copy of the Thesis,please write to: Union des annonceurs
53 avenue Victor Hugo - 75116 Paris, Francewww.uda.fr

World Federation of AdvertisersAvenue Louise 120 - box 6
B-1050 Brussels+32 2 502 57 40
[email protected] - www.wfanet.org