Embed Size (px)
Citation preview
Environmental Energy Technologies Division • Energy Analysis Department 1
Renewables Portfolio Standards
in the United States:
A Status Update
Edward Holt
Ed Holt & Associates, Inc.
Galen Barbose & Ryan Wiser
Lawrence Berkeley National Laboratory
Renewable Energy Markets Conference Washington, DC
September 25, 2012
Environmental Energy Technologies Division • Energy Analysis Department 2
Presentation Outline
1) Overview of State RPS Landscape
2) Policy Developments and Trends
3) Impacts: Past and Future
4) Ongoing Issues and Challenges
Environmental Energy Technologies Division • Energy Analysis Department 3
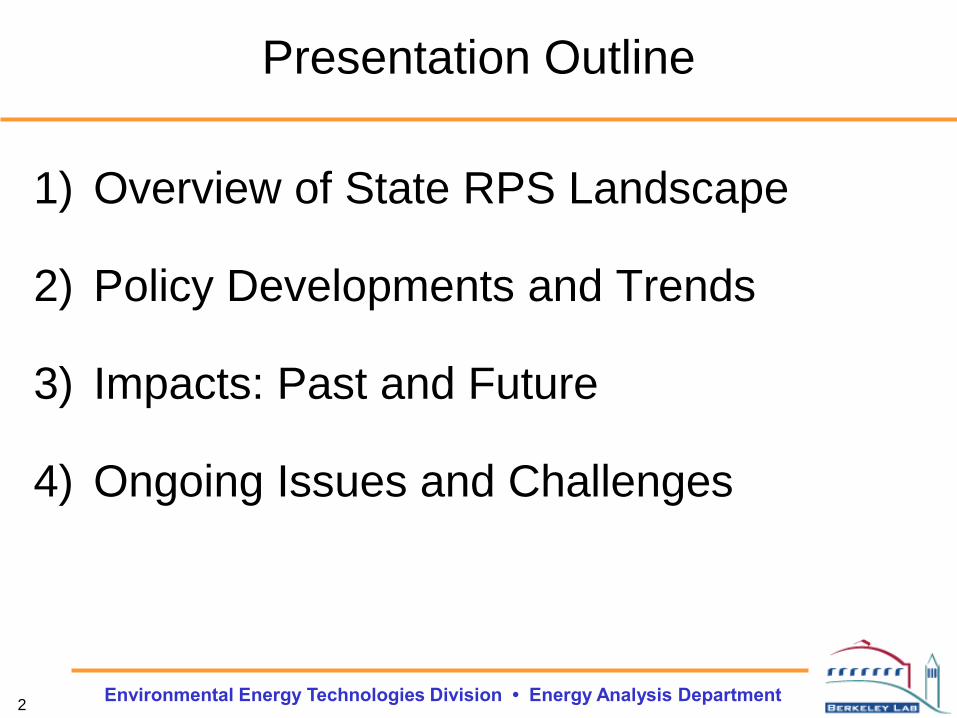
RPS Policies Exist in 29 States and D.C.; 7 More States Have Non-Binding Goals
Most policies established through state legislation, but some initially
through regulatory action (NY, AZ) or ballot initiatives (CO, MO, WA)
Non-Binding Goal
Source: Berkeley Lab
WI: 10% by 2015
NV: 25% by 2025
TX: 5,880 MW by 2015
PA: 8.5% by 2020
NJ: 22.5% by 2020CT: 23% by 2020
MA: 11.1% by 2009 +1%/yr
ME: 40% by 2017
NM: 20% by 2020 (IOUs)
10% by 2020 (co-ops)
CA: 33% by 2020
MN: 25% by 2025
Xcel: 30% by 2020
IA: 105 MW by 1999
MD: 20% by 2022
RI: 16% by 2019
HI: 40% by 2030
AZ: 15% by 2025
NY: 30% by 2015
CO: 30% by 2020 (IOUs)
10% by 2020 (co-ops and munis)
MT: 15% by 2015
DE: 25% by 2025
DC: 20% by 2020
WA: 15% by 2020
NH: 24.8% by 2025
OR: 25% by 2025 (large utilities)
5-10% by 2025 (smaller utilities)
NC: 12.5% by 2021 (IOUs)
10% by 2018 (co-ops and munis)
IL: 25% by 2025
Mandatory RPS
VT: 20% by 2017ND: 10% by 2015
VA: 15% by 2025MO: 15% by 2021
OH: 12.5% by 2024
SD: 10% by 2015
UT: 20% by 2025
MI: 10% by 2015
KS: 20% of peak
demand by 2020
OK: 15% by 2015
AK: 50% by 2025
Notes: Compliance years are designated by the calendar year in which they begin. Mandatory standards or non-binding
goals also exist in US territories (American Samoa, Guam, Puerto Rico, US Virgin Islands)

Several States Have Adopted Broader Clean Energy Standards, or Efficiency Standards
• Clean energy
standards (CES’)
adopted in parallel to
RPS (MI, OH, PA) or
as a wholly separate
policy (WV)
• IN has a voluntary
clean energy goal
• Many states have
adopted stand-alone
energy efficiency (EE)
resource standards or
allow EE to qualify
within an RPS or CES
Environmental Energy Technologies Division • Energy Analysis Department 4

Environmental Energy Technologies Division • Energy Analysis Department 5
Existing RPS’ Apply to 54% of Total U.S. Retail Electricity Sales in 2012
U.S. Electrical Load with Active State RPS Obligations (Historical and Projected)
0%
10%
20%
30%
40%
50%
60%
19
98
19
99
20
00
20
01
20
02
20
03
20
04
20
05
20
06
20
07
20
08
20
09
20
10
20
11
20
12
20
13
20
14
20
15
20
16
20
17
20
18
20
19
20
20
20
21
20
22
20
23
20
24
20
25
POUs
IOUs & ESPs
ESPs
IOUs
Pe
rce
nt o
f T
ota
l U
.S. R
eta
il S
ale
s
Environmental Energy Technologies Division • Energy Analysis Department 6
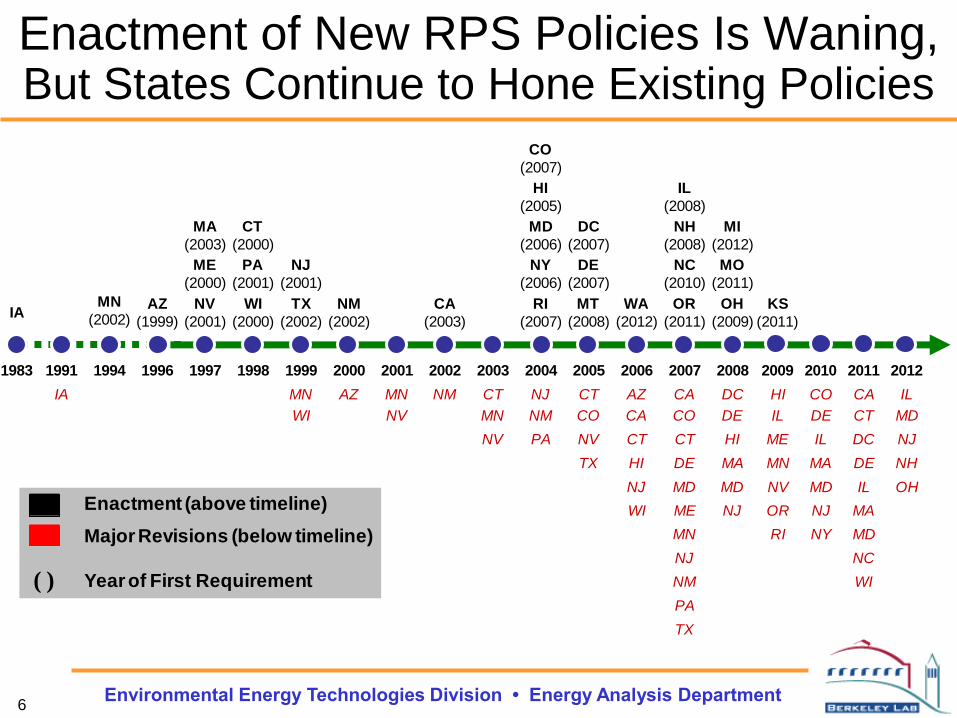
Enactment of New RPS Policies Is Waning, But States Continue to Hone Existing Policies
CO
(2007)
HI
(2005)
IL
(2008)
MA
(2003)
CT
(2000)
MD
(2006)
DC
(2007)
NH
(2008)
MI
(2012)
ME
(2000)
PA
(2001)
NJ
(2001)
NY
(2006)
DE
(2007)
NC
(2010)
MO
(2011)
IAMN
(2002)AZ
(1999)
NV
(2001)
WI
(2000)
TX
(2002)
NM
(2002)
CA
(2003)
RI
(2007)
MT
(2008)
WA
(2012)
OR
(2011)
OH
(2009)
KS
(2011)
1983 1991 1994 1996 1997 1998 1999 2000 2001 2002 2003 2004 2005 2006 2007 2008 2009 2010 2011 2012
IA MN AZ MN NM CT NJ CT AZ CA DC HI CO CA IL
WI NV MN NM CO CA CO DE IL DE CT MD
NV PA NV CT CT HI ME IL DC NJ
TX HI DE MA MN MA DE NH
NJ MD MD NV MD IL OH
WI ME NJ OR NJ MA
MN RI NY MD
NJ NC
NM WI
PA
TX
Enactment (above timeline)
( ) Year of First Requirement
Enactment (above timeline)
Major Revisions (below timeline)
( ) Year of First Requirement

Environmental Energy Technologies Division • Energy Analysis Department 7
State RPS’ Have Largely Supported Wind, Though Solar Has Become More Prominent
RPS-Motivated* Renewable Energy Capacity Additions
from 1998-2011, by Technology Type
* Renewable additions are counted as “RPS-motivated” if and only if they are located in a state with an RPS policy and
commercial operation began no more than one year before the first year of RPS compliance obligations in that state. On an
energy (as opposed to capacity) basis, wind energy represents approximately 86%, biomass 8%, geothermal 3%, and solar 3%
of cumulative RPS-motivated renewable energy additions from 1998-2011, if estimated based on assumed capacity factors.
89%
1%
4%
6%
Cumulative RPS Capacity Additions (1998-2011)
0
1,000
2,000
3,000
4,000
5,000
6,000
7,000
1998
1999
2000
2001
2002
2003
2004
2005
2006
2007
2008
2009
2010
2011
Na
me
pla
te C
ap
ac
ity (M
W)
Annual RPS Capacity Additions
Geothermal
Biomass
Solar
Wind
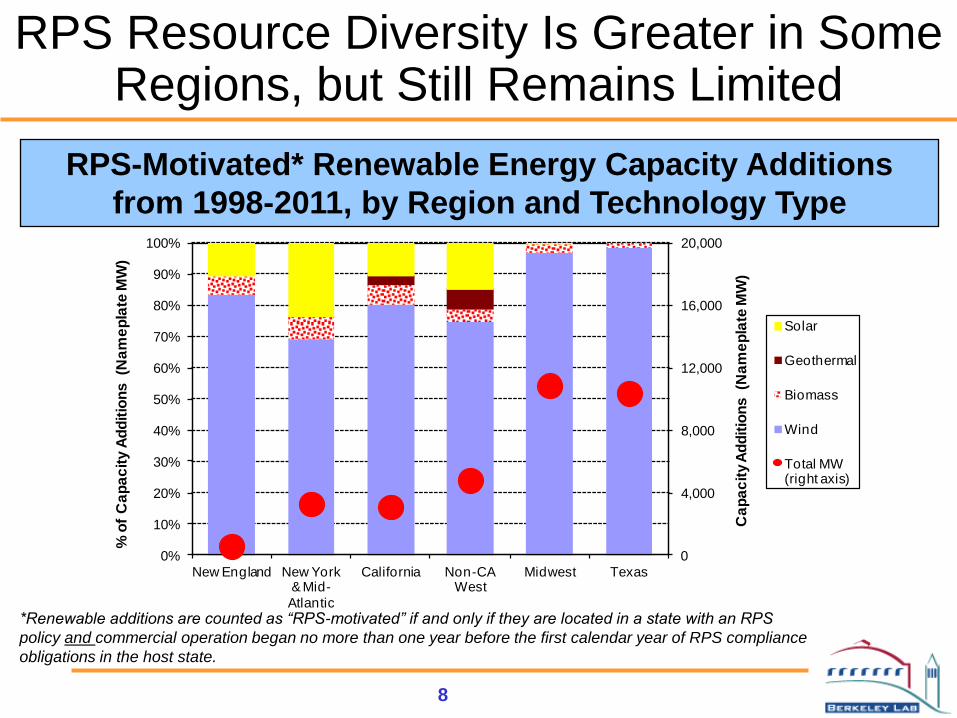
RPS Resource Diversity Is Greater in Some Regions, but Still Remains Limited
8
RPS-Motivated* Renewable Energy Capacity Additions
from 1998-2011, by Region and Technology Type
*Renewable additions are counted as “RPS-motivated” if and only if they are located in a state with an RPS
policy and commercial operation began no more than one year before the first calendar year of RPS compliance
obligations in the host state.
0
4,000
8,000
12,000
16,000
20,000
0%
10%
20%
30%
40%
50%
60%
70%
80%
90%
100%
New England New York & Mid-
Atlantic
California Non-CA West
Midwest Texas
Ca
pa
cit
y A
dd
itio
ns
(N
am
ep
late
MW
)
% o
f C
ap
ac
ity A
dd
itio
ns
(N
am
ep
late
MW
)
Solar
Geothermal
Biomass
Wind
Total MW (right axis)
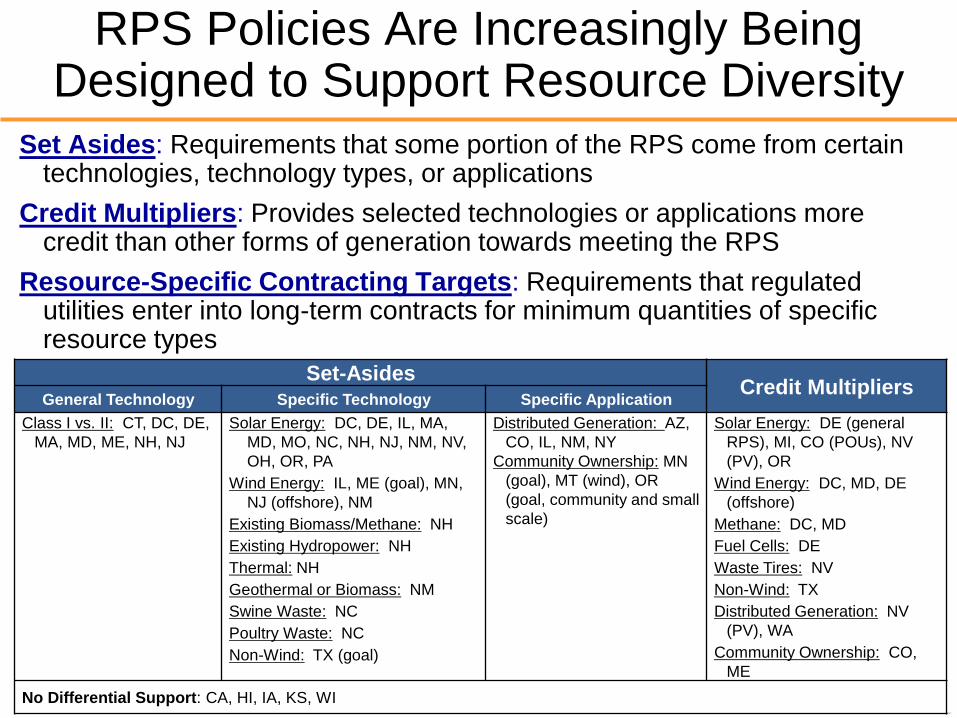
RPS Policies Are Increasingly Being Designed to Support Resource Diversity
Environmental Energy Technologies Division • Energy Analysis Department 9
Set-Asides Credit Multipliers
General Technology Specific Technology Specific Application
Class I vs. II: CT, DC, DE,
MA, MD, ME, NH, NJ
Solar Energy: DC, DE, IL, MA,
MD, MO, NC, NH, NJ, NM, NV,
OH, OR, PA
Wind Energy: IL, ME (goal), MN,
NJ (offshore), NM
Existing Biomass/Methane: NH
Existing Hydropower: NH
Thermal: NH
Geothermal or Biomass: NM
Swine Waste: NC
Poultry Waste: NC
Non-Wind: TX (goal)
Distributed Generation: AZ,
CO, IL, NM, NY
Community Ownership: MN
(goal), MT (wind), OR
(goal, community and small
scale)
Solar Energy: DE (general
RPS), MI, CO (POUs), NV
(PV), OR
Wind Energy: DC, MD, DE
(offshore)
Methane: DC, MD
Fuel Cells: DE
Waste Tires: NV
Non-Wind: TX
Distributed Generation: NV
(PV), WA
Community Ownership: CO,
ME
No Differential Support: CA, HI, IA, KS, WI
Set Asides: Requirements that some portion of the RPS come from certain technologies, technology types, or applications
Credit Multipliers: Provides selected technologies or applications more credit than other forms of generation towards meeting the RPS
Resource-Specific Contracting Targets: Requirements that regulated utilities enter into long-term contracts for minimum quantities of specific resource types

Environmental Energy Technologies Division • Energy Analysis Department 10
RPS Increasingly Designed to Support Resource Diversity: Most Commonly Solar and DG
16 states + D.C. have solar or DG set-asides, sometimes combined
with credit multipliers; 3 other states only have credit multipliers
Ten states created
solar/ DG set-
asides since 2007: DE, IL, MA, MD, MO,
NC, NH, NM, OH, OR Differential support for solar/DG provided in CT and RI via long-term
contracting programs with legislatively-established budgets or capacity targets
NV: 1.5% solar by 2025
2.4x multiplier for central PV2.45x multiplier for distributed PV
PA: 0.5% solar PV by 2020
NJ: 4.1% solar electric by 2027
AZ: 4.5% customer-sited DG
by 2025 (half from residential)
NY: 640 GWh retail DG by 2015
CO: 3% DG by 2020 for IOUs
(half from retail DG)3x multiplier for co-ops and
munis for solar installed before
July 2015
DC: 2.5% solar by 2023
WA: 2x multiplier for DG
NM: 4% solar electric by 2020,
0.6% customer-sited DG by 2020
DE: 3.5% solar by 2025
3x multiplier for solar installed before Jan. 2015 (applies only to
solar used for general RPS target)
MD: 2% solar by 2020
Set-aside
Multiplier
NC: 0.2% solar by 2018
NH: 0.3% solar electric by 2014
Set-aside with multiplier
TX: 2x multiplier for all non-wind
OH: 0.5% solar electric by 2024
MA: 456 GWh customer-sited
solar PV (no specified target year)
MO: 0.3% solar electric by 2021
MI: 3x multiplier for solarOR: 20 MW solar PV by 2020
2x multiplier for PV installed before 2016
IL: 1.5% solar PV by 2025,
1% DG by 2015 (50% <25 kW)
Note: Compliance years are designated by the calendar year in which they begin
Source: Berkeley Lab
Environmental Energy Technologies Division • Energy Analysis Department 11
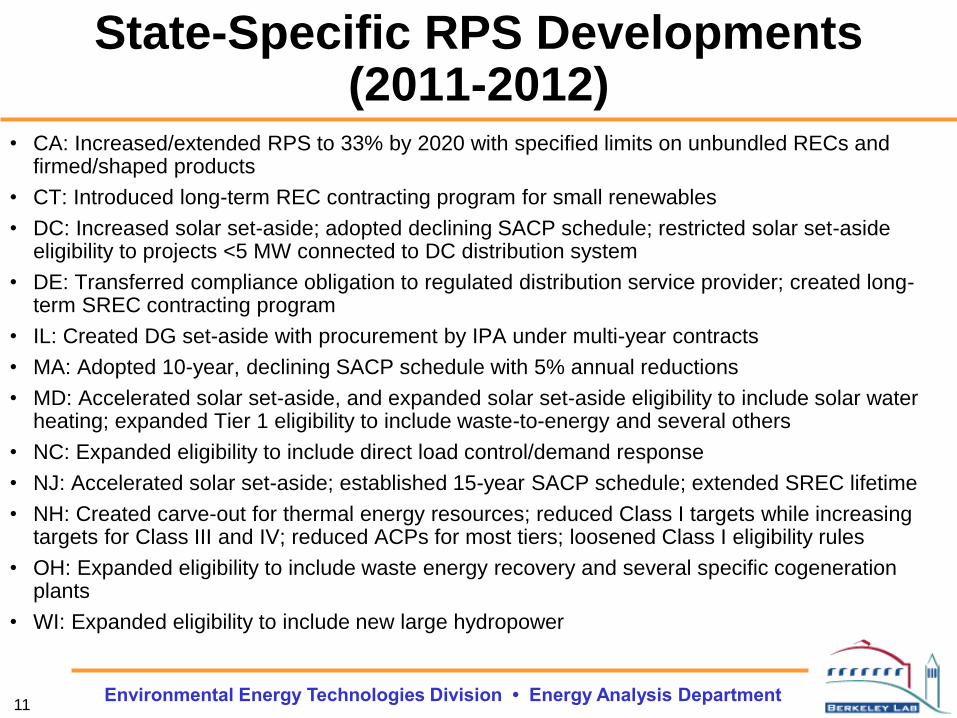
State-Specific RPS Developments (2011-2012)
• CA: Increased/extended RPS to 33% by 2020 with specified limits on unbundled RECs and firmed/shaped products
• CT: Introduced long-term REC contracting program for small renewables
• DC: Increased solar set-aside; adopted declining SACP schedule; restricted solar set-aside eligibility to projects <5 MW connected to DC distribution system
• DE: Transferred compliance obligation to regulated distribution service provider; created long-term SREC contracting program
• IL: Created DG set-aside with procurement by IPA under multi-year contracts
• MA: Adopted 10-year, declining SACP schedule with 5% annual reductions
• MD: Accelerated solar set-aside, and expanded solar set-aside eligibility to include solar water heating; expanded Tier 1 eligibility to include waste-to-energy and several others
• NC: Expanded eligibility to include direct load control/demand response
• NJ: Accelerated solar set-aside; established 15-year SACP schedule; extended SREC lifetime
• NH: Created carve-out for thermal energy resources; reduced Class I targets while increasing targets for Class III and IV; reduced ACPs for most tiers; loosened Class I eligibility rules
• OH: Expanded eligibility to include waste energy recovery and several specific cogeneration plants
• WI: Expanded eligibility to include new large hydropower
Environmental Energy Technologies Division • Energy Analysis Department 12
General Trends in Recent RPS Revisions
• Expanding eligibility (waste-to-energy, hydropower, biomass co-firing, solar thermal)
• Increased stringency of RPS purchase targets (though momentum has slowed)
– MI ballot would increase target from the current 10% by 2015 to 25% by 2025
• Adoption of resource-specific set-asides (though momentum there has also slowed)
• Honing solar set-aside provisions
– Eligibility rules (size, location, etc.)
– SACP schedules
– Contracting mechanisms
• Efforts to address REC oversupply/volatility (especially SRECs – e.g., by accelerating or increasing targets)
Political and Legal Challenges to RPS Policies Have Been Mounting
• Legislation in roughly ten states was introduced in 2011-
2012 to repeal or roll-back RPS policies
– None of these efforts have succeeded to-date
• While other legislation has sought revisions that may result in
“weakening” RPS policies
– E.g., by expanding eligibility, reducing ACPs
• Legal issues have also been raised in court cases and
regulatory proceedings
– Commerce Clause issues, often tied to geographic eligibility
rules (MA, CO, CA, MO)
– Challenges to the jurisdictional authority of the PUC to enact an
RPS (AZ)
Environmental Energy Technologies Division • Energy Analysis Department 13

Environmental Energy Technologies Division • Energy Analysis Department 14
State RPS Policies Appear to Be Motivating Substantial Renewable Capacity Development
Cumulative and Annual Non-Hydro Renewable Energy
Capacity in RPS and Non-RPS States, Nationally
Though not an ideal metric for RPS-impact, 63% of the 53 GW of non-hydro renewable additions from 1998-2011 (33 GW) occurred in states with active/impending RPS compliance obligations
10,000
20,000
30,000
40,000
50,000
60,000
70,000
1998
1999
2000
2001
2002
2003
2004
2005
2006
2007
2008
2009
2010
2011
Na
me
pla
te C
ap
ac
ity (M
W)
Cumulative Capacity
RPS
Non-RPS
0
2,000
4,000
6,000
8,000
10,000
12,000
1998
1999
2000
2001
2002
2003
2004
2005
2006
2007
2008
2009
2010
2011
Na
me
pla
te C
ap
ac
ity (M
W)
Annual Capacity Additions
RPS
Non-RPS

Environmental Energy Technologies Division • Energy Analysis Department 15
Impact of Solar/DG Set-Asides Is Growing: 1,500 MWac PV from 2000-2011
Set-asides also benefiting solar-thermal electric (CSP): 1 MW
(Arizona) constructed in 2006, and 64 MW (Nevada) in 2007
0%
10%
20%
30%
40%
50%
60%
70%
80%
90%
100%
0
200
400
600
800
1,000
2000 2001 2002 2003 2004 2005 2006 2007 2008 2009 2010 2011
Perc
en
t o
f U
.S.
An
nu
al
Gri
d-C
on
necte
d P
V I
nsta
llati
on
s (
%)
MO
IL
NH
NM
NC
MA
OH
DE
MD
DC
PA
CO
NV
NY
AZ
NJ
Percent of U.S. annual grid-connected PV capacity additions, including
California, driven by solar/DG set-asides [right axis]
Percent of U.S. annual grid-connected PV capacity additions, excluding California, driven by solar/DG
set-asides [right axis]
An
nu
al
Gri
d-C
on
necte
d P
V I
nsta
llati
on
s
for
So
lar/
DG
Set-
Asid
es (M
Wa
c)

Environmental Energy Technologies Division • Energy Analysis Department 16
Declining Solar Costs Will Increase RPS Resource Diversity Even without Set-Asides
Wind facing increased
competition in California
from solar; same is true
elsewhere in SW and,
to a lesser extent, in
other regions
Increased competition
largely driven by price
reductions for utility-
scale solar
More than 20 GW of contracts
with new renewable generators
signed in California since 2002*
Wind 46%
Solar 49%
Geothermal 1%
Biomass/MSW 3%
Small hydro <1%
*Based on CPUC RPS contract database for IOUs and analysis of
contract announcements by POUs

Environmental Energy Technologies Division • Energy Analysis Department 17
Future Impacts of Existing RPS Policies Are Projected To Be Relatively Sizable
~93 GW of
new* RE by
2035, if full
compliance is
achieved
(102 GW including
voluntary goals)
6% of projected
generation in 2035;
32% of projected
load growth from
2000-2035
* “New” renewables is defined based on state-specific distinctions between new vs. existing or on the
year in which the RPS was enacted; it does not represent new renewables relative to current supply
0 5 10 15 20 25 30
IA
RI
ME
NH
MT
DC
DE
KS
HI
WI
NV
CT
NM
MI
NC
M…
OR
NY
AZ
MD
PA
WA
CO
MA
OH
MN
TX
NJ
IL
CA
New Renewable Capacity by 2035 (Nameplate GW)
0% 5% 10% 15% 20% 25% 30% 35%
IA
NC
TX
MI
KS
PA
WI
NY
MO
AZ
ME
DC
MT
OH
WA
MD
NV
RI
NH
CO
NM
CT
OR
DE
IL
NJ
CA
MN
MA
HI
New Renewable Generation by 2035
(Percent of Statewide Retail Sales)

0
2,000
4,000
6,000
8,000
10,000
0
200
400
600
800
1,000
1,200
2010 2015 2020 2025 2030 2035
NJ
IL
AZ
MD
PA
OH
CO
NM
MA
DE
DC
NC
NY
NV
MO
NH
OR
Required Annual Capacity Additions
(left axis)Cumulative Capacity
Required (right axis)
Cu
mu
lati
ve
So
lar
Ca
pa
cit
y (
MW
ac)
An
nu
al S
ola
r C
ap
ac
ity A
dd
itio
ns
(M
Wac)
Environmental Energy Technologies Division • Energy Analysis Department 18
Future Impacts of Solar/DG Set-Asides Are Also Projected To Be Substantial
Cumulative capacity requirement grows to 8,500 MW by 2025
Required average annual solar capacity additions of 750 MW/yr
from 2012-15, 450 MW/yr from 2016-25
Solar/DG Set-Aside Compliance Requirements

Ongoing Issues and Challenges
• Price trends and near-term over-supply of RE
• Required additional RE deployment is “limited”
• State RPS compliance challenges in some cases
• Rate impacts and cost concerns
• Other emerging state policy design issues
Environmental Energy Technologies Division • Energy Analysis Department
19

Environmental Energy Technologies Division • Energy Analysis Department 20
REC Prices Have Dropped Substantially in Many Regions Over the Last Two Years
• REC prices historically volatile, and dropped substantially
in many regions recently (main tier and solar RECs)
• Recent price trends reflect “over-supply” for RPS needs in
some markets
• Wholesale electricity prices have also declined substantially over
the same period…
• In concert with low REC prices, makes RE economics more
challenging in near term, despite drop in RE costs
• States have considered and implemented various
measures to mitigate these effects
• Increasing or accelerating RPS targets
• Long-term contracting programs/requirements
• Price support mechanisms
• Various other approaches

Environmental Energy Technologies Division • Energy Analysis Department 21
Main Tier and Class I RECs
$0
$10
$20
$30
$40
$50
$60
$70Jan
-05
Jul-
05
Jan
-06
Jul-
06
Jan
-07
Jul-
07
Jan
-08
Jul-
08
Jan
-09
Jul-
09
Jan
-10
Jul-
10
Jan
-11
Jul-
11
Jan
-12
Jul-
12
Trading Month
CT Class I DC Tier I DE Class I
IL Wind MA Class I MD Tier I
ME New NH Class I NJ Class I
OH In-State PA Tier I RI New
TX
Avg
Mo
nth
ly R
EC
Pri
ce
(2
01
1$
/MW
h)
Sources: Evolution Markets (through 2007) and Spectron (2008 onward). Plotted values are the last trade (if available) or the mid-point of Bid and Offer prices, for the current or nearest future compliance
year traded in each month.
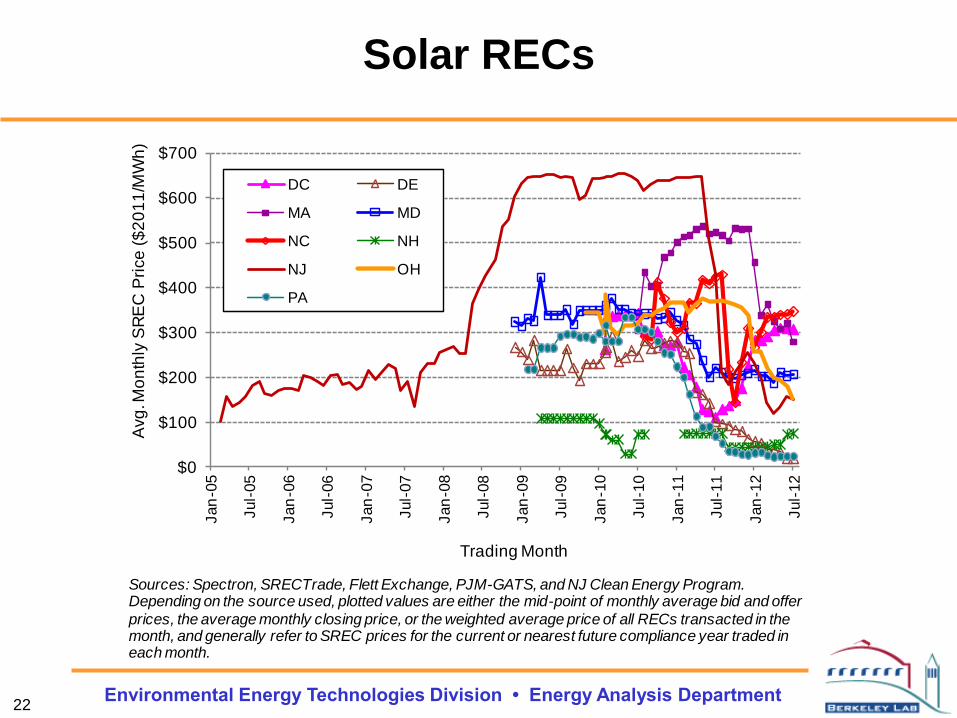
Environmental Energy Technologies Division • Energy Analysis Department 22
Solar RECs
$0
$100
$200
$300
$400
$500
$600
$700
Jan
-05
Jul-
05
Jan
-06
Jul-
06
Jan
-07
Jul-
07
Jan
-08
Jul-
08
Jan
-09
Jul-
09
Jan
-10
Jul-
10
Jan
-11
Jul-
11
Jan
-12
Jul-
12
Avg
. Mo
nth
ly S
RE
C P
rice
($
20
11
/MW
h)
Trading Month
DC DE
MA MD
NC NH
NJ OH
PA
Sources: Spectron, SRECTrade, Flett Exchange, PJM-GATS, and NJ Clean Energy Program. Depending on the source used, plotted values are either the mid-point of monthly average bid and offer
prices, the average monthly closing price, or the weighted average price of all RECs transacted in the month, and generally refer to SREC prices for the current or nearest future compliance year traded in each month.
Environmental Energy Technologies Division • Energy Analysis Department 23
Other Emerging and Continuing Issues Facing State RPS Programs
• Long-term contracting needs in “restructured” markets
otherwise dominated by short-term REC transactions
• Addressing the dual desires for liquid RE markets and in-
state benefits in the face of the Commerce Clause
• Managing compliance enforcement procedures, force
majeure events, and cost caps as targets become binding
• Maintaining some stability and predictability in the face of
numerous ongoing policy design changes
• Interactions between state and possible future Federal
policies
• Addressing the other barriers to renewable energy:
transmission, integration, siting, etc.

Thank You!
For further information:
LBNL renewable energy publications:
http://eetd.lbl.gov/ea/emp/re-pubs.html
Contact information: Galen Barbose, [email protected], 510-495-2593
Ryan Wiser, [email protected], 510-486-5474
Environmental Energy Technologies Division • Energy Analysis Department 24

Appendix Additional Slides
Environmental Energy Technologies Division • Energy Analysis Department 26
What Is a Renewables Portfolio Standard?
Renewables Portfolio Standard (RPS):
• A requirement on retail electric suppliers…
• to supply a minimum percentage or amount
of their retail load…
• with eligible sources of renewable energy.
Typically backed with penalties of some form
Often accompanied by a tradable renewable energy
credit (REC) program, to facilitate compliance
Never designed the same in any two states

Environmental Energy Technologies Division • Energy Analysis Department 27
State RPS Policies Feature Significant Design Differences
• Renewable purchase targets and timeframes
• Entities obligated to meet RPS, and use of exemptions
• Eligibility of different renewable technologies
• Whether existing renewable projects qualify
• Treatment of out-of-state generators
• Whether technology set-asides or other tiers are used
• Use of credit multipliers for
favored technologies
• Allowance for RECs, and REC definitions
• Methods to enforce compliance
• Existence and design of cost caps
• Compliance flexibility rules, and waivers from compliance
• Contracting requirements and degree of regulatory oversight
• Compliance filing and approval requirements
• Compliance cost recovery
• Role of state funding
mechanisms
Environmental Energy Technologies Division • Energy Analysis Department 28
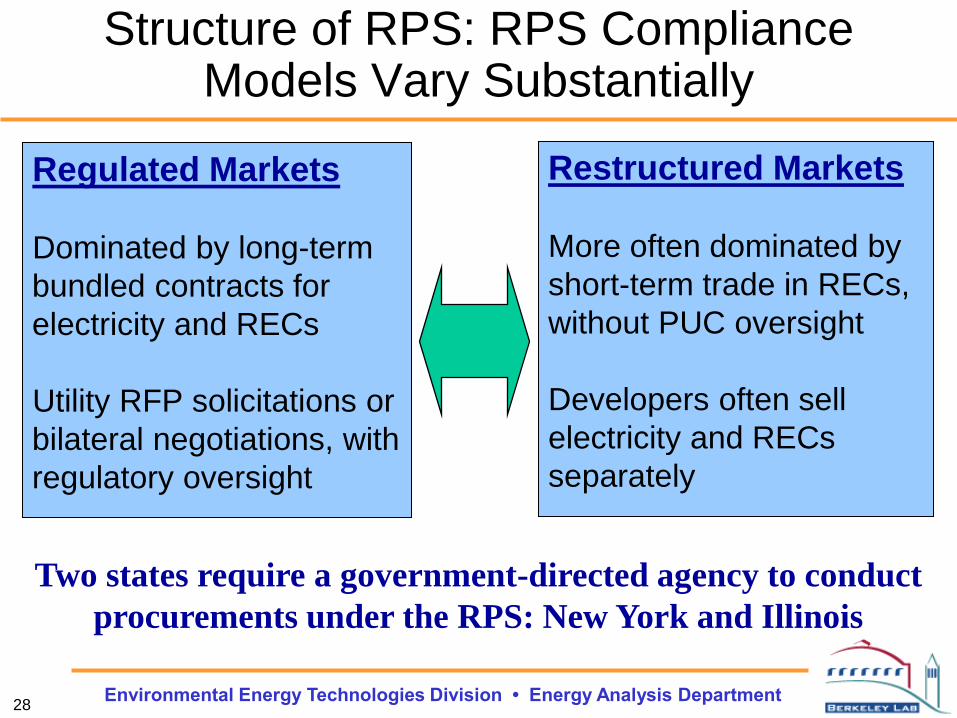
Structure of RPS: RPS Compliance Models Vary Substantially
Regulated Markets
Dominated by long-term
bundled contracts for
electricity and RECs
Utility RFP solicitations or
bilateral negotiations, with
regulatory oversight
Restructured Markets
More often dominated by
short-term trade in RECs,
without PUC oversight
Developers often sell
electricity and RECs
separately
Two states require a government-directed agency to conduct
procurements under the RPS: New York and Illinois

Environmental Energy Technologies Division • Energy Analysis Department 29
Geographic Eligibility and Electricity Delivery Rules Vary Considerably
Variation reflects differing:
• wholesale market structure
and geography
• state interests in supporting
in-state or in-region RE
• interpretations of the
requirements imposed by the
Interstate Commerce Clause
Table provides examples:
many states employ multiple
requirements, and therefore
would fit in multiple rows
Geographic Eligibility and Delivery
Requirements (Main Tier) Examples
In-state generation requirement HI, IA
In-region generation requirement DC, MI, MN, OR, PA
Electricity delivery required to state or to LSE
Direct transmission inter-tie between generators
and state TX
Broader delivery requirements to state or to LSE AZ, CA, KS, MT, NM,
NV, NY, OH, WI
Electricity delivery required to broader region
Generators anywhere outside region must deliver
electricity to region DE, ME, NJ, WA
Generators in limited areas outside region must
deliver electricity to region
CT, DC, MA, MD, NH,
RI
In-state generation encouragement
In-state multipliers CO, MO
Cost-effectiveness test IL
Limit on RECs from out-of-state generators NC

Environmental Energy Technologies Division • Energy Analysis Department 30
Operational Experience with State RPS Policies Remains Somewhat Limited
Operational Experience with State RPS Policies (number of major compliance years completed-to-date)
< 1 year 1 – 2 years 3 – 4 years 5 – 6 years 7 – 8 years > 8 years
Colorado Arizona
Delaware California
Maryland Iowa
Hawaii New York Maine
Kansas Illinois New Mexico Massachusetts
Missouri Montana Pennsylvania Connecticut Nevada
Michigan Oregon New Hampshire Rhode Island Minnesota New Jersey
Washington North Carolina Ohio Washington D.C. Wisconsin Texas
Environmental Energy Technologies Division • Energy Analysis Department 31
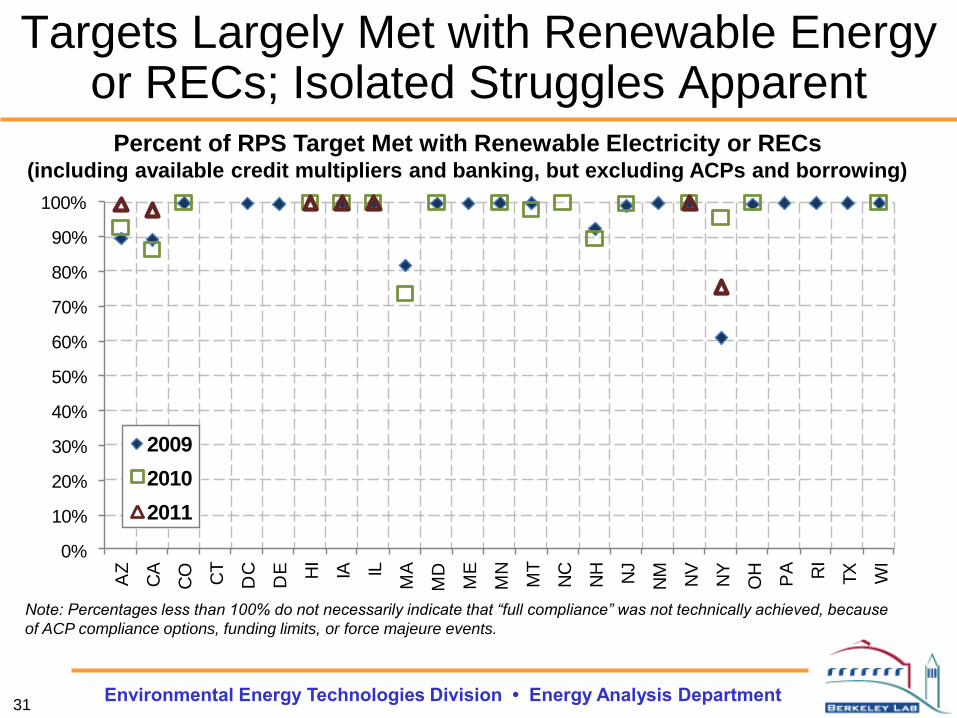
Targets Largely Met with Renewable Energy or RECs; Isolated Struggles Apparent
Percent of RPS Target Met with Renewable Electricity or RECs
(including available credit multipliers and banking, but excluding ACPs and borrowing)
Note: Percentages less than 100% do not necessarily indicate that “full compliance” was not technically achieved, because
of ACP compliance options, funding limits, or force majeure events.
0%
10%
20%
30%
40%
50%
60%
70%
80%
90%
100%
AZ
CA
CO CT
DC
DE HI
IA IL
MA
MD
ME
MN
MT
NC
NH
NJ
NM
NV
NY
OH
PA RI
TX
WI
2009
2010
2011

Environmental Energy Technologies Division • Energy Analysis Department 32
Achievement of Solar/DG Set-Aside Targets Has Steadily Increased in Many States
Retirement of solar electricity/RECs relative to set-aside
requirements has often been mixed in initial compliance years
States with Large (>150 MW) Solar/DG Targets in 2011
Note: "Percent of Solar/DG Target Met with Solar/DG Electricity or RECs" excludes ACPs but includes applicable credit
multipliers. In cases where this figure is below 100%, suppliers may not have been technically out of compliance due to solar
ACP compliance options, funding limits, and force majeure provisions.
0%
20%
40%
60%
80%
100%
2001 2002 2003 2004 2005 2006 2007 2008 2009 2010 2011
AZ (225 MW)*
CO (231 MW)*
NJ (336 MW)*
NV (170 MW)*
NY (227 MW)*
Perc
en
t o
f S
ola
r/D
G T
arg
et
Met
wit
h S
ola
r/D
G E
lectr
icit
y o
r R
EC
s
*Equivalent solar/DG capacity
(MW) required in
2011 at a 15% capacity factor

Environmental Energy Technologies Division • Energy Analysis Department 33
Enforcement Actions Have Thus Far Been Limited
• Enforcement mechanisms vary, and one should not assume that
strictly failing to meet RPS targets leads to enforcement actions
• Alternative compliance payments (ACPs) totaled $66 million in
2010
• Penalties have been levied in CA, CT, MT, OH, PA, and TX
• Lack of compliance has sometimes been excused
Enforcement Mechanisms States
ACP, Automatic Cost Recovery MA, ME, NH, NJ, RI
ACP, Possible Cost Recovery DC, DE, MD, OR
Explicit Financial Penalties, No Automatic Cost Recovery CA, CT, KS, MI, MO, MT, PA, OH, TX, WA, WI
Discretionary Financial Penalties, No Cost Recovery AZ, CO, HI, MN, NV
Enforcement at PUC Discretion NC, NM
Not Applicable IA, IL, NY
Environmental Energy Technologies Division • Energy Analysis Department 34
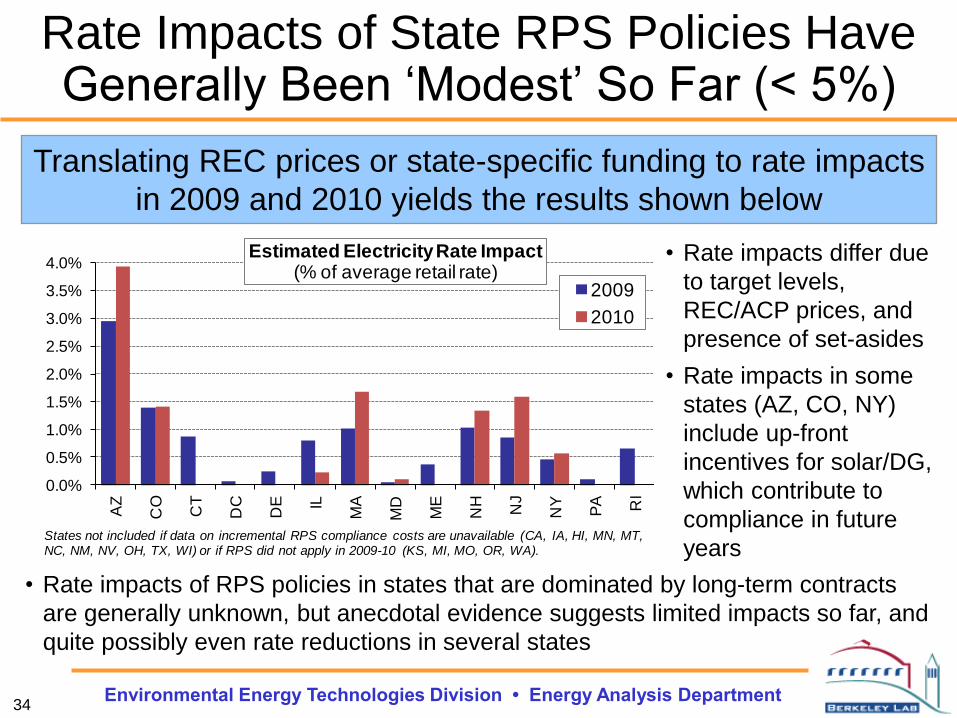
Rate Impacts of State RPS Policies Have Generally Been ‘Modest’ So Far (< 5%)
Translating REC prices or state-specific funding to rate impacts
in 2009 and 2010 yields the results shown below
• Rate impacts of RPS policies in states that are dominated by long-term contracts
are generally unknown, but anecdotal evidence suggests limited impacts so far, and
quite possibly even rate reductions in several states
• Rate impacts differ due
to target levels,
REC/ACP prices, and
presence of set-asides
• Rate impacts in some
states (AZ, CO, NY)
include up-front
incentives for solar/DG,
which contribute to
compliance in future
years
0.0%
0.5%
1.0%
1.5%
2.0%
2.5%
3.0%
3.5%
4.0%
AZ
CO
CT
DC
DE IL
MA
MD
ME
NH
NJ
NY
PA RI
Estimated Electricity Rate Impact (% of average retail rate)
2009
2010
States not included if data on incremental RPS compliance costs are unavailable (CA, IA, HI, MN, MT, NC, NM, NV, OH, TX, WI) or if RPS did not apply in 2009-10 (KS, MI, MO, OR, WA).
Environmental Energy Technologies Division • Energy Analysis Department 35
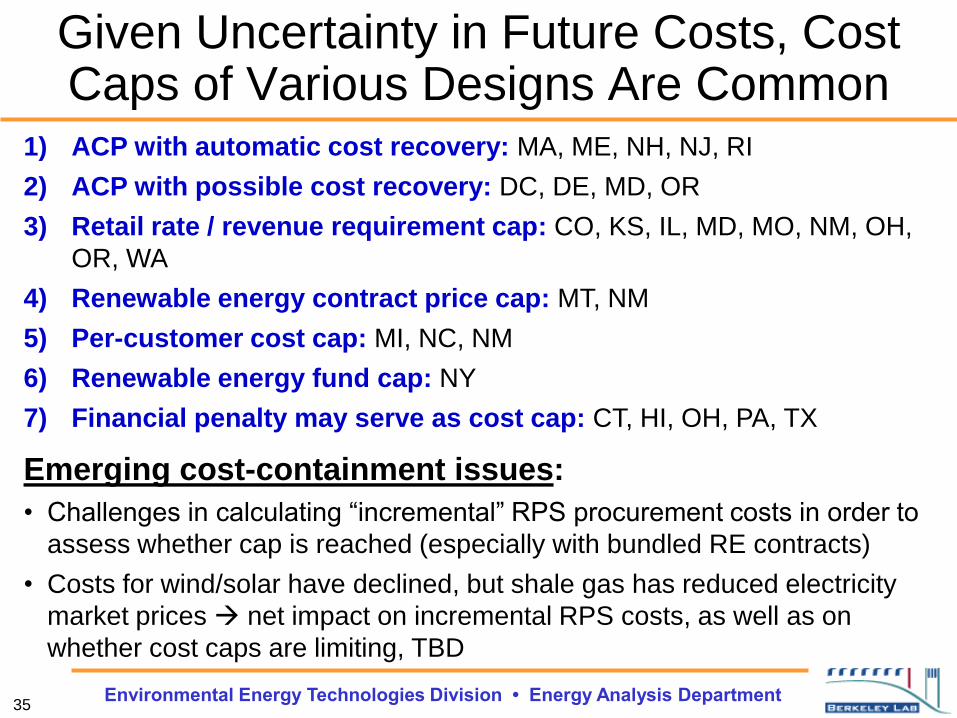
Given Uncertainty in Future Costs, Cost Caps of Various Designs Are Common
1) ACP with automatic cost recovery: MA, ME, NH, NJ, RI
2) ACP with possible cost recovery: DC, DE, MD, OR
3) Retail rate / revenue requirement cap: CO, KS, IL, MD, MO, NM, OH,
OR, WA
4) Renewable energy contract price cap: MT, NM
5) Per-customer cost cap: MI, NC, NM
6) Renewable energy fund cap: NY
7) Financial penalty may serve as cost cap: CT, HI, OH, PA, TX
Emerging cost-containment issues:
• Challenges in calculating “incremental” RPS procurement costs in order to
assess whether cap is reached (especially with bundled RE contracts)
• Costs for wind/solar have declined, but shale gas has reduced electricity
market prices net impact on incremental RPS costs, as well as on
whether cost caps are limiting, TBD

Environmental Energy Technologies Division • Energy Analysis Department 36
Most States Have Capped Rate Impacts Well Below 10% (12 States Below 5%)
• No explicit cap on incremental compliance costs in 9 states (AZ, CA, IA, KS, HI,
NM, NV, PA, WI), though KS caps gross RPS procurement costs and CA is currently
developing its cost containment mechanism.
Many states cost containment mechanisms can be translated
into an estimated maximum increase in retail rates
0%
5%
10%
15%
20%
25%
DE NJ RI MA NH CT DC ME MD OR WA TX MI OH NM NY CO NC IL MO MT
Maximum Incremental RPS Compliance Costs (Percentage Increase in Average Retail Rates)
Max
imu
m E
ffe
ctiv
e R
eta
il R
ate
Incr
eas
e

State RPS, and Proposed Federal RPS, Require Fewer RE Additions than Experienced in 2008-11
Environmental Energy Technologies Division • Energy Analysis Department 37
Recent Renewable Capacity Additions (2008-2011) 6-11 GW/yr
Average Annual Renewable Capacity Additions (2012-2020)
State RPS Requirements 4-5 GW/yr
Proposed Federal RPS (Bingaman 2010) + State RPS 4-11 GW/yr
Continued growth at 2008-11 rate exceeds level required to meet state
RPS’; would be sufficient to meet the most recent Federal RPS proposal
Federal clean energy standards (CES) could yield more or less RE
capacity than historical growth, depending on the specific proposal
New/increased state RPS policies appear less likely going forward in near
term (policy weakening possible)
Demand from non-RPS markets (green power, IRP, least cost) needed to
maintain 2008-11 installation rate
Recent RE capacity additions vs. RE additions required to meet
current state RPS policies and proposed Federal RPS