Embed Size (px)
Citation preview
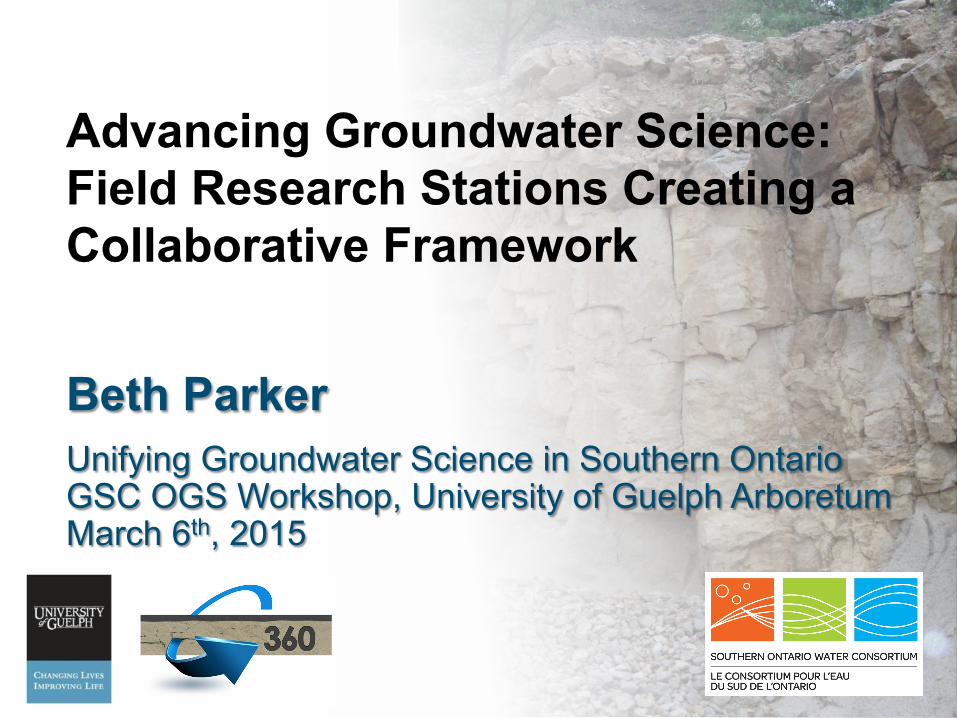
Advancing Groundwater Science: Field Research Stations Creating a Collaborative Framework
Beth Parker
Unifying Groundwater Science in Southern Ontario GSC OGS Workshop, University of Guelph Arboretum March 6th, 2015
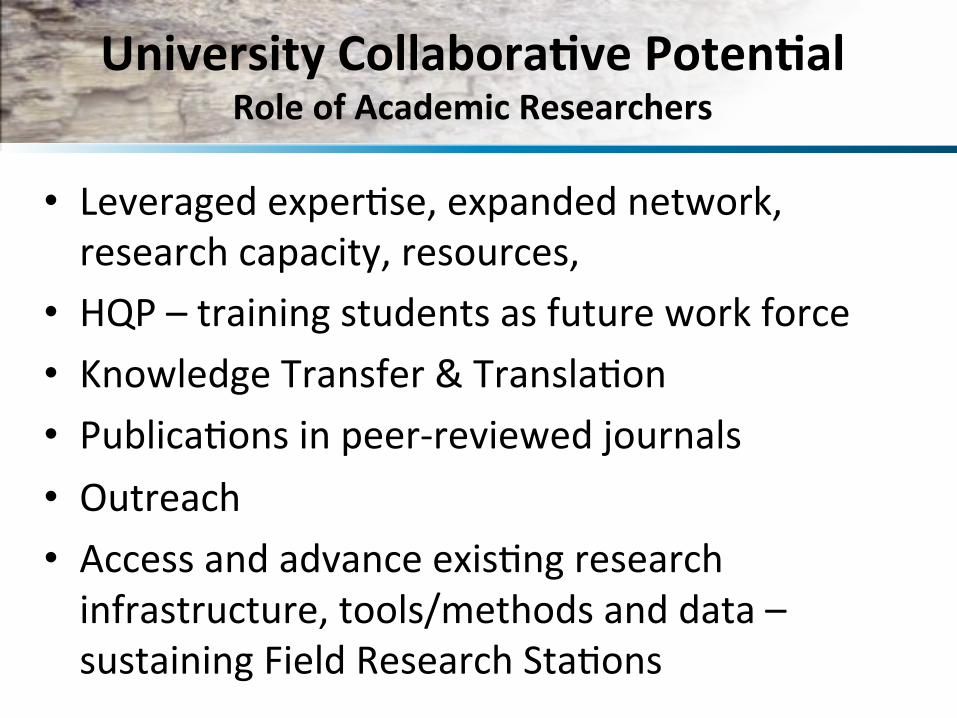
University Collabora0ve Poten0al Role of Academic Researchers
• Leveraged exper+se, expanded network, research capacity, resources,
• HQP – training students as future work force • Knowledge Transfer & Transla+on • Publica+ons in peer-‐reviewed journals • Outreach • Access and advance exis+ng research infrastructure, tools/methods and data – sustaining Field Research Sta+ons
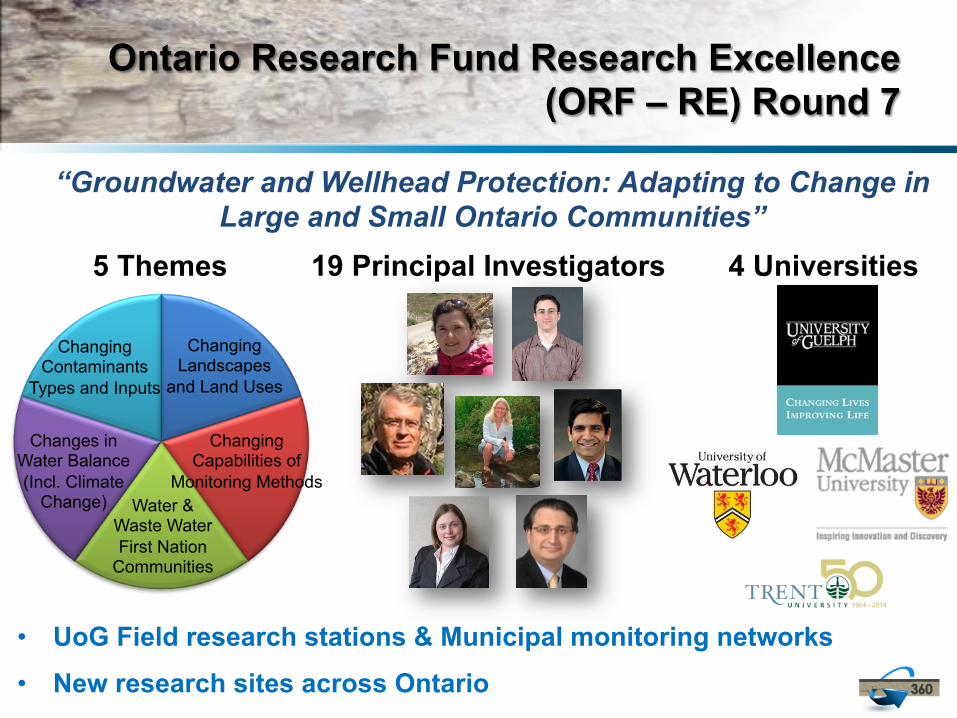
Ontario Research Fund Research Excellence (ORF – RE) Round 7
“Groundwater and Wellhead Protection: Adapting to Change in Large and Small Ontario Communities”
• UoG Field research stations & Municipal monitoring networks
• New research sites across Ontario
5 Themes 19 Principal Investigators 4 Universities
Changing Contaminants
Types and Inputs
Changing Landscapes
and Land Uses
Changing Capabilities of
Monitoring Methods Water &
Waste Water First Nation
Communities
Changes in Water Balance (Incl. Climate
Change)
Silurian Dolostone Belt
Water supply
50 km
N
Grand River Watershed
Toronto
Buffalo
Fractured Dolostone
Guelph
Cambridge Waterloo
N
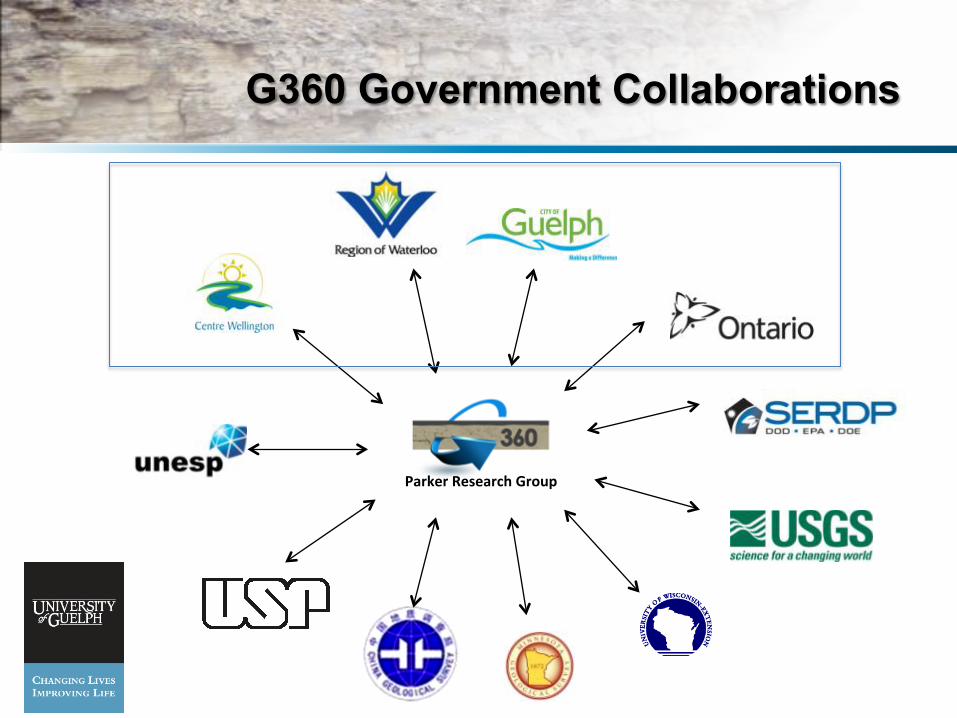
G360 Government Collaborations
Parker Research Group
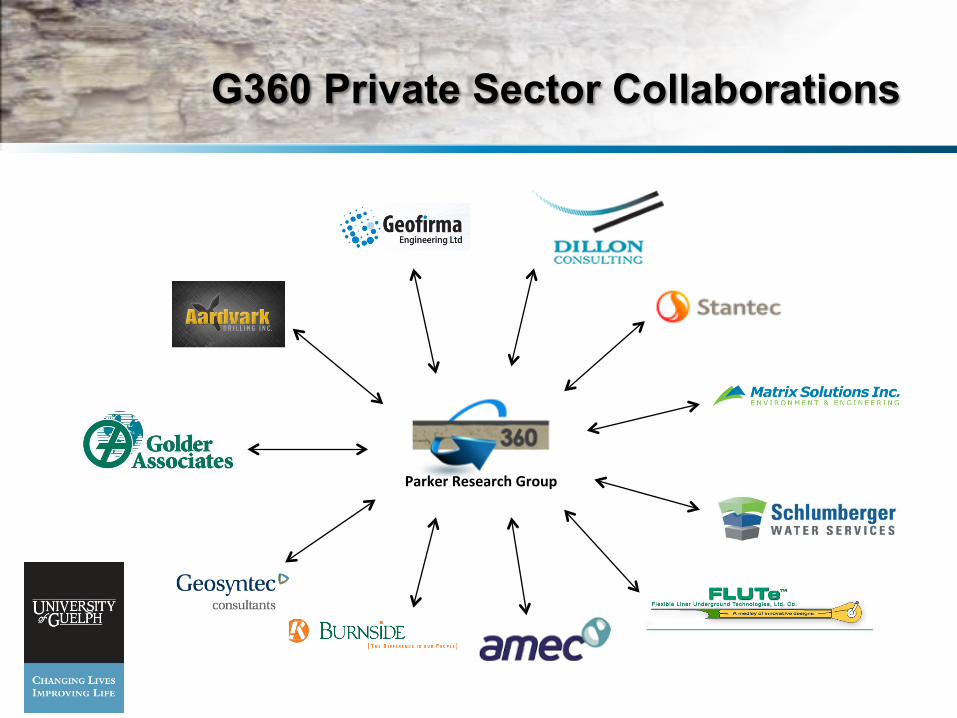
G360 Private Sector Collaborations
Parker Research Group
SOWC: A PLATFORM FOR COLLABORATION AND INNOVATION IN THE WATER SECTOR
8
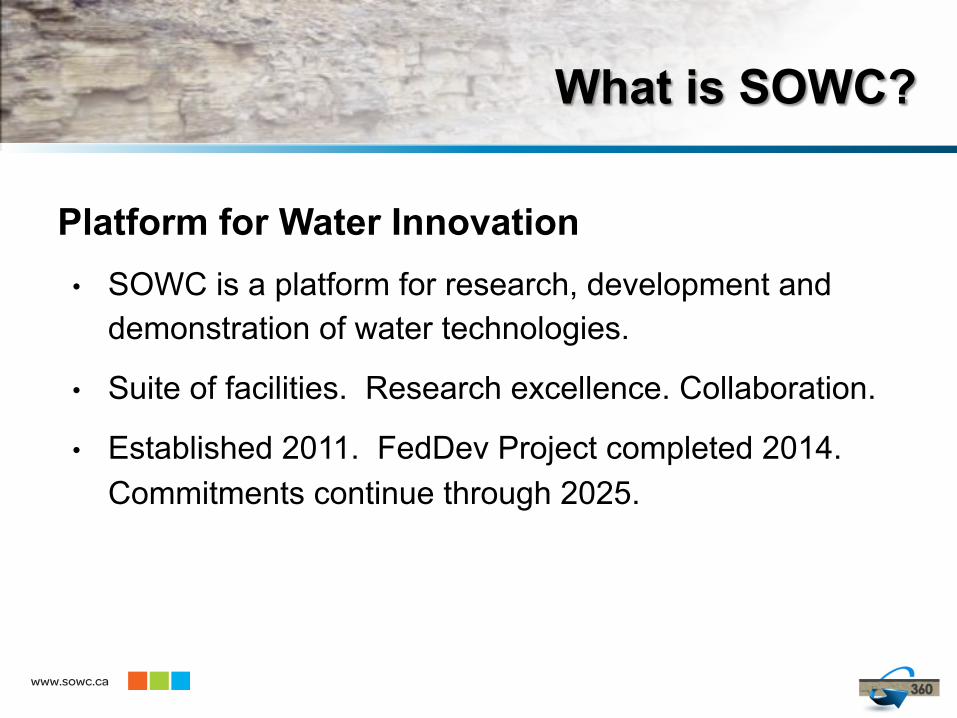
What is SOWC?
Platform for Water Innovation • SOWC is a platform for research, development and
demonstration of water technologies.
• Suite of facilities. Research excellence. Collaboration.
• Established 2011. FedDev Project completed 2014. Commitments continue through 2025.
www.sowc.ca
9
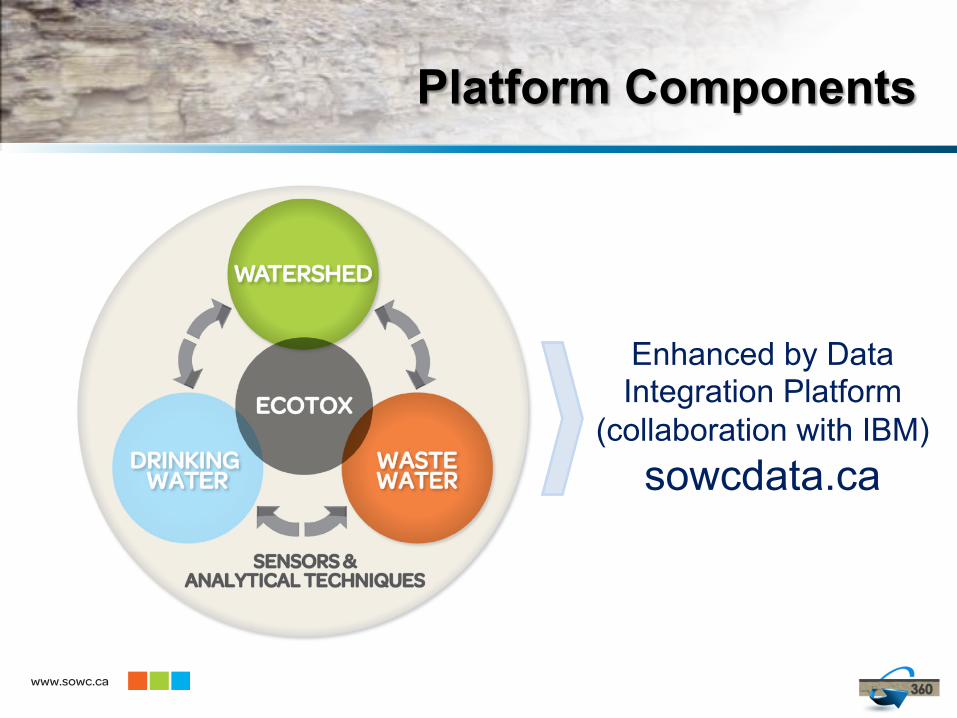
Platform Components
www.sowc.ca
Enhanced by Data Integration Platform
(collaboration with IBM) sowcdata.ca
10
Watersheds Node SOWC
www.sowc.ca
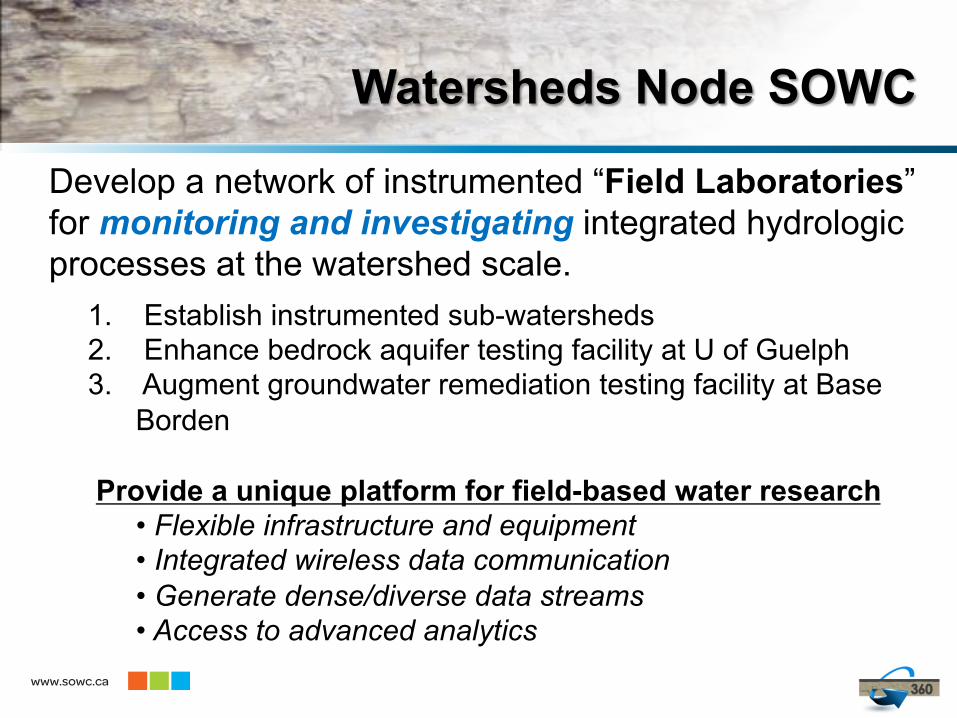
Develop a network of instrumented “Field Laboratories” for monitoring and investigating integrated hydrologic processes at the watershed scale.
1. Establish instrumented sub-watersheds 2. Enhance bedrock aquifer testing facility at U of Guelph 3. Augment groundwater remediation testing facility at Base
Borden Provide a unique platform for field-based water research
• Flexible infrastructure and equipment • Integrated wireless data communication • Generate dense/diverse data streams • Access to advanced analytics
11
Who is SOWC? Post-Secondary Partners
www.sowc.ca
12
Who is SOWC?
www.sowc.ca
Strategic Partners:
Funders:
13
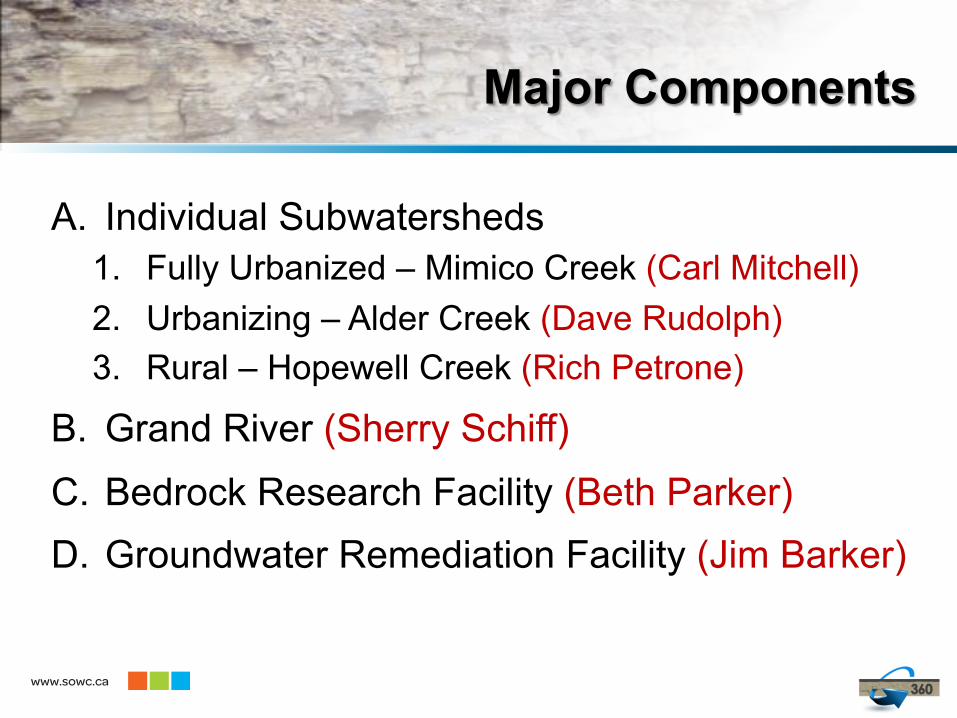
Major Components
www.sowc.ca
A. Individual Subwatersheds 1. Fully Urbanized – Mimico Creek (Carl Mitchell) 2. Urbanizing – Alder Creek (Dave Rudolph) 3. Rural – Hopewell Creek (Rich Petrone)
B. Grand River (Sherry Schiff)
C. Bedrock Research Facility (Beth Parker)
D. Groundwater Remediation Facility (Jim Barker)
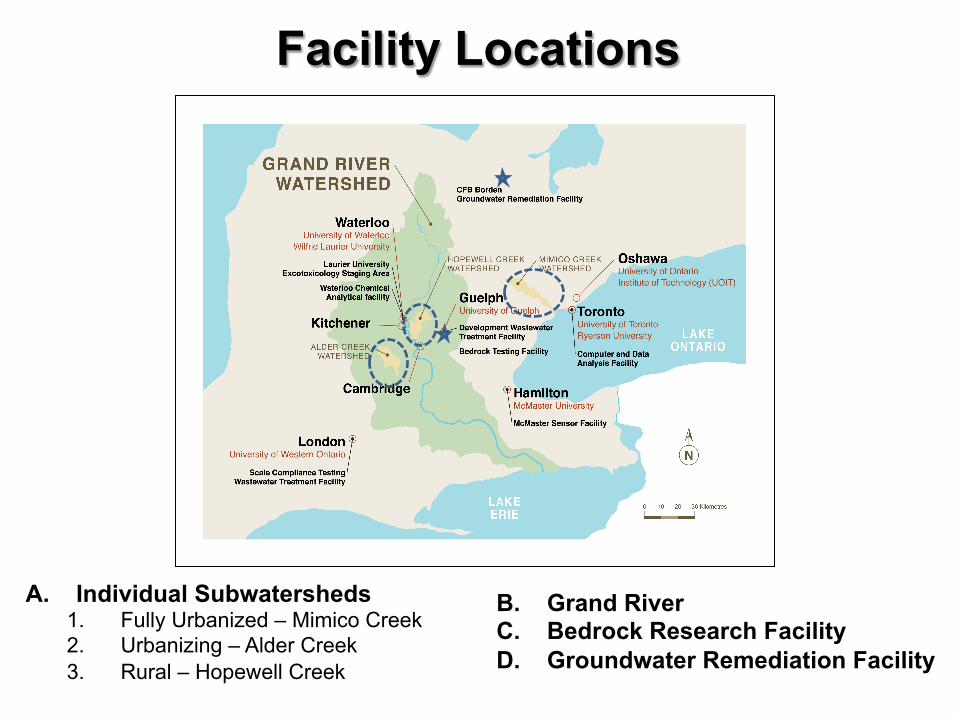
Facility Locations
A. Individual Subwatersheds 1. Fully Urbanized – Mimico Creek 2. Urbanizing – Alder Creek 3. Rural – Hopewell Creek
B. Grand River C. Bedrock Research Facility D. Groundwater Remediation Facility
15
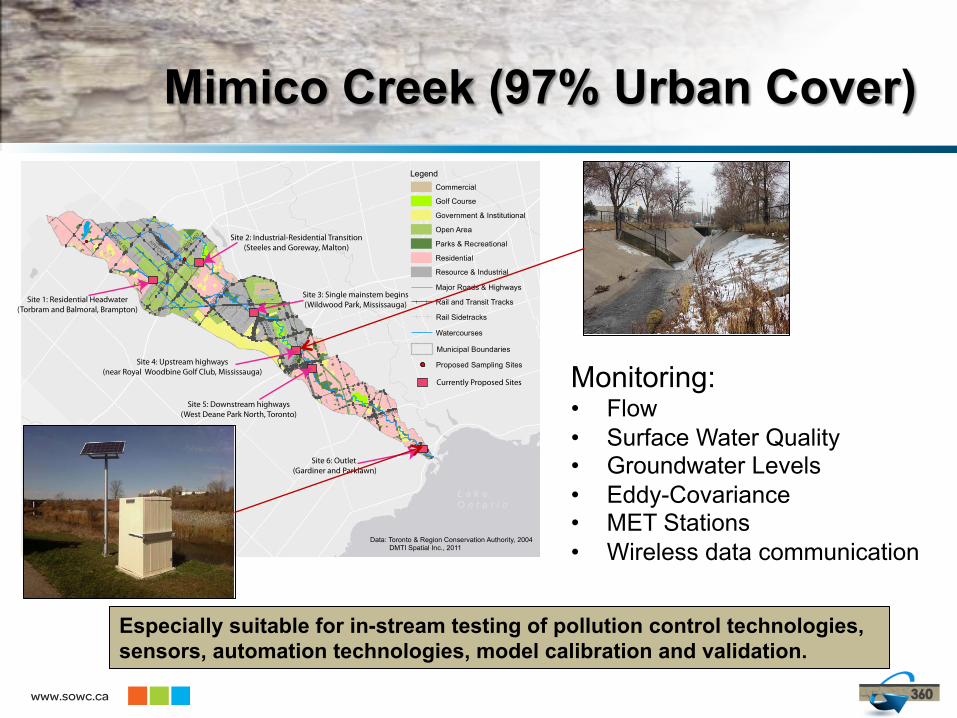
Mimico Creek (97% Urban Cover)
www.sowc.ca
TORBRAM RDAIRPORT RD
HIGHWAY 407
DERRY RD E
HIG
HWAY
401
HIG
HW
AY 427
STEE
LES AV
E E
BLOOR ST W
L a k e
O n t a r i o
± 0 2.5 5 Km Data: Toronto & Region Conservation Authority, 2004 DMTI Spatial Inc., 2011
Legend
Municipal Boundaries
Watercourses
Rail and Transit Tracks
Rail Sidetracks
Major Roads & Highways
Commercial
Golf Course
Government & Institutional
Open Area
Parks & Recreational
Residential
Resource & Industrial
Proposed Sampling Sites
Currently Proposed Sites
Site 1: Residential Headwater(Torbram and Balmoral, Brampton)
Site 2: Industrial-Residential Transition(Steeles and Goreway, Malton)
Site 3: Single mainstem begins(Wildwood Park, Mississauga)
Site 4: Upstream highways(near Royal Woodbine Golf Club, Mississauga)
Site 5: Downstream highways(West Deane Park North, Toronto)
Site 6: Outlet (Gardiner and Parklawn)
Especially suitable for in-stream testing of pollution control technologies, sensors, automation technologies, model calibration and validation.
Monitoring: • Flow • Surface Water Quality • Groundwater Levels • Eddy-Covariance • MET Stations • Wireless data communication
16
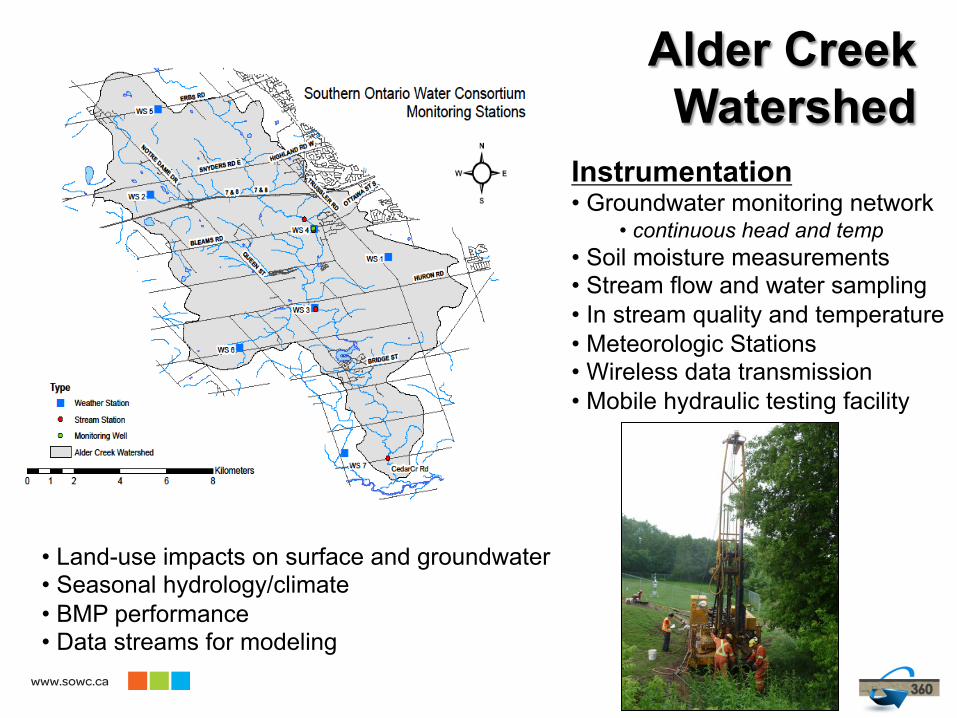
Alder Creek Watershed
www.sowc.ca
Instrumentation • Groundwater monitoring network
• continuous head and temp • Soil moisture measurements • Stream flow and water sampling • In stream quality and temperature • Meteorologic Stations • Wireless data transmission • Mobile hydraulic testing facility
• Land-use impacts on surface and groundwater • Seasonal hydrology/climate • BMP performance • Data streams for modeling
17 www.sowc.ca
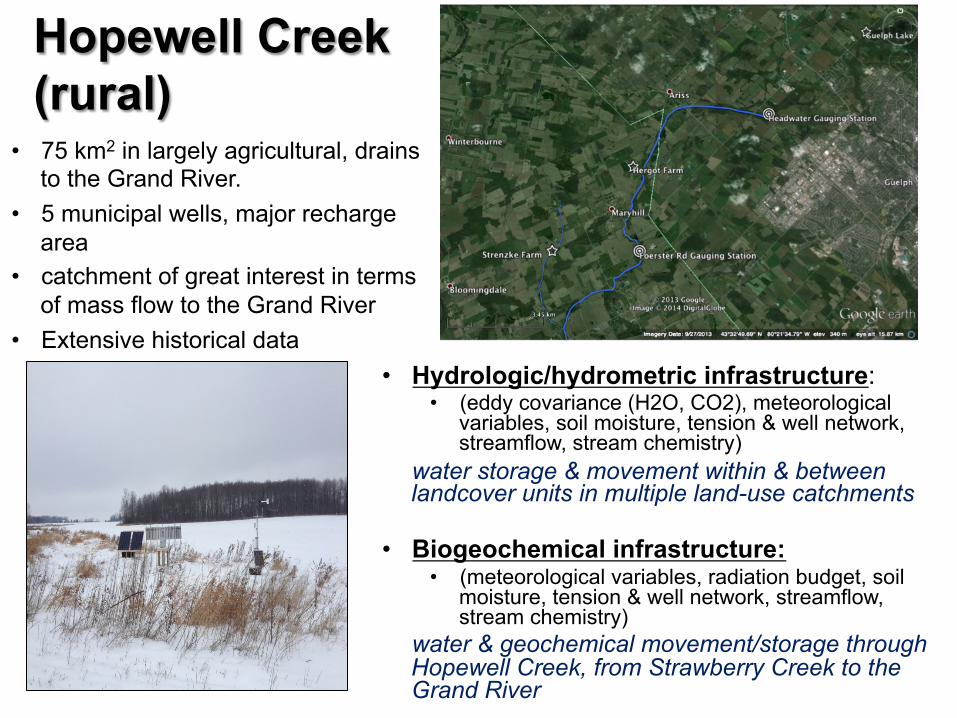
Hopewell Creek (rural)
• 75 km2 in largely agricultural, drains to the Grand River.
• 5 municipal wells, major recharge area
• catchment of great interest in terms of mass flow to the Grand River
• Extensive historical data • Hydrologic/hydrometric infrastructure:
• (eddy covariance (H2O, CO2), meteorological variables, soil moisture, tension & well network, streamflow, stream chemistry)
water storage & movement within & between landcover units in multiple land-use catchments
• Biogeochemical infrastructure:
• (meteorological variables, radiation budget, soil moisture, tension & well network, streamflow, stream chemistry)
water & geochemical movement/storage through Hopewell Creek, from Strawberry Creek to the Grand River
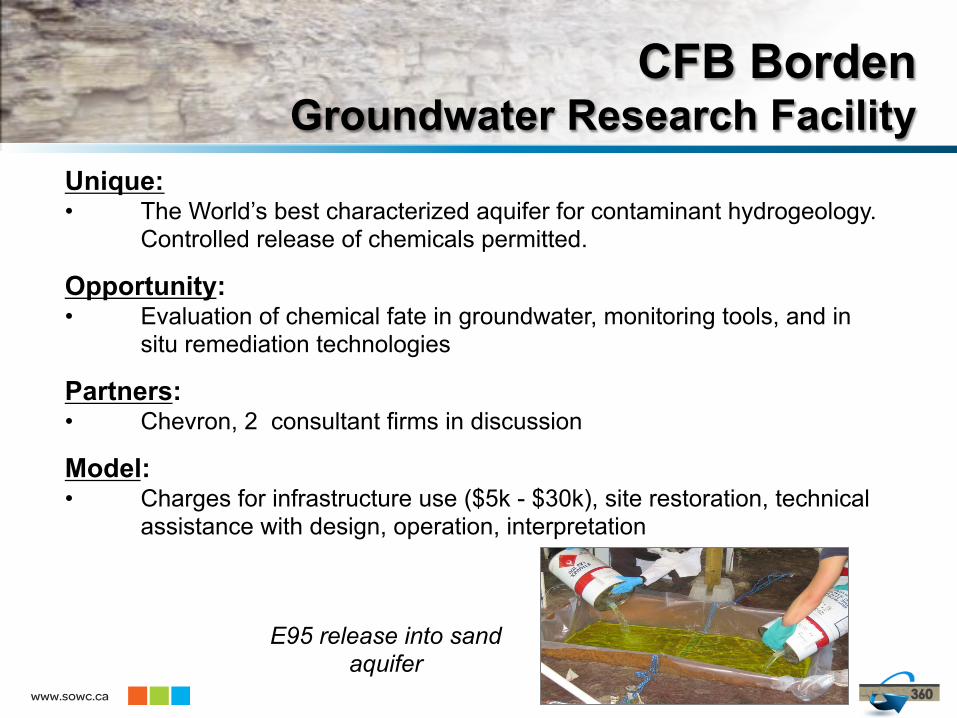
CFB Borden Groundwater Research Facility
www.sowc.ca
E95 release into sand aquifer
Unique: • The World’s best characterized aquifer for contaminant hydrogeology.
Controlled release of chemicals permitted.
Opportunity: • Evaluation of chemical fate in groundwater, monitoring tools, and in
situ remediation technologies
Partners: • Chevron, 2 consultant firms in discussion
Model: • Charges for infrastructure use ($5k - $30k), site restoration, technical
assistance with design, operation, interpretation
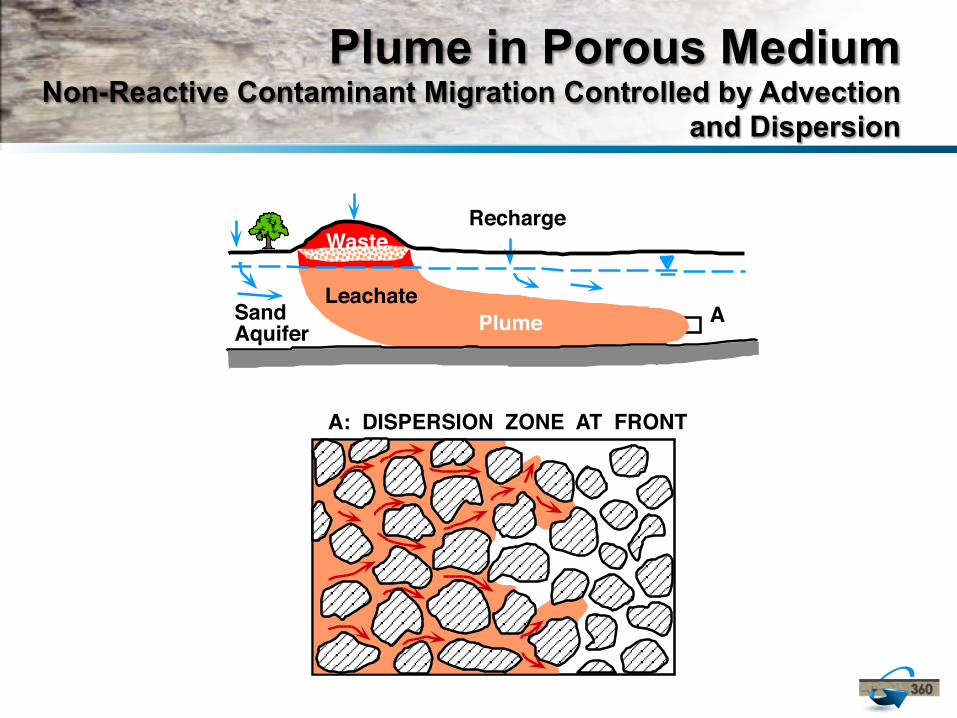
Plume in Porous Medium Non-Reactive Contaminant Migration Controlled by Advection
and Dispersion
A: DISPERSION ZONE AT FRONT
Recharge
Sand Aquifer
Waste
Leachate Plume A
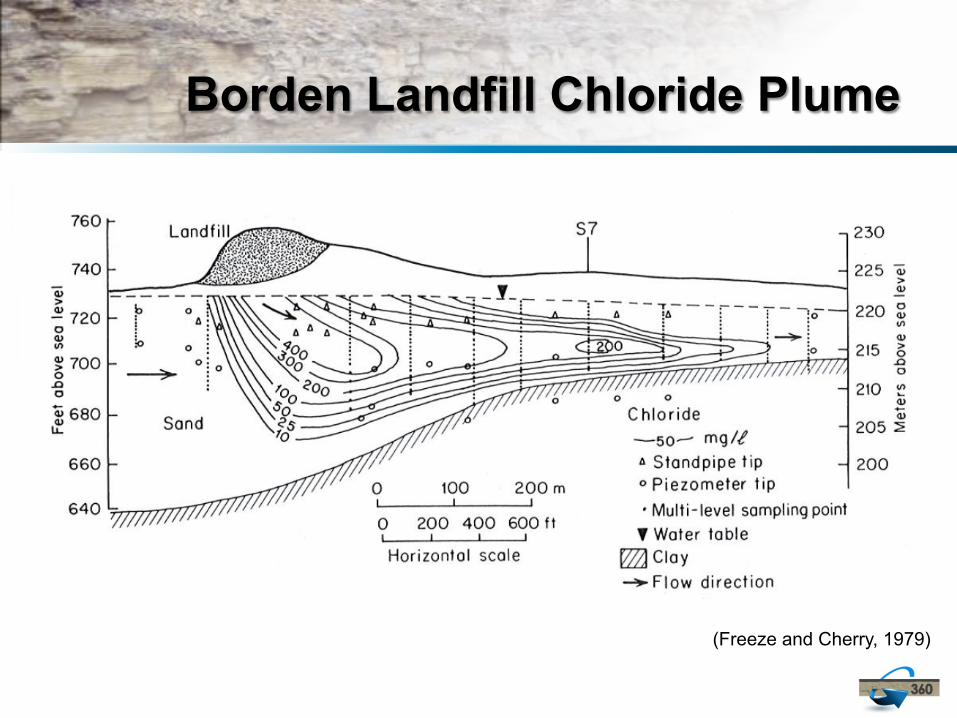
Borden Landfill Chloride Plume
(Freeze and Cherry, 1979)
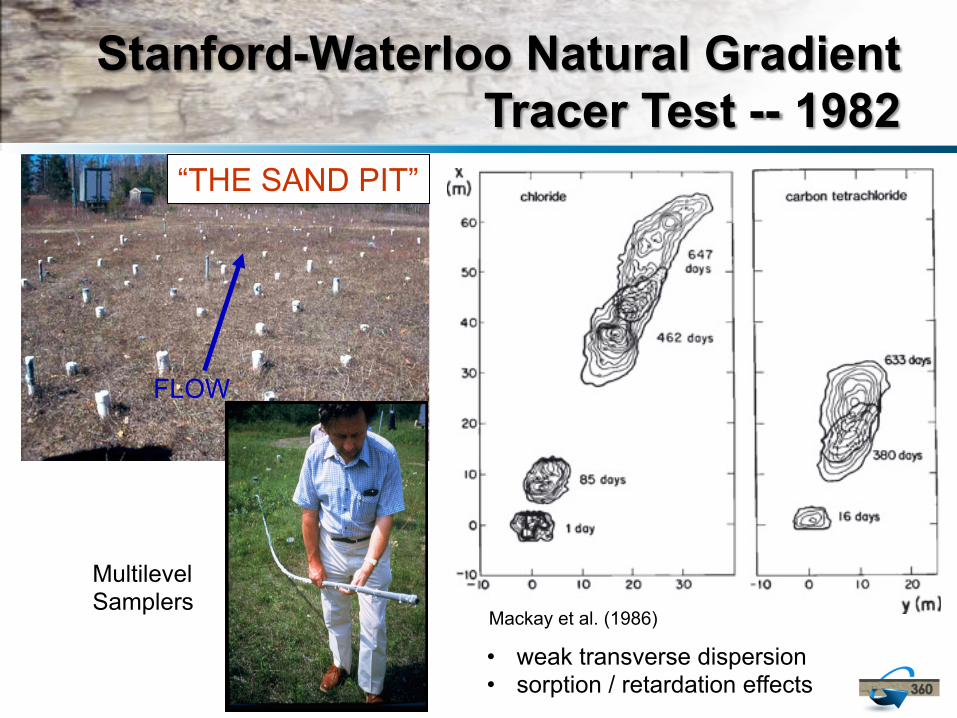
Stanford-Waterloo Natural Gradient Tracer Test -- 1982
Mackay et al. (1986)
• weak transverse dispersion • sorption / retardation effects
“THE SAND PIT”
FLOW
Multilevel Samplers
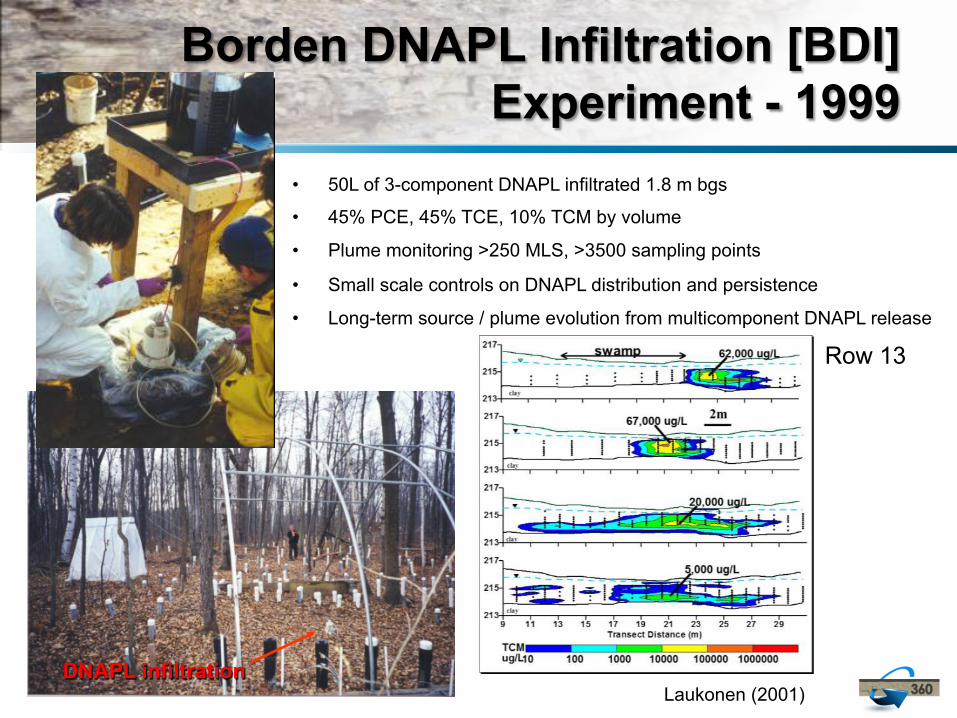
Borden DNAPL Infiltration [BDI] Experiment - 1999
• 50L of 3-component DNAPL infiltrated 1.8 m bgs
• 45% PCE, 45% TCE, 10% TCM by volume
• Plume monitoring >250 MLS, >3500 sampling points
• Small scale controls on DNAPL distribution and persistence
• Long-term source / plume evolution from multicomponent DNAPL release
DNAPL infiltration
Row 13
Laukonen (2001)
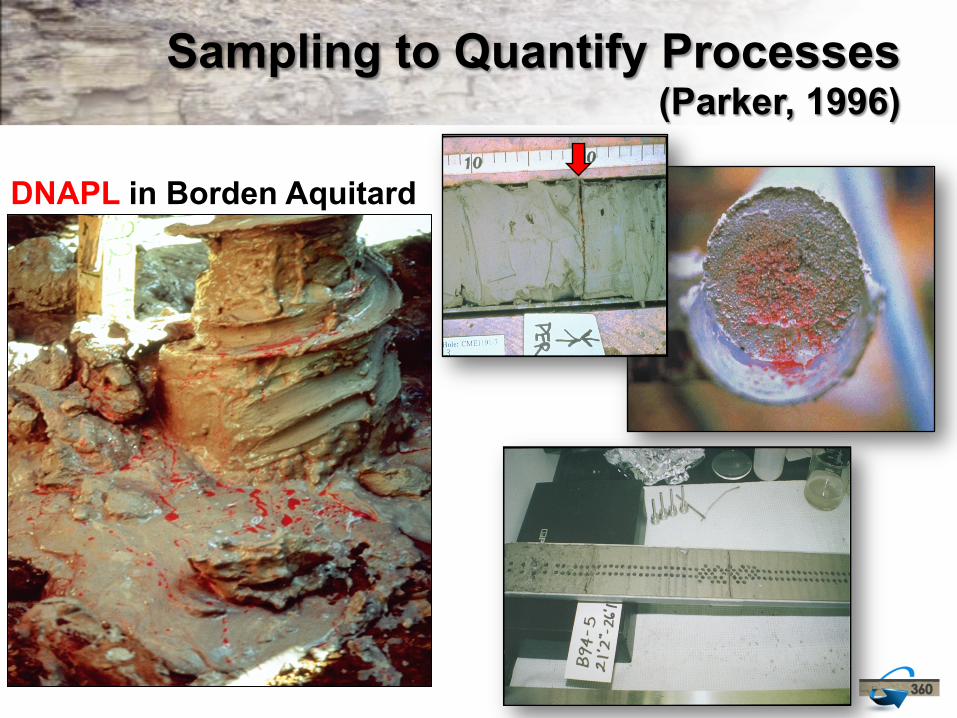
Sampling to Quantify Processes (Parker, 1996)
DNAPL in Borden Aquitard
0 100 200 300 -40
-20
0
20
40
60
Concentration ( mg/L )
Dis
tanc
e ( c
m )
De/R = 2.49 x 10⁻⁷ R = 8.6
De/R = 2.30 x 10 R = 13.6
-7
De/R = 1.98 x 10⁻⁷ R = 10.7
De/R = 1.44 x 10⁻⁷ R = 7.7
PCE SAND
PCE SAND
PCE SAND
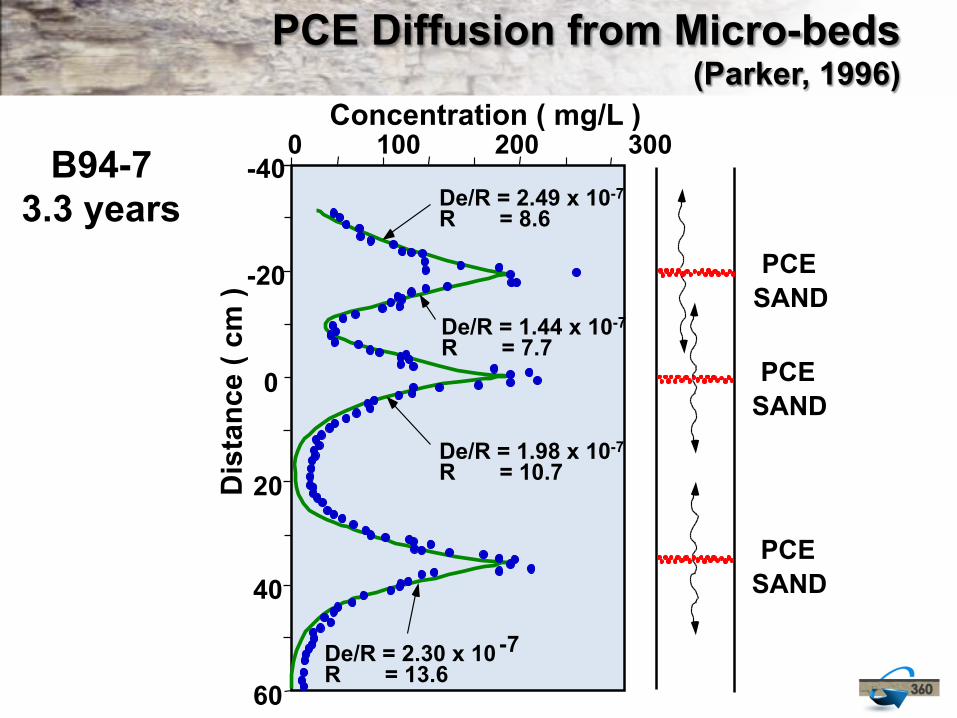
B94-7 3.3 years
PCE Diffusion from Micro-beds (Parker, 1996)
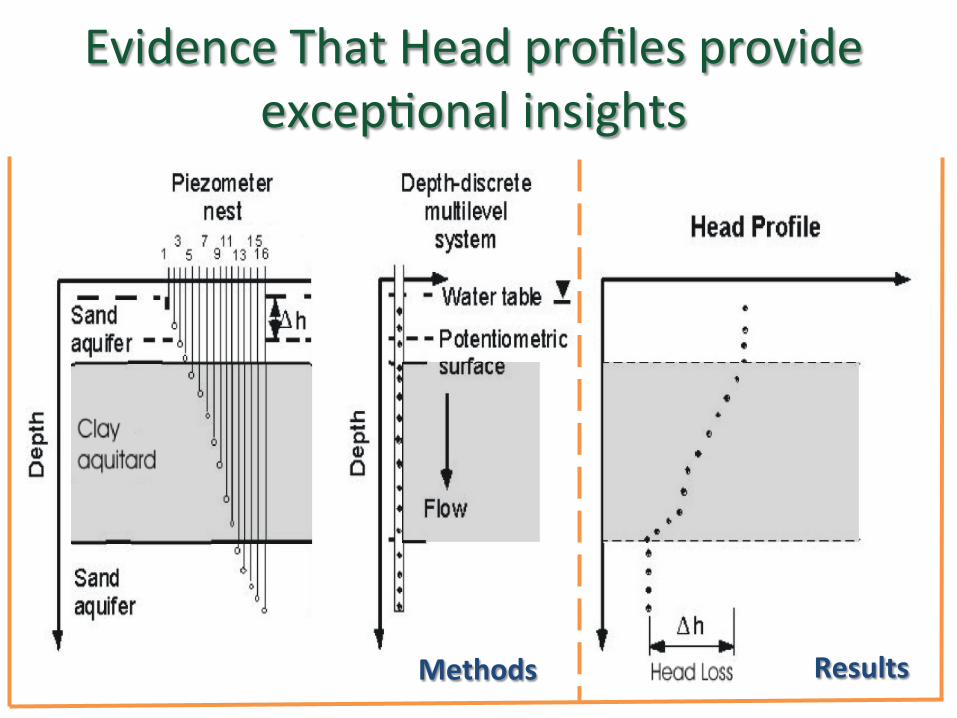
Evidence That Head profiles provide excep+onal insights
Methods Results
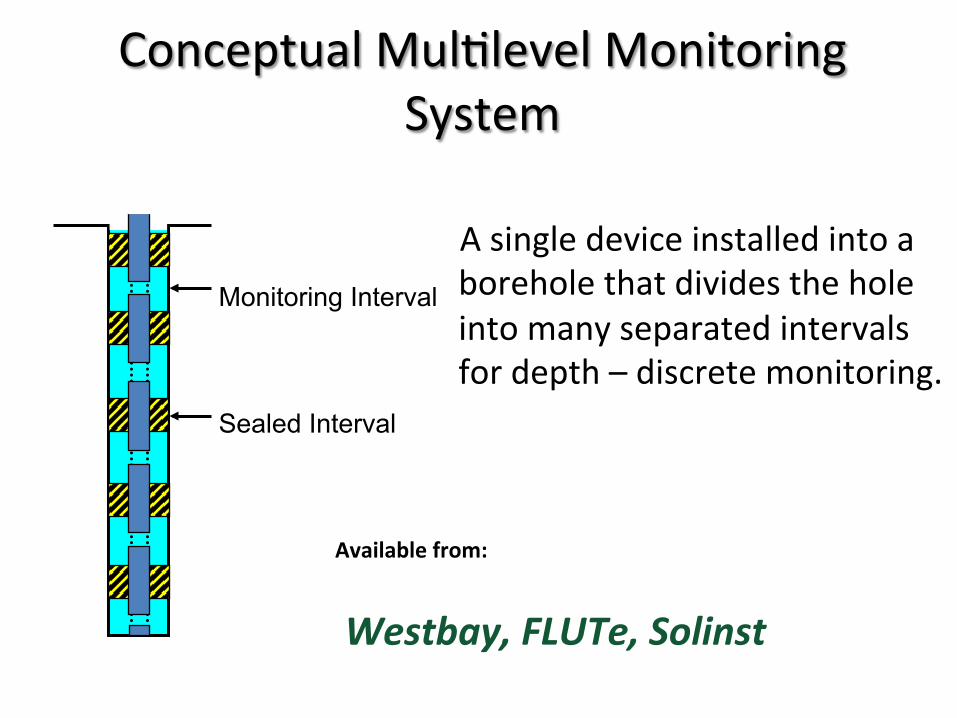
Conceptual Mul+level Monitoring System
A single device installed into a borehole that divides the hole into many separated intervals for depth – discrete monitoring.
Monitoring Interval
Sealed Interval
Westbay, FLUTe, Solinst
Available from:
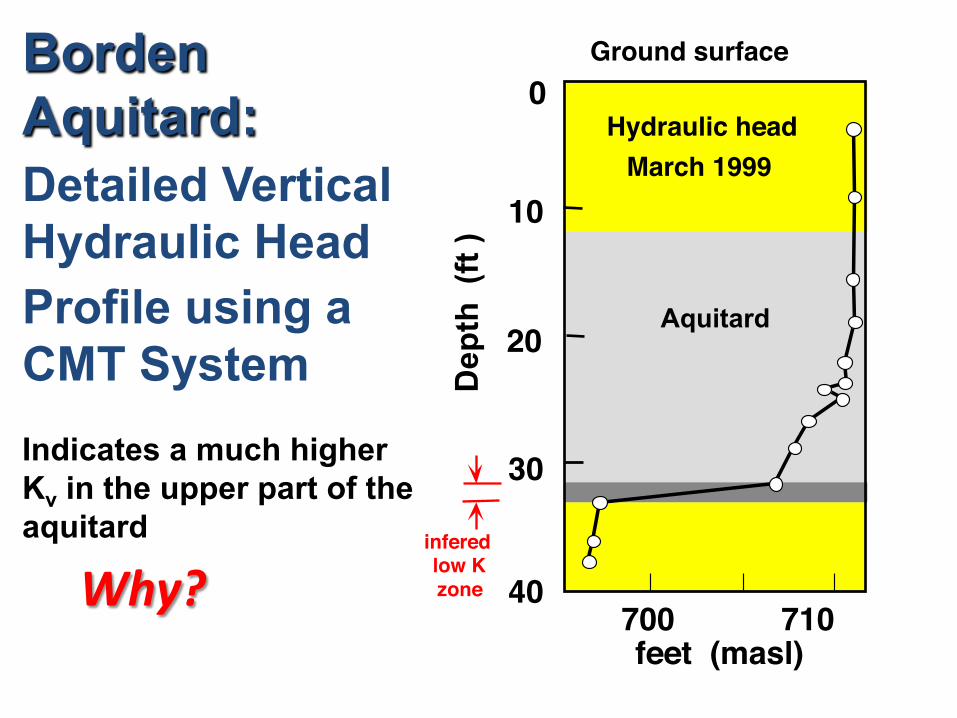
Borden Aquitard: Detailed Vertical Hydraulic Head Profile using a CMT System Indicates a much higher Kv in the upper part of the aquitard
0
10
20
30
40
Dep
th (
ft )
700 710 feet (masl)
Hydraulic head March 1999
Ground surface
infered low K zone
Aquitard
Why?
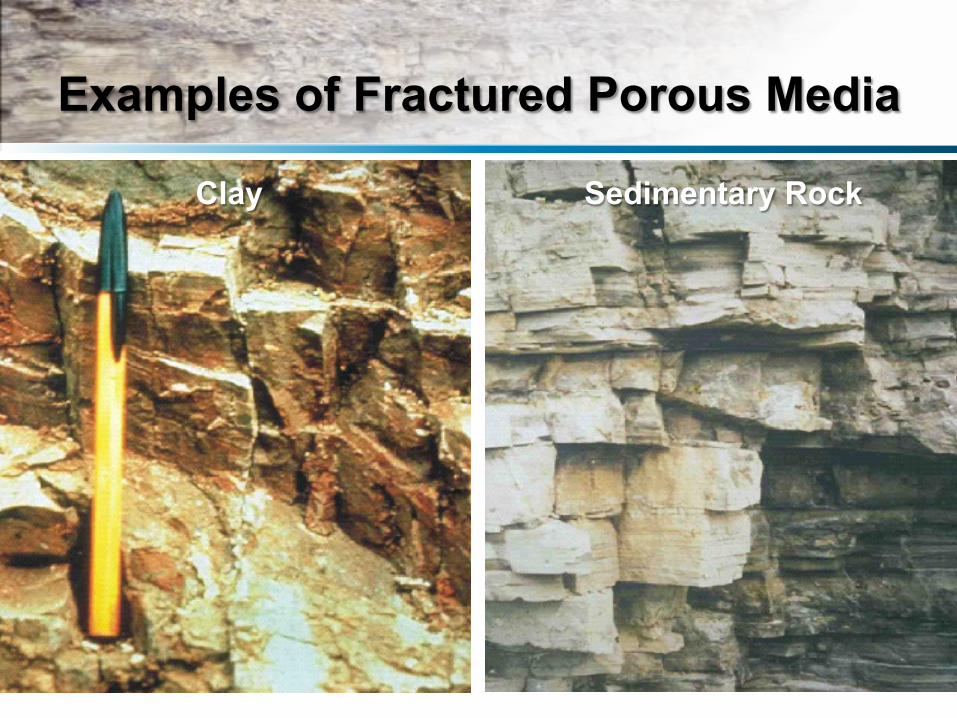
Examples of Fractured Porous Media
Clay Sedimentary Rock
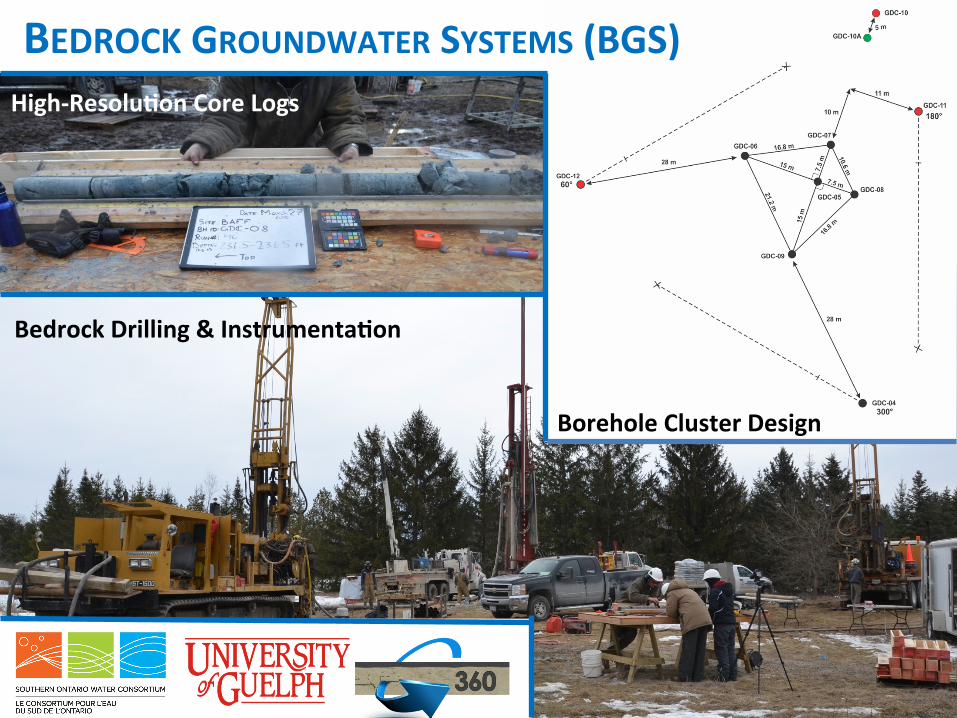
BEDROCK GROUNDWATER SYSTEMS (BGS)
Borehole Cluster Design
High-‐Resolu0on Core Logs
Bedrock Drilling & Instrumenta0on
30
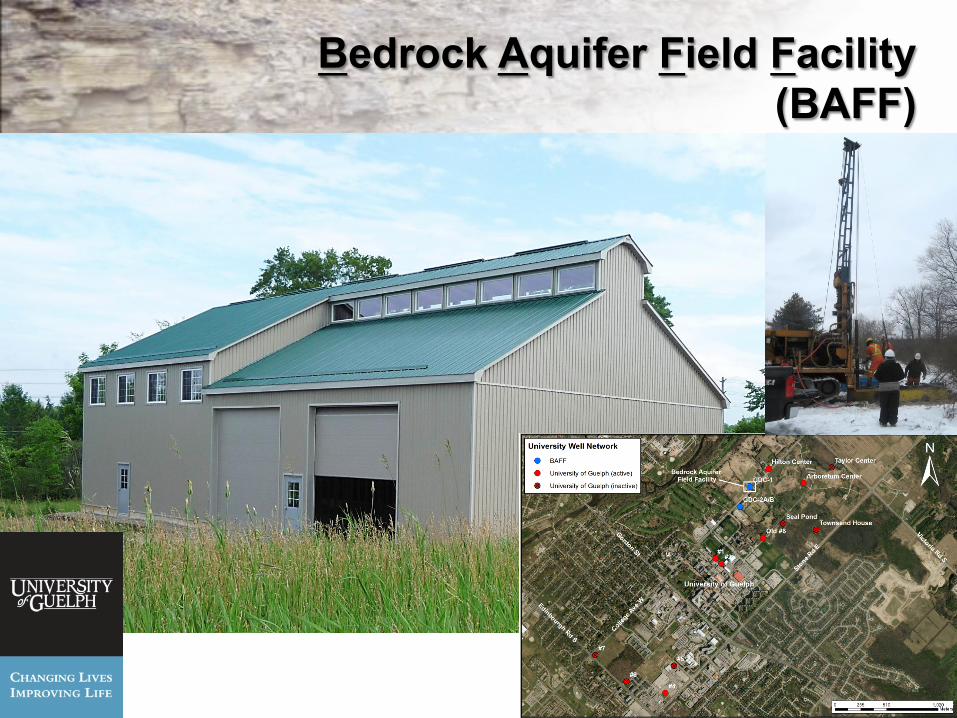
Bedrock Aquifer Field Facility (BAFF)
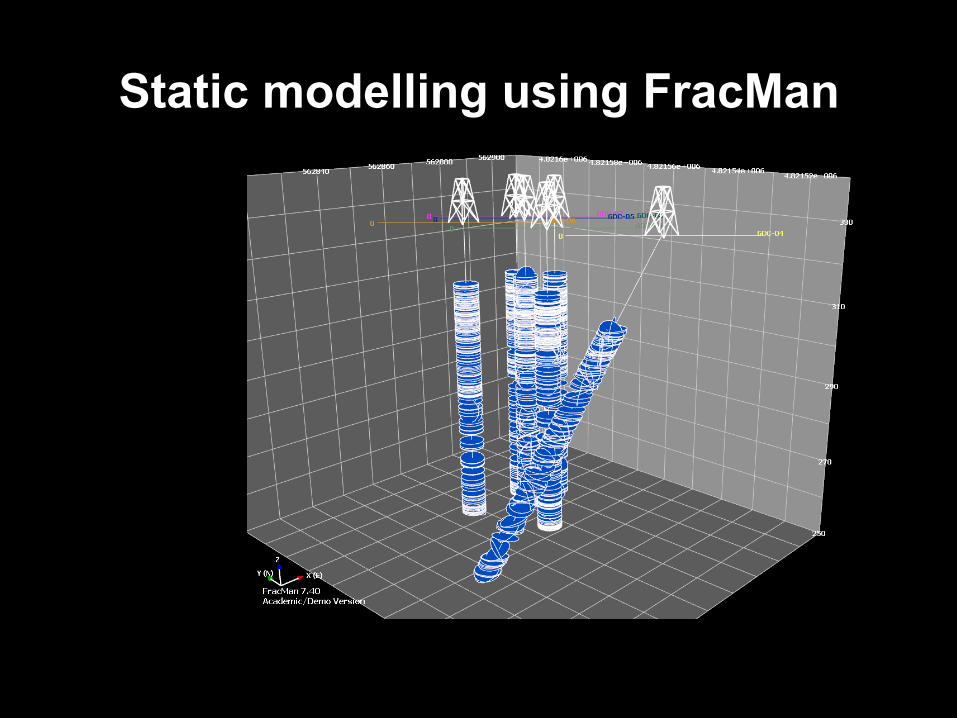
Static modelling using FracMan
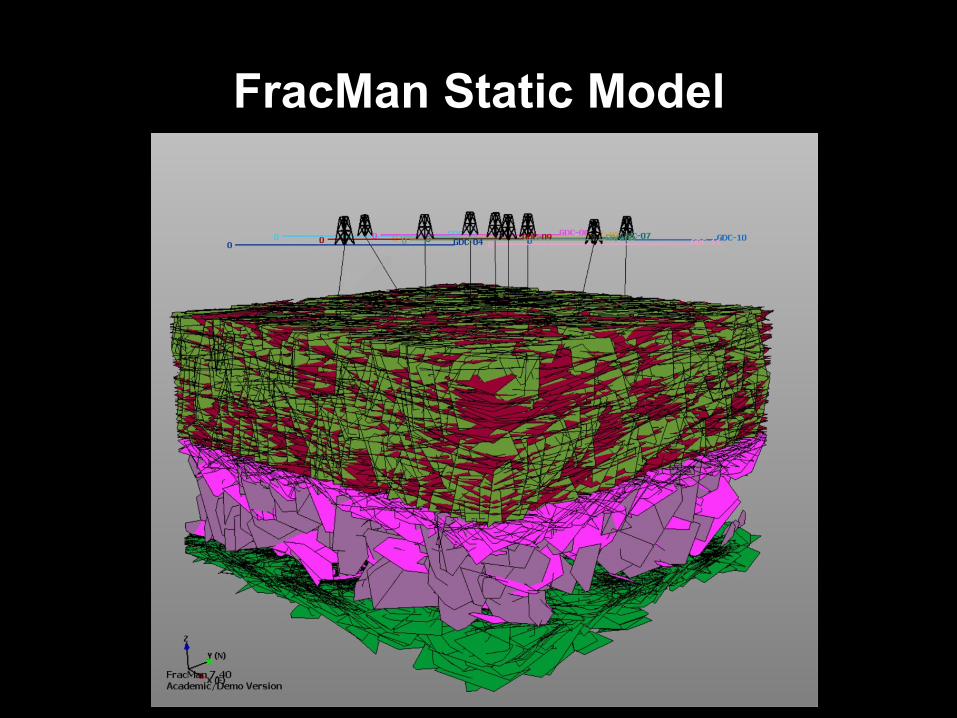
FracMan Static Model
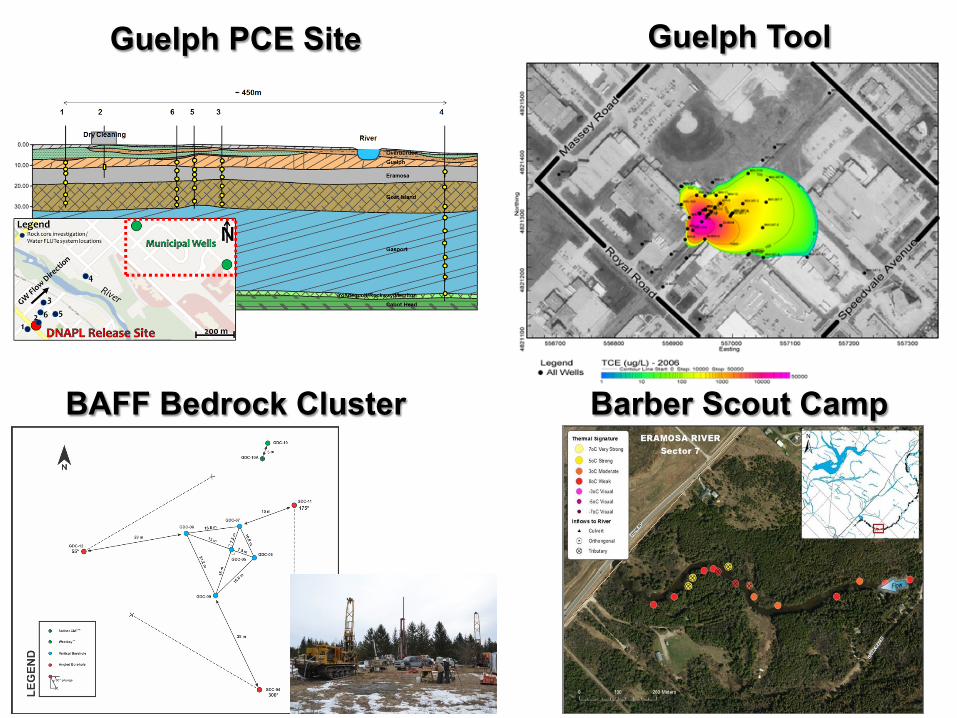
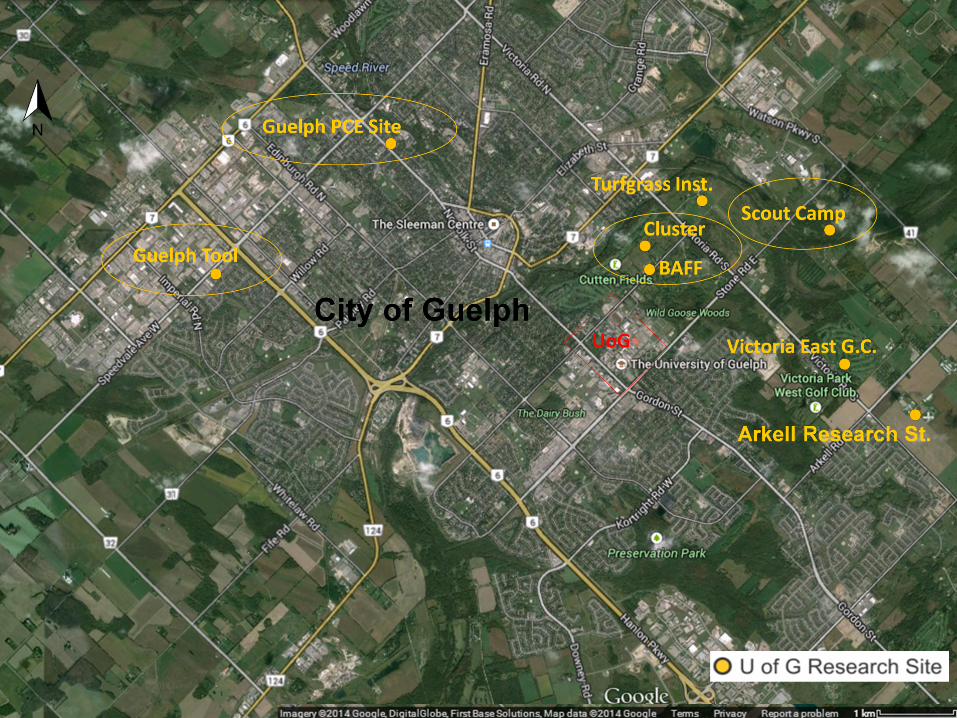
Guelph PCE Site Guelph Tool
BAFF Bedrock Cluster Barber Scout Camp
34
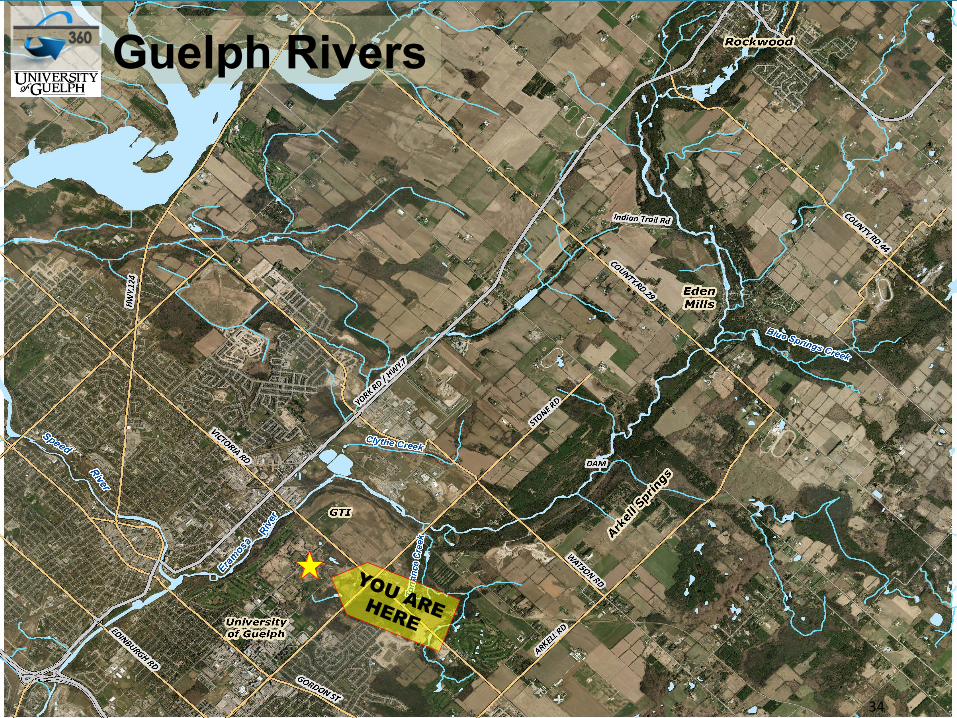
Guelph Rivers
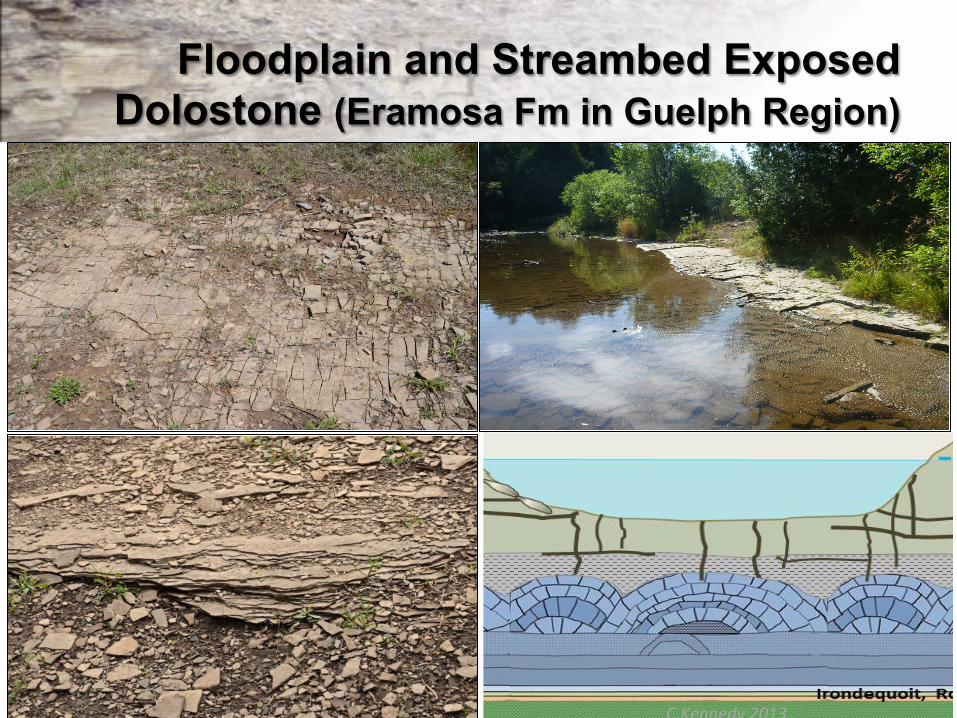
Floodplain and Streambed Exposed Dolostone (Eramosa Fm in Guelph Region)
35 C.Kennedy 2013
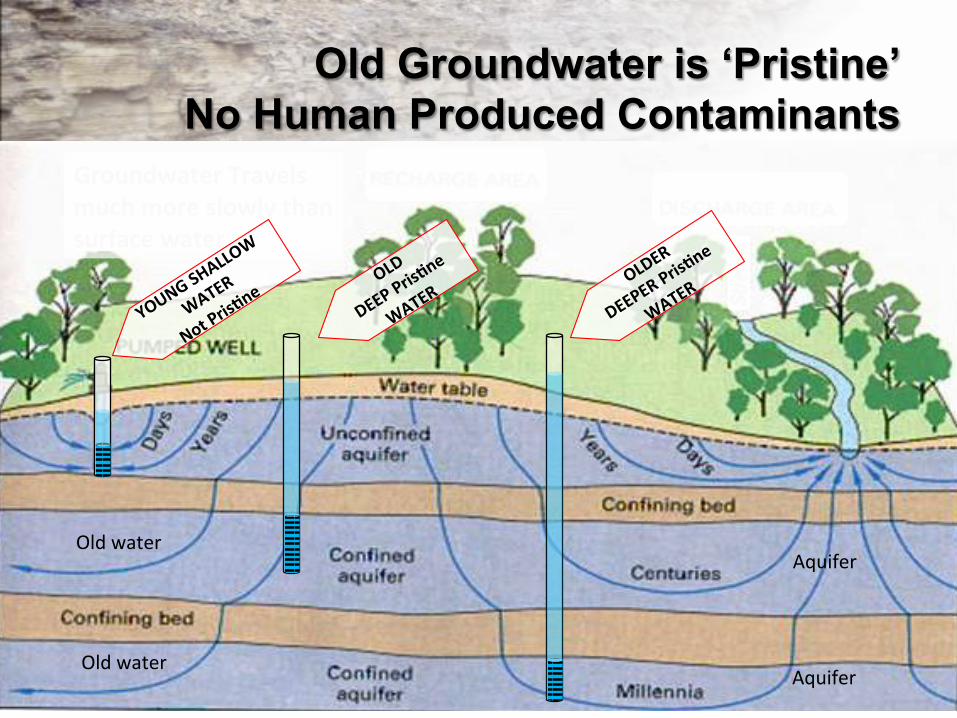
Old Groundwater is ‘Pristine’ No Human Produced Contaminants
Groundwater Travels much more slowly than surface water
Old water
Old water
Aquifer
Aquifer
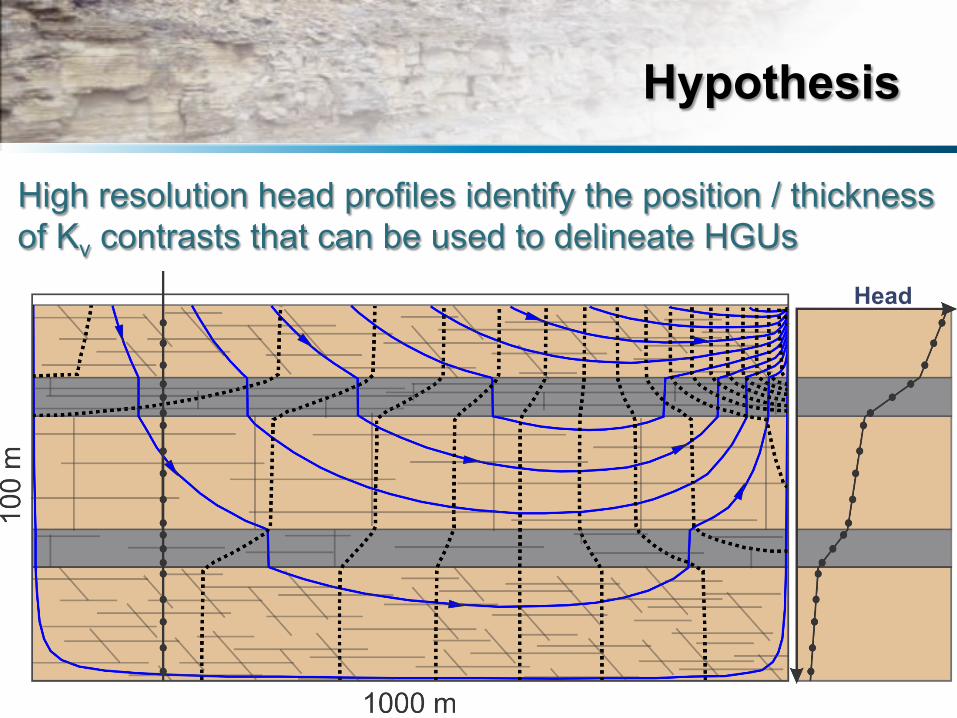
Hypothesis
High resolution head profiles identify the position / thickness of Kv contrasts that can be used to delineate HGUs
Head
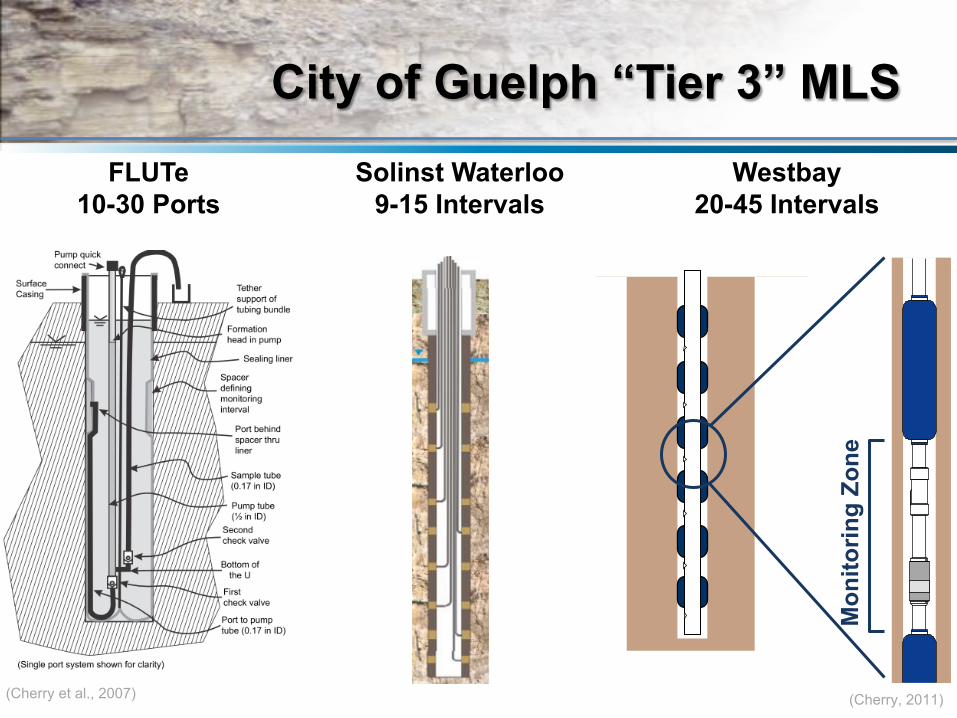
City of Guelph “Tier 3” MLS FLUTe
10-30 Ports Solinst Waterloo
9-15 Intervals Westbay
20-45 Intervals
Mon
itorin
g Zo
ne
(Cherry, 2011) (Cherry et al., 2007)
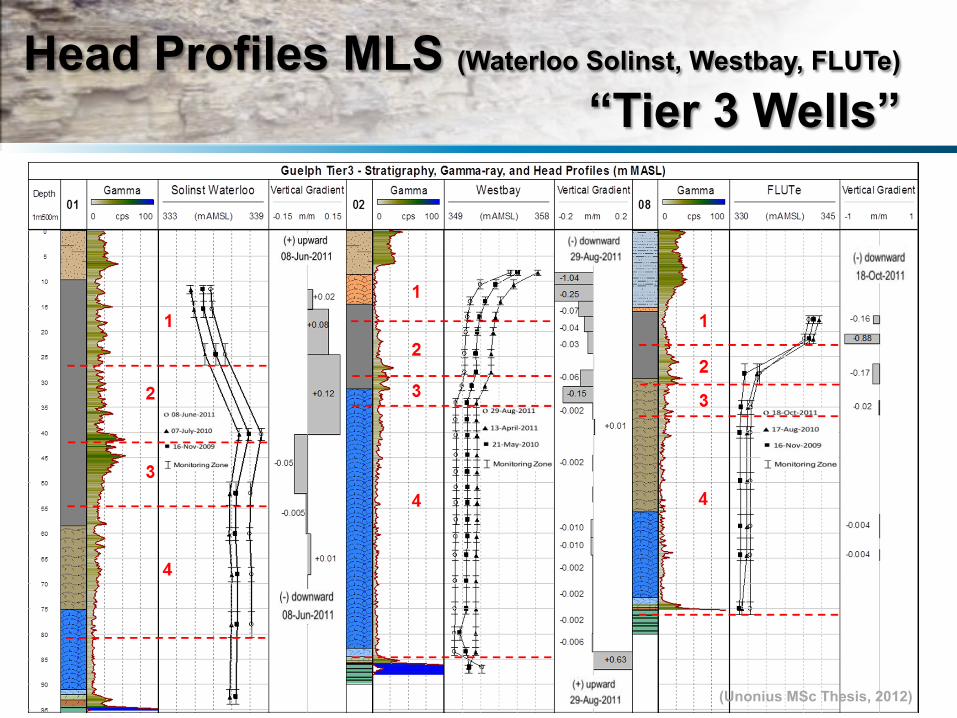
Head Profiles MLS (Waterloo Solinst, Westbay, FLUTe)
“Tier 3 Wells”
(Unonius MSc Thesis, 2012)
Elora
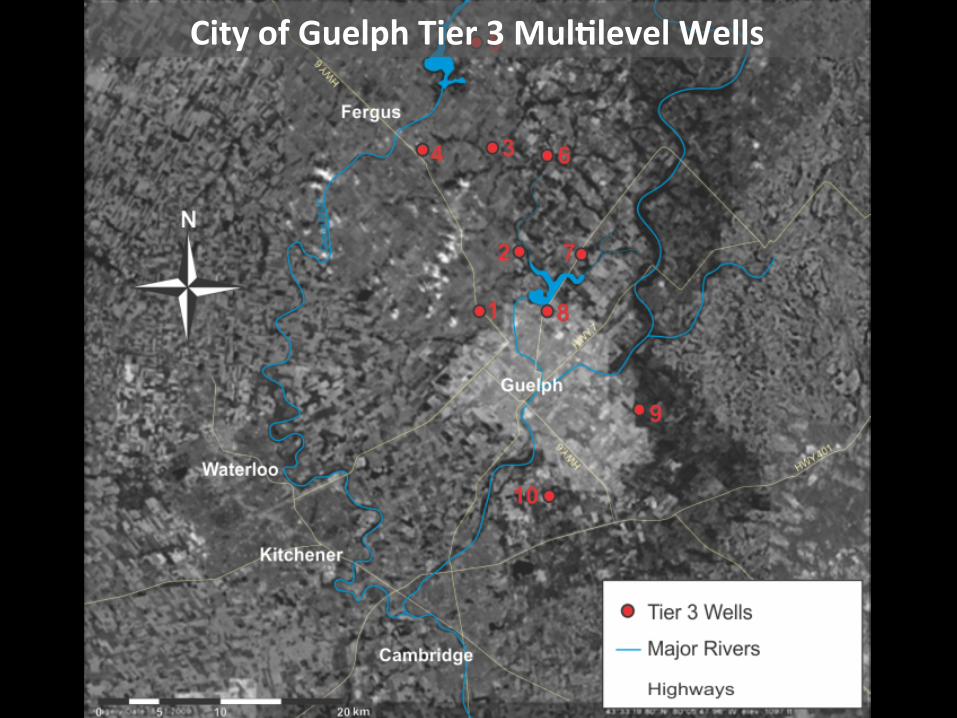
City of Guelph Tier 3 Mul0level Wells
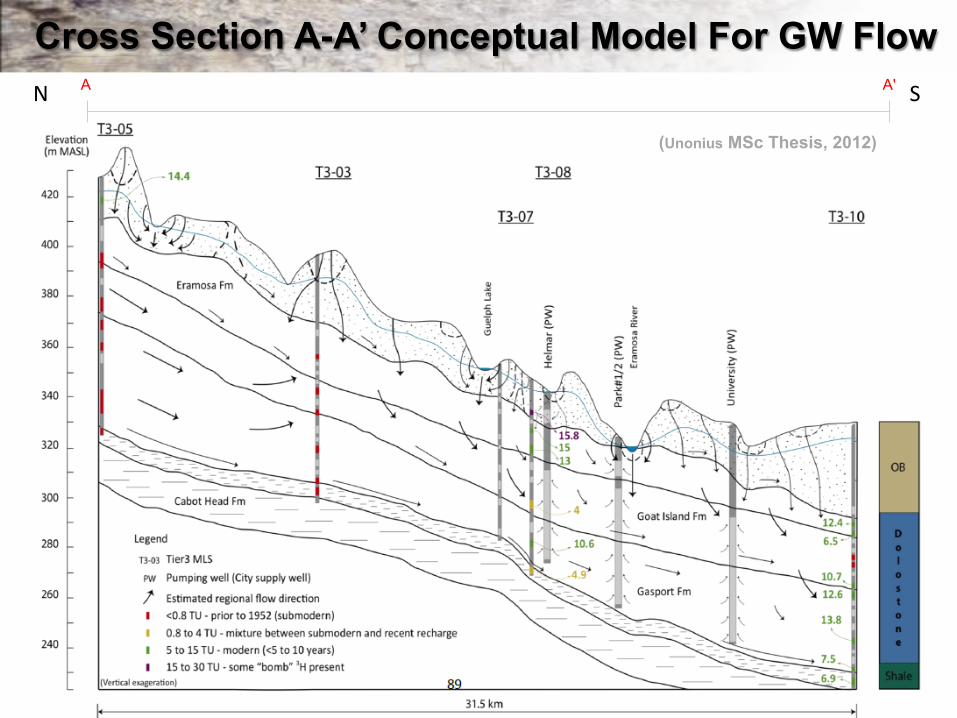
N S
33.5km
T3-
05
T3-
03
T3-
07
T3-
08
T3-
10
A A'
N S
10
0
-10
-20
-30
met
res
(Unonius MSc Thesis, 2012)
Cross Section A-A’ Conceptual Model For GW Flow
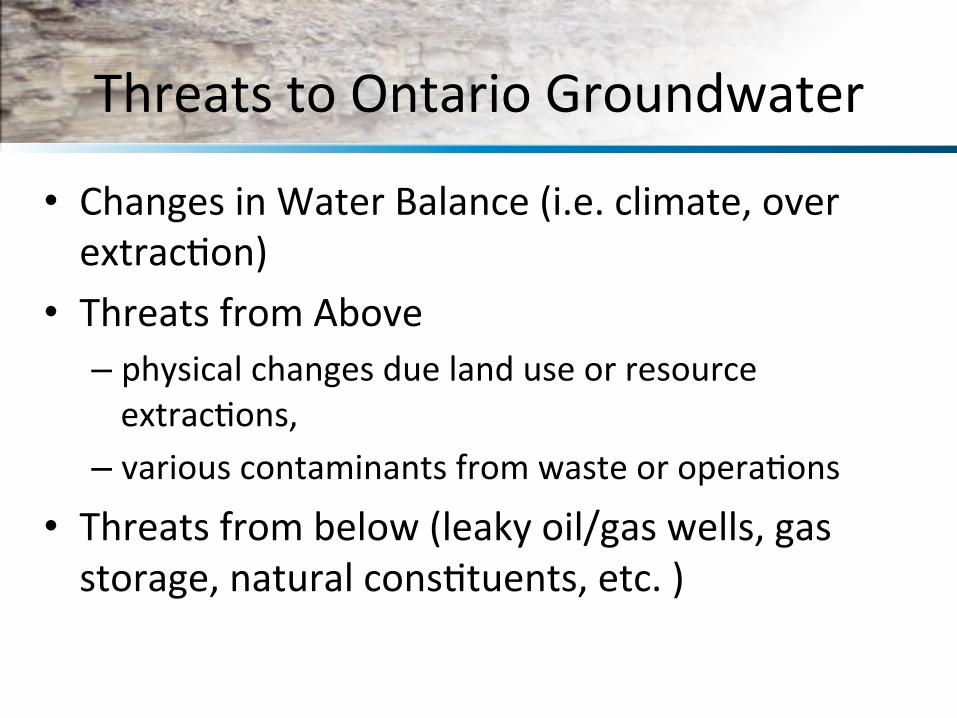
Threats to Ontario Groundwater
• Changes in Water Balance (i.e. climate, over extrac+on)
• Threats from Above – physical changes due land use or resource extrac+ons,
– various contaminants from waste or opera+ons
• Threats from below (leaky oil/gas wells, gas storage, natural cons+tuents, etc. )
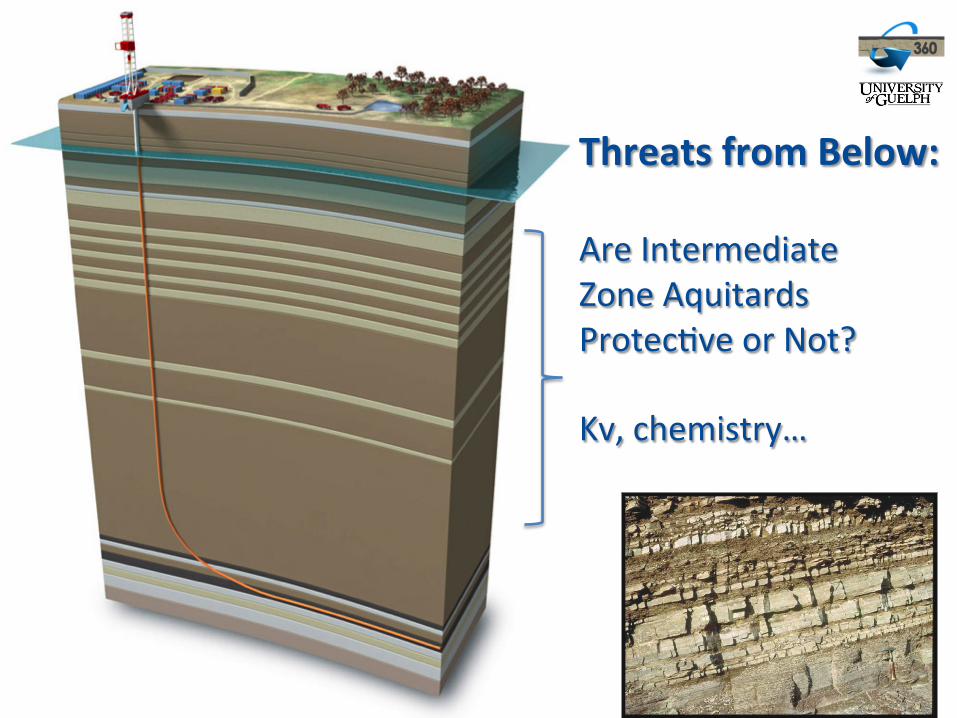
Threats from Below: Are Intermediate Zone Aquitards Protec+ve or Not? Kv, chemistry…
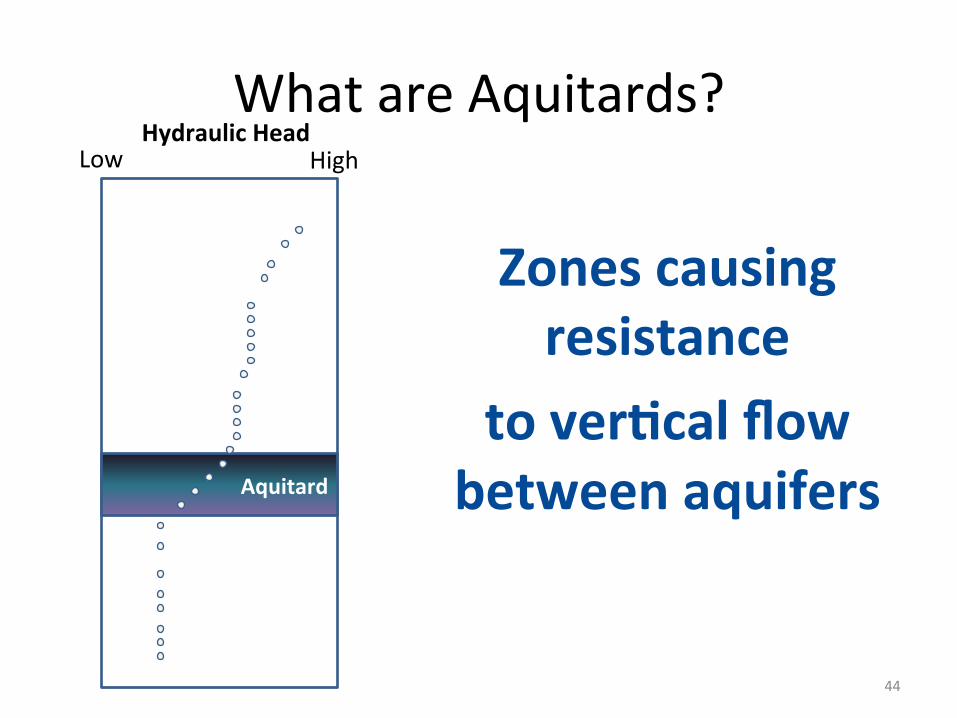
What are Aquitards?
44
Hydraulic Head High Low
Aquitard
Zones causing resistance
to ver0cal flow between aquifers
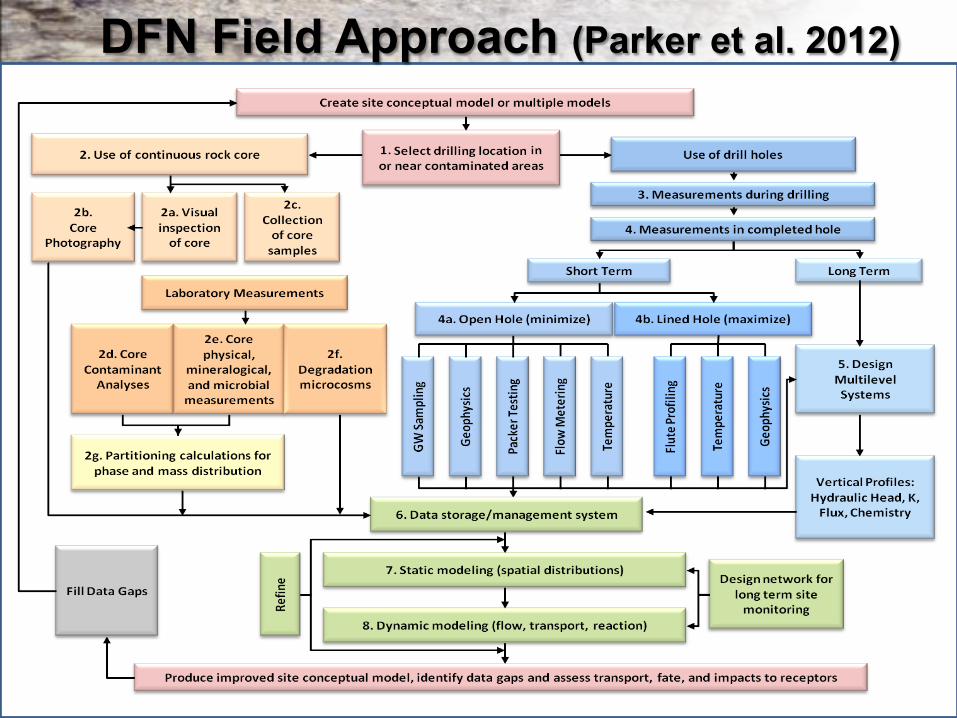
DFN Field Approach (Parker et al. 2012)
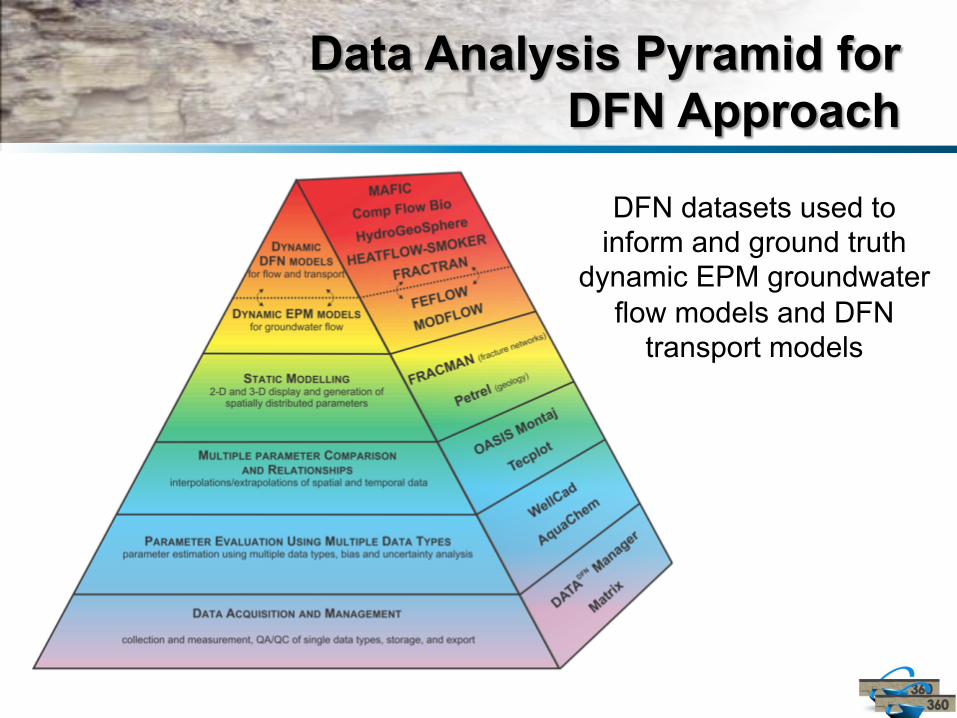
Data Analysis Pyramid for DFN Approach
DFN datasets used to inform and ground truth
dynamic EPM groundwater flow models and DFN
transport models
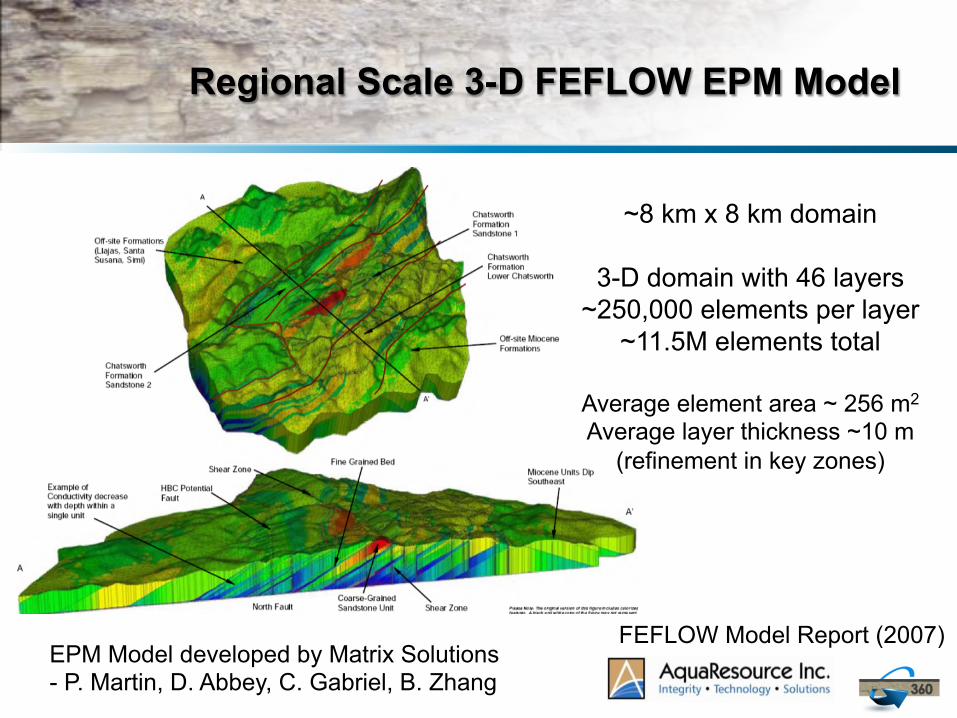
Regional Scale 3-D FEFLOW EPM Model
FEFLOW Model Report (2007)
~8 km x 8 km domain
3-D domain with 46 layers ~250,000 elements per layer
~11.5M elements total
Average element area ~ 256 m2 Average layer thickness ~10 m
(refinement in key zones)
EPM Model developed by Matrix Solutions - P. Martin, D. Abbey, C. Gabriel, B. Zhang
Thank You
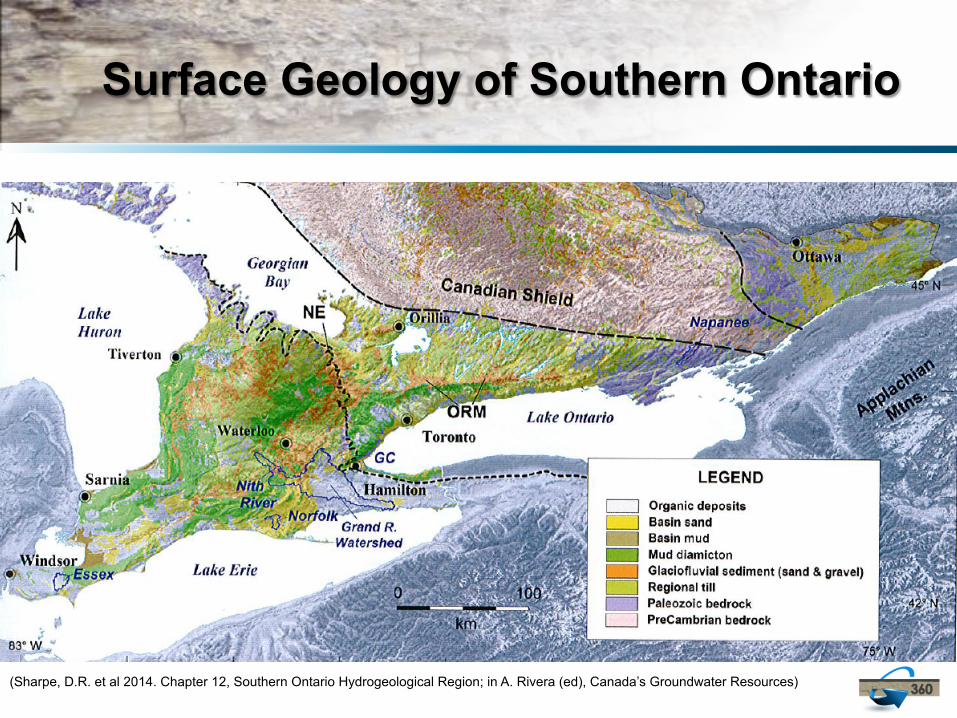
Surface Geology of Southern Ontario
(Sharpe, D.R. et al 2014. Chapter 12, Southern Ontario Hydrogeological Region; in A. Rivera (ed), Canada’s Groundwater Resources)
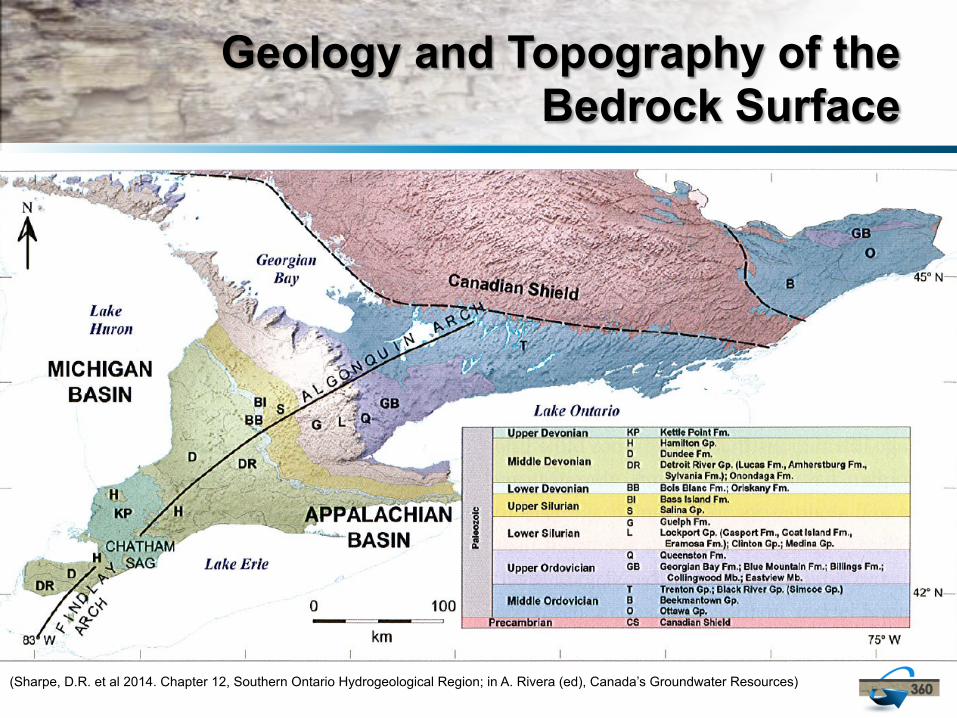
Geology and Topography of the Bedrock Surface
(Sharpe, D.R. et al 2014. Chapter 12, Southern Ontario Hydrogeological Region; in A. Rivera (ed), Canada’s Groundwater Resources)
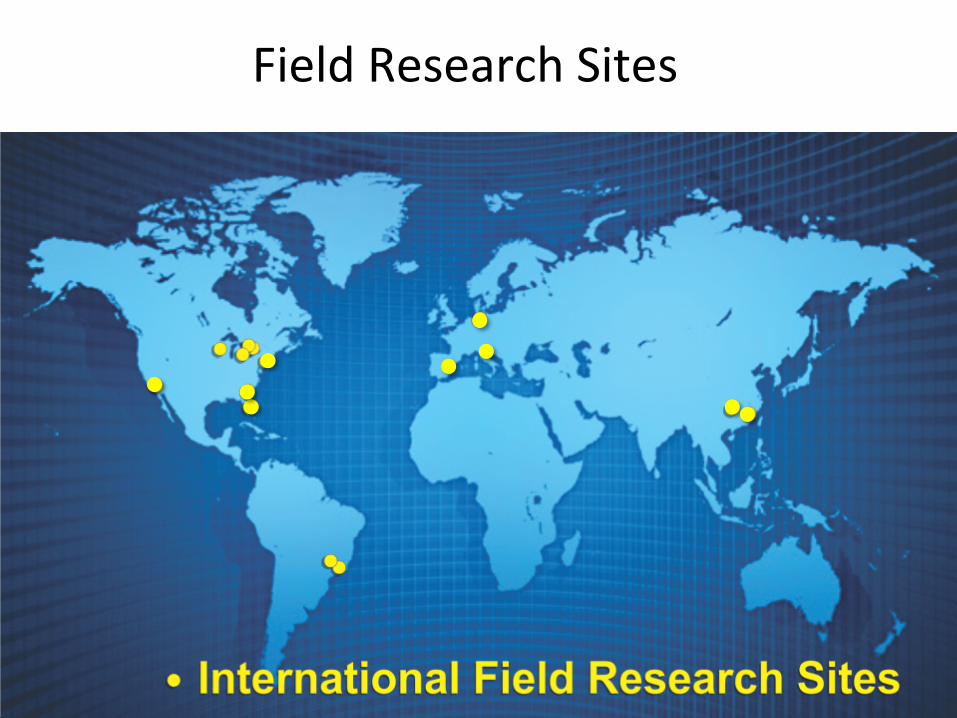
Field Research Sites
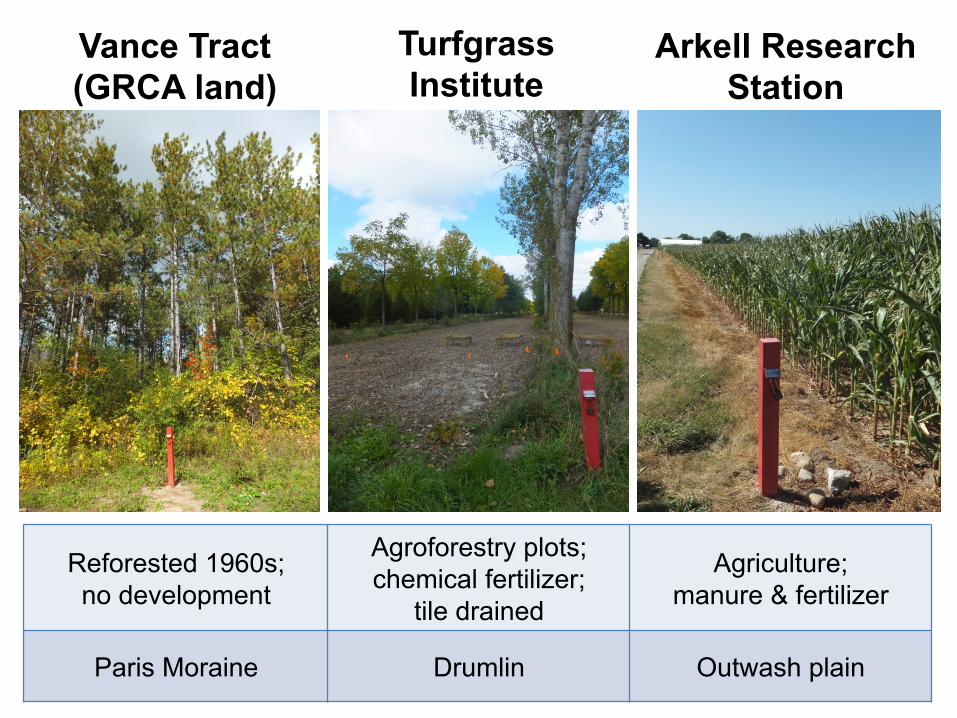
Reforested 1960s; no development
Agroforestry plots; chemical fertilizer;
tile drained
Agriculture; manure & fertilizer
Paris Moraine Drumlin Outwash plain
Arkell Research Station
Turfgrass Institute
Vance Tract (GRCA land)
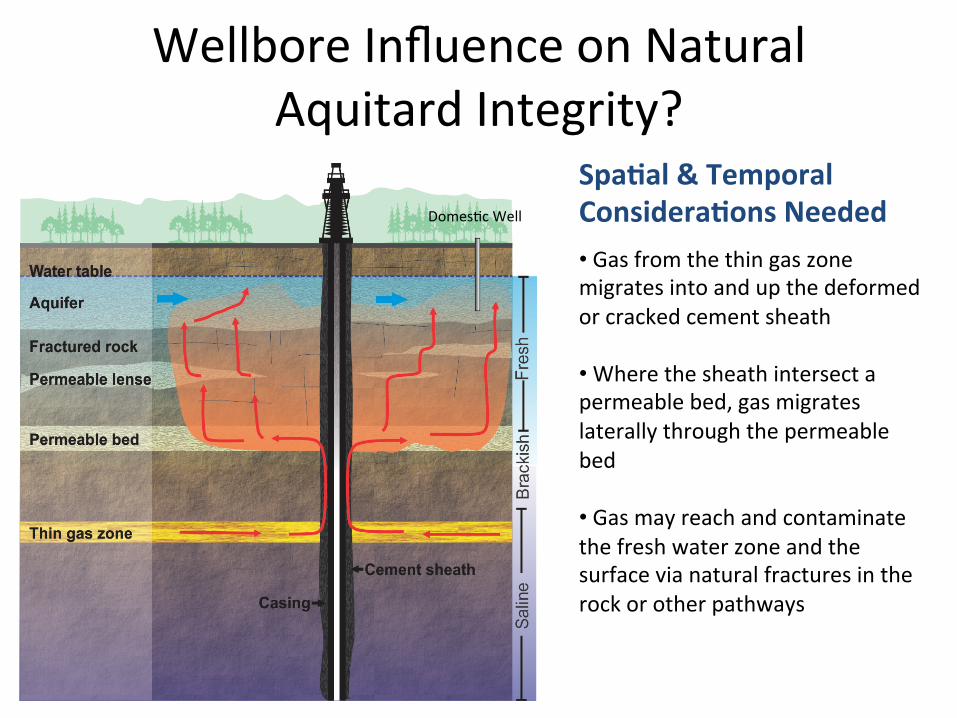
Wellbore Influence on Natural Aquitard Integrity?
• Gas from the thin gas zone migrates into and up the deformed or cracked cement sheath
• Where the sheath intersect a permeable bed, gas migrates laterally through the permeable bed
• Gas may reach and contaminate the fresh water zone and the surface via natural fractures in the rock or other pathways
Domes+c Well
Spa0al & Temporal Considera0ons Needed
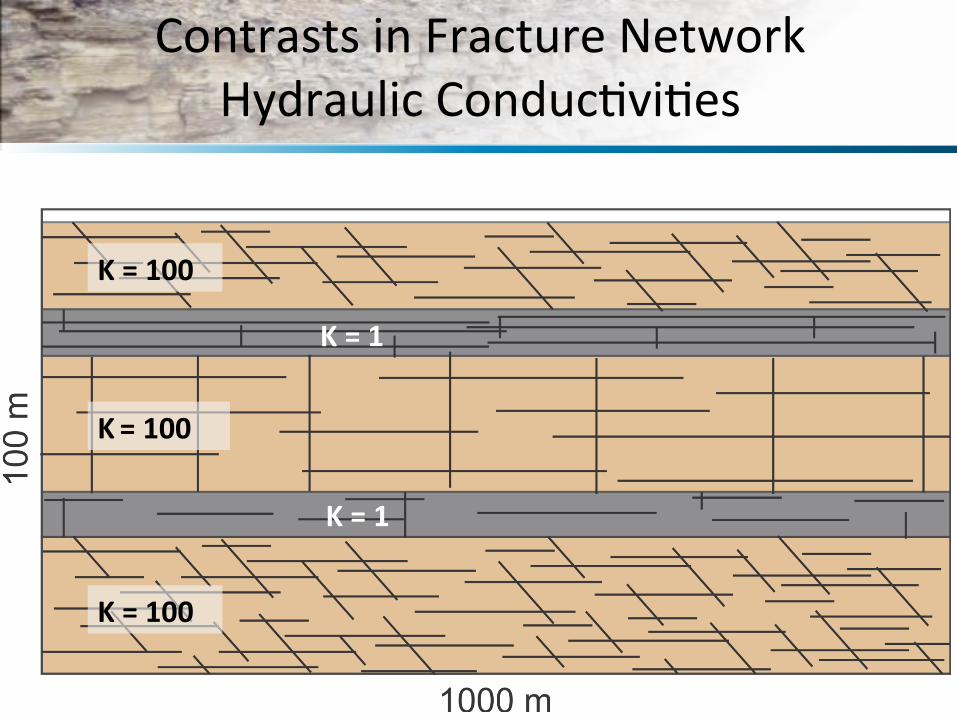
Contrasts in Fracture Network Hydraulic Conduc+vi+es
K = 1
K = 1
K = 100
K = 100
K = 100
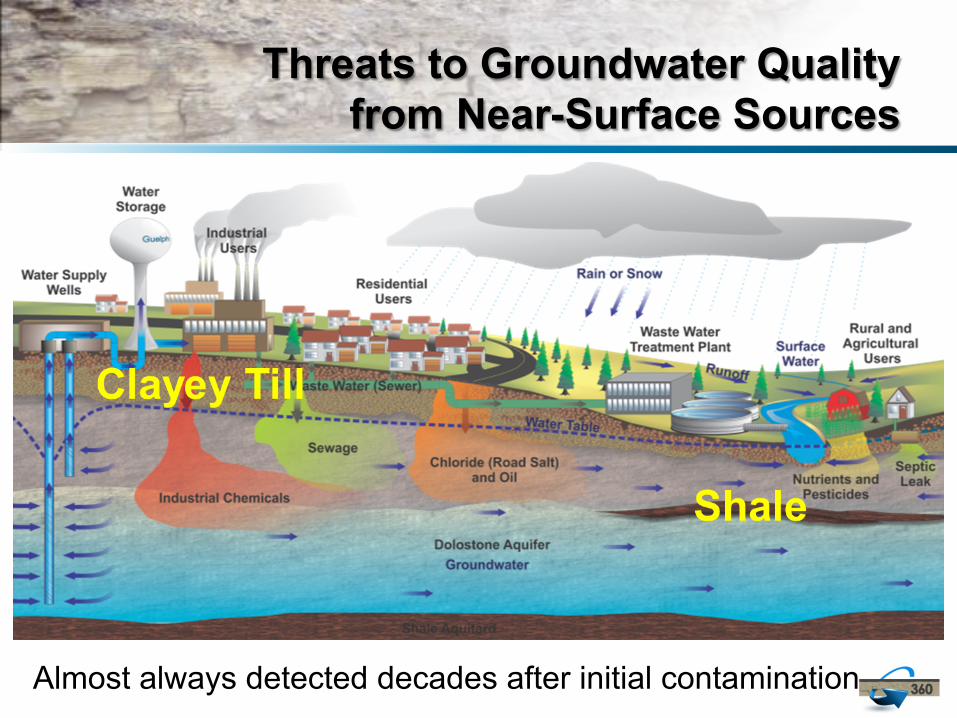
Threats to Groundwater Quality from Near-Surface Sources
Almost always detected decades after initial contamination