Embed Size (px)
Citation preview
Copyright © 2014 Pigging Products & Services Association
ADVANCEMENTS IN THE DETECTION AND SIZING OF "PINHOLE" METAL LOSS IN ONSHORE AND OFFSHORE PIPELINES
By: Martin Bluck, PII Pipeline Solutions, United Kingdom
Abstract In the last 4 years more than 800 inspections have been completed on & off-shore with the latest generation MFL ILI technology, capturing information on tens of thousands of kilometres of pipe, and generating a significant volume of dig verification data. In collaboration with Oil & Gas pipeline operators around the world this growing dig verification database has been utilized to improve software models, algorithms, & analysis processes to validate and further enhance system detection, sizing, & reporting capabilities. This paper focuses on the recent collaboration between ExxonMobil and PII, to investigate system capabilities with respect to “Pinholes”, to address a known threat to a specific pipeline in the United Kingdom. This paper will describe the: • Evolution of the “Pinhole” specification that captured the interest of ExxonMobil. • Use of Finite Element models to predict entitlement for characterization of “Pinhole” type
defects • Detail of and results from the ExxonMobil sponsored test program that was conducted in early
2013 • The in-line inspection, analysis report, and dig verification that followed for the pipeline in
question. This joint paper prepared by PII in collaboration with ExxonMobil will reflect the perspective and synergy of ILI vendor & and Pipeline Owner/Operator. Introduction An EGIG
1 report from December 2011
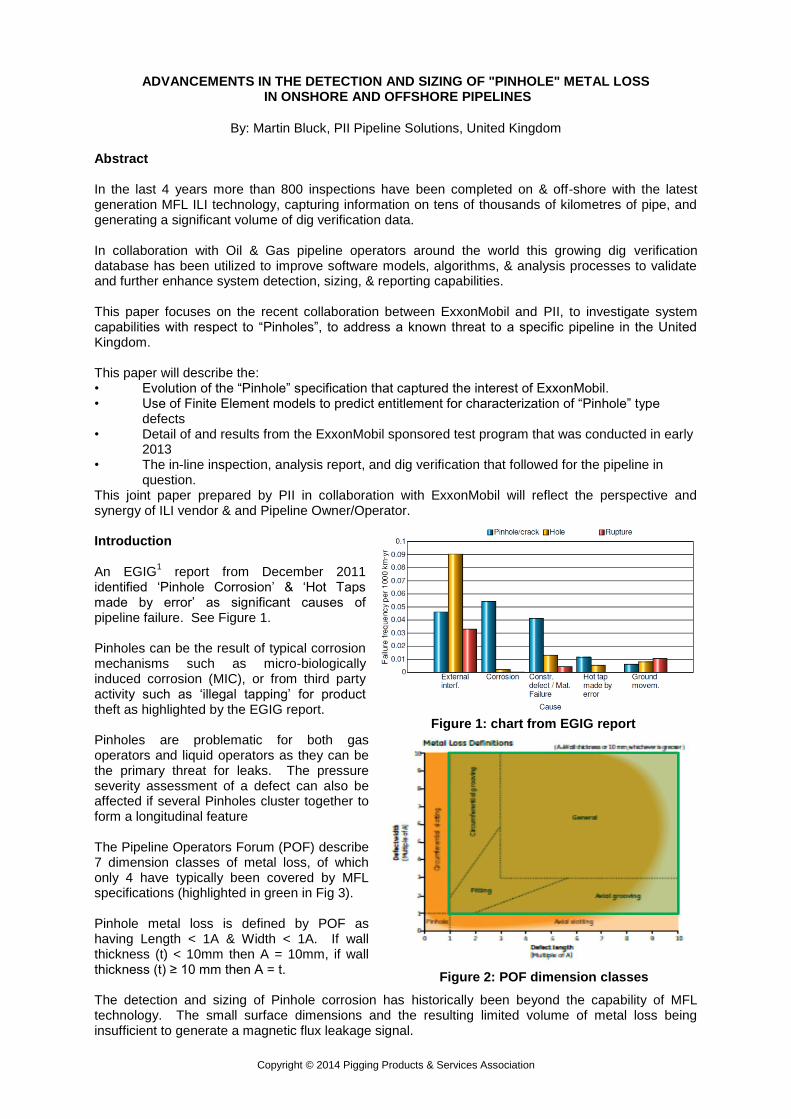
identified „Pinhole Corrosion‟ & „Hot Taps made by error‟ as significant causes of pipeline failure. See Figure 1. Pinholes can be the result of typical corrosion mechanisms such as micro-biologically induced corrosion (MIC), or from third party activity such as „illegal tapping‟ for product theft as highlighted by the EGIG report. Pinholes are problematic for both gas operators and liquid operators as they can be the primary threat for leaks. The pressure severity assessment of a defect can also be affected if several Pinholes cluster together to form a longitudinal feature The Pipeline Operators Forum (POF) describe 7 dimension classes of metal loss, of which only 4 have typically been covered by MFL specifications (highlighted in green in Fig 3). Pinhole metal loss is defined by POF as having Length < 1A & Width < 1A. If wall thickness (t) < 10mm then A = 10mm, if wall thickness (t) ≥ 10 mm then A = t. The detection and sizing of Pinhole corrosion has historically been beyond the capability of MFL technology. The small surface dimensions and the resulting limited volume of metal loss being insufficient to generate a magnetic flux leakage signal.
Figure 2: POF dimension classes
Figure 1: chart from EGIG report
Seminar 2014
10-2
However, in the last 5 years more than 900 on-shore & off-shore pipelines have been inspected with the latest generation MFL ILI technology – MagneScan
TM (MFL4), capturing information on
more than 40,000 kilometres of pipe, and generating a significant volume of dig verification (DV) data. This DV data has validated sizing models & specifications developed from thousands of signals generated by repeatedly pulling the MFL system through multiple line builds with a vast array of defects in a range of wall thicknesses. Ongoing validation & enhancement of specifications is continued in-field through Dig Verification data fed back for continuous performance improvement. A novel if not unique approach adopted from the earliest digs was to categorize each feature into one of the 7 POF dimension classes for more focused feed-back as can be seen in this unity plot (Figure 3) Initially the focus of attention was validating and enhancing models for general metal loss, pits, axial & circumferential grooves. However, the capability of the system and models to also detect and size pinholes
3 and axial & circumferential slots was soon evident.
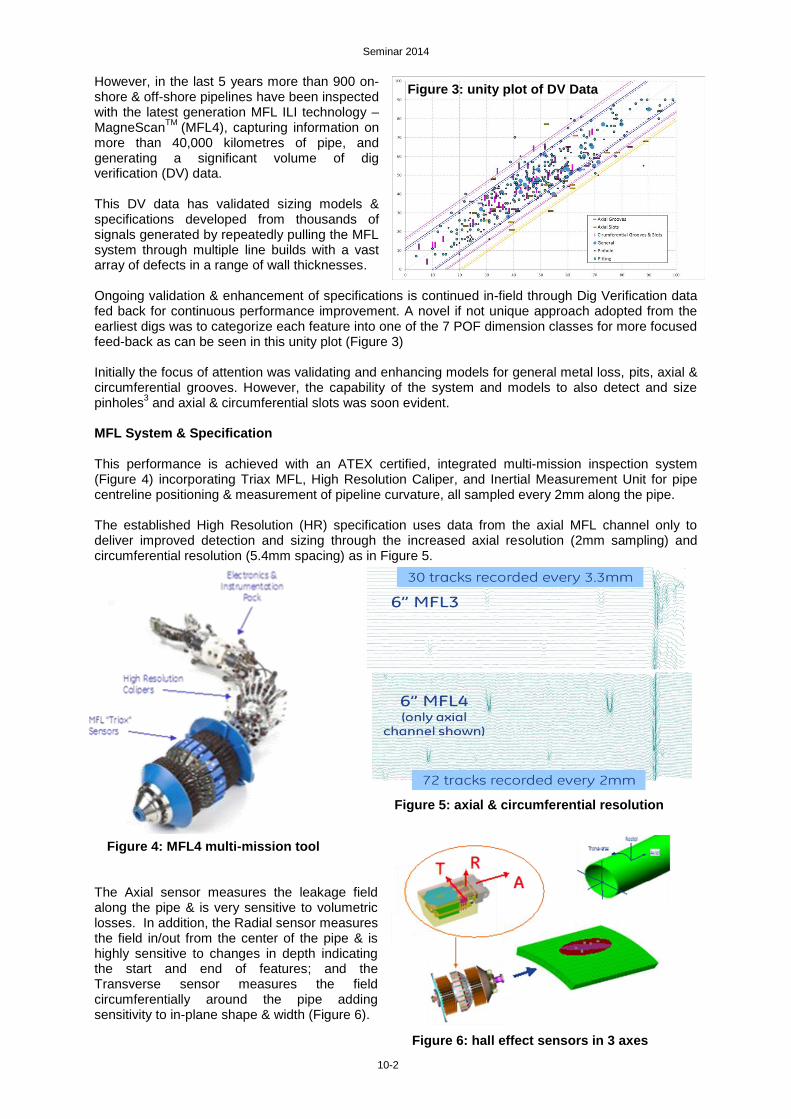
MFL System & Specification This performance is achieved with an ATEX certified, integrated multi-mission inspection system (Figure 4) incorporating Triax MFL, High Resolution Caliper, and Inertial Measurement Unit for pipe centreline positioning & measurement of pipeline curvature, all sampled every 2mm along the pipe. The established High Resolution (HR) specification uses data from the axial MFL channel only to deliver improved detection and sizing through the increased axial resolution (2mm sampling) and circumferential resolution (5.4mm spacing) as in Figure 5.
The Axial sensor measures the leakage field along the pipe & is very sensitive to volumetric losses. In addition, the Radial sensor measures the field in/out from the center of the pipe & is highly sensitive to changes in depth indicating the start and end of features; and the Transverse sensor measures the field circumferentially around the pipe adding sensitivity to in-plane shape & width (Figure 6).
Figure 3: unity plot of DV Data
Figure 4: MFL4 multi-mission tool
Figure 5: axial & circumferential resolution
Figure 6: hall effect sensors in 3 axes
Seminar 2014
10-3
PII develop detection & sizing specifications from many thousands of signals generated by repeatedly pulling the MFL system at speeds from 0.1 to 5 m/s through line builds of pipe of varying wall thicknesses in which a broad range of defects had been manufactured.
The signals from all 3 sensors are used in the Super High Resolution (SHR) specification models for improved discrimination & classification of all features. There is a significant improvement in sizing of axial & pinhole features with improved width measurement reducing the tendency to under-call. The tendency to oversize deep circumferential features is reduced through improved length measurement. There is only marginal improvement in sizing of General Metal Loss or Pits unless they are axially aligned or within an area of complex interacting corrosion. So SHR Analysis is more accurate (narrower distribution) & more precise (centered distribution) for certain defect types but not all (Figure 7)
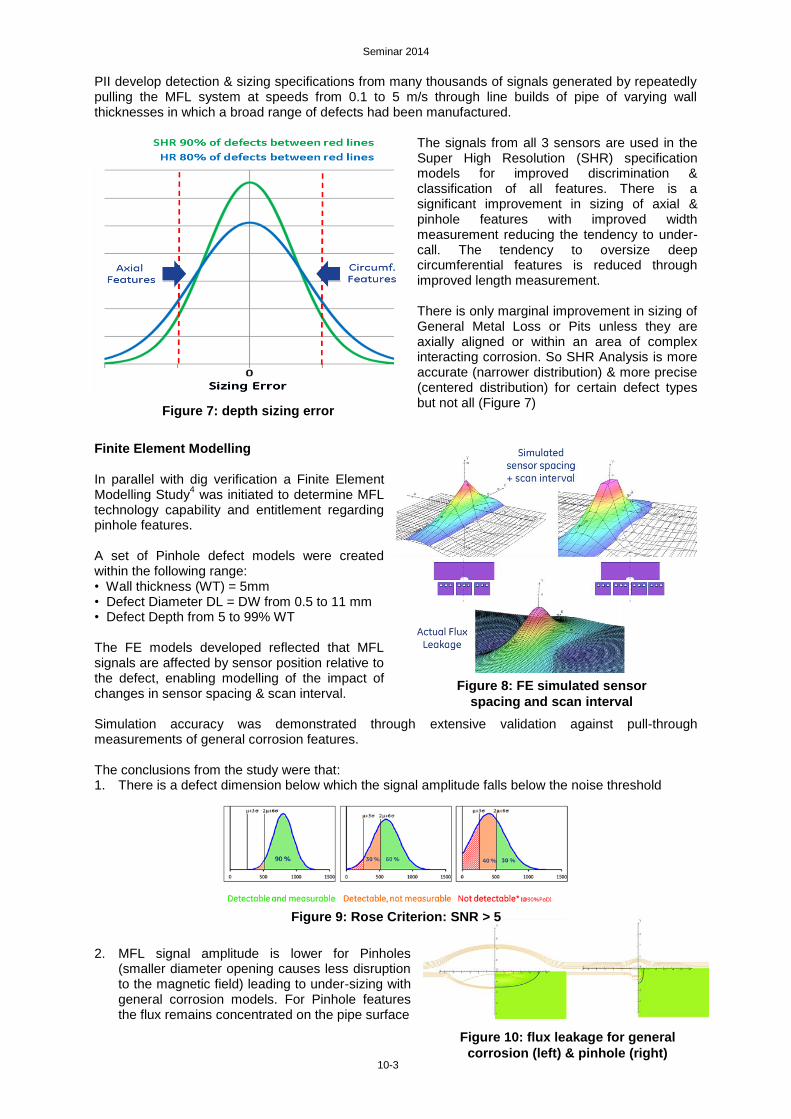
Finite Element Modelling In parallel with dig verification a Finite Element Modelling Study
4 was initiated to determine MFL
technology capability and entitlement regarding pinhole features. A set of Pinhole defect models were created within the following range: • Wall thickness (WT) = 5mm • Defect Diameter DL = DW from 0.5 to 11 mm • Defect Depth from 5 to 99% WT The FE models developed reflected that MFL signals are affected by sensor position relative to the defect, enabling modelling of the impact of changes in sensor spacing & scan interval. Simulation accuracy was demonstrated through extensive validation against pull-through measurements of general corrosion features. The conclusions from the study were that: 1. There is a defect dimension below which the signal amplitude falls below the noise threshold
2. MFL signal amplitude is lower for Pinholes (smaller diameter opening causes less disruption to the magnetic field) leading to under-sizing with general corrosion models. For Pinhole features the flux remains concentrated on the pipe surface
Figure 7: depth sizing error
Figure 8: FE simulated sensor
spacing and scan interval
Figure 9: Rose Criterion: SNR > 5
Figure 10: flux leakage for general
corrosion (left) & pinhole (right)
Seminar 2014
10-4
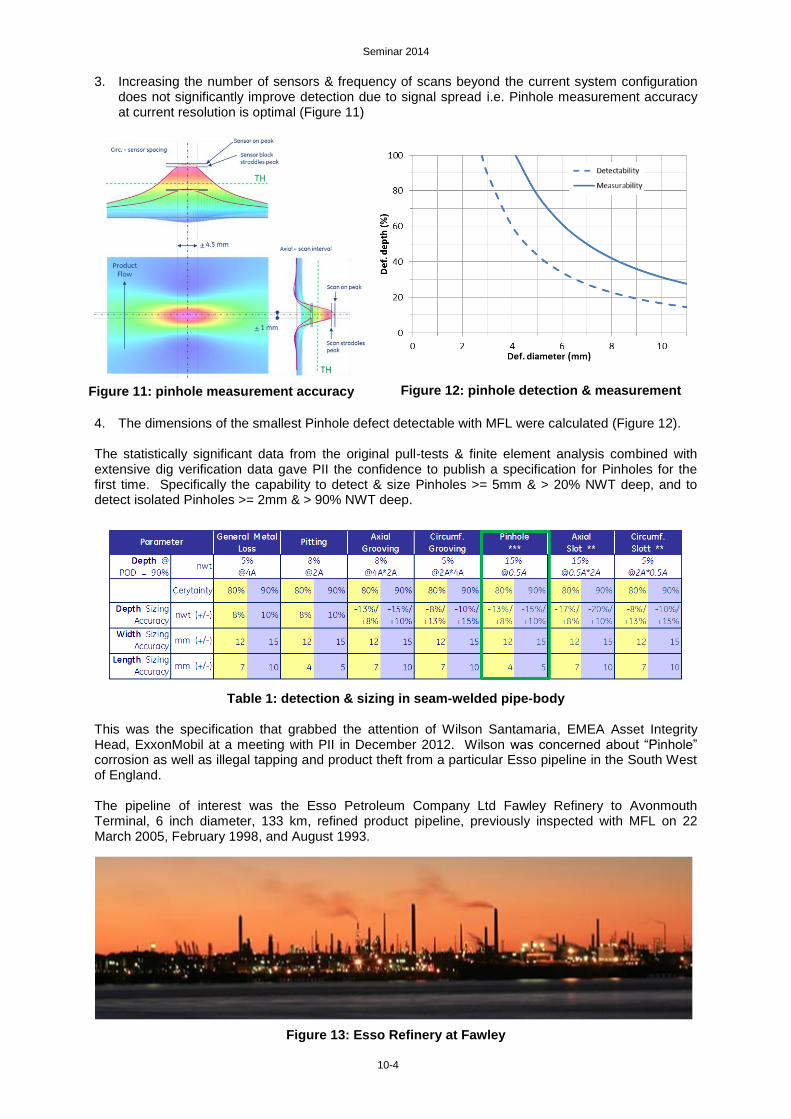
3. Increasing the number of sensors & frequency of scans beyond the current system configuration does not significantly improve detection due to signal spread i.e. Pinhole measurement accuracy at current resolution is optimal (Figure 11)
4. The dimensions of the smallest Pinhole defect detectable with MFL were calculated (Figure 12). The statistically significant data from the original pull-tests & finite element analysis combined with extensive dig verification data gave PII the confidence to publish a specification for Pinholes for the first time. Specifically the capability to detect & size Pinholes >= 5mm & > 20% NWT deep, and to detect isolated Pinholes >= 2mm & > 90% NWT deep.
Table 1: detection & sizing in seam-welded pipe-body This was the specification that grabbed the attention of Wilson Santamaria, EMEA Asset Integrity Head, ExxonMobil at a meeting with PII in December 2012. Wilson was concerned about “Pinhole” corrosion as well as illegal tapping and product theft from a particular Esso pipeline in the South West of England. The pipeline of interest was the Esso Petroleum Company Ltd Fawley Refinery to Avonmouth Terminal, 6 inch diameter, 133 km, refined product pipeline, previously inspected with MFL on 22 March 2005, February 1998, and August 1993.
Figure 13: Esso Refinery at Fawley
Figure 12: pinhole detection & measurement Figure 11: pinhole measurement accuracy

Seminar 2014
10-5
ExxonMobil Pinhole Test Program Esso initiated a Pinhole study with PII to confirm the capability of 6” MagneScan (MFL4) to detect and size Pinhole defects and to provide possible solutions for improvements in analysis and reporting of these features for a proposed re-inspection of the Avonmouth pipeline later in 2013. Pull through tests were carried out on the 7th January 2013 through a 5.6mm wall thickness Esso test spool machined with Pinhole defects. The number of defects and their actual dimensions were unknown to PII at the initial stage of the Pinhole study (blind test). There were 12 runs completed (including 1 conditioning run) with speeds ranging from 0.5m/s to 4.5m/s. PII analyzed the pull through data and released listings to Esso on the deepest ILI defect prediction for each defect detected by the MFL system on the 25th January. Details of the machined defects were released to PII on 28th January which enabled GE PII to assess the 6” MFL detection capabilities, evaluate sizing performance, & demonstrate repeatability. ExxonMobil Pinhole Test Program Results The test spool provided was 10m in length, the first 6m section was machined with 57 external defects (41 drill holes & 16 conical) and the remaining 4m section machined with 20 internal defects (20 conical). There was a 0.23m length external casing fitted around the external spool section at approx. 0.124m from the start. Defects ranged from 1mm to 10 mm in diameter, and from 25% to 100% (through wall) depth. The signals captured from the section with external defects by the MFL system from a single run can be seen in Figure 14 on the following page.
Figure 14: ‘Boxes’ and Esso reference #s Figure 15: Pinhole detection plot In summary, 94% of all features (72/77) were detected across all runs; 100% of in-spec features (64/64) were detected on all runs; 7 non-spec defects were detected across all runs; 1 non-spec feature (#41) was detected on 3 out of 11 runs; 5 extreme non-spec defects were not detected. What can be seen is that all defects > 3.0mm in diameter where detected on every run, and similarly all defects >= 2.0mm diameter and >= 50% NWT metal loss (Figure 15). PII reported the deepest depth & range for all detected defects from the 11 pull through runs in the blind test. The sizing performance was assessed when PII received the actual defect depths of the machined defects. The depth sizing accuracy achieved the contractual specification for the 44 in-spec defects (>=5mm diameter). A defect under the metal casing was under sized, as expected, due to the magnetic field levels being significantly affected in the area (reasonable-endeavors sizing). Table 2: pinhole sizing performance
Seminar 2014
10-6
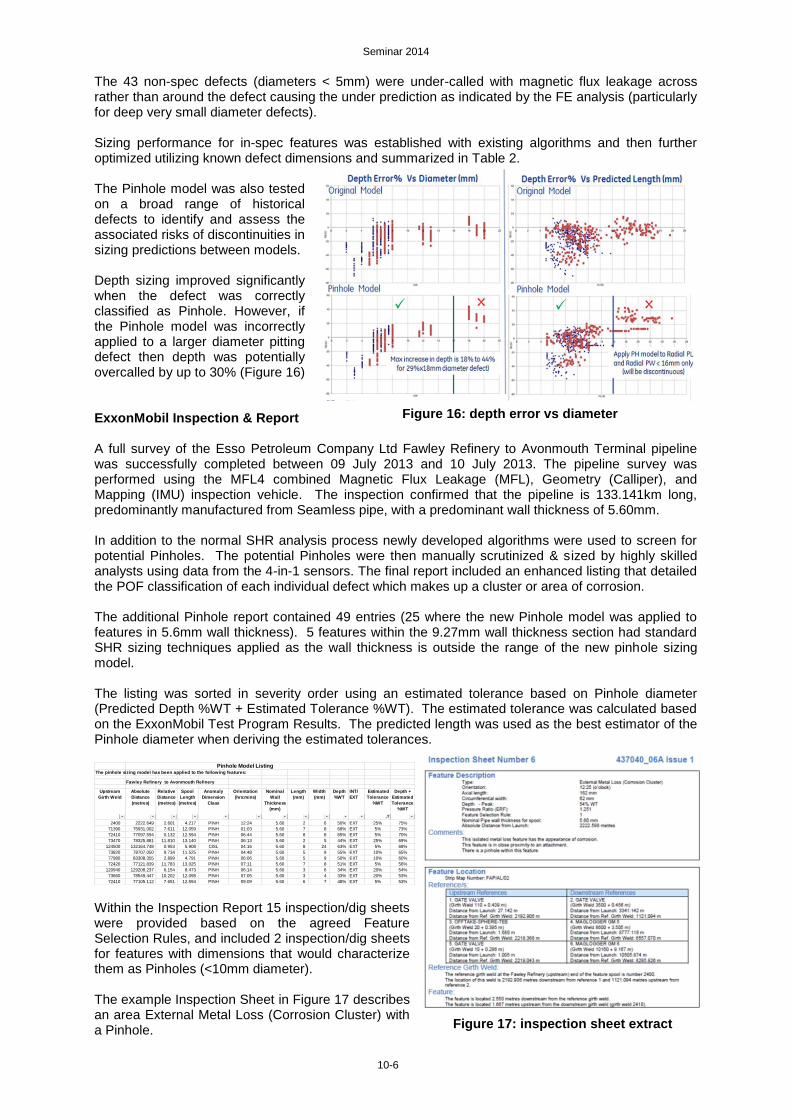
The 43 non-spec defects (diameters < 5mm) were under-called with magnetic flux leakage across rather than around the defect causing the under prediction as indicated by the FE analysis (particularly for deep very small diameter defects). Sizing performance for in-spec features was established with existing algorithms and then further optimized utilizing known defect dimensions and summarized in Table 2. The Pinhole model was also tested on a broad range of historical defects to identify and assess the associated risks of discontinuities in sizing predictions between models. Depth sizing improved significantly when the defect was correctly classified as Pinhole. However, if the Pinhole model was incorrectly applied to a larger diameter pitting defect then depth was potentially overcalled by up to 30% (Figure 16) ExxonMobil Inspection & Report A full survey of the Esso Petroleum Company Ltd Fawley Refinery to Avonmouth Terminal pipeline was successfully completed between 09 July 2013 and 10 July 2013. The pipeline survey was performed using the MFL4 combined Magnetic Flux Leakage (MFL), Geometry (Calliper), and Mapping (IMU) inspection vehicle. The inspection confirmed that the pipeline is 133.141km long, predominantly manufactured from Seamless pipe, with a predominant wall thickness of 5.60mm. In addition to the normal SHR analysis process newly developed algorithms were used to screen for potential Pinholes. The potential Pinholes were then manually scrutinized & sized by highly skilled analysts using data from the 4-in-1 sensors. The final report included an enhanced listing that detailed the POF classification of each individual defect which makes up a cluster or area of corrosion. The additional Pinhole report contained 49 entries (25 where the new Pinhole model was applied to features in 5.6mm wall thickness). 5 features within the 9.27mm wall thickness section had standard SHR sizing techniques applied as the wall thickness is outside the range of the new pinhole sizing model. The listing was sorted in severity order using an estimated tolerance based on Pinhole diameter (Predicted Depth %WT + Estimated Tolerance %WT). The estimated tolerance was calculated based on the ExxonMobil Test Program Results. The predicted length was used as the best estimator of the Pinhole diameter when deriving the estimated tolerances.
Pinhole Model ListingThe pinhole sizing model has been applied to the following features:
Fawley Refinery to Avonmouth Refinery
Upstream
Girth Weld
Absolute
Distance
(metres)
Relative
Distance
(metres)
Spool
Length
(metres)
Anomaly
Dimension
Class
Orientation
(hrs:mins)
Nominal
Wall
Thickness
(mm)
Length
(mm)
Width
(mm)
Depth
%WT
INT/
EXT
Estimated
Tolerance
%WT
Depth +
Estimated
Tolerance
%WT
2400 2222.649 2.601 4.217 PINH 12:24 5.60 2 6 50% EXT 25% 75%
71390 75931.002 7.611 12.059 PINH 01:03 5.60 7 8 68% EXT 5% 73%
72410 77097.594 0.132 12.594 PINH 06:44 5.60 8 8 65% EXT 5% 70%
73470 78325.881 11.810 13.140 PINH 06:13 5.60 2 5 44% EXT 25% 69%
124500 132164.748 0.953 5.908 CISL 04:16 5.60 8 24 63% EXT 5% 68%
73820 78707.050 9.734 11.525 PINH 04:48 5.60 5 9 55% EXT 10% 65%
77980 83308.355 2.899 4.791 PINH 06:06 5.60 5 9 50% EXT 10% 60%
72420 77121.839 11.783 13.025 PINH 07:11 5.60 7 8 51% EXT 5% 56%
120940 129208.237 6.154 8.473 PINH 06:14 5.60 3 6 34% EXT 20% 54%
73660 78549.447 10.202 12.098 PINH 07:05 5.60 3 4 33% EXT 20% 53%
72410 77105.112 7.651 12.594 PINH 09:09 5.60 6 7 48% EXT 5% 53%
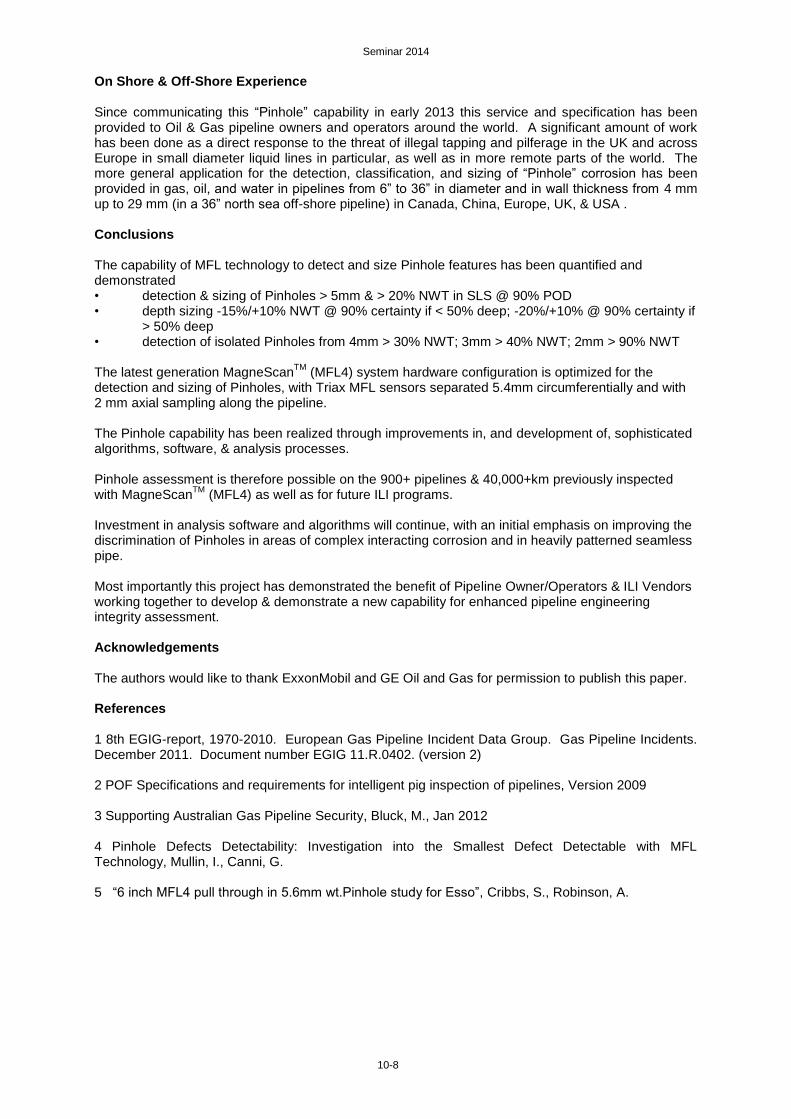
Within the Inspection Report 15 inspection/dig sheets were provided based on the agreed Feature Selection Rules, and included 2 inspection/dig sheets for features with dimensions that would characterize them as Pinholes (<10mm diameter). The example Inspection Sheet in Figure 17 describes an area External Metal Loss (Corrosion Cluster) with a Pinhole.
Figure 17: inspection sheet extract
Figure 16: depth error vs diameter

Seminar 2014
10-7
ExxonMobil Dig Verification An extensive program of digs was initiated by Exxon Mobil in January 2014, supported in field by PII‟s own Dig Verification/NDT expert following industry best practice. Features being investigated included anomalies classified as Pinholes by PII as well as other significant features. At the time of writing this paper NDT data was available for 13 features from 7 dig sites. The detection performance is presented in Figure 18. Of the 13 features found, 11 were detected. The 2 Pinhole features not detected were below the predicted detection threshold. 3 features on the detection threshold created a signal but were not automatically „boxed‟ by the analysis software.
Figure 18: Detected Vs Excavated Figure 19: Predicted Depth Vs Excavated All features detected were sized within predicted depth sizing tolerances including 3 features in > 10 mm wall thickness pipe which is beyond the published wall thickness limit for the system in 6” diameter pipe. The ILI Predicted Depth Vs Excavated Depth for the 13 features is plotted in Figure 19 with the depth sizing tolerance bands within which > 90% of features should fit. As can be seen all detected features were sized within the tolerance bands. The graphical plots over simplify the complexity of the features and the detection & sizing challenge. Only 5 of the 13 features would be considered to be isolated Pinholes or Pits. 6 of the features classified as Pinholes were in areas of complex interacting corrosion, and 1 the result of an arc strike. For example, examination of the feature highlighted in the Inspection Sheet (Fig 17) revealed an area of external general interacting corrosion with Pitting and Pinhole components. The corrosion feature had a peak depth of 53% of the wall thickness, and when clustered was 202mm long and 144mm wide overall. The deepest point was within a Pinhole component that was 53% peak depth and was 4mm long and 5mm wide. In Figure 20 you can see the trace plot from the axial MFL sensors and a photograph of the exposed pipe in the general area of the reported location, highlighted with white background paint. 3 features that were detected by the system and not automatically „boxed‟ by the software were Pinholes within larger Pinholes or Pits. In these cases the signal from the heavy patterning of the seamless pipe was the same order of magnitude as the signal produced from the Pinholes.
Figure 20: ILI & Dig Verifications Data
Seminar 2014
10-8
On Shore & Off-Shore Experience Since communicating this “Pinhole” capability in early 2013 this service and specification has been provided to Oil & Gas pipeline owners and operators around the world. A significant amount of work has been done as a direct response to the threat of illegal tapping and pilferage in the UK and across Europe in small diameter liquid lines in particular, as well as in more remote parts of the world. The more general application for the detection, classification, and sizing of “Pinhole” corrosion has been provided in gas, oil, and water in pipelines from 6” to 36” in diameter and in wall thickness from 4 mm up to 29 mm (in a 36” north sea off-shore pipeline) in Canada, China, Europe, UK, & USA . Conclusions The capability of MFL technology to detect and size Pinhole features has been quantified and demonstrated • detection & sizing of Pinholes > 5mm & > 20% NWT in SLS @ 90% POD • depth sizing -15%/+10% NWT @ 90% certainty if < 50% deep; -20%/+10% @ 90% certainty if
> 50% deep • detection of isolated Pinholes from 4mm > 30% NWT; 3mm > 40% NWT; 2mm > 90% NWT The latest generation MagneScan
TM (MFL4) system hardware configuration is optimized for the
detection and sizing of Pinholes, with Triax MFL sensors separated 5.4mm circumferentially and with 2 mm axial sampling along the pipeline. The Pinhole capability has been realized through improvements in, and development of, sophisticated algorithms, software, & analysis processes. Pinhole assessment is therefore possible on the 900+ pipelines & 40,000+km previously inspected with MagneScan
TM (MFL4) as well as for future ILI programs.
Investment in analysis software and algorithms will continue, with an initial emphasis on improving the discrimination of Pinholes in areas of complex interacting corrosion and in heavily patterned seamless pipe. Most importantly this project has demonstrated the benefit of Pipeline Owner/Operators & ILI Vendors working together to develop & demonstrate a new capability for enhanced pipeline engineering integrity assessment. Acknowledgements The authors would like to thank ExxonMobil and GE Oil and Gas for permission to publish this paper. References 1 8th EGIG-report, 1970-2010. European Gas Pipeline Incident Data Group. Gas Pipeline Incidents. December 2011. Document number EGIG 11.R.0402. (version 2) 2 POF Specifications and requirements for intelligent pig inspection of pipelines, Version 2009 3 Supporting Australian Gas Pipeline Security, Bluck, M., Jan 2012 4 Pinhole Defects Detectability: Investigation into the Smallest Defect Detectable with MFL Technology, Mullin, I., Canni, G. 5 “6 inch MFL4 pull through in 5.6mm wt.Pinhole study for Esso”, Cribbs, S., Robinson, A.