Embed Size (px)
Citation preview

Advanced Polymer Nanocomposites with Tailored Morphologies for High Voltage Insulating Systems
by
Emna HELAL
MANUSCRIPT-BASED THESIS PRESENTED TO ÉCOLE DE TECHNOLOGIE SUPÉRIEURE IN PARTIAL FULFILLMENT OF THE REQUIREMENTS FOR THE DEGREE OF DOCTOR OF PHILOSOPHY
Ph.D.
MONTREAL, JULY 11, 2017
ÉCOLE DE TECHNOLOGIE SUPÉRIEURE UNIVERSITÉ DU QUÉBEC
Emna HELAL, 2017

This Creative Commons licence allows readers to download this work and share it with others as long as the
author is credited. The content of this work can’t be modified in any way or used commercially.

BOARD OF EXAMINERS
THIS THESIS HAS BEEN EVALUATED
BY THE FOLLOWING BOARD OF EXAMINERS Professor Nicole Raymonde DEMARQUETTE, Thesis Supervisor Department of Mechanical Engineering at École de Technologie Supérieure Professor Éric DAVID, Thesis Co-supervisor Department of Mechanical Engineering at École de Technologie Supérieure Professor Michel FRÉCHETTE, Thesis Co-supervisor Department of Materials Science at Hydro-Québec’s Research Institute Professor Sylvain CLOUTIER, President of the Board of Examiners Department of Electrical Engineering at École de Technologie Supérieure Professor Ricardo ZEDNIK, Member of Jury Department of Mechanical Engineering at École de Technologie Supérieure Professor Musa KAMAL, Independent External Evaluator Department of Chemical Engineering at McGill University, Canada Professor Jérôme CASTELLON, External Evaluator Institut d’Électronique et des Systèmes, Université de Montpellier, France
THIS THESIS WAS PRENSENTED AND DEFENDED
IN THE PRESENCE OF A BOARD OF EXAMINERS AND PUBLIC
ON JUNE 02, 2017
AT ÉCOLE DE TECHNOLOGIE SUPÉRIEURE


DEDICATION
To my parents, Mohamed HELAL and Jawaher SLIMAN, to whom this dissertation means as
much as it means to me.
To my husband, Mohamed ZEMZEM, who has been a constant source of support for me.
To Prof. Zoubeida OUNAIES who a few years ago gave me the opportunity to discover what
“Nano” is. The months I spent working with her team have opened my mind to research in
many different ways.


ACKNOWLEDGMENT
I would like to express my deep gratitude to the people who helped me during my PhD
project. Without your support, I wouldn’t have made it this far.
First, I would like to sincerely thank my main supervisor, Prof. Nicole R. DEMARQUETTE,
for accepting me as her PhD student and for her continuous support, guidance and trust
throughout my research and graduate study at ÉTS. Working with her has been a wonderful
and rewarding experience. I am also very much grateful to my co-supervisors Prof. Éric
DAVID and Prof. Michel FRÉCHETTE who put their efforts and expertise on this project
similarly to the main supervisor. Their assistance and support throughout the course of this
research is greatly appreciated. I would like also to thank our collaborators, Prof. Danilo J.
CARASTAN and his research group from Federal University of ABC in Brazil and Dr. Leice
G. AMURIN for providing materials and valuable insights to help me with my research.
The financial support from Hydro-Québec, NSERC and ÉTS is gratefully acknowledged.
I hope I have met the expectations.
Among people from ÉTS, I would like to thank Prof. Sylvain CLOUTIER, Prof. Martine
DUBÉ and Prof. Ricardo ZEDNIK for agreeing to evaluate this work either during exams or
defense. I am also grateful to Prof. Claudiane OUELLET-PLAMONDON and Michaël
DUBOIS from Construction Engineering Department as well as Jaime and Felipe, graduate
students of Prof. Sylvain CLOUTIER, from Electrical Engineering Department for providing
me access to some equipment. I would like also to extend my gratitude to the technicians,
Claude-Daniel, Nabil, Olivier and Radu, and all the staff working in the Mechanical
Engineering Department for their practical help whenever needed.
I would like also to thank Prof. Musa KAMAL from McGill University and Prof. Jérôme
CASTELLON from University of Montpellier in France for agreeing to evaluate this work.

VIII
From IREQ, I would like to thank Dr. Tung Tran Anh, Dr. Hugues COUDERC, Dr. Christele
VANGA BOUANGA and Dr. Meng GUO for their valuable and generous help with some of
my dielectric spectroscopy, mechanical profilometry and thermal conductivity experiments.
Thanks go also to my dear friends and colleagues (researchers, students and interns) that I
met at ÉTS or IREQ: Abdelghani, Anthony, Camille, Chloé, Carlos, Christele, Eya, Ehsan,
Foued, Fouzia, Ghalia, Hugues, Julie, Leice, Marwa, Mauricio, Meng, Mitasha, Mostafa,
Oana, Samantha, Scheyla, Sohrab, Thomas, Victor and Zahra; Thank you, merci, obrigada,
gracias, danke, xièxiè, مرسي , شكرا … for professional and nonprofessional discussions,
helpful insights, multicultural environment, good memories and every workday’s. I wish all
of you the best of luck on your future plans. Special thoughts to Carlos and Leice for the
happy moments, confidence and shared laughs that made some “heavy days” lighter (Also,
for brigadeiro, beijinhos and all the delicious Brazilian sweets!).
I am also thankful to all the persons and friends who made my stay in Montreal more
delightful and interesting: Azadeh, for always being so nice friend and available whenever I
needed an advice, Lina, Refka and Sun, for being such lovely roommates and Carmelle, for
being a very kind landlord always caring about our comfort and also for the dinners and
delicious Quebec dishes.
To my friends in Montreal, Arbi and Abir (and their cute Yassine), Foued and Randa (and
their little Youssef), Fouzia, Hend and her family, Marwa and her husband and my husband’s
friend Abdellatif, I would like to say thank you for adding the warm feeling of home to this
journey and for being a second family to me here in Montreal.
To my friends in Tunisia, especially Ghazoua and Nesrine, I want to say thank you for being
always there for me, even by distance, whenever I needed a helping hand. Your friendship
means a lot to me.
Certainly, my deepest gratitude goes to my parents, Mohamed and Jawaher, for continuous
support at different scales, for unconditional love, for their dedication to their jobs that
inspired me and for being so good teachers for life (Merci d’être mon repère!). Thank you

IX
also for supporting my dreams and ambitions and always believing in me even when my
choices were not the best. I will be always grateful to have you in my life.
I am also grateful, to my brother, Mohamed, for standing up for me and for taking good care
of our parents in my absence. Besides, I am indebted to all my extended family, especially
my uncle Mohamed Hechmi SLIMAN (I am always impressed by your “mathematical”
vision of life), his wife Zohra and their children Amani, Mejda and Mohamed, for their never
ending love, continuous support and encouragements along my studies.
Of course, I could not forget my soulmate Mohamed who became my husband during these
four years of PhD, for sharing life’s best and worst moments, for holding my hand all these
years and for absolutely everything. Your love and support are so precious to me. I am glad
to share this PhD journey with you: your turn is next!
And foremost, I am grateful to God for giving me the strength to keep going during difficult
times.

NANOCOMPOSITES DE POLYMÈRES À MORPHOLOGIES CONTRÔLÉES POUR DES APPLICATIONS D’ISOLATION HAUTE TENSION
Emna HELAL
RÉSUMÉ
Cette thèse rapporte différentes approches pour préparer des matériaux d’isolation nanostructurés qui bénéficient d’une dispersion contrôlée de nanoparticules dans l’objectif d’optimiser leurs propriétés. Ces approches se basent sur l’utilisation de matrices polymères multi-phases, telles que les copolymères à blocs et les mélanges de polymères, comme gabarit pour guider la dispersion des nanoparticules. Deux types de nanoparticules, organiquement modifiées, ont été utilisés: l’oxyde de zinc (ZnO) sous forme de sphères et l’argile Montmorillonite sous forme de plaquettes. En plus, un copolymère à blocs a été sélectionné comme gabarit, à savoir: le polystyrène-b-poly(éthylène-co-butylène)-b-polystyrène (SEBS) constitué de deux blocs de polystyrène (PS) sous forme de domaines nanométriques et d’un bloc élastomère de poly(éthylène-co-butylène) (PEB).
Des nanocomposites SEBS/argile et SEBS/ZnO ayant des morphologies variées ont été fabriqués. En particulier, l’orientation des nanodomaines du bloc PS et des plaquettes d’argile dans ces nanocomposites a été contrôlée en ayant recours à différentes méthodes de fabrication. Les morphologies obtenues varient de l’isotropie totale à l’orientation totale suivant une seule direction, en passant par des morphologies intermédiaires partiellement orientées. La distribution spatiale des deux types de nanoparticules ainsi que leurs affinités respectives aux blocs PS et PEB ont été également contrôlées par la présence ou non de groupements fonctionnels d’anhydride maléique (MA) greffés sur le bloc élastomère PEB. Les propriétés diélectriques, rhéologiques, thermiques et mécaniques de ces nanocomposites ont été caractérisées en corrélation avec leurs morphologies.
Dans les nanocomposites SEBS/argile, l’incorporation des argiles a réduit la mobilité des chaînes du bloc PEB situées à l’interface polymère/nanoparticule. Une transition vitreuse, plus élevée que celle du bloc PEB, a été attribuée à ces chaînes de la zone interfaciale. De plus, l’orientation et la localisation des argiles ont affecté la mobilité de ces chaînes et en conséquence les propriétés d’ingénierie. Plus précisément, les nanocomposites SEBS/argile ayant une morphologie partiellement alignés ont assuré la combinaison optimale de résistance diélectrique et mécanique.
Dans les nanocomposites SEBS/ZnO et en présence du MA, la dispersion des nanoparticules et leur affinité au bloc PEB ont été nettement améliorées. Par conséquence, un réseau entre les nanosphères de ZnO et les chaînes de polymère a été formé. Ce réseau a été associé à une amélioration de la conductivité thermique et une remarquable augmentation de la résistance à l’érosion de surface par décharges couronne; le volume érodé étant réduit de 90% à seulement 5 wt% de ZnO. Dans la dernière partie du projet, des nanocomposites SEBS/ZnO sélectionnés ont été mélangés avec du polyéthylène (PE) pour préparer des nanocomposites hybrides PE/SEBS/ZnO candidats pour l’isolation haute tension. La résistance à l’érosion de surface et la flexibilité mécanique des nanocomposites PE/SEBS/ZnO ont été améliorées par rapport aux nanocomposites de référence PE/ZnO. Cette augmentation a été associée à l'amélioration de la dispersion des nanoparticules de ZnO et à leur localisation sélective dans SEBS et à l’interface entre PE et SEBS.
Mots clés: isolation haute tension, nanocomposite de polymère, nanodiélectrique, dispersion contrôlée de nanoparticules, copolymère à blocs, mélange de polymères…


ADVANCED POLYMER NANOCOMPOSITES WITH TAILORED MORPHOLOGIES FOR HIGH VOLTAGE INSULATING SYSTEMS
Emna HELAL
ABSTRACT
This thesis reports different approaches to prepare a new generation of nanostructured insulating materials featuring controlled nanoparticles dispersion, using block copolymers and polymer blends as template matrices. Two types of nanoparticles, both organically modified, were used: zinc oxide (ZnO) and Montmorillonite clay. In addition, polystyrene-b-poly(ethylene-co-butylene)-b-polystyrene (SEBS) triblock copolymer, composed of two polystyrene (PS) endblocks in the form of well-ordered nanodomains and one poly(ethylene-co-butylene) (PEB) elastomer middle block, was selected as a template matrix.
SEBS/clay and SEBS/ZnO nanocomposites featuring different configurations of PS domains and clay platelets, namely: isotropic, partially oriented and oriented morphologies were achieved by varying the processing techniques. Besides, the spatial distribution of clay platelets and ZnO nanospheres and their affinities to either PS block or PEB block were tuned by the presence or not of maleic anhydride (MA) graft attached to PEB block. In particular, the dispersion of both types of nanoparticles was considerably improved in the presence of MA. Dielectric, rheological, thermal and mechanical properties of these nanocomposites were characterized in correlation with their morphologies.
In SEBS/clay nanocomposites, it was found that the incorporation of clay induced slower dynamics of PEB chains located in the interfacial region. A new interfacial glass transition (Tgi), higher than the glass transition (Tg) of bulk PEB, was attributed to these interfacial chains. Furthermore, the orientation and location of clay affected the interfacial dynamics: the highest Tgi temperatures were related to samples with lower alignment degree and preferential location of clay in PEB phase. Functional properties were also affected by the orientation. To be more specific, SEBS/clay nanocomposites with totally aligned clay platelets and PS domains were simultaneously the most efficient in improving the breakdown strength up to 45% and the less efficient in improving the mechanical strength. However, nanocomposites with partially oriented morphologies provided the best combination of dielectric breakdown strength and mechanical strength.
In SEBS/ZnO nanocomposites, the improved dispersion and affinity to PEB block, achieved in the presence of MA, induced the formation of networks between ZnO nanoparticles and SEBS chains. This behavior was accompanied by an increase of thermal conductivity and excellent improvement of the resistance to surface erosion: eroded volume reduced by 90% at only 5wt% ZnO. In the last part of the project, selected SEBS/ZnO nanocomposites were mixed with polyethylene (PE) to prepare blend nanocomposites as new candidates for HV insulation. Although the overall dielectric performance of unfilled PE/SEBS blend was reduced compared to neat PE, PE/SEBS/ZnO blend nanocomposites featured higher resistance to surface erosion and mechanical flexibility compared to conventional PE/ZnO nanocomposites. This improvement was correlated with the improved dispersion of ZnO nanoparticles in PE/SEBS/ZnO compared to PE/ZnO nanocomposites and their selective localization in SEBS phase and potentially at the interfaces between PE and SEBS.
Keywords: High voltage insulation, polymer nanocomposite, nanodielectric, tailored nanoparticles dispersion, block copolymer, polymer blend…


TABLE OF CONTENTS
Page
INTRODUCTION .....................................................................................................................3
NANOCOMPOSITES WITH TUNED MORPHOLOGY FOR HV INSULATION ...........................................................................................13
1.1 Definition of nanocomposites and nanodielectrics ......................................................13 1.1.1 Polymer nanocomposites definition .......................................................... 13 1.1.2 Definition of nanodielectrics ..................................................................... 14 1.1.3 Theories and models regarding the interfacial region ............................... 15
1.1.3.1 Interlayer model ......................................................................... 16 1.1.3.2 Multi-core model ....................................................................... 18
1.1.4 Nanoparticles vs. Microparticles in polymer based insulations ................ 19 1.1.5 Review of nanoparticles used in HV insulation systems .......................... 22
1.1.5.1 Metal oxide nanoparticles .......................................................... 22 1.1.5.2 Nitride and Carbide nanoparticles ............................................. 24 1.1.5.3 Anisotropic nanoparticles .......................................................... 24
1.1.6 Parameters affecting the role of nanoparticles in HV insulating materials ................................................................................... 25 1.1.6.1 Effect of nanoparticles size ........................................................ 25 1.1.6.2 Effect of nanoparticles shape and orientation ............................ 26 1.1.6.3 Effect of nanoparticles dispersion .............................................. 29
1.2 Control of morphology: application to nanodielectrics ...............................................30 1.2.1 Block copolymer nanocomposites ............................................................ 30 1.2.2 Polymer blend nanocomposites ................................................................ 33
1.3 Review of the materials ...............................................................................................36 1.3.1 Polyethylene .............................................................................................. 36 1.3.2 SEBS thermoplastic elastomer .................................................................. 37 1.3.3 Zinc Oxide nanoparticles .......................................................................... 39 1.3.4 Organically modified Montmorillonite Clay ............................................ 40
ARTICLE 1: STYRENIC BLOCK COPOLYMER-BASED NANOCOMPOSITES: IMPLICATIONS OF NANOSTRUCTURATION AND NANOFILLER TAILORED DISPERSION ON THE DIELECTRIC PROPERTIES ............................43
2.1 Introduction ..................................................................................................................44 2.2 Materials and experimental characterization ...............................................................46
2.2.1 Experimental strategy ............................................................................... 46 2.2.2 Materials and methods .............................................................................. 47
2.3 Results and discussion .................................................................................................50 2.3.1 Morphology............................................................................................... 50
2.3.1.1 State of dispersion and location of nanoclay ............................. 50 2.3.1.2 Amount of nanoparticle surface area ......................................... 52

XVI
2.3.1.1 Nanoclay orientation .................................................................. 55 2.3.1.2 SEBS morphology ..................................................................... 56 2.3.1.3 Stability of SEBS morphology................................................... 57
2.3.2 Dielectric properties .................................................................................. 61 2.3.3 AC short-term breakdown strength ........................................................... 70 2.3.4 Summary of results ................................................................................... 74
2.4 Conclusion ...................................................................................................................75
ARTICLE 2: INTERFACIAL MOLECULAR DYNAMICS OF STYRENIC BLOCK COPOLYMER-BASED NANOCOMPOSITES WITH CONTROLLED SPATIAL DISTRIBUTION ...............................77
3.1 Introduction ..................................................................................................................78 3.2 Materials and methods .................................................................................................81 3.3 Characterization ...........................................................................................................86
3.3.1 Small Angle X-ray Scattering ................................................................... 86 3.3.2 Transmission Electron Microscopy .......................................................... 86 3.3.3 Broadband dielectric spectroscopy ........................................................... 86 3.3.4 Dynamic mechanical analysis ................................................................... 87
3.4 Results and discussion .................................................................................................87 3.4.1 Morphology............................................................................................... 87
3.4.1.1 Totally isotropic morphologies .................................................. 87 3.4.1.2 Totally aligned morphologies .................................................... 90 3.4.1.3 Partially aligned morphologies .................................................. 90
3.4.2 Dielectric properties .................................................................................. 97 3.4.2.1 Effect of orientation on dielectric behavior ............................. 102 3.4.2.2 Effect of styrene content and diameter of PS cylinders ........... 105 3.4.2.3 Effect of nanoparticles location and intercalation degree ........ 109
3.4.3 Dynamic mechanical analysis ................................................................. 111 3.5 Concluding remarks ...................................................................................................119
ARTICLE 3: THERMOPLASTIC ELASTOMER NANOCOMPOSITES WITH CONTROLLED NANOPARTICLES DISPERSION FOR HV INSULATION SYSTEMS: CORRELATION BETWEEN RHEOLOGICAL, THERMAL, ELECTRICAL AND DIELECTRIC PROPERTIES ...............................123
4.1 Introduction ................................................................................................................124 4.2 Experimental section ..................................................................................................127
4.2.1 Materials ................................................................................................. 127 4.2.2 Processing ............................................................................................... 128 4.2.3 Characterization ...................................................................................... 129
4.3 Results and discussion ...............................................................................................132 4.3.1 Dispersion and morphology .................................................................... 132 4.3.2 Rheological properties ............................................................................ 137 4.3.3 Low-field dielectric characterization ...................................................... 142
4.3.3.1 Complex dielectric permittivity ............................................... 142

XVII
4.3.4 High-field dielectric characterization ..................................................... 151 4.3.4.1 Short-term breakdown strength ................................................ 151 4.3.4.1 Resistance to surface erosion by partial discharges ................. 153 4.3.4.1 DC electrical conductivity: dependence on nanoparticles
networks ................................................................................... 155 4.3.5 Thermal conductivity .............................................................................. 159
4.4 Concluding remarks ...................................................................................................161
ARTICLE 4: EVALUATION OF POLYETHYLENE/THERMOPLASTIC ELASTOMER/ZINC OXIDE BLEND NANOCOMPOSITES FOR HIGH VOLTAGE INSULATION APPLICATIONS ............................................................163
5.1 Introduction ................................................................................................................164 5.2 Experimental ..............................................................................................................166
5.2.1 Materials ................................................................................................. 166 5.2.2 Processing ............................................................................................... 167 5.2.3 Characterization ...................................................................................... 167
5.3 Results and discussion ...............................................................................................170 5.3.1 Scanning electron microscopy (SEM) .................................................... 170 5.3.2 Thermodynamic prediction of ZnO nanoparticles localization:
Wetting coefficient .................................................................................. 174 5.3.3 Rheological properties ............................................................................ 177 5.3.4 Complex dielectric permittivity .............................................................. 181 5.3.5 AC short-term breakdown strength ......................................................... 185 5.3.6 Resistance to surface erosion by partial discharges ................................ 187 5.3.7 Mechanical properties ............................................................................. 189
5.4 Concluding remarks ...................................................................................................192
ARTICLE 5: TUNING THE MECHANICAL AND DIELECTRIC PROPERTIES OF CLAY-CONTAINING THERMOPLASTIC ELASTOMER NANOCOMPOSITES ....................................................195
6.1 Introduction ................................................................................................................196 6.2 Processing and characterization .................................................................................199
6.2.1 Materials ................................................................................................. 199 6.2.2 Processing ............................................................................................... 199 6.2.3 Summary of nanocomposites morphologies ........................................... 200
6.3 Characterization .........................................................................................................203 6.3.1 Mechanical properties ............................................................................. 203 6.3.2 AC short-term breakdown strength ......................................................... 203
6.4 Results and discussion ...............................................................................................203 6.4.1 Mechanical properties ............................................................................. 203 6.4.2 AC short-term Breakdown strength ........................................................ 208
6.5 Conclusion .................................................................................................................213
DISCUSSION ..........................................................................................215 7.1 Nanocomposites with tailored morphologies.............................................................215

XVIII
7.2 SEBS/Clay nanocomposites.......................................................................................216 7.3 SEBS/ZnO nanocomposites .......................................................................................218 7.4 PE/SEBS/ZnO blend nanocomposites .......................................................................219
CONCLUSION ......................................................................................................................221
RECOMMENDATIONS .......................................................................................................227
ANNEX I SUPPORTING ELECTRONIC INFORMATION FOR ARTICLE 1 ..............................................................................................231
ANNEX II SUPPORTING ELECTRONIC INFORMATION FOR ARTICLE 2 ..............................................................................................241
ANNEX III SUPPORTING ELECTRONIC INFORMATION FOR ARTICLE 3 ..............................................................................................257
APPENDIX VITA .................................................................................................................267
LIST OF BIBLIOGRAPHICAL REFERENCES ..................................................................271

LIST OF TABLES
Page
Table 2-1 Properties of Cloisite 20A grade ................................................................48
Table 2-2 Summary of SEBS/clay nanocomposites with different structures ...........60
Table 2-3 Designation of the nanocomposites ...........................................................61
Table 2-4 Dielectric strengths of SEBS, SEBS_MA and their nanocomposites .......73
Table 2-5 Summary of different effects of SEBS/nanoclays morphology on the complex dielectric permittivity and breakdown strength ...........................75
Table 3-1 Properties of SEBS-13, SEBS-20 and SEBS-30........................................82
Table 3-2 Nomenclature of nanocomposites ..............................................................85
Table 3-3 Nomenclature, morphology description and morphology sketch of the nanocomposites ..........................................................................................96
Table 3-4 VFT fitting parameters corresponding to SEBS-20 based nanocomposites ........................................................................................104
Table 3-5 Dielectric strength of SEBS-20 based nanocomposites at 60 °C and 80 °C .................................................................................................105
Table 3-6 VFT fitting parameters corresponding to SEBS-13 and SEBS-30 based nanocomposites ..............................................................................109
Table 3-7 VFT fitting parameters corresponding to SEBS-30-MA-20A-oriented nanocomposite .........................................................................................110
Table 3-8 Dielectric strength corresponding to SEBS-30-20A vs. SEBS-30-MA-20A nanocomposites prepared by extrusion ....................110
Table 3-9 Tgs of both PS and PEB blocks in different samples of SEBS based nanocomposites ........................................................................................114
Table 3-10 Interfacial Tgi, bound fraction and interfacial layer thickness in SEBS-30 based nanocomposites ..............................................................117
Table 3-11 Average dimensions of clay tactoids based on TEM quantitative analysis published by Carastan et al. (Carastan et al., 2014) ...................117

XX
Table 4-1 Values of real part of complex conductivity at 10-1 Hz ...........................147
Table 4-2 Dissipation factor (tan δ = ε’’/ ε’) at 66 Hz for different nanocomposites ........................................................................................150
Table 5-1 Nomenclature and composition of PE/ZnO and PE/SEBS-MA/ZnO nanocomposites ........................................................................................167
Table 5-2 Total surface tension and Dispersive and Polar components for polymers and ZnO nanoparticles estimated at 160 °C .............................176
Table 5-3 Estimated interfacial tension and wetting coefficient values ...................177
Table 6-1 Nomenclature and morphology description of SEBS-20 and SEBS-13 based nanocomposites .......................................................202

LIST OF FIGURES
Page
Figure 0-1 Main steps of the PhD project ......................................................................9
Figure 1-1 Illustration of size effect on interfacial volume: increasing dominance of interfacial areas with decreasing filler sizes ..........................................14
Figure 1-2 Polymer composite with an interfacial layer between the filler and the matrix ............................................................................................17
Figure 1-3 Conductive water layer surrounding nanoparticles embedded in a polymer matrix: (a) separate water layers (b) overlapping water shells ....18
Figure 1-4 Multi-core model .......................................................................................19
Figure 1-5 Effect of nanoparticles on the flow of electrical charge carriers in nanocomposites ..........................................................................................22
Figure 1-6 Relative impacts of selected nanoparticles on the breakdown strength of polymer insulation matrices .....................................................23
Figure 1-7 DC breakdown strength of BN/Epoxy as function of filler size ................25
Figure 1-8 Effect of the nanofillers alignment on: (a) the Displacement-Electric field (D-E) loops and (b) the breakdown strength of polyethylene ...........27
Figure 1-9 Thermal conductivity of BNNT/ PVA nanocomposite as function of the orientation ........................................................................................28
Figure 1-10 TEM images of: a) P3HT/ZnO nanocomposite and b) P3Ht-b-PEO/ZnO nanocomposite ..................................................31
Figure 1-11 Morphology of polyethylene: amorphous and crystalline regions ............37
Figure 1-12 Schematic description of SEBS block copolymer: (a) without maleic anhydride (MA) and (b) with MA graft attached to PEB block ................38
Figure 1-13 Crystal structure of phyllosilicates .............................................................41
Figure 1-14 Layered clay structures in nanocomposites ...............................................42

XXII
Figure 2-1 TEM images of respectively: (a) SEBS_5wt% nanoclay, (b) SEBS_MA_2.5wt% nanoclay, (c) SEBS_MA_5wt% nanoclay and (d) SEBS_MA_7.5wt% nanoclay (Prepared by extrusion) .......................51
Figure 2-2 (a) Storage modulus E’, (b) Loss modulus E’’ and (c) Damping factor (tan δ) at 1 Hz of SEBS vs. SEBS_MA nanocomposites containing 5wt% nanoclay (prepared by extrusion) ....................................................52
Figure 2-3 TEM image quantitative analysis of oriented hexagonal SEBS/clay nanocomposites, prepared by extrusion, containing different nanoclay loadings: 2.5, 5 and 7.5 wt% ......................................................................54
Figure 2-4 (a) Storage modulus E’, (b) Loss modulus E’’ and (c) Damping factor (tan δ) at 1 Hz of SEBS_MA nanocomposites containing 2.5, 5 and 7.5 wt% nanoclay (prepared by extrusion) ...............................55
Figure 2-5 Radial plot of peak intensities of SEBS vs. SEBS_MA nanocomposites containing 5 wt% nanoclay (prepared by solution): (a) unannealed samples and (b) annealed samples ...............57
Figure 2-6 Radial plots of SAXS peak intensities as function of time at 200 °C of: (a) unannealed pure SEBS and (b) unannealed SEBS_5wt% nanocomposite prepared by solution....................................59
Figure 2-7 Orientation of electric field in dielectric spectroscopy and AC short-term breakdown measurements: (a) anisotropic nanocomposites prepared by extrusion and (b) isotropic nanocomposites prepared by solution casting ..........................................................................................63
Figure 2-8 (a) Real and (b) imaginary parts of the complex permittivity at room temperature of oriented hexagonal SEBS (type I) and SEBS_MA (type II) nanocomposites containing 2.5, 5 and 7.5 wt% nanoclay ......................................................................64
Figure 2-9 Real and imaginary parts of the complex dielectric permittivity in the temperature range from 25 to 95 °C of: Pure SEBS (a) and (b), SEBS_5wt%_int_ori_hex (c) and (d) and SEBS_MA_5wt%_exf_ori_hex (e) and (f) ................................................65
Figure 2-10 Real (a) and Imaginary (b) parts of the complex permittivity at room temperature of oriented hexagonal vs. random hexagonal SEBS/clay nanocomposites ......................................................68
Figure 2-11 Real (a) and imaginary (b) parts of the complex permittivity of SEBS_5wt%_int_ran_hex nanocomposite with random hexagonal structure in the temperature range from 25 to 95 °C ................69

XXIII
Figure 2-12 Real (a) and imaginary (b) parts of the complex permittivity of SEBS_5wt%_int_ran_lam nanocomposite with random lamellar structure in the temperature range from 25 to 95 °C ...................70
Figure 2-13 Weibull plot of breakdown strength of SEBS vs. SEBS/clay nanocomposites with oriented hexagonal structure ...................................72
Figure 3-1 Illustrations showing: (a) sheet die extrusion, (b) film blowing with ratio R1= 1 and (c) film blowing with ratio R3= 3 (Coordinate system used as reference is indicated at the left of the figure) ..................84
Figure 3-2 Scattering intensity as function of scattering vector q at different temperatures of: (a) SEBS-20-solution and (b) SEB-20-20A-solution nanocomposite, (c) SEBS-13-solution and (d) SEBS-13-20A-solution nanocomposite ...........................................................................................89
Figure 3-3 (a)-(b) 2D SAXS patterns of: (a) SEBS-20-film blowing R1 and (b) SEBS-20-20A-film blowing R1, (c)-(e) TEM images of SEBS 20-20A- film blowing R1 at 3 different magnifications showing imperfect alignment of PS cylinders and clay tactoids: (d) zoom on the section defined by black square in (c), (e) the white square indicates regions featuring perfect alignment of PS cylinders in the extrusion direction while dotted white rectangles indicate other directions of alignment (PS domains were stained with RuO4 (dark phase)) ..................................92
Figure 3-4 (a)-(b) 2D SAXS patterns of: (a) SEBS-20-film blowing R3 and (b) SEBS-20-20A- film blowing R3 nanocomposite, (c)-(d) TEM images of SEBS-20-film blowing R3 at different magnifications (PS domains (darker phase) were stained with RuO4) ..............................94
Figure 3-5 Imaginary part of the dielectric permittivity as a function of temperature of: (a) neat SEBS-20-partially oriented R3, (b) SEBS-20-20A-oriented, (c) SEBS-20-20A- partially oriented R1, (d) SEBS-20-20A-partially oriented R3, (e) SEBS-20-20A-isotropic and (f) an example of the fitting corresponding to SEBS-20-20A-partially oriented R3 at 75 °C (Different colors are used to denote the different contributions) ........................................101
Figure 3-6 Temperature dependence of the relaxation times corresponding to SEBS-20 nanocomposites prepared by different processes: symbols correspond to relaxations times retrieved from the HN function and solid lines correspond to VFT fitting .....................104
Figure 3-7 Examples of fitting according to equation (A II.2) in annex II of respectively: (a) SEBS-13-20A-isotropic at 65 °C (ɛ” presented in log scale due to high contribution from charge fluctuation)

XXIV
and (b) SEBS-30-20A-oriented at 70 °C (Different colors are used to denote the different contributions) ..............................................106
Figure 3-8 Temperature dependence of the relaxation times corresponding to SEBS-13 and SEBS-30 nanocomposites prepared by different processes: symbols correspond to relaxation times retrieved from the HN function and solid lines correspond to VFT fitting, plots corresponding to SEBS-20 nanocomposites are presented again for comparison ...............................108
Figure 3-9 Temperature dependence of the relaxation times corresponding to SEBS-30-MA-20A-oriented nanocomposite: symbols correspond to relaxations times retrieved from the HN function and solid lines correspond to VFT fitting (plot corresponding to SEBS-30-20A-oriented nanocomposite is presented again for comparison) ..........................................................111
Figure 3-10 tan δ of different SEBS-30 materials (prepared by sheet die extrusion) from -100 °C to 130 °C at 1 Hz ..............................................113
Figure 3-11 Fitted tan delta curves showing bulk Tgs of PS and PEB blocks as well as Tgi of the interfacial layer (an additional ADS term is considered for the increasing baseline):(a) SEBS-30-oriented and (b) SEBS-30-20A-oriented................................................................115
Figure 3-12 Scheme of the interfacial layer covering the lateral side of clay particles: (a) First approximation: clay tactoid as a solid particle, (b) part of the interfacial layer is between clay galleries .........................118
Figure 4-1 Schematic description of SEBS block copolymer with MA group grafted to elastomer block ("Polystyrene-block-poly(ethylene-ran-butylene)-block-polystyrene-graft-maleic anhydride,") ..........................128
Figure 4-2 Sketch of the set up for resistance to surface erosion test ........................131
Figure 4-3 SEM micrographs of: (a) SEBS-5 (arrows indicate the agglomerations) and (b) SEBS-MA-5 .....................................................133
Figure 4-4 TEM micrographs of SEBS-MA-5 nanocomposite .................................133
Figure 4-5 FTIR spectra of SEBS-MA-ZnO nanocomposites: (a) in the absorption range 1500-2000 cm-1 and (b) in the absorption range 3000-3800 cm-1 ..............................................................................135
Figure 4-6 Reaction scheme between maleic anhydride and the surface of the nanoparticles (R: alkyl ammonium salt) ........................................136

XXV
Figure 4-7 AFM images of: (a) Neat SEBS-MA, (b) SEBS-MA-1 nanocomposite, (c) Zoom on the region indicated by the square in (b) (showing the same magnification as (a)) .......................................137
Figure 4-8 SAOS measurements of SEBS-ZnO vs. SEBS-MA-ZnO nanocomposites: (a)-(b) storage modulus G’ (●) and loss modulus G” (■) and (c)-(d) complex viscosity modulus |η*| ...........140
Figure 4-9 Time sweep test at 200 °C, 0.05 rad.s-1 and 0.5% strain .........................141
Figure 4-10 Complex dielectric permittivity at room temperature of SEBS-MA-ZnO vs. SEBS-ZnO nanocomposites: (a) Real part of permittivity of SEBS-MA-ZnO nanocomposites, (b) Imaginary part of permittivity of SEBS-MA-ZnO nanocomposites, (c) Real part of permittivity of SEBS-ZnO nanocomposites and (d) Imaginary part of permittivity of SEBS-MA-ZnO nanocomposites ........................................................................................144
Figure 4-11 Imaginary part of the dielectric permittivity as functions of frequency and temperature of: (a) Neat SEBS-MA, (b) Neat SEBS,(c) SEBS-MA-5 nanocomposite and (d) SEBS-5 nanocomposite ...............................................................146
Figure 4-12 Imaginary part of electric modulus as functions of frequency and temperature of: (a) SEBS-MA-20wt% ZnO nanocomposite and (b) SEBS-20wt% ZnO nanocomposite .............................................149
Figure 4-13 Breakdown strength of: (a) SEBS-ZnO and (b) SEBS-MA-ZnO nanocomposites ........................................................................................152
Figure 4-14 Resistance to surface erosion by partial discharges .................................155
Figure 4-15 (a) current density vs. DC electric field plots of SEBS-MA-ZnO vs. SEBS-ZnO nanocomposites , (b) DC conductivity of SEBS-MA-ZnO vs. SEBS-ZnO nanocomposites as functions of ZnO loading (wt%) and electric field .......................................................................................158
Figure 4-16 Thermal conductivity of SEBS-ZnO vs. SEBS-MA-ZnO nanocomposites ........................................................................................160
Figure 5-1 SEM micrographs of PE/ZnO nanocomposites: (a) unfilled PE, (b) PE/1, (c) PE/5 and (d) PE/10 ..............................................................171
Figure 5-2 SEM micrographs of samples treated by solvent extraction: (a) unfilled PE/SEBS-MA, (b) PE/SEBS-MA/1, (c) PE/SEBS-MA/5 and (d) PE/SEBS-MA/10 ........................................172

XXVI
Figure 5-3 HRSEM micrographs of PE/SEBS-MA/5 nanocomposite: (a) SEBS-MA not extracted, (b) SEBS-MA extracted, (c) Zoom inside PE region surrounded by blue continuous line in (b): poor ZnO phase, (d) Zoom inside SEBS-MA region surrounded by red dotted line in (b): poor ZnO phase, (d) Zoom inside SEBS-MA region surrounded by red dotted line in (b): rich ZnO phase (Colors are available in the online version) ....................................................................................174
Figure 5-4 SAOS measurements of PE/ZnO vs. PE/SEBS-MA/ZnO nanocomposites: (a) storage modulus G’ and (b) complex viscosity modulus |η*| as function of angular frequency ω .....................180
Figure 5-5 Plots of imaginary permittivity ɛ’’ as function of frequency measured at room temperature corresponding to: (a) PE/ZnO nanocomposites, (b) PE/SEBS-MA/ZnO nanocomposites and (c) comparison with SEBS-MA/ZnO master batches .......................183
Figure 5-6: Isothermal frequency sweeps of the imaginary permittivity ɛ’’ of PE/5 and PE/SEBS-MA/5 nanocomposites at different temperatures between 25 °C and 100 °C, performed before and after drying: (a) undried PE/5, (b) undried PE/SEBS-MA/5, (c) PE/5 dried and (d) PE/SEBS-MA/5 dried for 5 days at 65 °C. ..........185
Figure 5-7 Weibull probability plots of: (a) PE/ZnO nanocomposites and (b) PE/SEBS-MA/ZnO nanocomposites..................................................187
Figure 5-8 Resistance to surface erosion by partial discharges for PE/ZnO vs. PE/SEBS-MA/ZnO nanocomposites ....................................189
Figure 5-9 Typical stress-strain curves of selected PE/ZnO vs. PE/SEBS-MA/ZnO materials ...............................................190
Figure 5-10 Mechanical properties of PE/ZnO vs. PE/SEBS-MA/ZnO nanocomposites: (a) Elastic Young’s modulus E, (b) Elongation at break EB, (c) Ultimate tensile strength UTS and (d) Elongation at ultimate tensile strength EUTS (error bars stand for standard deviation) ..................................................192
Figure 6-1 Cartoons illustrating: sheet-die extrusion (a), films blowing extrusion using a tubular die with two different ratios: R1 (b) and R3 (c) (the coordinate system is used as a reference for the following characterizations and discussions) ...........................................................200
Figure 6-2 Characteristic stress-strain plots of SEBS-20 based materials ................207

XXVII
Figure 6-3 Characteristic stress-strain plots of SEBS-13 based materials ................207
Figure 6-4 Young’s modulus of respectively SEBS-20 and SEBS-13 sets of materials...............................................................................................208
Figure 6-5 Breakdown strength of SEBS-20 based nanocomposites ........................212
Figure 6-6 Breakdown strength of SEBS-13 based nanocomposites. .......................212


LIST OF ABREVIATIONS AC Alternating current
ADS equation Asymmetric Double Sigmoid equation
AFM Atomic force microscopy
Al2O3 Aluminium oxide or Alumina
BDS Broadband dielectric spectroscopy
BN Boron nitride
BNNS Boron nitride nanosheets
BNNT Boron nitride nanotubes
CNT Carbon nanotubes
DC Direct current
DMA Dynamic mechanical analysis
DSC Differential scanning calorimetry
E Elastic modulus
EB Elongation at break
EUTS Elongation at ultimate tensile strength
FTIR Fourier transformed infrared spectroscopy
GO Graphene oxide
HDPE High density polyethylene
HRSEM High resolution scanning electron microscopy
HV High voltage
HVDC High voltage direct current
LDPE Low density polyethylene
MA Maleic anhydride
MgO Magnesium oxide
MMT Montmorillonite
MWS polarization Maxwell Wagner Sillars polarization
PE Polyethylene
PEB Poly(ethylene-co-butylene)

XXX
PEO Polyethylene oxide
PMMA Poly(methyl methacrylate)
POE Polyolefin elastomer
POSS Polyhedral Oligomeric Silsesquioxane
PP Polypropylene
PS Polystyrene
SAOS Small amplitude oscillatory shear
SAXS Small angle X-ray scattering
SBR Styrene-Butadiene rubber
SEBS Polystyrene-b-poly(ethylene-co-butylene)-b-polystyrene
SiC Silicon Carbide
Si3N4 Silicon Nitride
SiO2 Silicon dioxide or Silica
TEM Transmission electron microscopy
TiO2 Titanium Oxide
UTS Ultimate tensile strength
VFT equation Vogel Fulcher Tammann equation
XLPE Crosslinked Polyethylene
ZnO Zinc Oxide
LIST OF SYMBOLS F Fragility index
G’ Storage modulus
G’’ Loss modulus
t Thickness
T Temperature
tanδ Loss tangent or dissipation factor in BDS measurements (Chapters 4 and 5) or DMA measurements (Chapters 2 and 3)
Tg Glass Transition
Tgi Interfacial Glass Transition
Wa Wetting coefficient
20A Organically modified clay Cloisite 20A
δ Surface tension
δp Polar component of the surface tension
δd Dispersive component of the surface tension
δ12 Interfacial tension ∆ε Dielectric strength
ε Complex dielectric permittivity
ε’ Real part of dielectric permittivity
ε’’ Imaginary part of dielectric permittivity
η* Complex viscosity
λ Thermal conductivity
σ Conductivity modulus
σ’ Real part of complex conductivity
τ Relaxation time
ω Angular frequency

INTRODUCTION
0.1 Context of the research
Existing electrical insulating polymers currently used in high voltage (HV) apparatus are
subjected constantly to increasing electrical and thermal stresses due to growing operating
voltages and power ratings required by the current market demand and the emergence of new
techniques suitable for long-distance electric power transmission such as high voltage direct
current (HVDC) cables (Astrom & Lescale, 2006; Ghorbani, Jeroense, Olsson, & Saltzer,
2014). For example, in the case of extruded HVDC cables, the maximum transmission
voltage level is currently equal to 525 kV. By 2030, the objective is to increase this level up
to 1 MV while maintaining the present cables geometry unchanged (Amir M Pourrahimi et
al., 2016; Amir Masoud Pourrahimi et al., 2016). To meet these pressing requirements, there
has been a critical need for the development of new reliable and cost-effective HV insulating
materials with improved dielectric and thermal performance. The ensuing research, during
the last decades, led to the introduction of nanocomposites as a new conceptual design for
dielectric materials used in HV insulation.
The new generation of nanocomposite dielectrics, known also as nanodielectrics (David &
Fréchette, 2013; Michel F Fréchette, Trudeau, Alamdar, & Boily, 2004; Michel F Fréchette
et al., 2010; Tanaka & Imai, 2013) featured several promising properties, albeit depending on
the nanoparticles challenging dispersion, which unfortunately compromises their reliability
and reproducibility (Balazs, Emrick, & Russell, 2006). In fact, inorganic nanoparticles
typically form submicrometric and micrometric agglomerations, during nanocomposites
processing, due to their incompatibility with the organic polymer hosts, which supress or
reduce potential benefits associated with their nanoscopic dimensions. In addition to the
agglomerations issue, the spatial distribution of nanoparticles as well as their orientation and
selective location are considered as major challenges of morphology design that could affect
drastically the functional properties of nanocomposites in general and those of
nanodielectrics in specific, such as the breakdown strength, dielectric loss, electrical

4
conductivity, thermal conductivity and resistance to surface erosion, to name a few (David &
Fréchette, 2013; Roy et al., 2005). Therefore, recently researchers began seeking the
possibilities to design nanocomposites with prescribed morphologies that optimize their
functional properties (Balazs et al., 2006; Richard A Vaia & Maguire, 2006).
Several techniques have been tested to avoid nanoparticles agglomerations, through the
mediation of the interaction between the nanoparticles and polymer chains, such as surface
functionalization of nanoparticles (Balazs et al., 2006; Huang et al., 2013; D. Ma et al., 2005;
Polizos, Tomer, Manias, & Randall, 2010; Virtanen et al., 2014), in situ synthesis of
nanoparticles (Dirix, Bastiaansen, Caseri, & Smith, 1999) or in situ polymerization of the
polymer matrix (Zapata et al., 2011). Besides, some attempts to orient nanoparticles and
tailor their spatial distribution were also performed (Richard A Vaia & Maguire, 2006). The
current findings are partially successful in solving the issue of agglomerations. However,
they are far from governing all different aspects involved within the concept of tailored
dispersion. Moreover, a large-scale production based on the current techniques is often
inappropriate due to several factors including increased complexity and cost, limited yield,
poor efficiency and/or potential drawbacks induced by some modifiers on the dielectric
properties.
A new approach is nowadays considered as a promising technique to overcome the hurdles
related to the control of dispersion. It consists in using template matrices in order to guide
the dispersion, the spatial distribution as well as the orientation of nanoparticles (Balazs et
al., 2006). In particular, the template can be a multiphase polymer system with controllable
morphology, such as block copolymers or immiscible polymer blends, which offers various
possibilities to disperse nanoparticles based on its architecture and the affinity of the studied
nanoparticles to one phase or another. Block copolymers are composed of covalently bonded
blocks that exhibit nanoscale dimensions and self-assemble in different morphologies
depending on several factors including the molecular weight of the blocks, their affinity and
the ratio between them (Helfand, 1975; Sarkar & Alexandridis, 2015). Immiscible polymer

5
blends are mixtures of at least two polymers which cannot be homogenized. They feature
several characteristic morphologies as well, of microscale dimensions though.
Owing to their ordered structures, these classes of materials might lead nanoparticles
orientation, location and dispersion in the aim of optimizing the ultimate performance of the
nanocomposites (Balazs et al., 2006; Carastan, Amurin, Craievich, do Carmo Gonçalves, &
Demarquette, 2013; Carastan, Amurin, Craievich, Gonçalves, & Demarquette, 2014; Kao,
Thorkelsson, Bai, Rancatore, & Xu, 2013; Park, Yoon, & Thomas, 2003; Sarkar &
Alexandridis, 2015). Furthermore, they could exhibit useful physical properties depending on
the choice of the blocks or constitutive phases of the blend. In particular, styrenic
thermoplastic elastomers are block copolymers, composed of a combination of styrenic hard
blocks and elastomeric soft blocks, which display excellent mechanical properties (Holden,
Kricheldorf, & Quirk, 2004), electromechanical coupling (B. Kim et al., 2011) and good
resistance to water treeing (Liu, Mhetar, & Freestone, 2011; Z. Ma, Jiang, Wang, & Yang,
2010). Among styrenic thermoplastic elastomers, polystyrene-b-poly(ethylene-co-butylene)-
b-polystyrene SEBS is an interesting candidate commercially available and widely used in
several industries as a compatibilizer. It consists of two polystyrene PS endblocks dispersed
in the form of cylinders, lamellae or spheres within a hydrogenated Polybutadiene midblock
matrix, known as poly(ethylene-co-butylene) PEB. The latter has a structure equivalent to the
structure of polyethylene PE in its amorphous form which ensures good compatibility with
polyolefins (Agari, Ueda, & Nagai, 1993).
0.2 Motivation and Objectives
This PhD project is part of a bigger research project conducted in collaboration between
École de Technologie Supérieure (ÉTS) and Hydro-Québec Research Institute (IREQ) and
involving several graduate students, in the aim of producing novel nanodielectrics for HV
insulation systems and tailoring their functional properties in correlation with their
microstructures. Besides, a better understanding of the underlying structure-property
relationships governing the dielectric and thermal performance of nanodielectrics is
expected. Within this framework, the main goal of this thesis was to design advanced SEBS

6
block copolymer nanocomposites with tunable nanoparticles dispersion that take advantage
from SEBS architecture as a template or guiding matrix (Carastan et al., 2013; Carastan et
al., 2014). Two types of nanoparticles, respectively: clay nanoplatelets and Zinc oxide (ZnO)
nanospheres featuring distinguished properties and shapes were used. The effects of their
patterned arrangement in SEBS, going beyond single-particle dispersion limits, on the
dielectric performance of the insulating matrix were evaluated. The resulting block
copolymer nanocomposites were subsequently used as master batches and blended with
polyethylene (PE), a polyolefin widely used in its crosslinked form as insulating material in
the current state-of-the-art extruded HV cables. The dispersion and the selective location of
the nanoparticles in these particular blends were emphasized. Ultimately, their dielectric
properties were compared to those of PE as a reference insulating material.
0.3 Industrial impact
From an industrial point of view, the optimization of nanoparticles spatial distribution using a
block copolymer template is expected to result in an optimized use of nanoparticles
properties at lower loadings and to induce as a consequence an effective cost reduction.
Hence, the method might be generalized to different types of nanoparticles and versatile
processing techniques (solution casting, extrusion, injection…) to evaluate its scalability.
Furthermore, the as-prepared nanocomposites are expected to exhibit good compatibility
with polyolefins, good resistance to water treeing and excellent electromechanical coupling,
which are intrinsic properties of the styrenic thermoplastic elastomer matrix. They might be
used as final materials or as master batches to blend with polyolefins for larger spectra of
dielectric applications including but not limited to HV insulation, capacitors and dielectric
elastomer actuators.
0.4 Approach and methodology
This PhD project was divided in three main parts that are summarized in Figure 0-1.
- SEBS/Clay nanocomposites: In addition to their reduced cost, nanoclays were
selected due to their anisotropy and confirmed electron scattering effect especially

7
upon exfoliation and orientation (David et al., 2013; Tomer, Polizos, Randall, &
Manias, 2011). Moreover, successful orientation and localization of these
nanoplatelets in SEBS was recently reported (Carastan et al., 2013; Carastan et al.,
2014). In this step, the effect of nanoclays and PS domains orientations as well as the
effect of nanoclays selective location on the dielectric performance of the
nanocomposites were emphasized. Different morphologies, i.e. isotropic vs. oriented
vs. partially oriented, were obtained through the variation of the processing technique
and the ratio between the blocks of SEBS. The location of nanoclays either in the
hard PS block or soft PEB block was tuned through the presence or absence of maleic
anhydride (MA) group grafted onto the rubber block. The latter exhibits good affinity
to the functional groups attached to the nanoparticles surface. Afterward, changes in
the dielectric and mechanical properties depending on the configuration were
evaluated. Moreover, the interfacial dynamics were investigated as function of
morphology. The results of this part led to the publication of two articles (Chapter 2
and Chapter 3) and one conference paper. A third manuscript (submitted), related to
this part, is also reported in Chapter 6.
- SEBS/ZnO nanocomposites: In a second step, nanocomposites of SEBS were
prepared with a different type of nanoparticles: functionalized ZnO nanospheres that
are commercially available. ZnO nanoparticles were selected for their relatively high
thermal conductivity and excellent UV light shielding capability as well as their
confirmed ability to reduce space charge accumulation in polymer matrices, which is
a key requirement for HVDC cables (Huang, Jiang, & Tanaka, 2011; Mazzanti &
Marzinotto, 2013; Tian, Lei, Wang, & Wang, 2011, 2012). Only isotropic
morphology was investigated in this part but nanoparticles distribution and selective
location was modulated using the MA graft. The effect of morphology on the
dielectric, electrical and thermal properties was emphasized at this step. A correlation
with rheological properties was also established. The findings of this part were
reported in one submitted article (Chapter 4) and two conference papers.
- Blend of Polyethylene and SEBS/ZnO nanocomposites: In a third step, block
copolymer nanocomposites containing ZnO nanoparticles studied in the previous step

8
were used as master batches and blended with polyethylene. These nanocomposites
were selected due to their good potential for HV insulation and HVDC cables
insulation in particular. The morphology of the resulting blend nanocomposites and
the selective location of ZnO nanoparticles in this blend were investigated. The effect
of the obtained morphologies on the dielectric and mechanical properties was
evaluated. The main conclusions of this part were reported in one submitted article
(Chapter 5) and two conference papers.
The microstructures of all the fabricated nanocomposites were investigated by means of
Scanning Electron Microscopy, Transmission Electron Microscopy and Atomic Force
Microscopy. The morphology of the block copolymer and the arrangements of both the block
copolymer domains and the nanoparticles were assessed by means of Small Angle X-Ray
Scattering. Besides, the dielectric performance was evaluated by means of: dielectric
broadband spectroscopy, AC breakdown strength, resistance to surface erosion by partial
discharges, electrical conductivity and thermal conductivity measurements. Tensile
properties and linear viscoelastic properties were evaluated in some cases as well, to achieve
better understanding of the correlation between the microstructure and dielectric properties.

9
Figure 0-1: Main steps of the PhD project
0.5 Organization of the PhD thesis
This thesis is divided in 7 chapters. Following the introduction, a brief literature review
regarding nanodielectrics and the concept of tailored nanoparticles dispersion is presented.
Then, in each one of the next 5 chapters, an article related to a part of the above-mentioned
parts of the project is presented. Finally, in the last chapter, a general discussion is provided
and followed by conclusions and recommendations for future work.
In chapter 2, the paper untitled ‘’Styrenic block copolymer-based nanocomposites:
implications of nanostructuration and nanofiller tailored dispersion on the dielectric
properties’’ published in Polymer is presented. This article is based on results from the first
part of the project regarding block copolymer nanocomposites containing clay nanoparticles.
It emphasizes the effect of orientation of nanoparticles and morphology of the block
copolymer on dielectric properties namely dielectric loss and short-term breakdown strength.
Block copolymer nanostructured
template
Block copolymer
+ 2D nanoparticle
Block copolymer + 0D
nanoparticle
Block copolymer + 0D nanoparticle
+ Polyolefin
Step 2 Step 1
Step 3

10
Chapter 3 presents the paper ‘’ Interfacial molecular dynamics of styrenic block copolymer-
based nanocomposites with controlled spatial distribution’’ published in Polymer as well.
This article is also related to the first part of this project. It highlights a correlation between
the studied nanocomposite morphologies and the interfacial dynamics at nanoclay-block
copolymer interfaces. An extended range of complex morphologies is achieved through the
variation of the blocks proportions and the processing techniques as well as the use of MA
graft.
In chapter 4, the paper untitled ‘’Thermoplastic elastomer nanocomposites with controlled
nanoparticles dispersion for HV insulation systems: correlation between rheological, thermal,
electrical and dielectric properties’’ submitted to European Polymer Journal is presented.
This study summarizes the results of the second part of this project related to block
copolymer nanocomposites containing Zinc Oxide nanoparticles. In particular, a correlation
between the dielectric, electrical, thermal and rheological properties and the formation of a
network between ZnO nanoparticles and the block copolymer chains is established.
In chapter 5, the paper untitled ‘’Evaluation of polyethylene/thermoplastic elastomer/zinc
oxide blend nanocomposites for high voltage insulation applications’’ submitted to Polymer
is presented. This paper is based on the conclusions found in the third part of this project
dealing with the use of block copolymer nanocomposites with controlled morphology as a
master batch to blend with polyethylene. It focuses on the potential of these blend
nanocomposites with tuned nanoparticles dispersion for HV insulation applications.
In chapter 6, the study ‘’Tuning mechanical and dielectric strength of clay-containing
thermoplastic elastomer nanocomposites’’ is reported. The manuscript is submitted to
Polymer Engineering and Science. This work is also based on the findings of the first part of
the project. It presents an evaluation of the dielectric breakdown strength and mechanical
strength of the nanocomposites with different morphologies studied in chapter 3.

11
In addition to the main chapters, three annexes are also included at the end of the thesis. They
provide supplementary information regarding the articles reported respectively in chapters 2,
3 and 4.
For more details regarding the fundamentals of dielectric spectroscopy and the physical
properties of solid insulations, good reviews can be found respectively in references (Kremer
& Schönhals, 2012; C. C. Ku & Liepins, 1987) and references (Blythe & Bloor, 2005;
Dissado & Fothergill, 1992; C. C. Ku & Liepins, 1987). For block copolymers (including
thermoplastic elastomers) and polymer blends, respectively references (Holden et al., 2004;
Mai & Eisenberg, 2012) and reference (Paul & Bucknall, 2000) can be consulted.


CHAPITRE 1
NANOCOMPOSITES WITH TUNED MORPHOLOGY FOR HV INSULATION
Polymer nanocomposites have shown promise recently for the development of advanced
materials intended for use in a large spectrum of applications including dielectric applications
and HV insulation. Their established and foreseen superior properties are often correlated
with the formation of polymer/nanoparticle interfacial layers featuring distinct behavior
compared to the bulk polymer host.
In this chapter, the concept of polymer nanocomposites and nanodielectrics is reviewed, with
a focus on the impact of the interfacial region. Besides, a summary of the most common
types of nanoparticles investigated, during the last decades, in HV insulation is presented.
The influence of several parameters such as the nanoparticles shape, size, orientation and
quality of dispersion on the efficiency of their use in nanodielectrics is investigated as well.
Then, the concept of controlled nanocomposites morphology is emphasized. In particular, the
effect of tuning nanoparticles dispersion in polymer blends and block copolymers, used as
template polymer matrices, on their dielectric performance is highlighted. Finally, a review
of the polymers and nanoparticles studied in the present project is reported.
1.1 Definition of nanocomposites and nanodielectrics
1.1.1 Polymer nanocomposites definition
Polymer nanocomposites are polymeric materials containing particles, with at least one
dimension below 100 nm. Polymer nanocomposites differ from conventional
microcomposites in two major aspects:
- Particles size in the nanometer range: this feature results in significantly higher
specific surface area, i.e. surface area per mass of a material, compared to similar
masses of larger scale particles. To illustrate better the tremendous effect of
CHAPTER 1

14
nanoparticles size on the specific surface area, one can compare the total surface area
of a single solid cube of volume equal to 1 cm3 with the same volume made up of 1
nanometer-sized cubes; each of them having a surface area equal to 6 nm2. The latter
contains 1021 nanoscale cubes with a total surface area equal to 6000 m2 compared to
only 6 cm2 for the single solid cube ("What is so special about the nanoscale? ,").
- Small fraction of fillers compared to conventional composites: This can be also
considered a consequence of the nanometric size. In fact, when incorporated in a
polymer matrix, the large surface area of nanoparticles constitutes an interaction zone
that comes into contact with the surrounding polymer and favorably affects its
properties. As the particle size decreases, the specific surface area increases and the
interfacial region becomes more prominent for the same amount of particles, as
illustrated in Figure 1-1. As a consequence, lower loading of nanoparticles is needed,
compared to microparticles, to achieve equivalent or higher properties.
Figure 1-1: Illustration of size effect on interfacial volume: increasing dominance of interfacial areas with decreasing filler sizes
Taken from (Andritsch, Kochetov, Gebrekiros, Morshuis, & Smit, 2010)
1.1.2 Definition of nanodielectrics
A dielectric material is an electrical insulating material that has the ability to polarize in the
presence of an electric field. When an electric field is applied, a dielectric responds by
distorting slightly its charges from their equilibrium position and redistributing them in a

15
more organized form: positive charges are shifted toward the field and negative charges in
the opposite direction. The resulting dipoles orient parallel to the electric field with opposite
polarity and create an internal field that reduces the overall field within the dielectric. There
are three basic groups of dielectrics: solid, fluid and gaseous dielectrics. In particular,
electrically insulating polymers belong to the group of solid dielectrics. Comprehensive
details regarding insulating polymers, their electrical properties and the polarization
phenomena can be found in (Blythe & Bloor, 2005; Dissado & Fothergill, 1992; Kremer &
Schönhals, 2012; C. C. Ku & Liepins, 1987).
The term nanometric dielectric or nanodielectric for short was proposed for the first time in
2001 by Fréchette et al. (M. F. Fréchette, Trudeau, Alamdari, & Boily, 2001) as a “multi-
component dielectric processing nanostructures, the presence of which lead to changes in one
or several of its dielectric properties”. This notion includes nanostructured ceramics and
polymer nanocomposites. In particular, in last decades, an important and growing fraction of
nanodielectrics has been developed based on the second group, namely polymer
nanocomposites (M. F. Fréchette et al., 2001). It is now well established that the addition of
specific nanoparticles to regular insulating polymers used as solid dielectrics can improve
their performance in different aspects. Hence, the as-developed nanodielectrics have gained
attraction in different dielectric applications including HV insulation, high energy density
capacitors and dielectric elastomer actuators (Camargo, Satyanarayana, & Wypych, 2009;
David & Fréchette, 2013; Michel F Fréchette et al., 2010; Pleşa, Noţingher, Schlögl,
Sumereder, & Muhr, 2016; Tanaka, Montanari, & Mulhaupt, 2004). However, it is worth
noting that the extent of the achieved improvement is strongly dependent on the properties of
the interfacial area, which is actually the case for all nanocomposites. The interface region
depends not only on the nanoparticles size and specific surface area but also on their
dispersion/spatial distribution and their compatibility with the polymer host.
1.1.3 Theories and models regarding the interfacial region
Few properties of composite materials, such as the mechanical modulus, can be roughly
estimated from the inherent properties of the polymer matrix and the added particles

16
respectively, using basic approaches such as the rule of mixtures (Bartczak, Argon, Cohen, &
Weinberg, 1999; Selvin, Kuruvilla, & Sabu, 2004; Zare & Garmabi, 2014). However, the
majority of them, including electrical and thermal properties, are more difficult to predict
because they depend strongly on polymer/particles interactions in addition to the usual
factors. In nanocomposites, this phenomenon is even more pronounced due to the presence of
an important interfacial region. In this context, it was repeatedly observed that effective
properties of nanocomposites are often far from the predictions of basic models and that the
achieved/potential enhancements are rather governed by the properties of the interfacial
region (Heid, 2015; Lewis, 2005; Nelson & Hu, 2005; Rittigstein, Priestley, Broadbelt, &
Torkelson, 2007; Smith, Liang, Landry, Nelson, & Schadler, 2008; Zare & Garmabi, 2014).
Therefore, several models have been proposed to describe the interaction zone in
nanocomposites, on the basis of chemical and electrical analysis (Heid, 2015; Kremer &
Schönhals, 2012; Pitsa & Danikas, 2011; Ioana Preda, Castellon, Frechette, & Agnel, 2014;
Tanaka, Kozako, Fuse, & Ohki, 2005; Zou, Fothergill, & Rowe, 2007), in order to
understand their electrical and thermal properties. These models based on different
approaches and assumptions can be more or less accurate in describing the experimental
results, depending on the property and the system studied. But, overall there is a general
consensus on the great role of the interface region. One basic theoretical model that was
initially developed is the interlayer model treating the case of a matrix-inclusion system with
an interfacial layer (Kremer & Schönhals, 2012). Later, several models have been proposed
such as the multi-core model proposed by Tanaka et al. (Tanaka et al., 2005) which suggests
that the interfacial zone is divided in several layers featuring different physical properties.
These two models will be reviewed briefly in the following sections.
1.1.3.1 Interlayer model
A polymer composite with an interfacial layer between the filler and the matrix, as illustrated
in Figure 1-2, can be modeled using the asymmetrical effective medium approach. The
analytical solution, also known as the interlayer model, can be used to describe several
macroscopic properties including the complex dielectric permittivity (Kremer & Schönhals,
2012).

17
Figure 1-2: Polymer composite with an interfacial layer between the filler and the matrix
Taken from (Kremer & Schönhals, 2012)
In the case of dielectrics and nanodielectrics, this model can be particularly interesting to
describe the behavior of dielectrics and nanodielectrics containing water sensitive particles
such as metal oxides. In fact, humidity absorption often leads to detrimental effects on the
dielectric behavior of the polymer matrix. In particular, simultaneous increase of the
dielectric constant and dielectric loss are commonly reported since water has relatively high
dielectric constant and high electrical conductivity. The increase of the dielectric loss is
dominant at low frequencies and attributed to quasi DC conductivity increase. This behavior
is explained by the fact that absorbed water resides in the interfacial region leading to the
formation of a conductive interlayer between the particles and the polymer matrix. In
addition to the increase of conductivity and dielectric loss, this conductive interlayer gives
rise to an interfacial loss process at low frequencies. Furthermore, in nanocomposites, water
shells around the nanoparticles have higher probability to overlap with increasing
concentrations as illustrated in Figure 1-3 due to the increased interfacial area and reduced
interparticle distance, providing conduction paths for charge carriers (Kremer & Schönhals,
2012; Zou et al., 2007).

18
Figure 1-3: Conductive water layer surrounding nanoparticles embedded in a polymer matrix: (a) separate water layers (b) overlapping water shells
Adapted from (Zou et al., 2007)
1.1.3.2 Multi-core model
According to this model, the interfacial layer is composed, on the basis of chemical and
electrical analysis, of 3 different physical layers overlapped by an electric diffuse layer, as
illustrated in Figure 1-4 (Tanaka et al., 2005). Each of these layers has a distinguished
physical, chemical and/or electrical behavior, as following:
- The bonded layer: this first layer is tightly bonded to the surface of nanoparticles by
coupling agents.
- The bound layer: this second layer consists of polymer chains strongly bound to the
first layer and the surface of the nanoparticles. The thickness of the bound fraction, in
the range from 2 to 9 nm, is increasing with the strength of polymer-nanoparticle
interaction. The mobility of chains belonging to this region is particularly altered but
the polymer conformation, local density and crystallinity are also subjected to
changes, as compared to the bulk polymer.
- The loose layer: this third layer is loosely interacting with the second layer but still
affected chemically by its behavior and expected to exhibit different behavior from
the bulk. Its thickness is up to several tens of nanometers.

19
- The diffuse electric layer: Charge injection from nanoparticles to polymer matrix
often occurs resulting in the formation of charge distribution layer. This diffuse layer
is superposed to the 3 physical layers explained above.
Moreover, the overlapping of multiple interaction zones corresponding to several
nanoparticles might result in collaborative effects and further complication of the
resulting macroscopic behavior. Models treating this situation were also investigated
(Ioana Preda et al., 2014).
Figure 1-4: Multi-core model Taken from (Tanaka et al., 2005)
1.1.4 Nanoparticles vs. Microparticles in polymer based insulations
The performance of electrically insulating polymers is reflected by their resistance to
electrical degradation when placed in operational conditions. This degradation is a complex
phenomenon that depends on a multitude of interdependent parameters such as dielectric
losses, electrical conductivity, resistance to space charge accumulation as well as the thermal

20
and mechanical properties (Blythe & Bloor, 2005; Dissado & Fothergill, 1992). Although it
is a long-term process, the susceptibility of polymers to electrical degradation might be
reasonably evaluated by short-term measurements such as the short-term breakdown strength
or mid-term measurements such as the resistance to surface erosion by partial discharges.
Longer-term measurements such as voltage endurance and resistance to electrical treeing
remain the most trustable tools but unfortunately time consuming (Tian et al., 2012). An
exhaustive review of all the notions covered by the subject of electrical degradation of
polymers might be found in (Blythe & Bloor, 2005; Dissado & Fothergill, 1992; C. C. Ku &
Liepins, 1987).
To overcome the limitations faced by the existing polymer insulating materials, both
microparticles and nanoparticles with desired intrinsic properties were investigated.
Chronologically, microparticles raised interest first. In most of the cases, they resulted in
enhanced heat dissipation and resistance to surface erosion (M. Frechette et al., 2012; Huang
et al., 2011; Iyer, Gorur, & Krivda, 2012; Kochetov, Andritsch, Morshuis, & Smit, 2010;
Tanaka, Matsuo, & Uchida, 2008), unfortunately at the cost of reduced dielectric and
mechanical strengths (Fleming, Ammala, Casey, & Lang, 2008; Z. Li, Okamoto, Ohki, &
Tanaka, 2010). In fact, inorganic microparticles incorporated in a polymer matrix result in
the formation of defects and voids of micrometric size in the regions surrounding the
particles. These defects constitute zones of reduced mechanical strength and increased
electrical stress in addition to the distortion of the electric field which arises from the
mismatch in permittivities or conductivities between the polymer and the inorganic filler.
The increase of the electrical stress in these weak zones leads to initiation and propagation of
electrical trees, i.e. interconnected channels which are generally filled with gas, through the
polymer matrix and early dielectric failure (Blythe & Bloor, 2005; Danikas & Tanaka, 2009;
Dissado & Fothergill, 1992; C. C. Ku & Liepins, 1987; Z. Li et al., 2010).
Progressively, nanoparticles replaced microparticles in composites in order to avoid the
abovementioned issues. Given their excellent intrinsic properties, their nanoscale dimensions
and their high interfacial area, nanoparticles were reported to improve the overall dielectric

21
performance without sacrificing a specific property (Andritsch, 2010; Camargo et al., 2009;
Danikas & Tanaka, 2009; David & Fréchette, 2013; Michel F Fréchette et al., 2010; Heid,
2015; Pleşa et al., 2016; Tanaka et al., 2004). In fact, when nanoparticles are well dispersed,
the density and the size of defects are reduced. In addition, the distortion of the electric field
caused by the difference in conductivities or permittivities between the polymer and the
inorganic filler is less pronounced due to the small size of nanoparticles leading to more
homogeneous electric field distribution over the nanocomposite. Furthermore, nanoparticles
act as barriers resisting the penetration and propagation of electrical trees in the bulk of the
polymer insulation by the formation of traps to charge carriers (Danikas & Tanaka, 2009; Z.
Li et al., 2010; Tian et al., 2011, 2012). As a consequence, they induce higher breakdown
strength, resistance to surface erosion and resistance to electrical treeing while reducing
space charge accumulation and maintaining low dielectric losses (Andritsch, 2010; Danikas
& Tanaka, 2009; David & Fréchette, 2013; Michel F Fréchette et al., 2010; Heid, 2015; Z. Li
et al., 2010; Pleşa et al., 2016; Tanaka et al., 2004; Tiemblo et al., 2008). In this context,
Danikas et al. (Danikas & Tanaka, 2009) suggested that, in the presence of nanoparticles
impeding the flow of electrical charge carriers, three possible directions of electrical paths
can be considered as shown in Figure 1-5:
- Propagation of the electrical tree through the polymer without contacting the
nanoparticles (Figure 1-5(a)).
- Propagation of the electrical tree through the polymer contacting the nanoparticles but
without penetrating them (Figure 1-5(b)).
- Propagation of the electrical tree through the polymer contacting the nanoparticles
and circumventing them; the tree structure will grow partially at the polymer-
nanoparticle interface (Figure 1-5(c)).
In all these three cases, the electrical tree path is extended resulting in an increase of the time
required to produce dielectric failure and ultimately an increase of the lifetime of the
insulating material.

22
Figure 1-5: Effect of nanoparticles on the flow of electrical charge carriers in nanocomposites
Replotted from (Danikas & Tanaka, 2009)
1.1.5 Review of nanoparticles used in HV insulation systems
Several nanoparticles, mostly of spherical shape, such as Alumina (Al2O3), Silica (SiO2),
Zinc Oxide (ZnO) and Titanium Oxide (TiO2) were first studied as nanofillers for materials
used in HV insulation systems. Later, an increasing interest has been given to anisotropic
nanoparticles of 1D and 2D dimensions to achieve more advanced nanodielectrics, due to
their outstanding properties compared to their isotropic pairs. In the following paragraphs, a
review of the different types of nanoparticles that have been used in HV insulation is
presented. Furthermore, a classification of these nanocharges considering their chemical
nature, their geometry as well as their dielectric and thermal properties is adopted.
1.1.5.1 Metal oxide nanoparticles
Metal oxide nanoparticles have been extensively investigated in HV insulation materials.
Being either insulating such as Al2O3, SiO2 and magnesium oxide (MgO) or semiconductive
such as TiO2 and ZnO, these nanoparticles exhibit in general values of electrical conductivity
higher than those of insulating polymers such as polyethylene. When added in low weight
fractions (< 5wt%) to polymer matrices, some metal oxide nanoparticles, mainly SiO2, MgO
and ZnO were reported to improve the breakdown strength and voltage endurance and more
recently to supress space charge accumulation in the insulation matrix. These effects are
(a) (b) (c)

23
explained by the formation of trapping sites that reduce the mobility of charge carriers in the
polymer matrix including electrons, holes and ionic species, which results in an overall
reduction of the insulation conductivity (David & Fréchette, 2013; Fleming et al., 2008;
Hayase et al., 2006; Ju et al., 2014; Amir M Pourrahimi et al., 2016; Amir Masoud
Pourrahimi et al., 2016; Tian et al., 2011, 2012; Tian et al., 2015). For instance, Figure 1-6
reports a summary of the achieved improvements of breakdown strength in various insulating
polymer matrices induced by different concentrations of metal oxide nanoparticles (David &
Fréchette, 2013).
Before their use in nanocomposites, metal oxide nanoparticles are often coated or
functionalized with different groups such as silane coupling agents in order to reduce their
hydrophilic character and enable their proper distribution in hydrophobic insulating polymer
matrices (Amir M Pourrahimi et al., 2016; Amir Masoud Pourrahimi et al., 2016).
Figure 1-6: Relative impacts of selected nanoparticles on the breakdown strength of polymer insulation matrices
Taken from (David & Fréchette, 2013)

24
1.1.5.2 Nitride and Carbide nanoparticles
Several nitride and carbide nanoparticles such as silicon nitride (Si3N4), aluminium nitride
(AlN), boron nitride (BN) and silicon carbide (SiC) have been investigated in HV insulation
systems and HV accessories, particularly for their high thermal conductivities going up to
few hundreds W.m-1.K-1 (Huang et al., 2011). Among them, BN presents the advantage of
high thermal conductivity combined with low dielectric permittivity and excellent electrical
resistivity and thermal stability. Due to these attractive properties, BN nanoparticles and
nanoflakes have gained increasing interest recently (Golberg et al., 2010; Heid, 2015; Song et
al., 2012; Zhi et al., 2009).
1.1.5.3 Anisotropic nanoparticles
Layered and elongated nanoparticles such as nanoclays (David et al., 2013; Tomer et al.,
2011; B Zazoum, E David, & Anh Dung Ngô, 2014), BN nanotubes and nanosheets (Golberg
et al., 2010; Heid, 2015; Song et al., 2012; Terao et al., 2010; Zhi et al., 2009) as well as
graphene oxide (GO) and graphene (Fabiani, Mancinelli, Vanga-Bouanga, Fréchette, &
Castellon, 2016; MF Fréchette, Vanga-Bouanga, Fabiani, Castellon, & Diaham, 2015; Gaska,
Xu, Gubanski, & Kádár, 2017; Ghosh et al., 2008) have been also investigated in HV
insulation. These anisotropic nanoparticles usually feature outstanding properties in
preferential directions depending on their shape. In particular, nanoclays were reported to
induce a beneficial effect on breakdown strength in addition to their support to mechanical
strength while BN anisotropic nanoparticles input was mainly on the thermal conductivity
and resistance to surface erosion. Regarding graphene oxide and graphene, it was
demonstrated recently that their incorporation in small quantities (<0.1 wt%) to polymer
matrix reduces space charge accumulation (Y. J. Kim et al., 2013) in addition to
improvements in mechanical and thermal properties. More details regarding improvements
induced by anisotropic particles, mainly nanoclays and BN are discussed in the following
sections regarding the effects of nanoparticles shape and orientation on properties of
nanocomposites candidates for HV insulation.

25
1.1.6 Parameters affecting the role of nanoparticles in HV insulating materials
Several parameters affect the efficiency of the role of nanoparticles in the ultimate functional
properties of the nanocomposites: the size, the shape, the orientation and the state of
dispersion (nanoscale dispersion vs. agglomerations). In the following sections, selected
studies from the literature illustrate the effect of each parameter on several properties related
to the performance of HV insulating materials.
1.1.6.1 Effect of nanoparticles size
As discussed previously, decrease of nanoparticles size induces an increase of the interfacial
region fraction. In correlation with this effect, several dielectric properties such as the
breakdown strength and resistance to surface erosion were reported to increase. An
illustrative example was reported by Andritsch et al. (Andritsch et al., 2010) in their study of
the dielectric behavior of epoxy nanocomposites containing BN nanoparticles with various
diameters ranging from 70 nm to 5 μm. In particular, they observed an increase of the DC
breakdown strength with decreasing nanoparticles size. The maximum strength was achieved
at 10 wt % BN (70 nm) and corresponded to 40 % increase compared to the neat epoxy
(Figure 1-7). A similar trend was reported by Yang et al. (W. Yang et al., 2012) as well.
Figure 1-7: DC breakdown strength of BN/Epoxy as function of filler size
Taken from Andritsch et al. (Andritsch et al., 2010)

26
Regarding the resistance to surface erosion, multiple studies concluded that polymer matrices
filled with nanoparticles feature higher resilience compared to matrices filled with the same
concentrations of microparticles or even higher (M. Frechette et al., 2012; Iyer et al., 2012;
Tanaka et al., 2008). For example, Iyer et al. (Iyer et al., 2012) found out that epoxy matrix
filled with 5wt% silica nanoparticles perform slightly better than epoxy matrix containing 65
wt% of silica microparticles. Taking into consideration that the degradation in the samples
occurs exclusively through the polymer matrix which creates an erosion path growing
between the particles of higher thermal stability, this behavior can be explained by the fact
that nano-filled samples have longer erosion paths compared to micro-filled samples due to
reduced interparticle distance and hence increased tortuosity.
Thermal conductivity as well is affected by the size of particles. In this context, a recent
study performed by Kochetov et al. (Kochetov et al., 2010) on epoxy composites filled with
BN particles of different sizes from 70 nm to 5 μm has shown that thermal conductivity tends
to increase with increasing nanoparticles loading but features an optimum as function of BN
size at 0.5 μm. This behavior is probable related to facilitated formation of a thermal network
using submicron particles, as compared to either nanometric or micrometric particles. Few
other studies reported size dependence of thermal conductivity on the filler size but no
obvious trend was concluded (Reading, Vaughan, & Lewin, 2011).
1.1.6.2 Effect of nanoparticles shape and orientation
Some anisotropic nanoparticles such as nanotubes and nanoplatelets feature high aspect
ratios and considerably larger interfacial areas compared to their isotropic pairs, in addition
to the anisotropy of their intrinsic properties. Due to these features, the geometry and the
orientation of nanoparticles incorporated in polymer insulations was found to affect their
functional properties.
In this context, Tomer et al. (Tomer et al., 2011) studied the effect of alignment of nanoclays
on the dielectric properties of an 80/20 LLDPE/ LDPE polymer blend. Films with oriented
nanoclays were prepared in a twin-screw extruder whereas films with random distribution of

27
nanoparticles were obtained by hot-pressing a stack of 4 oriented films sequentially rotated
by п/4. The orientation of nanoparticles didn’t induce any particular effect on the low field
dielectric response of the PE matrix. In fact, all the nanocomposites were found to exhibit
similar losses that are approximately two orders of magnitude higher than the dielectric loss
of unfilled PE. However, the group reported that the nanocomposites with randomly oriented
fillers exhibit considerably higher losses when subjected to a high electric field (broader
Displacement-Electric field D-E loop as reported in Figure 1-8(a)) as well as lower
breakdown strength (Figure 1-8(b)), compared with nanocomposite containing oriented
fillers. They attributed these results to the fact that oriented-fillers samples are expected to
provide more ordered trapping sites and more efficient scattering for the injected charge,
limiting its ability to cross the sample to the opposite electrode. This scattering effect is
reduced for randomly dispersed fillers, even when they are in the form of high aspect ratio
particles such as nanoclays.
Figure 1-8: Effect of the nanofillers alignment on: (a) the Displacement-Electric field (D-E) loops and (b) the breakdown strength of polyethylene
Taken from (Tomer et al., 2011)
In the same context of orientation effect, Terao et al. (Terao et al., 2010) studied the effect of
the alignement of boron nitride nanotubes (BNNT) by electrospinning on the thermal
conductivity of BNNT/Polyvinyl alcohol (PVA) nanocomposites. They observed that in a
general trend, the increase of thermal conductivity induced by BNNT incorporation is higher
in the in-plane directions than along the thickness of the samples, regardless of the nanotubes
(a) (b)

28
orientation as reported in Figure 1-9. Upon alignement of 10 wt% BNNT along one axis, the
thermal conductivity value reaches 0.54 W.m-1.K-1 along the alignment axis and 0.27 W.m-
1.K-1 along the other in-plane direction compared to 0.16 W.m-1.K-1 for the neat PVA.
However, the values of thermal conductivity for the bioriented sample and the isotropic
sample are respectively equal to 0.38 and 0.26 W.m-1.K-1. This increase along the alignment
direction was attributed to the contribution of high axial thermal conductivity of BNNTs.
Figure 1-9: Thermal conductivity of BNNT/ PVA nanocomposite as function of the orientation
Taken from (Terao et al., 2010)
Regarding the impact of nanoparticles geometry, a good illustration of the effect of
nanoparticles shape on the dielectric behavior was reported in the work of Fabiani et al.
(Fabiani, Montanari, & Testa, 2010). In this study, the dielectric response of Ethylene-vinyl-
acetate (EVA) polymer matrix containing two clay particles featuring different aspect ratios
was investigated. It was found out that the dielectric loss and the electrical conductivity were
higher in the sample containing the nanofiller with the highest aspect ratio. This behavior
was attributed to favored formation of a conductive path between the absorbed water shells
surrounding the particles.

29
1.1.6.3 Effect of nanoparticles dispersion
The dispersion of nanoparticles is a key factor affecting the quality of the interfacial region
and consequently the engineering properties. In the specific case of nanodielectrics, the
thermal and dielectric properties are sensitive to the dispersion. Below, some illustrative
examples from the literature regarding the effect of dispersion are provided. In particular, the
engineering properties of samples containing agglomerated nanoparticles are compared to
samples featuring improved dispersion, achieved either by specific processing techniques or
by nanoparticles functionalization. For instance, Yang et al. (W. Yang et al., 2012) studied
the dissipation factor and the short-term breakdown strength of an epoxy matrix containing
respectively well dispersed nano ZnO particles vs. aggregated ZnO nanoparticles. The
improved dispersion was achieved by adding high shear mixing and ultrasonication steps to
the fabrication process. The group reported that the highest breakdown strength and the
lowest dielectric loss were achieved in the nanocomposite featuring well dispersed
nanoparticles due to more efficient scattering of charge carriers and reduced interfacial
polarization. In the same context, a recent study performed by Zazoum et al. (Bouchaib
Zazoum, Frechette, & David, 2016) investigated the dielectric loss of low density
polyethylene (LDPE) containing respectively untreated titanium dioxide (TiO2) nanoparticles
and TiO2 treated with Polyhedral Oligomeric Silsesquioxane (POSS) molecules. The surface
modification with POSS resulted in improved nanoscale dispersion of TiO2 nanoparticles that
was confirmed by atomic force microscopy (AFM). As a result of this improved dispersion, a
significant decrease of the dielectric loss was observed. Moreover, the dielectric strength of
the interfacial relaxation observed in the untreated nanocomposite was reduced and the peak
shifted toward lower frequencies indicating that most likely the effective electrical
conductivity of the nanofillers was reduced after functionalization with POSS. As far as
thermal conductivity and resistance to surface erosion are concerned, it was demonstrated
that the dispersion quality might have an important impact as well. In recent publications by
Heid et al. (Heid, Fréchette, & David, 2015, 2016), it was found out that 1 wt% of reactive
POSS molecules incorporated in an epoxy matrix and evenly distributed at the nanoscale led
to an increase of thermal conductivity by 20%. However, the sample containing non-reactive

30
POSS exhibited an increase of only 10%. Moreover, it was observed that the resistance to
surface erosion of the sample containing reactive POSS was improved with increasing POSS
loading while the opposite effect was observed in the sample containing non-reactive POSS
due to the formation of agglomerations.
1.2 Control of morphology: application to nanodielectrics
As discussed in the previous sections, several parameters affect the performance of
nanocomposites and specifically nanodielectrics, including the quality of dispersion and
orientation. Recently, new approaches that might help improving the dispersion and more
importantly controlling the selective localization and orientation of nanoparticles are being
investigated. These approaches are based on the use of multi-phase polymer matrices as
structure-guiding hosts to tailor nanoparticles dispersion, such as polymer blends and block
copolymers which are self-assembled according to specific morphologies at micro and
nanoscale respectively (Carastan et al., 2013; Carastan et al., 2014; Chipara, Artiaga, Lau,
Chipara, & Hui, 2017; Kao et al., 2013; Yao Lin et al., 2005; Park et al., 2003; Sarkar &
Alexandridis, 2015). In these multi-component systems, the control of dispersion and spatial
distribution can be ensured based on the matrix ordered morphology and the affinity of the
studied nanoparticles to one phase or another. In the last decades, several studies have
investigated this approach for various applications including mainly microelectronics,
polymer solar cells and optical sensors (As’habi et al., 2013; H. Choi et al., 2013; F. Li, Shi,
Yuan, & Chen, 2013; Park et al., 2003; Sarkar & Alexandridis, 2015). However, only few of
them addressed the field of dielectrics and more specifically HV electrical insulation. In the
following sections, selected published studies on tailored dispersion of nanoparticles in block
copolymers, polymer blends and polymer/block copolymer blends are presented with focus
on dielectric applications.
1.2.1 Block copolymer nanocomposites
The control of nanoparticles dispersion in block copolymer hosts depends on few important
criteria including the affinity between the selected nanoparticles and each phase of the block

31
copolymer, the nanostructure of the block copolymer as well as the geometry of the
nanoparticles and the block copolymer nanodomains. In particular, some combinations of
respectively nanoparticle geometries and block copolymer morphologies offer larger
interfacial area (Bockstaller, Mickiewicz, & Thomas, 2005). Besides, the size of the
nanoparticles, in comparison to the characteristic length scales of the block copolymer
domains, might affect their selective localization and the block copolymer ordered structure,
taking into account the thermodynamic constraints (Sarkar & Alexandridis, 2015).
Tailored dispersion of different nanoparticles, mainly of spherical shape, in block
copolymers was reported in the literature (H. Choi et al., 2013; F. Li et al., 2013; T.-I. Yang
& Kofinas, 2007). For instance, Li et al. (F. Li et al., 2013) studied the dispersion of ZnO
nanoparticles in a poly(3-hexylthiophene)-b-poly(ethylene oxide) (P3HT-b-PEO) diblock
copolymer matrix in comparison with ZnO dispersion in P3HT homopolymer matrix. The
analysis of both types of nanocomposites processed in the same conditions by TEM revealed
that fine and uniform dispersion of ZnO nanoparticles was achieved in the block copolymer
while large clusters of ZnO nanoparticles were formed in P3HT matrix (Figure 1-10).
Furthermore, the ZnO nanoparticles were preferentially located in the PEO nanometric
domains. The group attributed this improved dispersion and selective localization to the
favorable interaction between the oxygen atoms of the PEO backbone and ZnO
nanoparticles.
Figure 1-10: TEM images of: a) P3HT/ZnO nanocomposite and b) P3Ht-b-PEO/ZnO nanocomposite Taken from Li et al. (F. Li et al., 2013)

32
Recently, controlled dispersion of anisotropic nanoparticles in block copolymers has been
investigated as well (Carastan et al., 2014; Chipara et al., 2017; Peponi et al., 2009). As an
illustration, the recent study carried out by Carastan et al. (Carastan et al., 2014) investigated
the dispersion of clay nanoplatelets in polystyrene-b-poly(ethylene-co-butylene)-b-
polystyrene (SEBS) triblock copolymer. The studied block copolymer features an
hexagonally packed cylindrical morphology and is composed of two PS endblocks in the
form of cylinders surrounded by an elastomer PEB midblock. The group reported successful
orientation of nanoclays and PS nanodomains achieved using tape extrusion technique.
Besides, clay nanoplatelets structure, i.e. exfoliated vs. intercalated, and their location in
either PS block or PEB block were tuned through a maleic anhydride (MA) graft attached to
the PEB rubber block.
In the field of dielectric applications, few block copolymers gained attraction either for their
nanostructure or for their functional properties such as their good electromechanical coupling
(B. Kim et al., 2011). As far as the nanostructure is concerned, it was demonstrated that the
breakdown strength of a block copolymer is highly sensitive to its ordered nanostructure. For
example, polystyrene-b-poly(methyl methacrylate) (PS-b-PMMA) block copolymer with
highly oriented lamellar morphology featured great enhancement of breakdown strength
compared to unordered films prepared by solvent casting (Samant et al., 2016). The
enhancement was attributed to the fact that the multiple interfaces between the lamellae
block components act as barriers to the flow of electric charge carriers. This behavior has an
important potential to design nanodielectrics with high energy density for instance. Styrenic
block copolymers, as part of the category thermoplastic elastomers, were among those
recently investigated within the scope of actuation properties. The main objective of their use
was the design of sophisticated, light-weight and shape-flexible high dielectric permittivity
polymer nanocomposites intended for service in embedded capacitors, piezoelectric and
pyroelectric sensors, microwave communication devices and/or dielectric elastomer actuators
(Kofod et al., 2011; Mc Carthy, Risse, Katekomol, & Kofod, 2009; Mi, Li, Turng, Sun, &
Gong, 2014; Saleem, Thunga, Kollosche, Kessler, & Laflamme, 2014; Stoyanov, Kollosche,
Risse, McCarthy, & Kofod, 2011; T.-I. Yang & Kofinas, 2007). In general, the two main

33
approaches to achieve this type of nanocomposites, which are based on the use of either high
dielectric permittivity ceramics or conductive particles (sub-percolation loadings), induce
relatively high dielectric losses; a design limitation for the cited applications. Interestingly,
through tailoring the size distribution of nanoparticles and their spatial distribution in block
copolymers featuring highly periodic nanostructures, structural heterogeneities and
agglomerations contributing to the increase of dielectric losses might be significantly reduced
(T.-I. Yang & Kofinas, 2007).
In HV electrical insulation, the use of styrenic block copolymers is mainly limited to their
role as compatibilizers to improve nanoparticles dispersion (Liang & Tjong, 2006) or as
water treeing retardant agents (Liu et al., 2011; Z. Ma et al., 2010). However, their potential
as nanostructured template matrices is not fully exploited yet.
1.2.2 Polymer blend nanocomposites
Recently, a need to replace commercial cross-linked polyethylene (XLPE) cables, currently
on the market, has progressively emerged due to their vulnerability to space charge
accumulation induced by the crosslinking by-products, which makes XLPE non-recyclable
and unsuitable for increased HV ratings and especially HVDC cables (Fu, Chen, Dissado, &
Fothergill, 2007; Ghorbani et al., 2014; Amir M Pourrahimi et al., 2016; Amir Masoud
Pourrahimi et al., 2016). Unfortunately, the crosslinking is required in current HV cable
insulations to improve the mechanical and thermal stability of LDPE, which is the most
common polymer insulation used in HV cables (Arora & Mosch, 2011).
In this context, polymer blends have been investigated since the last decades in order to
improve the performance of LDPE and ultimately avoid crosslinking. In this context, Hosier
et al. (I. Hosier, Vaughan, & Swingler, 1997) studied the effect of the presence of a dispersed
high density polyethylene (HDPE) phase on the breakdown strength of an LDPE matrix. The
prepared blends were subjected to thermal annealing at two different temperatures: 115 °C
and at 124 °C. The group reported a clear improvement of the breakdown strength in blends

34
containing HDPE fractions above 7% and annealed at 115 °C, whereas, in those annealed at
124 °C, a slight improvement occurred only above 17% of HDPE. Below these limits, both
types of blends featured a reduction in the breakdown strength compared to the pure LDPE.
These behaviors were correlated with changes in spherulite structures upon blending HDPE
with LDPE. In particular, it was concluded that morphologies based upon small well
distributed HDPE-rich inclusions achieved at 124 °C (compact spherulites which did not
interpenetrate) lead to lower breakdown strength while space-filling spherulites, achieved at
115 °C, cause the tree to adopt a more extended path or, in the extreme cases where they
impinge, force the tree to penetrate the highly crystalline material leading to higher
breakdown strength compared to the pure LDPE.
To improve further the properties of LDPE/HDPE blends, incorporation of nanoparticles has
been investigated as well. For example, Zazoum et al. (B Zazoum et al., 2014) investigated
the effect of organically modified nanoclays on the dielectric properties of a blend containing
80 wt% LDPE and 20 wt% HDPE. They observed that the incorporation of 5 wt% nanoclays
in the blend induced a consistent increase of the breakdown strength equal to 17%. This
improvement was extended further to 22% when polyethylene grafted maleic anhydride (PE-
MA) was used as compatibilizer. This behavior was correlated with microscopy results
confirming the achievement of better intercalated/exfoliated nanoclays structure in the
compatibilized blend nanocomposites.
Recently, other alternatives have been investigated. In fact, high density polyethylene
(HDPE) and especially Polypropylene (PP) feature better thermal and mechanical stability,
compared to LDPE, due to their higher melting points (Arora & Mosch, 2011). Therefore,
they might constitute potential candidates for recyclable HV insulation materials, considering
the omitted need for crosslinking. However, these materials suffer from increased brittleness
at low temperatures. To adapt better their properties to the purpose of recyclable HV
insulations, blending was investigated again as one of the solutions. In particular, blends with
thermoplastic elastomers such as ethylene-vinyl-acetate (EVA) and polyolefin elastomers
were considered (I. Hosier, Vaughan, & Tseng, 2007; I. L. Hosier, Vaughan, & Swingler,

35
2010; Y. Zhou, He, Hu, Huang, & Jiang, 2015). It was found out that such blends feature
considerably improved mechanical flexibility and occasionally improved electrical
resistivity. Nevertheless, reduction of breakdown strength and increase of space charge
accumulation, a key property for HVDC cable insulation, were unfortunately inevitable after
blending. To cope with these drawbacks while taking advantages from the blends properties,
several nanoparticles have been added, among them: ZnO and BN (Dong, Han, & Han, 2012;
Du, Xu, Li, & Li, 2016; D.-L. Zhang et al., 2017). For instance, Du et al. (Du et al., 2016)
reported that the addition of ZnO nanoparticles to PP/Polyolefin elastomer (POE) blends
results in suppression of space charge accumulation, encountered in the unfilled blend, while
maintaining the excellent flexibility ensured by the POE phase. This reduction of space
charge accumulation is due to increased trap level density and consequently reduced charge
injection upon the addition of ZnO nanoparticles. The maintained mechanical flexibility of
the blend is more likely related to the fact that the majority of ZnO nanoparticles migrated to
PP phase during the processing and consequently didn’t affect the mechanical flexibility of
POE phase. In the same line of research, another blend nanocomposite containing a
thermoplastic elastomer was recently investigated by Zhang et al. (D.-L. Zhang et al., 2017).
In this system, the main matrix is PP and the selected thermoplastic elastomer is polystyrene-
b-poly(ethylene-co-butylene)-b-polystyrene (SEBS) while the nanoparticles are Boron
Nitride nanosheets (BNNS), known for their excellent thermal conductivity and electrical
insulation. The proportions of PP and SEBS in the blend are respectively equal to 35 and 65
wt%. In this blend, BNNS were selectively located in SEBS phase. At 3wt% loading, these
high aspect ratio nanoparticles simultaneously formed a thermal network inside the SEBS
phase and induced a morphology change in the blend from dispersed SEBS phase to co-
continuity, leading to a “double percolation” phenomenon as described by the authors. This
selective location of BNNS and specific configuration of the blend induced great
enhancement of thermal conductivity in addition to reduction of space charge accumulation
and increase of breakdown strength. Another example of a successful controlled dispersion in
a conventional HV insulating material induced by blending has been reported by Peng et al.
(Peng, Xu, Li, Zhang, & Zheng, 2016). In this work, an epoxy resin was blended with an
amphiphilic triblock copolymer composed of a poly(POSS) midblock and two

36
polycaprolactone (PCL) endblocks. The PCL block is miscible with epoxy while the
poly(POSS) midblock self-assembles in the form of non-spherical domains of size 20-50 nm
well distributed within the epoxy matrix. This periodic organization allowed a consistent
reduction of the dielectric permittivity compared to unfilled epoxy combined with an
enhancement of the surface hydrophobicity.
1.3 Review of the materials
In this section, a review of the polymers and nanoparticles that were investigated in this
project is presented. In particular, the choice of cost-effective nanoparticles is emphasized.
1.3.1 Polyethylene
Polyethylene (PE) is a polycrystalline polymer belonging to the family of polyolefins. It
features a simple hydrocarbon structure and can be obtained with different molecular weights
and branching degrees, with the highest branching occurring in low density polyethylene
(LDPE). Moreover, its semi-crystalline structure with crystalline/amorphous interfaces
provides traps that reduce charge carriers mobility and the overall electrical conductivity
(Figure 1-11). Therefore, it is already considered as a nanodielectric, even without the
incorporation of nanometric fillers (Ieda, 1984; Lewis, 2014). In HV insulating materials
industry, PE is attractive due to its excellent electrical resistivity, high breakdown strength
and good processability by melt compounding techniques. Currently, cross-linked low
density polyethylene (XLPE) is the most widely used form of PE in HV cable insulation. The
crosslinking is particularly important to improve the thermal and mechanical stability of
LDPE at increased temperatures as mentioned previously (Arora & Mosch, 2011; Amir M
Pourrahimi et al., 2016; Amir Masoud Pourrahimi et al., 2016). Unfortunately, it renders the
insulating material unrecyclable and sensitive to space charge accumulation (Fu et al., 2007;
Ghorbani et al., 2014). Compared to LDPE, high density polyethylene HDPE features higher
thermal stability but has been less common in cable insulation due to its relatively high
rigidity (Arora & Mosch, 2011). However, recently it has been investigated in several blends
in the objective of designing insulating materials suitable for HV insulation without the need

37
of crosslinking (I. Hosier et al., 1997; I. Hosier et al., 2007; I. L. Hosier et al., 2010). In this
project, HDPE was investigated in a blend with SEBS thermoplastic elastomer.
Figure 1-11: Morphology of polyethylene: amorphous and crystalline regions
Taken from (Lewis, 2014)
1.3.2 SEBS thermoplastic elastomer
Polystyrene-b-poly(ethylene-co-butylene)-b-polystyrene (SEBS) is a triblock copolymer
composed of two polystyrene (PS) endblocks and a poly(ethylene-co-butylene) (PEB)
midblock that belongs to the family of styrenic thermoplastic elastomers. Its chemical
formula is reported in Figure 1-12.

38
Figure 1-12: Schematic description of SEBS block copolymer: (a) without maleic anhydride (MA) ("Polystyrene-block-poly(ethylene-ran-butylene)-block-polystyrene,") and (b) with MA graft attached to PEB block ("Polystyrene-block-poly(ethylene-ran-butylene)-block-
polystyrene-graft-maleic anhydride,")
Being a block copolymer, SEBS features self-assembled nanodomains that vary from
lamellar to spherical depending mainly on the styrene fraction (Carastan et al., 2013;
Carastan et al., 2014; Carastan, Demarquette, Vermogen, & Masenelli-Varlot, 2008).
Moreover, it exhibits excellent mechanical properties combining both the thermoplastic and
the elastomer behaviors (Balsamo et al., 2006; Holden et al., 2004). Besides, its
hydrogenated polybutadiene midblock has a structure equivalent to the structure of PE in its
amorphous form, which ensures a good compatibility with PE and polyolefins in general
(Agari et al., 1993). Simultaneously, the relatively polar aromatic rings of PS block exhibit
chemical affinity to several inorganic nanoparticles such as nanoclays and carbon nanotubes
(CNT) (Carastan et al., 2014; Kuester, Barra, Ferreira Jr, Soares, & Demarquette, 2016).
Therefore, SEBS and especially SEBS grafted maleic anhydride (MA) were recently widely
used either as matrices or compatibilizers in blends with polyolefins to improve the
dispersion of inorganic nanoparticles including nanoclays, metal oxides and CNT, and to
compensate for toughness decrease induced by their incorporation in polymer matrices
(Carastan et al., 2014; Kuester et al., 2016; Liang & Tjong, 2006).
In dielectric applications, SEBS has been also investigated, as mentioned in previous
sections, mainly as a water treeing retardant agent for cable insulation (Liu et al., 2011; Z.
Ma et al., 2010) or as a dielectric elastomer actuator (Kofod et al., 2011; Mc Carthy et al.,
2009; Mi et al., 2014; Saleem et al., 2014; Stoyanov et al., 2011; T.-I. Yang & Kofinas,
2007). In addition to these attractive functional properties, it started recently to gain
(a) (b)

39
attraction, among other thermoplastic elastomers, in the design of recyclable
polyolefin/thermoplastic elastomer blends suitable for HV insulation and especially for
HVDC cable insulation (D.-L. Zhang et al., 2017).
In this study, SEBS was investigated first as a template block copolymer matrix to evaluate
the effect of controlled dispersion and spatial distribution of nanoparticles on the dielectric,
electrical and thermal properties of nanodielectrics; an approach that has not yet been widely
studied in this field. In particular, different grades of SEBS with various PS block fractions
and subsequently various morphologies of the block copolymer were studied. In a second
step, SEBS was investigated in a blend with HDPE where both its functional properties and
nanoarchitecture are taken into account to design nanocomposites with improved dielectric
performance intended for use in HV insulation.
1.3.3 Zinc Oxide nanoparticles
Zinc oxide (ZnO) is a large band gap semi-conductor material characterized by its nonlinear
electrical conductivity (Hong, Schadler, Siegel, & Mårtensson, 2006; Varlow, Robertson, &
Donnelly, 2007), relatively high thermal conductivity (around 60 W.m-1.K-1 compared to 0.33
W.m-1.K-1 for LDPE and 2000 W.m-1.K-1 for diamond according to (Huang et al., 2011)) and
ability to shield UV light that can be released during partial discharges for instance (S. Chen,
Huang, Peng, Wang, & Cheng, 2010). Similar to other metal oxides, ZnO nanoparticles were
studied in polymer nanocomposites for insulation applications, mainly PE based (Fleming et
al., 2008; Amir M Pourrahimi et al., 2016; Amir Masoud Pourrahimi et al., 2016; Tian et al.,
2011, 2012; Tian et al., 2015). As mentioned in paragraph 1.1.5.1, the undertaken research
into the properties of these nanocomposites demonstrated the ability of ZnO nanoparticles to
relieve local electrical stress concentration and consequently to homogenize electric field
distribution, which hinders the growth of electrical trees within the nanocomposite. Besides,
they were reported to increase traps density in the insulating matrix leading to decrease of
charge carriers’ mobility (Tian et al., 2011). In correlation with these features, significant
reduction in space charge accumulation and improved resistance to surface erosion and
electrical treeing were observed in ZnO-containing nanocomposites.
40
In addition to the functional properties, the geometry of ZnO nanoparticles can be tailored
into a broad range of particle sizes and shapes using mainly chemical routes. Moreover, their
surface can be modified to increase their hydrophobicity and ultimately improve their
compatibility with organic polymer matrices. Both the processes of synthesis and surface
functionalization of these nanoparticles are relatively simple and cost-effective (Amir M
Pourrahimi et al., 2016). In this project, commercial ZnO nanoparticles of spherical shape
and functionalized with an alkyl ammonium salt were used.
1.3.4 Organically modified Montmorillonite Clay
Smectite clays such as Montmorillonite are the inorganic particles most used in
nanocomposites. They belong to the phyllosilicates family characterized by a 2:1 structure
built of layers; each of them is composed of aluminium or magnesium hydroxide octahedral
sheet sandwiched between two silicon oxide tetrahedral sheets, as illustrated in Figure 1-13.
The layers are placed on the top of each other’s forming stacks. Besides, Van Der Waals and
weak electrostatic interactions occur between them and result in the creation of interlayer
spaces or galleries where exchangeable cations reside. The thickness of the constitutive
layers is around 1 nm while the lateral dimensions may vary from 30 nm to several microns
leading to high aspect ratio and large surface area that dominate the interactions of these
particles with polymers (Anadão, 2012; Choudalakis & Gotsis, 2009; Nguyen & Baird, 2006;
Powell & Beall, 2006).

41
Figure 1-13: Crystal structure of phyllosilicates Taken from Thomas el al. (Thomas & Zaikov, 2008)
Layered clays are hydrophilic in their pristine state. Therefore, for non-polar polymer
matrices, an organic treatment on the clay surface is needed to obtain satisfactory dispersion.
The most commonly used organic treatment is based on quaternary ammonium salts, which
can have a variety of chain lengths (Choudalakis & Gotsis, 2009; Powell & Beall, 2006).
Depending on the polymer matrix, the selected organic modification and the processing
method, two main types of clay structures can be obtained as illustrated in Figure 1-14:
intercalated and exfoliated. In the case of untreated clays or inappropriate surface
functionalization, the layers don’t separate and the clay particles remain in the initial form of
stacks or tactoids.
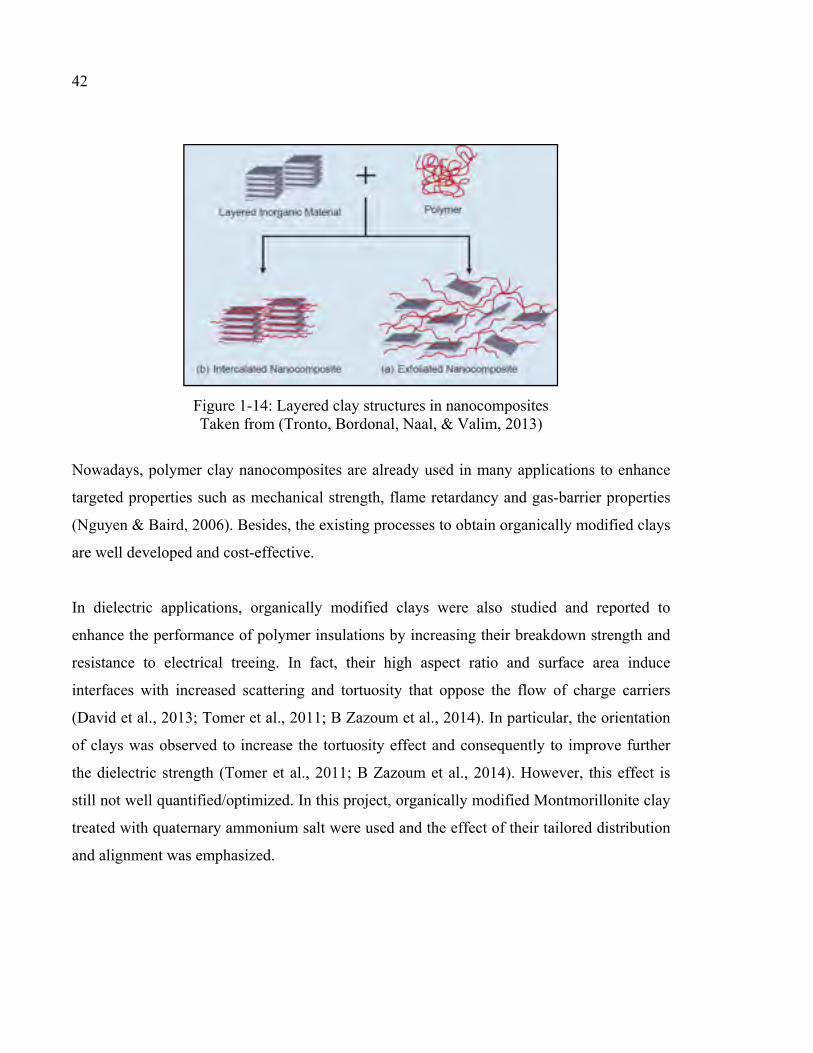
42
Figure 1-14: Layered clay structures in nanocomposites Taken from (Tronto, Bordonal, Naal, & Valim, 2013)
Nowadays, polymer clay nanocomposites are already used in many applications to enhance
targeted properties such as mechanical strength, flame retardancy and gas-barrier properties
(Nguyen & Baird, 2006). Besides, the existing processes to obtain organically modified clays
are well developed and cost-effective.
In dielectric applications, organically modified clays were also studied and reported to
enhance the performance of polymer insulations by increasing their breakdown strength and
resistance to electrical treeing. In fact, their high aspect ratio and surface area induce
interfaces with increased scattering and tortuosity that oppose the flow of charge carriers
(David et al., 2013; Tomer et al., 2011; B Zazoum et al., 2014). In particular, the orientation
of clays was observed to increase the tortuosity effect and consequently to improve further
the dielectric strength (Tomer et al., 2011; B Zazoum et al., 2014). However, this effect is
still not well quantified/optimized. In this project, organically modified Montmorillonite clay
treated with quaternary ammonium salt were used and the effect of their tailored distribution
and alignment was emphasized.

CHAPITRE 2
ARTICLE 1: STYRENIC BLOCK COPOLYMER-BASED NANOCOMPOSITES: IMPLICATIONS OF NANOSTRUCTURATION AND NANOFILLER TAILORED
DISPERSION ON THE DIELECTRIC PROPERTIES
E. Helal a, N.R.Demarquette a, L.G. Amurin a, E. David a a Department of Mechanical Engineering, Ecole de Technologie Supérieure,
Montreal, QC, Canada
D.J. Carastan b b Federal University of ABC, Santo André, SP, Brazil
M. Fréchette c c Institut de Recherche d’Hydro-Québec, Varennes, QC, Canada
This article has been published in:
Polymer, Volume 64, 1 May 2015, Pages 139–152
http://dx.doi.org/10.1016/j.polymer.2015.03.026
Abstract
In this work, the effect of controlling the morphology on the dielectric properties of triblock
copolymers and their clay-containing nanocomposites was evaluated. Two different
copolymers: polystyrene-b-poly(ethylene-co-butylene)-b-polystyrene (SEBS) and SEBS
grafted with maleic anhydride were used for that purpose. Morphologies with different
degrees of intercalation, exfoliation and orientation were obtained and tested. At the highest
state of dispersion, achieved at a clay loading equal to 5wt%, 50% of clay nanoplatelets were
individually dispersed and located within the PEB soft domain of the block copolymer and a
maximum of interfacial polarization and a minimum of dynamic mechanical damping factor
were respectively exhibited. When the nanoclays were oriented, the dielectric loss due to
nanoclays conductivity contribution was reduced up to 2 orders of magnitude at high
CHAPTER 2

44
temperatures and low frequencies and the AC short-term breakdown strength increased up to
45%.
Keywords: block copolymer; tailored dispersion; dielectric properties…
2.1 Introduction
“Nanodielectrics” or nanocomposite dielectrics are a new generation of dielectric materials
containing fillers that have at least one dimension less than 100 nm (Michel F Fréchette et al.,
2010). This class of materials is gaining a lot of interest aiming at developing dielectrics with
distinct properties originating from the intrinsic properties of the nanofillers and mostly from
the important interfacial region introduced due to the huge surface area of the nanofillers
(Lewis, 2004; Roy et al., 2005). Several publications over the last decade proved the
efficiency of nanofillers at improving several aspects related to the dielectric performance of
insulating polymers in applications such as cable insulation (David & Fréchette, 2013; M.
Fréchette, 2009), high energy storage capacitors (Dang, Yuan, Yao, & Liao, 2013) and
dielectric elastomer actuators (McCarthy et al., 2012). In these studies, different types of
nanofillers and polymers have been tested.
In terms of nanofillers, nanoclays were the most common nanoparticles used due to their
relatively low cost. More specifically, organically-modified nanoclays have been the
nanoparticles of choice since their surface modification made them more compatible with
organic polymer media (Carastan & Demarquette, 2007; Lei, Hoa, & Ton-That, 2006). These
nanoparticles have proved their positive role in improving the mechanical properties of
polymers and in few studies in improving their dielectric properties. In effect, it was
demonstrated that nanoclay addition and orientation has an influence on the high field
properties of polyolefins such as the short-term breakdown strength (David et al., 2013; Liao
et al., 2013a; Liao, Li, Bai, Yang, & Gu, 2014; Tomer et al., 2011). In this context, David et
al. (David et al., 2013) reported an increase up to 15% of the breakdown strength of low
density polyethylene (LDPE) matrix filled with a low content of nanoclay equal to 3wt%.
This improvement was combined with an increase of the dielectric loss by roughly two
orders of magnitude. They attributed the increase of the breakdown strength to the exfoliated

45
structure of nanoclays and the high dielectric loss to the high conductivity along the clay
nanoplatelets. Also, Tomer et al. (Tomer et al., 2011) reported an increase of the breakdown
strength by 20% upon the alignment of nanoparticles in LDPE containing 6 wt% nanoclay
whereas they observed a deterioration in the breakdown strength and consequently in the
maximum recoverable energy when nanoclays are randomly oriented. The authors reported
as well an increase of the dielectric loss by two orders of magnitude in both types of
nanocomposites with either random or aligned nanoclays.
In terms of polymers, styrenic block copolymers constitute interesting candidates which
represent an important part of the current market of thermoplastic elastomers. In fact, these
materials exhibit attractive mechanical properties due to their combination of a soft elastomer
phase and a hard polystyrene phase. Furthermore, as block copolymers, this class of materials
presents the advantage of being self-assembled at the nanoscale in unique morphologies such
as lamellar, cylindrical and spherical hard domains distributed within the elastomer domains.
The shape of these ordered structures depends on the chemical composition, molar mass of
the blocks, affinity between the blocks and processing method (Mai & Eisenberg, 2012). In
the field of nanocomposites, this ability to control their spatial organization makes styrenic
block copolymers attractive as promising template matrices for selective dispersion of
nanoparticles with competitive mechanical properties (Bockstaller, Lapetnikov, Margel, &
Thomas, 2003; Bockstaller et al., 2005; Chiu, Kim, Kramer, & Pine, 2005). In this context, a
great number of recent publications were related to block copolymer-based nanocomposites
with tailored dispersion of nanofillers. Among them, the studies performed by Carastan et al.
(Carastan et al., 2014; Carastan, Vermogen, Masenelli‐Varlot, & Demarquette, 2010) show
that selective dispersion and orientation of nanoclays were successfully achieved in a triblock
copolymer. The published researches treated various applications such as polymer solar cells
(H. Choi et al., 2013; F. Li et al., 2013) and block copolymer electrolytes (Hur & Bae, 2015).
They demonstrated that the orientation as well as the location of nanoparticles seems to affect
the resulting properties. To the best of our knowledge, only few of these studies addressed
the field of dielectric applications (H. Chen, Hassan, Peddini, & Mauritz, 2011; Mc Carthy et
al., 2009; Vo, Anastasiadis, & Giannelis, 2011) in spite of the fact that thermoplastic

46
elastomers could represent promising candidates for dielectric elastomer actuators (Mc
Carthy et al., 2009) or styrenic block copolymer/polyolefin blends for high voltage insulation
(Liu et al., 2011).
In this paper, the dielectric properties of polystyrene-b-poly(ethylene-co-butylene)-b-
polystyrene (SEBS), an interesting thermoplastic elastomer widely used (Arevalillo, Muñoz,
Santamaría, Fraga, & Barrio, 2008; Carastan et al., 2013; Carastan et al., 2008; S. Choi, Lee,
& Han, 2004; Ganguly, Bhowmick, & Li, 2008; Jeong et al., 2003), and its nanocomposites
containing clay nanoparticles were investigated as function of various parameters related at
times to the nanofillers and other times to the SEBS structure. In this context, the effect of
clay dispersion (intercalated vs. exfoliated), clay location (within the hard or soft phase), clay
concentration and clay orientation were evaluated. Besides, the effect of SEBS morphology
was studied. In particular, two types of SEBS structures, namely a hexagonal structure where
polystyrene cylinders are distributed within the rubber phase and a lamellar structure formed
by alternating polystyrene and rubber layers, were evaluated. The structures of SEBS
nanocomposites studied were characterized by different tools such as TEM, SAXS and
DMA. The complex dielectric permittivity and breakdown strength of these nanocomposites
were also evaluated and correlated to the different structures.
2.2 Materials and experimental characterization
2.2.1 Experimental strategy
In the nanocomposites studied in this paper, four microstructural aspects have been
controlled, by varying the processing technique, in order to highlight their effects on the
dielectric properties:
- Dispersion and location of nanoclays: two different grades of SEBS, one of them
modified with a maleic anhydride (MA) group grafted to its rubber phase and the
other without any modification, were used in order to tailor the location and state of
exfoliation of nanoclays. In the pure SEBS, intercalated nanoclays located within the

47
polystyrene (PS) domain were achieved while in the SEBS modified with maleic
anhydride, exfoliated nanoclays located at the interface between the PS and the
rubber domains were obtained. In fact, the grafted group has the greatest affinity to
nanoclays and consequently attracts them to the interface (Carastan et al., 2014).
- Amount of surface area of nanoparticles: three different nanoclay concentrations were
studied: 2.5, 5 and 7.5%.
- Orientation of nanoclays: two different techniques were used to control the
orientation of the PS domain and consequently the orientation of nanofillers:
extrusion process vs. solution casting. In particular, oriented nanoclays have been
obtained by extrusion while random nanoclay distribution has been achieved in the
nanocomposites prepared by solution casting (Carastan et al., 2014).
- Structures of SEBS: An oriented hexagonal structure, where oriented PS cylinders
were dispersed within the rubber phase, was obtained by the extrusion process.
Furthermore, the solution casting process was adapted to achieve respectively random
hexagonal structure vs. random lamellar structure. The hexagonal structure was
obtained when the solution casting process was accompanied by a specific thermal
treatment while the lamellar structure was obtained when no thermal treatment was
applied.
The details of experimental procedures to reach those morphologies are explained in the
following section.
2.2.2 Materials and methods
Two grades of triblock copolymer SEBS donated by Kraton were used: G1652 and FG1901.
The G1652 contains 30 wt % of polystyrene PS endblocks dispersed in the form of cylinders
within a hydrogenated polybutadiene PEB midblock matrix. Its density is equal to 0.915
g/cm3. The FG1901 has the same composition with a maleic anhydride MA group grafted to
the PEB midblock. Following, the G1652 and the FG1901 will be respectively referred to as
SEBS and SEBS_MA. Montmorillonite clay grade Cloisite 20A from Southern Clay
(Gonzales, USA), modified with dimethyl di (hydrogenated tallow) quaternary ammonium
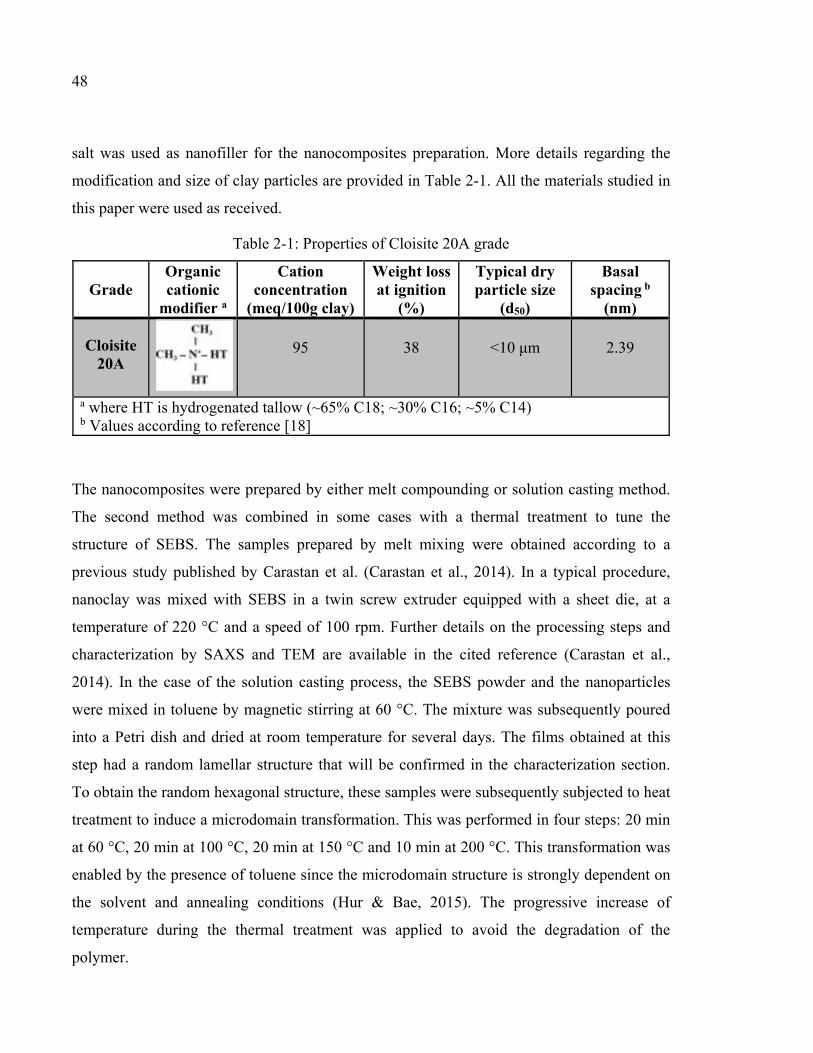
48
salt was used as nanofiller for the nanocomposites preparation. More details regarding the
modification and size of clay particles are provided in Table 2-1. All the materials studied in
this paper were used as received.
Table 2-1: Properties of Cloisite 20A grade
Grade
Organic cationic
modifier a
Cation concentration
(meq/100g clay)
Weight loss at ignition
(%)
Typical dry particle size
(d50)
Basal spacing b
(nm)
Cloisite 20A
95
38
<10 μm
2.39
a where HT is hydrogenated tallow (~65% C18; ~30% C16; ~5% C14) b Values according to reference [18]
The nanocomposites were prepared by either melt compounding or solution casting method.
The second method was combined in some cases with a thermal treatment to tune the
structure of SEBS. The samples prepared by melt mixing were obtained according to a
previous study published by Carastan et al. (Carastan et al., 2014). In a typical procedure,
nanoclay was mixed with SEBS in a twin screw extruder equipped with a sheet die, at a
temperature of 220 °C and a speed of 100 rpm. Further details on the processing steps and
characterization by SAXS and TEM are available in the cited reference (Carastan et al.,
2014). In the case of the solution casting process, the SEBS powder and the nanoparticles
were mixed in toluene by magnetic stirring at 60 °C. The mixture was subsequently poured
into a Petri dish and dried at room temperature for several days. The films obtained at this
step had a random lamellar structure that will be confirmed in the characterization section.
To obtain the random hexagonal structure, these samples were subsequently subjected to heat
treatment to induce a microdomain transformation. This was performed in four steps: 20 min
at 60 °C, 20 min at 100 °C, 20 min at 150 °C and 10 min at 200 °C. This transformation was
enabled by the presence of toluene since the microdomain structure is strongly dependent on
the solvent and annealing conditions (Hur & Bae, 2015). The progressive increase of
temperature during the thermal treatment was applied to avoid the degradation of the
polymer.

49
The morphology of the as-obtained nanocomposites was characterized by small angle X-ray
scattering (SAXS) and transmission electron microscopy (TEM). The SAXS patterns were
obtained using the synchrotron source of the National Synchrotron Light Laboratory (LNLS),
Campinas, Brazil. The wavelength used in these measurements was 1.488 Å and the sample-
to-detector distance was either 950 mm or 1125 mm. The TEM was performed with a Carl
Zeiss CEM 902 transmission electron microscope for the nanocomposite containing 5 wt%
nanoclay and with a Hitachi HD2700 field emission scanning transmission electron
microscope (FE-STEM) for the nanocomposites containing 2.5 and 7.5 wt% nanoclay. Prior
to observations, ultrathin sections of few tens of nanometers were cryo-cut using an ultra-
microtome at -100 oC and deposited on copper grids. Some grids were also stained during 30
minutes with ruthenium tetroxide RuO4 vapor in order to determine the block copolymer
morphology and to evaluate the location of clay nanoparticles.
Subsequently, the viscoelastic properties of all the nanocomposites were evaluated in order to
confirm the different results obtained by microscopy and SAXS. In particular, the dynamic
mechanical analysis (DMA) was done using a Q800 TA Instruments analyzer. Tensile mode
was selected and rectangular specimens of 20 mm × 6.5 mm x 1 mm were used. The
measurements were performed from 20 °C to 140 °C. The test conditions were as follows:
rate of heating equal to 3 °C/min, resonant frequency equal to 1 Hz and amplitude equal to
0.2 mm. The tensile storage modulus (E’), loss modulus (E”) and damping factor (tan δ) were
evaluated.
Finally, in terms of dielectric properties, the complex dielectric permittivity of the
nanocomposites was evaluated using a Novocontrol broadband spectrometer. Specimens of
20 mm in diameter were placed between two parallel brass plated electrodes. Measurements
swept through a frequency range from 10-2 Hz up to 3*105 Hz at a temperature range varying
from 25 °C to 95 °C. The AC short-term breakdown strength of the samples was measured
using ball-type electrodes of diameter 4 mm in a dielectric oil environment. The size of test
specimens was approximately 3 cm x 3 cm. For each sample, 15 specimens were considered
to calculate the dielectric strength using Weibull distribution, except for the extruded SEBS

50
nanocomposite containing 2.5 wt% nanoclay, where only 10 spots have been taken into
account. A voltage ramp of 2 kV/s at a frequency of 60 Hz was applied until breakdown
occurred. All measurements were done at a temperature equal to 23 °C. Since the thickness
of the samples was not uniform, all the measurements were corrected to equal the breakdown
strength of a 100 µm thick film using the power law relationship between the breakdown
field and the film thickness in order to obtain comparable results (Takala et al., 2010).
2.3 Results and discussion
2.3.1 Morphology
As mentioned above, four microstructural aspects of the nanocomposites were controlled:
state of dispersion and location of nanoclays, amount of surface area of nanoparticles,
orientation of nanoclays and structure of SEBS. These four aspects are reviewed below:
2.3.1.1 State of dispersion and location of nanoclay
In the nanocomposites produced by extrusion, both intercalated and exfoliated nanoclay
structures were obtained depending on the use of SEBS or SEBS_MA as the matrix:
nanoclay particles were intercalated and located within PS cylinders when SEBS was used
while they were partially exfoliated and located in the PEB block when SEBS_MA was the
matrix. The exfoliated vs. intercalated nanoclay structures can be observed respectively in
Figure 2-1(a) and Figure 2-1(b)-(d). More details regarding the location of nanoclays in
SEBS phases are available in reference (Carastan et al., 2014) and in the supporting file
(annex I).

51
Figure 2-1: TEM images of respectively: (a) SEBS_5wt% nanoclay, (b) SEBS_MA_2.5wt% nanoclay, (c) SEBS_MA_5wt% nanoclay and (d) SEBS_MA_7.5wt% nanoclay
(Prepared by extrusion)
DMA analysis was performed on the samples in order to confirm the difference in the state of
clay dispersion, i.e. exfoliated vs. intercalated, as observed by TEM, between the
nanocomposites prepared with SEBS and SEBS_MA. Plots of storage modulus E’, loss
modulus E” and damping factor as functions of temperature are presented in Figure 2-2(a),
Figure 2-2(b) and Figure 2-2(c) respectively. According to Figure 2-2(c), a relaxation peak
around 104 oC was detected in tan δ curve for the pure SEBS. This peak corresponds to the
glass transition temperature of the PS domains. The position of the damping peak was shifted
by approximately 5 °C toward higher temperatures in the nanocomposites, indicating an
increase of the PS glass transition temperature. Besides, the intensity of the damping peak
decreased significantly in the nanocomposites. Both the increase of PS glass transition
temperature and the decrease of the damping peak could be attributed to the reduction of
polymer chain mobility within PS phase due to the presence of nanoclays. In particular, the
lowest peak measured in SEBS_MA_5% exfoliated nanocomposite may be considered as an
indication of the efficient contribution of exfoliated clay nanoplatelets obtained in
SEBS_MA compared to intercalated nanoplatelets obtained in pure SEBS in blocking the
segmental chain movement of PS cylinders and consequently decreasing the degree of
disorder within the PS domain. These DMA results confirm the TEM observation shown in
Figure 2-1.
(a) (b) (c) (d)

52
Figure 2-2: (a) Storage modulus E’, (b) Loss modulus E’’ and (c) Damping factor (tan δ) at 1 Hz of SEBS vs. SEBS_MA nanocomposites containing 5wt% nanoclay (prepared by
extrusion)
2.3.1.2 Amount of nanoparticle surface area
In addition to the nanocomposites prepared with 5 wt% nanoclay, two other loadings have
been considered to highlight the effect of the interfacial region on the dielectric properties:
2.5 and 7.5 wt%. The quality of dispersion in these nanocomposites prepared by extrusion
was assessed by image quantitative analysis involving TEM observations carried out at
different scales following the procedure reported in Carastan et al. (Carastan et al., 2010) and
Vermogen et al. (Vermogen et al., 2005). For that, a set of images taken at 3 magnifications
was considered: 1 image at 20k, 4 images at 50k and 10 images at 100k. The thicknesses of
(b)
(c)
(a)
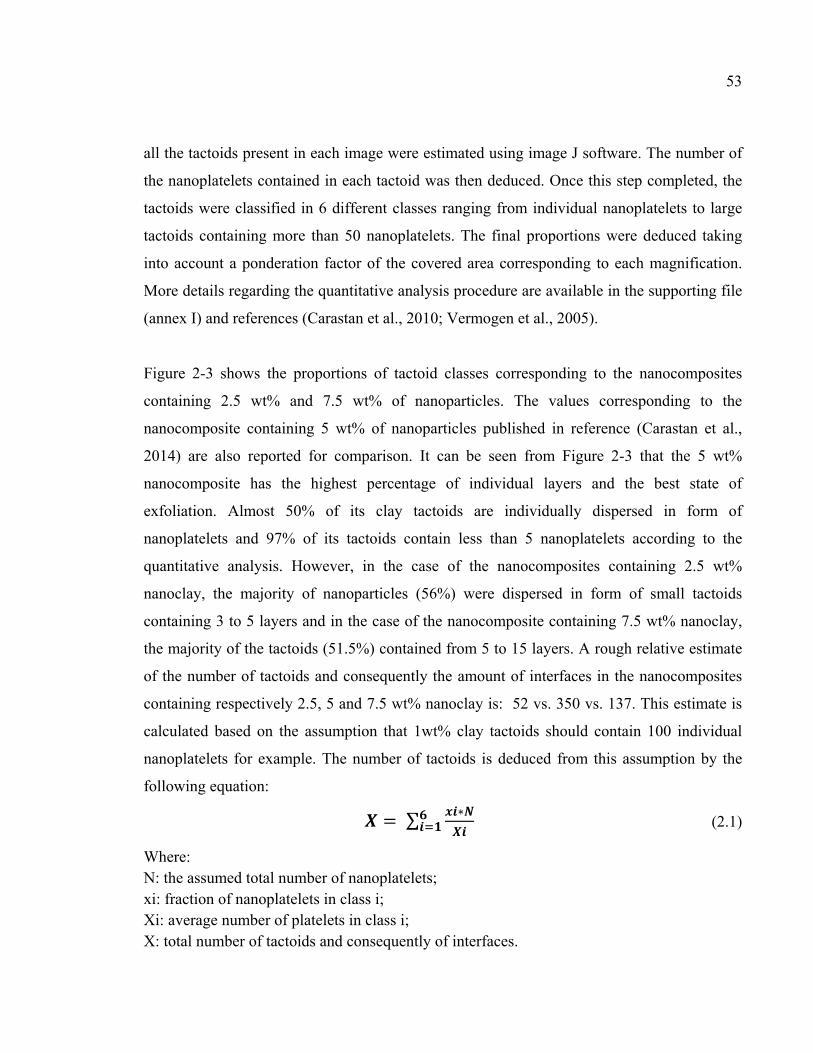
53
all the tactoids present in each image were estimated using image J software. The number of
the nanoplatelets contained in each tactoid was then deduced. Once this step completed, the
tactoids were classified in 6 different classes ranging from individual nanoplatelets to large
tactoids containing more than 50 nanoplatelets. The final proportions were deduced taking
into account a ponderation factor of the covered area corresponding to each magnification.
More details regarding the quantitative analysis procedure are available in the supporting file
(annex I) and references (Carastan et al., 2010; Vermogen et al., 2005).
Figure 2-3 shows the proportions of tactoid classes corresponding to the nanocomposites
containing 2.5 wt% and 7.5 wt% of nanoparticles. The values corresponding to the
nanocomposite containing 5 wt% of nanoparticles published in reference (Carastan et al.,
2014) are also reported for comparison. It can be seen from Figure 2-3 that the 5 wt%
nanocomposite has the highest percentage of individual layers and the best state of
exfoliation. Almost 50% of its clay tactoids are individually dispersed in form of
nanoplatelets and 97% of its tactoids contain less than 5 nanoplatelets according to the
quantitative analysis. However, in the case of the nanocomposites containing 2.5 wt%
nanoclay, the majority of nanoparticles (56%) were dispersed in form of small tactoids
containing 3 to 5 layers and in the case of the nanocomposite containing 7.5 wt% nanoclay,
the majority of the tactoids (51.5%) contained from 5 to 15 layers. A rough relative estimate
of the number of tactoids and consequently the amount of interfaces in the nanocomposites
containing respectively 2.5, 5 and 7.5 wt% nanoclay is: 52 vs. 350 vs. 137. This estimate is
calculated based on the assumption that 1wt% clay tactoids should contain 100 individual
nanoplatelets for example. The number of tactoids is deduced from this assumption by the
following equation: =∑ ∗ (2.1)
Where: N: the assumed total number of nanoplatelets; xi: fraction of nanoplatelets in class i; Xi: average number of platelets in class i; X: total number of tactoids and consequently of interfaces.

54
Figure 2-3: TEM image quantitative analysis of oriented hexagonal SEBS/clay nanocomposites, prepared by extrusion, containing different nanoclay loadings: 2.5, 5
and 7.5 wt% (values for the 5 wt% nanocomposite are reported according to (Carastan et al., 2014))
Storage modulus, loss modulus and damping factor corresponding to SEBS_MA
nanocomposites containing the 3 studied clay loadings are presented in Figure 2-4. In
particular, Figure 2-4(c) shows that the highest glass transition temperature of the PS phase
was exhibited by pure SEBS_MA (111 °C). However, all the nanocomposites have lower
glass transition temperatures ranging from 107.5 °C for SEBS_MA_7.5% to 109 °C
SEBS_MA_5%, which could be considered as a small difference. This remarkable increase
of PS Tg in pure SEBS-MA could be related to the presence of MA. Furthermore, Figure
2-4(b) shows a remarkable decrease of the molecular relaxation peak of SEBS in the vicinity
of PS glass transition upon addition of nanoclay (indicated by the arrow), which results in a
decrease of the damping peak intensity as observed in Figure 2-4(c) and previously in Figure
2-2(c). Although the reduction of the damping peak occurred with increasing nanoclay
loading, it can be seen that at 7.5 wt% nanoclay, only a slight additional decrease was
induced compared to 5 wt% loading. This decrease is more likely attributed to the decrease
of the loss modulus since no additional improvement of the storage modulus was observed at
this loading (Figure 2-4(a)). This behavior may indicate that no further exfoliated
Individuallayers
2 to 3 layerstactoids
3 to 5 layerstactoids
small tactoids(5 to 15layers)
middle sizetactoids (15-
50 layers)2.50% 5,75 55,9 38,355% 53 27 17 37.50% 6,75 38,3 51,5 3,45
0
10
20
30
40
50
60
Cont
ent (
%)

55
nanoparticles could be obtained at nanoclay loadings higher than 5 wt%. The present
behavior is consistent with the result of quantitative analysis stating that the maximum
exfoliation corresponds to 5 wt% nanoclay.
Figure 2-4: (a) Storage modulus E’, (b) Loss modulus E’’ and (c) Damping factor (tan δ) at 1 Hz of SEBS_MA nanocomposites containing 2.5, 5 and 7.5 wt% nanoclay
(prepared by extrusion)
2.3.1.1 Nanoclay orientation
In order to characterize the orientation of nanoclays and PS micro-domains in the samples,
SAXS analyses were performed. The SAXS diffraction patterns revealed that PS cylinders
and clay nanoparticles were oriented in the extrusion direction for the extruded samples (see
supporting file annex I). The TEM images presented in Figure 2-1(b)-(d) corresponding to
the exfoliated samples clearly show evidence of this alignment while the TEM image
(a) (b)
(c)

56
presented in Figure 2-1(a) and corresponding to the intercalated sample is not as conclusive.
However, one should keep in mind that TEM images only probe a small area whereas SAXS
present a more global analysis of the sample.
In the case of samples obtained by solution casting, for both the annealed and unannealed
samples, the SAXS patterns revealed only concentric circles indicative of isotropic samples
presenting random orientation of both PS domains and clay tactoids (see supporting file
annex I).
2.3.1.2 SEBS morphology
The structure of extruded nanocomposites was studied in reference (Carastan et al., 2014).
The authors reported that a hexagonal cylindrical morphology was present in both pure SEBS
and the nanocomposites. The case of samples prepared by solution will be treated in this
section. Figure 2-5(a) and Figure 2-5(b) present the radial plots of scattering intensity as
function of scattering vector q of respectively unannealed and annealed samples. In Figure
2-5(a), corresponding to the unannealed samples, the relative q-position of Bragg peaks with
the sequence 1:2:3 characteristic of lamellar structure was detected. This non-equilibrium
morphology of alternating lamellae of PS and PEB domains was expected and attributed to
the solvent effect since toluene dissolves better PS blocks compared to PEB blocks (Jeong et
al., 2003), which favors the formation of PS lamellae and prevents their separation into
cylindrical domains. In Figure 2-5(b) corresponding to annealed samples, the detected
relative q-position of the peaks followed the sequence 1:√3:√7, characteristic of hexagonal
structure. This thermally induced order-to-order transition from lamellar to a more stable
hexagonal cylindrical structure was reported in the literature as well when the annealing is
performed at temperatures considerably higher than the PS glass transition temperature
(Jeong et al., 2003). Furthermore, upon the addition of nanoclay, the third peak was
broadened or disappeared from the spectra of both annealed and unannealed samples. This
fact may indicate that the presence of nanoclay resulted in less well ordered SEBS structures
compared to pure SEBS samples.

57
Figure 2-5: Radial plot of peak intensities of SEBS vs. SEBS_MA nanocomposites containing 5 wt% nanoclay (prepared by solution):
(a) unannealed samples and (b) annealed samples
2.3.1.3 Stability of SEBS morphology
The morphological stability of unannealed nanocomposites prepared by solution was checked
by analysing the relative peak positions in radial SAXS plots as a function of time at a
temperature high enough to induce transition from lamellar to cylindrical morphology,
(b)
(a)

58
selected equal to 200 °C in our case. This study was performed in order to determine whether
the lamellar morphology in unannealed nanocomposites changed or not after pressing the
samples at 200 °C, which was a necessary step to prepare specimens with comparable
thicknesses for the dielectric breakdown measurements which will be discussed later. The
plots corresponding to pure SEBS and SEBS nanocomposite with 5 wt% nanoclay are
presented in Figure 2-6(a) and Figure 2-6(b). They show respectively the relative peak
positions of pure SEBS and SEBS_5% clay nanocomposites as functions of time. Peaks
corresponding to the diffraction of clay particles are observed as well in Figure 2-6(b). It
could be seen that the first and the second peaks relative to lamellar structure in the radial
plots changed of positions while the third peak was transformed in two small peaks
(indicated by two arrows in the figures), after 5 minutes in the pure SEBS and after 10
minutes in the SEBS_5% clay nanocomposite. These new peaks correspond to the (√7, √9)
peaks in radial plots of annealed samples presented in Figure 2-5(b). As a consequence, it
could be concluded from this observation that a possible transition from lamellar to
cylindrical morphology could have occurred during the molding process. It is also worth
mentioning that the two small peaks are less apparent in the nanocomposite sample; which
was also observed in the case of annealed nanocomposites (Figure 2-5(b)). Therefore, the
initial morphologies of annealed and unannealed samples were also investigated by TEM.
More details are provided in Table 2-2 and the supporting file reported in annex I.

59
Figure 2-6: Radial plots of SAXS peak intensities as function of time at 200 °C of: (a) unannealed pure SEBS and (b) unannealed SEBS_5wt% nanocomposite prepared
by solution
Table 2-2 presents a summary of all the morphologies studied in this work. In particular,
nanocomposites of type I and II prepared by extrusion exhibit an oriented hexagonal
structure where both PS cylinders and nanoclays were oriented in the direction of extrusion
while nanocomposites of type III and IV, prepared by solution casting method, exhibit both
an isotropic structure where PS domains are distributed randomly within a PEB matrix. In
type III nanocomposites, the hexagonal structure was induced due to thermal treatment while
in type IV, the lamellar structure was dominating according to SAXS plots presented in
Figure 2-5(a). However, it is worth mentioning that both lamellar and hexagonal
morphologies could co-exist in the unannealed nanocomposites as indicated by the TEM
image corresponding to type IV presented in Table 2-2. In particular, the cylindrical
morphology is observed surrounding the nanoclays which may indicate that these particles
favor the transition from lamellar morphology to more stable hexagonal morphology despite
the fact that the samples were not subjected to thermal treatment (more details are available
in the supporting file (annex I)). This observation is also consistent with the assumption of
less ordered structure and the absence of the third peak in radial SAXS plots presented in
Figure 2-5 and Figure 2-6.
(a) (b)

60
Table 2-2: Summary of SEBS/clay nanocomposites with different structures (Red, yellow and green domains in the sketches illustrate respectively nanoclays, PEB phase
and PS phase, in some sketches the yellow domains are removed only for the sake of simplicity)
Processing method
TEM Morphology Sketch
I
Figure 6(d) in (Carastan et al., 2008) and Figure 3(b) in (Leice G. Amurin, Carastan, & Demarquette, 2012)
- Hexagonal cylindrical SEBS structure - Oriented PS cylinders and nanoclays - Intercalated nanoclays crossing PS cylinders
II
- Hexagonal SEBS_MA structure - Oriented PS cylinders and nanoclays - Partially exfoliated nanoclays located within the PEB domain
III
- Hexagonal SEBS structure - Groups of PS cylinders dispersed randomly in PEB matrix - Nanoclays located within the PS cylinders or the PEB domain depending on the use of SEBS or SEBS_MA (see supporting file annex I)
IV
- Mostly lamellar SEBS structure (see supporting file annex I) - Localized cylindrical morphology surrounding nanoclay particles - PS domains randomly dispersed in PEB matrix - Nanoclays located within PS domain or PEB domain depending on the use of SEBS or SEBS_MA
Sol
uti
on C
asti
ng
Sol
uti
on C
asti
ng
+ T
her
mal
tre
atm
ent
Ext
rusi
on
Ext
rusi
on

61
For the sake of simplicity, in the following figures related to dielectric properties, all the
nanocomposites will be designated as following: SEBS_W_X_Y_Z or
SEBS_MA_W_X_Y_Z where W is the wt% of nanoclay, X is the type of dispersion, Y is the
orientation and Z is the structure of SEBS, as indicated in Table 2-3.
Table 2-3: Designation of the nanocomposites
Symbol Parameter Abbreviation
W Weight% 2.5, 5 or 7.5 wt% of nanoclays
X Dispersion exf (exfoliated), int (intercalated)
Y Orientation ori (oriented), ran (random)
Z SEBS structure hex (hexagonal), lam (lamellar)
2.3.2 Dielectric properties
The dielectric permittivity of an insulating material measures its ability to polarize in
response to an applied electric field. It is expressed as follows (Kremer & Schönhals, 2012):
)()()(ˆ ''' ωεωεωε i−= (2.2)
Where:
ω: Frequency;
ɛ’: real part of the complex dielectric permittivity, which is related to the stored energy. It is
also known as the dielectric constant;
ɛ’’: imaginary part of dielectric permittivity, which is related to the dissipated energy. It is
also known as the dielectric loss.
The complex dielectric permittivities of all SEBS/Clay nanocomposites were evaluated as
function of the nanoclays' state of exfoliation and orientation as well as the block copolymer
structure. It is worth mentioning that the measurements were performed perpendicular to the
direction of orientation in the case of extruded samples as indicated in Figure 2-7. Figure
2-8(a) and Figure 2-8(b) represent respectively the real and the imaginary part of the complex

62
permittivity measured at room temperature of intercalated SEBS/clay vs. exfoliated
SEBS_MA/clay nanocomposites prepared by extrusion with different nanoclay loadings: 2.5,
5 and 7.5 wt%. In all the nanocomposites, an increase of the dielectric constant accompanied
with a simultaneous increase of the dielectric loss is observed at low frequencies. This
increase is attributed to Maxwell/Wagner/Sillars polarization at the nanoclay/polymer
interfaces (Kremer & Schönhals, 2012). In particular, the increase achieved in
nanocomposites prepared from SEBS_MA matrix is more pronounced compared to the
nanocomposites prepared from SEBS matrix indicating that more nanoclay/polymer
interfaces are present in the first type of nanocomposites. Besides, a broad relaxation peak
corresponding to the interfacial polarization appeared in the curves of nanocomposites with
exfoliated structure in the frequency range 0.1 to 1 Hz. This is consistent with the fact that a
better state of exfoliation is achieved when SEBS_MA is used. In order to highlight the effect
of exfoliation vs. intercalation of nanoclays on the dielectric behavior, the dielectric
permittivities of respectively pure SEBS, SEBS_5wt%_int_ori_hex and
SEBS_MA_5wt%_exf_ori_hex nanocomposites were scanned as functions of frequency in
the temperature range: 25 to 95 °C. In this temperature range, no relaxation was observed for
the unfilled SEBS block copolymer (Figure 2-9(a) and Figure 2-9(b)) since the material is
essentially non polar and therefore the relaxation process that can be seen in Figure 2-4 is not
dielectrically active. However, the oriented SEBS_5% nanocomposite with intercalated
structure exhibits a first relaxation mode below the Tg of PS phase which is attributed to the
interfacial polarization. As the temperature increases, the increase of the dielectric constant at
low frequencies is more evident (Figure 2-9 (c)) and the relaxation peak is shifted to higher
frequencies (Figure 2-9(d)). In the graphs corresponding to the exfoliated nanocomposite
(Figure 2-9(e) and Figure 2-9(f)), the interfacial phenomena is more important and
corresponds to a clearer step in the dielectric constant curve and to more intense interfacial
relaxation peak. The relaxation peaks in Figure 2-9(d) and Figure 2-9(f) are indicated by the
arrows. Furthermore, the increase of dielectric loss observed at low frequencies and high
temperatures due to nanoclays conduction contribution is one order of magnitude less in the
nanocomposite with exfoliated structure compared to the nanocomposite with intercalated
structure (Figure 2-9(d) vs. Figure 2-9(f)). This behavior could be explained by the fact that

63
the conductivity at the interfaces between intercalated clay nanoplatelets is higher than the
conductivity at the interfaces between the polymer and exfoliated clay nanoplatelets.
Figure 2-7: Orientation of electric field in dielectric spectroscopy and AC short-term breakdown measurements: (a) anisotropic nanocomposites prepared
by extrusion and (b) isotropic nanocomposites prepared by solution casting
(b) (a)

64
Figure 2-8: (a) Real and (b) imaginary parts of the complex permittivity at room temperature of oriented hexagonal SEBS
(type I) and SEBS_MA (type II) nanocomposites containing 2.5, 5 and 7.5 wt% nanoclay
(b)
(a)

65
Figure 2-9: Real and imaginary parts of the complex dielectric permittivity in the temperature range from 25 to 95 °C of: Pure SEBS (a) and (b), SEBS_5wt%_int_ori_hex
(c) and (d) and SEBS_MA_5wt%_exf_ori_hex (e) and (f)
(b) (a)
(c) (d)
(e) (f)

66
As far as the concentration of nanoclay is concerned, the nanocomposites containing 5 wt%
nanoclay exhibit the highest permittivities compared to the pure SEBS, SEBS_MA and the
nanocomposites containing 2.5 wt% and 7.5wt% nanoclay. The decline of the permittivity at
7.5 wt% indicates that concentrations above 5wt% may result in poor dispersion of
nanoclays. This behavior was observed also in DMA results (Figure 2-4). The same trend of
increase of the dielectric constant was observed in the dielectric loss of the nanocomposites,
which confirms that the increase observed in the dielectric constant is due to conduction
phenomena along the nanoclay/polymer interfaces which leads to both an interfacial
polarization peak and some low frequency dispersion. These experimental results are
consistent with the results of quantitative image analysis stating that a higher amount of
interface is achieved when a 5 wt% nanoclay loading is used. A similar behavior was
reported in the studies done by Pirani et al. (Pirani, Krishnamachari, & Hashaikeh, 2014) and
Lam et al. (Lam et al., 2005) who observed that the highest improvements in the mechanical
properties of the polymer matrices were achieved at optimum nanoclay loadings. They
attributed the decline of the properties above these optimum loadings to the deterioration of
the dispersion quality.
Figure 2-10(a) and Figure 2-10(b) show respectively the real and imaginary parts of the
dielectric permittivities of random hexagonal SEBS nanocomposites vs. oriented hexagonal
SEBS nanocomposites measured at room temperature. It can be seen that the orientation of
nanoclays affects the dielectric response. In fact, both the real and imaginary parts of the
dielectric permittivity of non-oriented nanocomposites are higher than the values
corresponding to oriented nanocomposites. To illustrate better this increase, the complex
dielectric permittivity of non-oriented hexagonal SEBS_5%_int_ran_hex nanocomposite as a
function of increasing temperature from 25 °C to 95 °C, is presented in Figure 11. A more
pronounced increase of the dielectric permittivity (Figure 2-11(a)) and the dielectric loss
(Figure 2-11(b)) in the isotropic sample compared to the anisotropic sample (Figure 2-9(c)
and Figure 2-9(d)) is observed at high temperatures. For instance, at 0.1 Hz and 95 °C,
respectively the dielectric constant and the dielectric loss of the oriented vs. random sample
were: 3.4 vs. 14.4 and 1.3 vs. 30.9. This difference of dielectric behavior between the

67
anisotropic nanocomposite and the isotropic nanocomposite at low frequencies and especially
at high temperatures could be explained by the fact that the increase of the dielectric constant
and the dielectric loss is essentially due to the conductivity of clay tactoids which is an
anisotropic property. In fact, the conductivity along clay platelets is largely higher than
across them (David et al., 2013). Hence, the alignment of nanoclays along the direction of
extrusion in the oriented nanocomposites may result in a decreased conductivity along the
thickness of the nanocomposites samples and consequently lower dielectric permittivities and
dielectric losses compared to the isotropic samples when measurements are done
perpendicularly to the preferred orientation direction.
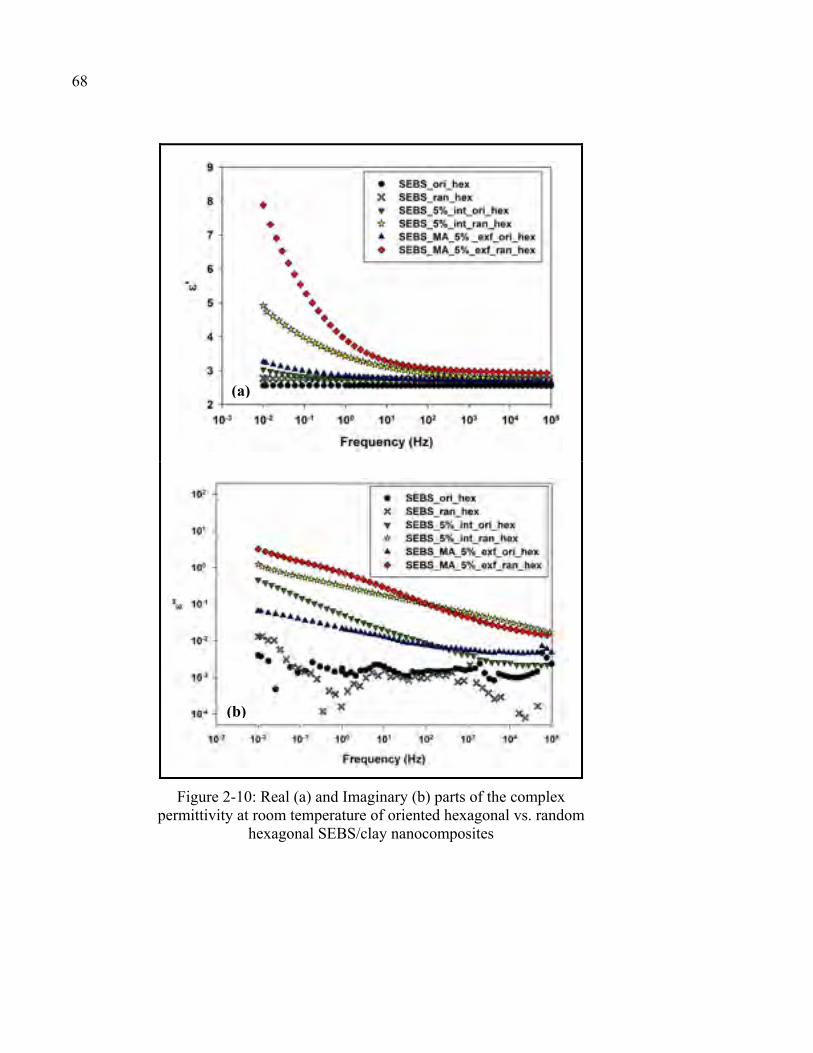
68
Figure 2-10: Real (a) and Imaginary (b) parts of the complex permittivity at room temperature of oriented hexagonal vs. random
hexagonal SEBS/clay nanocomposites
(a)
(b)

69
Figure 2-11: Real (a) and imaginary (b) parts of the complex permittivity of SEBS_5wt%_int_ran_hex nanocomposite with random hexagonal structure in the
temperature range from 25 to 95 °C
In order to study the effect of SEBS structure on the dielectric response, the complex
permittivity of unannealed mostly lamellar SEBS_5% clay nanocomposite prepared by
solution method was evaluated and compared to its corresponding nanocomposite with
random hexagonal morphology. Figure 2-12(a) and Figure 2-12(b) show respectively the real
and the imaginary parts of dielectric permittivity of SEBS_5wt%_int_ran_lam
nanocomposite in the temperature range 25 to 95 °C. The results indicate that the
nanocomposite with dominant lamellar morphology exhibits largely higher dielectric loss
compared to the nanocomposite with hexagonal structure (Figure 2-11(a) and Figure
2-11(b)). For example, at 0.1 Hz and 95 °C, the values of dielectric constant were 14.4 vs.
19.5 and the values of dielectric loss were 30.9 vs. 98.0 respectively in hexagonal vs.
lamellar SEBS_5% clay nanocomposites. Prior to determining the origin of this difference, it
is worth mentioning that both random hexagonal pure SEBS and random lamellar pure SEBS
exhibit dielectric responses similar to the dielectric response of oriented cylindrical SEBS
plotted in Figure 2-9(a) and Figure 2-9(b) (the results are not presented in this paper). As a
consequence, the observed difference in the dielectric behavior of the nanocomposites is
related to how the morphology of SEBS affects the orientation and dispersion of nanoclays.
(b) (a)

70
One possible explanation is that the lamellar morphology may hinder the orientation of
nanoclays more than cylindrical morphology.
Figure 2-12: Real (a) and imaginary (b) parts of the complex permittivity of SEBS_5wt%_int_ran_lam nanocomposite with random lamellar structure in the
temperature range from 25 to 95 °C
2.3.3 AC short-term breakdown strength
The breakdown strength is equal to the maximum electric field that an insulating material can
withstand without breaking down ("IEEE Guide for the Statistical Analysis of Electrical
Insulation Breakdown Data," 2005). In this paper, the retrieved AC breakdown data were
treated by means of a two-parameter Weibull distribution to assess the evolution of the
breakdown strength of the tested nanocomposites. The expression of the two-parameter
Weibull distribution is shown in equation (2.3). More details regarding the use of Weibull
distribution for dielectric strength estimation could be found in IEEE 930 standard ("IEEE
Guide for the Statistical Analysis of Electrical Insulation Breakdown Data," 2005).
(b) (a)

71
β
−−=
0
exp1E
EP (2.3)
Where:
P: is the cumulative probability of failure at an electric field less or equal to E;
E0: is the scale parameter corresponding to the breakdown strength for which the cumulative
failure probability is equal to 63.2%;
β: is the shape parameter which measures the range of breakdown strengths. The larger β is
the smaller is range for breakdown strengths.
The Weibull plots of the experimental data corresponding to oriented SEBS/clay
nanocomposites are displayed in Figure 2-13 while the Weibull parameters of all the
nanocomposites are summarized in Table 2-4. The electric field was perpendicular to the
direction of preferred orientation in the anisotropic samples, for breakdown measurements as
well (Figure 2-7). The average thicknesses of the nanocomposites and the relative humidity
were also reported since they may affect the measurements. Regarding the oriented samples,
a tremendous increase of the breakdown strength was achieved by the addition of nanoclays
within the pure SEBS. The maximum increase corresponds to the intercalated SEBS_5wt%
nanocomposite by 45%. At 7.5wt% loading of nanoclay, the breakdown strength starts to
decrease again. This behavior is analogous to the behavior seen in dielectric spectroscopy
and dynamic mechanical analysis.

72
Figure 2-13: Weibull plot of breakdown strength of SEBS vs. SEBS/clay nanocomposites with oriented hexagonal structure
In the oriented samples with exfoliated nanoclay structure, prepared with SEBS_MA as a
matrix, the breakdown strength starts to decrease from 5wt% loading of nanoclay after an
initial increase by 35% corresponding to 2.5wt% nanoclay loading. This behavior could be
explained by the fact that in the presence of a large amount of exfoliated nanoclay in
SEBS_MA_5wt%_exf_ori_hex nanocomposite as demonstrated by image quantitative
analysis, a network starts to form in some regions of the polymer and consequently reduces
the breakdown voltage. Furthermore, the breakdown values of these 3 nanocomposites
prepared from SEBS_MA are relatively lower than the rest of the nanocomposites due to
probably lower Young’s modulus of SEBS_MA compared to pure SEBS induced by its less
ordered structure. The increased relative humidity when the breakdown measurements were
performed on these samples could also be responsible for this unexpected decrease.
In terms of isotropic samples, it could be seen from Table 2-4 that the dielectric breakdown
strengths of the random hexagonal samples, either pure SEBS or SEBS_5% nanocomposites
are higher than the values measured for the oriented samples prepared by extrusion.
However, the nanoclays didn’t induce any increase of the breakdown strength of the pure

73
matrix unlike the case of the oriented samples. Hence, it seems that the breakdown
phenomena in these materials are mostly governed by the isotropic structure of SEBS. In the
same context of the influence of SEBS structure, it could be also seen from Table 2-4 that the
breakdown strength values of the samples with dominant lamellar morphology are higher
than samples with cylindrical morphology. The presence of lamellar morphology could be
responsible for this increase of the breakdown strength due to the mechanical strengthening
of the structure. However, the breakdown measurements could be also overestimated after
the thickness normalization. In fact, the lamellar samples are in average thicker compared to
the rest of the samples and also compared to the normalization thickness used for correction.
Table 2-4: Dielectric strengths of SEBS, SEBS_MA and their nanocomposites
Nanocomposite
Morphology
E0
(kV/mm)
Β
Average thickness
(μm)
Relative humidity
(%)
SEBS_0 Intercalated
Oriented Hexagonal
(Type I in Table 2-2)
88 7.3 108 22
SEBS_2.5 123 5.9 96 22
SEBS_5 127 5.6 98 22
SEBS_7.5 120 3 129 22
SEBS_MA_2.5 Exfoliated Oriented
Hexagonal (Type II in Table 2-2)
119 5.3 118 31
SEBS_MA_5 109 6.3 97 31
SEBS_MA_7.5 113 3.8 120 31
SEBS_0 Intercalated Random
Hexagonal (Type III in Table
2-2)
133 3.7 110 23
SEBS_5 135 4.1 122 23
SEBS_0 Intercalated Random Lamellar
(Type VI in Table 2-2)
147 3.4 155 23
SEBS_5 144 6.1 171 23
74
To conclude, the oriented nanoclays seem to be more efficient in scattering electrons
transport and increasing the breakdown strength. The increase of the breakdown induced by
these samples is the highest compared to the isotropic samples where nanoclays were
randomly dispersed. However, in terms of SEBS structure effect, the orientation of PS
cylinders in SEBS is more likely to produce a negative effect which was not observed in the
isotropic structure. This effect could be attributed to the reduction of Young’s modulus and
stiffness along the thickness of the oriented samples. In fact, Wang et al. (Wang, Fujinami,
Liu, Nakajima, & Nishi, 2010) estimated the Young’s modulus of respectively PS and PEB
blocks of an SEBS grade similar to the one used in this study to be equal to: 133.3±26 MPa
and 25.6±9.2 MPa. Hence, the orientation of PS cylinders could significantly decrease the
modulus along the thickness of the samples which was proved to be a key parameter
controlling the breakdown strength in dielectric elastomers (Kollosche & Kofod, 2010;
Kollosche et al., 2009). More precisely, it was reported that a consistent reduction in Young’s
modulus and stiffness could lead to electromechanical breakdown (Dissado & Fothergill,
1992). This effect of mechanical strength is further confirmed by the observed increase of the
breakdown strength in samples containing lamellar morphology which normally exhibits
stronger equivalent Young’s modulus (compared to the cylindrical morphology) due to the
arrangement of PS phase with high Young’s modulus in form of lamellae.
2.3.4 Summary of results
The main effects of structural changes in the morphology of SEBS/nanoclays on the complex
dielectric permittivity and ac the breakdown strength are summarized in Table 2-5.
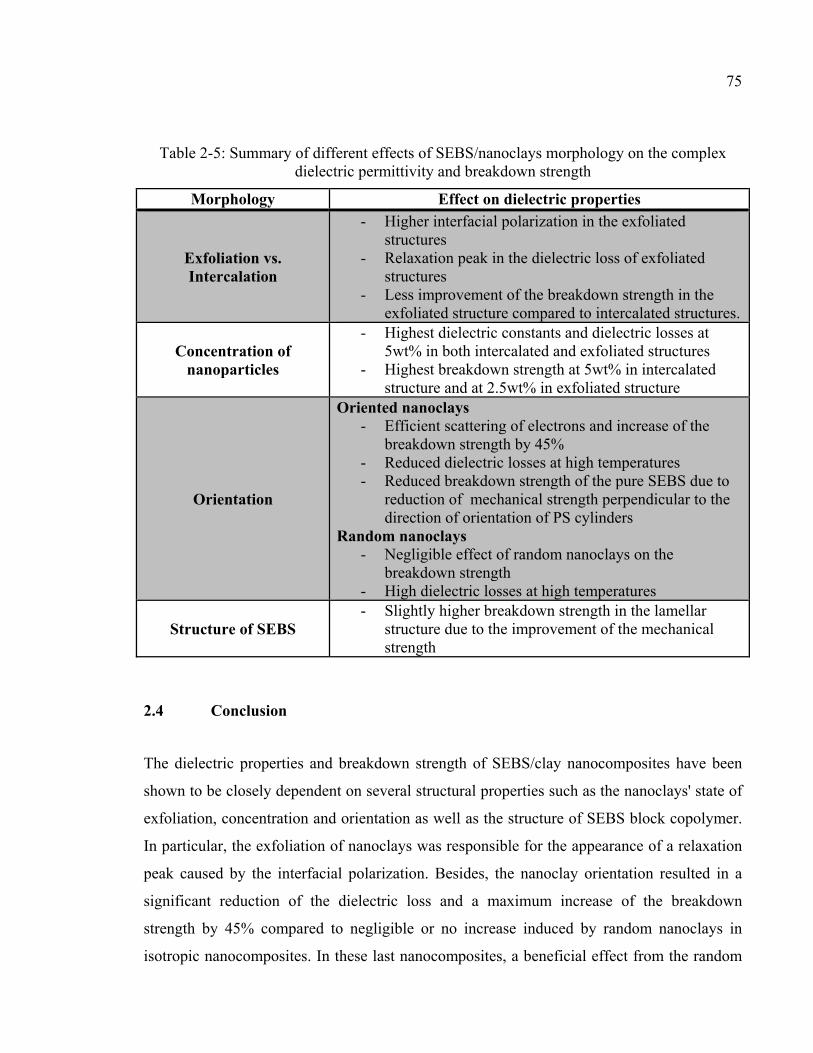
75
Table 2-5: Summary of different effects of SEBS/nanoclays morphology on the complex dielectric permittivity and breakdown strength
Morphology Effect on dielectric properties
Exfoliation vs. Intercalation
- Higher interfacial polarization in the exfoliated structures
- Relaxation peak in the dielectric loss of exfoliated structures
- Less improvement of the breakdown strength in the exfoliated structure compared to intercalated structures.
Concentration of
nanoparticles
- Highest dielectric constants and dielectric losses at 5wt% in both intercalated and exfoliated structures
- Highest breakdown strength at 5wt% in intercalated structure and at 2.5wt% in exfoliated structure
Orientation
Oriented nanoclays - Efficient scattering of electrons and increase of the
breakdown strength by 45% - Reduced dielectric losses at high temperatures - Reduced breakdown strength of the pure SEBS due to
reduction of mechanical strength perpendicular to the direction of orientation of PS cylinders
Random nanoclays - Negligible effect of random nanoclays on the
breakdown strength - High dielectric losses at high temperatures
Structure of SEBS
- Slightly higher breakdown strength in the lamellar structure due to the improvement of the mechanical strength
2.4 Conclusion
The dielectric properties and breakdown strength of SEBS/clay nanocomposites have been
shown to be closely dependent on several structural properties such as the nanoclays' state of
exfoliation, concentration and orientation as well as the structure of SEBS block copolymer.
In particular, the exfoliation of nanoclays was responsible for the appearance of a relaxation
peak caused by the interfacial polarization. Besides, the nanoclay orientation resulted in a
significant reduction of the dielectric loss and a maximum increase of the breakdown
strength by 45% compared to negligible or no increase induced by random nanoclays in
isotropic nanocomposites. In these last nanocomposites, a beneficial effect from the random

76
distribution of PS domains in improving the mechanical strength and consequently the
breakdown strength of the structure was rather seen and responsible for the increase of the
breakdown strength of pure SEBS, especially in its lamellar structure compared to oriented
SEBS. In all of the samples, it was demonstrated that a nanoclay loading of 2.5 to 5 wt% is
an optimum content in terms of dispersion, number of nanoscale interfaces and dielectric
performance. Finally, the results achieved so far in this study could be enhanced by studying
the variation of the breakdown strength and dielectric loss in special morphologies where it is
possible to take advantage of the orientation of nanoclays without degrading the mechanical
strength of the SEBS matrix itself. An oriented lamellar morphology, a bi-oriented
morphology or an isotropic morphology of PS cylinders with aligned nanoclays could
represent interesting candidates in this context.
Acknowledgements
The Natural Sciences and Engineering Research Council (NSERC) and Hydro-Québec from
Canada as well as Coordenação de Aperfeiçoamento de Pessoal de Nível Superior (CAPES),
Conselho Nacional de Desenvolvimento Científico e Tecnológico (CNPq) and Fundação de
Amparo à Pesquisa do Estado de São Paulo (FAPESP) from Brazil are gratefully recognized
for their financial support. Also, the authors want to thank Mr. René Veillette from
Laboratoire de Caractérisation des Matériaux at Institut de Recherche d’Hydro-Québec for
TEM images used for the quantitative analysis study and the technical staff of Laboratório
Nacional de Luz Síncrotron (LNLS) where the SAXS measurements were performed.

CHAPITRE 3
ARTICLE 2: INTERFACIAL MOLECULAR DYNAMICS OF STYRENIC BLOCK COPOLYMER-BASED NANOCOMPOSITES WITH CONTROLLED SPATIAL
DISTRIBUTION
E. Helal 1, L.G. Amurin1,a, D. J. Carastan 2, R.R. de Sousa Jr. 2, E. David 1, M. Fréchette 3
and N.R. Demarquette 1, 1Mechanical Engineering Department, École de Technologie Supérieure,
Montréal, QC, Canada aCurrent affiliation: MackGraphe Research Center, Mackenzie Presbyterian University, São
Paulo, SP, Brazil 2Center for Engineering, Modeling and Applied Social Sciences, Federal University of ABC,
Santo André, SP, Brazil 3Institut de Recherche d’Hydro-Québec, Varennes, QC, Canada
This article has been published in:
Polymer, Volume 113, 24 March 2017, Pages 9–26
http://dx.doi.org/10.1016/j.polymer.2017.02.025
Abstract
The dielectric properties of nanocomposites of polystyrene-b-poly(ethylene-co-butylene)-b-
polystyrene (SEBS) triblock copolymers containing organically modified clay nanoparticles
featuring controlled spatial orientation at the nanoscale: isotropic, totally oriented and
partially oriented, have been investigated and correlated with the nanocomposite
morphologies. A slow dielectric relaxation process attributed to elastomer chains with
reduced mobility confined at nanoparticle/polymer interphase was observed in all the
nanocomposites and was found to be dependent on the orientation of nanoclay and
polystyrene (PS) domains, the location of clay tactoids as well as the PS block fraction. A
dielectric “interfacial” glass transition temperature Tgi assigned to this characteristic
CHAPTER 3
78
relaxation was estimated to occur at temperatures ranging between 6 °C and 35 °C depending
on the nanocomposite, which is much higher than the bulk rubber phase glass transition
temperature, normally lower than -40 °C for the studied block copolymers. Interestingly, the
highest Tgi were associated with the nanocomposites featuring random or partial orientation
and/or selective location of nanoparticles in the rubber phase.
Keywords: block copolymer nanocomposite, nanoclay, interphase, confinement, orientation,
controlled dispersion, selective location
3.1 Introduction
In nanocomposite materials, controlled orientation of certain anisotropic nanoparticles such
as nanoclay (Carastan et al., 2014; E Helal et al., 2015) , carbon nanotubes (Goh, Ismail, &
Ng, 2014) and recently boron nitride nanotubes and nanosheets (Z. Cui, Cao, Ma, Dobrynin,
& Adamson, 2015; Terao et al., 2010) is very beneficial for a wide spectrum of applications
requiring excellent mechanical, electrical and/or thermal properties. For example, in the case
of mechanical reinforcement, the alignment of nanoclay was reported in several publications
to induce an improved mechanical strength in the alignment direction (Galgali, Agarwal, &
Lele, 2004). In the specific case of nanodielectrics, more efficient electron scattering and
consequently higher breakdown strength perpendicular to the nanoparticles alignment
direction were reported (David et al., 2013; Fillery et al., 2012; E Helal et al., 2015; Tomer et
al., 2011). Simultaneously, nanoparticle alignment was shown to reduce dielectric losses in
the direction perpendicular to the main plane of the aligned nanoparticles (E Helal et al.,
2015). This controlled orientation can be obtained using a wide range of techniques (Goh et
al., 2014) although spatial alignment of nanoparticles according to 2D and 3D patterns is
still a challenging field of study (Richard A Vaia & Maguire, 2006).
In applications requiring tuned spatial distribution of nanoparticles, the use of block
copolymers can be really an asset due to the different nanoscale morphologies these materials
present (Hamley, 2001; Helfand, 1975; Ohta & Kawasaki, 1990; Sarkar & Alexandridis,
2015; Semenov, 1993). To probe the effect of tailored morphology and orientation of such
79
designed nanocomposites on their polymer-filler interactions and implicitly on their final
performance, techniques such as broadband dielectric spectroscopy (BDS) are often required
(Kremer & Schönhals, 2012).
In fact, the performance of polymer nanocomposites in general is governed by the interphase
region (Roy et al., 2005; Leszek A Utracki, 2010) which consists mainly of a bound layer
where the motion of macromolecular chains is strongly restricted affecting several properties
including dielectric and mechanical properties (Hernández, Carretero-González, Verdejo,
Ezquerra, & López-Manchado, 2010; Qu et al., 2011; Leszek A Utracki, 2010; Vo et al.,
2011). The thickness and volume fraction of this interphase usually depend on the geometry
of the nanoparticles and their compatibility with the polymer matrix (L. Chen et al., 2009;
Klonos, Kyritsis, & Pissis, 2015; Yu Lin et al., 2015; Robertson & Rackaitis, 2011). It was
estimated using both experimental techniques (L. Chen et al., 2009; Yu Lin et al., 2015) and
molecular dynamics simulations (Gao, Liu, Zhang, & Cao, 2014; Ghanbari, Rahimi, &
Dehghany, 2013). Furthermore, an additional glass transition corresponding to the interfacial
polymer chains with restricted mobility was observed in some nanocomposites featuring
strong attractive interfacial interactions (L. Chen et al., 2009; Y. Gao et al., 2014; Ghanbari
et al., 2013; Hernández et al., 2010; Hernández, del Mar Bernal, Verdejo, Ezquerra, &
López-Manchado, 2012; Holt et al., 2014; Klonos et al., 2015; Yu Lin et al., 2015; Robertson
& Rackaitis, 2011; Tsagaropoulos & Eisenberg, 1995; Tsagaropoulos & Eisenburg, 1995; Vo
et al., 2011) and predicted by modeling and simulations (Starr, Schroder, & Glotzer, 2002) as
well, for relatively thick bound layers.
The reduced mobility of polymer chains in the interphase region of homopolymer-based
nanocomposites has been well investigated during the last years, especially the effect of
interaction strength between nanoparticles and the polymer matrix. However, to the best of
our knowledge, there is only little literature regarding the interphase region in block
copolymer based nanocomposite systems and specifically the effect of the orientation of
nanoparticles and block copolymer nanodomains on polymer dynamics in this interphase
region. In fact, in the case of nanocomposites prepared from multicomponent polymer

80
matrices, an additional degree of complexity is added to the system as the nanofillers can
interact differently with the constitutive components (Sarkar & Alexandridis, 2015; Vo et al.,
2011). These interactions are usually interdependent and hard to quantify separately. Few
studies investigated the dielectric behavior of copolymers and its dependence on chemical
and structural factors such as sulfonation (H. Chen et al., 2011) and compatibility with
different nanofillers. In this context, Vo et al. (Vo et al., 2011) studied the dielectric behavior
of styrene-butadiene rubber (SBR) random copolymer filled with three different
nanoparticles: nanoclay, silica and carbon black. They reported a new relaxation mode for all
three systems attributed to the segmental motion of rubber chains with reduced mobility at
the polymer-nanoparticle interface. Moreover, they evaluated an interfacial glass transition
temperature Tgi associated with this relaxation process. The highest Tgi was attributed to the
SBR/clay system indicating stronger interaction and better compatibility compared to the two
other fillers.
In this work, we investigated polystyrene-b-poly(ethylene-co-butylene)-b-polystyrene
(SEBS) thermoplastic elastomer as the block copolymer matrix since it presents excellent
features suitable for many applications, such as good mechanical properties (Balsamo et al.,
2006; Holden et al., 2004) , good resistance to water treeing (Liu et al., 2011; Z. Ma et al.,
2010) as well as good electromechanical coupling (B. Kim et al., 2011). It is a symmetric
triblock copolymer composed of two polystyrene (PS) end-blocks of the same length at the
extremities and a poly (ethylene-co-butylene) (PEB) rubber mid-block. Organically modified
nanoclays, known for their beneficial effect on mechanical and dielectric properties of
polymer nanocomposites including breakdown strength, resistance to surface erosion and
reduction of space charge accumulation (David et al., 2013; Fillery et al., 2012; MF Fréchette
et al., 2008; Galgali et al., 2004; E Helal et al., 2015; Tomer et al., 2011; Leszek A Utracki,
2010), were added to the thermoplastic elastomer. Four sets of block copolymer
nanocomposites containing three different weight fractions of PS phase (0.13, 0.20 and 0.30)
were investigated in total. Depending on these ratios and using several fabrication processes,
different morphologies were successfully prepared: isotropic vs. totally oriented vs. partially
oriented polystyrene nanodomains and clay nanoparticles. Moreover, the degree of

81
exfoliation and location of clay particles inside PS or PEB domains were tailored using a
specific SEBS grade with a maleic anhydride (MA) grafted on the PEB block.
In a first step, the orientation of nanoclay and PS nanodomains in the different samples as
well as the state of order of the block copolymer were fully characterized by SAXS and
TEM. In a second step, the dielectric response was studied as a function of frequency and
temperature in order to investigate the influence of the block copolymer tuned architecture on
the polymer dynamics, which may affect implicitly the engineering properties such as
dielectric losses, breakdown strength and mechanical stiffness, to name a few. The dielectric
spectroscopy results were correlated to SAXS and TEM results in order to come up with a
template of block copolymer nanodielectrics (M. F. Frechette, Trudeau, Alamdar, & Boily,
2004) with controllable morphology and properties suitable for different dielectric
applications. In particular, a slower dielectric relaxation mode compared to the main
relaxation responsible for the bulk glass transition of the rubbery phase was observed in all
nanocomposites and attributed to the segmental motion of rubber chains with reduced
mobility located at the polymer-nanoparticle interphase. An interfacial glass transition Tgi
associated with this new relaxation mode was estimated and used to quantify the interaction
strength between the nanoparticles and the polymer chains depending on the configuration,
the styrene block content and the location of the nanoparticles in one block or another.
Besides, this new dielectric relaxation process, attributed to rubber chains located at the
interfacial layer, was also observed in the dynamic mechanical responses of samples
prepared from SEBS grade containing 30 wt% of PS block. Finally, the thickness of the
interfacial layer was estimated in the range 7-10 nm.
3.2 Materials and methods
Four grades of symmetric triblock copolymer SEBS donated by Kraton were used: G1643,
G1645, G1652 and FG1901. These grades contain different fractions of PS block ranging
from 13 to 30 wt%. Besides, the FG1901 grade contains 1.4-2 wt% of maleic anhydride
(MA) group attached to its elastomeric PEB block. All the grades contain 0% of diblocks.
More details regarding the physical properties and morphologies of these polymers are

82
reported in Table 3-1. Montmorillonite clay grade Cloisite 20A purchased from Southern
Clay (Gonzales, USA) and modified with dimethyl di(hydrogenated tallow) quaternary
ammonium salt, was used as nanofiller for the nanocomposites preparation. More details
regarding the physical properties of the polymers as well as the modification and size of clay
particles were provided in the previous studies published by co-authors in the same context
of research (Leice G Amurin, Carastan, & Demarquette, 2016; Carastan et al., 2014; De
Sousa Jr, Amurin, Demarquette, & Carastan, 2014; E Helal et al., 2015). All the materials
studied in this paper were used as received.
Table 3-1: Properties of SEBS-13, SEBS-20 and SEBS-30
Block copolymer
Grade PS wt%
MFI (g/10min)
ρc
(g/cm3) TOOTd (°C) TODTe
(°C) SEBS-20 G1643 20 18a 0.9 always cylindrical > 200
SEBS-13
G1645
13
40b
0.9
between 150 and 160
(transition to spherical)
190-200
SEBS-30 G1652 30 5b 0.91 always cylindrical >200 SEBS-30-MA FG1901* 30 22b 0.91 always cylindrical >200 a melt flow index measured at 230°C/2.16 Kg, ASTM D1238, provided by the supplier b melt flow index measured at 230°C/5 Kg, ASTM D1238, provided by the supplier c specific gravity, provided by the supplier d order to order transition (OOT) estimated from small amplitude oscillatory shear (SAOS) and small angle X-ray scattering (SAXS) measurements not presented in this manuscript. e order to disorder transition temperatures (ODT) estimated from small amplitude oscillatory shear (SAOS) and small angle X-ray scattering (SAXS) measurements not presented in this manuscript. * FG1901 grade contains 1.4-2 wt% of maleic anhydride (MA)
The nanocomposites were prepared by solvent casting, sheet die extrusion or film blowing
extrusion to achieve different morphologies. In the case of solvent casting process, the SEBS
powder and the nanoparticles were mixed in toluene by magnetic stirring at 60 °C. The
mixture was subsequently poured into a Petri dish and left in open air under the fume hood

83
for several days until complete evaporation of solvent. They were subsequently dried in a
vacuum oven and annealed according to specific temperature profiles selected depending on
the styrene content, in order to reach equilibrium morphologies (Hadjichristidis, Hirao,
Tezuka, & Du Prez, 2011). For SEBS-13 and SEBS-20, the sequence: 10 minutes at 50 °C,
30 minutes at 110 °C, 2 hours at 150 °C and 24 hours at 60 °C was used while for SEBS-30
and SEBS-30-MA, the sequence 20 min at 60 °C, 20 min at 100 °C, 20 min at 150 °C and 10
min at 200 °C was used as published in reference (E Helal et al., 2015). The samples
prepared by sheet die extrusion were obtained according to references (Leice G Amurin et
al., 2016; Carastan et al., 2014). In a typical procedure, clay nanoparticles were mixed with
SEBS in a twin screw extruder equipped with a sheet die, at a temperature profile ranging
from 160 to 190 °C for SEBS-20, equal to 150 °C for SEBS-13 and equal to 200 °C for
SEBS-30 and SEBS-30-MA and a screw speed of 100 rpm. The films prepared from SEBS-
20 by film blowing extrusion were processed in a first step following the same procedure of
sheet die extrusion. Subsequently, the samples were processed in a single screw extruder
using the same temperature profile and a screw speed equal to 30 rpm. The latter was
connected to an annular die with controllable air pressure inside the tube in order to induce
lateral elongation and promote biaxial orientation of the block copolymer. In this study, the
resulting films were inflated with air at two blow-up ratios: R1=1 and R3=3 in order to
initiate respectively uniaxial and biaxial orientation directions. More details regarding this
processing method are available in reference (De Sousa Jr et al., 2014) published by co-
authors. The sheet die extrusion and the film blowing extrusion processes are illustrated in
Figure 3-1.
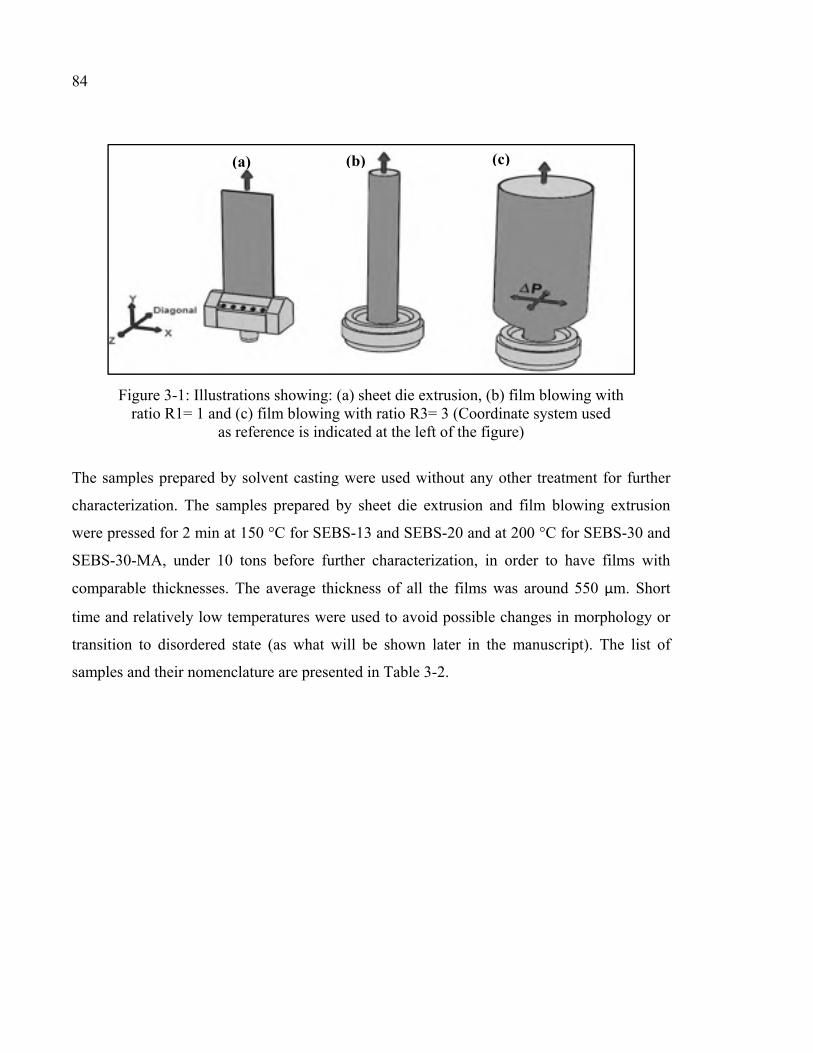
84
Figure 3-1: Illustrations showing: (a) sheet die extrusion, (b) film blowing with ratio R1= 1 and (c) film blowing with ratio R3= 3 (Coordinate system used
as reference is indicated at the left of the figure)
The samples prepared by solvent casting were used without any other treatment for further
characterization. The samples prepared by sheet die extrusion and film blowing extrusion
were pressed for 2 min at 150 °C for SEBS-13 and SEBS-20 and at 200 °C for SEBS-30 and
SEBS-30-MA, under 10 tons before further characterization, in order to have films with
comparable thicknesses. The average thickness of all the films was around 550 μm. Short
time and relatively low temperatures were used to avoid possible changes in morphology or
transition to disordered state (as what will be shown later in the manuscript). The list of
samples and their nomenclature are presented in Table 3-2.
(a) (b) (c)

85
Table 3-2: Nomenclature of nanocomposites
Polymer Nanoparticles wt%
Porcessing method Nomenclature
SEBS-20 0 Sheet die extrusion SEBS-20-extrusion SEBS-20 5 Sheet die extrusion SEBS-20-20A-extrusion SEBS-20 0 Solvent casting SEBS-20-solution SEBS-20 5 Solvent casting SEBS-20-20A-solution SEBS-20 0 Film blowing ratio R1 SEBS-20-film blowing R1 SEBS-20 5 Film blowing ratio R1 SEBS-20-20A-film blowing R1 SEBS-20 0 Film blowing ratio R3 SEBS-20-film blowing R3 SEBS-20 5 Film blowing ratio R3 SEBS-20-20A-film blowing R3 SEBS-13 0 Sheet die extrusion SEBS-13-extrusion SEBS-13 5 Sheet die extrusion SEBS-13-20A-extrusion SEBS-13 0 Solvent casting SEBS-13-solution SEBS-13 5 Solvent casting SEBS-13-20A-solution SEBS-30 5 Sheet die extrusion SEBS-30-20A-extrusion SEBS-30 5 Solvent casting SEBS-30-20A-solution
SEBS-30-MA 5 Sheet die extrusion SEBS-30-MA-20A-extrusion
It is worth noting that the morphology and the dielectric response of the materials prepared
from the SEBS-30 and SEBS-30-MA grades have been already reported in previous studies
(Leice G Amurin et al., 2016; Carastan et al., 2014; E Helal et al., 2015). In particular, it was
demonstrated, by TEM and XRD (Carastan et al., 2014), that in the presence of MA, clay
particles are mostly exfoliated and located in the PEB phase while in its absence an
intercalated clay structure is dominant and clay tactoids cross PS domains. At increasing clay
loading up to 7.5wt%, both the average distance between (100) planes of the cylindrical
structures and the diameter of PS cylinders increase (Leice G Amurin et al., 2016).
In terms of dielectric properties, it was shown that the alignment of PS cylinders results in an
initial decrease of the breakdown strength that was compensated by the improvement induced
through the alignment of clay tactoids. The highest increase was equal to 45% compared to
unfilled and aligned SEBS-30, at 5wt% loading of clay. In this manuscript, the frequency-
domain dielectric response of these samples will be investigated in terms of comparison.

86
3.3 Characterization
The morphology of the as-obtained nanocomposites was characterized by small angle X-ray
scattering (SAXS) and transmission electron microscopy (TEM). Subsequently, the dielectric
properties and the dynamic mechanical properties were characterized by means of
respectively broadband dielectric spectroscopy (BDS) and dynamic mechanical analysis
(DMA).
3.3.1 Small Angle X-ray Scattering
The SAXS patterns were obtained using Bruker NanoSTAR with 1.5 kV CuKa radiation.
The sample-to-detector distance was 650 nm. Besides, bidimensional detectors were used in
order to evaluate potential anisotropic features in the samples. The data were analyzed using
Fit2D software, without any background subtraction.
3.3.2 Transmission Electron Microscopy
The TEM was performed with a JEOL 2100F microscope. Prior to observations, ultrathin
sections of few tens of nanometers were cryo-cut using an ultra-microtome operated at -100
°C and deposited on copper grids. The grids were also stained during 30 minutes with
ruthenium tetroxide RuO4 vapor in order to determine the block copolymer morphology and
to evaluate the location of clay nanoparticles.
3.3.3 Broadband dielectric spectroscopy
In terms of dielectric properties, the complex dielectric permittivity of the nanocomposites
was measured using a Novocontrol broadband spectrometer. Specimens of 20 mm in
diameter were placed between two parallel brass plated electrodes. Measurements swept
through a frequency range from 10-2 Hz up to 105 Hz at a temperature range varying from 25
°C to 90 °C at 5 °C steps, under an rms excitation voltage of 1 V.
87
3.3.4 Dynamic mechanical analysis
The measurements were performed using a TA Q800 Instrument operated in tensile mode.
All the scans were done from -100 °C to 130 °C. The test conditions were as follows: rate of
heating equal to 3 °C/min, resonant frequency equal to 1 Hz and strain amplitude equal to
0.1%. The tensile storage modulus (E’), loss modulus (E”) and damping factor (tan δ) were
evaluated.
3.4 Results and discussion
3.4.1 Morphology
SAXS analysis was performed on every sample before and after pressing in order to check
the type (cylindrical, spherical, lamellar…) and the stability of the morphology as well as the
orientation of both PS domains and clay nanoparticles. The diffraction patterns, before and
after pressing, were similar, indicating that the compression molding did not induce any
significant change in the initial morphologies. In addition, SAXS patterns were recorded at
different temperatures up to 140 °C in order to check for changes in the morphology and
state of order that might be encountered during thermal annealing or dielectric spectroscopy
scans, as those ones were carried out as a function of temperature. The relative plots
indicating peak positions were integrated as well from the 2D patterns. In the following
sections, the different samples are analyzed and classified depending on PS block and clay
nanoparticles orientations in three different categories: totally isotropic, totally aligned and
partially aligned morphologies.
3.4.1.1 Totally isotropic morphologies
Isotropic morphologies with totally random orientation of PS nanodomains and clay
nanoparticles were obtained in all the samples prepared by solvent casting independently
from the polystyrene block content (13, 20 or 30 wt%). Typical diffraction patterns
corresponding to SEBS-13-solution and SEBS-20-solution materials are reported in Figure A

88
II-1 of the supporting file (annex II). The patterns feature concentric rings, in the 3 directions
of measurement indicating isotropic orientation of both PS domains and nanoclay. In the case
of the pure copolymer, the concentric rings are related to the scattering from PS domains
while in the nanocomposite, this scattering is overlapped with more intense scattering from
clay nanoparticles. Similar features were observed in nanocomposites prepared from SEBS-
30-solution (SAXS data available in Figure A I-4 of annex I relative to (E Helal et al.,
2015)). TEM micrographs corresponding to SEBS-30-20A-solution nanocomposite are
reported in Figure A II-5 of the supporting file (Annex II). They confirm the isotropic
distribution of clay tactoids and PS cylinders in samples prepared by solvent casting method.
Figure 3-2 presents SAXS radial plots of scattering intensity as a function of scattering vector
q corresponding to neat materials and nanocomposites prepared by solvent casting from
SEBS-20 and SEBS-13 matrices. Results regarding samples prepared from SEBS-30 were
already published in a previous study (E Helal et al., 2015). The profiles were integrated for
5 different temperatures ranging from 25 °C to 140 °C. In Figure 3-2(a) and Figure 3-2(b)
corresponding to respectively neat SEBS-20-solution and its nanocomposite, the relative q-
positions of Bragg peaks follow the sequence 1:√3:√7 characteristic of a hexagonally packed
cylindrical structure. It can be seen that the intensity of the second peak increased slightly
with increasing temperature, as indicated by the arrows, which infers a positive effect of
thermal annealing in reaching equilibrium morphologies and consequently improving long-
range order (Hadjichristidis et al., 2011). In Figure 3-2(c), corresponding to the neat SEBS-
13-solution, the same features were observed. However, in the case of the nanocomposite
(Figure 3-2(d)), the first peak was detected at the same position but the second peak was very
weak or completely absent. In addition, no obvious improvement was observed with
increasing temperature. These results indicate that the state of order is altered in the presence
of clay nanoparticles and does not improve with annealing. In particular, this behavior might
indicate improved dispersion and degree of intercalation that, in addition to random
nanoparticles distribution, help to freeze the block copolymer structure even when subjected
to thermal annealing and to reduce the mobility of polymer chains located at the interphase.
A higher clay interlayer spacing, d, and consequently intercalation degree has been already

89
reported for nanocomposites prepared by solvent casting from SEBS-13 (d=3.59 nm)
compared to nanocomposites prepared from SEBS-30 (d=3.09 nm), both containing Cloisite
15A nanoparticles (Carastan et al., 2008). This observation will be correlated later with
dielectric spectroscopy results.
Figure 3-2: Scattering intensity as function of scattering vector q at different temperatures of: (a) SEBS-20-solution and (b) SEB-20-20A-solution nanocomposite, (c) SEBS-13-solution
and (d) SEBS-13-20A-solution nanocomposite
(b) (a)
(c) (d)

90
3.4.1.2 Totally aligned morphologies
Diffraction patterns corresponding to samples prepared by sheet die extrusion from SEBS-20,
SEBS-30 and SEBS-30-MA are not shown in this manuscript since they exhibit totally
aligned morphologies in the extrusion direction. Typical patterns were previously reported by
co-authors in reference (Carastan et al., 2014) for SEBS-30 materials. TEM micrographs of
SEBS-30-MA-20A-extrusion nanocomposites exhibiting aligned and mostly exfoliated clay
layers are reported in Figure A II-6 of the supporting file (annex II). Aligned morphologies
were not obtained in the case of SEBS-13-extrusion as this material has limited tendency to
align due to the low fraction of PS block (Leice G Amurin et al., 2016). The case of SEBS-
13-extrusion will be treated in the following section within partially aligned morphologies.
3.4.1.3 Partially aligned morphologies
In addition to totally random morphologies and totally aligned morphologies, some
intermediate configurations were successfully achieved depending on the content of styrene
and the process used. More specifically, materials prepared from SEBS-20 by film blowing
extrusion exhibit two distinct morphologies depending on the blowing ratio: R1=1 or R3=3.
Figure 3-3 shows the diffraction patterns ((a)-(b)) and the TEM images ((c)-(e))
corresponding to SEBS-20-film blowing R1 and its nanocomposite SEBS-20-20A-film
blowing R1. In particular, the sections examined by TEM were cut perpendicular to the flow
direction (i.e. parallel to XZ plane indicated in Figure 3-1). Diffraction patterns
corresponding to neat SEBS-20-R1, presented in Figure 3-3(a), show evidence of hexagonal
packing of PS cylinders in the Y direction while in the X and Z directions, two sets of Bragg
peaks can be observed indicating the alignment of the majority of PS cylinders parallel to Y
axis (the initial direction of extrusion as indicated in Figure 3-1). Relative to nanocomposites,
diffraction patterns corresponding to SEBS-20-20A-R1 (Figure 3-3(b)) show strong diffuse
spots related to the scattering of nanoclay along the X and Y directions, which indicates
dominant alignment of nanoclay parallel to the XY plane (the initial direction of the flow).
The presence of maxima in the diffuse spots is characteristic of intercalated nanoclay

91
structure, which was confirmed by X-ray diffraction results reported by co-authors for
similar samples (Leice G Amurin et al., 2016; Carastan et al., 2014). TEM images confirm
preferential alignment of PS domains and nanoclay in the main direction of the flow (when
PS domains appear as small well-defined circles as indicated by the full-line white rectangle
in Figure 3-3(e)). Nevertheless, they reveal the appearance of additional directions of
orientation for both PS cylinders and nanoclay, in less important fractions though. In some
regions, a fraction of PS cylinders rotated across the thickness (as indicated by the white
dotted rectangles in Figure 3-3(e)). However, the angle of orientation is in most of the cases
lower than 90°, meaning that they do not succeed in orienting perfectly along the thickness.
Besides, less strong scattering is also observed in the Z direction of the nanocomposite
diffraction patterns (Figure 3-3(b)), which indicates orientation of some clay tactoids in the
YZ plane (across the thickness of the sample). This observation is consistent with the TEM
image of Figure 3-3(c) showing that some small clay nanoparticles (indicated by the arrows)
are aligned perpendicular to the main orientation of bigger tactoids. This effect could be
promoted by the presence of a normal force (parallel to Z axis) induced by the tubular die.
However, the orientation of a small fraction of clay particles in directions other than the main
flow direction was reported even for samples prepared by sheet die extrusion (Carastan et al.,
2014). Radial plots of scattering intensity as a function of scattering vector q of the neat
material and the nanocomposite are presented in Figure A II-2 of the supporting file (annex
II). The 1:√3:√7 sequence characteristic of hexagonal structure is observed in both the neat
and the nanocomposite confirming the dominance of hexagonal cylindrical structure.
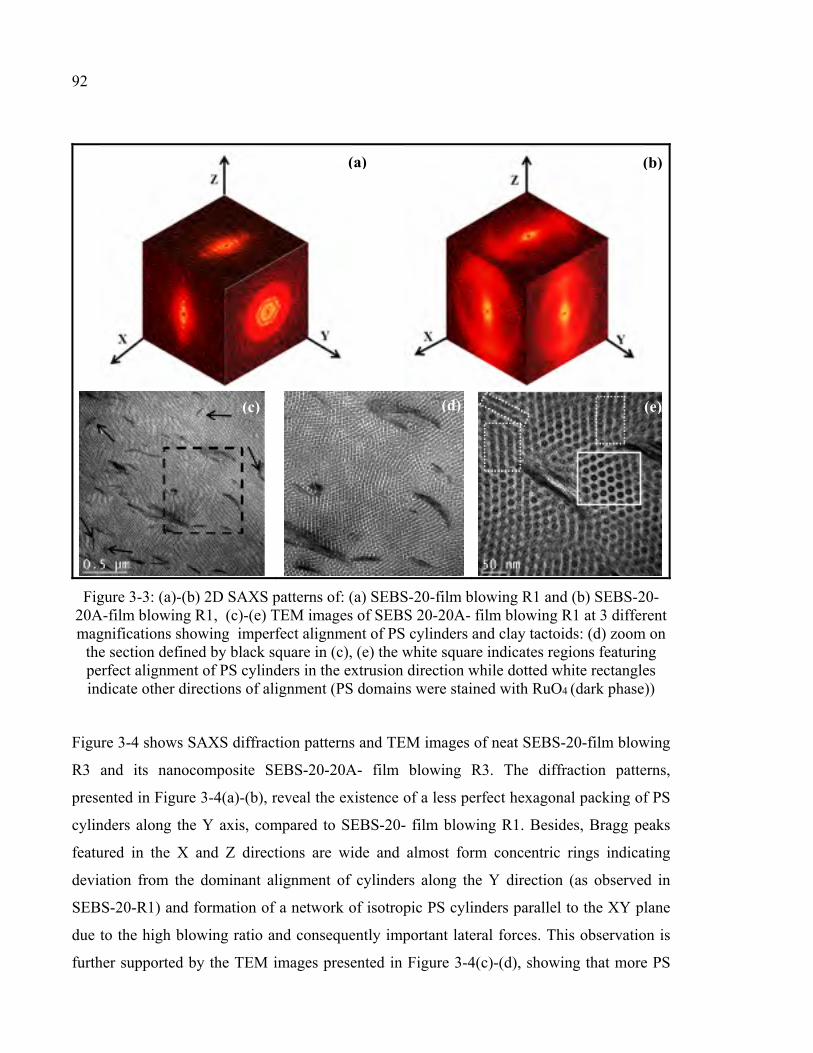
92
Figure 3-3: (a)-(b) 2D SAXS patterns of: (a) SEBS-20-film blowing R1 and (b) SEBS-20-20A-film blowing R1, (c)-(e) TEM images of SEBS 20-20A- film blowing R1 at 3 different magnifications showing imperfect alignment of PS cylinders and clay tactoids: (d) zoom on
the section defined by black square in (c), (e) the white square indicates regions featuring perfect alignment of PS cylinders in the extrusion direction while dotted white rectangles indicate other directions of alignment (PS domains were stained with RuO4 (dark phase))
Figure 3-4 shows SAXS diffraction patterns and TEM images of neat SEBS-20-film blowing
R3 and its nanocomposite SEBS-20-20A- film blowing R3. The diffraction patterns,
presented in Figure 3-4(a)-(b), reveal the existence of a less perfect hexagonal packing of PS
cylinders along the Y axis, compared to SEBS-20- film blowing R1. Besides, Bragg peaks
featured in the X and Z directions are wide and almost form concentric rings indicating
deviation from the dominant alignment of cylinders along the Y direction (as observed in
SEBS-20-R1) and formation of a network of isotropic PS cylinders parallel to the XY plane
due to the high blowing ratio and consequently important lateral forces. This observation is
further supported by the TEM images presented in Figure 3-4(c)-(d), showing that more PS
(a) (b)
(c) (d) (e)

93
domains are oriented in isotropic directions different from the initial flow direction. In Figure
3-4(b), corresponding to the diffraction pattern of SEBS-20-20A-film blowing R3
nanocomposite, similar features could be observed in the X and Y directions with more
intense and narrow scattering indicating more perfect alignment of nanoclay parallel to the
XY plane. However, by contrast to SEBS-20-20A-film blowing R1, no specific scattering
related to the orientation of clay tactoids in the Z direction is detected. This fact is most likely
due to the high lateral forces induced by the R3 blowing ratio that are able to overcome the
normal forces applied by the tubular die. Only lateral movements of nanoclay should be
possible; thus alignment in the initial direction of the flow is maintained. The radial plots
corresponding to SEBS-20-film blowing R3 and its nanocomposite SEBS-20-20A-film
blowing R3, presented in Figure A II-3 of the supporting file (annex II), exhibit again the
sequence 1:√3:√7 characteristic of hexagonal structure. However, it is worth noting that the
intensities of the peaks decreased, compared to R1 samples, which might indicate a lack of
order due to the increased stretching induced by the high blowing ratio. Moreover, the effect
of increasing temperatures in improving the intensities of the peaks is less obvious in these
samples, which might indicate a permanent alteration in the block copolymer ordered state
due to the important applied deformations. All these observations regarding lack of long
range order and alteration of initial alignment in the extrusion direction are in a good
agreement with previous results reported by co-authors in references (Leice G Amurin et al.,
2016; Carastan et al., 2013), stating that samples where initially aligned PS cylinders are
subjected to high strain values in the transversal direction exhibit misalignment due to the
rotation of PS domains that tend to align parallel to the deforming force direction. However,
this rotation is incomplete due to the competition between the alignment of PS domains and
copolymer molecules which don’t have enough time to relax. This stretching results as well
in breakage of cylinders in shorter domains and reduced long range order. More details
regarding these phenomena could be consulted in the cited references (Leice G Amurin et al.,
2016; Carastan et al., 2013).

94
Figure 3-4: (a)-(b) 2D SAXS patterns of: (a) SEBS-20-film blowing R3 and (b) SEBS-20-20A- film blowing R3 nanocomposite, (c)-(d) TEM images
of SEBS-20-film blowing R3 at different magnifications (PS domains (darker phase) were stained with RuO4)
As it was mentioned before, the materials prepared from SEBS-13 matrix by sheet die
extrusion do not exhibit totally aligned morphologies (Leice G Amurin et al., 2016).
Therefore, their case will be discussed in this section. SAXS diffraction patterns and radial
plots corresponding to these samples were integrated, in a similar trend to the previous
samples, and reported in Figure A II-4 of the supporting file (annex II).
In the diffraction patterns (Figure A II-4(a)-(b) of annex II), only the Z direction is reported
for the case of the pure material, as the 3 directions were similar. In particular, concentric
rings related to the scattering from the PS phase were observed in the 3 directions, for both
the neat copolymer and the nanocomposite. This fact indicates that the majority of PS
(a) (b)
(c) (d)
95
domains were not able to orient by the applied shear forces during extrusion and remain
randomly distributed due to the low polystyrene fraction. However, the scattering from the
nanoclay features direction dependence (Figure A II-4(b) of annex II). In fact, 2 strong spots
aligned parallel to Z direction corresponding to Bragg peaks associated with scattering from
nanoclay were observed in the XZ and YZ planes. These signals indicate the alignment of
nanoclays parallel to the extrusion direction. Since this alignment may potentially induce
simultaneous orientation of a fraction of PS cylinders, a partially isotropic PS/partially
oriented PS configuration will be rather considered for the case of SEBS-13-20A-extrusion
nanocomposite. Radial plots (Figure A II-4(c)-(d) of annex II) reveal similar characteristics
compared to the samples prepared by solvent casting in terms of dominance of hexagonally
packed cylindrical morphology and evolution of order degree with increasing temperature
and presence of nanoparticles.
In Table 3-3, a summary of all the studied samples, a brief description of their morphologies,
i.e. the orientation of clay tactoids and PS cylinders, as well as the corresponding illustrations
of the morphologies are presented. The nomenclature of the samples is also updated to recall
the concluded morphologies. In particular, the samples that are neither totally aligned nor
random will be referred to as “partially oriented” to indicate the presence of more than one
preferential orientation of PS cylinders or clay tactoids or both of them. The direction of the
applied electric field that was used for dielectric spectroscopy measurements, discussed in
the following section, is specified in one of the illustrations as well and remains valid for all
the samples.
It is worth noting that since the achieved orientations of PS cylinders and clay particles are
dependent on the processing technique, the obtained morphologies are metastable and may
change if the samples are subjected to additional processing steps. Therefore, a verification
of the morphology is needed if further steps are required. For instance, some studied samples
in this manuscript were hot pressed to obtain films of a precise thickness. To avoid potential
modification of the morphology, the pressing time and temperature were limited as possible.
The stability of the morphology after this step was checked by SAXS.

96
Table 3-3: Nomenclature, morphology description and morphology sketch of the nanocomposites
Nomenclature Morphology description Morphology sketch
SEBS-20-oriented SEBS-30-oriented
SEBS-30-MA-oriented
Uniaxially oriented PS cylinders in the flow direction along Y axis
SEBS-20-20A-oriented SEBS-30-20A-oriented
SEBS-30-MA-20A-oriented
Uniaxially oriented PS cylinders and nanoclay in the flow direction
along Y axis
SEBS-13-isotropic SEBS-20-isotropic SEBS-30-isotropic
Isotropic PS cylinders
SEBS-13-20A-isotropic SEBS-20-20A-isotropic SEBS-30-20A-isotropic
Isotropic PS cylinders and
nanoclay
SEBS-20-partially oriented R1
Mainly oriented PS cylinders in the flow direction along Y axis
Minor fraction oriented across the thickness along Z axis
SEBS-20-20A- partially oriented R1
Mainly oriented PS cylinders and nanoclay in the flow direction
along Y axis Few PS cylinders and nanoclay
oriented across the thickness parallel to YZ plane
SEBS-20- partially oriented R3
Isotropic orientation of cylinders in the flow direction parallel to
XY plane
SEBS-20-20A- partially oriented R3
Oriented nanoclay in the flow direction along Y axis
Isotropic orientation of cylinders in the flow direction parallel to
XY plane
SEBS-13- partially oriented
Partially isotropic PS cylinders Partially oriented PS cylinders in the flow direction along Y axis
SEBS-13-20A- partially oriented
Partially isotropic PS cylinders Partially oriented PS cylinders in the flow direction along Y axis Oriented nanoclay in the flow
direction along Y axis
Ext
rusi
on
Sol
ven
t ca
stin
g F
ilm
blo
win
g
Ext
rusi
on

97
3.4.2 Dielectric properties
The complex dielectric permittivity of an insulating material measures its response to an
applied electric field either through polarization mechanisms or charge carrier fluctuations
(Kremer & Schönhals, 2012). The corresponding equation is described in the supporting file
(equation (A II.1) in annex II).
In this manuscript, the dielectric response of the studied materials has been characterized as
functions of frequency and temperature. To better understand the origin and the dynamics
related to the relaxation modes observed in each material as well as to evaluate the
contribution from charge fluctuations, depending on the orientation of PS cylinders and
nanoclay, dielectric permittivity spectra of all nanocomposites were fitted according to
equation (A II.2) (Kremer & Schönhals, 2012), described in annex II, which comprises a
power law term to describe the contribution of charge fluctuations (A.K. Jonscher, 1983;
Andrzej K Jonscher, 1996) and a sum of Havriliak-Negami (HN) functions to take into
account the observed dipolar dielectric relaxation processes (Havriliak & Negami, 1967;
Hernández et al., 2010; A.K. Jonscher, 1983; Vo et al., 2011). There are as many terms in the
sum of HN functions as there are observed relaxations. Commercially available software was
used to obtain the curve-resolved spectra. Both real and imaginary parts of the dielectric
permittivity were considered for the fitting, computed based on nonlinear procedures.
However, only curve resolved spectra of the imaginary part are reported in the manuscript.
More details regarding the fitting procedure are available in the supporting file (annex II).
It is worth noting that the fitting of the experimental data to equation (A II.2) was applied to
the dielectric spectra of all nanocomposites in the temperature range from 40 °C to 90 °C,
where no specific molecular relaxation processes are supposed to occur in the neat material
as reported by previous studies (H. Chen et al., 2011; Kofod et al., 2011). In fact, the
segmental relaxation associated with the bulk glass transition of the rubber phase is too fast
and could not be observed within this temperature window while the relaxation associated
with the glass transition of PS phase is too slow and could not be observed either.

98
Figure 3-5 shows the imaginary part of the dielectric permittivity of neat SEBS-20 (Figure
3-5(a)) and its nanocomposites (Figure 3-5(b)-(e)), prepared by the three processing
techniques mentioned previously, at different temperatures ranging from 30 °C to 90 °C.
Only SEBS-20-partially oriented R3 was presented in Figure 3-5(a) as the other control
samples, without clay, prepared by sheet die extrusion or solvent casting feature similar
dielectric behavior. Moreover, for the sake of simplicity, the real part of the dielectric
permittivity is not reported in this manuscript since relaxation phenomena are observable in
both real and imaginary parts and the analysis of the imaginary part is more straightforward.
Typical spectra of real part of the dielectric permittivity could be consulted in Figure A II-8
of the supporting file (annex II).
The real part of the dielectric permittivity of the neat SEBS is almost frequency independent
and nearly equal to 2.35. At increasing temperatures, both the real and the imaginary parts of
the dielectric permittivity of the neat copolymer remained equal to or slightly decreased
below the value exhibited at room temperature (as it could be seen in the insert of Figure
3-5(a) and Figure A II-8 (annex II)). This decrease is probably related to the decreased
polymer density at increasing temperatures, which is linearly affecting the relative
permittivity (Blythe & Bloor, 2005). In addition, the high frequency relaxation peak related
to the glass transition of the rubber phase shifts towards higher frequencies with the
temperature increase (not observed in the studied range) causing a decrease of the dielectric
losses in the 103 to 105 Hz frequency window.
In all the nanocomposites, both ɛ’ and ɛ’’ increased simultaneously compared to neat SEBS
(Figure 3-5 of the manuscript, Figure A II-7 and Figure A II-8 of annex II), up to orders of
magnitude, particularly at low frequencies and high temperatures, indicating an important
contribution originating from the inclusion of nanoclay to the low frequency dispersion
(A.K. Jonscher, 1983; Andrzej K Jonscher, 1996). In particular, a pronounced increase is
observed in the isotropic samples featuring random clay tactoids distribution compared to the
samples where clay particles are aligned perpendicular to the electric field (Figure 3-5(e)
compared to Figure 3-5(b)-(d)). This behavior is most likely attributed to an anisotropic

99
nature of clay conductivity which might be considerably lower across the nanoplatelets
thickness than along their surface and the interlayer spacing, covered by a diffuse ionic layer
(David et al., 2013; Tokarský et al., 2016). Another possible contribution to this remarkable
increase of permittivity could be attributed to the presence of a fraction of polar organic
solvent that was trapped during the solvent casting process used for the preparation of the
isotropic samples.
It is worth noting that there is only little information regarding the experimental values of
dielectric permittivity and electrical conductivity of nanoclay which strongly depends on the
type of surface modification and the density of adsorbed cations (Uddin, 2008). The
dielectric properties of an organically modified clay tactoid, similar to the one used in this
study, were estimated through modeling by David et al. (David et al., 2013). In particular, the
pure direct current conductivity of clay was estimated to be equal to 10-9 S/m.
The fitting of the dielectric permittivity to equation (A II.2) confirmed that all the
nanocomposites exhibit, in addition to the charge fluctuation term, two relaxation modes that
were not observed in neat materials. Similar behavior was reported in the literature for clay
nanocomposites in general (David & Fréchette, 2013; David et al., 2013; Tomer et al., 2011)
and clay/rubber nanocomposites specifically (Hernández et al., 2010; Vo et al., 2011). The
charge fluctuation term is few orders of magnitude higher in the isotropic nanocomposite. In
particular, considering the case of pure electronic conductivity in the fitting process (n=0 in
equation (A II.2) of annex II), the values of conductivity σ0 are in the range 10-9 to 10-11 S/m
for the isotropic nanocomposite while they are in the range 10-12 to 10-14 S/m in the case of
oriented and partially oriented nanocomposites. In terms of relaxations, the first peak is
located at low frequencies and is often overshadowed by the low frequency dispersion. It is
attributed to Maxwell-Wagner-Sillars (MWS) polarization and is at the origin of the step-like
increase observed in the real part of dielectric permittivity at the lowest frequencies. The
second relaxation process was observed at intermediate frequencies and is shifted to higher
frequencies at increasing temperatures. It is at the origin of the second step-like increase
observed in real permittivity at intermediate frequencies. This additional relaxation could be

100
probably due to a MWS process from water absorbed at nanoparticles surface for instance
(David & Fréchette, 2013; Kremer & Schönhals, 2012) or to local segmental relaxation of
rubber chains with reduced mobility located at polymer/clay interfaces, which is slower than
the main segmental relaxation responsible for the bulk Tg of the elastomer (L. Chen et al.,
2009; Y. Gao et al., 2014; Ghanbari et al., 2013; Hernández et al., 2010; Hernández et al.,
2012; Holt et al., 2014; Klonos et al., 2015; Yu Lin et al., 2015; Qu et al., 2011; Robertson &
Rackaitis, 2011; Tsagaropoulos & Eisenberg, 1995; Tsagaropoulos & Eisenburg, 1995; Vo et
al., 2011). In the case of SEBS, the dynamic Tg of the PEB rubbery block is in the vicinity of
-40 °C, depending on the polystyrene block fraction (Leice G Amurin et al., 2016; Saleem et
al., 2014). An example of this fit is presented in Figure 3-5(f). It corresponds to the dielectric
loss spectrum of SEBS-20-20A-partially oriented R3 nanocomposite at 75 °C (Different
colors are used to denote the different contributions).
Moisture absorption in nanocomposites was reported several times in literature, especially for
epoxy-based nanocomposites containing polar groups and/or nanoparticles modified with
functional groups of relatively low hydrophobicity (David & Fréchette, 2013; Glaskova &
Aniskevich, 2009; I Preda et al., 2012). The absorbed water could form an interfacial
conductive layer between the nanoparticles and the matrix material, which gives rise to an
interfacial loss process (Kremer & Schönhals, 2012). In this study, the hypothesis of moisture
absorption is discarded as SEBS is an apolar copolymer exhibiting very low water uptake and
Cloisite 20A, the organically-modified clay used, features high hydrophobic character due to
its dimethyl ditallow ammonium based modifier (Darie et al., 2014). It has also been reported
that 24 hours of immersion in water was not found to have a significant impact on the
dielectric response of HDPE containing 10wt% of organically-modified clay (David,
Zazoum, Fréchette, & Rogti, 2015).

101
Figure 3-5: Imaginary part of the dielectric permittivity as a function of temperature of: (a) neat SEBS-20-partially oriented R3, (b) SEBS-20-20A-oriented, (c) SEBS-20-20A- partially oriented R1, (d) SEBS-20-20A-partially oriented R3, (e) SEBS-20-20A-isotropic and (f) an
example of the fitting corresponding to SEBS-20-20A-partially oriented R3 at 75 °C (Different colors are used to denote the different contributions)
(a) (b)
(c) (d)
(e) (f)

102
3.4.2.1 Effect of orientation on dielectric behavior
In order to confirm the origin of the second relaxation process, i.e. glass transition of the
interfacial rubbery chains with reduced mobility, and to evaluate the effect of PS cylinders
and nanoclay orientations on it, the temperature dependence of the relaxation times relative
to this process was analyzed. At each temperature, the relaxation time corresponding to the
peak maximum frequency was determined from the HN fit according to equation (A II.3)
(Kremer & Schönhals, 2012), described in the supporting file (annex II).
Figure 3-6 presents the relaxation times relative to the relaxation process observed at
intermediate frequencies as a function of inverse temperature for all the nanocomposites
prepared from SEBS-20. The temperature dependence of the relaxation times is well
described by the empirical Vogel-Fulcher-Tammann (VFT) equation (equation (A II.4)
described in the supporting file (annex II)), which is usually used to fit the segmental
relaxation process related to the bulk glass transition (Kremer & Schönhals, 2012). This
behavior supports the hypothesis of molecular relaxation at the origin of the second peak
observed at intermediate frequencies. The parameters of the VFT fit of each nanocomposite
were computed and listed in Table 3-4. Besides, a dielectric “interfacial” glass transition
temperature Tgi was associated to this relaxation mode in analogy with the glass transition
temperature assigned to the segmental relaxation of the bulk rubber phase. This temperature
was estimated by extrapolating the VFT fit to an extremely long relaxation time,
conventionally chosen equal to 100 seconds (Kremer & Schönhals, 2012; Vo et al., 2011).
The calculated temperatures are listed in Table 3-4 as well. In particular, the obtained values
of the VFT parameters τ0, B and T0 related to this new relaxation mechanism governing the
mobility of the interfacial chains are in the same range of those reported previously by
several groups for different rubber based nanocomposites where a similar phenomenon was
observed such as Vo et al. (Vo et al., 2011) for their SBR based nanocomposites, Lin et al.
(Yu Lin et al., 2015) for their Poly(vinylacetate)/silica nanocomposites and Wu et al. (Wu,
Tang, Guo, Zhang, & Jia, 2013) for their Butadiene-Styrene-Vinyl pyridine rubber/Graphene
Oxide nanocomposites.
103
In addition, the kinetic fragility index F, which characterizes how rapidly the dynamics of a
material slow down as it is cooled toward the glass transition temperature, was estimated
according to equation (A II.5) (Angell, 1991; Böhmer, Ngai, Angell, & Plazek, 1993)
described in the supporting file (annex II). Considering that the behavior of the relaxation
time as function of temperature is described by the VFT equation, the derivative could be
calculated for each sample. The calculated values of F are reported in Table 3-4 as well.
It could be seen from Figure 3-6 that the sample with isotropic orientation features the
highest relaxation times and consequently the slowest dynamics while the oriented
nanocomposite exhibits faster dynamics. Interestingly, both partially oriented
nanocomposites R1 and R3 exhibit even more reduced relaxation times especially toward the
highest studied temperatures. This speed up of chain dynamics was reported in literature for
rubber-based nanocomposites at increasing clay and graphene oxide nanoparticles loadings
and it was attributed to suppression of cooperativity of polymer chains confined in the
intercalated structures, when the confinement volume becomes comparable to that of the
cooperative rearranging regions (Hernández et al., 2010; Schönhals, Goering, Schick, Frick,
& Zorn, 2004; Wu et al., 2013). Moreover, at decreasing temperatures, the partially oriented
samples feature increased dependence on temperature and converge to the behavior of the
isotropic nanocomposite. This special behavior might be an indication of strong
intermolecular coupling, i.e. the relaxation times diminish more rapidly with increasing
temperatures (Bohmer, Angell, Richert, & Blumen, 1994; I Preda et al., 2013; Vilgis, 1993).
The analysis of the calculated interfacial glass transition temperature Tgi reveals that the new
relaxation process is located, depending on the nanocomposite configuration, in the
temperature range between 26 and 35 °C; much higher than the bulk glass transition of PEB
phase which will be studied by DMA analysis in a following section. Furthermore, this Tgi
seems to depend as well on the orientation of both nanoclay and PS cylinders, as it was
expected from the observed difference of the dependence of relaxation times on temperature.
Overall, the oriented samples prepared by extrusion exhibit the lowest interfacial glass
transition temperature, which might indicate that this controlled configuration helps
decreasing the induced molecular chains confinement, and consequently the interaction

104
strength in the interphase region. In fact, the isotropic and the partially oriented samples
exhibit characteristic Tgi up to 9 degrees higher, which is in good agreement with their
morphology featuring more complex patterns and disorder. Indeed, the calculated values of
fragility index confirm that partially oriented and isotropic samples feature more fragile
behavior and consequently higher intermolecular coupling and interaction strength at the
interface.
Figure 3-6: Temperature dependence of the relaxation times corresponding to SEBS-20 nanocomposites prepared by different processes: symbols correspond to relaxations times retrieved from
the HN function and solid lines correspond to VFT fitting
Table 3-4: VFT fitting parameters corresponding to SEBS-20 based nanocomposites
Samples τ0 (s) T0 (K) B (K) Tgi (K) F
SEBS-20-20A-partially oriented R1 4.24E-09 271 869 308 87.8
SEBS-20-20A-partially oriented R3 7.33E-07 280 483 306 95.8
SEBS-20-20A-oriented 1.05E-08 229 1620 299 43.7
SEBS-20-20A-isotropic 6.00E-04 285 232 305 80.1
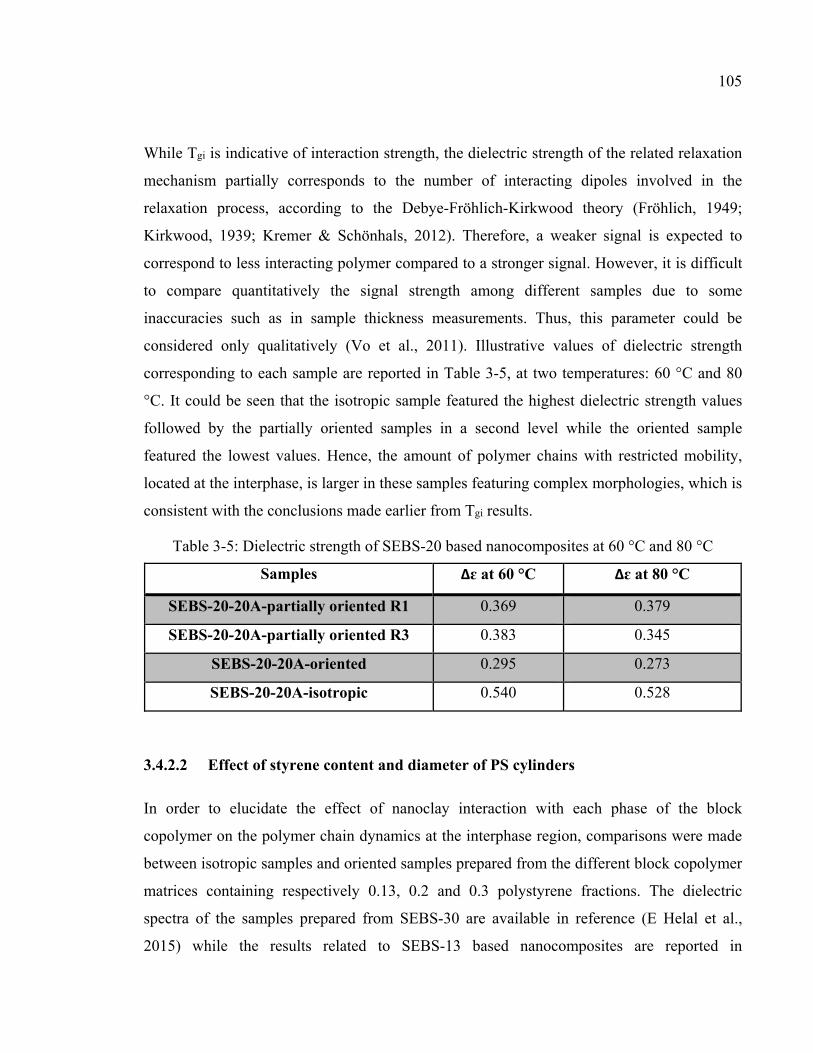
105
While Tgi is indicative of interaction strength, the dielectric strength of the related relaxation
mechanism partially corresponds to the number of interacting dipoles involved in the
relaxation process, according to the Debye-Fröhlich-Kirkwood theory (Fröhlich, 1949;
Kirkwood, 1939; Kremer & Schönhals, 2012). Therefore, a weaker signal is expected to
correspond to less interacting polymer compared to a stronger signal. However, it is difficult
to compare quantitatively the signal strength among different samples due to some
inaccuracies such as in sample thickness measurements. Thus, this parameter could be
considered only qualitatively (Vo et al., 2011). Illustrative values of dielectric strength
corresponding to each sample are reported in Table 3-5, at two temperatures: 60 °C and 80
°C. It could be seen that the isotropic sample featured the highest dielectric strength values
followed by the partially oriented samples in a second level while the oriented sample
featured the lowest values. Hence, the amount of polymer chains with restricted mobility,
located at the interphase, is larger in these samples featuring complex morphologies, which is
consistent with the conclusions made earlier from Tgi results.
Table 3-5: Dielectric strength of SEBS-20 based nanocomposites at 60 °C and 80 °C
Samples Δɛ at 60 °C Δɛ at 80 °C
SEBS-20-20A-partially oriented R1 0.369 0.379
SEBS-20-20A-partially oriented R3 0.383 0.345
SEBS-20-20A-oriented 0.295 0.273
SEBS-20-20A-isotropic 0.540 0.528
3.4.2.2 Effect of styrene content and diameter of PS cylinders
In order to elucidate the effect of nanoclay interaction with each phase of the block
copolymer on the polymer chain dynamics at the interphase region, comparisons were made
between isotropic samples and oriented samples prepared from the different block copolymer
matrices containing respectively 0.13, 0.2 and 0.3 polystyrene fractions. The dielectric
spectra of the samples prepared from SEBS-30 are available in reference (E Helal et al.,
2015) while the results related to SEBS-13 based nanocomposites are reported in

106
Figure A II-7 of the supporting file (annex II). Examples of the fitting according to equation
(A II.2) of the ESI file, for each type of nanocomposite are presented in Figure 3-7 (Different
colors are used to denote the different contributions). In particular, nanocomposites prepared
from SEBS-13 are well fitted by a power law term and two HN functions (similar to previous
samples prepared from SEBS-20), such as the example reported in Figure 3-7(a),
corresponding to SEBS-13-20A-isotropic. SEBS-30-20A nanocomposites, in comparison, are
rather fitted by three HN functions in addition to a power law term (Figure 3-7(b)). The third
relaxation peak has less dielectric strength than the two other peaks, i.e. the MWS peak and
the interfacial glass transition peak, and is most likely attributed to PS/PEB interphase
region, which starts to be more important with increasing PS content.
Figure 3-7: Examples of fitting according to equation (A II.2) in annex II of respectively: (a) SEBS-13-20A-isotropic at 65 °C (ɛ” presented in log scale due to high contribution
from charge fluctuation) and (b) SEBS-30-20A-oriented at 70 °C (Different colors are used to denote the different contributions)
Relaxation times corresponding to the interfacial glass transition relaxation peak are plotted
as a function of temperature in Figure 3-8. The results corresponding to nanocomposites
prepared from SEBS-20 discussed earlier (Figure 3-6) are reported again for the sake of
comparison. The VFT equations corresponding to each sample are plotted as well, while the
VFT parameters are summarized in Table 3-6. In particular, SEBS-13 nanocomposites,
featuring the lowest content of styrene, show similar values and dependence on orientation of
their interfacial Tgi, compared to samples prepared from SEBS-20, while SEBS-30
(b) (a)

107
nanocomposites, containing the highest fraction of styrene, show the lowest values and
sensitivity to orientation featuring Tgi values in the range of 6 to 9 °C. The fragility index
values confirm this observation as well. This fact might indicate that although clay
nanoparticles exhibit more affinity to the aromatic rings in PS blocks (Carastan et al., 2014),
they affect more the mobility of chains in the rubbery PEB phase, and consequently are
located more in contact with this phase. This latter observation is consistent with TEM
images reported in Figure 3-3(d)-(e), showing the presence of intercalated nanoclay that
either cross PS cylinders or are located completely outside PS cylinders if they are relatively
big. Another possible reason could be related to the cylinder diameter, which is reduced with
decreasing PS block content, providing more space for the contact between the clay
nanoparticles and the PEB blocks. In fact, the diameter of PS cylinders in SEBS-13 is
estimated to be equal to 9.7 nm according to calculations based on SAXS results (not
reported in the manuscript), while in SEBS-20 and SEBS-30, the estimated diameter is
respectively equal to 12.5 nm, according to the TEM image reported in Figure 3-3(e), and
13.5 nm according to a TEM image reported in reference (E Helal et al., 2015). As a
consequence, in samples prepared from SEBS-30, the contact volume between clay
nanoparticles and rubber chains might be reduced by the increased diameter of glassy PS
rods, in a similar way in both oriented and isotropic samples, resulting in less sensitivity to
orientation.
From another point of view, it could be seen that the relaxation times corresponding to
SEBS-13 and SEBS-30 nanocomposites are both smaller than those corresponding to SEBS-
20 nanocomposites. This behavior could be partially related to the bulk glass transition
temperature of PEB phase, which might depend on its overall fraction in the block
copolymer. In fact, the Tg of a specific block is usually different from the glass transition
temperature of the corresponding homopolymer, and it depends on the interphase region
between the blocks. In general, only when the compatibility between the blocks of a block
copolymer is weak, a sharp interface is observed due to strong segregation and the Tg of each
block is equal to the Tg of the corresponding homopolymers (Adhikari et al., 2003).
However, in the case of SEBS, the pendant groups of the hard PS phase might be mixed to

108
the soft PEB phase forming an interphase region, as predicted from the small relaxation peak
observed in SEBS-30 (Figure 3-7(b)). It will be shown later, by DMA measurements, that the
Tg of each block increases with increasing fraction of that block in SEBS block copolymer.
In general, it is expected that the block copolymer matrices featuring higher bulk Tg of their
PEB phase exhibit higher interfacial glass transition temperature and slower dynamics at a
given temperature above the Tgi, if other factors such as the orientation and the interaction of
nanoparticles with the block copolymer phases are maintained unchanged. This behavior is
partially achieved. In fact, SEBS-30 based nanocomposites exhibit the lowest bulk Tg of the
PEB block as what will be shown later by DMA, and simultaneously the fastest interfacial
dynamics and the lowest Tgi compared to materials prepared from SEBS-13 and SEBS-20.
However, one should keep in mind that the motion of polymer chains at the interphase region
does not depend only on the corresponding bulk Tg of the rubber phase, but it depends also
on other parameters including the interaction of nanoparticles with each block and the
orientation as concluded earlier.
Figure 3-8: Temperature dependence of the relaxation times corresponding to SEBS-13 and SEBS-30 nanocomposites
prepared by different processes: symbols correspond to relaxation times retrieved from the HN function and solid lines correspond
to VFT fitting, plots corresponding to SEBS-20 nanocomposites are presented again for comparison

109
Table 3-6: VFT fitting parameters corresponding to SEBS-13 and SEBS-30 based nanocomposites
Samples τ0 (s) T0 (K) B (K) Tgi (K) F
SEBS-13-20A- partially oriented 6.80E-09 244 1280 299 55.4
SEBS-13-20A-isotropic 7.16E-06 284 366 307 94.8
SEBS-30-20A-oriented 5.70E-10 220 1530 279 53.3
SEBS-30-20A-isotropic 2.59E-07 250 642 282 76.8
3.4.2.3 Effect of nanoparticles location and intercalation degree
To further understand the effect of the nanoparticles contact with one block or another on the
observed interfacial peak, samples where nanoparticles are completely located in PEB phase
are studied and compared to the previous results. The affinity of nanoparticles to PEB phase
was increased by the attachment of maleic anhydride (MA) to it. MA exhibits great
compatibility with the organic groups attached on the nanoparticles surface. Furthermore,
this increased affinity results in more pronounced intercalation of the elastomer chains in
clay galleries, disrupting the regular stacked layer structure of the organoclays and giving rise
to mostly exfoliated structure, as reported in our previous study (E Helal et al., 2015) (TEM
micrographs of SEBS-30-MA-20A nanocomposites exhibiting exfoliated structure are
available in Figure A II-6 of the supporting file (annex II)). Hence, a higher fraction of
elastomer chains is expected to be involved in this interphase region compared to the samples
prepared without MA. The comparison of relaxation times between SEBS-30-20A and
SEBS-30-MA-20A samples, plotted in Figure 3-9, shows that the presence of MA attached to
the rubber phase affected remarkably the dynamics of the interphase region. In particular,
relaxation times increased in the sample containing the MA graft, which indicates slower
dynamics. This behavior is expected due to the selective location of clay in the rubber phase,
which increases the amount of elastomer chains attached to the interface. In addition, the
degree of clay exfoliation is improved in the presence of MA, which results in a larger
number of interfaces and less efficient restriction of chains motion compared to intercalated

110
structures. Hence, the cooperativity of interfacial chains is higher, resulting in increased
relaxation times (Wu et al., 2013). These hypotheses are in agreement with the increased
estimated Tgi equal to 20 °C for SEBS-30-MA-20A, when compared to 6 °C for the sample
prepared without MA. These values were extrapolated from the VFT fitting parameters
reported in Table 3-7. The comparison of the dielectric strength values of the two
nanocomposites reported in Table 3-8 supports the same conclusion as well. In fact, the
dielectric strength of the sample containing MA is considerably higher than that of the
nanocomposite without MA.
Table 3-7: VFT fitting parameters corresponding to SEBS-30-MA-20A-oriented nanocomposite
Samples τ0 (s) T0 (K) B (K) Tgi (K) F
SEBS-30-MA-20A-oriented 7.91E-10 237 1430 293 58.7
Table 3-8: Dielectric strength corresponding to SEBS-30-20A vs. SEBS-30-MA-20A nanocomposites prepared by extrusion
Samples Δɛ at 60°C Δɛ at 80°C
SEBS-30-20A-oriented 0.252 0.233
SEBS-30-MA-20A-oriented 0.865 0.830

111
Figure 3-9: Temperature dependence of the relaxation times corresponding to SEBS-30-MA-20A-oriented nanocomposite: symbols correspond to relaxations times retrieved from the HN
function and solid lines correspond to VFT fitting (plot corresponding to SEBS-30-20A-oriented nanocomposite
is presented again for comparison)
Overall, BDS data revealed the appearance of a new relaxation mode attributed to rubber
chains with restricted mobility located at polymer/nanoparticle interfaces, in all the
nanocomposites prepared from SEBS-13, SEBS-20, SEBS-30 and SEBS-MA-30 grades. A
Tgi associated with this process is estimated to occur in the range 6 to 35 °C depending on the
nanocomposite morphology. To confirm the molecular origin of this relaxation process,
DMA was performed. Results will be discussed in the following section.
3.4.3 Dynamic mechanical analysis
Dielectric spectroscopy data discussed in this paper were mainly performed in the
temperature range from 30 to 90 °C and analyzed as a function of frequency. In order to
extend the study of relaxation phenomena to lower temperatures, to confirm the origin of the
new relaxation peak observed in BDS and to evaluate the dependence of bulk glass transition
temperatures of both PS and PEB blocks, respectively TgPEB and TgPS, on styrene fraction and

112
clay addition, dynamic mechanical analysis was carried out in a large temperature range from
-100 °C to 130 °C. In fact, in this range, both TgPEB and TgPS are expected to appear as peaks
in DMA tan δ graphs. Besides, any potential peak that will appear in addition will be
certainly due to a molecular relaxation, by contrast to BDS spectra, where relaxation
phenomena observed in hybrid materials could be due to either a molecular origin or
separation of charges at inner dielectric boundary layers (MWS polarization).
Figure 3-10 shows tan δ graphs corresponding to selected samples prepared from SEBS-30
(graphs corresponding to samples from SEBS-13 and SEBS-20 are not reported). It is worth
noting that the DMA measurements were conducted in the transverse direction for all the
studied samples (perpendicular to the main direction of PS cylinders alignment). In general,
all curves show evidence of two peaks which correspond to TgPEB (at low temperatures) and
TgPS (at high temperature). The values of TgPEB and TgPS corresponding to each material are
reported in Table 3-9, except TgPS corresponding to SEBS-13 samples where no clear peaks
were observed up to 130 °C. In a general trend, the glass transition temperature of each
block, either PS or PEB, and the height of its corresponding peak increases with increasing
fraction of that block in SEBS. This behavior is due to the fact that more chains of the
considered block are involved in the glass transition phenomena leading to a larger damping.
Besides, the Tg temperature and the intensity of the peak depend on the orientation of PS
cylinders. Indeed, TgPS of SEBS-20- partially oriented R1 material prepared by film blowing
is 6 degrees higher than SEBS-20-oriented, 106 °C vs.100 °C. Simultaneously, the intensity
of TgPS is reduced and that of TgPEB is considerably higher. This behavior might be due to the
fact that these samples are not completely aligned in the extrusion direction which leads to an
increasing fraction of PEB chains in the transverse direction, which is the direction of the
test, as well as more hindrance of PS chains mobility.
In the nanocomposites, the addition of clay results, in some cases, in the reduction of Tg peak
height and the broadening of the peak, such as the peaks corresponding to TgPS in both SEBS-
30-20A-oriented and SEBS-30-MA-20A-oriented nanocomposites, as shown in Figure 3-10.
These behaviors respectively indicate lower number of chains participating in the bulk glass
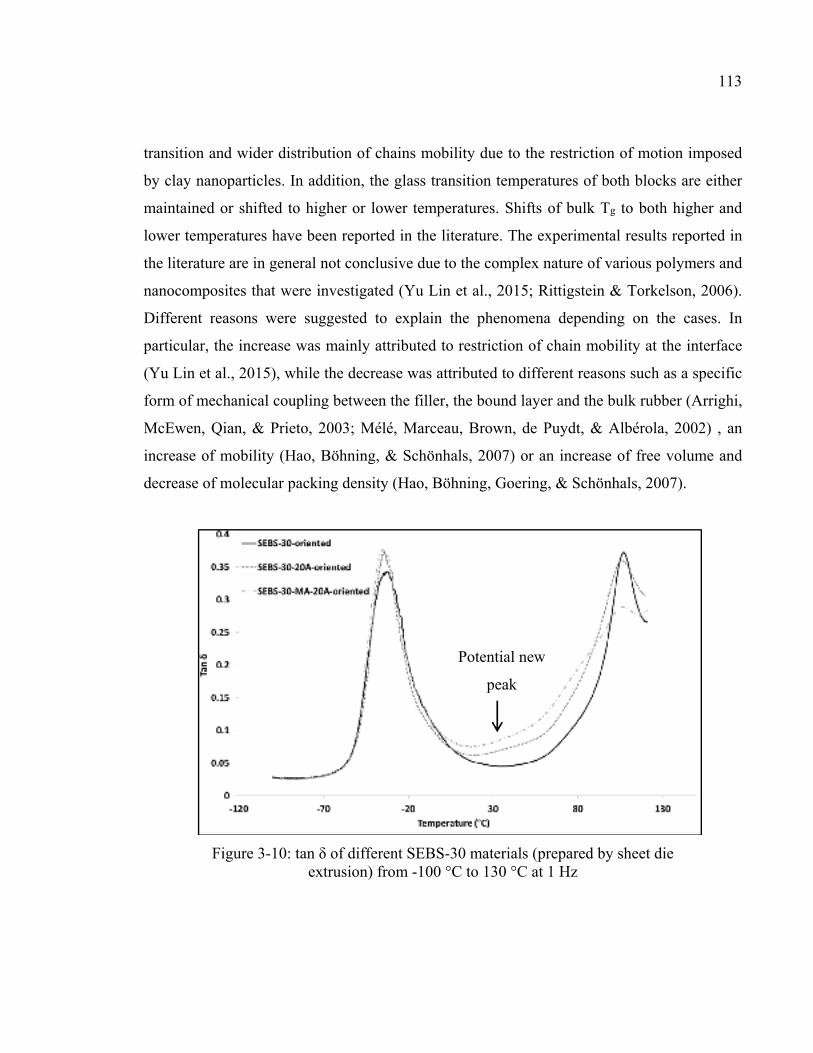
113
transition and wider distribution of chains mobility due to the restriction of motion imposed
by clay nanoparticles. In addition, the glass transition temperatures of both blocks are either
maintained or shifted to higher or lower temperatures. Shifts of bulk Tg to both higher and
lower temperatures have been reported in the literature. The experimental results reported in
the literature are in general not conclusive due to the complex nature of various polymers and
nanocomposites that were investigated (Yu Lin et al., 2015; Rittigstein & Torkelson, 2006).
Different reasons were suggested to explain the phenomena depending on the cases. In
particular, the increase was mainly attributed to restriction of chain mobility at the interface
(Yu Lin et al., 2015), while the decrease was attributed to different reasons such as a specific
form of mechanical coupling between the filler, the bound layer and the bulk rubber (Arrighi,
McEwen, Qian, & Prieto, 2003; Mélé, Marceau, Brown, de Puydt, & Albérola, 2002) , an
increase of mobility (Hao, Böhning, & Schönhals, 2007) or an increase of free volume and
decrease of molecular packing density (Hao, Böhning, Goering, & Schönhals, 2007).
Figure 3-10: tan δ of different SEBS-30 materials (prepared by sheet die extrusion) from -100 °C to 130 °C at 1 Hz
Potential new
peak

114
Table 3-9: Tgs of both PS and PEB blocks in different samples of SEBS based nanocomposites
Sample TgPEB (°C) TgPS (°C)
SEBS-13-partially oriented -23 -
SEBS-13-20A-partially oriented -27 -
SEBS-20-oriented -26 100
SEBS-20-20A-oriented -26 100
SEBS-20- partially oriented R1 -26 106
SEBS-20-20A- partially oriented R1 -20 110
SEBS-30-oriented -35 107
SEBS-30-20A-oriented -34 105
SEBS-30-MA-20A- oriented -33 104
In addition to the bulk glass transitions of PS and PEB blocks, nanocomposites prepared
from SEBS-30 seem to exhibit an additional low intensity peak occurring at intermediate
temperatures between TgPEB and TgPS, which might correspond to the glass transition of
interfacial rubber chains with reduced mobility (as indicated by the arrow in Figure 3-10).
However, this peak is not well resolved and as a consequence, resort to curve fitting was
necessary. Although, there is no theoretical expression to describe dynamic mechanical
relaxations as a function of temperature, the use of some empirical equations which
reproduce satisfactorily the asymmetry of tan δ peaks has been reported in the literature. One
such is the exponentially modified Gaussian (EMG) which was used by Tsagarapoulos et al.
(Tsagaropoulos & Eisenberg, 1995) and Cowie et al. (Cowie, Arrighi, Cameron, McEwan, &
McEwen, 2001) to characterize Tg peaks and particularly peaks related to Tg of interfacial
layers observed in several homopolymers containing relatively high fractions of fillers such
as silica nanoparticles and cellulose tricarbanilate. Another model based on the three-
parameter asymmetric double sigmoid (ADS) equation was successfully used by Arrighi et
al. (Arrighi et al., 2003) to characterize Tg of the interfacial layer observed in styrene
butadiene rubber (SBR) containing silica nanoparticles.

115
In this study, we adopted a model based on ADS equation, similarly to reference (Arrighi et
al., 2003), to describe both bulk Tg peaks and the new interfacial Tg peak. More details about
this equation and its characteristic parameters are available in reference (Arrighi et al., 2003)
and annex II (equation (A II.6)). The general model is composed of three ADS terms to
describe the three peaks. An additional ADS term with a large asymmetry in the high
temperature side was also considered to take into account the increasing baseline towards
high temperatures. For consistency, the same parameters were taken for the baseline term in
the neat SEBS-30-oriented and the nanocomposites. Examples of the fitting of both neat
SEBS-30-oriented and SEBS-30-20A-oriented nanocomposites showing the resolved Tg
peaks are reported in Figure 3-11.
Figure 3-11: Fitted tan delta curves showing bulk Tgs of PS and PEB blocks as well as Tgi of the interfacial layer (an additional ADS term is considered for the increasing
baseline):(a) SEBS-30-oriented and (b) SEBS-30-20A-oriented
The peak corresponding to the glass transition of the interfacial layer, Tgi, in both
nanocomposites, resulting from the curve-fitting process, is characterized by low intensity
and a broad shape indicating a large distribution of chains mobility in the interfacial layer.
Temperatures corresponding to Tgi peaks maxima are reported in Table 3-10. Taking the
difference between these values and TgPEB values reported in Table 3-9, Tgi of the interfacial
rubbery layer is estimated to occur 72 degrees higher than the bulk in the case of SEBS-30-
20A-oriented and 86 degrees higher than the bulk in the case of SEBS-30-MA-20A-oriented.
(a) (b)

116
This result is consistent with many findings in the literature expecting the glass transition of
tethered chains confined at the interface to occur 70 to 110 degrees higher than the bulk Tg
(Tsagaropoulos & Eisenberg, 1995). It is worth noting that these values of Tgi determined
from DMA data at 1 Hz are higher than those estimated earlier by BDS through the
extrapolation of the VFT equation at very low relaxation times (100s): 38 °C vs. 6 °C for
SEBS-30-20A-oriented and 53 °C vs. 20 °C for SEBS-MA-30-20A-oriented. However, the
trend is maintained. Hence, to check the similarity of the results given by both BDS and
DMA techniques, dielectric permittivity of SEBS-30-oriented and SEBS-30-20A-oriented
materials were mapped in an extended temperature range [-100, 150 °C] and dielectric loss
spectra were plotted as function of temperature at 1 Hz (Figure A II-9 and Figure A II-10 in
annex II). At this frequency, the peak corresponding to TgPEB is observed at -45 °C, which is
10 degrees higher than DMA and the peak corresponding to Tgi is observed at 40 °C, which
is 2 degrees higher than the value obtained by DMA. This difference between the results
given by the two methods is observed even when equivalent formalisms are used: electric
modulus vs. mechanical modulus. Thus, it is rather due to experimental conditions such as
different heating rates (Talja & Roos, 2001).
The fraction of bound polymer chains participating in the interfacial glass transition, FBound,
could be determined by dividing the area under Tgi peak by the sum of the areas of all Tg
peaks. Values of integrated area under each peak and estimated bound fractions are reported
in Table 3-10 as well. The bound fraction in SEBS-30-20A-oriented is around 7.5% while in
SEBS-30-MA-20A-oriented, it is around 12%. This is expected as the higher degree of
exfoliation in the latter nanocomposite results in more interfacial area. Taking into account
data about the average particle size of clay nanoparticles in SEBS-30 nanocomposites, which
were published previously by coauthors (Carastan et al., 2014), the thickness of interfacial
layer around each particle could be estimated in a similar fashion to the work of Arrighi et al.
(Arrighi et al., 2003). More details regarding this procedure could be consulted in annex II
(equations (A II.7) to equation (A II.10)).

117
Table 3-10: Interfacial Tgi, bound fraction and interfacial layer thickness in SEBS-30 based nanocomposites
Sample Tgi (°C) APEB APS AInt FBound T(nm)
SEBS-30-20A-oriented 38 9.475 10.15 1.59 0.075 10.5
SEBS-30-MA-20A-oriented 53 9.42 10.04 2.58 0.12 7.6
The average tactoid thickness, average lateral dimensions and average number of clay layers
per tactoid were determined based on the TEM quantitative analysis of clay dimensions in
SEBS-30-20A and SEBS-30-MA-20A nanocomposites reported by Carastan et al. (Carastan
et al., 2014). These values are listed in Table 3-11.
Table 3-11: Average dimensions of clay tactoids based on TEM quantitative analysis published by Carastan et al. (Carastan et al., 2014)
Average thickness (nm)
Average lateral size (nm)
Average number of layers
SEBS-30-20A-oriented 7.3 243.3 3
SEBS-30-MA-20A-oriented
3 116.3 2
To calculate the thickness of the interfacial layer in both nanocomposites, the clay tactoid
was considered as a solid particle surrounded on both lateral sides with constrained rubber
chains. Since the thickness of one tactoid is much smaller than its lateral dimension, the
fraction of chains that could be constrained along the thickness was neglected. Then, the
calculated interfacial layer thickness, t, was adjusted to take into account that some chains are
rather confined in the interlayer spacing, considering that the thickness of 1 clay layer is
equal to 0.94 nm (Carastan et al., 2014; Vermogen et al., 2005).These approximations are
illustrated in Figure 3-12. With these approximations the calculated values of interfacial layer
thickness are respectively equal to 7.6 nm for SEBS-30-MA-20A nanocomposite and 10.5
nm for SEBS-30-20A. They are in agreement with findings from the literature which
reported estimations of thickness of the interfacial layer. Whether evaluated experimentally
(Arrighi et al., 2003; Yu Lin et al., 2015) or theoretically (Y. Gao et al., 2014; Ghanbari et

118
al., 2013; Heid, 2015), the values reported in the literature did not exceed few nanometers
ranging from 2 to 10 nm in most of the reported studies.
Figure 3-12: Scheme of the interfacial layer covering the lateral side of clay particles: (a) First approximation: clay tactoid as a solid particle, (b) part
of the interfacial layer is between clay galleries
Hence, the fitting model based on ADS equation describes satisfactorily the bulk glass
transitions of both PEB and PS blocks as well as the Tgi of interfacial chains with restricted
mobility. It leads to an approximation of the interfacial layer thickness well in agreement
with values reported in the literature. However, it is worth noting that an important
hypothesis was assumed in the calculation of the interfacial layer thickness, which is the
absence of an immobilized layer corresponding to polymer chains that are tightly bounded
and don’t participate in neither bulk Tg nor interfacial Tgi (Tsagaropoulos & Eisenberg,
1995). In fact, the total number of chains participating in glass transition phenomena in a
nanocomposite is generally lower than the number of chains participating in the glass
transition of the neat material. Thus, by comparing the total area under Tg peaks in
respectively the nanocomposite and the pure material, the fraction of immobilized layer
could be determined and excluded when calculating the thickness of the interfacial layer
(Arrighi et al., 2003). The thickness of the immobilized layer was estimated in the literature
to be in the range 0.5 to 2 nm (Arrighi et al., 2003). In our case, comparing the tan delta
curves of the neat SEBS-30 and its corresponding nanocomposites, we could see that the
total area is higher in the case of nanocomposites, which gives the impression that more
chains are involved in the glass transition phenomena compared to the neat copolymer. This
behavior is puzzling and for this reason comparison with neat and estimation of the
immobilized fraction were not possible. As a consequence, the estimated thicknesses of the
interfacial layer might be smaller in reality. Another behavior that requires more
(a) (b)

119
investigation is the fact that the Tgi peak related to interfacial rubbery chains was not
observed in SEBS-13 and SEBS-20 nanocomposites by DMA, by contrast to BDS. Only
shifts of bulk Tg temperatures were obvious by this technique. However, for nanocomposites
prepared from SEBS-30 and SEBS-30-MA, the new relaxation process was confirmed by
both DMA and BDS. Furthermore, Tgi temperatures estimated by both techniques were in
agreement.
3.5 Concluding remarks
In this study, nanocomposites of SEBS block copolymer with cylindrical morphology and
organically modified clay nanoparticles have been successfully prepared with different
configurations of PS cylinders and clay nanoparticles. In particular, isotropic vs. oriented vs.
partially oriented morphologies have been successfully prepared by different processing
techniques and confirmed by SAXS and TEM.
In all the nanocomposites, a glassy interphase region was formed and gave rise to a new
relaxation mode corresponding to the interfacial rubbery chains with restricted mobility. A
dielectric “interfacial” glass transition Tgi, associated with this process, is estimated to occur
at temperatures ranging from 6 up to 35 °C, depending on the orientation of both PS domains
and clay nanoparticles, the fraction of polystyrene block as well as the location and the
degree of exfoliation of clay nanoparticles, which was tuned through the use of maleic
anhydride graft. The thickness of the interfacial layer was estimated through fitting of DMA
data and was found to be in the range 7.5-10.6 nm for nanocomposites prepared from SEBS-
30 and SEBS-30-MA.
Overall, the relaxation mode related to this interphase region was sensitive to the following
key parameters:
- Distribution of interfaces: oriented vs. isotropic vs. partially oriented; which affects the
area and the volume of the “interphase region” as well as the mobility of polymer chains. In
particular, samples featuring random or partially oriented morphologies were found to exhibit

120
higher interaction, dielectric strength and Tgi, up to 9 degrees higher, compared to their
oriented counterparts. Besides, partially oriented samples prepared by film blowing extrusion
featured the most “fragile” behavior and the fastest dynamics at temperatures above
estimated Tgi, compared to oriented and isotropic samples. This behavior could be attributed
to suppression of cooperativity of interfacial chains motion due to strong confinement in this
configuration.
- Ratio of PS/PEB, which affects the Tg of the bulk PEB block, the diameter of PS
cylinders as well as the amount and the mobility of PEB chains located in the interphase
region. In particular, the Tgi was found to decrease and to be less sensitive to orientation
effects, with increasing styrene content, most likely due to reduced amount of rubber chains
involved in the interphase region and increasing diameter of PS cylinders resulting in a
similar trend of confinement in both oriented and non-oriented samples.
- Location of clay nanoparticles either in PS or PEB blocks, which was modulated by the
use of maleic anhydride attached to the rubber phase. In particular, in the presence of MA,
clay particles were located exclusively within the elastomer block, resulting in increased
amount of rubber chains involved in the interphase region and consequently higher dielectric
strength associated to the relaxation process. Moreover, the degree of exfoliation of clay
tactoids is improved, which induced slower dynamics compared to intercalated structures
where strongly confined rubber chains exhibit reduced cooperativity and consequently
reduced relaxation times.
Finally, the charge fluctuation contribution to the dielectric loss was dependent as well on the
morphology. In particular, the conduction loss was reduced by 2 to 4 orders of magnitude in
the samples with controlled architecture, i.e. oriented and partially oriented, as clay
nanoparticles were quasi-aligned perpendicular to the electric field in these configurations.
Associated content
Supporting electronic information (ESI) file (reported in annex II): 2D and 1D SAXS
patterns, TEM micrographs and dielectric spectroscopy data related to the studied
nanocomposites are available. The procedure of the estimation of the interfacial layer
thickness is explained as well.

121
Author information
Corresponding Author: Nicole R. Demarquette, Department of Mechanical
Engineering, École de Technologie Supérieure, 1100 rue Notre Dame, H3C 1K3 Montreal,
Canada.
E-mail: [email protected]
Funding sources
The authors declare no competing financial interest.
Acknowledgments
The Natural Sciences and Engineering Research Council (NSERC), Hydro-Québec and
École de Technologie Supérieure (ÉTS) from Canada as well as Coordenação de
Aperfeiçoamento de Pessoal de Nível Superior (CAPES), Conselho Nacional de
Desenvolvimento Científico e Tecnológico (CNPq) and Fundação de Amparo à Pesquisa do
Estado de São Paulo (FAPESP) from Brazil are gratefully recognized for their financial
support.


CHAPITRE 4
ARTICLE 3: THERMOPLASTIC ELASTOMER NANOCOMPOSITES WITH CONTROLLED NANOPARTICLES DISPERSION FOR HV INSULATION
SYSTEMS: CORRELATION BETWEEN RHEOLOGICAL, THERMAL, ELECTRICAL AND DIELECTRIC PROPERTIES
E. Helal1, E. David1, M. Fréchette2 and N.R. Demarquette1 1Mechanical Engineering Department, École de Technologie Supérieure ÉTS,
Montréal, QC, Canada 2Institut de Recherche d’Hydro-Québec IREQ, Varennes, QC, Canada
This article has been published in:
European Polymer Journal, Vol. 94, September 2017, Pages 68-86
https://doi.org/10.1016/j.eurpolymj.2017.06.038
Abstract
Thermoplastic elastomer nanocomposites based on respectively polystyrene-b-poly(ethylene-
co-butylene)-b-polystyrene (SEBS) and polystyrene-b-poly(ethylene-co-butylene)-b-
polystyrene grafted maleic anhydride (SEBS-MA) block copolymers and containing
functionalized zinc oxide (ZnO) nanoparticles have been investigated as candidate materials
for high voltage (HV) insulation systems. The dispersion of the organically modified ZnO
nanoparticles has been successfully tuned through the MA graft and the block copolymer
nanostructure. In particular, nanocomposites with signs of rheological percolation, indicating
the formation of a network between individually dispersed nanoparticles and polymer chains,
have been obtained at ZnO content as low as 5 wt% (0.9 vol%). This behavior resulted in an
enhancement of the thermal conductivity and better control of the electrical conductivity
while maintaining breakdown strength and dielectric losses in the same range of the unfilled
insulating matrices. Furthermore, the resistance to surface erosion by partial discharges was
significantly improved: in the presence of 5 wt% of individually dispersed ZnO
nanoparticles, the eroded volume was reduced 10 times.
CHAPTER 4

124
Keywords: thermoplastic elastomer, Zinc Oxide nanoparticles, nanodielectric, rheological
percolation, HV insulation…
4.1 Introduction
Due to the immiscibility of their blocks that are covalently bonded, block copolymers can
self-organize into spherical, cylindrical, lamellar or more complex ordered nanodomains,
depending on several parameters such as the block copolymer composition, the chemical
interaction between the blocks and the molecular weight (Mai & Eisenberg, 2012). Owing to
this nanostructure, several block copolymers, including polystyrene-b-poly(ethylene-co-
butylene)-b-polystyrene (SEBS) and polystyrene-b-poly(ethylene-co-butylene)-b-polystyrene
grafted maleic anhydride (SEBS-MA) thermoplastic elastomers, have recently attracted
considerable attention as template matrices offering the possibility of nanoparticles dispersion
control, in the aim of producing nanocomposites and master batches with tailored dispersion
and interphase region. The expected high performance materials have a great potential in
different applications including dielectric applications (Sarkar & Alexandridis, 2015).
However, to the best of our knowledge, only few studies reported specific dielectric
characterization of thermoplastic elastomeric block copolymer based nanocomposites (E Helal
et al., 2015; Helal, Demarquette, David, & Fréchette, 2015; Kofod et al., 2011; Mc Carthy et
al., 2009; Mi et al., 2014; Saleem et al., 2014), taking into consideration the possibility of
tuned nanoparticles dispersion, in the aim of producing high performance nanodielectrics
(Emna Helal et al., 2015; Sarkar & Alexandridis, 2015).
In addition to the nanoarchitecture, thermoplastic elastomeric block copolymers can play a
functional role in dielectric applications such as dielectric elastomer actuators and HV
insulation materials. In fact, these materials exhibit good mechanical properties combining
both elastomer and thermoplastic properties (Balsamo et al., 2006; Holden et al., 2004), good
electromechanical coupling (B. Kim et al., 2011) as well as good resistance to moisture
absorption (Liu et al., 2011; Z. Ma et al., 2010). Currently, the use of thermoplastic
elastomeric block copolymers, in nanocomposites generally and nanodielectrics specifically,
is mainly limited to their role as compatibilizers to improve the dispersion of nanoparticles

125
such as nanoclay, metal oxides and more recently carbon nanotubes (Liang & Tjong, 2006) in
polyolefin matrices or as water treeing retardant agents in HV cables (Liu et al., 2011; Z. Ma
et al., 2010). Recent studies have started investigating these materials in a more functional
aspect. For instance, blends of polyolefins and thermoplastic elastomers have been evaluated
as candidates for HV cable insulation and specifically for recyclable high voltage direct
current (HVDC) cables in replacement to cross-linked Polyethylene (XLPE) cables (Han &
Sengupta, 2014; Helal, Demarquette, David, & Fréchette, 2016; Helal, Demarquette, David, &
Fréchette, 2014; I. Hosier et al., 2007; Y. Zhou et al., 2015). Preliminary results revealed that
these blends feature improved mechanical flexibility, thermal properties, volume resistivity
and resistance to surface erosion (Helal et al., 2016; I. Hosier et al., 2007; Y. Zhou et al.,
2015). However, they suffer from space charge accumulation, which is a bottle-neck
especially in HVDC transmission (Hayase et al., 2006; Mizutani, 2000). This problem might
be addressed by the incorporation of specific nanoparticles able to increase the density of
charge traps and consequently decrease charge carriers mobility, in a similar trend to what has
been reported for homopolymer nanocomposites (Fleming et al., 2008; Ju et al., 2014; Amir
M Pourrahimi et al., 2016; Amir Masoud Pourrahimi et al., 2016; Tian et al., 2011, 2012; Tian
et al., 2015). But, better understanding of the nanoparticles impact on the thermoplastic
elastomer phase is required first. Therefore, exhaustive dielectric, thermal and electrical
characterization of thermoplastic elastomer nanocomposites might be a crucial step to
evaluate their potential as nanodielectrics and as master batches to be blended with industrial
polyolefins for application in HV and HVDC insulation systems.
An important property governing the performance of HV insulation systems is space charge
distribution. In fact, accumulation of space charges in HV insulation materials subjected to
high electric fields might lead to inhomogeneous distribution of the electric field and localized
large electrical stresses, especially in DC transmission. To avoid the deterioration of the
insulation in the regions suffering from elevated electrical stresses, large thicknesses of the
insulating material are often required to reduce the magnitude of the peak stresses and to
increase the breakdown voltage, which leads to expensive insulation systems and difficulty to
dissipate heat. To reduce space charge accumulation, one approach is the use of non-linear

126
resistive fillers. At low loadings, these fillers were reported to increasing the charge trap
density and consequently decrease charge carriers mobility and prohibit space charge
accumulation in the bulk material (Fleming et al., 2008; Ju et al., 2014; Amir M Pourrahimi et
al., 2016; Amir Masoud Pourrahimi et al., 2016; Tian et al., 2011, 2012; Tian et al., 2015). At
higher loadings, an improvement of the non-linear feature of electrical conductivity is
reported and leads to efficient reduction and homogenization of electrical stresses within the
insulation (Hong, Schadler, Siegel, & Mårtensson, 2003; Hong et al., 2006; Varlow et al.,
2007). As the introduction of fillers may result in higher dielectric losses, an improvement of
thermal conductivity is also desirable, through the choice of appropriate fillers, in order to
increase the rate at which heat is dissipated in the system (Varlow et al., 2007).
One type of nanoparticles that is of particular interest when dealing with HV insulation
systems is Zinc Oxide (ZnO) nanoparticles. In fact, ZnO is a large band gap semiconductor
characterized by nonlinear electrical conductivity (Hong et al., 2006; Varlow et al., 2007),
relatively high thermal conductivity (Huang et al., 2011) and ability to absorb UV light
released by partial discharges (S. Chen et al., 2010). It was studied in nanocomposites for
insulation applications, mainly polyethylene based systems (S. Chen et al., 2010; Fleming et
al., 2008; Hong et al., 2003; Amir M Pourrahimi et al., 2016; Amir Masoud Pourrahimi et al.,
2016; Tian et al., 2011, 2012; Tian et al., 2015). Its incorporation led to several beneficial
properties including the ability to significantly decrease space charge accumulation (Fleming
et al., 2008; Tian et al., 2011; Tian et al., 2015) as well as to improve resistance to electrical
treeing (Tian et al., 2012), which are stringent requirements to be fulfilled by any potential
candidate for HV insulation in order to ensure longer lifetime of the insulation.
In this study, the morphology and rheological properties of nanocomposites of SEBS and
SEBS grafted maleic anhydride (SEBS-MA) containing ZnO nanoparticles have been
investigated. In particular, the dispersion of ZnO nanoparticles was tuned to obtain samples
featuring agglomerations vs. samples featuring nanoscale dispersion and controlled
interactions between polymer chains and nanoparticles at the interface. For that,
functionalized nanoparticles exhibiting good affinity with maleic anhydride (MA) were used

127
in order to improve the dispersion and to initiate the process of selective localization in the
phase exhibiting the highest affinity, which is the elastomer block. This tuned dispersion is
expected to affect strongly the quality of the interphase region and consequently the
engineering properties (David & Fréchette, 2013; Michel Fréchette et al., 2014; Lau,
Vaughan, Chen, Hosier, & Holt, 2013; Sarkar & Alexandridis, 2015). Therefore, a
correlation between the obtained morphologies and respectively the rheological, electrical,
thermal and dielectric properties was established in a trial to evaluate the potential of
thermoplastic elastomer nanocomposites for use in HV insulation systems and to predict their
optimal performance.
4.2 Experimental section
4.2.1 Materials
SEBS powder grade G1652, of density 0.915 g/cm3 and SEBS-MA pellets grade FG1901
were purchased from Kraton. Both block copolymers contain 30 wt% of polystyrene (PS)
endblocks dispersed in the form of nanodomains within a poly(ethylene-co-butylene) (PEB)
midblock matrix. The maleic anhydride (MA) content is equal to 1-2 wt% in SEBS-MA and is
grafted on the PEB elastomer block as illustrated in Figure 4-1. Zinc oxide nanoparticles were
supplied in the form of 40 wt% colloidal suspension in ethanol from Sigma Aldrich. The
particles are organically modified with an alkyl ammonium salt and have a particle size below
130 nm in general and an average particle size around 35 nm. All the materials were used as
received.

128
Figure 4-1: Schematic description of SEBS block copolymer with MA group grafted to elastomer block ("Polystyrene-block-poly(ethylene-ran-butylene)-block-
polystyrene-graft-maleic anhydride,")
4.2.2 Processing
The nanocomposites were prepared by solution blending using toluene as a solvent. The
suspension of nanoparticles was first mixed with toluene and disagglomerated using Sonic
Ruptor 400 ultrasonicator for 8 minutes in continuous mode at 70% of the maximum power.
The necessary amount of SEBS or SEBS-MA was subsequently added and dissolved in the
mixture by means of magnetic stirring overnight. The solution was simultaneously heated at
60 °C. Subsequently, the obtained mixture was poured into a Petri dish and kept under fume
hood until complete evaporation of solvent. The nanocomposites were finally dried for at least
48 hours at 60 °C under vacuum. The investigated nanoparticles loadings in the final samples
were equal to: 1 wt%, 5 wt%, 10 wt% and 20 wt%. These concentrations were checked by
means of thermal gravimetric analysis. All the samples were preheated for 10 minutes and
pressed for 5 minutes at 200 °C under 10 MPa to obtain films with specific thicknesses
suitable for further characterization. The samples prepared from SEBS and SEBS-MA will be
referred to respectively as SEBS-X and SEBS-MA-X, where X is the weight fraction of ZnO
nanoparticles in the nanocomposite. For example, SEBS-MA-5 corresponds to the
nanocomposite made from SEBS-MA as a matrix and containing 5 wt% ZnO.

129
4.2.3 Characterization
Cross-sections of different nanocomposites were observed to characterize the dispersion of
nanoparticles either by Scanning Electron Microscopy (SEM) or Transmission Electron
Microscopy (TEM). Hitachi S-3600N microscope was used for SEM micrographs. The
samples were cryogenically fractured using a Leica Microtome and a Tungsten knife operated
at -100 °C. A gold layer of thickness 20 nm was sputtered on the cross-section of the samples
before imaging. A Jeol JEM-2100F microscope was used for TEM micrographs. Ultrathin
sections of the samples were obtained using an ultramicrotome operated at -100 °C and placed
on copper grids.
The morphology of the block copolymer was characterized by Atomic Force Microscopy
(AFM). The images were obtained using a Veeco atomic force microscope operated in
tapping mode under ambient conditions at a scanning rate equal to 1 Hz. Samples for AFM
imaging were prepared by spin coating of nanocomposites suspensions directly onto a glass
substrate, allowing free evaporation of the solvent in open air. The obtained thin films were
then subjected to the same thermal treatment applied to the free-standing films during vacuum
drying and compression molding steps: 48 hours at 65 °C and 15 minutes at 200 °C.
The interactions at the nanoparticle-polymer interfaces were studied by means of Fourier
Transformed Infra-Red (FTIR) spectroscopy. The spectra were recorded in the transmission
mode in the wavelengths range from 500 to 4000 cm-1 with spectral resolution of 4 cm-1, using
a Nicolet 6700 Spectrometer.
Rheological measurements were performed at 200 °C to characterize the evolution of dynamic
moduli of the nanocomposites in the molten state. A strain-controlled rheometer MCR 501
Anton Paar was used. Small amplitude oscillatory shear (SAOS) tests were performed in the
linear viscoelastic regime under a strain equal to 0.5% in the frequency range from 10-2 to
300 rad.s-1. 25 mm-diameter parallel plate geometry was used and 1 mm sample gap was
used.

130
The complex dielectric permittivity of the different samples was measured at room
temperature using a Novocontrol broadband spectrometer. Specimens of 20 mm in diameter
were placed between parallel plated brass electrodes to form a plane-plane capacitor.
Measurements swept through a frequency range from 10-2 Hz up to 105 Hz under an excitation
voltage of 3V. Besides, temperature ranges between -100 °C and 120 °C were considered for
selected samples.
The AC short-term breakdown strength of the samples was measured in a dielectric oil
environment using ball-type electrodes of 4-mm diameter. A ramp of 1 kV/s and a frequency
of 60 Hz were applied until breakdown occurred. Samples of average thickness around 200
µm were used for this test. But, since the thickness of the samples was not strictly uniform,
all the measurements were corrected to equal the breakdown strength of a 200 µm thick film
using the power law relationship (equation (4.1)) between the breakdown field and the film
thickness in order to obtain comparable results (Takala et al., 2010). The data were then
retrieved considering a two-parameter Weibull distribution, by means of commercial software.
4.0
1
212 )( −=
d
dEE
(4.1)
Where:
d1: the real thickness of the sample;
E1: the measured dielectric strength at d1;
d2=200 µm: the thickness selected for normalization;
E2: the estimated dielectric strength at the desired thickness d2.
To evaluate the resistance of the fabricated materials to surface erosion, samples of average
thickness equal to 500 µm were exposed to partial discharges for 30 hours, using a point-to-
plane geometry set-up operated in open air, as represented in Figure 4-2. A sinusoidal voltage
of approximately 7 kVRMS and a frequency of 300 Hz were applied to the high-voltage rod
electrode. The electrode tip is made from nickel-plated carbon steel and has a 1-mm radius.
The samples were fixed to the ground plane electrode using Kapton tape and separated from
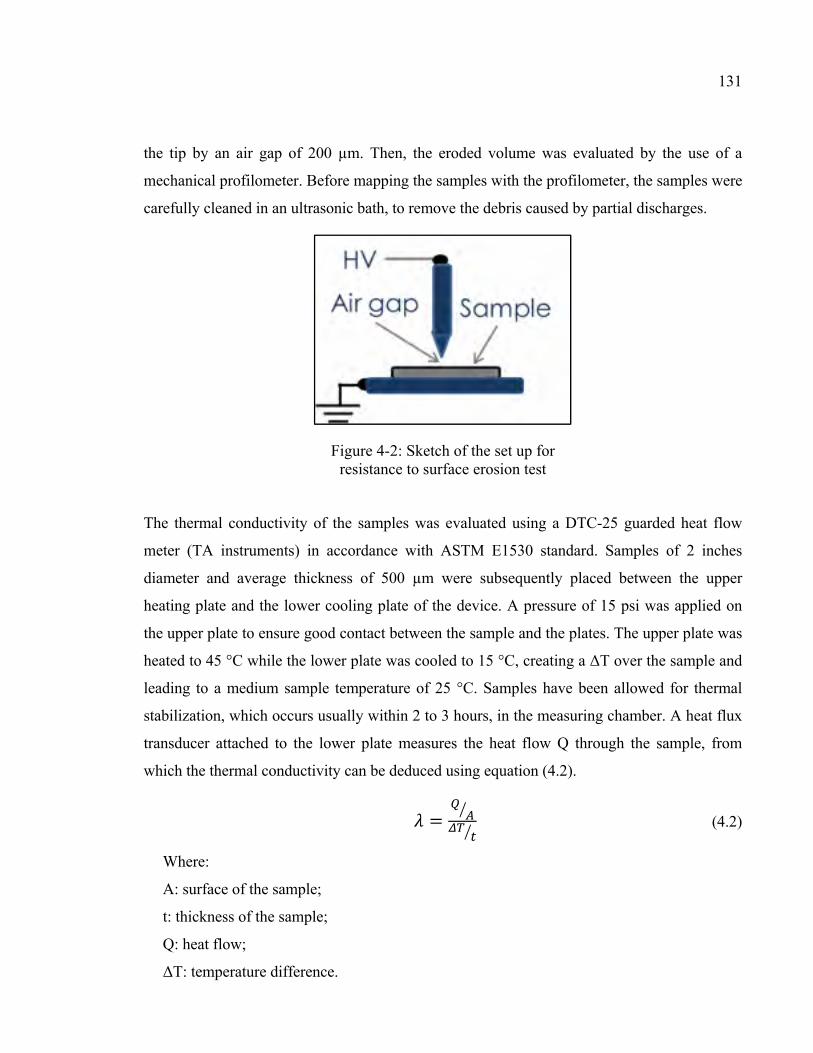
131
the tip by an air gap of 200 µm. Then, the eroded volume was evaluated by the use of a
mechanical profilometer. Before mapping the samples with the profilometer, the samples were
carefully cleaned in an ultrasonic bath, to remove the debris caused by partial discharges.
Figure 4-2: Sketch of the set up for resistance to surface erosion test
The thermal conductivity of the samples was evaluated using a DTC-25 guarded heat flow
meter (TA instruments) in accordance with ASTM E1530 standard. Samples of 2 inches
diameter and average thickness of 500 µm were subsequently placed between the upper
heating plate and the lower cooling plate of the device. A pressure of 15 psi was applied on
the upper plate to ensure good contact between the sample and the plates. The upper plate was
heated to 45 °C while the lower plate was cooled to 15 °C, creating a ΔT over the sample and
leading to a medium sample temperature of 25 °C. Samples have been allowed for thermal
stabilization, which occurs usually within 2 to 3 hours, in the measuring chamber. A heat flux
transducer attached to the lower plate measures the heat flow Q through the sample, from
which the thermal conductivity can be deduced using equation (4.2). = (4.2)
Where:
A: surface of the sample;
t: thickness of the sample;
Q: heat flow;
ΔT: temperature difference.
132
Finally, DC electrical conductivity of the nanocomposites was measured under ambient
conditions, using a two-probe method. 40 mm diameter samples of thickness around 500 µm
were used. Different electric fields ranging from 17 kV/cm to 170 kV/cm were applied using a
High Voltage DC source. The charge and discharge currents were measured using a Keithley
6487 Picoammeter. The data were collected for 600 s to reach quasi-steady state currents. The
characteristic I-V curve corresponding to each nanocomposite was subsequently plotted.
4.3 Results and discussion
4.3.1 Dispersion and morphology
The nanoparticles dispersion in both sets of nanocomposites, respectively SEBS-ZnO and
SEBS-MA-ZnO, was first characterized by SEM. The SEM micrographs reported in Figure
4-3 reveal that agglomerations are present in the case of SEBS-ZnO nanocomposites
(indicated by the arrows in Figure 4-3(a)) while they are absent in the case of SEBS-MA-ZnO
nanocomposites. To investigate further the dispersion in the latter case, TEM was performed
on SEBS-MA-5 nanocomposite. The images reported in Figure 4-4 reveal homogeneous and
quasi-individual dispersion of nanoparticles. Their size distribution was investigated by
particle size analysis reported in annex III of the supporting file (Figure A III-1 and Figure A
III-2). In particular, the size of more than 60% of the dispersed ZnO nanoparticles and their
small agglomerations ranges between 20 nm and 60 nm, which is equal to or larger than the
size of the SEBS block copolymer nanodomains estimated to be in the range 15-30 nm for
both blocks according to reference (Leice G Amurin et al., 2016) and AFM images reported in
Figure 4-7. AFM results will be discussed further later in the manuscript. Hence, it is difficult
to locate the nanoparticles exclusively in one block, either PS or PEB. However, it is expected
that the nanoparticles exhibit higher affinity to the PEB block due to favorable interaction
between the surface of ZnO nanoparticles and the MA groups grafted onto the PEB block. To
confirm this potential interaction, FTIR was performed. The spectra are reported in Figure
4-5.

133
Figure 4-3: SEM micrographs of: (a) SEBS-5 (arrows indicate the agglomerations) and (b) SEBS-MA-5
Figure 4-4: TEM micrographs of SEBS-MA-5 nanocomposite
Figure 4-5(a) shows the FTIR spectra of SEBS-MA based materials in the wavenumbers
range from 1500 to 2000 cm-1. In particular, the spectrum of SEBS-MA shows absorption
bands at respectively 1776, 1740 and 1713 cm-1 indicating the presence of carbonyl-
containing groups, mainly maleic anhydride and potentially maleic acid (Barra, Crespo,
Bertolino, Soldi, & Pires, 1999; "Characteristic IR Absorption Frequencies of Organic
Functional Groups," ; Xiong et al., 2013; X. Zhou, Yu, Lin, & Chen, 2013). In the spectra of
the nanocomposites, the absorption bands at 1713 and 1776 cm-1 are still detected but the peak
(a) (b)
(a) (b)

134
intensity at 1713 cm-1 seems to be considerably reduced. This observation is rather confirmed
if we consider a ratio between this absorption band and a reference band (not affected by the
potential interaction between ZnO nanoparticles and MA) such as the one observed at 1583
cm-1 and assigned to the vibrations of the benzene rings of PS block (G. Chen, Liu, Chen, &
Qi, 2001; Gupta, Wang, Hanssen, Hsia, & Datla, 1995). In fact, the ratio decreases especially
at large ZnO content. For instance, it drops down from approximately 2.3 for the neat SEBS-
MA to 1 for SEBS-MA-20 nanocomposite. Besides, the absorption band at 1713 cm-1 is
slightly shifted to lower wavenumbers at increasing ZnO content. Simultaneously, the
intensity of the absorption band at 1740 cm-1, which corresponds actually to the stretching
vibration of ester carbonyls ("Characteristic IR Absorption Frequencies of Organic Functional
Groups,"), seems to be increasing with increasing ZnO concentration, if we compare with the
same reference, i.e. the absorption band at 1583 cm-1. It reaches 2 for SEBS-MA-20
nanocomposite compared to 0.62 for the neat SEBS-MA. This behavior supports the
hypothesis of formation of ester bonds upon the reaction between MA and hydroxyl groups on
the surface of ZnO nanoparticles. Figure 4-5(b) shows the FTIR spectra of SEBS-MA based
materials in the wavenumbers range from 3000 to 3800 cm-1. As indicated by the arrow, a
broad absorption band appeared between 3200 and 3600 cm-1 in the spectra of all the
nanocomposites. It most likely corresponds to stretching vibration of hydrogen-bonded
hydroxyl groups. It is broad due to overlapping of several O-H stretching modes (Kuo &
Chang, 2001). This behavior indicates the formation of hydrogen bonds as well after the
reaction between MA and hydroxyl groups on the nanoparticles surfaces (Ndiaye et al., 2011;
Sari, Moradian, Bastani, & Stribeck, 2012; Xiong et al., 2013; X. Zhou et al., 2013). In
summary, in the nanocomposites studied in the present work, ZnO nanoparticles are
organically modified with an alkyl ammonium salt which is one of the functional groups that
are commonly used for the preparation of pre-intercalated clay layers. Although the used
nanoparticles are spherical, this modification helps to improve the compatibility with the
organic polymer matrix by decreasing the hydrophilic character of the nanoparticles. Besides,
maleic anhydride graft attached to the PEB block can be considered as a second effective
functional group which is able to bond with hydroxyl groups that partially cover the surface of
the nanoparticles, forming ester and hydrogen bonds. The resulting complexes act as in-situ

135
formed cross-linked structures that improve further the dispersion, as seen in TEM
micrographs (Figure 4-4), and affect drastically the rheological properties which will be
discussed later in the manuscript.
Figure 4-5: FTIR spectra of SEBS-MA-ZnO nanocomposites: (a) in the absorption range 1500-2000 cm-1 and (b) in the absorption
range 3000-3800 cm-1
1713
1740
1776
1583
(a)
(b)

136
A scheme of the possible reaction mechanism is presented in Figure 4-6 (Ndiaye et al., 2011;
Sari et al., 2012). The system studied in this manuscript is very similar to many clay
containing-maleated polymer nanocomposites that feature an excellent exfoliation of clay due
to simultaneous surface treatment by organic groups, which result in pre-intercalated clay
layers, and strong interaction between MA and hydroxyl groups at the edge of clay layers
improving the peeling mechanism and consequently the exfoliation of clay into individual
layers (Iwasa, Ueda, Shibayama, & Fukatani, 2002; L.A. Utracki, 2004).
Figure 4-6: Reaction scheme between maleic anhydride and the surface of the nanoparticles (R: alkyl ammonium salt)
As a consequence of the good interaction with MA, ZnO nanoparticles tend to be individually
dispersed and exhibit higher affinity to PEB phase to which the MA group is grafted.
However, as the size of the nanoparticles is comparable to or greater than the size of the PEB
domains, it is thermodynamically challenging to locate them inclusively in the rubber phase
(Emna Helal et al., 2015; Sarkar & Alexandridis, 2015). Only the nanoparticles with the
smallest size will potentially locate in the rubber phase. In order to reveal the obtained SEBS
morphology and the possibility of selective location of nanoparticles, some TEM grids were
treated with ruthenium tetroxide RuO4 to enhance contrast between the different phases.
However, the staining was not successful as ZnO reacted with RuO4 (TEM micrographs of the
treated samples can be consulted in Figure A III-3 of the supporting file (annex III)). Thus,
AFM was carried out instead to overcome this problem. In general, lamellar morphology is
expected when SEBS block copolymer is prepared from solvent blending using toluene

137
without annealing at elevated temperatures (E Helal et al., 2015). However, the compression
molding at 200 °C and the addition of nanoparticles can distort the block copolymer
morphology (Cano, Gutierrez, & Tercjak, 2013). Figure 4-7(b) shows AFM images
corresponding to SEBS-MA-1 nanocomposite subjected to the same thermal treatment as the
compression molded samples. A distorted “fingerprint” morphology is observed, where PS
domains (bright phase) are mostly in the form of short cylinders (Ganguly & Bhowmick,
2008; Seppala, 2012). This morphology is observed in the neat SEBS as well (Figure 4-7(a)),
but with better long-range order. The nanoparticles appear as bright spots. The smallest ones
are more in contact with the PEB block (dark phase) while the biggest ones do not selectively
locate. This observation agrees well with TEM and FTIR results.
Figure 4-7: AFM images of: (a) Neat SEBS-MA, (b) SEBS-MA-1 nanocomposite, (c) Zoom on the region indicated by the square in (b)
(showing the same magnification as (a))
4.3.2 Rheological properties
SAOS results corresponding to respectively SEBS-ZnO and SEBS-MA-ZnO nanocomposites
containing different nanoparticles concentrations are reported in Figure 4-8. The
measurements were done in the linear regime in the frequency range from 10-2 to 300 rad.s-1.
Besides, the low frequency range was extended down to 10-3 rad.s-1 for selected samples to
evaluate further the non-terminal behavior. Plots corresponding to dynamic storage and loss
(a) (b) (c)

138
moduli, G’ and G”, are reported in Figure 4-8(a)-(b) while those corresponding to the
complex viscosity modulus |η*| are reported in Figure 4-8(c)-(d).
By comparison with the linear viscoelastic response of unfilled SEBS and SEBS-MA, a
substantial effect of ZnO nanoparticles was observed in both sets of nanocomposites. With
increasing ZnO content, both storage modulus, G’, and loss modulus, G’’, of the
nanocomposites were progressively enhanced and became less dependent on the angular
frequency throughout the test range. The reduced dependence on frequency indicates that the
nanocomposites gradually exhibit solid-like behavior which is attributed to the confinement
of polymer chains and the formation of ZnO networks, due to good adhesion between the
nanoparticles and the polymer matrix (Hong et al., 2006). This behavior was more prominent
in SEBS-MA-ZnO nanocomposites compared to SEBS-ZnO nanocomposites. In fact, for
SEBS-ZnO nanocomposites, a slight increase of both storage and loss moduli, was exhibited
in the nanocomposites compared to the pure material due to the confinement of the polymer
chains in the presence of the nanoparticles. In SEBS-MA-ZnO nanocomposites, the same
behavior is exhibited but the degree of increase is higher than one order of magnitude,
compared to the neat, for both moduli. This behavior is most likely due to the improved
dispersion and affinity to PEB block which were more efficient in confining polymer chains.
Moreover, a plateau in G’-ω curve in log-scale was approached for all the nanocomposites
prepared from maleated SEBS, even at low ZnO content equal to 1 wt%. This plateau was
more evident when extending the frequency range to 10-3 rad.s-1, as seen in Figure 4-8(a).
The low frequency slope, calculated in the range 10-1 rad.s-1 to 10-2 rad.s-1, decreased from
0.17 for neat SEBS-MA, which corresponds to hexagonally-packed cylindrical morphology
that was probably improved during the SAOS test (Carastan et al., 2008), down to 0.03 for
SEBS-MA-5 nanocomposite. Since the rheological measurements in the low frequency
regime reflect the long range motion of polymer chains, this particular non-terminal behavior
means that the long-range motion is hindered due to the formation of a network between the
ZnO nanoparticles and the polymer chains, i.e. rheological percolation, resulting in
incomplete relaxation of the chains(C. Gao et al., 2014; Q. Zhang & Archer, 2002).
Moreover, the values of complex viscosity, |η*|, increased in the whole frequency range, as
shown in Figure 4-8(c), along with a more pronounced shear-thinning behavior at higher

139
ZnO content. Comparing SEBS-MA-ZnO nanocomposites containing respectively 10 and
20wt% nanoparticles, same values of G’, G’’ and |η*| can be observed. Hence, it seems that
the rheological percolation occurs between 5wt% (0.9 vol%) and 10wt% (1.8 vol%). This
range is below the predicted theoretical rheological percolation for spherical nanoparticles
(Q. Zhang & Archer, 2002). This fact seems to support the hypothesis of good interaction
between the nanoparticles and the rubber phase of the block copolymer which may result in
lowering the threshold for rheological percolation.
(a)
(b)

140
Figure 4-8: SAOS measurements of SEBS-ZnO vs. SEBS-MA-ZnO nanocomposites: (a)-(b) storage modulus G’ (●) and
loss modulus G” (■) and (c)-(d) complex viscosity modulus |η*|
In order to investigate if the non-terminal behavior observed in SEBS-MA-ZnO
nanocomposites is indeed due to the rheological percolation and not due to a change of SEBS
block copolymer morphology during the SAOS test to body-centered cubic spherical
morphology, which is also characterized by a zero-slope in G’-ω plot as a non-terminal
(c)
(d)

141
behavior (Carastan et al., 2008; Kossuth, Morse, & Bates, 1999), a time sweep test were
performed. The time sweep test describes the evolution of viscoelastic moduli as function of
time under a constant temperature, frequency and strain. In this test, a change of morphology
will be manifested by a sudden change of the storage modulus (Carastan et al., 2008). In
literature, changes of morphology in block copolymer nanocomposites have been reported,
especially in the case where nanoparticles are selectively located in one phase and
consequently increase its volume fraction (Cano et al., 2013; Carastan et al., 2008). Figure
4-9 shows the evolution of the storage moduli of unfilled SEBS-MA and SEBS-MA-5
nanocomposite for 8 hours at a fixed frequency equal to 0.05 rad.s-1. G’ of both samples
remained constant over time which confirms that the morphology of the block copolymer
didn’t change. Hence, the plateau observed in G’-ω plots of the nanocomposites, is rather due
to rheological percolation.
Figure 4-9: Time sweep test at 200 °C, 0.05 rad.s-1 and 0.5% strain

142
4.3.3 Low-field dielectric characterization
4.3.3.1 Complex dielectric permittivity
Figure 4-10 reports respectively the values of real and imaginary parts of the complex
dielectric permittivity, ɛ’ and ɛ’’ respectively, of both SEBS-MA-ZnO and SEBS-ZnO
nanocomposites sets, measured at room temperature. The comparison of dielectric response
of both types of nanocomposites shows that the dielectric behavior is strongly affected by the
presence of MA and the quality of ZnO dispersion. For the unfilled matrices, it can be seen
that SEBS-MA has slightly higher real and imaginary permittivities compared to SEBS. This
is most likely due to the presence of MA polar groups. Regarding the SEBS-MA
nanocomposites, it can be seen from Figure 4-10(a) and Figure 4-10(b) that up to 10wt%
loading, there is no significant increase of either the imaginary or the real part of the complex
permittivity. This has been frequently observed in the case of well dispersed ceramic filled
polymer nanocomposites (Praeger, Andritsch, Swingler, & Vaughan, 2014; I. Tsekmes,
Kochetov, Morshuis, & Smit, 2014), particularly when functional groups creates covalent
bonding between particles and matrix (Bouchaib Zazoum et al., 2016). The most popular
explanation for this behavior is the interlayer theory suggesting an interlayer zone between
the nanofiller and the matrix having different dielectric properties than both the matrix and
the particles (for example a lower permittivity) (Heid, David, & Fréchette, 2016; I. A.
Tsekmes, 2016). However, when hydrophilic filler, such as a metallic oxide, is used, the
occurrence of a water layer also surrounding the particle is frequently observed which
invariably leads to a strong relaxation peak usually within the 10-2 to 105 Hz frequency
window (see discussion in the paragraph below). This was not observed in the case of SEBS-
MA nanocomposites for loadings below 20 wt%.
The poor dispersion and the presence of agglomerations lead to much higher dielectric losses
(and consequently permittivity) in the case of the SEBS-ZnO nanocomposites as it can be
seen in Figure 4-10(c) and Figure 4-10(d). Due to the distribution of the agglomerate size,
very broad relaxation mechanisms were observed from 5wt% loading. At a high
143
nanoparticles loading equal to 20wt%, a strong increase of dielectric losses was observed for
both nanocomposites. In the case of the SEBS-MA-20, a clear and rather narrow interfacial
relaxation peak appeared in the vicinity of 102-103 Hz suggesting a somewhat narrow
distribution of filler size. On the other hand, SEBS-20 shows larger increase of its dielectric
losses over the whole frequency range showing a very broad relaxation mechanism possibly
resulting from the overlapping of several interfacial relaxation processes related to different
agglomerate size and properties. Step-like increases related to these relaxation peaks were
simultaneously observed in real permittivities of these samples, resulting in increased values
of real permittivity, especially at low frequencies. The observed relaxation peaks might have
different origins including the presence of a water layer absorbed at the interface between
ZnO nanoparticles and polymer chains. In fact, water sorbed from the ambient atmosphere
constitutes a conductive layer leading to an interfacial relaxation observed at intermediate
frequencies (Kremer & Schönhals, 2012). This phenomenon was reported in the literature
(Couderc, David, Frechette, & Medjdoub, 2013; David & Fréchette, 2013; Glaskova &
Aniskevich, 2009; I. Hosier, Praeger, Vaughan, & Swingler, 2015; Kofod et al., 2011; Lau et
al., 2013), for polymers filled with several types of hydrophilic nanofillers, among them metal
oxides, which were demonstrated to effectively absorb humidity. The geometry and the
fraction of this conductive layer depend strongly on the quality of the interface and
consequently the quality of the dispersion. Thus, in materials suffering from the presence of
agglomerations, different interfaces lead to different thicknesses of water layers that might co-
exist resulting in more than one relaxation peak, observed at distinguished frequencies and
featuring different dielectric strengths (Kremer & Schönhals, 2012; Lau et al., 2013).
However, in specific cases where nanoparticles are functionalized with an adequate surface
modification, reduced or negligible effect of humidity was reported (David & Fréchette, 2013;
David et al., 2015; Lau et al., 2013). Moisture absorption can also affect dipolar relaxation
dynamics by enhancing the molecular mobility of its related dipoles and consequently shifting
the corresponding peak to higher frequencies (Kofod et al., 2011).

144
Figure 4-10: Complex dielectric permittivity at room temperature of SEBS-MA-ZnO vs. SEBS-ZnO nanocomposites: (a) Real part of permittivity of SEBS-MA-ZnO
nanocomposites, (b) Imaginary part of permittivity of SEBS-MA-ZnO nanocomposites, (c) Real part of permittivity of SEBS-ZnO nanocomposites and (d) Imaginary part of
permittivity of SEBS-MA-ZnO nanocomposites
To follow the evolution of the different observed relaxations, isothermal dielectric
measurements were performed on unfilled materials and selected nanocomposites at
temperatures ranging from 25 °C up to 120 °C. Dielectric loss spectra of unfilled matrices are
reported in Figure 4-11(a) and Figure 4-11(b) while those of nanocomposites containing 5
wt% ZnO are reported in Figure 4-11(c) and Figure 4-11(d) (Data corresponding to
nanocomposites containing 1 wt% ZnO are reported in Figure A III-4 of the supporting file
(annex III)). First, it can be seen that values of ε’’ of both neat materials increased at low
frequencies and elevated temperatures due to increased charge carrier fluctuation leading to
both direct conduction and most likely electrode polarization. Besides, no specific relaxation
(a) (b)
(c) (d)
145
process was detected even in the case of SEBS-MA, by contrast to some studies reporting
relaxation related to dipolar fluctuations of MA polar groups (Böhning et al., 2005). As a
consequence, unfilled SEBS and SEBS-MA don`t undergo any relaxation processes in the
temperature range studied (Kofod et al., 2011).
From Figure 4-11(c) and Figure 4-11(d), it can be seen that at elevated temperatures and low
frequencies below 1 Hz, the dielectric loss of SEBS-MA-5 exhibits strong frequency
dependence, especially at temperatures higher than 60 °C, and exceeds largely that of SEBS-
5 nanocomposite, which features only a broad relaxation peak in the intermediate frequency
range shifting to higher frequencies with increasing temperatures. The large increase of ε” of
SEBS-MA-5 nanocomposite at low frequencies indicates an important contribution from
conductivity. The sample becomes even slightly conductive at temperatures higher than 60
°C. An additional contribution from electrode polarization might also be present and overlap
potential relaxation phenomena. The slope of the ε”-frequency curve in log-scale at elevated
temperatures is between -0.9 and -0.86 for SEBS-MA-5 nanocomposite, which supports the
assumption of presence of non-ohmic conduction (Kremer & Schönhals, 2012). This effect
was also observed in the rest of SEBS-MA-ZnO nanocomposites and seems to reach its
maximum at 5wt% ZnO. However, it was not observed in SEBS-ZnO nanocomposites even
at 20 wt% ZnO.
The improved dispersion, homogeneous distribution and reduced interparticle distance
achieved in SEBS-MA-ZnO nanocomposites are most likely at the origin of this interesting
behavior. Moreover, the formation of complexes upon the interaction of MA with functional
groups on the surface of the nanoparticles as well as the established network between the
nanoparticles and polymer chains, as confirmed by rheological properties, might modify the
nature of the interfaces and charge carriers activity, which ultimately leads to a much lower
percolation threshold, under favorable heating conditions.

146
Figure 4-11: Imaginary part of the dielectric permittivity as functions of frequency and temperature of: (a) Neat SEBS-MA, (b) Neat SEBS, (c) SEBS-MA-5 nanocomposite and
(d) SEBS-5 nanocomposite
To evaluate the increase of AC conductivity, the real part of the complex electrical
conductivity, σ’, might be estimated using equation (4.3). It includes the contribution of
direct conduction as well as contribution from dielectric losses associated with relaxation
processes and electrode polarization. ′ = ɛ (4.3)
Where:
σ’: real part of complex conductivity;
ɛ0: vacuum permittivity;
ɛ’’: imaginary part of complex permittivity at angular frequency ω.
(a) (b)
(c) (d)

147
In Table 4-1, values of σ', at respectively 25 °C and 100 °C, are reported for different
nanocomposites. These values have been calculated at a relatively low frequency equal to
10-1 Hz in order to compare them with values of dc conductivity that will be discussed later
in the manuscript. It is worth mentioning that, in the case of the studied samples, an
important increase of electrical conductivity is not expected, since the intrinsic electrical
conductivity of semi-conductive ZnO nanoparticles is relatively low and doesn’t increase
considerably with temperature. It can be seen that in the case of neat materials and SEBS-
ZnO nanocomposites, the increase of conductivity with increasing temperature from 25 °C to
100 °C doesn’t exceed 1 order of magnitude generally. In the case of SEBS-MA-ZnO
nanocomposites, the conductivity increases by 3-4 orders of magnitude. This effect seems to
saturate at 5 wt%, which is in line with the rheological properties.
Table 4-1: Values of real part of complex conductivity at 10-1 Hz
σ' at 25 °C (S.cm-1) σ' at 100 °C (S.cm-1)
SEBS 3.0 x 10⁻¹⁸ 3.6 x 10⁻¹⁷
SEBS-1 3.6 x 10⁻¹⁸ 1.2 x 10⁻¹⁶
SEBS-5 2.3 x 10⁻¹⁷ 4.4 x 10⁻¹⁷
SEBS-20 3.2 x 10⁻¹⁶ 4.5 x 10⁻¹⁶
SEBS-MA 2.3 x 10⁻¹⁷ 8.1 x 10⁻¹⁷
SEBS-MA-1 3.6 x 10⁻¹⁸ 1.9 x 10⁻¹⁵
SEBS-MA-5 7.8 x 10⁻¹⁸ 6.4 x 10⁻¹⁴
SEBS-MA-20 3.0 x 10⁻¹⁷ 1.7 x 10⁻¹⁴
As observed in room temperature spectra reported in Figure 4-10, additional relaxation peaks
in the intermediate frequencies range are detected in the dielectric loss spectra of some
nanocomposites, especially at elevated ZnO loadings. In order to investigate these relaxation
processes, isothermal measurements at higher temperatures were performed on both SEBS-
MA-20 and SEBS-20 nanocomposites. Their corresponding spectra of ε” are reported in
Figure 4-12(a) and Figure 4-12(b). In particular, Figure 4-12(a) shows that SEBS-MA-20
exhibits strong conduction at low frequencies eventually associated with a MWS peak,

148
similarly to what have been observed earlier in the spectrum of SEBS-MA-5 (Figure
4-11(c)). In addition, a relaxation peak is observed initially around 103 Hz and shifted
towards higher frequencies at elevated temperatures (indicated by an arrow). In SEBS-20,
two peaks were observed initially at room temperature, at two different frequencies as
indicated by the arrows in Figure 4-12(b). At increasing temperatures, both peaks were
shifted to higher frequencies as well and seem to merge in one peak with higher asymmetry
at the low-frequency side.
These new relaxations observed in the materials containing high loadings of nanoparticles
might be related to the presence of a conductive water layer adsorbed at the interface
between the polymer and the metal oxide nanoparticles as mentioned earlier. Although it was
reported in several studies that relaxation processes affected by moisture absorption exhibit a
distinguished behavior consisting on the displacement of the peak maximum to lower
frequencies starting from a certain temperature (Böhning et al., 2005; Couderc et al., 2013;
David & Fréchette, 2013; Lau et al., 2013), a regular trend of the displacement of the peak
towards higher frequencies was also reported in other studies (Ciuprina et al., 2010; David &
Fréchette, 2013). In our case, the latter behavior is observed. Besides, it seems that the
temperature dependence of the peak maximum frequency is stronger in SEBS-ZnO compared
to SEBS-MA-ZnO.
In order to confirm if the additional relaxations are corresponding to a conductive water layer
adsorbed at the interface between the nanoparticles and polymer chains, nanocomposites
containing 5 wt% and 20 wt% ZnO from both sets, were dried for 3 days at 65°C under
vacuum before rescanning their dielectric spectra. In fact, if humidity absorption is at the
origin of these relaxations, corresponding peaks are expected to shift to lower frequencies or
completely disappear after drying (Böhning et al., 2005; Couderc et al., 2013; David &
Fréchette, 2013; Kofod et al., 2011; Lau et al., 2013). In the case of SEBS-MA-ZnO
nanocomposites, no change of the dielectric spectra was observed after drying, for both
studied ZnO contents: 5 wt% and 20 wt% ZnO (Figure A III-5 and Figure A III-6 in annex
III). However, in the case of SEBS-ZnO nanocomposites, some changes were observed after

149
drying (Figure A III-7 in annex III). In particular, peak maximum frequencies of the observed
relaxations were not significantly affected but the dielectric losses increased mainly at low
frequencies and a new relaxation process is observed at elevated temperatures. This behavior
is in agreement with findings from the literature reporting that the effect of moisture is
reduced on treated nanoparticles and that in the dry state, the dielectric losses might increase
due the presence of coupling agents (David & Fréchette, 2013; David et al., 2015; Lau et al.,
2013). As a consequence, it was not possible to confirm a correlation between the relaxation
processes observed at intermediate frequencies and the presence of water layer surrounding
the nanoparticles, especially in the case of SEBS-MA-ZnO nanocomposites. Probably,
additional drying is necessary to observe significant changes but overall it can be concluded
that moisture absorption is not a major issue in the studied SEBS-ZnO and especially SEBS-
MA-ZnO samples. If the effect of moisture absorption is negligible, the observed relaxations
might be caused by the co-existence of different types of interfaces: polymer-particle and
particle-particle, especially at high nanoparticles loadings and in the presence of
agglomerations, resulting in broad and multiple relaxations (Figure 4-12(b)). Another
possible origin for the observed relaxations, especially at high loadings of nanoparticles, is
the existence of an interphase region where polymer chains might feature restricted mobility
(Michel Fréchette et al., 2014; Yu Lin et al., 2015; Tsagaropoulos & Eisenburg, 1995). In
this case, further investigations are required to confirm these phenomena.
Figure 4-12: Imaginary part of electric modulus as functions of frequency and temperature of: (a) SEBS-MA-20wt% ZnO nanocomposite and (b) SEBS-20wt% ZnO nanocomposite
Double peak
(a) (b)

150
In order to evaluate the dielectric losses of the nanocomposites compared to the pure
materials and between themselves at operational conditions, values of the dissipation factor
tan δ equal to the ratio ε’’/ε’, at a fixed frequency equal to 66 Hz (close to power frequencies)
and different temperatures: 25, 40 and 60 °C were reported in Table 4-2 for the 5, 10 and 20
wt% nanocomposites (1wt% nanocomposites did not show any significant increase of the
dissipation factor). At a first glance, it can be seen that at this frequency, nanocomposites
prepared from SEBS-MA don’t exhibit higher losses compared to nanocomposites prepared
from SEBS despite the fact that they show stronger conductivity at low frequencies and
elevated temperatures and that maleated SEBS features higher losses compared to
unmaleated SEBS. Besides, both sets of nanocomposites, containing 1 wt% and 5wt%
nanoparticles, have dielectric losses similar to (less than one order of magnitude increase) or
lower than unfilled matrices even at 60 °C. At higher ZnO contents equal to 10wt% and
20wt%, losses increase up to 2 orders of magnitude compared to unfilled materials. However,
SEBS-MA-ZnO feature lower losses compared to SEBS-ZnO. For instance, the maximum
dissipation factor for SEBS-20 nanocomposite in the studied temperature range is equal to
4.57 x 10⁻² compared to 3.78 x 10⁻³ for SEBS-MA-20. Overall, by controlling the dispersion
of ZnO in SEBS-MA, it is possible to incorporate up to 20wt% ZnO while limiting the
increase of the loss factor to less than 1 order of magnitude. At lower concentrations up to
5wt% ZnO, no additional dielectric losses are induced.
Table 4-2: Dissipation factor (tan δ = ε’’/ ε’) at 66 Hz for different nanocomposites
ZnO
(wt%)
25 °C 40 °C 60 °C
SEBS SEBS-MA SEBS SEBS-MA SEBS SEBS-MA
0 6.33 x 10-04 1.5 x 10-03 1.54 x 10-04 9.94 x 10-04 1.99 x 10-04 8.62 x 10-04
5 3.34 x 10-03 1.04 x 10-03 1.28 x 10-03 7.6 x 10-04 1.34 x 10-03 2.03 x 10-03
10 1.18 x 10-02 1.37 x 10-03 5.39 x 10-03 1.40 x 10-03 2.45 x 10-03 5.02 x 10-03
20 4.57 x 10-02 3.78 x 10-03 3.23 x 10-02 2.56 x 10-03 3.13 x 10-02 3.51 x 10-03

151
4.3.4 High-field dielectric characterization
In this section, several dielectric characterizations, performed to evaluate the dielectric
performance at high electric fields, will be discussed.
4.3.4.1 Short-term breakdown strength
Figure 4-13(a) and Figure 4-13(b) present Weibull plots of breakdown strength
corresponding respectively to SEBS-ZnO and SEBS-MA-ZnO sets of nanocomposites. In
SEBS-ZnO set, the values of breakdown strength decrease progressively, when increased
loadings of ZnO nanoparticles are incorporated, due to the presence of nanoparticles
agglomerations which act as defect centers distorting the electric field around them. This
behavior has been repeatedly reported in literature for ZnO contents equal to 5wt% or higher
(S. Chen et al., 2010; Cheng, Guo, Wang, & Zhang, 2013; Hong et al., 2003; Tian et al.,
2012). In particular, an initial drop from 107 kV/mm down to approximately 86 kV/mm was
observed in nanocomposites containing 5 wt% up to 10 wt% ZnO, both exhibiting similar
performance. Then, a second drop down to 73 kV/mm was observed when ZnO content is
increased up to 20 wt%. This second large decline is an indication that a network of
agglomerated ZnO nanoparticles start to form at this loading, leading to increased tunneling
current between the nanoparticles. This observation will be discussed later in correlation with
dc electrical conductivity and thermal conductivity results showing consistent increase at
20wt% ZnO loading.
In SEBS-MA-ZnO nanocomposites set, a different behavior was observed. First of all, the
breakdown strength of the maleated SEBS decreased to 93 kV/mm compared to 107kV/mm
for non maleated SEBS. This drop is most likely due to lower stiffness in SEBS-MA
(Kollosche & Kofod, 2010). Regarding the nanocomposites, it seems that the incorporation of
nanoparticles has only marginal effect. In fact, the breakdown strength remained equal or
slightly higher than the unfilled SEBS-MA even at ZnO loading as high as 20wt%. This
behavior can be the sum of two opposite mechanisms, both resulting from nanoscale
dispersion and homogeneous distribution of the nanoparticles, which compensate each other:
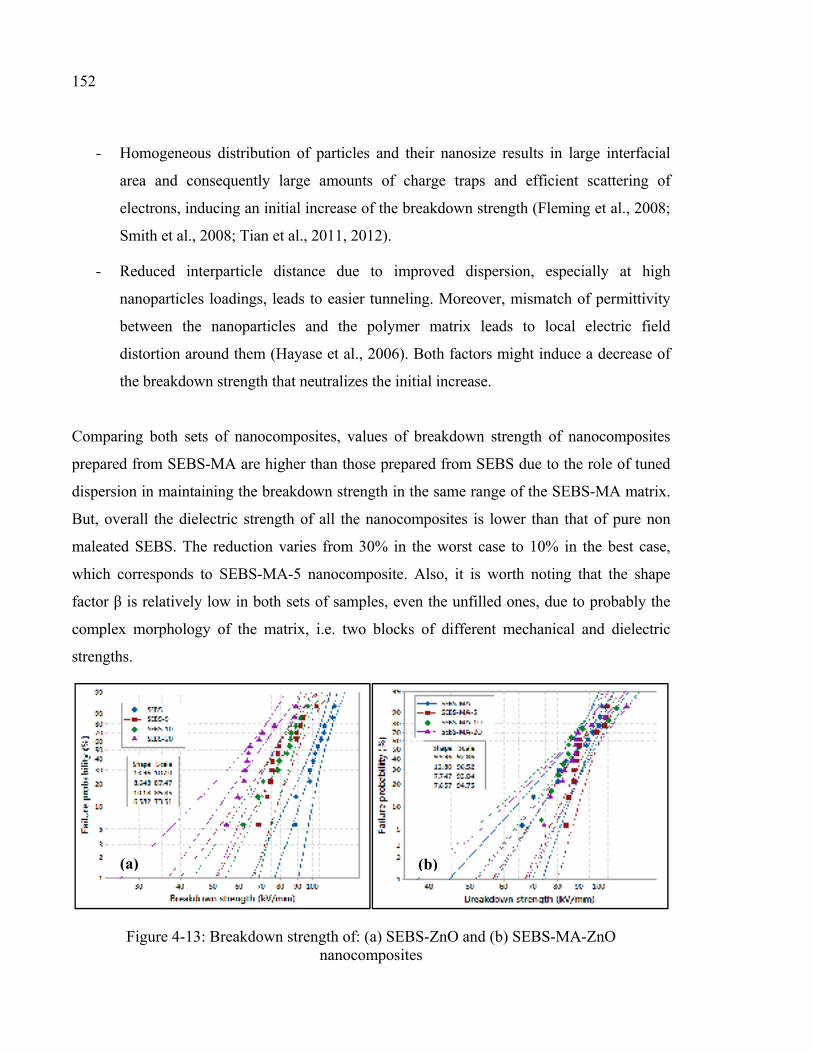
152
- Homogeneous distribution of particles and their nanosize results in large interfacial
area and consequently large amounts of charge traps and efficient scattering of
electrons, inducing an initial increase of the breakdown strength (Fleming et al., 2008;
Smith et al., 2008; Tian et al., 2011, 2012).
- Reduced interparticle distance due to improved dispersion, especially at high
nanoparticles loadings, leads to easier tunneling. Moreover, mismatch of permittivity
between the nanoparticles and the polymer matrix leads to local electric field
distortion around them (Hayase et al., 2006). Both factors might induce a decrease of
the breakdown strength that neutralizes the initial increase.
Comparing both sets of nanocomposites, values of breakdown strength of nanocomposites
prepared from SEBS-MA are higher than those prepared from SEBS due to the role of tuned
dispersion in maintaining the breakdown strength in the same range of the SEBS-MA matrix.
But, overall the dielectric strength of all the nanocomposites is lower than that of pure non
maleated SEBS. The reduction varies from 30% in the worst case to 10% in the best case,
which corresponds to SEBS-MA-5 nanocomposite. Also, it is worth noting that the shape
factor β is relatively low in both sets of samples, even the unfilled ones, due to probably the
complex morphology of the matrix, i.e. two blocks of different mechanical and dielectric
strengths.
Figure 4-13: Breakdown strength of: (a) SEBS-ZnO and (b) SEBS-MA-ZnO nanocomposites
(a) (b)

153
4.3.4.1 Resistance to surface erosion by partial discharges
Resistance to surface erosion by partial discharges is an important criterion to evaluate the
aging of polymer insulation in operating conditions. In fact, when subjected to high electric
fields, the insulation surface can be degraded and its effective thickness reduced. In this
section, we evaluate the resistance to surface erosion of the studied nanocomposites, by
estimating the eroded volume induced in each sample after being subjected to a specific
electric field. The eroded volumes, calculated using mechanical profilometer data,
corresponding to the samples exposed to a voltage equal to 7 kVrms for 30 hours are presented
in Figure 4-14. In general, a decrease of the sample eroded volume can be associated with an
increase in its resistance to electrical discharges. Comparing unfilled materials, the resistance
to surface erosion of SEBS-MA is 10% lower than SEBS. Considering the nanocomposites,
both SEBS-ZnO and SEBS-MA-ZnO sets exhibit excellent resistance to surface erosion by
partial discharges compared to unfilled matrices, even at low ZnO content equal to 1wt%.
This behavior has been commonly reported for nanocomposites and microcomposites
containing fillers featuring good resistance to partial discharges (Brockschmidt, Pohlmann,
Kempen, & Gröppel, 2011; S. Chen et al., 2010; Heid et al., 2015; Huang et al., 2014),
specifically ZnO which is known for its effective shielding of ultraviolet radiation, emitted
during the process of corona aging and playing an important role in the degradation of the
polymer insulation (S. Chen et al., 2010). However, it is obvious from the reported results
that SEBS-MA-ZnO nanocomposites exhibit better performance compared to SEBS-ZnO
nanocomposites. For instance, the eroded volume was reduced by almost 60% upon addition
of 1wt% nanoparticles to SEBS-MA compared to only 18% when the same amount of
nanoparticles is incorporated in SEBS. This behavior is of particular interest. In fact, it
demonstrates that the resistance to erosion by partial discharges cannot be explained only by
the intrinsic shielding property of ZnO, as in this case one would expect similar performance
for similar ZnO content (David & Fréchette, 2013). Thus, the superior performance of SEBS-
MA-ZnO is most likely related to the improved dispersion and interaction in SEBS-MA-ZnO
nanocomposites which results in large interphase layer with a resistance higher than that of
the unfilled matrix and consequently more homogeneous eroded surface and less erosion

154
depth (Mappings of the eroded area corresponding to different samples are available in
Figure A III-8 in annex III). However, in SEBS-ZnO nanocomposites, the inhomogeneous
distribution and the presence of agglomerations may cause local electric field enhancements,
which lead to locally increased electrical and thermal stresses of the nanocomposite, resulting
in intense erosion of the surrounding organic matrix. Results in agreement with these
findings were reported in the literature. For instance, comparison of epoxy microcomposites
and nanocomposites filled with Alumina showed higher resistance to erosion in the case of
nanocomposites (Z. Li, Okamoto, Ohki, & Tanaka, 2011). Also, it was found that
nanocomposites filled with high contents of agglomerated polyhedral oligomeric
silsesquioxane (POSS) molecules exhibit lower resistance than nanocomposites filled with
lower POSS loadings but featuring better dispersion (Heid et al., 2015; Heid, Fréchette, et al.,
2016).
At 10 wt% and 20 wt% ZnO loadings, the eroded volume in respectively SEBS-MA-10 and
SEBS-MA-20 was almost negligible and it was difficult to estimate it properly from the
mapping data. Hence, it seems that the beneficial effect of ZnO nanoparticles saturates at 5
wt% loading, which corresponds to rheological percolation and implicitly to the maximum
interphase volume, as estimated from SAOS measurements earlier. At this loading, the
eroded volume is reduced by 90%.

155
Figure 4-14: Resistance to surface erosion by partial discharges
4.3.4.1 DC electrical conductivity: dependence on nanoparticles networks
Non-linear electrical conductivity is an important property in polymer insulation systems in
order to reduce space charge accumulation especially under DC electric field. In
nanocomposites, the electrical conductivity behavior is often strongly dependent on the
distribution of nanoparticles and the possibility of creating conductive pathways, in addition
to the intrinsic conductivity of the nanoparticles.
Figure 4-15 presents plots of current density vs. electric field for both sets of
nanocomposites: SEBS-ZnO and SEBS-MA-ZnO (Figure 4-15(a)) as well as the evolution of
DC electrical conductivity as function of ZnO loading and applied electric field (Figure
4-15(b)). Since SEBS-MA-ZnO nanocomposites exhibit improved dispersion, homogenous
nanoparticles distribution and consequently less contact between the nanoparticles, one
would expect that these materials will show lower conductivity and will require higher
electric fields to exhibit a non-linear I-V relationship compared to SEBS-ZnO
nanocomposites (Hong et al., 2006). The data reveal that all the materials feature an
improved non-linear behavior in the studied electric field range, especially at electric fields

156
higher than 50kV/cm (corresponding to a change of the slope), except the unfilled SEBS-MA
and SEBS-MA-5 nanocomposite (Figure 4-15(a)). However, different dependences on ZnO
content and electric field have been observed for each set: SEBS-ZnO vs. SEBS-MA-ZnO. In
SEBS-ZnO nanocomposites, a non-linear behavior is observed starting from 5wt% ZnO
content. Besides, a similar trend of current density increase as function of nanoparticles
loadings is observed, independently from the applied electric field, which indicates that the
resulting increase of conductivity observed in these samples is rather depending on the
fraction of agglomerated nanoparticles networks that were progressively formed in the
material at increasing loadings due to imperfect dispersion and inhomogeneous distribution.
Regarding SEBS-MA-ZnO materials, it can be observed that the calculated slope for unfilled
SEBS-MA is higher than 1 (all the slopes are calculated starting from 50 kV/cm), which
corresponds to ohmic conduction. This behavior might be due to the presence of MA polar
groups. At 5wt% ZnO loading, no non-linear electrical behavior was observed up to 170
kV/cm. The slope of the I-V plot is even lower than that of unfilled SEBS-MA, which might
be explained by the presence of deep trapping sites that limit the current transport through the
material (S. Chen et al., 2010; Amir M Pourrahimi et al., 2016; Amir Masoud Pourrahimi et
al., 2016). Similar behavior was reported in the literature for nanocomposites containing low
loadings of ZnO up to 5wt%. A significant decrease of conductivity was even observed in
some cases (Fleming et al., 2008; Amir M Pourrahimi et al., 2016; Amir Masoud Pourrahimi
et al., 2016). Besides, the increase of the current density of SEBS-MA-ZnO materials, at
increasing ZnO wt%, seems to be more dependent on the electric field compared to SEBS-
ZnO nanocomposites. In particular, at low electric field (17 kV/cm), no increase of current
density was observed up to 10 wt% ZnO. At higher electric fields such as 119 kV/cm and
170 kV/cm, the current density starts increasing at 10 wt% ZnO. The improvement induced
by increasing ZnO content from 5 wt% to 10wt% was significantly higher in SEBS-MA-ZnO
nanocomposite compared to SEBS-ZnO nanocomposites. This behavior is most likely due to
reduced interparticle distance enabling efficient electron tunneling activated at high electric
fields (Hong et al., 2003). At increased ZnO loading from 10 wt% up to 20wt% ZnO, a jump
of the current density of approximately two orders of magnitude was observed at low electric

157
fields in SEBS-MA-ZnO nanocomposites compared to 1 order of magnitude for SEBS-ZnO
nanocomposite. However, at high electric fields, a similar trend of increase is observed which
is expected due to the high concentration of nanoparticles. In a summary, the electrical
conduction in SEBS-MA-ZnO nanocomposites is thought to be due to tunneling between
ZnO nanoparticles. The slope of the current-voltage curve in log scale, which reflects the
non-linearity, exhibits a maximum at 10 wt% ZnO (Figure 4-15(a)). This behavior might be
correlated with the rheological percolation estimated between 5wt% and 10wt% from SAOS
measurements discussed earlier. In SEBS-ZnO nanocomposites, the conduction is rather
governed by the formation of paths of touching particles. At increasing ZnO concentrations,
conduction paths extend through the entire sample, which is in line with increasing slope of
non-linearity (Hong et al., 2003, 2006; Zohrevand, Ajji, & Mighri, 2014).
DC electrical conductivity values reported in Figure 4-15(b) illustrate also the different
behaviors exhibited by SEBS-ZnO and SEBS-MA-ZnO nanocomposites as functions of ZnO
content and electric field, as discussed earlier. Besides, the values corresponding to neat
SEBS-MA and SEBS-MA-5 nanocomposite are close to AC conductivity values reported in
Table 4-1, despite the fact that they are measured at higher electric fields and under DC field.
However, for the rest of the samples exhibiting stronger non-linearity, the measured values of
DC conductivity are higher.
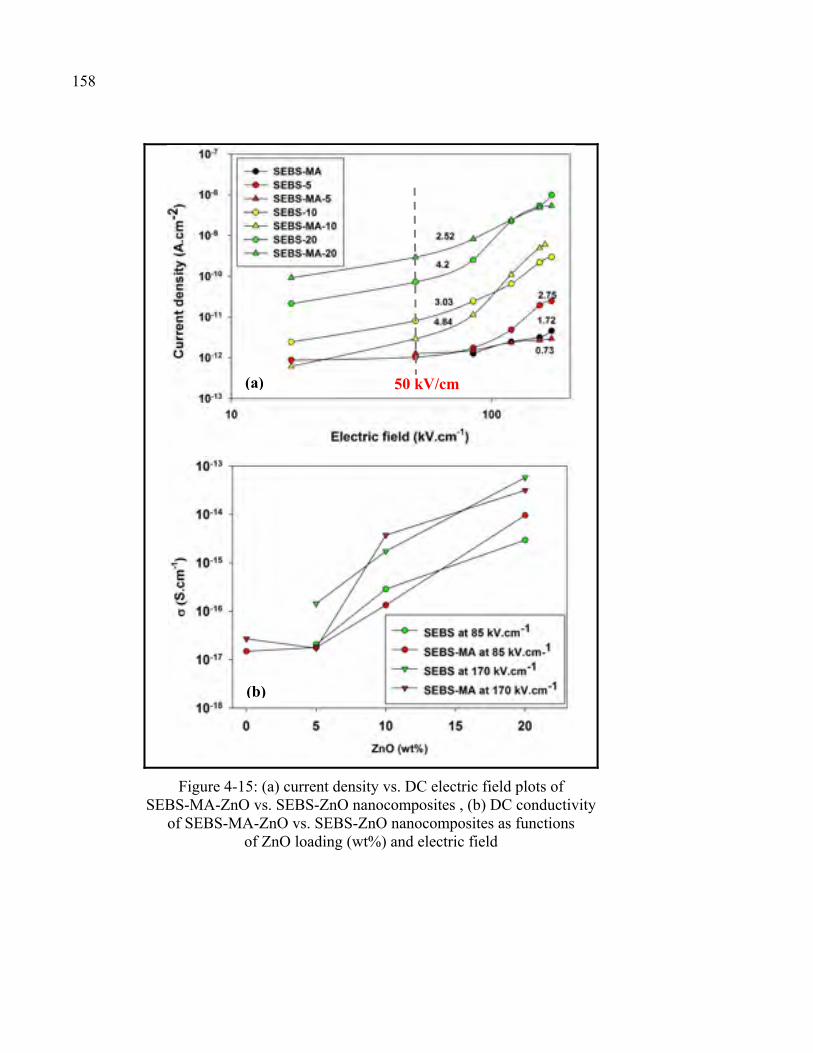
158
Figure 4-15: (a) current density vs. DC electric field plots of SEBS-MA-ZnO vs. SEBS-ZnO nanocomposites , (b) DC conductivity
of SEBS-MA-ZnO vs. SEBS-ZnO nanocomposites as functions of ZnO loading (wt%) and electric field
50 kV/cm (a)
(b)

159
4.3.5 Thermal conductivity
Relatively high thermal conductivity is also a desirable property in insulating materials in
order to facilitate heat dissipation and to avoid the deterioration of the insulation. In general,
the medium to transport thermal energy in solid insulations is phonons, i.e. lattice vibrations
(W. Cui et al., 2011; Heid et al., 2015; Heid, Fréchette, et al., 2016; Huang, Iizuka, Jiang,
Ohki, & Tanaka, 2012). Hence, one would expect that in nanocomposites, the formation of
organized networks of thermally conductive particles is necessary to achieve an improvement
of the matrix thermal conductivity. In this section, we will evaluate the potential of controlled
spatial distribution offered by the established network between ZnO nanoparticles and
polymer chains in enhancing the thermal conductivity of the studied nanocomposites.
Thermal conductivity values of both SEBS-ZnO and SEBS-MA-ZnO sets of nanocomposites
are reported in Figure 4-16. The accuracy of the method used is within 5%. A distinct
behavior has been observed in each set. In particular, in SEBS-ZnO nanocomposites, the
thermal conductivity remained constant up to 10wt% ZnO content, and then increased by
20% at 20 wt% ZnO. This abrupt increase indicates that thermal networks might start to form
in a large scale only at this relatively high loading due to the presence of agglomerations in
SEBS-ZnO nanocomposites and the spherical shape of the nanoparticles. This observation is
consistent with the observed decline of breakdown in SEBS-20 nanocomposite. At ZnO
contents lower than 20wt%, phonon scattering at nanoparticle-polymer and nanoparticle-
nanoparticle interfaces is dominant in SEBS-ZnO nanocomposites and impedes improvement
of thermal conductivity (Huang et al., 2012).
In SEBS-MA-ZnO samples, a higher conductivity of neat SEBS-MA, compared to SEBS,
can be observed at first. This is most-likely related to a molecular rearrangement of the
repetitive units of the copolymer in the presence of MA graft resulting in a denser and more
organized thermal network (Murillo & López, 2015). It was demonstrated in several studies
that controlling the chemistry of amorphous polymers at molecular level might reduce
phonon scattering and consequently enhance the thermal transport (Z. Guo et al., 2014; T.

160
Zhang & Luo, 2016). Upon the incorporation of 5wt% ZnO nanoparticles, an increase of
thermal conductivity by 10% compared to unfilled SEBS-MA and by more than 20%
compared to unfilled SEBS is achieved. At higher contents of ZnO equal to 10wt% and
20wt%, the thermal conductivity didn’t increase further and probably a slight decrease is
even induced. This behavior infers that in SEBS-MA-ZnO nanocomposites, the formation of
thermally conductive pathways starts at lower loadings of nanoparticles, compared to SEBS-
ZnO, most likely due to rheological percolation that was confirmed by SAOS. This is in
agreement with the conclusions of recent studies suggesting that creating ordered structures
at the nanoscale within an amorphous polymer matrix would improve the thermal
conductivity of the polymer (Heid, Fréchette, et al., 2016). Simultaneously, phonon
scattering has more chances to occur especially at elevated nanoparticles loadings, as a result
of good dispersion and the presence of large number of interfaces. However, it is worth
noting that the improved compatibility and adhesion at nanoparticle-polymer interfaces
reduces significantly the impact of scattering (W. Cui et al., 2011; Heid et al., 2015; Heid,
Fréchette, et al., 2016; Huang et al., 2012).
Figure 4-16: Thermal conductivity of SEBS-ZnO vs. SEBS-MA-ZnO nanocomposites
161
4.4 Concluding remarks
In this study, the dispersion of ZnO nanoparticles within SEBS block copolymer was tailored
through the use of MA graft attached to the rubber block. Although the nanoparticles were of
spherical shape, rheological percolation was observed at low ZnO content between 5 wt%
and 10 wt%. This network formed between the nanoparticles and polymer chains was
accompanied by an improvement of thermal conductivity and excellent resistance to surface
erosion, at lower ZnO contents not exceeding 5 wt%, compared to non-maleated SEBS-ZnO
samples where the dispersion was not tailored. Simultaneously, a better control of the
electrical conductivity as function of the electric field and nanoparticles loading was enabled,
which might reduce efficiently the space charge accumulation either by increasing trapping
sites density or improving the non-linearity feature of the conductivity. Besides, the dielectric
losses and the breakdown strength of these samples with tuned dispersion were in similar
range compared to unfilled SEBS and SEBS-MA at power frequencies and operational
temperatures. Furthermore, moisture absorption was found to have a negligible effect on the
dielectric response of these nanocomposites. This combination of properties makes SEBS-
MA-ZnO nanocomposites a promising candidate for HV insulation systems. These features
were enabled at relatively low contents of nanoparticles by using a block copolymer matrix
as a nanostructured template and MA as a functional graft, leading to rheological percolation.
The correlation between rheological properties and electrical, thermal and dielectric
properties brings the attention to viscoelastic properties as an efficient tool to evaluate the
control of dispersion and predict the dielectric performance. Interestingly, this model might
be applied to other types of nanoparticles with desirable properties such as magnesium oxide
(MgO) for instance, which is reported to reduce significantly space charge accumulation.
Application wise, it might be interesting to investigate the resulting thermoplastic elastomer
nanocomposites as master batches to blend with polyolefins commonly used in HV insulation
systems such as polyethylene and polypropylene, in order to improve their performance.

162
Associated content
Supporting electronic information (ESI) file: Additional TEM micrographs, dielectric
spectroscopy data and mappings of eroded area related to the studied nanocomposites are
available online.
Acknowledgements
The financial support from Hydro-Québec and the Natural Sciences and Engineering
Research Council of Canada (NSERC) is gratefully acknowledged. The authors would also
like to thank Dr. Christele Vanga Bouanga, Ms. Meng Guo and Dr. Tung Tran Anh from
IREQ for their valuable help in the thermal conductivity tests and the mechanical
profilometry of the eroded samples as well as Prof. Sylvain Cloutier and his student Jaime
Benavides-Guerrero from ÉTS for the help with spin coating experiments.

CHAPITRE 5
ARTICLE 4: POLYETHYLENE/THERMOPLASTIC ELASTOMER/ZINC OXIDE NANOCOMPOSITES FOR HIGH VOLTAGE INSULATION APPLICATIONS:
DIELECTRIC, MECHANICAL AND RHEOLOGICAL BEHAVIOR
E. Helal1, C. Pottier1,a, E. David1, M. Fréchette2, N.R. Demarquette1 1Mechanical Engineering Department, École de Technologie Supérieure, Montréal, Canada
a Current affiliation: École des Mines de Douai, Douai, France 2Institut de Recherche d’Hydro-Québec, Varennes, Canada.
This article has been submitted for publication to Polymer (submitted on March 16th, 2017,
under review)
Abstract
Blends of polyethylene (PE) with nanocomposites of polystyrene-b-poly(ethylene-co-
butylene)-b-polystyrene grafted maleic anhydride (SEBS-MA) thermoplastic elastomer filled
with Zinc Oxide (ZnO) nanoparticles have been studied as potential candidates for
applications in HV insulation systems including HVDC cables. In particular, the dielectric
and mechanical properties of PE/SEBS-MA/ZnO blend nanocomposites have been evaluated
and compared to those of PE/ZnO homopolymer nanocomposites prepared as a reference.
PE/ZnO materials were characterized by homogeneous distribution of nanoparticles and
presence of agglomerations attributed to insufficient compatibility between the metal oxide
nanoparticles and the polyolefin matrix. However, nanoscale dispersion was achieved in
SEBS-MA/ZnO and PE/SEBS-MA/ZnO nanocomposites due to improved compatibility
between the nanoparticles and SEBS-MA. Besides, in PE/SEBS-MA/ZnO blend
nanocomposites, ZnO nanoparticles remained exclusively confined in SEBS-MA or at the
interface between PE and SEBS-MA. In terms of dielectric properties, the unfilled blend
PE/SEBS-MA featured reduced breakdown strength and resistance to surface erosion by
partial discharges in comparison with neat PE. However, upon addition of ZnO, PE/SEBS-
MA/ZnO presented higher performance when compared to PE/ZnO nanocomposites. At 1
CHAPTER 5

164
wt% ZnO loading, the resistance to surface erosion of PE/SEBS-MA/ZnO increased by 45%
higher than neat PE/SEBS-MA, 38% higher than unfilled PE and 30% higher than PE/ZnO
nanocomposite containing the same ZnO loading. Besides, PE/SEBS-MA/ZnO blend
nanocomposites exhibited dielectric losses lower than PE/ZnO nanocomposites at power
frequencies and temperatures up to 80 °C. The breakdown strength of both sets of
nanocomposites decreased compared to unfilled materials, at large loadings of nanoparticles.
However, smaller reduction was observed in the case of PE/SEBS-MA/ZnO nanocomposites
due to improved nanoparticles dispersion. Finally, PE/SEBS-MA/ZnO nanocomposites
featured enhanced mechanical flexibility when compared to PE/ZnO nanocomposites.
Keywords: thermoplastic elastomer, polymer blend nanocomposite, nanodielectrics,
selective nanoparticles dispersion, HV insulation systems…
5.1 Introduction
Thermoplastic materials such as Polyethylene (PE) and Polypropylene (PP) are common
materials used within high voltage insulation systems. Among them, low density polyethylene
(LDPE) has been extensively used in cable insulation due to its excellent dielectric properties
and attractive processability. However, LDPE has relatively poor thermal and mechanical
stability at high temperatures which could be improved by crosslinking, for instance.
Therefore, currently LDPE is mainly used in its cross-linked form (XLPE), which is
unfortunately unrecyclable (Arora & Mosch, 2011) and vulnerable to space charge
accumulation due to the presence of by-products from the crosslinking process (Fu et al.,
2007).
High density polyethylene (HDPE) and especially PP feature better thermal and mechanical
stability due to their higher melting points and might constitute potential candidates for
recyclable high voltage (HV) insulation materials. But, they suffer from increased brittleness
at low temperatures (Arora & Mosch, 2011). To adapt better the properties of HDPE and PP
to the purpose of recyclable HV insulation, blending was investigated as one of the solutions.
In particular, blends of HDPE with LDPE and/or thermoplastic elastomers were considered

165
(Helal et al., 2016; Helal et al., 2014; I. Hosier et al., 2007; I. L. Hosier et al., 2010; B
Zazoum, David, & Ngô, 2013). Recently, blends of PP and thermoplastic elastomers have
been investigated as well (Du et al., 2016; Hamzah, Jaafar, Jamil, & Kamarol, 2014; Y. Zhou
et al., 2015). The blends have shown mainly an interesting improvement of the mechanical
flexibility at the cost of a reduction in breakdown strength and resistance to surface erosion by
partial discharges as well as increased space charge accumulation (Helal et al., 2016; Helal et
al., 2014; B Zazoum et al., 2013; Y. Zhou et al., 2015). Addition of nanoparticles to these
blends might be a powerful tool to compensate these drawbacks, in a similar trend to what has
been reported in the case of PE based nanocomposites. In fact, it has been well established
that the addition of nanoparticles, including metallic oxide nanoparticles such zinc oxide
(ZnO) and magnesium oxide (MgO), to homopolymer induces a reduction in space charge
accumulation as well as an increase of breakdown strength and resistance to surface erosion
(David & Fréchette, 2013; Fabiani et al., 2016; Fleming et al., 2008; Michel F Fréchette et al.,
2010; M. Guo, Fréchette, David, & Demarquette, 2016; Hayase et al., 2006; Amir M
Pourrahimi et al., 2016; Amir Masoud Pourrahimi et al., 2016; Smith et al., 2008; Tian et al.,
2011, 2012; Tian et al., 2015). In the case of HDPE and PP based blends, few studies have
been reported regarding the effect of nanoparticles (Du et al., 2016; Hamzah et al., 2014;
Helal et al., 2016; B Zazoum et al., 2013). Among them, the recent study published by Du et
al. (Du et al., 2016), reporting that the addition of ZnO nanoparticles to PP/Polyolefin
elastomer (POE) blends results in suppression of space charge accumulation while
maintaining an excellent flexibility ensured by the POE phase. However, there is still work to
be done in this area, especially in the case of HDPE. Therefore, in this study, a blend of HDPE
with polystyrene-b-poly(ethylene-co-butylene)-b-polystyrene grafted maleic anhydride
(SEBS-MA) thermoplastic elastomer containing ZnO nanoparticles will be investigated. In
fact, SEBS and SEBS-MA are often added in minor fractions to polymer matrices either as
compatibilizers to improve the dispersion of nanoparticles including nanoclays, metal oxides
and carbon nanotubes (Liang & Tjong, 2006), when a polyolefin matrix is used or as water
treeing retardant agent in polymer insulating materials (Liu et al., 2011; Z. Ma et al., 2010).
Besides, recently few studies have started exploring blends of polyolefins with SEBS or
SEBS-MA, where the thermoplastic elastomer is acting as a structural phase of the blend

166
affecting its morphology and the spatial distribution of nanoparticles in it (Emna Helal et al.,
2015; Helal et al., 2016; Sarkar & Alexandridis, 2015).
In this work, SEBS-MA/ZnO nanocomposites with excellent nanoparticles dispersion were
initially fabricated by solvent blending following a method reported in a previous study
(Emna Helal et al., 2015) then blended with HDPE using a melt compounding process (Helal
et al., 2016). The morphology of the as-prepared PE/SEBS-MA/ZnO blend nanocomposites
was studied through microscopy and characterization of the linear viscoelastic properties.
Besides, measurements of complex dielectric permittivity, AC short-term breakdown strength
and resistance to surface erosion by partial discharges were performed to evaluate the blend
nanocomposites dielectric behavior, in comparison with reference PE/ZnO nanocomposites
prepared by melt compounding. The mechanical properties of the nanocomposites have been
also investigated, viz. the tensile strength and the elongation at break.
5.2 Experimental
5.2.1 Materials
HDPE was purchased from Chevron Phillips in pellets form (grade HXM50100). Its density is
equal to 0.948 g/cm3 and its melt flow index is equal to 10 g/10 min at 190 °C and under a
load of 21.6 Kg. The grade FG1901 of SEBS block copolymer, which is grafted with maleic
anhydride (MA), was supplied from Kraton in pellets form as well. Its density is equal to
0.915 g/cm3. It is composed of two polystyrene (PS) endblocks in the form of nanometric
cylinders dispersed within the poly(ethylene-co-butylene) (PEB) elastomer midblock. The PS
block fraction is equal to 30wt% while the MA content is equal to 1-2 wt% and is attached to
the PEB block. The ZnO nanoparticles were purchased from Sigma Aldrich in the form of
40wt% colloidal suspension in ethanol. They are modified with an alkyl ammonium salt and
feature an average particle size around 35 nm. All the materials were used as received.

167
5.2.2 Processing
In a first step, SEBS-MA/ZnO nanocomposites were prepared by solvent casting method. In a
second step, SEBS-MA/ZnO nanocomposites were blended with polyethylene by melt
compounding to achieve PE/SEBS-MA/ZnO blend nanocomposites. Moreover, PE/ZnO
nanocomposites were prepared by melt mixing using the same processing conditions, for the
sake of comparison. Before further characterization, all the samples were hot pressed at 160
°C to obtain thin films. The detailed fabrication procedure is published in previous studies
(Emna Helal et al., 2015; Helal et al., 2016). The list and composition of the obtained films
are summarized in Table 5-1. Note that mass fractions of PE and SEBS-MA in the obtained
blends are equal.
Table 5-1: Nomenclature and composition of PE/ZnO and PE/SEBS-MA/ZnO nanocomposites
PE (wt%) SEBS-MA (wt%) ZnO (wt%)
PE 100 0 0
PE/1 99 0 1
PE/5 95 0 5
PE/10 90 0 10
PE/SEBS-MA 50 50 0
PE/SEBS-MA/1 49.5 49.5 1
PE/SEBS-MA/5 47.5 47.5 5
PE/SEBS-MA/10 45 45 10
5.2.3 Characterization
Cross-sections of different nanocomposites were observed to characterize the dispersion of
nanoparticles either by Scanning Electron Microscopy (SEM) or High Resolution Scanning
Electron Microscopy (HRSEM). Hitachi S-3600N microscope was used for SEM images

168
while Hitachi SU-8230 microscope was used for HRSEM images. A Leica microtome
equipped with a tungsten knife was used to fracture the samples in liquid nitrogen at -100 °C.
In order to characterize the morphology of the prepared blends, some samples were immersed
overnight in a large volume of toluene and stirred gently at room temperature, after fracturing,
to extract the SEBS-MA component. Prior to observation, the cross-sections were coated with
a 20 nm thick layer of gold to prevent charge accumulation.
Rheological measurements were performed at 160 °C to characterize the linear viscoelastic
properties of the nanocomposites in the molten state. In particular, small amplitude oscillatory
shear (SAOS) tests were performed by means of Anton Paar MCR 501 strain-controlled
rheometer equipped with 25 mm-diameter parallel plate geometry. The strain value was fixed
to 0.5% while the angular frequency range swept from 0.01 to 300 rad.s-1.
The complex dielectric permittivity of the materials was characterized at room temperature by
means of a Novocontrol broadband spectrometer. In particular, 20-mm-diameter disks were
prepared from the samples and placed between parallel plated brass electrodes to form a
plane-plane capacitor. Then, measurements were performed in the frequency range from
10-2 Hz up to 105 Hz. Besides, a temperature range between 25 °C and 100 °C was considered
for selected samples.
AC short-term breakdown strength tests were performed at ambient temperature using a Bauer
DTA100 equipped with a pair of 4 mm-diameter ball-type electrodes. A constant AC voltage
ramp of 2 kV.s-1 was progressively applied at a frequency equal to 60 Hz, until breakdown
occurred. During the measurement, the samples were fixed between the two electrodes and
immersed in Luminol TRi insulating fluid. 12 specimens of each material, of average
thickness around 250 µm, were considered for a statistical analysis by means of two-
parameter Weibull distribution. However, the samples thickness was not strictly uniform.
Thus, to reduce the errors related to thickness, all the measured breakdown strength fields
were normalized to the average thickness of 250 µm using a power law equation reported in

169
reference (Takala et al., 2010). The normalized breakdown strengths were used for the
statistical analysis.
To evaluate the resistance of the fabricated materials to surface erosion, samples of average
thickness equal to 500 µm were subjected to prolonged AC stress under electrical discharge
conditions, using a point-to-plane geometry set-up operated in open air. The samples were
fixed to the ground plane electrode using Kapton tape and separated from the tip of the rod
electrode by an air gap of 200 µm. The radius of the rod electrode is equal to 1 mm. During
the test, a sinusoidal AC voltage (7 kVRMS , 300 Hz) was applied to the rod electrode while the
plane electrode was connected to ground. The erosion time was fixed to 40 hours which is
equivalent to 200 hours at 60 Hz. Then, the eroded volume of each sample was evaluated by
means of a mechanical profilometer (Dektak 150).
More details regarding the procedures used for dielectric spectroscopy measurements, AC
short-breakdown tests and resistance to surface erosion tests are available in previous studies
(Emna Helal et al., 2015; Helal et al., 2016).
The mechanical properties of all the nanocomposites were measured using STM Alliance
machine equipped with 1 kN load cell and operated in the tensile mode according to ASTM
D638-14 (Standard Test Method for Tensile Properties of Plastics, 2014). The stretching rate
was selected equal to 10mm/min. Dog-bone shaped specimens were used with a gauge length
of 9.53 mm, a width of narrow section equal to 3.15 mm and a thickness of 3.15 mm. 5
specimens were tested for each material. All the specimen were prepared by injection molding
using a melt temperature equal to 200 °C, a mold temperature equal to 60 °C and an injection
pressure equal to 50 MPa.

170
5.3 Results and discussion
5.3.1 Scanning electron microscopy (SEM)
The dispersion of ZnO nanoparticles in the fabricated nanocomposites was first characterized
by SEM at low magnifications. Samples not subjected to solvent extraction were considered
at this step. Micrographs corresponding to untreated PE/ZnO nanocomposites containing
different concentrations of nanoparticles are presented in Figure 5-1. It can be seen that at
increasing content of nanoparticles, microscale agglomerations of increasing size are
observed (as indicated by the arrows in Figure 5-1(c) and Figure 5-1(d)), which indicates
poor dispersion of nanoparticles in polyethylene matrix. In micrographs corresponding to
untreated PE/SEBS-MA/ZnO reported previously in (Helal et al., 2016), no agglomerations
were observed. Besides, chemical analysis by energy dispersive X-ray spectroscopy (EDX),
reported in the same study (Helal et al., 2016), revealed homogeneous distribution of Zinc
element all over the sample.

171
Figure 5-1: SEM micrographs of PE/ZnO nanocomposites: (a) unfilled PE, (b) PE/1, (c) PE/5 and (d) PE/10
To study the morphology of PE/SEBS-MA/ZnO blend nanocomposites, samples treated by
solvent extraction to dissolve SEBS-MA were considered. Micrographs corresponding to
these samples are reported in Figure 5-2. Figure 5-2(a), corresponding to the unfilled blend,
indicates the formation of a co-continuous morphology, characterized by a sponge shape.
Interestingly, the incorporation of ZnO nanoparticles in the blend results in a considerable
change of morphology (Figure 5-2(b)-(d)), even at nanoparticles concentration as low as
1wt%. More specifically, the co-continuous morphology of the unfilled blend disappeared
giving place to more droplet dispersion type morphology where SEBS-MA phase is in the
form of elongated droplets. This switch of morphology is the result of the increase of SEBS-
MA viscosity during the melt processing, upon the addition of ZnO nanoparticles, which
leads to breaking the threads. The viscosity increase hypothesis will be discussed in a
following section of the manuscript, in correlation with SAOS measurements performed on
PE/SEBS-MA/ZnO blends and reported in Figure 5-4 as well as SAOS measurements

172
corresponding to SEBS-MA/ZnO master batches and reported previously in (Helal, David,
Fréchette, & Demarquette, under review; Emna Helal et al., 2015).
Apart from the switch of morphology, SEM micrographs reported in Figure 5-2 doesn’t
indicate any presence of agglomerations. This observation confirms that the dispersion of
nanoparticles was considerably improved. However, the location of nanoparticles cannot be
identified at this step. To determine their location, two methods were adopted: an analytical
method based on the wetting coefficient theory as well as an experimental method based on
HRSEM.
Figure 5-2: SEM micrographs of samples treated by solvent extraction: (a) unfilled PE/SEBS-MA, (b) PE/SEBS-MA/1, (c) PE/SEBS-MA/5 and (d) PE/SEBS-MA/10

173
PE/SEBS-MA/5 nanocomposite was considered for HRSEM. Two specimens were
investigated: one treated with toluene to dissolve the SEBS-MA phase and one untreated
where both phases are present. The HRSEM micrographs are reported in Figure 5-3. In
particular, micrographs corresponding to the untreated specimen and the treated specimen are
reported respectively in Figure 5-3(a) and Figure 5-3(b). Besides, Figure 5-3(c) and Figure
5-3(d) correspond to two zooms on respectively a PE region and an SEBS-MA region,
selected from Figure 5-3(b). From the SEM image corresponding to the untreated sample
(Figure 5-3(a)), it is difficult to accurately distinguish the two phases of the blend, i.e. PE and
SEBS-MA, due to insufficient contrast between the two polymers (which could be due to the
fact that the examined section was not thin enough). However, a nanoscale dispersion and
inhomogeneous distribution of the nanoparticles is observed (regions surrounded by yellow
dotted lines in Figure 5-3(a) correspond to regions containing nanoparticles). The
examination of the sample treated with toluene at low magnification shows the presence of
islands which correspond normally to the extracted SEBS-MA domains. A zoom inside one
of these domains (region surrounded by red dotted line in Figure 5-3(b)) shows multiple
traces of nanoparticles (Figure 5-3(d)). However, no nanoparticles were observed outside the
SEBS-MA region (region surrounded by blue continuous line in Figure 5-3(b) and presented
in Figure 5-3(c)). Hence, it can be concluded that the nanoparticles are enclosed in SEBS-
MA phase and at the interface PE/SEBS-MA, due to the good affinity between the MA graft
and the functional groups on the surface of ZnO nanoparticles.

174
Figure 5-3: HRSEM micrographs of PE/SEBS-MA/5 nanocomposite: (a) SEBS-MA not extracted, (b) SEBS-MA extracted, (c) Zoom inside PE region surrounded by blue continuous line in (b): poor ZnO phase, (d) Zoom inside SEBS-MA region surrounded
by red dotted line in (b): poor ZnO phase, (d) Zoom inside SEBS-MA region surrounded by red dotted line in (b): rich ZnO phase
(Colors are available in the online version)
5.3.2 Thermodynamic prediction of ZnO nanoparticles localization: Wetting
coefficient
In order to support the conclusions made from HRSEM analyses regarding the localization of
ZnO nanoparticles, a thermodynamic prediction was performed to estimate the ability of the
nanoparticles to be wetted by the two components of the blend: PE and SEBS-MA. In fact, at
thermodynamic equilibrium, nanoparticles in a polymer blend tend to locate in a position that
minimizes the interfacial energy. This equilibrium position might be predicted by the

175
evaluation of the wetting coefficient Wa which is estimated according to equation (5.1),
adapted from Young`s equation (Tadros, 2015; Trifkovic, Hedegaard, Sheikhzadeh, Huang,
& Macosko, 2015; X. Zhao et al., 2013). In the case of the studied system, Wa is equivalent
to the contact angle of the nanoparticle at the interface between PE and SEBS-MA
(Vandebril, Vermant, & Moldenaers, 2010). = / // (5.1)
Where:
Wa: wetting coefficient; γ1/2: interfacial tension between components 1 and 2.
Wa values above 1 or below -1 mean that ZnO nanoparticles would preferentially locate in
SEBS-MA or in PE, respectively. If the value of Wa is between -1 and 1, the difference
between ZnO/PE and ZnO/SEBS-MA interfacial tensions is less than PE/SEBS-MA
interfacial tension which induces the nanoparticles to localize at the interface in order to
minimize the interfacial energy.
The interfacial tension between two components could be determined experimentally or
theoretically. The experimental method might be difficult and not accurate especially in the
case of nanoparticle-polymer interfaces (Trifkovic et al., 2015). Therefore, to avoid this
complication, the values of the interfacial tension used in this manuscript were derived
according to Owens-Wendt mean equation (equation (5.2)), knowing the surface tension of
each component (Owens & Wendt, 1969). The values of surface tension corresponding to
PE, SEBS-MA and ZnO nanoparticles at the processing temperature 160 °C have been
extrapolated from values reported in literature (Demarquette, Da Silva, Brandi, & Gouvêa,
2000; Moreira & Demarquette, 2001; "Solid surface energy data (SFE) for common
polymers," ; Švab, Musil, Šmit, & Makarovič, 2007; Torchinsky & Rosenman, 2009;
Trifkovic et al., 2015; Wilkinson, Clemens, & Harding, 2004) and summarized in Table 5-2.

176
γ / = γ + γ − 2( γ γ + γ γ ) (5.2)
Where: γ1/2: interfacial tension between component 1 and 2; γ1: surface tension of component 1; γp: polar component; γd: dispersive component.
Table 5-2: Total surface tension and Dispersive and Polar components for polymers and ZnO nanoparticles estimated at 160 °C
-dγ/dT (mJ.m-2.K-1)
γ (mJ.m-2)
γ d
(mJ.m-2) γ p
(mJ.m-2)
PE (Demarquette et al., 2000; Moreira &
Demarquette, 2001; "Solid surface energy
data (SFE) for common polymers," ; Trifkovic et
al., 2015)
0.057
27.72
27.72
0
SEBS-MA (Švab et al., 2007; Wilkinson et al.,
2004)
0.045
30
21.6
8.4
ZnO (Torchinsky & Rosenman, 2009)
- 34 25 9
The calculated values of interfacial tension between each two components and the estimated
wetting coefficient are reported in Table 5-3. The estimated Wa indicates that the
nanoparticles should be mainly localized in SEBS-MA phase and probably at the interface
PE/SEBS-MA. This result is expected due to the interaction between the nanoparticles
surface and the MA graft. It is also in line with the results of microscopy reported earlier. As
a consequence, the theoretical method represents a straightforward tool to predict the
localization of nanoparticles. However, it is worth mentioning that this theoretical prediction
has several limitations. The major one is the difficulty to get accurate values of surface
tension from the literature in the case of SEBS-MA block copolymer and ZnO nanoparticles,

177
which takes into account the exact physical properties and applied chemical modification, for
instance. Also, in this study, the value of the temperature coefficient, dδ/dT, of SEBS-MA
was assumed equal to that of SEBS. Besides, the values of surface tension calculated for ZnO
nanoparticles in reference (Torchinsky & Rosenman, 2009) and used in this study,
correspond to nanoparticles treated to decrease their surface tension and improve their
compatibility with polymers. Unfortunately, their chemical modification differs from that
applied to the nanoparticles used in this work. But, these values remain reliable since they are
also close to those reported for several organically modified clays (Trifkovic et al., 2015)
functionalized in a similar fashion to the nanoparticles used in this study, which are modified
by an alkyl ammonium salt. In addition to errors related to surface tension values, in the
general case, nanoparticles localization in a polymer blend is not only influenced by
thermodynamic considerations, but also by kinetic effects. In fact, interplay between
nanoparticle compatibility with each polymer phase, processing sequence and rheology is
often involved (Trifkovic et al., 2015).
Table 5-3: Estimated interfacial tension and wetting coefficient values
Estimated values
γZnO/PE (mJ.m-2) 9.07
γZnO/SEBS-MA (mJ.m-2) 0.13
γPE/SEBS-MA (mJ.m-2) 8.78
Wa 1.01
5.3.3 Rheological properties
The morphology of PE/SEBS-MA blends and the improved quality of dispersion in
PE/SEBS-MA/ZnO nanocomposites were studied by microscopy, as discussed earlier.
However, this technique only gives insights at a local micro and nanoscale. A useful
technique that might give information about the dispersion and morphology at a larger
macroscale is rheology. In fact, by performing small amplitude oscillatory shear (SAOS)

178
tests for example, the variation of the viscoelastic properties of the polymer matrix in the
molten state as function of the nanoparticles dispersion could be probed. Generally, many
homopolymers such as polyethylene exhibit a terminal behavior distinguished by a high
slope and drop of the elastic modulus, at low frequencies. However, in the presence of
nanostructures such as nanoparticles or nanodomains of a block copolymer for example, this
slope may decrease and the elastic modulus might increase due to confinement of polymer
chains between the nanostructures. This effect is more obvious with increasing amount of
nanoparticles.
In Figure 5-4, plots of storage modulus G’ and complex viscosity modulus |η*| as function of
angular frequency ω are reported, respectively in Figure 5-4(a) and Figure 5-4(b), for both
PE/ZnO and PE/SEBS-MA/ZnO nanocomposites. The viscoelastic properties of unfilled
SEBS-MA and SEBS-MA/ZnO master batch, used to prepare PE/SEBS-MA/5
nanocomposite and referred to as MB5, are also reported for the sake of comparison. In the
case of PE/ZnO nanocomposites, it can be seen that G’ and |η*| of PE remain roughly the
same after the addition of the nanoparticles. This behavior is valid for ZnO concentrations up
to 10wt% ZnO (only results corresponding to 5 wt% ZnO are reported in Figure 5-4) and
indicates that the interaction between ZnO nanoparticles and PE chains is relatively weak. In
the case of PE/SEBS-MA/ZnO materials, a different behavior is observed. First of all, it can
be seen that G’ of unfilled PE/SEBS-MA blend increased compared to neat PE especially at
low frequencies. This behavior is partially attributed to the characteristic non-terminal
behavior of SEBS-MA as a block copolymer (Carastan et al., 2008) and also to the
deformation of SEBS-MA domains in the blend (Graebling, Muller, & Palierne, 1993).
Considering PE/SEBS-MA/ZnO nanocomposites, a consistent increase of G’ and |η*|
compared to unfilled PE/SEBS-MA is exhibited in the whole frequency range and especially
at low frequencies. Simultaneously, the slope of G’ vs. ω plot decreases at low frequencies.
The same behavior is also featured by MB5 compared to unfilled SEBS-MA, with a higher
improvement rate. Moreover, a plateau in G’ vs. ω plot is exhibited at low frequency
indicating good nanoparticles dispersion and establishment of a network between ZnO
nanoparticles and SEBS-MA block copolymer chains attributed to the interaction between

179
MA graft and functional groups on the surface of ZnO nanoparticles. More details regarding
this viscoelastic behavior of SEBS-MA/ZnO nanocomposites can be found in prior studies
(Helal et al., under review; Emna Helal et al., 2015). The resulting efficient confinement of
the macromolecular chains by the nanoparticles is at the origin of the increased dynamic
viscosity of SEBS-MA and subsequently the blend in the whole ω range studied. This
increase justifies the switch of morphology of PE/SEBS-MA/ZnO nanocomposites compared
to unfilled PE/SEBS-MA reported in Figure 5-2, if we consider that the shear viscosity
during the melt processing is well approximated by the dynamic viscosity, in respect with
Cox-Merz approximation, which is valid for different polymer systems at relatively low
shear rates (Dealy & Wang, 2013). In fact, although the value of the shear rate during the
processing was not estimated quantitatively in this study, due to the different parameters that
are involved in its estimation (Bousmina, Ait-Kadi, & Faisant, 1999), it is not expected to
exceed few hundreds of reciprocal seconds (Bousmina et al., 1999; Kohlgrüber, 2008), which
is in the range of the studied angular frequencies of the SAOS tests.

180
Figure 5-4: SAOS measurements of PE/ZnO vs. PE/SEBS-MA/ZnO nanocomposites: (a) storage modulus G’ and (b) complex viscosity
modulus |η*| as function of angular frequency ω
(b)
(a)

181
5.3.4 Complex dielectric permittivity
Complex dielectric permittivity of the studied nanocomposites has been characterized as
functions of frequency and temperature. Data corresponding to room temperature
measurements are reported in Figure 5-5. In particular, plots of imaginary permittivity ɛ’’ as
function of frequency, corresponding to PE/ZnO and PE/SEBS-MA/ZnO nanocomposites are
reported respectively in Figure 5-5(a) and Figure 5-5(b). Besides, plots of ɛ’’ as function of
frequency corresponding to SEBS-MA/ZnO nanocomposites, used as master batches to
prepare respectively PE/SEBS-MA/5 and PE/SEBS-MA/10 nanocomposites, are reported in
Figure 5-5(c) for the sake of comparison. The master batches are referred to as MB5 and
MB10 respectively. More details regarding the dielectric spectroscopy results of SEBS-
MA/ZnO nanocomposites are reported in (Helal et al., under review).
All PE/ZnO nanocomposites show large relaxation peaks in the vicinity of 101-102 Hz, which
correspond most likely to Maxwell-Wagner-Sillars (MWS) interfacial process. At increasing
ZnO concentration, the peak is shifted to lower frequencies. This behavior is in part
consistent with the MWS theory suggesting that, if the conductivity of the matrix is small and
can be neglected, which is the case for both PE and SEBS-MA, an increase in the volume
fraction of the fillers induces a slight increase of the relaxation time and consequently a
decrease of the peak maximum frequency (David & Fréchette, 2013; Kremer & Schönhals,
2012; Tsangaris, Kouloumbi, & Kyvelidis, 1996). However, this effect is too small to justify
the observed experimental results. Instead, the formation of bigger agglomerates with lower
effective conductivity, at increasing ZnO concentrations, is the likely explanation for this
behavior. PE/SEBS-MA/ZnO nanocomposites exhibit an interfacial relaxation process as
well, but less intense and at higher frequencies in the vicinity of 102-103 Hz. Similar to the
behavior observed in PE/ZnO nanocomposites, the relaxation peak is shifted to lower
frequencies at increasing ZnO content.
The difference in frequencies windows corresponding to the relaxation phenomena observed
respectively in PE/ZnO and PE/SEBS-MA/ZnO might be correlated with the location of
182
nanoparticles in either PE or SEBS-MA, since the MA graft attached to SEBS interacts with
the surface of ZnO nanoparticles, modifying the properties of the interface (Helal et al.,
under review). In fact, MB5 and MB10 nanocomposites used as master batches exhibit
relaxation peaks at around 103 Hz. Besides, the peak featured in PE/SEBS-MA/ZnO
nanocomposites is more similar to SEBS-MA/ZnO nanocomposites in terms of dielectric
strength and peak position indicating that ZnO nanoparticles are potentially located in SEBS-
MA phase. This observation supports the conclusions made earlier from the microscopy and
thermodynamic study, which suggest that the nanoparticles stay confined inside SEBS-MA
phase and probably at SEBS-MA/PE interfaces.
As far as the insulation application is concerned, PE/SEBS-MA/ZnO nanocomposites feature
the lowest losses at room temperature, as compared to both PE/ZnO nanocomposites and
SEBS-MA/ZnO master batches as shown in Figure 5-5(c), especially at power frequencies.
Moreover, the real permittivities of the nanocomposites remain low and close to those of
unfilled PE and PE/SEBS-MA, all values in the range 2.2-2.4 (not reported in this
manuscript).

183
Figure 5-5: Plots of imaginary permittivity ɛ’’ as function of frequency measured at room temperature corresponding to: (a) PE/ZnO nanocomposites, (b) PE/SEBS-MA/ZnO
nanocomposites and (c) comparison with SEBS-MA/ZnO nanocomposites
To investigate further the observed interfacial relaxation process and the effect of absorbed
humidity on it, isothermal frequency sweeps of the complex dielectric permittivities of both
PE/5 and PE/SEBS-MA/5 nanocomposites have been performed in the temperature range
from 25 °C to 100 °C, before drying and immediately after drying them for 5 days in a
vacuum oven at 65 °C. The results are reported in Figure 5-6. The comparison of the spectra
recorded before (Figure 5-6(a)-(b)) and after drying (Figure 5-6(c)-(d)) reveals that there is a
little effect of drying, which indicates that the quantity of absorbed humidity is negligible.
This behavior is expected and has been already reported several times in the literature, when
nanoparticles with adequate surface modification are used (David et al., 2015; Fleming et al.,
2008; Lau et al., 2013).
(a) (b)
(c)

184
Apart from the drying aspect, a drastic change in the dielectric behavior was observed
between PE/ZnO and PE/SEBS/ZnO nanocomposites. For PE/5 nanocomposite, the
relaxation peak was found to shift towards higher frequencies at increasing temperatures,
which is the usual trend for nanocomposites for which the conductivity of the inclusion
increases with temperature. This behavior is more obvious in the case of the dried sample
since the release of absorbed water as the temperature increases in the case of the undried
samples slightly counterbalance the increase of the inclusions conductivity. The PE/SEBS-
MA/5 nanocomposite (Figure 5-6(d)) exhibits a considerably reduced dielectric strength and
broadness compared to PE/5 nanocomposite (Figure 5-6(c)) in the studied temperature range.
This behavior is in line with the absence of agglomerations in PE/SEBS-MA/ZnO
nanocomposites and the improved interaction with the nanoparticles which modifies the
interphase properties. Similar results have been reported when improved compatibility
between the nanoparticles and the polymer matrix is ensured (David & Fréchette, 2013;
Smith et al., 2008; Bouchaib Zazoum, Eric David, & Anh Dung Ngô, 2014; Bouchaib
Zazoum et al., 2016). However, it could be seen that at elevated temperatures starting from
50 °C, a dominant contribution from charge fluctuations to the dielectric loss spectra, is
observed for the PE/SEBS-MA/5 nanocomposite, especially for frequencies below 10 Hz,
while being completely absent in the case of PE/5 nanocomposite. At 90 °C, the dielectric
loss of PE/SEBS-MA/5 nanocomposite becomes even slightly higher than PE/5
nanocomposite at power frequencies.
Electrode polarization might be responsible of part of this increase. However, a considerable
improvement of the nanocomposites conductivity by few orders of magnitude is the likely
explanation. In fact, this behavior has been also observed in the dielectric spectra of SEBS-
MA/ZnO nanocomposites, as reported in (Helal et al., under review), and was attributed to
the interaction of MA with functional groups on the surface of the nanoparticles that leads to
an improved dispersion and the formation of a network between ZnO nanoparticles and the
block copolymer chains. As a consequence, SEBS-MA/ZnO nanocomposites become slightly
conductive at favorable heating conditions. Moreover, the increase of conductivity reaches a

185
threshold at about 5 wt% ZnO. This effect seems to be ultimately transferred to the
PE/SEBS-MA blends leading to the observed behavior.
Figure 5-6: Isothermal frequency sweeps of the imaginary permittivity ɛ’’ of PE/5 and PE/SEBS-MA/5 nanocomposites at different temperatures between 25 °C and 100 °C,
performed before and after drying: (a) undried PE/5, (b) undried PE/SEBS-MA/5, (c) PE/5 dried and (d) PE/SEBS-MA/5 dried for 5 days at 65 °C.
5.3.5 AC short-term breakdown strength
After normalization to the thickness of 250 µm, the retrieved data corresponding to the AC
short term breakdown tests were analyzed by means of a two-parameter Weibull distribution
(a) (b)
(c) (d)

186
to evaluate the breakdown strength of the studied nanocomposites. Commercial software was
used for the analysis.
The cumulative Weibull distribution function of breakdown strength is given by equation
(5.3). More details regarding the use of Weibull distribution for dielectric strength estimation
could be found in IEEE standard 930 ("IEEE Guide for the Statistical Analysis of Electrical
Insulation Breakdown Data," 2005).
β
−−=
0
exp1E
EP (5.3)
Where:
P: is the cumulative probability of failure at an electric field less or equal to E;
E0: is the scale parameter corresponding to the breakdown strength for which the cumulative
failure probability is equal to 63.2%;
β: is the shape parameter which measures the scatter of the data. The larger β is the narrower
is the range for breakdown strength.
Weibull plots as well as scale and shape parameters values corresponding to PE/ZnO and
PE/SEBS-MA/ZnO nanocomposites are reported respectively in Figure 5-7(a) and Figure
5-7(b). In particular, the value of the breakdown strength of neat PE is equal to 162 kV/mm.
Upon addition of nanoparticles up to 5 wt%, the breakdown strength decreased by about
10%. At 10 wt % ZnO loading, a considerable decrease of breakdown by 34% was induced.
This behavior might be explained by the presence of agglomerations, especially at large
concentrations of nanoparticles, which result in local voids and defects where the electric
field is enhanced. This negative effect is dominating the potential positive effect consisting of
increasing charge traps density and more efficient electron scattering (Cheng et al., 2013;
Tian et al., 2012). The unfilled PE/SEBS-MA blend features a reduction of breakdown
strength compared to neat PE by 10% as well, which is in line with its reduced mechanical
strength (to be discussed later) and the presence of PE/SEBS-MA interfaces. Upon the
addition of ZnO nanoparticles to the blend up to 5wt%, the breakdown strength of the blend
was maintained or slightly reduced by 5%. This behavior might be correlated with the

187
improved compatibility and dispersion of nanoparticles inside SEBS-MA phase, which
ensure a good balance between electron scattering and local electric field enhancements
(Cheng et al., 2013; Smith et al., 2008; Tian et al., 2011, 2012). At this level of ZnO
loadings, dielectric breakdown strength values of PE/ZnO and PE/SEBS-MA/ZnO
nanocomposites are comparable and the initial drop induced by the thermoplastic elastomer
phase was compensated by the improved role of ZnO dispersion. At 10wt% ZnO, the
dielectric strength of PE/SEBS-MA/10 nanocomposite exhibits a drop by 15% compared to
the unfilled blend but remains higher than PE/10 nanocomposite: 123 vs.107 kV/mm. Overall
in both sets of nanocomposites, it seems that 5wt% ZnO is an optimum loading at which the
breakdown of the nanocomposites reaches its maximum.
Figure 5-7: Weibull probability plots of: (a) PE/ZnO nanocomposites and (b) PE/SEBS-MA/ZnO nanocomposites
5.3.6 Resistance to surface erosion by partial discharges
The resistance to surface erosion by partial discharges is an important property to evaluate
the long-term dielectric performance of insulating materials under operational conditions,
especially high electrical stresses. In general, a reduction in the eroded volume caused by
corona discharges is equivalent to an improved resistance. In Figure 5-8, eroded volumes
corresponding to PE/ZnO and PE/SEBS-MA/ZnO nanocomposites, subjected to a voltage
equal to 7 kVRMS for 40 hours at 300 Hz, are reported. The relative evolution of the eroded
(a) (b)

188
volume corresponding to each nanocomposite is calculated compared to the unfilled
reference, either unfilled PE or unfilled PE/SEBS-MA.
Comparing unfilled PE and PE/SEBS-MA, it could be seen that the blend exhibits again
lower performance, with an increase of the eroded volume by approximatively 13%
compared to neat PE. Upon the addition of ZnO nanoparticles, both sets of nanocomposites
exhibit improved resistance. In a general trend, the eroded volumes decrease with increasing
nanoparticles content. This is expected due to higher resistance of inorganic species to partial
discharges compared to organic compounds (Brockschmidt et al., 2011; S. Chen et al., 2010;
Heid et al., 2015). Moreover, Zinc oxide is well known by its shielding effect to UV light
emitted during the process of partial discharges (S. Chen et al., 2010).
Comparing both sets of nanocomposites, it can be observed that PE/SEBS-MA/ZnO
nanocomposites feature the best resistance, despite the low performance of the unfilled blend.
For example, the eroded volume of PE/SEBS-MA/1 is 45% less than unfilled PE/SEBS-MA,
38% less than unfilled PE and 30% less than PE/1 nanocomposite. At higher loading equal to
10wt%, the eroded volume of PE/SEBS-MA/10 is 82% less than PE/SEBS-MA, 79% less
than PE and 24% less than PE/10. Since the comparison is made considering the same
amount of nanoparticles, the observed difference between both sets of nanocomposites is
most likely related to the dispersion and distribution of the nanoparticles. In fact, the
improved nanoscale dispersion of ZnO nanoparticles in SEBS-MA results in reduced
distortion of the electric field and highly improved resistance inside the SEBS-MA phase.
Resistance to surface erosion measurements performed on SEBS-MA/ZnO samples and
reported in (Helal et al., under review) support this conclusion. However, in PE/ZnO
nanocomposites, the presence of agglomerations might lead to local field enhancements and
severe erosion of the surrounding polymer (Heid et al., 2015; Heid, Fréchette, et al., 2016). In
PE/SEBS-MA/ZnO blend nanocomposites, SEBS-MA/ZnO domains are distributed in form
of droplets, as seen in Figure 5-2(b)-(d). These droplets featuring high resistance to erosion
improve the performance of PE matrix and lead to an overall performance between that of
PE/ZnO nanocomposites and that of SEBS-MA/ZnO nanocomposites used as master batch.

189
Hence, an improved control of the blend morphology in order to achieve co-continuity or
more homogeneous distribution of SEBS-MA/ZnO islands might be beneficial to achieve
higher performance. The shape of SEBS-MA/ZnO domains might be of importance as well.
For instance, elongated domains could increase further the efficiency of SEBS-MA/ZnO
phase in the blend.
Figure 5-8: Resistance to surface erosion by partial discharges for PE/ZnO vs. PE/SEBS-MA/ZnO nanocomposites
5.3.7 Mechanical properties
Mechanical properties of both PE/ZnO and PE/SEBS-MA/ZnO nanocomposites have been
characterized in tensile mode. Typical stress-strain curves corresponding to different samples
are reported in Figure 5-9 while estimated values of elastic modulus E, elongation at break
EB, ultimate tensile strength UTS and elongation at ultimate tensile strength EUTS are
reported respectively in Figure 5-10(a)-(d). The reported stress-strain curves show that
PE/ZnO and PE/SEBS-MA/ZnO feature different behaviors in terms of stiffness and
flexibility. In particular, unfilled PE and its corresponding PE/ZnO nanocomposites exhibit

190
high rigidity. However, they fracture shortly after necking at relatively low strains. These
results are in agreement with other studies reporting similar values of elongation for HDPE
based materials (Bhattacharyya, Chen, & Zhu, 2014; H. Ku, Wang, Pattarachaiyakoop, &
Trada, 2011; Kumar et al., 2016; J.-H. Lee, Jung, Hong, Rhee, & Advani, 2005). It is worth
noting that the absence of a large cold drawing region might be correlated with the used
strain rate. In particular, reducing the strain rate may result in larger cold drawing regions
and consequently larger values of elongation (Cai & Song, 2015). Unfilled PE/SEBS-MA
blend exhibits a different behavior characterized by a reduced elastic modulus and an
improved plasticity compared to PE, leading to a considerable improvement of toughness
overall. Finally, PE/SEBS-MA/ZnO nanocomposites exhibit an intermediate behavior in
terms of stiffness and elongation.
Figure 5-9: Typical stress-strain curves of selected PE/ZnO vs. PE/SEBS-MA/ZnO materials
Considering the values of elastic modulus E of the studied materials reported in Figure
5-10(a), it could be seen that indeed blending PE with SEBS-MA reduces largely E from 385
MPa to about 65 MPa. This behavior is expected due to the low stiffness of SEBS-MA. In
PE/ZnO nanocomposites, the addition of increasing ZnO content up to 5wt% leads to an

191
initial small increase of E up to 400 MPa. However, at 10wt% ZnO, the modulus drops to
about 370 MPa. The increase of stiffness with the addition of metal oxide nanoparticles is
expected due to their high rigidity. However, at elevated concentrations, the formed
agglomerations impede the load stress transfer from the polymer matrix to the nanoparticles
leading to reduced strength (Pang et al., 2015). In PE/SEBS-MA based nanocomposites, the
presence of ZnO nanoparticles results in considerable improvement of stiffness compared to
the unfilled blend, up 95% at 5 wt% ZnO loading. This effect could be explained by the good
dispersion of ZnO in SEBS-MA and the good adhesion at the interface which increase
efficiently the stiffness of SEBS-MA phase and consequently the blend. This behavior
compensates partially for the initial drop of stiffness caused by the thermoplastic elastomer.
However, the stiffness of PE/SEBS-MA/ZnO nanocomposites remains in general
considerably lower than PE/ZnO materials. UTS values corresponding to PE/SEBS-MA/ZnO
are also lower than PE/ZnO materials, as shown in Figure 5-10(c). In both sets, the presence
of ZnO nanoparticles induces small enhancements, mainly at 1wt% and 5wt% ZnO loadings.
Overall, tensile strength values of PE/SEBS-MA/ZnO are in the range 20-25 MPa while
those of PE/ZnO are in the range 40-45 MPa.
In terms of flexibility, EB and EUTS, shown respectively in Figure 5-10(b) and Figure
5-10(d), are largely improved in unfilled PE/SEBS-MA. Upon the addition of ZnO
nanoparticles to PE/SEBS-MA, the flexibility is reduced, which is expected due to the rigid
nature of the nanoparticles, but remains considerably high compared to PE/ZnO materials. In
particular, PE/SEBS-MA/1 nanocomposite features a good balance of strength and ductility,
ensuring an overall enhancement of toughness compared to PE.

192
Figure 5-10: Mechanical properties of PE/ZnO vs. PE/SEBS-MA/ZnO nanocomposites: (a) Elastic Young’s modulus E, (b) Elongation at break EB, (c) Ultimate tensile strength UTS and (d) Elongation at ultimate tensile strength EUTS (error bars stand for standard deviation)
5.4 Concluding remarks
In this study, the dielectric and mechanical properties of PE/SEBS-MA/ZnO nanocomposites
have been evaluated, as potential candidates for HV insulation systems, in comparison with
conventional PE/ZnO nanocomposites prepared by melt compounding. A correlation with the
morphology and nanoparticles dispersion has been established as well. The main conclusions
are the following:
- The use of SEBS-MA/ZnO master batch and a short mixing time with PE allows
maintaining a good dispersion of the nanoparticles and their selective localization
(c) (d)
(b) (a)

193
inside the SEBS-MA phase and potentially at the interfaces PE/SEBS-MA. The
increase of SEBS-MA viscosity upon addition of ZnO nanoparticles results in a
switch of morphology from co-continuity in the case of unfilled PE/SEBS-MA blend
to elongated droplets, in the case of PE/SEBS-MA/ZnO nanocomposites.
- The improved dispersion of nanoparticles in PE/SEBS-MA/ZnO compared to
PE/ZnO results in better control of dielectric loss increase and breakdown strength
decrease especially at elevated ZnO concentrations. Besides, the selective dispersion
of ZnO in SEBS-MA droplets results in more efficient resistance to surface erosion
by partial discharges inside the droplets and ultimately in the whole blend, compared
to PE/ZnO nanocomposites where agglomerations are formed. This effect is more
obvious at low concentrations of ZnO.
- Due to the presence of the elastomer PEB block, the breaking elongation of unfilled
PE/SEBS-MA is improved compared to PE while the tensile strength is reduced. The
presence of ZnO nanoparticles results in a considerable decrease of the elongation
while improving slightly the tensile strength. But overall, PE/SEBS-MA-ZnO
nanocomposites show improved mechanical flexibility compared to PE/ZnO
nanocomposites and higher toughness at low ZnO loading equal to 1wt%.
Due to these improved electrical properties and mechanical flexibility, PE/SEBS-MA/ZnO
nanocomposites have good potential for applications in HV insulation systems, specifically
in HVDC cables as a replacement to XLPE. Therefore, the investigation of different fractions
of PE and SEBS-MA in the blend as well as ZnO contents lower than 1 wt%, are
recommended to optimize further the initial properties of the unfilled blend and to ensure a
good trade-off between mechanical and dielectric/electrical properties in PE/SEBS-MA/ZnO
blend nanocomposites.
Acknowledgements
The financial support from Hydro-Quebec and the Natural Sciences and Engineering Research
Council of Canada is highly appreciated. The authors are also grateful to Dr. Christele V.
Bouanga, Dr. Meng Guo and Dr. Tung Tran Anh, for their generous help in the mechanical
profilometry of the eroded samples.

194

CHAPITRE 6
ARTICLE 5: TUNING THE MECHANICAL AND DIELECTRIC PROPERTIES OF CLAY-CONTAINING THERMOPLASTIC ELASTOMER NANOCOMPOSITES
E. Helal1, L.G. Amurin1,a, D. J. Carastan2, R.R. de Sousa Jr.2, E. David1, M. Fréchette3 and
N.R. Demarquette1 1 Mechanical Engineering Department, École de Technologie Supérieure,
Montréal, QC, Canada a Current affiliation: MackGraphe Research Center, Mackenzie Presbyterian University, São
Paulo, SP, Brazil 2 Center for Engineering, Modeling and Applied Social Sciences, Federal University of ABC,
Santo André, SP, Brazil 3 Institut de Recherche d’Hydro-Québec, Varennes, QC, Canada
This manuscript is submitted for publication to Polymer Engineering and Science (submitted
on May 07th, 2017, under review)
Abstract
In this study, the mechanical strength and the AC short term breakdown strength of
polystyrene-b-poly(ethylene-co-butylene)-b-polystyrene (SEBS) thermoplastic elastomer
clay-containing nanocomposites have been investigated as function of their morphologies.
The SEBS/clay nanocomposites with tailored morphologies were prepared previously by
different processing techniques. They featured different orientations of clay platelets as well
as polystyrene (PS) block nanodomains, namely: isotropic, oriented and partially oriented
morphologies. In unfilled SEBS matrices, the mechanical strength was mainly tuned by the
orientation of PS block nanodomains. A good correlation between the dielectric breakdown
strength and the mechanical stiffness was observed overall: the higher the mechanical
strength was, the higher the breakdown strength was. In the nanocomposites, the orientation
of clay platelets as well as the degree of order and the characteristic sizes of the block
CHAPTER 6
196
copolymer domains were seen to affect strongly the breakdown strength behavior in addition
to the mechanical strength. In particular, the partially oriented morphology achieved by film
blowing extrusion exhibited the maximum increase of the breakdown strength by 25% with
optimized mechanical stiffness evaluated between that of the oriented morphology as a lower
limit and that of the isotropic morphology as an upper limit.
Keywords: thermoplastic elastomer nanocomposite, tailored morphology, mechanical
stiffness, dielectric breakdown strength
6.1 Introduction
Block copolymers are a special class of materials composed of immiscible polymer blocks
that are usually self-organized in well-ordered nanodomains. The morphologies adopted by
these nanodomains depend on several parameters such as the affinity between the blocks,
their molecular weights and their relative proportions (Helfand, 1975; Sarkar & Alexandridis,
2015). Besides, these morphologies can be easily tuned by different external forces that can
be applied either during melt compounding or solvent casting fabrication processes (Leice G
Amurin et al., 2016; Daniel, Hamley, & Mortensen, 2000; Liedel, Pester, Ruppel, Urban, &
Böker, 2012; Mansky et al., 1998; Ruppel et al., 2013).
Due to these features, block copolymers have been investigated recently as templated
multiphase matrices to tailor nanoparticles dispersion in polymer nanocomposites (Balazs et
al., 2006; Bockstaller et al., 2005; Kao et al., 2013; J. Y. Lee, Park, Yang, Cho, & Kim,
2003; Park et al., 2003; Sarkar & Alexandridis, 2015). Currently, this approach is considered
of high importance to develop techniques for designing an advanced generation of
nanocomposites with prescribed morphologies and engineering properties.
In this context, some recent studies investigated different morphologies of polystyrene-b-
poly(ethylene-co-butylene)-b-polystyrene (SEBS) triblock copolymers and their clay-
containing nanocomposites (Carastan et al., 2013; Carastan et al., 2014; De Sousa Jr et al.,

197
2014; Helal et al., 2017; E Helal et al., 2015). SEBS belongs to the class of styrenic
thermoplastic elastomers and features in addition to its ordered nanostructure, excellent
combination of mechanical properties (Balsamo et al., 2006; Holden et al., 2004), good
resistance to water treeing (Liu et al., 2011; Z. Ma et al., 2010), good electromechanical
coupling (B. Kim et al., 2011) and high compatibility with polyolefins (Agari et al., 1993).
As a block copolymer, SEBS is composed of two polystyrene (PS) blocks and one
poly(ethylene-co-butylene) (PEB) elastomer midblock. It was widely used as a
compatibilizer (Liang & Tjong, 2006) and as a dielectric elastomer actuator (Kofod et al.,
2011; Mc Carthy et al., 2009; Mi et al., 2014; Saleem et al., 2014; Stoyanov et al., 2011).
The studies performed on SEBS and SEBS/clay nanocomposites demonstrated that different
orientations of PS ordered nanodomains and clay nanoplatelets can be achieved by
appropriate processing techniques (Leice G Amurin et al., 2016; Carastan et al., 2013;
Carastan et al., 2014; De Sousa Jr et al., 2014; Helal et al., 2017; E Helal et al., 2015). For
instance, isotropic lamellar or cylindrical morphologies were obtained by solvent casting
process when adequate thermal annealing procedures were applied and appropriate fractions
of PS blocks were present (E Helal et al., 2015). Furthermore, oriented morphologies where
PS nanodomains and clay nanoplatelets are simultaneously aligned in the same direction
were obtained by extensional and shear forces applied during a sheet die extrusion process
(Leice G Amurin et al., 2016; Carastan et al., 2013; Carastan et al., 2014). In addition, more
complex morphologies where PS domains and clay platelets have more than one preferential
direction of alignment were achieved by film blowing extrusion. More details regarding these
morphologies are available in the cited publications (De Sousa Jr et al., 2014; Helal et al.,
2017). The abovementioned changes in spatial distribution of PS domains and nanoclays
were correlated with changes in the mobility of elastomer chains located in the interfacial
region. An interfacial glass transition (Tgi), several tens of degrees higher than the glass
transition of the bulk PEB block, was attributed to these interfacial chains. In particular, the
lowest Tgi temperatures were attributed to nanocomposites with aligned morphologies
indicating less mobility restriction in this configuration compared to the other morphologies
(Helal et al., 2017).

198
The control of morphology ultimately resulted in changes in effective dielectric properties as
well. This behavior is partially expected due to the observed changes in the interfacial region
which usually governs the properties of nanocomposites. In particular, increase of the
breakdown strength was observed when SEBS-30 matrix (30 wt% PS domains) was filled
with clay content equal to 5 wt%. Moreover, the comparison between isotropic and oriented
morphologies of this nanocomposite revealed that the maximum increase of breakdown
strength was equal to 45% and corresponded to the nanocomposite featuring oriented
morphology, with both clay platelets and PS domains simultaneously aligned perpendicularly
to the applied electric field (E Helal et al., 2015). This effect is in agreement with findings
from the literature reporting that the addition of nanoclay to polyolefin matrices, increases
the dielectric breakdown strength and their alignment perpendicular to the applied electric
field improves further the results by increasing the tortuosity of the paths taken by the charge
carriers (David et al., 2013; Liao et al., 2013b; Liao et al., 2014; Tomer et al., 2011).
However, the dielectric strength of oriented unfilled SEBS matrix was reduced, compared to
isotropic unfilled SEBS, which unfortunately neutralizes the increase observed by the
alignment of clay.
This behavior is most likely related to the reduction of mechanical stiffness upon the
alignment of PS nanodomains perpendicular to the electric field direction. In support to this
hypothesis, few studies reported that the breakdown strength of SEBS was reduced with
decreasing mechanical stiffness (Kollosche & Kofod, 2010; Kollosche et al., 2009). In fact,
the electrodes attached to the specimen’s surface during the breakdown test exert a
compressive force that might result in appreciable deformations at an applied voltage below
the intrinsic breakdown voltage, especially in soft elastomeric materials, leading to reduced
dielectric strength and failure. This phenomenon is well-known as electromechanical
breakdown. Some empirical equations were already established to describe the correlation
between mechanical stiffness and electromechanical breakdown strength in rubbery materials
(Blythe & Bloor, 2005).

199
In the same research orientation, this work aims at evaluating and validating the correlation
between the breakdown strength and the mechanical strength of clay-containing SEBS
nanocomposites in dependence with their designed morphologies, mainly the spatial
distribution of PS block nanodomains and clay nanoplatelets. To this end, two sets of SEBS
block copolymers with different ratios of PS blocks: 13 wt% and 20 wt% as well as their
nanocomposites were investigated. The morphologies of these nanocomposites were tuned
by means of different processing techniques.
6.2 Processing and characterization
6.2.1 Materials
Two grades of symmetric SEBS triblock copolymers donated by Kraton were used:
G1643and G1645. These grades contain respectively 13 wt% and 20 wt% of PS blocks and
are referred to in the manuscript respectively as SEBS-13 and SEBS-20. PS block
nanodomains are ordered in the form of hexagonally packed cylinders within the
poly(ethylene-co-butylene) (PEB) elastomer block. Montmorillonite clay grade Cloisite 20A
purchased from Southern Clay (Gonzales, USA) and modified with dimethyl di
(hydrogenated tallow) quaternary ammonium salt, was used as nanofiller for the
nanocomposites preparation. In the rest of the manuscript, the abbreviation 20A will be used
to design clay Cloisite 20A. All the materials studied in this paper were used as received.
More details regarding the physical properties of the polymers as well as the modification
and size of clay particles were provided in the previous studies published by co-authors
(Leice G Amurin et al., 2016; Carastan et al., 2013; Carastan et al., 2014; De Sousa Jr et al.,
2014; Helal et al., 2017; E Helal et al., 2015).
6.2.2 Processing
The materials investigated in this study were prepared by different processing techniques to
achieve different orientations of PS nanodomains and clay platelets. Three selected
techniques were used: solvent casting, sheet die extrusion and film blowing extrusion at two
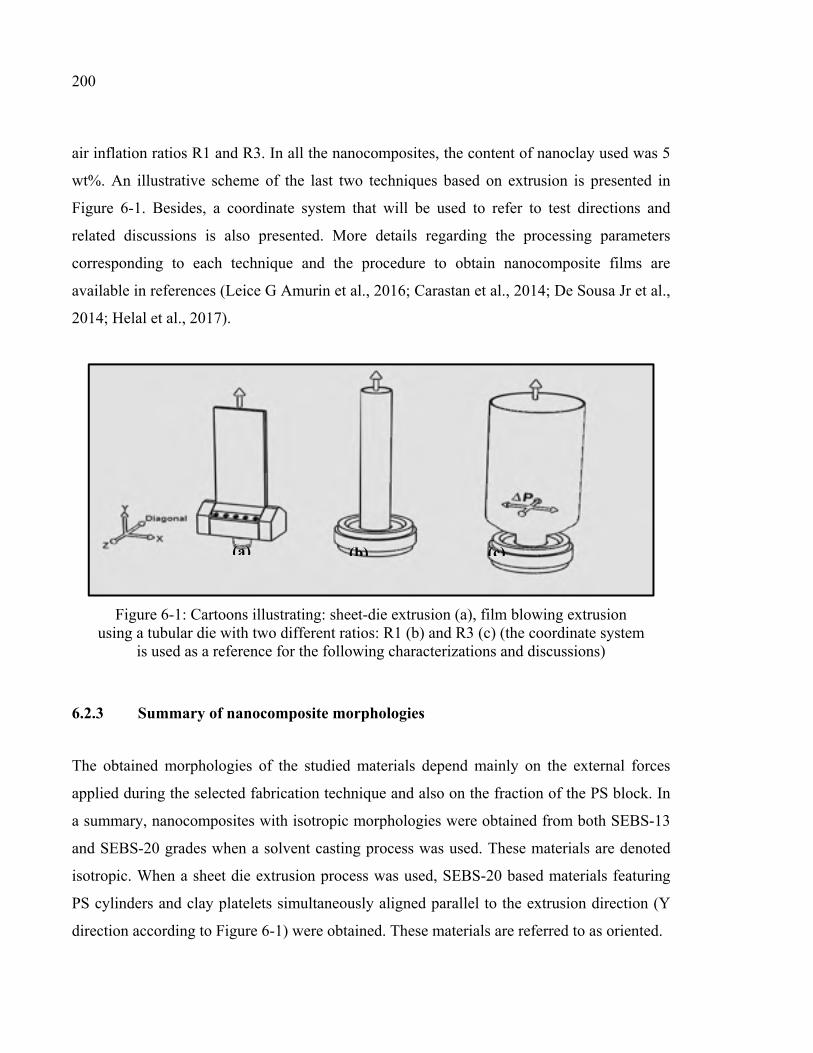
200
air inflation ratios R1 and R3. In all the nanocomposites, the content of nanoclay used was 5
wt%. An illustrative scheme of the last two techniques based on extrusion is presented in
Figure 6-1. Besides, a coordinate system that will be used to refer to test directions and
related discussions is also presented. More details regarding the processing parameters
corresponding to each technique and the procedure to obtain nanocomposite films are
available in references (Leice G Amurin et al., 2016; Carastan et al., 2014; De Sousa Jr et al.,
2014; Helal et al., 2017).
Figure 6-1: Cartoons illustrating: sheet-die extrusion (a), film blowing extrusion using a tubular die with two different ratios: R1 (b) and R3 (c) (the coordinate system
is used as a reference for the following characterizations and discussions)
6.2.3 Summary of nanocomposite morphologies
The obtained morphologies of the studied materials depend mainly on the external forces
applied during the selected fabrication technique and also on the fraction of the PS block. In
a summary, nanocomposites with isotropic morphologies were obtained from both SEBS-13
and SEBS-20 grades when a solvent casting process was used. These materials are denoted
isotropic. When a sheet die extrusion process was used, SEBS-20 based materials featuring
PS cylinders and clay platelets simultaneously aligned parallel to the extrusion direction (Y
direction according to Figure 6-1) were obtained. These materials are referred to as oriented.
(c)(b)(a)

201
The rest of the nanocomposites discussed in this manuscript feature more complex
morphologies. In fact, the sheet die extrusion of SEBS-13 based materials induced the
alignment of clay platelets parallel to (XY) plane and a fraction of PS nanodomains parallel
to Y axis. However, another fraction of PS cylinders remained isotropic. The imperfect
alignment of PS cylinders in SEBS-13 was attributed to the low fraction of PS block (Leice
G Amurin et al., 2016). SEBS-20 based materials prepared by film blowing extrusion
featured also complex morphologies depending on the air inflation ratio. At ratio R1, a major
fraction of both PS domains and clay particles were aligned in the extrusion direction (Y
axis) and a minor fraction was aligned across the thickness (parallel to Z axis). At ratio R3,
clay platelets were oriented in the XY plane while PS domains were randomly distributed in
the XY plane perpendicular to the thickness. This third class of materials is designated
partially oriented.
An exhaustive characterization of the as-described morphologies by small angle X-ray
scattering (SAXS) and transmission electron microscopy (TEM) was reported in previous
publications (Leice G Amurin et al., 2016; De Sousa Jr et al., 2014; Helal et al., 2017). The
nomenclature of these nanocomposites and short descriptions of their morphologies are
provided in Table 6-1. More details and illustrative schemes can be found in (Helal et al.,
2017) or Table 3-3 of this dissertation.
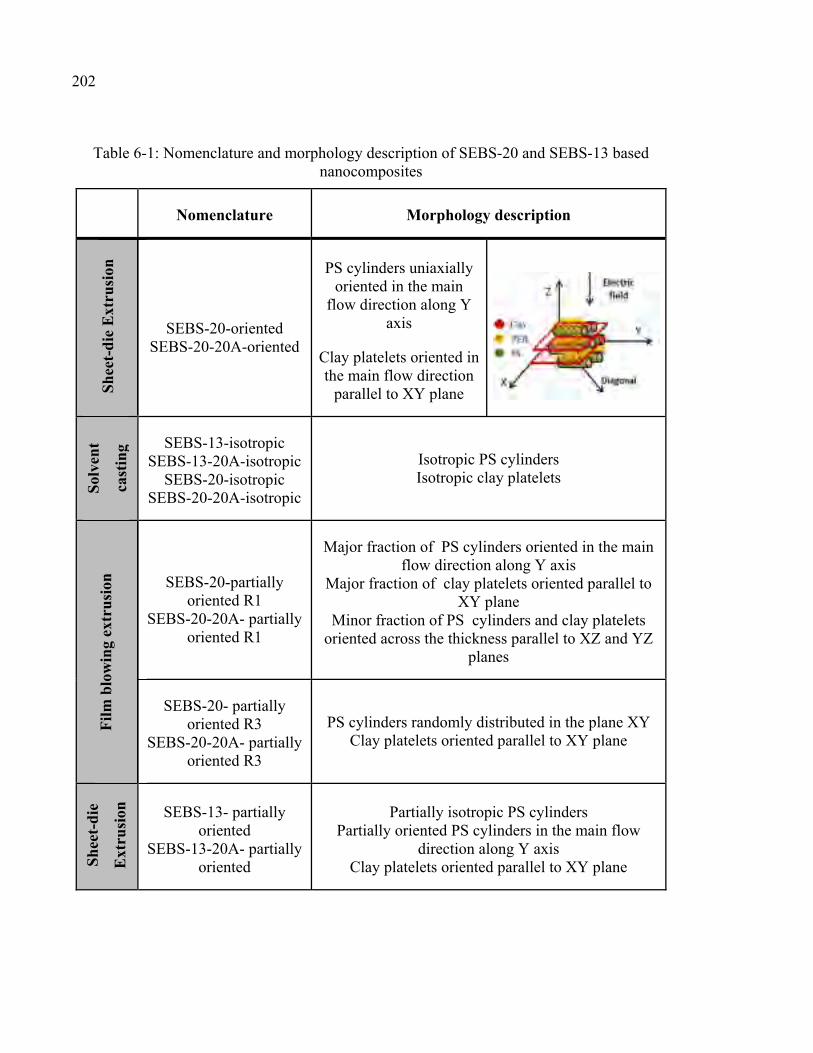
202
Table 6-1: Nomenclature and morphology description of SEBS-20 and SEBS-13 based nanocomposites
Nomenclature Morphology description
SEBS-20-oriented SEBS-20-20A-oriented
PS cylinders uniaxially
oriented in the main flow direction along Y
axis
Clay platelets oriented in the main flow direction
parallel to XY plane
SEBS-13-isotropic
SEBS-13-20A-isotropic SEBS-20-isotropic
SEBS-20-20A-isotropic
Isotropic PS cylinders Isotropic clay platelets
SEBS-20-partially
oriented R1 SEBS-20-20A- partially
oriented R1
Major fraction of PS cylinders oriented in the main flow direction along Y axis
Major fraction of clay platelets oriented parallel to XY plane
Minor fraction of PS cylinders and clay platelets oriented across the thickness parallel to XZ and YZ
planes
SEBS-20- partially oriented R3
SEBS-20-20A- partially oriented R3
PS cylinders randomly distributed in the plane XY
Clay platelets oriented parallel to XY plane
SEBS-13- partially
oriented SEBS-13-20A- partially
oriented
Partially isotropic PS cylinders
Partially oriented PS cylinders in the main flow direction along Y axis
Clay platelets oriented parallel to XY plane
Sol
ven
t
cast
ing
Sh
eet-
die
Ext
rusi
on
Fil
m b
low
ing
extr
usi
on
Sh
eet-
die
Ext
rusi
on

203
6.3 Characterization
6.3.1 Mechanical properties
The mechanical properties of the block copolymers and their nanocomposites were measured
using STM Alliance machine equipped with 1kN load cell and pneumatic grippers. The
elastic Young’s modulus and the elongation at break were evaluated in the tensile mode
according to ASTM 412D (Standard Test Methods for Vulcanized Rubber and Thermoplastic
Elastomers, 2016). The speed was selected equal to 50mm/min, lower than the speed
recommended by the standard (500 mm/min) for more precision (Saleem et al., 2014). 5
specimens at least were tested for each material.
6.3.2 AC short-term breakdown strength
The AC short-term breakdown strength of the samples was measured using ball-type
electrodes of diameter 4 mm in a dielectric oil environment. For each sample, 12 specimens
were considered to calculate the dielectric strength using Weibull distribution. A voltage
ramp of 2 kV/s at a frequency of 60 Hz was applied until breakdown occurred. All
measurements were done at room temperature. Since the thickness of the samples was not
strictly uniform, all the measurements were corrected to equal the breakdown strength of a
550 µm thick film using the power law relationship between the breakdown field and the film
thickness in order to obtain comparable results (Takala et al., 2010) .
6.4 Results and discussion
6.4.1 Mechanical properties
The stress-strain curves of SEBS-20 and SEBS-13 sets of materials are respectively plotted
in Figure 6-2 and Figure 6-3. The Young’s modulus was evaluated by calculating the slope in
the linear region up to 5% strain. The values are summarized in Figure 6-4. It is worth
mentioning that the final objective is to evaluate the mechanical properties of the samples in
the thickness direction (Z direction) in order to correlate them with the breakdown strength

204
measurements, where the electric field was applied parallel to the thickness as indicated by
the arrows in the illustrative cartoon in Table 6-1. Since it was technically difficult to
evaluate the mechanical properties by compression, tensile measurements were adopted and
the directions of the tests were varied, depending on the orientation of PS cylinders and clay
platelets, in order to mimic the maximum the mechanical behavior across the thickness.
Nevertheless, the results will be discussed carefully as some differences from the real
behavior may exist.
For the samples prepared by solution, no specific recommendation for the test direction was
needed as they are isotropic. For the extruded samples exhibiting specific orientation of PS
cylinders and clay layers parallel to the Y axis, the tensile testing was performed in the
transverse direction (parallel to X axis) which is equivalent to Z axis as far as the
contribution of PS cylinders to the mechanical properties is concerned.
For the samples prepared by film blowing extrusion at a ratio R1, the tests were performed in
the XY plane with an angle of 45° to take into account the orientation of a small fraction of
PS cylinders that deviate from aligning parallel to the Y axis. This direction will be referred
to as diagonal (Figure 6-1 and Table 6-1) and is believed to be equivalent to Z axis as far as
the contribution of PS cylinders to the mechanical properties is concerned, since a minor
fraction of PS cylinders were oriented in the thickness direction. For the samples prepared by
film blowing extrusion at a ratio R3, the tensile tests were performed in the diagonal
direction as well. Since the PS cylinders are randomly oriented in the XY plane, the
mechanical properties in this direction are expected to be close to those of the isotropic
sample. However, in the thickness direction, the mechanical properties should be equivalent
to the case of oriented samples.
As noticed, all the specified test directions for the anisotropic samples take into account the
real contribution of PS cylinders orientation to the mechanical properties but do not
correspond to the real contribution of clay layers which are oriented parallel to the XY plan
in which the tensile tests are performed and perpendicular to the Z axis (thickness direction).

205
Thus, the real mechanical properties of these samples in the thickness direction, especially in
the elastic region, might be lower than the measured values due to the reduced mechanical
strength of the “intrastack phase” as reported by Mishnaevsky et al. (Dai & Mishnaevsky Jr,
2013; Mishnaevsky Jr, 2012). However, since this imprecision is present in all the
anisotropic samples, the evaluation of their relative performance compared to each other
remains possible.
Figure 6-2 shows that all SEBS-20 based materials present comparable elongations at break
and ultimate strengths (including those prepared by film blowing extrusion and not reported
in the Figure). The same conclusion can be made for SEBS-13 set of materials as well
(Figure 6-3). In terms of stiffness, all the nanocomposites showed in general improved
stiffness compared to their pure materials, as it can be seen in Figure 6-4. Hence, the effect of
nanoclays is more obvious on the elastic deformation rather than plastic deformation. This
stiffening effect is partially attributed to the relatively high Young’s modulus of clay platelets
especially along their planes, as reported several times in the literature (Dai & Mishnaevsky
Jr, 2013; Mishnaevsky Jr, 2012; Leszek A Utracki, 2010). Besides, the interfacial
interactions have an important impact as well. In fact, the presence of clay platelets might
prevent the molecules from orientation resulting in stiffness enhancement (Fang, Leng, &
Gao, 2006; Helal et al., 2017; Vo et al., 2011).
Considering the set of materials prepared from SEBS-20 and the data reported in Figure 6-2
and Figure 6-4, it can be concluded that the oriented materials prepared by extrusion exhibit
the lowest elastic moduli, respectively equal to 2.7MPa and 5.2MPa for the neat SEBS-20
and the SEBS-20-20A-oriented nanocomposite. This is expected since perpendicular to PS
cylinders orientation, the mechanical properties are rather governed by the soft PEB phase
featuring lower stiffness (Leice G Amurin et al., 2016; Wang et al., 2010). The materials
prepared by film blowing extrusion at a ratio R1 exhibit improved elastic moduli,
respectively equal to 3.3MPa and 5.7MPa for the neat SEBS-20-partially oriented R1 and its
corresponding nanocomposite. This improvement is attributed to the orientation of a fraction
of PS cylinders parallel to the thickness. However, it is worth noting that SEBS-20- partially

206
oriented R1 seems to be relatively inhomogeneous in the test direction. In fact, although the
majority of the tested specimens exhibit behavior close to the average behavior presented in
Figure 6-2 and Figure 6-4, few specimens exhibit higher stiffness with Young’s modulus
around 6.2 MPa (plots not presented in this manuscript).
The samples prepared by solution and by film blowing extrusion at a ratio R3 exhibit the
highest improvement in stiffness. Furthermore, their elastic moduli are similar, for both
cases: unfilled matrices and nanocomposites. This behavior confirms the hypothesis of
isotropic morphology in the XY plane of samples prepared with a ratio R3 concluded from
SAXS and TEM data discussed in a previous publication ((Helal et al., 2017). As a
consequence, in the Z direction, the mechanical behavior of these materials (partially
oriented R3) is rather close to that of the oriented samples measured in the transverse
direction. This assumption will be considered later in the discussion of the breakdown
strength results. In a summary, parallel to the thickness (Z direction), SEBS-20 based
materials could be classified corresponding to their stiffness as following: oriented~ partially
oriented R3< partially oriented R1< isotropic. This trend supports also the potential role of
the interfacial interactions in the stiffening effect. In fact, it was reported in (Helal et al.,
2017) that nanocomposites with isotropic and partially oriented morphologies exhibit more
confinement in the interfacial region.
According to Figure 6-3 and Figure 6-4, the set of samples prepared from SEBS-13 exhibit
generally higher elongation at break but lower stiffness compared to the samples prepared
from SEBS-20. This behavior is expected due to the reduction of PS block fraction exhibiting
higher mechanical strength compared to PEB block. Moreover, extruded SEBS-13 based
samples, both the neat and the nanocomposite, exhibit lower stiffness compared to isotropic
materials prepared by solution. This behavior supports the conclusion that SEBS-13 materials
prepared by extrusion exhibit both oriented PS domains and isotropic PS domains, despite
the fact that SAXS diffraction patterns corresponding to these materials reported in (Helal et
al., 2017) indicate only isotropic PS cylinders.

207
Figure 6-2: Characteristic stress-strain plots of SEBS-20 based materials
Figure 6-3: Characteristic stress-strain plots of SEBS-13 based materials

208
Figure 6-4: Young’s modulus of respectively SEBS-20 and SEBS-13 sets of materials
6.4.2 AC short-term Breakdown strength
The data corresponding to the AC short-term breakdown tests were retrieved using
commercial software. Two-parameter Weibull distribution (equation (6.1)) was used for the
estimation of the breakdown strength. More details regarding the statistical analysis of
breakdown measurements could be found in IEEE 930 standard ("IEEE Guide for the
Statistical Analysis of Electrical Insulation Breakdown Data," 2005).

209
β
−−=
0
exp1E
EP (6.1)
Where: P: is the cumulative probability of failure at an electric field less or equal to E; E0: is the scale parameter corresponding to the breakdown strength for which the cumulative failure probability is equal to 63.2%; β: is the shape parameter which measures the scatter of the data. The larger β is the narrower is the range for breakdown strength.
Weibull plots, scale factor and shape factor related to SEBS-20 and SEBS-13 sets of
materials are reported respectively in
Figure 6-5 and Figure 6-6. An overall inspection of the results shows that all the
nanocomposites exhibit higher dielectric strength compared to their unfilled parts and
increased shape factors indicative of improved reliability. The highest increase of β is
observed in samples prepared by solution as they are more homogeneous due to their
isotropy.
As far as unfilled materials are concerned, it could be seen that indeed the breakdown
strength varied depending on the processing method and consequently on the morphology
and mechanical properties of the block copolymer. In fact, oriented samples exhibit lower
dielectric strength compared to the isotropic samples. Moreover, in the case of SEBS-20 set,
SEBS-20- partially oriented R3 and SEBS-20-oriented exhibit comparable values around 56
kV/mm while SEBS-20-isotropic and SEBS-20-partially oriented R1 exhibit higher values
respectively around 60kV/mm and 62 kV/mm. This observation partially matches the trend
observed for the mechanical properties but a higher breakdown was expected for the
isotropic sample which exhibits the highest elastic modulus. This behavior might be due to
the fact that SEBS-20-isotropic features less perfect order compared to SEBS-20-bioriented
R1. In fact, the decrease of order may result in reduced number of nanoscaled interfaces
between the blocks and induce less efficient trapping of charge carriers (Samant et al., 2016).
SAXS data reported in (Helal et al., 2017) support this hypothesis.

210
Surprisingly, SEBS-13 set of materials shows similar behavior compared to SEBS-20
materials with breakdown strength equal to 61kV/mm for the isotropic material prepared by
solution and equal to 53kV/mm for the material prepared by extrusion. Although this
behavior supports the hypothesis that the two samples prepared by different processing
techniques do not exhibit the same PS orientation, it disagrees with the fact that these
materials exhibit lower stiffness compared to SEBS-20 due to the reduced ratio of styrene
and are consequently expected to exhibit lower dielectric strength. This unexpected high
performance is probably due to the fact that the diameter of PS cylinders in SEBS-13, equal
to 9.7 nm according to calculations based on SAXS results (not reported in this manuscript),
is smaller than the diameter of PS cylinders in SEBS-20 estimated as 12.5 nm (Helal et al.,
2017), which induces larger and more nanosized interfacial area where the charge carriers
could be trapped and subsequently compensates for the deterioration of stiffness in SEBS-13.
However, this hypothesis needs further investigation to be confirmed.
In terms of nanocomposites, the data reported in
Figure 6-5 and Figure 6-6 shows that the lowest improvement in breakdown strength,
compared to the unfilled matrices, corresponds to isotropic nanocomposites prepared by
solution. It is in the range of 6 to 7%. The nanocomposites featuring clay platelets aligned
parallel to XY plane, prepared either by sheet-die extrusion or film blowing extrusion at ratio
R3, exhibit higher improvement up to 10.6% due to alignment of nanoparticles perpendicular
to the electric field. Unfortunately, this improvement does not compensate for the decline of
the breakdown strength of the matrix caused by the simultaneous alignment of PS cylinders
perpendicular to the thickness. A similar behavior was reported in our previous study (E
Helal et al., 2015) concerning SEBS-30 based nanocomposites. However, a higher increase
of breakdown strength, up to 45%, was achieved in SEBS-30-20A oriented nanocomposite
compared to unfilled SEBS-30 oriented, indicating more efficient role of clay platelets as
barriers to the flow of charge carriers. This higher performance might be related to improved
dispersion, degree of orientation and interaction with polymer chains at increasing fraction of
PS block. In fact, clay platelets exhibit better interaction with the relatively polar aromatic
rings of PS block (Carastan et al., 2014). Also, the difference in the thickness between the
211
samples used to perform the breakdown tests (average thickness in the range 100-170 µm for
SEBS-30 based nanocomposites compared to 550 µm for SEBS-20 and SEBS-13 based
nanocomposites) might partially contribute to the superior performance of SEBS-30
nanocomposite. In fact, in solid insulations, the breakdown strength is often reported to
increase with decreasing sample thickness. This film thickness effect has been attributed to
potential changes in several parameters including the probability of defects, charge trapping
and detrapping mechanism and material morphology (H. K. Kim & Shi, 2001; L. Zhao, Liu,
Su, Pan, & Zhang, 2011). Hence, the reduced thickness of tested SEBS-30 materials might
have resulted in more perfect packing and alignment of clay platelets and consequently
higher improvement of breakdown strength compared to the unfilled material, as observed.
SEBS-20-20A-partially oriented R1 nanocomposite exhibits the highest increase in dielectric
strength by 25% compared to its unfilled peer SEBS-20-R1 and 37% compared to
conventionally extruded matrix SEBS-20-oriented. This increase is attributed to synergetic
effects including the improved elastic moduli of the matrix induced by the alignment of some
cylinders in the thickness direction, the high state of order of the block copolymer compared
to isotropic and R3 samples and simultaneously the alignment of major fraction of clay
tactoids perpendicular to the electric field (Helal et al., 2017).

212
Figure 6-5: Breakdown strength of SEBS-20 based nanocomposites
Figure 6-6: Breakdown strength of SEBS-13 based nanocomposites
213
6.4.3 Summary
The comparison of the trends followed by the tensile strength and breakdown strength results
reveal an important correlation between these two properties in the case of unfilled SEBS-20
and SEBS-13 matrices. In fact, this correlation is a well-known behavior in soft elastomers
and thermoplastic elastomers in general, due to the high possibility of deformation of soft
materials under an applied electric field (Blythe & Bloor, 2005)
In the studied materials, since the mechanical strength of thermoplastic PS domains is greater
than that of the rubbery PEB domains, the control of their orientation induced different
mechanical behaviors of unfilled SEBS-20 and SEBS-13 matrices as function of their
morphologies. Subsequently, the dielectric breakdown strength followed the same trend of
the mechanical stiffness (both estimated in the same direction). In particular, when PS
cylinders are aligned parallel to the direction of the applied electric field, the lowest
mechanical strength and dielectric breakdown strength were simultaneously observed. In the
nanocomposites, in addition to its dependence on the mechanical stiffness, the breakdown
strength was mainly governed by the orientation of clay platelets compared to the applied
electric field. In particular, the alignment of clay perpendicular to the applied electric field is
the desired configuration. In this context, isotropic nanocomposites exhibited the lowest
improvement of breakdown strength, compared to their unfilled pairs, despite their high
mechanical stiffness. However, the partially oriented R1 nanocomposite exhibited the best
combination of mechanical and dielectric breakdown strengths due to adjusted alignment of
respectively clay platelets and PS cylinders. Other factors such as the state of order in the
block copolymer and the quality of the interfaces affected also the breakdown strength.
6.5 Conclusion
In this study, it was demonstrated that the mechanical strength and ultimately the breakdown
strength of SEBS/clay thermoplastic elastomer nanocomposites can be tuned through the
design of their morphologies, using different processing techniques. The investigated

214
nanocomposites featured different morphologies that were classified as oriented, partially
oriented or isotropic depending on the alignment of both clay platelets and PS cylinders. In
unfilled SEBS matrices, the mechanical stiffness and the breakdown strength were strongly
correlated and dependent on the orientation of PS nanodomains. But, in the nanocomposites,
this correlation is less strong. Instead, the spatial distribution of clay platelets was the main
factor governing the extent of the achieved improvement of breakdown strength compared to
the unfilled matrix.
Overall, this control of morphology and functional properties is expected to increase the
potential of these flexible nanocomposites in different dielectric applications including
electrical insulation and dielectric elastomer actuators.
Acknowledgements
The Natural Sciences and Engineering Research Council (NSERC) and Hydro-Québec from
Canada as well as Coordenação de Aperfeiçoamento de Pessoal de Nível Superior (CAPES),
Conselho Nacional de Desenvolvimento Científico e Tecnológico (CNPq) and Fundação de
Amparo à Pesquisa do Estado de São Paulo (FAPESP) from Brazil are gratefully recognized
for their financial support.
CHAPITRE 7
DISCUSSION
This thesis studied the design and processing of polymer nanocomposites with controlled
morphologies, intended to serve as HV insulating materials. The parameters involved within
the concept of controlled morphology are: state of dispersion (agglomerations vs. nanoscale
dispersion), orientation and selective localization of the nanoparticles. To achieve this
objective, this project was divided in three main parts as described in the introduction of this
thesis. The work performed in these parts involved the investigation of two types of
nanoparticles as well as a block copolymer and a blend of polyethylene with a block
copolymer as template matrices. In the following, some of the challenges encountered in
each part of the project are discussed. Besides, the achievement of the specific research
objectives related to each part is evaluated.
7.1 Nanocomposites with tailored morphologies
The performance of insulating polymers used as HV insulating materials is affected by
various physical properties including real and imaginary parts of dielectric permittivity,
breakdown strength, resistance to partial discharges, thermal conductivity and mechanical
strength. In polymer nanocomposites, it was observed that several engineering properties
might be optimized by tailoring the nanocomposites morphologies. In this context, the
analysis of the recent literature, discussed in chapter 1, has shown that specific approaches
based on the use of multiphase polymer systems were developed to achieve tuned
morphologies in nanocomposites. The multiphase materials, such as block copolymers and
polymer blends, were used as template matrices and were able to induce different
enhancements in the electrical, thermal and/or mechanical behavior depending on the
targeted field. In particular, these approaches started gaining attraction in nanodielectrics.
However, their application to the field of HV insulation is still limited.
CHAPTER 7
216
In this thesis, these approaches were extended to polymer nanocomposites intended for use as
HV insulating materials. Through chapter 2 to chapter 6, it was demonstrated that indeed
these approaches have potential to improve the functional properties related to HV insulation.
The first challenge encountered at the early steps of this project was the choice of the block
copolymer and the nanoparticles. In particular, SEBS was chosen due to its ordered
nanostructure as a block copolymer, interesting mechanical properties as a thermoplastic
elastomer and good resistance to water treeing. In terms of nanoparticles, clay platelets and
ZnO nanospheres were selected. Both of them exhibit different shapes and chemical natures
but have in common benefits in HV insulation and low costs.
The specific findings and challenges related to each part of the project are discussed in the
next three sections.
7.2 SEBS/Clay nanocomposites
SEBS/clay nanocomposites with different morphologies were investigated, with stress on the
effect of clay orientation, localization and degree of exfoliation on some key properties
related to HV insulation; namely: dielectric losses, dielectric breakdown strength and
mechanical strength. The control of localization and degree of exfoliation was ensured
through the use of MA graft attached to the PEB block. In fact, the interaction between MA
and hydroxyl groups at the edge of clay layers, which are already pre-intercalated due to the
organic surface treatment, improves the peeling mechanism and consequently the exfoliation
of clay into individual layers. Furthermore, this increased affinity favors the localization of
clay platelets in the elastomer PEB block.
In terms of orientation, the control was achieved by specific processing techniques. In this
context, oriented nanocomposites exhibiting alignment of both clay platelets and PS
nanodomains along the thickness of nanocomposites films were obtained by sheet die
extrusion process while isotropic nanocomposites were achieved by solvent casting process.
The alignment of clay platelets improved efficiently the resistance to dielectric failure and
217
reduced the dielectric losses compared to isotropic morphologies. However, the alignment of
PS domains reduced the mechanical stiffness of the matrix and subsequently its dielectric
breakdown strength. To overcome this undesirable effect, more complex configurations,
allowing taking advantage from clay alignment without sacrificing the dielectric and
mechanical strength of the matrix, were needed. In this context, the morphologies, untitled
“partially oriented” were prepared using a different processing technique: film blowing
extrusion. In this process, a tubular die is used instead of a sheet die and the nanocomposite
film is inflated with air at tunable blow-up ratios. As a result, radial forces are applied instead
of only lateral forces (applied in the main extrusion direction when a sheet-die extrusion
process is used). The applied blow-up ratio determines the ratio between the final and initial
diameters of the fabricated tube and ultimately affects the orientation of both clay platelets
and PS cylinders. In the as-obtained nanocomposite films, an important fraction of clay
platelets were aligned along the thickness (parallel to the main extrusion direction) while PS
domains were either isotropic in the plane perpendicular to the thickness or having a fraction
of them oriented across the thickness as well. For this reason, these morphologies were
referred to as “partially oriented”. They succeeded in maintaining the mechanical strength of
the matrix while improving the breakdown strength and limiting the dielectric losses, due to
alignment of clay platelets.
To validate the correlation between mechanical and dielectric strength for these soft
SEBS/clay nanocomposites exhibiting different morphologies, the mechanical properties
were evaluated. In breakdown measurements, the electric field was applied perpendicular to
the samples thickness. Therefore, evaluation of the mechanical stiffness across the thickness
would be favored for more accuracy. However, it was technically difficult to evaluate the
mechanical properties across the thickness by compression. Therefore, tensile mode was
adopted and the directions of the tests were selected carefully in order to simulate to the best
the morphology across the thickness, as described in chapter 6. The results confirmed the
correlation between mechanical and dielectric strengths. This was another challenge
encountered in this part of the project.

218
In order to better understand the role of the interface in such nanocomposites, an attempt was
made to establish a relationship between the studied morphologies and their corresponding
interfacial molecular dynamics. For this purpose, relaxation processes observed in broadband
dielectric spectra (BDS) and dynamic mechanical analysis (DMA) spectra were analyzed.
The studied systems were rather complex, with the two blocks of SEBS exhibiting distinct
segmental relaxations in addition to the potential interfacial relaxations. In particular, a
relaxation process attributed to rubber chains with restricted mobility located in the interface
region was identified. Furthermore, the spatial distribution of nanoparticles affected this
relaxation process. In a summary, it was found out that the isotropic morphologies, partially
oriented morphologies and morphologies with clay selectively located in the rubber block,
result in more restriction and stronger fragile behavior. It is worth noting that this relaxation
process was observed in BDS spectra of all the nanocomposites but only for selected
materials in DMA spectra. This behavior requires further investigation.
7.3 SEBS/ZnO nanocomposites
In the second part of this project, tailored dispersion of ZnO nanospheres in SEBS block
copolymer was investigated. In particular, nanoscale dispersion and interaction between these
isotropic nanoparticles with polymer chains were the tuned aspects. The control was again
enabled through the use of MA groups grafted to PEB elastomer block and exhibiting good
affinity with the nanoparticles surface. In fact, the organic treatment of the surface of ZnO
nanoparticles helped decreasing their hydrophilic character and consequently improving their
compatibility with the polymer matrix. Simultaneously, MA reacted with the remaining
hydroxyl groups that partially cover the surface of the nanoparticles, forming ester and
hydrogen bonds. The resulting complexes act as in-situ formed cross-linked structures that
improve the dispersion and affect drastically the rheological properties. In particular, the
storage modulus of SEBS/ZnO nanocomposites prepared with MA, was nearly constant at
low angular frequencies (a plateau was formed). This interesting behavior indicates the
formation of networks between the nanoparticles and polymer chains. It was observed at ZnO
concentrations starting from 5 wt%.

219
The formation of networks was correlated with improvements in thermal conductivity and
resistance to surface erosion at lower content of nanoparticles compared to SEBS/ZnO
nanocomposites prepared without the MA graft. Besides, at low frequencies, the dielectric
losses, rather dominated by electrical conduction phenomena in this range, were remarkably
increased with temperature. This intriguing behavior was not observed in SEBS/ZnO
nanocomposites prepared without MA. It is also believed to be related to the specific spatial
distribution of nanoparticles and the established networks which render the nanocomposites
slightly conductive. However, further investigations are required to confirm it. From a
practical point of view, the efficiency of these materials as HV insulations might be reduced
if elevated operational temperatures are required. However, at room temperature and
intermediate temperatures up to 70 °C, which are more common, the dielectric losses of
SEBS/ZnO prepared with MA are lower than those prepared without MA due to the
improved dispersion.
Lastly, it is worth noting that although networks between polymer chains and ZnO
nanoparticles were formed in the presence of MA, a total selective localization of the studied
ZnO nanoparticles in the PEB block was unfortunately not possible because their dimensions
were in the same range or slightly higher than the characteristic length scales of SEBS
nanodomains, which imposes thermodynamic constraints. Hence, the use of ZnO
nanoparticles of average diameter smaller than the dimensions of the PEB block could be
interesting, since it facilitates the achievement of preferential localization and may improve
further the observed property enhancements at even lower loadings of nanoparticles.
7.4 PE/SEBS/ZnO blend nanocomposites
The last part of this project aimed at producing materials with controlled morphology for
practical use in HV insulation. In this context, blends of SEBS/ZnO nanocomposites with
HDPE were investigated. The choice of ZnO-containing nanocomposites was justified by the
confirmed role of ZnO nanoparticles in reducing space charge accumulation, which is a
crucial property in HV cable insulations and especially HVDC cable insulations. The
selective localization of nanoparticles in either PE or SEBS was the main parameter to
220
control at this step. It was confirmed by microscopy and by estimation of the wetting
coefficient that ZnO nanoparticles were located in SEBS phase. This preferential localization
was enabled by the high affinity of ZnO nanoparticles to the MA groups attached to the PEB
block and by using short mixing time during melt compounding (to avoid migration of the
nanoparticles to PE).
The as-obtained PE/SEBS/ZnO blend nanocomposites exhibited lower dielectric losses as
well as improved resistance to surface erosion and mechanical flexibility compared to
conventional PE/ZnO nanocomposites. In this context, tensile measurements confirmed that
the elongation at break increased for PE/SEBS/ZnO nanocomposites due to the presence of
SEBS thermoplastic elastomer while PE/ZnO nanocomposites broke shortly after necking. It
is also worth mentioning that the measured values of elongation at break for both
PE/SEBS/ZnO and PE/ZnO nanocomposites might be extended further if the tensile test
speed is decreased.
Regarding the morphology of the blends, equal mass fractions of PE and SEBS were selected
initially to achieve a co-continuous morphology. In the unfilled PE/SEBS blend, the
achievement of a co-continuous morphology was confirmed by microscopy after solvent
extraction of SEBS. However, the incorporation of ZnO in SEBS, in the presence of MA,
induced an increase of viscosity and subsequently a switch of the blend morphology to
droplets morphology where elongated domains of SEBS/ZnO constitute the dispersed phase.
In the case of the studied blend nanocomposites, the co-continuous morphology is believed
important to achieve a thermal conductivity path for instance and to increase further the
efficiency of resistance to surface erosion. Moreover, it ensures the homogenous distribution
of the nanoparticles in the matrix while maintaining the option of selective localization of the
nanoparticles possible. Therefore, further investigation to optimize the morphology of
PE/SEBS/ZnO blend nanocomposites would be interesting.

CONCLUSION
In this section, a summary of the main findings of this project is provided. Partial conclusions
relative to each part of the project are presented in accordance with the order of their
presentation in the thesis. At the end of the section, the general conclusion is stated.
SEBS/clay nanocomposites
In the first part of this project, SEBS/clay nanocomposites with different concentrations of
clay particles up to 7.5 wt% and different fractions of PS block in SEBS respectively equal
to: 13%, 20% and 30%, were investigated. Various morphologies were obtained by different
processing techniques. In these morphologies, orientation and preferential localization of clay
platelets were the main aspects of dispersion control. It was found that:
• The control of orientation of clay platelets and PS nanodomains in SEBS block
copolymer was enabled by the use of different processing techniques and different
grades of SEBS block copolymer, one of them having an MA graft attached to its
rubber block. The used processing techniques were: solvent casting, sheet-die
extrusion and film blowing extrusion. They led to respectively: isotropic, totally
oriented and partially oriented morphologies, as discussed in chapter 3.
• In SEBS grade containing 30 wt% of PS block, 5 wt% clay platelets represented an
optimum concentration in terms of dispersion and exfoliated clay fraction. This result
was confirmed by TEM quantitative analysis. Moreover, this concentration coincided
with the maximum improvement of the breakdown strength.
• The orientation of clay platelets induced a significant decrease of the dielectric losses
especially at low frequencies and significant increase of the breakdown strength up to
45 % at 5 wt% clay. However, in the isotropic samples only a slight increase of the
breakdown strength was achieved and significantly higher dielectric losses were
exhibited.
• The orientation of PS nanodomains which occurs simultaneously with clay
orientation, when a sheet die extrusion process is used, led to a decrease of the
222
breakdown strength of the polymer matrix, due to reduction of the mechanical
strength. This reduction unfortunately counterbalances the increase observed from the
orientation of clay.
• The partially oriented morphologies investigated in the purpose of limiting this
negative effect, featured an optimized morphology were clay particles are mainly
oriented along the thickness while a fraction of PS domains are randomly distributed
along the thickness and another fraction oriented across the thickness. This
morphology obtained by film blowing extrusion allowed avoiding the negative effect
on breakdown strength and mechanical strength of the unfilled matrix encountered
when aligning PS nanodomains while maintaining the advantages on breakdown
strength and dielectric losses observed when clay platelets are aligned.
• When clay platelets are incorporated, rubber chains located at the interface exhibited
restricted mobility. This behavior was confirmed by Broadband Dielectric
Spectroscopy (BDS) and Dynamic Mechanical Analysis (DMA) measurements that
both show the appearance of a relaxation peak related to the dynamics of this
interfacial layer. The interfacial glass transition temperature was estimated to occur in
the range 6 to 35 °C while the Tg of the bulk elastomer block is around -30°C. The
thickness of the interfacial layer region was estimated, by fitting of DMA data, to be
in the range 7-10 nm.
• The molecular dynamics of these interfacial chains were found to depend on the
orientation of both PS nanodomains and clay nanoparticles, the fraction of PS block
as well as the location and degree of exfoliation of clay platelets, which was tuned
through the use of maleic anhydride graft. In particular, samples with lower degree of
alignment, higher degree of clay exfoliation and preferential localization in rubber
block, were found to exhibit higher interaction and higher interfacial glass transition
temperatures. This behavior was attributed to strong confinement of interfacial
chains in these configurations. At increasing fraction of PS block, the interfacial glass
transition temperature decreases and the effect of orientation was found to decrease.
The main conclusions of this part are: the orientation and localization of clay platelets in
SEBS block copolymer can be controlled by means of the processing technique and selection

223
of the appropriate grafts or functional groups that have high affinity to functional groups
attached to the surface of nanoparticles. This control of orientation and selective
localization allows the tuning of the dielectric losses, breakdown strength and mechanical
strength.
SEBS/ZnO nanocomposites
In the second part of this project, SEBS/ZnO nanocomposites were investigated. ZnO
nanoparticles have a spherical shape and were modified with alkyl ammonium salt. Due to
the isotropy of the nanoparticles, no emphasis was given to orientation. Instead, the spatial
distribution of the nanoparticles and their interaction with polymer chains were the key
parameters to tailor, in this part. This control was enabled through the use of MA grafted to
rubber block. It was found that:
• The dispersion of ZnO nanoparticles in SEBS was improved in the presence of MA
compared to the dispersion observed in SEBS without MA. This behavior is
attributed to good interaction between MA and the surface of the nanoparticles.
• In the presence of MA, nanocomposites exhibited a distinguished rheological
behavior characterized by a plateau of the storage modulus at low frequencies. This
behavior observed at low ZnO content starting from 5 wt% indicates the formation of
a network between ZnO nanoparticles and polymer chains, i.e. rheological
percolation.
• This rheological percolation was accompanied by an improvement of thermal
conductivity by 10% and excellent increase of resistance to surface erosion by partial
discharges: the eroded volume was reduced by 90% at 5 wt% ZnO. Furthermore, the
dielectric losses at low frequencies, which are dominated by electrical conduction
phenomena in this range, increased remarkably as function of temperature. This
behavior is also believed to be correlated with the established network.
• At power frequencies and operational temperatures, the dielectric losses of
nanocomposites with controlled dispersion were lower than the nanocomposites not
featuring controlled dispersion (prepared without MA). Besides, no noticeable

224
decrease of the dielectric breakdown strength compared to the unfilled matrix was
observed up to 20wt% ZnO loading.
• DC electrical conductivity measurements have shown that SEBS/ZnO
nanocomposites exhibit in general a non-linear feature attributed to the presence of
ZnO. In the nanocomposites with controlled dispersion, a higher control of this non-
linearity as function of the electric field and ZnO content was possible. In addition, at
5wt% ZnO and in the presence of MA, SEBS/ZnO nanocomposite exhibited electrical
conductivity values lower than those of unfilled SEBS. This interesting behavior
might be caused by the formation of trapping sites that block charge carriers from
propagating and accumulating in the bulk of the material.
The main conclusions of this part are: the establishment of a network between ZnO
nanoparticles and SEBS block copolymer chains was enabled by the presence of MA
groups attached to the elastomer block of SEBS. This morphology was accompanied by
improvements of thermal conductivity and resistance to surface erosion as well as reduced
dielectric losses at power frequencies and service temperatures. Besides, the breakdown
strength was maintained in the same range as the unfilled matrix.
PE/SEBS/ZnO blend nanocomposites
In the last part of this project, blends of SEBS-MA/ZnO nanocomposites with HDPE were
investigated. The choice of ZnO-containing nanocomposites was driven by the confirmed
role of metal oxide nanoparticles in reducing space charge accumulation in polymer
insulations. This property is a crucial requirement in the development of insulating materials
suitable for high voltage direct current (HVDC) cables. In this immiscible blend of PE and
SEBS, the selective localization of ZnO nanoparticles in either PE or SEBS was the main
aspect of dispersion control that was highlighted. In particular, it was found out that:
• Due to the affinity of ZnO nanoparticles surface to MA graft, nanoparticles remained
exclusively in SEBS phase and and potentially at the interfaces PE/SEBS but didn’t
migrate to PE. This behavior was predicted thermodynamically by the estimation of

225
the wetting coefficient and confirmed by high resolution scanning electron
microscopy.
• The blends contained equal mass fractions of PE and SEBS polymers. The unfilled
PE/SEBS blend featured a co-continuous morphology. However, in the presence of
ZnO nanoparticles, the blend switched to elongated droplets morphology where the
dispersed phase is composed of SEBS/ZnO domains. The morphology switch was
attributed to the increase of SEBS viscosity upon the incorporation of ZnO
nanoparticles in the presence of MA.
• PE/SEBS/ZnO blend nanocomposites featured improved nanoscale dispersion
compared to PE/ZnO nanocomposites prepared by melt compounding which
exhibited several agglomerations, especially at increasing ZnO content.
• At power frequencies and operational temperatures, the dielectric losses of
PE/SEBS/ZnO blend nanocomposites are lower than those related to PE/ZnO
reference nanocomposites. Besides, in both types of nanocomposites, an interfacial
relaxation process was observed. In the blend nanocomposites, the broadness and the
dielectric strength of the relaxation process were reduced compared to PE/ZnO
nanocomposites, thanks again to the improved dispersion.
• The selective dispersion of ZnO in SEBS droplets induced more efficient resistance to
surface erosion by partial discharges inside the droplets and ultimately in the whole
blend, compared to PE/ZnO nanocomposites. This effect was more obvious at low
concentrations of ZnO. In fact, elongated domains of SEBS/ZnO constitute an
equivalent of micrometric particles featuring at the same time excellent resistance to
surface erosion and good adhesion to PE matrix, due to the compatibility between the
PEB rubber block and PE. In PE/ZnO nanocomposites, although the presence of the
inorganic nanoparticles improved the resistance to surface erosion, the observed
submicrometric and micrometric agglomerations exhibit poor adhesion to PE and act
as week zones of high electrical stresses reducing the overall performance.
• The presence of the elastomer PEB block allowed PE/SEBS/ZnO nanocomposites to
exhibit improved elongation at break compared to neat PE and PE/ZnO
nanocomposites, and higher toughness when low ZnO loading (1wt%) was used.

226
The main conclusions of this part are: blending HDPE with SEBS thermoplastic elastomer
and selectively locating ZnO nanoparticles in SEBS phase led to improvements in dielectric
and mechanical performances, namely: lower dielectric losses at utility frequencies, higher
resistance to surface erosion by partial discharges and higher mechanical flexibility. As a
consequence of these improvements, PE/SEBS/ZnO blend nanocomposites have good
potential for HV insulation applications.
General conclusion
In this project, nanocomposites with tailored nanoparticles spatial distribution have been
studied as candidates for HV insulation. Within the concept of controlled dispersion, several
aspects have been tuned, namely: state of dispersion, interaction between the nanoparticles
and polymer chains, orientation and selective localization of the nanoparticles. The control
was achieved using template matrices, i.e. block copolymers and polymer blends, and
appropriate grafts to increase the affinity of nanoparticles to a specific block of the block
copolymer. It was demonstrated in several occasions that the control of one or more of the
abovementioned aspects is accompanied by an enhancement of one or more engineering
properties that affect the performance of HV insulating materials. These properties include:
dielectric breakdown strength, resistance to surface erosion by partial discharges, dielectric
losses, thermal conductivity and mechanical properties. In an attempt to correlate the
observed behaviors with nano and microstructure, the interfacial molecular dynamics were
investigated by means of broadband dielectric spectroscopy and dynamic mechanical
analysis. Interestingly, it was found out that the orientation and preferential localization of
nanoparticles affect indeed the mobility of chains and the thickness of the interfacial region.
To conclude, the findings of this work helped paving the way to a new generation of
nanodielectrics and HV insulating materials featuring controllable properties and gave few
insights to better understand the structure-property relationships behind.

RECOMMENDATIONS
In this project, it was demonstrated that well-defined nano/microstructures, achieved by
controlling the spatial distribution of nanoparticles in multi-phase polymer matrices, have
high potential for designing novel HV insulating materials with superior performance. To
improve, consolidate, extend and/or up-scale the findings of this work, many additional
studies might be worth investigation. In the following, few suggestions for future work are
presented.
• SEBS/Clay nanocomposites
As far as SEBS/clay nanocomposites are concerned, the observed effect of orientation and
preferential localization of clay platelets on the molecular dynamics of elastomer chains
located at nanoparticle/polymer interface might be further investigated by carrying out
modulated DSC measurements. In particular, the interfacial glass transition might be
evaluated and correlated with the results of dielectric spectroscopy and dynamic mechanical
analysis reported in chapter 3.
• SEBS/ZnO nanocomposites
The measurements of DC electrical conductivity carried out on SEBS/ZnO nanocomposites
containing MA graft demonstrated that at 5 wt% ZnO, the electrical conductivity of the
nanocomposite was even slightly lower than that of unfilled SEBS. This behavior indicates
the formation of traps that block the space charges at an early stage from propagating and
accumulating in the bulk and consequently reduce the overall conductivity. It is well in
agreement with recent findings from the literature reporting a reduction in space charge
accumulation and decrease of electrical conductivity of the insulating polymer matrix when
low loadings of metal oxide nanoparticles (< 5 wt%) are incorporated. Thus, extending the
study of the electrical conductivity of SEBS/ZnO nanocomposites to ZnO loadings below
5wt% is important to evaluate the possibility of reducing space charge accumulation in the
bulk of the material by increasing the number of trapping sites and blocking the mobility of

228
charges carriers at an early stage. In fact, the controlled dispersion achieved in these
nanocomposites have the potential to favor this behavior at concentrations of ZnO
nanoparticles even lower than those reported in the literature, generally up to 5 wt%. Besides,
achieving successful selective localization by using ZnO nanoparticles of average size lower
than characteristic dimensions of SEBS block, might improve further this desired behavior.
• Polyolefin/SEBS nanocomposite blends
In the last part of this project, blends of SEBS/ZnO nanocomposites with HDPE have been
studied to evaluate their potential as new HV insulating materials recyclable and suitable for
HVDC cables. Compared to conventional PE/ZnO nanocomposites, PE/SEBS/ZnO blend
nanocomposites have shown their promise. Improving further the potential of these blends
might be achieved by:
- Studying and determining the proportions of both PE and SEBS that lead to co-
continuity in PE/SEBS/ZnO blend nanocomposites, taking into account the increase
of viscosity of SEBS after the addition of ZnO nanoparticles. In fact, the co-
continuous morphology might improve further several properties such as thermal
conductivity and resistance to surface erosion, by enabling the formation of
particles networks all over the material.
- PP is an interesting candidate for HVDC cable insulation that gained much
attention recently. Application wise, the investigation of PP in blends with the
studied SEBS nanocomposites is certainly beneficial to extend the potential of these
materials in HV insulation and more specifically HVDC cables.
• Investigation of other nanoparticles
In the context of generalizing and up-scaling the approach of controlled dispersion for the
development of new HV insulating materials, other nanoparticles featuring interesting
properties might be considered. In particular, MgO as well as BN nanosheets and nanotubes
constitute excellent candidates that have shown recently great improvements mainly in
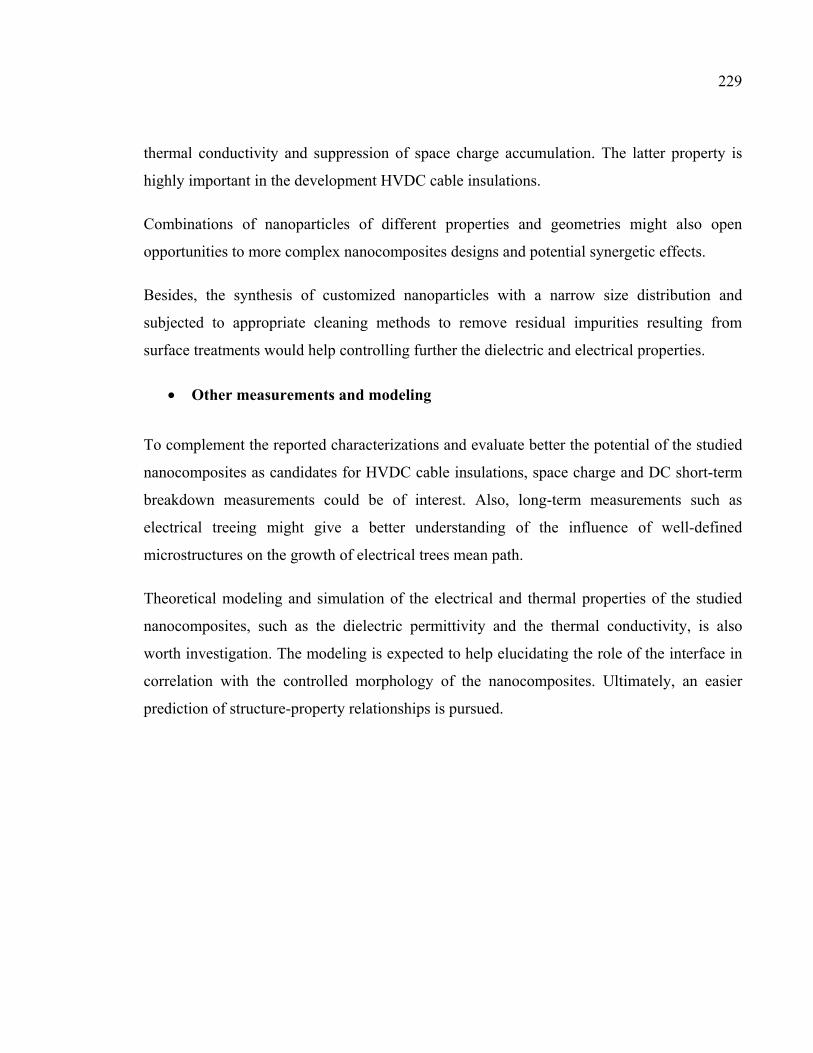
229
thermal conductivity and suppression of space charge accumulation. The latter property is
highly important in the development HVDC cable insulations.
Combinations of nanoparticles of different properties and geometries might also open
opportunities to more complex nanocomposites designs and potential synergetic effects.
Besides, the synthesis of customized nanoparticles with a narrow size distribution and
subjected to appropriate cleaning methods to remove residual impurities resulting from
surface treatments would help controlling further the dielectric and electrical properties.
• Other measurements and modeling
To complement the reported characterizations and evaluate better the potential of the studied
nanocomposites as candidates for HVDC cable insulations, space charge and DC short-term
breakdown measurements could be of interest. Also, long-term measurements such as
electrical treeing might give a better understanding of the influence of well-defined
microstructures on the growth of electrical trees mean path.
Theoretical modeling and simulation of the electrical and thermal properties of the studied
nanocomposites, such as the dielectric permittivity and the thermal conductivity, is also
worth investigation. The modeling is expected to help elucidating the role of the interface in
correlation with the controlled morphology of the nanocomposites. Ultimately, an easier
prediction of structure-property relationships is pursued.


ANNEX I
SUPPORTING ELECTRONIC INFORMATION FOR ARTICLE 1
Styrenic block copolymer-based nanocomposites: implications of nanostructuration
and nanofiller tailored dispersion on the dielectric properties
E. Helal a, N.R.Demarquette a*, L.G. Amurin a,1, E. David a a Department of Mechanical Engineering, Ecole de Technologie Supérieure, Montreal, QC, Canada 1Current affiliation: MackGraphe Research Center, Mackenzie Presbyterian University, São Paulo,
SP, Brazil.
D.J. Carastan b b Federal University of ABC, Santo André, SP, Brazil
M. Fréchette c c Institut de Recherche d’Hydro-Québec, Varennes, QC, Canada
* Corresponding author: Nicole R. Demarquette, Department of Mechanical Engineering,
École de Technologie Supérieure, 1100 rue Notre Dame, H3C 1K3 Montreal, Canada. E-
mail: [email protected]

232
1. Location of nanoclays
The location of nanoparticles in PS or PEB phase of SEBS depends on the presence of maleic
anhydride (MA) group. In fact, in the absence of MA, nanoclays have greater affinity to polar
PS phase which is most likely due to interaction between aromatic ring of PS and the polar
surface of clay layers (Carastan et al., 2014; Richard A. Vaia, Jandt, Kramer, & Giannelis,
1996). However, in the presence of MA which is grafted to PEB phase, nanoclays tend to
locate more in this phase since MA has greater affinity to nanoclays compared to PS due to
its high polarity. This hypothesis was confirmed for the case of extruded samples and
published in (Carastan et al., 2014). In this section, the case of isotropic samples prepared by
solution will be treated. In particular, an annealed sample containing 5wt% nanoclays will be
presented in Figure A I-1 and an unannealed sample containing 5wt% nanoclays will be
presented in Figure A I-2.
Figure A I-1: SEBS_5wt % nanoclays (Prepared by solution, annealed, stained for 30 minutes)

233
Figure A I-2: SEBS_MA_5wt % nanoclay (prepared by solution, unannealed, stained for 30 minutes): (a) lamellar structure, (b) localized cylindrical
structure where nanoclays are located
(a)
(b)

234
Figure A I-1 shows that:
- In annealed samples, PS phase exhibits an hexagonal cylindrical packing.
- Both nanoclays (indicated by arrows) and PS cylinders (black and dark grey circles)
are randomly dispersed and not aligned.
- The nanoclays are intercalated and located within PS cylinders.
Figure A I-2 shows that:
- In unannealed samples, both lamellar and hexagonal cylindrical structures co-exist.
- Lamellar morphology is dominant (figure A I-2(a)).
- Nanoclays are mostly located in the cylindrical morphology which may indicate that
they facilitate the transition from lamellar to cylindrical morphology even without
thermal treatment (figure A I-2(b)).
- Both nanoclays (indicated by arrows) and PS domains (black and dark grey) are
randomly dispersed and not aligned.
- The nanoclays are exfoliated and located in PEB phase (grey) between PS domains
(black or dark grey).
2. Quantitative analysis procedure
The quantitative analysis procedure adopted in this paper was published in references
(Carastan et al., 2014; Carastan et al., 2010; Vermogen et al., 2005). In this section, the basic
steps are summarized. For more details, the cited references could be consulted.
The steps are as follows:
- For each nanocomposite, 1 image at 20K, 4 images at 50 K and 10 images at 100K
magnifications are considered in order to have a good overview of clay tactoids size
at different scales. Examples of typical images used for the analysis are presented in
Figure A I-3.
- For a considered magnification, the thicknesses of a fixed number of tactoids (30 per
image) chosen randomly in each image were measured by imageJ software.
- The number of layers in each tactoid is determined using the following equation:

235
= ( + − )
Where:
N: number of layers;
ttactoid: thickness of the tactoid;
tlayer: estimated thickness of a single layer taken equal to 0.94 nm according to
(Vermogen et al., 2005);
d001: interlayer distance measured taken equal to 3.73 nm for SEBS-MA-2.5% and
3.47 nm for SEBS-MA-7.5% nanocomposite. These values were measured by X-ray
diffraction (XRD).
- Each tactoid is then classified in one of 6 classes ranging from individual layers to
large tactoids containing more than 50 layers depending on its estimated number of
layers. An example of this classification is provided in Table A I-1.
- The final proportions of each class were then calculated taking into account a
ponderation factor of the covered area corresponding to each magnification. For
example, an image taken at 100k has a coefficient of 1 while an image taken at 50k
has a coefficient of 4. These final results were used to plot Figure 2-3 in the
manuscript reported in Chapter 2.
Figure A I-3: Typical TEM images considered for quantitative analysis (related to SEBS_MA_2.5% extruded nanocomposite) taken at: (a) 20 K, (b) 50 K and (c) 100 K
(a) (b) (c)

236
Table A I-1: Proportions of tactoids in each class calculated from TEM images of SEBS_MA_2.5% extruded nanocomposite taken at 50 K
Class Number of layers per tactoid Number of tactoids per class 1 1 - 2 2 to 3 - 3 3 to 5 93 4 Small tactoids (5 to 15) 27 5 Middle size tactoids (15-50) - 6 Large tactoids (>50) -
Total number of analyzed tactoids in the 4 images
120
3. SAXS analysis
To evaluate the alignment of nanoclay and PS domains, we considered two types of
characterization:
- TEM: probes a small area but characterizes at the same time the state of exfoliation
and the location of nanoclays.
- SAXS: probes a larger area than TEM and characterizes both the alignment of PS
domain and nanoclay.
TEM images of extruded nanocomposites containing different loadings of nanoclay are
reported in Figure A I-4(a)-(d) of the manuscript. They show evidence of nanoclay alignment
except Figure 1(a) corresponding to the intercalated sample which is not as conclusive.
The SAXS analysis is reported in this annex as follows: Figure A I-4(a) presents the
diffraction pattern of pure extruded SEBS while Figure A I-4(b) shows the diffraction pattern
of extruded SEBS-7.5wt% clay nanocomposite and Figure A I-4(c) shows the diffraction
pattern of extruded SEBS-MA-7.5wt% clay nanocomposite. Figure A I-4(d) shows the
diffraction pattern of isotropic SEBS-5wt% clay nanocomposite prepared by solution for
comparison. Similar results were also obtained with different clay concentrations and
reported in (Carastan et al., 2014). It is worth mentioning that the incident X-Ray beam was
oriented perpendicular to the extrusion direction (parallel to Y direction indicated in Figure A
I-5).

237
Figure A I-4: Two dimensional SAXS patterns of (a) extruded pure SEBS, (b) extruded SEBS-7.5wt% clay nanocomposite, (c) extruded SEBS-MA-7.5wt%
clay nanocomposite and (d) SEBS-5wt% clay nanocomposite prepared by solution

238
Figure A I-5: X: direction of extrusion and Y: direction of the incident X-Ray beam
- The scattering patterns corresponding to the beam diffraction along the Y direction,
shown in Figure A I-5(a), reveal a set of Bragg peaks corresponding to long order
arrangement of PS cylinders in a two dimensional hexagonal packing and their
alignment in a direction perpendicular to the Y direction (which is the direction of
extrusion X as demonstrated in reference (Carastan et al., 2014)).
- In addition to the scattering from aligned PS domains, two strong diffuse spots
corresponding to Bragg peaks associated with scattering from clay particles are
observed in the SAXS patterns of extruded SEBS-7.5wt% and SEBS-MA-7.5wt%
clay nanocomposites presented in Figure A I-4(b) and Figure A I-4(c). These signals
indicate the alignment of nanoclay in the same direction of PS cylinders. The
presence of maxima in the Figure A I-4(b) is characteristic of intercalated nanoclay
while the absence of maxima in Figure A I-4(c) indicates scattering from exfoliated
nanoclay.
- The scattering patterns in Figure A I-4(d) which correspond to SEBS-5wt% clay
nanocomposite prepared by solution casting reveal concentric rings indicating that
both PS domains and nanoclays are randomly dispersed in samples prepared by
solution casting.
So far, these SAXS measurements clearly show the alignment of both PS domains and
nanoclay in our extruded samples despite the fact that the TEM image presented in Figure

239
2-1(a) of the manuscript could have been misleading since it shows some randomly dispersed
clay tactoids. In fact, one should keep in mind that TEM images only probe a small area
whereas SAXS present a more global analysis of the sample.


ANNEX II
SUPPORTING ELECTRONIC INFORMATION FOR ARTICLE 2
Interfacial molecular dynamics of styrenic block copolymer-based nanocomposites with
controlled spatial distribution
E. Helal1, L.G. Amurin2, D. J. Carastan3, R.R. de Sousa3, E. David1, M. Fréchette4 and N.R. Demarquette1*
1Mechanical Engineering Department, École de Technologie Supérieure, Montréal, QC, Canada 2MackGraphe Research Center, Mackenzie Presbyterian University, São Paulo, SP, Brazil
3Federal University of ABC, Santo André, SP, Brazil 4Institut de Recherche d’Hydro-Québec, Varennes, QC, Canada
* Corresponding author: Nicole R. Demarquette, Department of Mechanical Engineering,
École de Technologie Supérieure, 1100 rue Notre Dame Ouest, H3C 1K3 Montreal, Canada.
E-mail: [email protected]
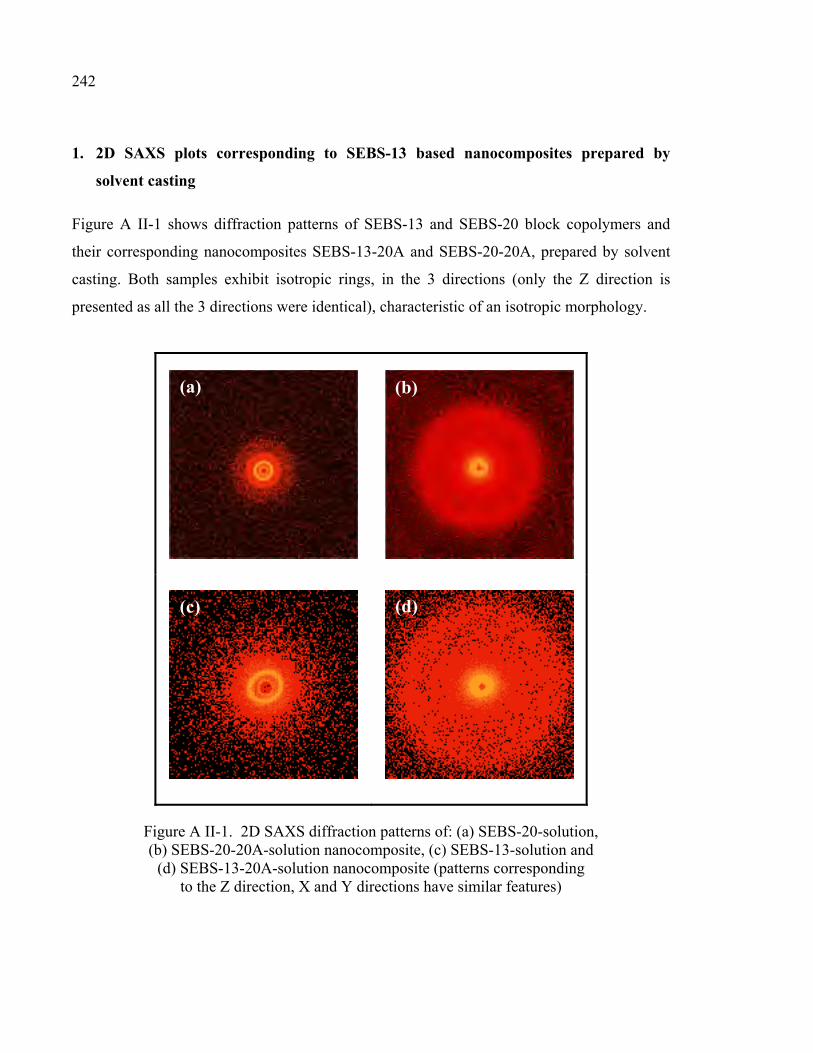
242
1. 2D SAXS plots corresponding to SEBS-13 based nanocomposites prepared by
solvent casting
Figure A II-1 shows diffraction patterns of SEBS-13 and SEBS-20 block copolymers and
their corresponding nanocomposites SEBS-13-20A and SEBS-20-20A, prepared by solvent
casting. Both samples exhibit isotropic rings, in the 3 directions (only the Z direction is
presented as all the 3 directions were identical), characteristic of an isotropic morphology.
Figure A II-1. 2D SAXS diffraction patterns of: (a) SEBS-20-solution, (b) SEBS-20-20A-solution nanocomposite, (c) SEBS-13-solution and
(d) SEBS-13-20A-solution nanocomposite (patterns corresponding to the Z direction, X and Y directions have similar features)
(a) (b)
(c) (d)

243
2. Scattering intensity as function of scattering vector q corresponding to SEBS-20-
film blowing R1 and SEBS-20- film blowing R3 and their nanocomposites, prepared
by film blowing extrusion
Figure A II-2. Scattering intensity as function of scattering vector q at different temperatures of: (a) SEBS-20- film blowing R1 and (b) SEBS-20-20A- film
blowing R1 nanocomposite
Figure A II-3. Scattering intensity as function of scattering vector q at different temperatures of: (a) SEBS-20-film blowing R3 and (b) SEBS-20-20A- film
blowing R3 nanocomposite
(a) (b)
(a) (b)

244
3. SAXS data corresponding to SEBS-13-extrusion and its nanocomposite SEBS-13-
20A-extrusion, prepared by sheet die extrusion
Figure A II-4. (a)-(b) 2D SAXS patterns of: (a) SEBS-13-extrusion (Z direction) and (b) SEBS-13-20A-extrusion nanocomposite, (c)-(d) Scattering intensity as
function of scattering vector q at different temperatures of: (c) SEBS-13-extrusion and (d) SEB-13-20A-extrusion nanocomposite. Peak positions follow the 1:√3 :√7
characteristic of hexagonal morphology
(c) (d)
(a) (b)

245
4. TEM micrographs of SEBS-30-20A-solution nanocomposite
TEM images of SEBS-30-20A-solution nanocomposite without and with staining are
reported in Figure A II-5 for the sake of comparison with samples exhibiting preferential
alignment in the direction of extrusion such as SEBS-20-20A-R1 (TEM images in Figure
3-3(c)-(e) of the manuscript). Comparison between the 2 figures shows that, indeed in Figure
A II-5, clay tactoids and PS cylinders are randomly distributed and isotropic within the
matrix (In Figure A II-5(d), clay particles are indicated by the arrows) whereas most of the
clay particles are oriented in one direction in Figure 3-3 of the manuscript.
Figure A II-5. TEM of SEBS-30-20A-isotropic, (a) and (b) unstained, (c) and (d) samples stained for 30 min with RuO4
(dark phase corresponds to PS domains)
(a) (b)
(c) (d)
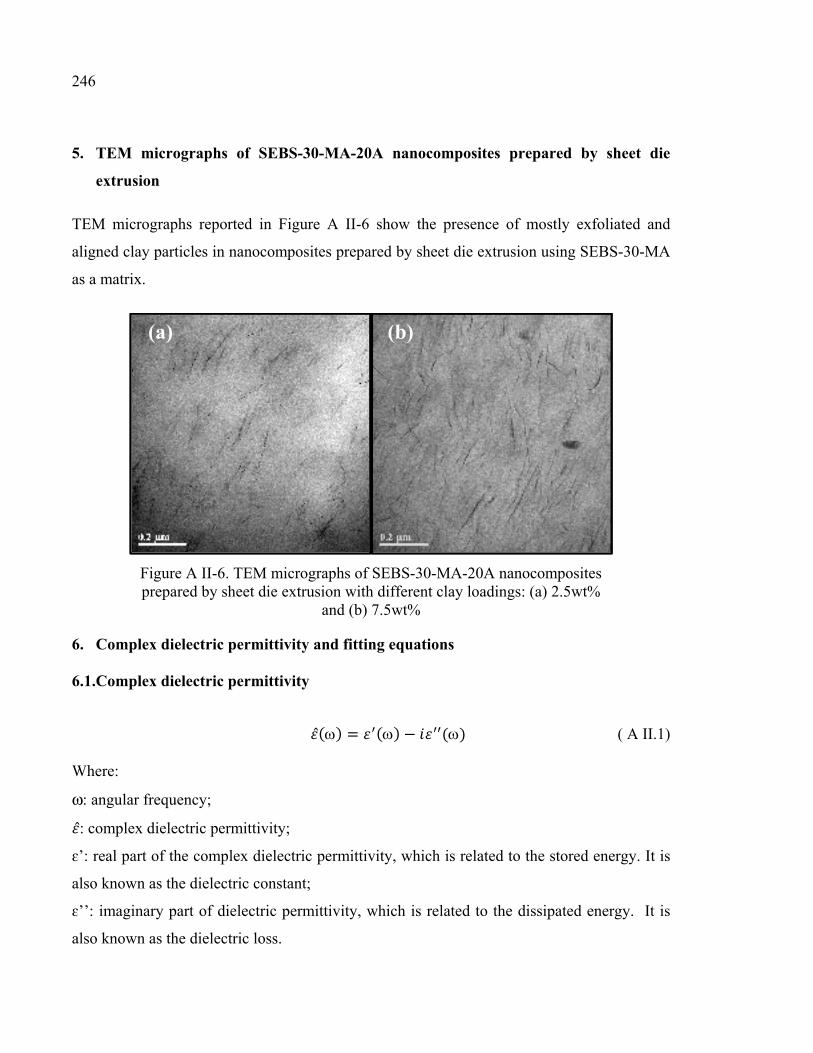
246
5. TEM micrographs of SEBS-30-MA-20A nanocomposites prepared by sheet die
extrusion
TEM micrographs reported in Figure A II-6 show the presence of mostly exfoliated and
aligned clay particles in nanocomposites prepared by sheet die extrusion using SEBS-30-MA
as a matrix.
Figure A II-6. TEM micrographs of SEBS-30-MA-20A nanocomposites prepared by sheet die extrusion with different clay loadings: (a) 2.5wt%
and (b) 7.5wt%
6. Complex dielectric permittivity and fitting equations
6.1.Complex dielectric permittivity
() = () − () ( A II.1)
Where:
ω: angular frequency; : complex dielectric permittivity;
ɛ’: real part of the complex dielectric permittivity, which is related to the stored energy. It is
also known as the dielectric constant;
ɛ’’: imaginary part of dielectric permittivity, which is related to the dissipated energy. It is
also known as the dielectric loss.
(a) (b)
247
6.2.Fitting equation
( ) = ( ) + ∑ ∆( ( ) ) + (A II.2)
Where:
ω: angular frequency;
n: exponential factor, between 0 and 1 characterizing the nature of the charge hopping
process (the case n=0 corresponds to pure electronic conduction with b=σ0/ɛ0);
τk: relaxation time related to relaxation process k;
Δεk: difference between real permittivity values at very low and infinite frequencies. It is
proportional to the area below the relaxation peak in ε” and known also as the dielectric
strength;
ε∞k: real permittivity at much higher frequencies than the relaxation frequency of the
relaxation process k;
αk: width parameter characteristic of the slope at the low frequency side of the relaxation
peak;
βk: asymmetry parameter. –αkβk gives the slope at the high frequency side of the relaxation
peak;
N: number of total observed relaxations in the studied range of frequencies and temperatures.
6.3.Fitting procedure
Commercially available software was used to obtain the curve-resolved spectra. Both real and
imaginary parts of the dielectric permittivity were considered for the fitting, computed based on
nonlinear procedures. The mean square deviation (MSD) was provided automatically by the software
at each fitting step, as criteria for the goodness of fit. It gives the mean value of quadratic deviations
between observed and calculated ɛ’’ values. The objective is to find a combination of fitting
parameters ensuring a minimum MSD value. For all the fits performed in this study, a fit is
considered stable and accepted if the MSD is relatively stable to 10-4 over 3 iterations. Besides, all the
MSD values were lower than 0.05.
Power law term Havriliak-Negami (HN) term

248
6.4.Relaxation time corresponding to the peak maximum frequency
= ∗ ( ( ))( ( )) (A II.3)
Where:
τmax: relaxation time corresponding to the peak maximum frequency;
τHN: relaxation time obtained from the HN fit (equation (A II.2));
α: width parameter obtained from the HN fit (equation (A II.2));
β: asymmetry parameter obtained from the HN fit (equation (A II.2)).
6.5.Vogel Fulcher Tammann (VFT) equation
( ) = exp( ) (A II.4)
Where:
B: constant related to the apparent activation energy and cooperativity of underlying
molecular motions;
τ0: relaxation time at infinite temperature;
T0: Vogel-Fulcher temperature, which is 30-70 K below the Tg in case of the main segmental
relaxation α.
6.6.Fragility index
= ( )( ) |( = ) (A II.5)
Where:
F: fragility index;
τ: the relaxation time expressed according to VFT equation (A II.4) (Considering the VFT
equation for the relaxation time, the derivative could be calculated for each sample);
Tg: glass transition temperature.

249
6.7.Imaginary part of complex dielectric permittivity corresponding to SEBS-13
nanocomposites prepared by extrusion and solvent casting
Figure A II-7 shows dielectric loss spectra corresponding to pure SEBS-13 and SEBS-13-
20A nanocomposites prepared by sheet die extrusion (clay oriented) and solvent casting
(isotropic). In particular, remarkably higher losses are observed in the isotropic sample.
Dielectric relaxation peaks could be observed in both samples and exhibit dependence on the
morphology and orientation as reported in the manuscript.
Figure A II-7. Imaginary part of the dielectric permittivity as function of temperature of: (a) neat SEBS-13-partially oriented and (b) SEBS-13-20A-partially oriented (sheet die
extrusion) and (c) SEBS-13-20A-isotropic (solvent casting)
(a) (b)
(c)

250
6.8.Real part of complex dielectric permittivity corresponding to SEBS-13
nanocomposites prepared by sheet die extrusion and solvent casting
Figure A II-8 shows typical behaviors of the real part of dielectric permittivity as functions of
frequency and temperature, of respectively neat SEBS, partially oriented nanocomposite and
isotropic nanocomposite. In general, a relaxation peak in the dielectric loss spectrum leads to
a step-like increase in the real part of permittivity since their frequency dependence is
mathematically linked through the Kramers-Kronig relations.
The real permittivity of the neat exhibits no dependence on frequency and decreases slightly
with increasing temperature due to the decrease of density. The real permittivity of the
partially oriented nanocomposite exhibits slight dependence on frequency and increases with
increasing temperatures especially at low frequencies, due to most likely Maxwell-Wagner-
Sillars (MWS) interfacial polarization. The real permittivity of the isotropic sample exhibits
stronger dependence on frequency and temperature. Step-like increases corresponding to
relaxation phenomena are more obvious in this sample compared to the partially oriented
sample.
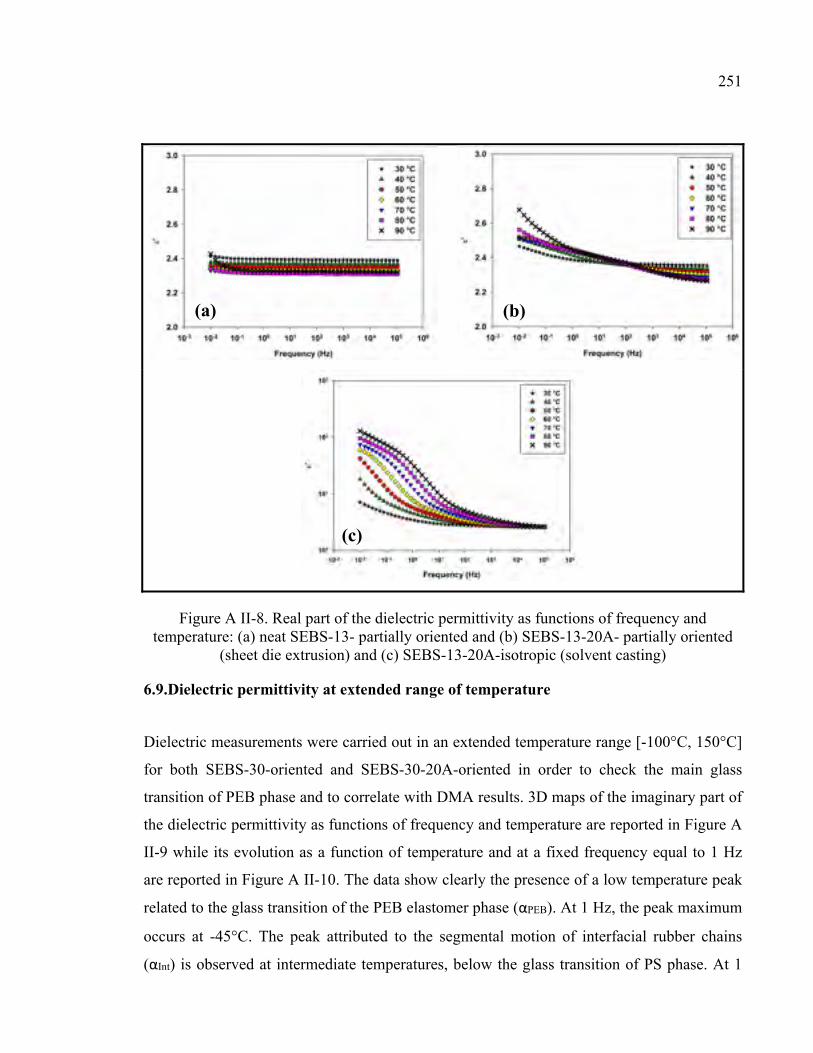
251
Figure A II-8. Real part of the dielectric permittivity as functions of frequency and temperature: (a) neat SEBS-13- partially oriented and (b) SEBS-13-20A- partially oriented
(sheet die extrusion) and (c) SEBS-13-20A-isotropic (solvent casting)
6.9.Dielectric permittivity at extended range of temperature
Dielectric measurements were carried out in an extended temperature range [-100°C, 150°C]
for both SEBS-30-oriented and SEBS-30-20A-oriented in order to check the main glass
transition of PEB phase and to correlate with DMA results. 3D maps of the imaginary part of
the dielectric permittivity as functions of frequency and temperature are reported in Figure A
II-9 while its evolution as a function of temperature and at a fixed frequency equal to 1 Hz
are reported in Figure A II-10. The data show clearly the presence of a low temperature peak
related to the glass transition of the PEB elastomer phase (αPEB). At 1 Hz, the peak maximum
occurs at -45°C. The peak attributed to the segmental motion of interfacial rubber chains
(αInt) is observed at intermediate temperatures, below the glass transition of PS phase. At 1
(a) (b)
(c)

252
Hz, this peak maximum is around 40°C. Besides, an additional peak is observed towards
higher temperatures (α`). This peak is more obvious at increased frequencies (Figure A II-10,
at 1 kHz). Since this peak is observed only in the spectrum of the nanocomposite, it is
believed to correspond to MWS interfacial polarization as discussed in the manuscript. At
low frequencies and high temperatures, a remarkable increase of dielectric loss is observed in
the spectra of both: the pure and the nanocomposite. This phenomenon is due to electrode
polarization (αEP) at the interface between the sample and the electrode.
It is worth noting that in this studied range of temperature, it was not possible to observe
clearly the peak related to the segmental relaxation of PS block. However, the low-
temperature wing of this peak might contribute to the observed spectra.
Figure A II-9. Dielectric spectroscopy maps as function of frequencies and temperatures of: (a) SEBS-30-oriented and (b) SEBS-30-20A-oriented
Segmental
relaxation of PEB
block (αPEB)
Segmental
relaxation of PEB
block (αPEB)
New relaxation
(αInt)
(a) (b)

253
Figure A II-10. Imaginary part of the dielectric permittivity of SEBS-30-oriented vs. SEBS-30-20A-oriented as
function of temperature at 1 Hz
7. Fitting of Dynamic Mechanical Analysis (DMA) results
7.1.Three parameter asymmetric double sigmoid (ADS) equation
(T) = A(1 + exp ) 1 − 1 + exp (A II.6)
Where:
Pi= peak I;
T: temperature;
A: height of the peak;
μ, σ1, σ2: three mathematical parameters. When σ1=σ2, the function is symmetric about μ.

254
7.2.Estimation of the interfacial thickness
The fraction of bound polymer chains participating in the interfacial glass transition, FBound,
could be determined by dividing the area under the interfacial Tgi peak by the sum of the
areas of all Tg peaks, as it could be seen in equation (A II.7). = /( + + ) (A II.7)
Where:
Ai: area under the peak i.
Subsequently, the total number of clay particles per nanocomposite volume unit, N, can be evaluated by equation (A II.8).
Where:
VClay total: fraction of clay particles in a volume unit of the composite which is equal to 0.0214
(5wt% clay is equivalent to 2.14vol% in SEBS-30 considering that the density of Cloisite
20A is equal to 1.77 g/cm3);
VClay particle: the volume of one clay particle that could be determined knowing the average
size of the tactoids.
Moreover, the fraction of polymer chains in a volume unit of the composite is given by
equation (A II.9).
Where:
VPolymer: volume of polymer chains per volume unit (only the volume of clay particles is
excluded).
The volume of chains with restricted mobility that participate in the interfacial glass Tgi is
obtained either by multiplying the bound fraction obtained by the volume of polymer chains
= 1 − = 1 − 0.0214 (A II.9)
N= / (A II.8)

255
in a volume unit or by multiplying the number of particles by the volume of the interfacial
layer surrounding each particle according to equation (A II.10).
Where:
Vbound: volume of bound polymer chains in a volume unit;
VClay particle+ t: volume of one clay particle and interfacial layer surrounding it;
t: thickness of interfacial layer.
Finally, the thickness of the interfacial layer, t, was deduced from equation (A II.10).
= ∗ = − ∗ (A II.10)

ANNEX III
SUPPORTING ELECTRONIC INFORMATION FOR ARTICLE 3
Thermoplastic elastomer nanocomposites with controlled nanoparticles dispersion for
HV insulation: correlation between rheological, thermal, electrical and dielectric
properties
E. Helal1, E. David1, M. Fréchette2 and N.R. Demarquette1*
1Mechanical Engineering Department, École de Technologie Supérieure, Montréal, QC, Canada 2Institut de Recherche d’Hydro-Québec, Varennes, QC, Canada
* Corresponding author: Nicole R. Demarquette, Department of Mechanical Engineering,
École de Technologie Supérieure, 1100 rue Notre Dame Ouest, H3C 1K3 Montreal, Canada.
E-mail: [email protected]

258
1. Particle size analysis and size distribution of ZnO nanoparticles into SEBS-MA-5
nanocomposite
A TEM image of low magnification was selected to investigate the size distribution of ZnO
nanoparticles/small agglomerations as dispersed in the nanocomposite. Initially, several
processing steps were performed with ImageJ software to isolate the particles. Then, the
particle size analysis was performed automatically as indicated in Figure A III-1. In
particular, 504 particles were considered for the analysis and the particle size was determined
based on Feret’s diameter (given directly by the software). Based on the analysis, ZnO
particles/agglomerations were classified in 12 classes of dimensions ranging from 0 to 220
nm as reported in Figure A III-2. This size distribution reveals that more than 60 % of ZnO
particles/agglomerations, as dispersed in SEBS-MA, have sizes between 20 and 60 nm. This
fact confirms the achievement of nanoscale dispersion.

259
Figure A III-1. Steps of particle size analysis: (a) TEM image considered for the analysis (related to SEBS-MA-5 nanocomposite,
(b) cropped image, (c) particle domains isolated, (d) analyzed domains
(a) (b)
(c) (d)

260
Figure A III-2. Size distribution of ZnO nanoparticles/agglomerations in SEBS-MA-5 nanocomposite based on particle size analysis
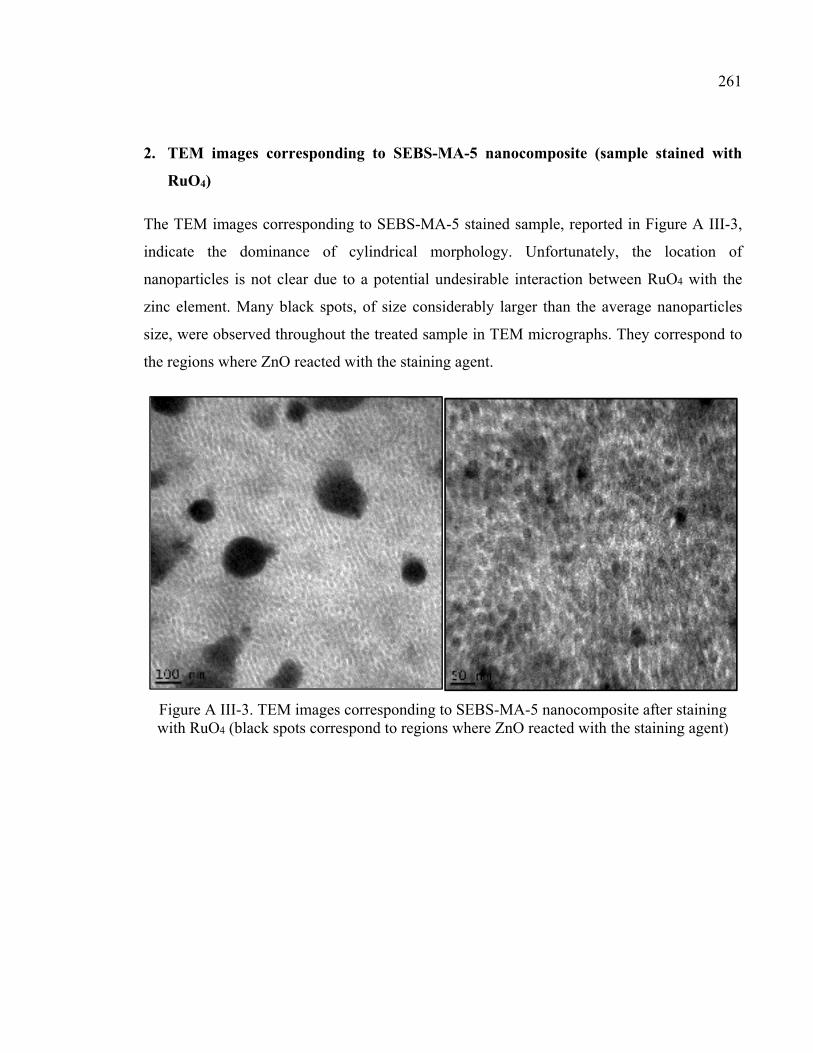
261
2. TEM images corresponding to SEBS-MA-5 nanocomposite (sample stained with
RuO4)
The TEM images corresponding to SEBS-MA-5 stained sample, reported in Figure A III-3,
indicate the dominance of cylindrical morphology. Unfortunately, the location of
nanoparticles is not clear due to a potential undesirable interaction between RuO4 with the
zinc element. Many black spots, of size considerably larger than the average nanoparticles
size, were observed throughout the treated sample in TEM micrographs. They correspond to
the regions where ZnO reacted with the staining agent.
Figure A III-3. TEM images corresponding to SEBS-MA-5 nanocomposite after staining with RuO4 (black spots correspond to regions where ZnO reacted with the staining agent)
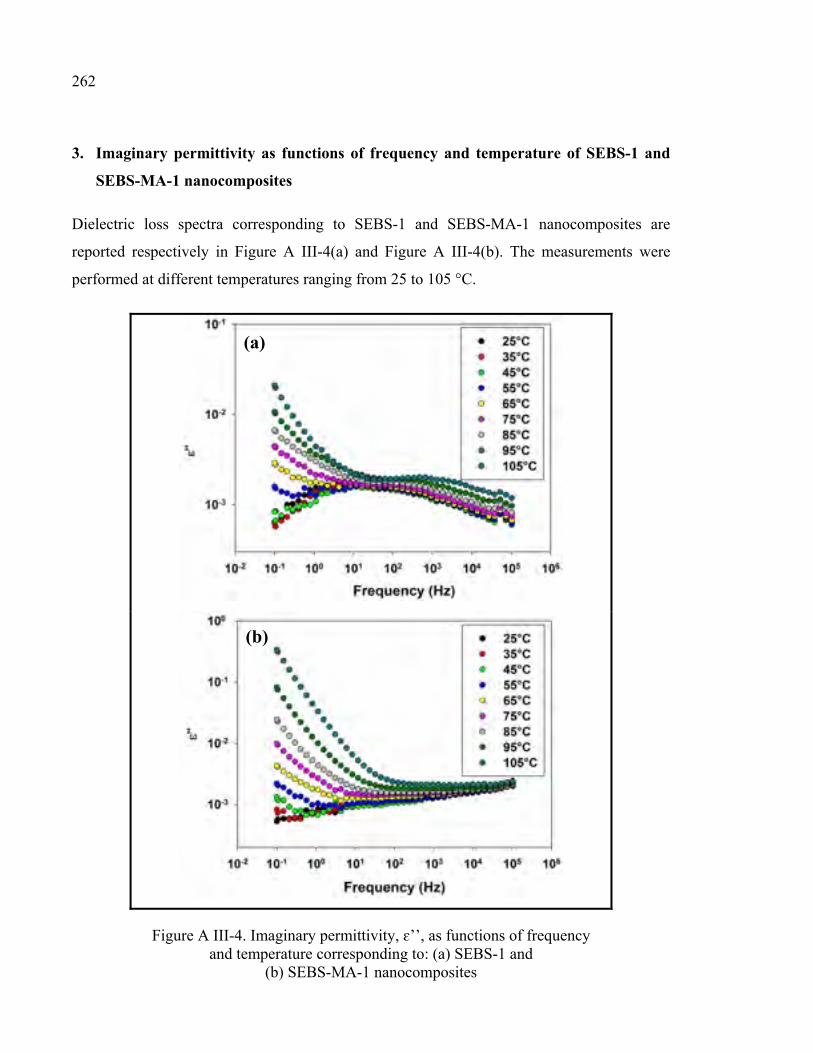
262
3. Imaginary permittivity as functions of frequency and temperature of SEBS-1 and
SEBS-MA-1 nanocomposites
Dielectric loss spectra corresponding to SEBS-1 and SEBS-MA-1 nanocomposites are
reported respectively in Figure A III-4(a) and Figure A III-4(b). The measurements were
performed at different temperatures ranging from 25 to 105 °C.
Figure A III-4. Imaginary permittivity, ɛ’’, as functions of frequency and temperature corresponding to: (a) SEBS-1 and
(b) SEBS-MA-1 nanocomposites
(a)
(b)

263
4. Effect of drying on dielectric response of SEBS-MA-5 nanocomposite
Dielectric loss spectra corresponding to SEBS-MA-5 nanocomposite before and after drying
are reported respectively in Figure A III-5(a) and Figure A III-5(b). The measurements were
performed at different temperatures ranging from 20 to 110 °C. Only a marginal effect could
be observed.
Figure A III-5. ɛ’’ of SEBS-MA-5 nanocomposite: (a) before drying and (b) after drying for 3 days at 65°C under vacuum
(a)
(b)

264
5. Effect of drying on the dielectric response of SEBS-MA-20 nanocomposite
Dielectric loss spectra corresponding to SEBS-MA-20 nanocomposite before and after drying
are reported respectively in Figure A III-6(a) and Figure A III-6(b). The measurements were
performed at different temperatures ranging from 20 to 110 °C. Only a small effect could be
observed at low temperatures (Figure A III-6(c)).
Figure A III-6. ɛ’’ of SEBS-MA-20 nanocomposite: (a) before drying, (b) after drying for 3 days at 65°C under vacuum and (c) comparison at selected temperatures
(a) (b)
(c)

265
6. Effect of drying on the dielectric response of SEBS-20 nanocomposite
Dielectric loss spectra corresponding to SEBS-20 nanocomposite before and after drying are
reported respectively in Figure A III-7(a) and Figure A III-7(b). The measurements were
performed at different temperatures ranging from 20 to 110 °C. Several changes were
obseved, mainly the increase of dielectric losses at low frequencies after drying (Figure A
III-7(c)).
Figure A III-7. ɛ’’ of SEBS-20 nanocomposite: (a) before drying, (b) after drying for 3 days at 65°C under vacuum and (c) comparison at selected temperatures
(a) (b)
(c)

266
7. Mapping of eroded area
Mappings of the eroded area corresponding to neat materials and nanocomposites containing
1wt% ZnO are reported in Figure A III-8. To evaluate the performance of SEBS-MA-ZnO
compared to SEBS-ZnO in terms of resistance to erosion, the erosion depth (estimated from
the mapping) might be considered as a quantitative parameter. For instance, the maximum
depth of erosion in neat SEBS is around 177 µm (Figure A III-8(a)) while it is reduced to 128
µm in SEBS-1 nanocomposite (Figure A III-8(c)). In unfilled SEBS-MA, the estimated
erosion depth is equal to 145 µm (Figure A III-8(b)). It was reduced to only 38 µm in SEBS-
MA-1 nanocomposite (Figure A III-8(d)).
Figure A III-8. Mapping of eroded area in different SEBS-ZnO vs. SEBS-MA-ZnO samples: (a) SEBS, (b) SEBS-MA, (c) SEBS-1 and (d) SEBS-MA-1
Distrib
ution
of erosion d
epth

APPENDIX
VITA
EDUCATION
• Doctor of Philosophy – École de Technologie Supérieure (ÉTS). Supervisor: Prof.
Nicole R. Demarquette, Co-supervisors: Prof. Eric David and Prof: Michel Fréchette.
From February 2013 to June 2017. Montréal, QC – Canada.
• Master of Science in Mechanical Engineering – École Polytechnique de Tunisie.
Supervisors: Prof. Moez Chafra and Prof. Zoubeida Ounaies. From September 2009
to December 2011. Tunis – Tunisie.
• Bachelor of Science in Engineering – École Polytechnique de Tunisie. From
September 2007 to September 2010. Tunis – Tunisie.
AWARDS AND SCHOLARSHIPS
• 2016: Sommet de Montréal sur l`innovation SMI 2016 - Poster selected for oral
presentation.
• 2016: American Society of Materials ASM - 1st poster prize.
• 2016: École de Technologie Supérieure - Bourse interne
• 2014&2015: École de Technologie Supérieure - Conference travel awards
• 2015: Society of Plastics Engineers SPE - Conference travel award
• 2010&2011: International Institute for Multifunctional Materials for Energy
Conversion IIMEC- scholarships for two six months internships in USA universities
within the context of collaboration between USA and Tunisian researchers.
• 2007-2010: Tunisian Ministry of Higher Education- monthly scholarship awarded to
engineering students admitted at Tunisia Polytechnic School.
JOURNAL PUBLICATIONS
• E. Helal, E. David, M. Fréchette and N.R. Demarquette, Thermoplastic elastomer
nanocomposites with controlled nanoparticles dispersion for HV insulation:
268
correlation between rheological, thermal, electrical and dielectric properties,
European Polymer Journal, Volume 94, September 2017, pp. 68-86.
• E. Helal, L.G. Amurin, D.J. Carastan, R.R. de Sousa Jr., E. David, M. Fréchette and
N.R. Demarquette, Interfacial molecular dynamics of styrenic block copolymer-based
nanocomposites with controlled spatial distribution, Polymer, Volume 113, 24 March
2017, Pages 9–26.
• E. Helal, N.R. Demarquette, L.G. Amurin, E. David, D.J. Carastan and M. Fréchette,
Styrenic block copolymer-based nanocomposites: Implications of nanostructuration
and nanofiller tailored dispersion on the dielectric properties, Polymer, Volume 64,
May 2015, pp. 139–152.
• E. Helal, C. Pottier, E. David, M. Fréchette and N.R. Demarquette,
Polyethylene/Thermoplastic elastomer/Zinc Oxide nanocomposites for High Voltage
insulation applications: dielectric, mechanical and rheological behavior, submitted to
Polymer on March 2017 (under review).
• E. Helal, L.G. Amurin, D.J. Carastan, R.R. de Sousa Jr., E. David, M. Fréchette and
N.R. Demarquette, Tuning the mechanical and dielectric properties of clay-containing
thermoplastic elastomer nanocomposites, submitted to Polymer Engineering and
Science on May 2017 (under review).
• E. Helal, Z. Ounaies and A.B. Meddeb, Processing and characterisation of two- and
three-phase polymer-based nanocomposites for energy storage applications,
International Journal of Microstructure and Materials Properties,Volume7, 2012,
pp.417 – 427.
CONFERENCE PRESENTATIONS
• E. Helal, C. Pottier, C.V. Bouanga, E. David, M. Fréchette and N.R. Demarquette,
Effect of blending with styrenic thermoplastic elastomer on dielectric performance of
polyethylene/ZnO and maleated polyethylene/ZnO nanocomposites, Abstract
submitted for Nano 2016, August 7-12th, 2016, Quebec, Canada
• E. Helal, N. R. Demarquette, E. David and M. Fréchette, Evaluation of dielectric
behavior of polyethylene/thermoplastic elastomer blends containing zinc oxide (ZnO)

269
nanoparticles for high voltage insulation, IEEE Electrical Insulation Conference
(EIC), pp. 592-595, June 19-22nd, 2016.
• E. Helal, N.R. Demarquette, E. David and M. Fréchette, Dielectric properties of
thermoplastic elastomer/zinc oxide (ZnO) nanocomposites with controlled
nanoparticles dispersion, Conference on Electrical Insulation and Dielectric
Phenomena (CEIDP), October 18th-21st, 2015, Ann Arbor MI, USA, pp.447-450.
• E. Helal, N.R. Demarquette, E. David and M. Fréchette, Polystyrene-b-Poly
(Ethylene-co-Butylene)-b-Polystyrene/Zinc Oxide Block Copolymer
Nanocomposites: Rheological and Dielectric Properties, Annual Technical
Conference of the Society of Plastics Engineers (ANTEC), March 23-25th, 2015,
Orlando FL, USA.
• E. Helal, N.R. Demarquette, E. David and M. Fréchette, Polyethylene/styrenic block
copolymer blends: Morphology and dielectric properties, Conference on Electrical
Insulation and Dielectric Phenomena (CEIDP), October 19th-22nd, Des Moines IA,
USA, 2014, pp. 767-770.
• E. Helal, N.R. Demarquette, E. David, D.J. Carastan, L.G. Amurin and M.F.
Fréchette, Effect of Clay-Containing SEBS Nanocomposites Morphology on Their
Thermal, Mechanical, Rheological and Dielectric Properties, Annual Technical
Conference of the Society of Plastics Engineers (ANTEC), April 28-30th, 2014, Las
Vegas NV, USA.


271
LIST OF BIBLIOGRAPHICAL REFERENCES
Adhikari, R., Michler, G. H., Huy, T. A., Ivan'kova, E., Godehardt, R., Lebek, W., & Knoll, K. (2003). Correlation between molecular architecture, morphology, and deformation behaviour of styrene/butadiene block copolymers. Macromolecular Chemistry and Physics, 204(3), 488-499.
Agari, Y., Ueda, A., & Nagai, S. (1993). Thermal conductivities of blends of
polyethylene/SEBS block copolymer and polystyrene/SEBS block copolymer. Journal of applied polymer science, 47(2), 331-337.
Amurin, L. G., Carastan, D. J., & Demarquette, N. R. (2012). Effect of clay concentration on
the rheological properties of triblock copolymers nanocomposites. Dans 70th Annual Technical Conference of the Society of Plastics Engineers 2012, ANTEC 2012, April 2, 2012 - April 4, 2012 (Vol. 1, pp. 29-32). Society of Plastics Engineers.
Amurin, L. G., Carastan, D. J., & Demarquette, N. R. (2016). Morphological evolution of
block copolymer nanocomposites submitted to extensional flows. Journal of Rheology, 60(1), 175-189.
Anadão, P. (2012). Polymer/clay nanocomposites: concepts, researches, applications and
trends for the future. Nanocomposites—new trends and developments. InTech, Croatia, 514.
Andritsch, T. (2010). Epoxy Based Nanodielectrics for High Voltage DC Applications:
Synthesis, Dielectric Properties and Space Charge Dynamics. printed by Ridderprint grafisch bedrijf, Ridderkerk.
Andritsch, T., Kochetov, R., Gebrekiros, Y. T., Morshuis, P. H., & Smit, J. J. (2010). Short
term DC breakdown strength in epoxy based BN nano-and microcomposites. Dans Solid Dielectrics (ICSD), 2010 10th IEEE International Conference on (pp. 1-4). IEEE.
Angell, C. (1991). Relaxation in liquids, polymers and plastic crystals—strong/fragile
patterns and problems. Journal of Non-Crystalline Solids, 131, 13-31. Arevalillo, A., Muñoz, M. E., Santamaría, A., Fraga, L., & Barrio, J. A. (2008). Novel
rheological features of molten SEBS copolymers: Mechanical relaxation at low frequencies and flow split. European Polymer Journal, 44(10), 3213-3221.
Arora, R., & Mosch, W. (2011). High voltage and electrical insulation engineering (Vol.
69). John Wiley & Sons.

272
Arrighi, V., McEwen, I., Qian, H., & Prieto, M. S. (2003). The glass transition and interfacial layer in styrene-butadiene rubber containing silica nanofiller. Polymer, 44(20), 6259-6266.
As’habi, L., Jafari, S., Khonakdar, H., Boldt, R., Wagenknecht, U., & Heinrich, G. (2013).
Tuning the processability, morphology and biodegradability of clay incorporated PLA/LLDPE blends via selective localization of nanoclay induced by melt mixing sequence. Express Polym Lett, 7(1), 21-39.
Astrom, U., & Lescale, V. (2006). Converter stations for 800 kV HVDC. Dans Power System
Technology, 2006. PowerCon 2006. International Conference on (pp. 1-7). IEEE. Balazs, A. C., Emrick, T., & Russell, T. P. (2006). Nanoparticle polymer composites: where
two small worlds meet. Science, 314(5802), 1107-1110. Balsamo, V., Lorenzo, A. T., Müller, A. J., Corona‐Galván, S., Fraga Trillo, L. M., & Santa
Quiteria, V. R. (2006). Structure, properties and applications of ABA and ABC triblock copolymers with hydrogenated polybutadiene blocks. Block Copolymers in Nanoscience, 367-389.
Barra, G. M., Crespo, J. S., Bertolino, J. R., Soldi, V., & Pires, A. T. N. (1999). Maleic
anhydride grafting on EPDM: qualitative and quantitative determination. Journal of the Brazilian Chemical Society, 10(1), 31-34.
Bartczak, Z., Argon, A. S., Cohen, R. E., & Weinberg, M. (1999). Toughness mechanism in
semi-crystalline polymer blends: I. High-density polyethylene toughened with rubbers. Polymer, 40(9), 2331-2346. doi: http://doi.org/10.1016/S0032-3861(98)00445-5. Repéré à http://www.sciencedirect.com/science/article/pii/S0032386198004455
Bhattacharyya, A., Chen, S., & Zhu, M. (2014). Graphene reinforced ultra high molecular
weight polyethylene with improved tensile strength and creep resistance properties. eXPRESS Polymer Letters, 8(2), 74-84.
Blythe, A. R., & Bloor, D. (2005). Electrical properties of polymers. Cambridge University
Press. Bockstaller, M. R., Lapetnikov, Y., Margel, S., & Thomas, E. L. (2003). Size-selective
organization of enthalpic compatibilized nanocrystals in ternary block copolymer/particle mixtures. Journal of the American Chemical Society, 125(18), 5276-5277.
Bockstaller, M. R., Mickiewicz, R. A., & Thomas, E. L. (2005). Block copolymer
nanocomposites: perspectives for tailored functional materials. Advanced Materials, 17(11), 1331-1349.

273
Bohmer, R., Angell, C., Richert, R., & Blumen, A. (1994). Disorder effects of relaxation
processes. Berlin: Springer. Böhmer, R., Ngai, K., Angell, C., & Plazek, D. (1993). Nonexponential relaxations in strong
and fragile glass formers. The Journal of chemical physics, 99(5), 4201-4209. Böhning, M., Goering, H., Fritz, A., Brzezinka, K.-W., Turky, G., Schönhals, A., & Schartel,
B. (2005). Dielectric study of molecular mobility in poly (propylene-graft-maleic anhydride)/clay nanocomposites. Macromolecules, 38(7), 2764-2774.
Bousmina, M., Ait-Kadi, A., & Faisant, J. (1999). Determination of shear rate and viscosity
from batch mixer data. Journal of Rheology, 43(2), 415-433. Brockschmidt, M., Pohlmann, F., Kempen, S., & Gröppel, P. (2011). Testing of nano-
insulation materials: Some ideas, some experiences. Dans Electrical Insulation Conference (EIC), 2011 (pp. 506-510). IEEE.
Cai, D., & Song, M. (2015). Ultra‐high enhancement in the toughness of polyethylene by
exfoliated natural clay nanosheets. Journal of applied polymer science, 132(1). Camargo, P. H. C., Satyanarayana, K. G., & Wypych, F. (2009). Nanocomposites: synthesis,
structure, properties and new application opportunities. Materials Research, 12, 1-39. Repéré à http://www.scielo.br/scielo.php?script=sci_arttext&pid=S1516-14392009000100002&nrm=iso
Cano, L., Gutierrez, J., & Tercjak, A. (2013). Rutile TiO2 nanoparticles dispersed in a self-
assembled polystyrene-block-polymethyl methacrylate diblock copolymer template. The Journal of Physical Chemistry C, 117(2), 1151-1156.
Carastan, D. J., Amurin, L. G., Craievich, A. F., do Carmo Gonçalves, M., & Demarquette,
N. R. (2013). Morphological evolution of oriented clay-containing block copolymer nanocomposites under elongational flow. European Polymer Journal, 49(6), 1391-1405.
Carastan, D. J., Amurin, L. G., Craievich, A. F., Gonçalves, M. d. C., & Demarquette, N. R.
(2014). Clay‐containing block copolymer nanocomposites with aligned morphology prepared by extrusion. Polymer International, 63(2), 184-194.
Carastan, D. J., & Demarquette, N. R. (2007). Polystyrene/clay nanocomposites.
International Materials Reviews, 52(6), 345-380. doi: 10.1179/174328007X212517. Repéré à http://dx.doi.org/10.1179/174328007X212517
274
Carastan, D. J., Demarquette, N. R., Vermogen, A., & Masenelli-Varlot, K. (2008). Linear viscoelasticity of styrenic block copolymers–clay nanocomposites. Rheologica Acta, 47(5-6), 521.
Carastan, D. J., Vermogen, A., Masenelli‐Varlot, K., & Demarquette, N. R. (2010).
Quantification of clay dispersion in nanocomposites of styrenic polymers. Polymer Engineering & Science, 50(2), 257-267.
Characteristic IR Absorption Frequencies of Organic Functional Groups. Repéré à
http://www2.ups.edu/faculty/hanson/Spectroscopy/IR/IRfrequencies.html ( Access date: February 07, 2017)
Chen, G., Liu, S., Chen, S., & Qi, Z. (2001). FTIR spectra, thermal properties, and
dispersibility of a polystyrene/montmorillonite nanocomposite. Macromolecular Chemistry and Physics, 202(7), 1189-1193.
Chen, H., Hassan, M. K., Peddini, S. K., & Mauritz, K. A. (2011). Macromolecular dynamics
of sulfonated poly (styrene-b-ethylene-ran-butylene-b-styrene) block copolymers by broadband dielectric spectroscopy. European Polymer Journal, 47(10), 1936-1948.
Chen, L., Zheng, K., Tian, X., Hu, K., Wang, R., Liu, C., . . . Cui, P. (2009). Double glass
transitions and interfacial immobilized layer in in-situ-synthesized poly (vinyl alcohol)/silica nanocomposites. Macromolecules, 43(2), 1076-1082.
Chen, S., Huang, R., Peng, Z., Wang, X., & Cheng, X. (2010). The effect of nano-ZnO on
withstanding corona aging in low-density polyethylene. Dans Solid Dielectrics (ICSD), 2010 10th IEEE International Conference on (pp. 1-4). IEEE.
Cheng, Y., Guo, N., Wang, R., & Zhang, X. (2013). Investigation on breakdown properties
of low-density polyethylene/nano-ZnO composites. Dans Electrical Insulation and Dielectric Phenomena (CEIDP), 2013 IEEE Conference on (pp. 830-833). IEEE.
Chipara, M., Artiaga, R., Lau, K., Chipara, D., & Hui, D. (2017). Dynamical mechanical
analysis of multiwall carbon nanotubes-styrene-isoprene-styrene block copolymer nanocomposite. Composites Communications, 3, 23-27.
Chiu, J. J., Kim, B. J., Kramer, E. J., & Pine, D. J. (2005). Control of nanoparticle location in
block copolymers. Journal of the American Chemical Society, 127(14), 5036-5037. Choi, H., Lee, J.-P., Ko, S.-J., Jung, J.-W., Park, H., Yoo, S., . . . Kim, J. Y. (2013).
Multipositional silica-coated silver nanoparticles for high-performance polymer solar cells. Nano letters, 13(5), 2204-2208.

275
Choi, S., Lee, K. M., & Han, C. D. (2004). Effects of triblock copolymer architecture and the degree of functionalization on the organoclay dispersion and rheology of nanocomposites. Macromolecules, 37(20), 7649-7662.
Choudalakis, G., & Gotsis, A. (2009). Permeability of polymer/clay nanocomposites: a
review. European Polymer Journal, 45(4), 967-984. Ciuprina, F., Plesa, I., Notingher, P. V., Zaharescu, T., Rain, P., & Panaitescu, D. (2010).
Dielectric properties of LDPE-SiO 2 nanocomposites. Dans Solid Dielectrics (ICSD), 2010 10th IEEE International Conference on (pp. 1-4). IEEE.
Couderc, H., David, E., Frechette, M., & Medjdoub, A. (2013). Influence of water on PE—
SiO 2 nanocomposites dielectric properties. Dans Electrical Insulation and Dielectric Phenomena (CEIDP), 2013 IEEE Conference on (pp. 737-741). IEEE.
Cowie, J., Arrighi, V., Cameron, J., McEwan, I., & McEwen, I. (2001). Lyotropic liquid
crystalline cellulose derivatives in blends and molecular composites. Polymer, 42(24), 9657-9663.
Cui, W., Du, F., Zhao, J., Zhang, W., Yang, Y., Xie, X., & Mai, Y.-W. (2011). Improving
thermal conductivity while retaining high electrical resistivity of epoxy composites by incorporating silica-coated multi-walled carbon nanotubes. Carbon, 49(2), 495-500.
Cui, Z., Cao, Z., Ma, R., Dobrynin, A. V., & Adamson, D. H. (2015). Boron Nitride Surface
Activity as Route to Composite Dielectric Films. ACS applied materials & interfaces, 7(31), 16913-16916.
Dai, G., & Mishnaevsky Jr, L. (2013). Damage evolution in nanoclay-reinforced polymers: A
three-dimensional computational study. Composites Science and Technology, 74, 67-77. doi: http://doi.org/10.1016/j.compscitech.2012.10.003. Repéré à http://www.sciencedirect.com/science/article/pii/S0266353812003570
Dang, Z. M., Yuan, J. K., Yao, S. H., & Liao, R. J. (2013). Flexible nanodielectric materials
with high permittivity for power energy storage. Advanced Materials, 25(44), 6334-6365.
Daniel, C., Hamley, I. W., & Mortensen, K. (2000). Effect of planar extension on the
structure and mechanical properties of polystyrene–poly(ethylene-co-butylene)–polystyrene triblock copolymers. Polymer, 41(26), 9239-9247. doi: http://doi.org/10.1016/S0032-3861(00)00308-6. Repéré à http://www.sciencedirect.com/science/article/pii/S0032386100003086
Danikas, M. G., & Tanaka, T. (2009). Nanocomposites-a review of electrical treeing and
breakdown. IEEE Electrical Insulation Magazine, 25(4), 19-25.
276
Darie, R. N., Pâslaru, E., Sdrobis, A., Pricope, G. M., Hitruc, G. E., Poiată, A., . . . Vasile, C. (2014). Effect of nanoclay hydrophilicity on the poly (lactic acid)/clay nanocomposites properties. Industrial & Engineering Chemistry Research, 53(19), 7877-7890.
David, E., & Fréchette, M. (2013). Polymer nanocomposites-major conclusions and
achievements reached so far. IEEE Electrical Insulation Magazine, 29(6), 29-36. David, E., Fréchette, M., Zazoum, B., Daran-Daneau, C., Ngô, A. D., & Couderc, H. (2013).
Dielectric properties of PE/clay nanocomposites. Journal of Nanomaterials, 2013, 65. David, E., Zazoum, B., Fréchette, M., & Rogti, F. (2015). Dielectric response of HDPE/clay
nanocomposites containing 10% wt of organo-modified clay. Dans Electrical Insulation and Dielectric Phenomena (CEIDP), 2015 IEEE Conference on (pp. 531-534). IEEE.
De Sousa Jr, R., Amurin, L., Demarquette, N. R., & Carastan, D. (2014). Block copolymer
nanocomposites with mono-and bioriented structures. Dealy, J. M., & Wang, J. (2013). Melt rheology and its applications in the plastics industry.
Springer Science & Business Media. Demarquette, N. R., Da Silva, F. T., Brandi, S. D., & Gouvêa, D. (2000). Surface tension of
polyethylene used in thermal coating. Polymer Engineering & Science, 40(7), 1663-1671.
Dirix, Y., Bastiaansen, C., Caseri, W., & Smith, P. (1999). Preparation, structure and
properties of uniaxially oriented polyethylene-silver nanocomposites. Journal of materials science, 34(16), 3859-3866.
Dissado, L. A., & Fothergill, J. C. (1992). Electrical degradation and breakdown in polymers
(Vol. 9). IET. Dong, W., Han, Z., & Han, B. (2012). Boron nitride filled immiscible blends of polyethylene
and ethylene-vinyl acetate copolymer: Morphology and dielectric properties. Dans Properties and Applications of Dielectric Materials (ICPADM), 2012 IEEE 10th International Conference on the (pp. 1-4). IEEE.
Du, B., Xu, H., Li, J., & Li, Z. (2016). Space charge behaviors of PP/POE/ZnO
nanocomposites for HVDC cables. IEEE Transactions on Dielectrics and Electrical Insulation, 23(5), 3165-3174.
Fabiani, D., Mancinelli, P., Vanga-Bouanga, C., Fréchette, M. F., & Castellon, J. (2016).
Effect of graphene-oxide content on space charge characteristics of PE-based

277
nanocomposites. Dans IEEE Electrical Insulation Conference (EIC), 2016 (pp. 631-634). IEEE.
Fabiani, D., Montanari, G. C., & Testa, L. (2010). Effect of aspect ratio and water
contamination on the electric properties of nanostructured insulating materials. IEEE Transactions on Dielectrics and Electrical Insulation, 17(1).
Fang, L., Leng, Y., & Gao, P. (2006). Processing and mechanical properties of
HA/UHMWPE nanocomposites. Biomaterials, 27(20), 3701-3707. doi: http://doi.org/10.1016/j.biomaterials.2006.02.023. Repéré à http://www.sciencedirect.com/science/article/pii/S0142961206001670
Fillery, S. P., Koerner, H., Drummy, L., Dunkerley, E., Durstock, M. F., Schmidt, D. F., &
Vaia, R. A. (2012). Nanolaminates: increasing dielectric breakdown strength of composites. ACS applied materials & interfaces, 4(3), 1388-1396.
Fleming, R., Ammala, A., Casey, P., & Lang, S. (2008). Conductivity and space charge in
LDPE containing nano-and micro-sized ZnO particles. IEEE Transactions on Dielectrics and Electrical Insulation, 15(1).
Fréchette, M. (2009). Innovation in dielectric materials: from macro to nanoscales. Dans
Electrical Insulation Conference, 2009. EIC 2009. IEEE (pp. 514-523). IEEE. Fréchette, M., Larocque, R., Trudeau, M., Veillette, R., Rioux, R., Pelissou, S., . . . That, M.-
T. T. (2008). Nanostructured polymer microcomposites: A distinct class of insulating materials. IEEE Transactions on Dielectrics and Electrical Insulation, 15(1).
Fréchette, M., Preda, I., Castellon, J., Krivda, A., Veillette, R., Trudeau, M., & David, E.
(2014). Polymer composites with a large nanofiller content: a case study involving epoxy. IEEE Transactions on Dielectrics and Electrical Insulation, 21(2), 434-443.
Frechette, M., Savoie, S., Reading, M., Vaughan, A., Couderc, H., Castellon, J., & Banet, L.
(2012). Surface resistance of epoxy-based composites to electrical discharge. Dans Electrical Insulation (ISEI), Conference Record of the 2012 IEEE International Symposium on (pp. 632-636). IEEE.
Fréchette, M., Vanga-Bouanga, C., Fabiani, D., Castellon, J., & Diaham, S. (2015).
Graphene-based polymer composites: What about it for the HV electrotechnical arena? Dans Electrical Insulation Conference (EIC), 2015 IEEE (pp. 483-487). IEEE.
Fréchette, M. F., Trudeau, M., Alamdari, H. D., & Boily, S. (2001). Introductory remarks on
nanodielectrics. Dans 2001 Annual Report Conference on Electrical Insulation and Dielectric Phenomena (Cat. No.01CH37225) (pp. 92-99). doi: 10.1109/CEIDP.2001.963496

278
Frechette, M. F., Trudeau, M. L., Alamdar, H., & Boily, S. (2004). Introductory remarks on nanodielectrics. IEEE Transactions on Dielectrics and Electrical Insulation, 11(5), 808-818.
Fréchette, M. F., Trudeau, M. L., Alamdar, H., & Boily, S. (2004). Introductory remarks on
nanodielectrics. IEEE Transactions on Dielectrics and Electrical Insulation, 11(5), 808-818.
Fréchette, M. F., Vijh, A., Trudeau, M. L., Utracki, L., Sami, A., David, É., . . . Kochetov, R.
(2010). Nanodielectrics: A “universal” panacea for solving all electrical insulation problems? Dans Solid Dielectrics (ICSD), 2010 10th IEEE International Conference on (pp. 1-3). IEEE.
Fröhlich, H. (1949). Theory of dielectrics. Fu, M., Chen, G., Dissado, L. A., & Fothergill, J. C. (2007). Influence of thermal treatment
and residues on space charge accumulation in XLPE for DC power cable application. IEEE Transactions on Dielectrics and Electrical Insulation, 14(1).
Galgali, G., Agarwal, S., & Lele, A. (2004). Effect of clay orientation on the tensile modulus
of polypropylene–nanoclay composites. Polymer, 45(17), 6059-6069. Ganguly, A., & Bhowmick, A. K. (2008). Sulfonated styrene-(ethylene-co-butylene)-
styrene/montmorillonite clay nanocomposites: synthesis, morphology, and properties. Nanoscale Research Letters, 3(1), 36.
Ganguly, A., Bhowmick, A. K., & Li, Y. (2008). Insights into montmorillonite nanoclay
based ex situ nanocomposites from SEBS and modified SEBS by small-angle X-ray scattering and modulated DSC studies. Macromolecules, 41(16), 6246-6253.
Gao, C., Zhang, S., Wang, F., Wen, B., Han, C., Ding, Y., & Yang, M. (2014). Graphene
networks with low percolation threshold in ABS nanocomposites: selective localization and electrical and rheological properties. ACS applied materials & interfaces, 6(15), 12252-12260.
Gao, Y., Liu, J., Zhang, L., & Cao, D. (2014). Existence of a Glassy Layer in the Polymer‐
Nanosheet Interface: Evidence from Molecular Dynamics. Macromolecular Theory and Simulations, 23(1), 36-48.
Gaska, K., Xu, X., Gubanski, S., & Kádár, R. (2017). Electrical, Mechanical, and Thermal
Properties of LDPE Graphene Nanoplatelets Composites Produced by Means of Melt Extrusion Process. Polymers, 9(1), 11.
Ghanbari, A., Rahimi, M., & Dehghany, J. (2013). Influence of Surface Grafted Polymers on
the Polymer Dynamics in a Silica–Polystyrene Nanocomposite: A Coarse-Grained

279
Molecular Dynamics Investigation. The Journal of Physical Chemistry C, 117(47), 25069-25076.
Ghorbani, H., Jeroense, M., Olsson, C.-O., & Saltzer, M. (2014). HVDC cable systems—
highlighting extruded technology. IEEE Transactions on Power Delivery, 29(1), 414-421.
Ghosh, S., Calizo, I., Teweldebrhan, D., Pokatilov, E. P., Nika, D. L., Balandin, A. A., . . .
Lau, C. N. (2008). Extremely high thermal conductivity of graphene: Prospects for thermal management applications in nanoelectronic circuits. Applied Physics Letters, 92(15), 151911.
Glaskova, Т., & Aniskevich, A. (2009). Moisture absorption by epoxy/montmorillonite
nanocomposite. Composites Science and Technology, 69(15), 2711-2715. Goh, P. S., Ismail, A. F., & Ng, B. C. (2014). Directional alignment of carbon nanotubes in
polymer matrices: contemporary approaches and future advances. Composites Part A: Applied Science and Manufacturing, 56, 103-126.
Golberg, D., Bando, Y., Huang, Y., Terao, T., Mitome, M., Tang, C., & Zhi, C. (2010).
Boron nitride nanotubes and nanosheets. ACS nano, 4(6), 2979-2993. Graebling, D., Muller, R., & Palierne, J. (1993). Linear viscoelastic behavior of some
incompatible polymer blends in the melt. Interpretation of data with a model of emulsion of viscoelastic liquids. Macromolecules, 26, 320-320.
Guo, M., Fréchette, M., David, É., & Demarquette, N. R. (2016). Influence of fabrication
techniques on the dielectric properties of PE/POSS polymeric composites. Dans IEEE Electrical Insulation Conference (EIC), 2016 (pp. 297-300). IEEE.
Guo, Z., Lee, D., Liu, Y., Sun, F., Sliwinski, A., Gao, H., . . . Luo, T. (2014). Tuning the
thermal conductivity of solar cell polymers through side chain engineering. Physical Chemistry Chemical Physics, 16(17), 7764-7771.
Gupta, D., Wang, L., Hanssen, L. M., Hsia, J. J., & Datla, R. U. (1995). Polystyrene films for
calibrating the wavelength scale of infrared spectrophotometers-SRM 1921. US Government Printing Office Washington DC.
Hadjichristidis, N., Hirao, A., Tezuka, Y., & Du Prez, F. (2011). Complex macromolecular
architectures: synthesis, characterization, and self-assembly. John Wiley & Sons. Hamley, I. W. (2001). Structure and flow behaviour of block copolymers. Journal of
Physics: Condensed Matter, 13(33), R643.

280
Hamzah, M. S., Jaafar, M., Jamil, M., & Kamarol, M. (2014). Electrical insulation characteristics of alumina, titania, and organoclay nanoparticles filled PP/EPDM nanocomposites. Journal of applied polymer science, 131(23).
Han, S. J., & Sengupta, S. (2014). Evaluation of rheological and electrical breakdown
behaviors of multi-phase polyolefin blends. Dans Electrical Insulation Conference (EIC), 2014 (pp. 152-156). IEEE.
Hao, N., Böhning, M., Goering, H., & Schönhals, A. (2007). Nanocomposites of polyhedral
oligomeric phenethylsilsesquioxanes and poly (bisphenol A carbonate) as investigated by dielectric spectroscopy. Macromolecules, 40(8), 2955-2964.
Hao, N., Böhning, M., & Schönhals, A. (2007). Dielectric properties of nanocomposites
based on polystyrene and polyhedral oligomeric phenethyl-silsesquioxanes. Macromolecules, 40(26), 9672-9679.
Havriliak, S., & Negami, S. (1967). A complex plane representation of dielectric and
mechanical relaxation processes in some polymers. Polymer, 8, 161-210. Hayase, Y., Aoyama, H., Matsui, K., Tanaka, Y., Takada, T., & Murata, Y. (2006). Space
charge formation in LDPE/MgO nano-composite film under ultra-high DC electric stress. IEEJ Transactions on Fundamentals and Materials, 126(11), 1084-1089.
Heid, T. (2015). Innovative nanostructured epoxy composites for enhanced high voltage
insulation systems (École de technologie supérieure). Heid, T., David, E., & Fréchette, M. (2016). Modeling the thermal conductivity of
epoxy/POSS and Epoxy/POSS/cBN composites. Dans Dielectrics (ICD), 2016 IEEE International Conference on (Vol. 1, pp. 414-417). IEEE.
Heid, T., Fréchette, M., & David, E. (2015). Nanostructured epoxy/POSS composites:
enhanced materials for high voltage insulation applications. IEEE Transactions on Dielectrics and Electrical Insulation, 22(3), 1594-1604.
Heid, T., Fréchette, M., & David, E. (2016). Enhanced electrical and thermal performances
of nanostructured epoxy/POSS composites. IEEE Transactions on Dielectrics and Electrical Insulation, 23(3), 1732-1742.
Helal, E., Amurin, L. G., Carastan, D. J., de Sousa Jr, R. R., David, E., Fréchette, M., &
Demarquette, N. R. (2017). Interfacial molecular dynamics of styrenic block copolymer-based nanocomposites with controlled spatial distribution. Polymer, 113, 9-26. doi: http://doi.org/10.1016/j.polymer.2017.02.025. Repéré à http://www.sciencedirect.com/science/article/pii/S0032386117301489

281
Helal, E., David, E., Fréchette, M., & Demarquette, N. R. (under review). Thermoplastic elastomer nanocomposites with controlled nanoparticles dispersion for HV insulation: correlation between rheological, thermal, electrical and dielectric properties. European Polymer Journal.
Helal, E., Demarquette, N. R., Amurin, L., David, E., Carastan, D., & Fréchette, M. (2015).
Styrenic block copolymer-based nanocomposites: Implications of nanostructuration and nanofiller tailored dispersion on the dielectric properties. Polymer, 64, 139-152.
Helal, E., Demarquette, N. R., David, E., & Fréchette, M. (2015). Dielectric properties of
thermoplastic elastomer/zinc oxide (ZnO) nanocomposites with controlled nanoparticles dispersion. Dans Electrical Insulation and Dielectric Phenomena (CEIDP), 2015 IEEE Conference on (pp. 447-450). IEEE.
Helal, E., Demarquette, N. R., David, E., & Fréchette, M. (2016). Evaluation of dielectric
behavior of polyethylene/thermoplastic elastomer blends containing zinc oxide (ZnO) nanoparticles for high voltage insulation. Dans IEEE Electrical Insulation Conference (EIC), 2016 (pp. 592-592). IEEE.
Helal, E., Demarquette, N. R., David, E., & Fréchette, M. F. (2014). Polyethylene/styrenic
block copolymer blends: Morphology and dielectric properties. Dans Electrical Insulation and Dielectric Phenomena (CEIDP), 2014 IEEE Conference on (pp. 767-770). IEEE.
Helfand, E. (1975). Block copolymer theory. III. Statistical mechanics of the microdomain
structure. Macromolecules, 8(4), 552-556. Hernández, M., Carretero-González, J., Verdejo, R., Ezquerra, T. A., & López-Manchado,
M. A. (2010). Molecular Dynamics of Natural Rubber/Layered Silicate Nanocomposites As Studied by Dielectric Relaxation Spectroscopy. Macromolecules, 43(2), 643-651. doi: 10.1021/ma902379t. Repéré à http://dx.doi.org/10.1021/ma902379t
Hernández, M., del Mar Bernal, M., Verdejo, R., Ezquerra, T. A., & López-Manchado, M. A.
(2012). Overall performance of natural rubber/graphene nanocomposites. Composites Science and Technology, 73, 40-46.
Holden, G., Kricheldorf, H. R., & Quirk, R. P. (2004). Thermoplastic elastomers (Vol. 133).
Hanser Munich. Holt, A. P., Griffin, P. J., Bocharova, V., Agapov, A. L., Imel, A. E., Dadmun, M. D., . . .
Sokolov, A. P. (2014). Dynamics at the polymer/nanoparticle interface in poly (2-vinylpyridine)/silica nanocomposites. Macromolecules, 47(5), 1837-1843.

282
Hong, J., Schadler, L., Siegel, R., & Mårtensson, E. (2003). Rescaled electrical properties of ZnO/low density polyethylene nanocomposites. Applied Physics Letters, 82(12), 1956-1958.
Hong, J., Schadler, L., Siegel, R., & Mårtensson, E. (2006). Electrical behavior of low
density polyethylene containing an inhomogeneous distribution of ZnO nanoparticles. Journal of materials science, 41(18), 5810-5814.
Hosier, I., Praeger, M., Vaughan, A., & Swingler, S. (2015). Electrical properties of polymer
nano-composites based on oxide and nitride fillers. Dans Electrical Insulation Conference (EIC), 2015 IEEE (pp. 438-441). IEEE.
Hosier, I., Vaughan, A., & Swingler, S. (1997). Structure–property relationships in
polyethylene blends: the effect of morphology on electrical breakdown strength. Journal of materials science, 32(17), 4523-4531.
Hosier, I., Vaughan, A., & Tseng, W. (2007). Effect of polyethylene on morphology and
dielectric breakdown in EVA blends. Dans Solid Dielectrics, 2007. ICSD'07. IEEE International Conference on (pp. 184-187). IEEE.
Hosier, I. L., Vaughan, A. S., & Swingler, S. G. (2010). An investigation of the potential of
ethylene vinyl acetate/polyethylene blends for use in recyclable high voltage cable insulation systems. Journal of materials science, 45(10), 2747-2759.
Huang, X., Iizuka, T., Jiang, P., Ohki, Y., & Tanaka, T. (2012). Role of interface on the
thermal conductivity of highly filled dielectric epoxy/AlN composites. The Journal of Physical Chemistry C, 116(25), 13629-13639.
Huang, X., Jiang, P., & Tanaka, T. (2011). A review of dielectric polymer composites with
high thermal conductivity. IEEE Electrical Insulation Magazine, 27(4). Huang, X., Li, Y., Liu, F., Jiang, P., Iizuka, T., Tatsumi, K., & Tanaka, T. (2014). Electrical
properties of epoxy/POSS composites with homogeneous nanostructure. IEEE Transactions on Dielectrics and Electrical Insulation, 21(4), 1516-1528.
Huang, X., Zhi, C., Jiang, P., Golberg, D., Bando, Y., & Tanaka, T. (2013). Polyhedral
oligosilsesquioxane‐modified boron nitride nanotube based epoxy nanocomposites: an ideal dielectric material with high thermal conductivity. Advanced Functional Materials, 23(14), 1824-1831.
Hur, J., & Bae, J. (2015). Solvent induced conversion of microdomain structure in block
copolymer electrolyte thin films. Journal of Industrial and Engineering Chemistry, 21, 851-855.

283
Ieda, M. (1984). Electrical conduction and carrier traps in polymeric materials. IEEE transactions on electrical insulation, (3), 162-178.
IEEE Guide for the Statistical Analysis of Electrical Insulation Breakdown Data. (2005).
IEEE Std 930-2004 (Revision of IEEE Std 930-1987), 0_1-41. doi: 10.1109/IEEESTD.2005.96286
Iwasa, K., Ueda, N., Shibayama, K., & Fukatani, J. (2002). Polyolefin resin composite,
thermoplastic resin composite, and process for producing thermoplastic resin composite: Google Patents.
Iyer, G., Gorur, R., & Krivda, A. (2012). Corona resistance of epoxy nanocomposites:
experimental results and modeling. IEEE Transactions on Dielectrics and Electrical Insulation, 19(1).
Jeong, U., Lee, H. H., Yang, H., Kim, J. K., Okamoto, S., Aida, S., & Sakurai, S. (2003).
Kinetics and Mechanism of Morphological Transition from Lamella to Cylinder Microdomain in Polystyrene-b lock-poly (ethylene-co-but-1-ene)-b lock-polystyrene Triblock Copolymer. Macromolecules, 36(5), 1685-1693.
Jonscher, A. K. (1983). Dielectric Relaxation in Solids. Chelsea Dielectrics Press Limited.
Repéré à https://books.google.ca/books?id=Eq0eAQAAIAAJ Jonscher, A. K. (1996). Universal relaxation law: a sequel to Dielectric relaxation in solids.
Chelsea Dielectrics Press. Ju, S., Zhang, H., Chen, M., Zhang, C., Chen, X., & Zhang, Z. (2014). Improved electrical
insulating properties of LDPE based nanocomposite: Effect of surface modification of magnesia nanoparticles. Composites Part A: Applied Science and Manufacturing, 66, 183-192.
Kao, J., Thorkelsson, K., Bai, P., Rancatore, B. J., & Xu, T. (2013). Toward functional
nanocomposites: taking the best of nanoparticles, polymers, and small molecules. Chemical Society Reviews, 42(7), 2654-2678.
Kim, B., Park, Y. D., Min, K., Lee, J. H., Hwang, S. S., Hong, S. M., . . . Koo, C. M. (2011).
Electric actuation of nanostructured thermoplastic elastomer gels with ultralarge electrostriction coefficients. Advanced Functional Materials, 21(17), 3242-3249.
Kim, H. K., & Shi, F. G. (2001). Thickness dependent dielectric strength of a low-
permittivity dielectric film. IEEE Transactions on Dielectrics and Electrical Insulation, 8(2), 248-252. doi: 10.1109/94.919946
Kim, Y. J., Ha, S.-T., Lee, G. J., Nam, J. H., Ryu, I. H., Nam, S. H., . . . Han, C. J. (2013).
Investigation of Space Charge Distribution of Low-Density Polyethylene/GO-GNF
284
(Graphene Oxide from Graphite Nanofiber) Nanocomposite for HVDC Application. Journal of Nanoscience and Nanotechnology, 13(5), 3464-3469. doi: 10.1166/jnn.2013.7276. Repéré à http://www.ingentaconnect.com/content/asp/jnn/2013/00000013/00000005/art00054
https://doi.org/10.1166/jnn.2013.7276 Kirkwood, J. G. (1939). The dielectric polarization of polar liquids. The Journal of chemical
physics, 7(10), 911-919. Klonos, P., Kyritsis, A., & Pissis, P. (2015). Interfacial dynamics of polydimethylsiloxane
adsorbed on fumed metal oxide particles of a wide range of specific surface area. Polymer, 77, 10-13.
Kochetov, R., Andritsch, T., Morshuis, P., & Smit, J. (2010). Effect of filler size on complex
permittivity and thermal conductivity of epoxy-based composites filled with BN particles. Dans Electrical Insulation and Dielectric Phenomena (CEIDP), 2010 Annual Report Conference on (pp. 1-4). IEEE.
Kofod, G., Risse, S., Stoyanov, H., McCarthy, D. N., Sokolov, S., & Kraehnert, R. (2011).
Broad-spectrum enhancement of polymer composite dielectric constant at ultralow volume fractions of silica-supported copper nanoparticles. ACS nano, 5(3), 1623-1629.
Kohlgrüber, K. (2008). Co-Rotating Twin-Screw Extruders - Fundamentals, Technology, and
Applications: Hanser Publishers. Kollosche, M., & Kofod, G. (2010). Electrical failure in blends of chemically identical, soft
thermoplastic elastomers with different elastic stiffness. Applied Physics Letters, 96(7), 071904.
Kollosche, M., Melzer, M., Becker, A., Stoyanov, H., McCarthy, D. N., Ragusch, H., &
Kofod, G. (2009). The influence of mechanical properties in the electrical breakdown in poly-styrene-ethylene-butadiene-styrene thermoplastic elastomer. Dans Proc. SPIE (Vol. 7287, pp. 728729).
Kossuth, M., Morse, D., & Bates, F. (1999). Viscoelastic behavior of cubic phases in block
copolymer melts. Journal of Rheology, 43(1), 167-196. Kremer, F., & Schönhals, A. (2012). Broadband Dielectric Spectroscopy. Springer Berlin
Heidelberg. Repéré à https://books.google.ca/books?id=z5LzCAAAQBAJ Ku, C. C., & Liepins, R. (1987). Electrical properties of polymers: chemical principles.
Hanser Publishers.

285
Ku, H., Wang, H., Pattarachaiyakoop, N., & Trada, M. (2011). A review on the tensile properties of natural fiber reinforced polymer composites. Composites Part B: Engineering, 42(4), 856-873.
Kuester, S., Barra, G. M. O., Ferreira Jr, J. C., Soares, B. G., & Demarquette, N. R. (2016).
Electromagnetic interference shielding and electrical properties of nanocomposites based on poly (styrene-b-ethylene-ran-butylene-b-styrene) and carbon nanotubes. European Polymer Journal, 77, 43-53. doi: http://doi.org/10.1016/j.eurpolymj.2016.02.020. Repéré à http://www.sciencedirect.com/science/article/pii/S0014305716300799
Kumar, B. B., Doddamani, M., Zeltmann, S. E., Gupta, N., Ramesh, M., & Ramakrishna, S.
(2016). Processing of cenosphere/HDPE syntactic foams using an industrial scale polymer injection molding machine. Materials & Design, 92, 414-423.
Kuo, S. W., & Chang, F. C. (2001). Miscibility and hydrogen bonding in blends of poly
(vinylphenol-co-methyl methacrylate) with poly (ethylene oxide). Macromolecules, 34(12), 4089-4097.
Lam, C.-K., Cheung, H.-y., Lau, K.-t., Zhou, L.-m., Ho, M.-w., & Hui, D. (2005). Cluster
size effect in hardness of nanoclay/epoxy composites. Composites Part B: Engineering, 36(3), 263-269.
Lau, K., Vaughan, A., Chen, G., Hosier, I., & Holt, A. (2013). On the dielectric response of
silica-based polyethylene nanocomposites. Journal of Physics D: Applied Physics, 46(9), 095303.
Lee, J.-H., Jung, D., Hong, C.-E., Rhee, K. Y., & Advani, S. G. (2005). Properties of
polyethylene-layered silicate nanocomposites prepared by melt intercalation with a PP-g-MA compatibilizer. Composites Science and Technology, 65(13), 1996-2002.
Lee, J. Y., Park, M. S., Yang, H. C., Cho, K., & Kim, J. K. (2003). Alignment and
orientational proliferation of HEX cylinders in a polystyrene-block-polyisoprene-block-polystyrene copolymer in the presence of clay. Polymer, 44(5), 1705-1710. doi: http://doi.org/10.1016/S0032-3861(02)00912-6. Repéré à http://www.sciencedirect.com/science/article/pii/S0032386102009126
Lei, S., Hoa, S. V., & Ton-That, M.-T. (2006). Effect of clay types on the processing and
properties of polypropylene nanocomposites. Composites Science and Technology, 66(10), 1274-1279.
Lewis, T. (2004). Interfaces are the dominant feature of dielectrics at the nanometric level.
IEEE Transactions on Dielectrics and Electrical Insulation, 11(5), 739-753.

286
Lewis, T. (2005). Interfaces: nanometric dielectrics. Journal of Physics D: Applied Physics, 38(2), 202.
Lewis, T. (2014). Charge transport in polyethylene nano dielectrics. IEEE Transactions on
Dielectrics and Electrical Insulation, 21(2), 497-502. Li, F., Shi, Y., Yuan, K., & Chen, Y. (2013). Fine dispersion and self-assembly of ZnO
nanoparticles driven by P3HT-b-PEO diblocks for improvement of hybrid solar cells performance. New Journal of Chemistry, 37(1), 195-203.
Li, Z., Okamoto, K., Ohki, Y., & Tanaka, T. (2010). Effects of nano-filler addition on partial
discharge resistance and dielectric breakdown strength of Micro-Al 2 O 3 Epoxy composite. IEEE Transactions on Dielectrics and Electrical Insulation, 17(3).
Li, Z., Okamoto, K., Ohki, Y., & Tanaka, T. (2011). The role of nano and micro particles on
partial discharge and breakdown strength in epoxy composites. IEEE Transactions on Dielectrics and Electrical Insulation, 18(3).
Liang, G., & Tjong, S. (2006). Electrical properties of low-density polyethylene/multiwalled
carbon nanotube nanocomposites. Materials Chemistry and Physics, 100(1), 132-137. Liao, R., Bai, G., Yang, L., Cheng, H., Yuan, Y., & Guan, J. (2013a). Improved electric
strength and space charge characterization in LDPE composites with montmorillonite fillers. Journal of Nanomaterials, 2013, 2.
Liao, R., Bai, G., Yang, L., Cheng, H., Yuan, Y., & Guan, J. (2013b). Improved Electric
Strength and Space Charge Characterization in LDPE Composites with Montmorillonite Fillers. Journal of Nanomaterials, 2013, 7. doi: 10.1155/2013/712543. Repéré à http://dx.doi.org/10.1155/2013/712543
Liao, R., Li, X., Bai, G., Yang, L., & Gu, J. (2014). Influence of montmorillonite on
electrical treeing and breakdown characteristics of low-density polyethylene. Journal of Reinforced Plastics and Composites, 33(23), 2117-2128.
Liedel, C., Pester, C. W., Ruppel, M., Urban, V. S., & Böker, A. (2012). Beyond Orientation:
The Impact of Electric Fields on Block Copolymers. Macromolecular Chemistry and Physics, 213(3), 259-269. doi: 10.1002/macp.201100590. Repéré à http://dx.doi.org/10.1002/macp.201100590
Lin, Y., Böker, A., He, J., Sill, K., Xiang, H., Abetz, C., . . . Long, S. (2005). Self-directed
self-assembly of nanoparticle/copolymer mixtures. Nature, 434(7029), 55-59. Lin, Y., Liu, L., Xu, G., Zhang, D., Guan, A., & Wu, G. (2015). Interfacial interactions and
segmental dynamics of poly (vinyl acetate)/silica nanocomposites. The Journal of Physical Chemistry C, 119(23), 12956-12966.
287
Liu, J., Mhetar, V., & Freestone, J. (2011). Insulation containing styrene copolymers: Google
Patents. Ma, D., Hugener, T. A., Siegel, R. W., Christerson, A., Mårtensson, E., Önneby, C., &
Schadler, L. S. (2005). Influence of nanoparticle surface modification on the electrical behaviour of polyethylene nanocomposites. Nanotechnology, 16(6), 724.
Ma, Z., Jiang, P., Wang, L., & Yang, J. (2010). Effect of styrene–ethylene–butadiene–styrene
and its synergetic effect with ethylene vinyl acetate on the mechanical, thermal, dielectric, and water‐treeing behaviors of crosslinked polyethylene. Journal of applied polymer science, 118(4), 2350-2357.
Mai, Y., & Eisenberg, A. (2012). Self-assembly of block copolymers. Chemical Society
Reviews, 41(18), 5969-5985. Mansky, P., DeRouchey, J., Russell, T. P., Mays, J., Pitsikalis, M., Morkved, T., & Jaeger, H.
(1998). Large-Area Domain Alignment in Block Copolymer Thin Films Using Electric Fields. Macromolecules, 31(13), 4399-4401. doi: 10.1021/ma980299u. Repéré à http://dx.doi.org/10.1021/ma980299u
Mazzanti, G., & Marzinotto, M. (2013). Extruded cables for high-voltage direct-current
transmission: advances in research and development (Vol. 93). John Wiley & Sons. Mc Carthy, D., Risse, S., Katekomol, P., & Kofod, G. (2009). The effect of dispersion on the
increased relative permittivity of TiO2/SEBS composites. Journal of Physics D: Applied Physics, 42(14), 145406.
McCarthy, D. N., Stoyanov, H., Rychkov, D., Ragusch, H., Melzer, M., & Kofod, G. (2012).
Increased permittivity nanocomposite dielectrics by controlled interfacial interactions. Composites Science and Technology, 72(6), 731-736.
Mélé, P., Marceau, S., Brown, D., de Puydt, Y., & Albérola, N. D. (2002). Reinforcement
effects in fractal-structure-filled rubber. Polymer, 43(20), 5577-5586. Mi, H.-Y., Li, Z., Turng, L.-S., Sun, Y., & Gong, S. (2014). Silver nanowire/thermoplastic
polyurethane elastomer nanocomposites: Thermal, mechanical, and dielectric properties. Materials & Design, 56, 398-404.
Mishnaevsky Jr, L. (2012). Micromechanical analysis of nanocomposites using 3D voxel
based material model. Composites Science and Technology, 72(10), 1167-1177. doi: http://doi.org/10.1016/j.compscitech.2012.03.026. Repéré à http://www.sciencedirect.com/science/article/pii/S0266353812001327

288
Mizutani, T. (2000). High-voltage dc insulation and space charge. Dans Properties and Applications of Dielectric Materials, 2000. Proceedings of the 6th International Conference on (Vol. 1, pp. 18-23). IEEE.
Moreira, J. C., & Demarquette, N. R. (2001). Influence of temperature, molecular weight,
and molecular weight dispersity on the surface tension of PS, PP, and PE. I. Experimental. Journal of applied polymer science, 82(8), 1907-1920.
Murillo, E. A., & López, B. L. (2015). Effect of the maleic anhydride content on the
structural, thermal, rheological and film properties of the n-butyl methacrylate–maleic anhydride copolymers. Progress in Organic Coatings, 78, 96-102.
Ndiaye, D., Matuana, L. M., Morlat‐Therias, S., Vidal, L., Tidjani, A., & Gardette, J. L.
(2011). Thermal and mechanical properties of polypropylene/wood‐flour composites. Journal of applied polymer science, 119(6), 3321-3328.
Nelson, J., & Hu, Y. (2005). Nanocomposite dielectrics—properties and implications.
Journal of Physics D: Applied Physics, 38(2), 213. Nguyen, Q. T., & Baird, D. G. (2006). Preparation of polymer–clay nanocomposites and
their properties. Advances in Polymer Technology, 25(4), 270-285. Ohta, T., & Kawasaki, K. (1990). Comment on the free energy functional of block copolymer
melts in the strong segregation limit. Macromolecules, 23(8), 2413-2414. Owens, D. K., & Wendt, R. (1969). Estimation of the surface free energy of polymers.
Journal of applied polymer science, 13(8), 1741-1747. Pang, W., Ni, Z., Chen, G., Huang, G., Huang, H., & Zhao, Y. (2015). Mechanical and
thermal properties of graphene oxide/ultrahigh molecular weight polyethylene nanocomposites. RSC Advances, 5(77), 63063-63072.
Park, C., Yoon, J., & Thomas, E. L. (2003). Enabling nanotechnology with self assembled
block copolymer patterns. Polymer, 44(22), 6725-6760. Paul, D. R., & Bucknall, C. B. (2000). Polymer blends (Vol. Volume I Formulation). John
Wiley & Sons. Peng, W., Xu, S., Li, L., Zhang, C., & Zheng, S. (2016). Organic–Inorganic Nanocomposites
via Self-Assembly of an Amphiphilic Triblock Copolymer Bearing a Poly (butadiene-g-POSS) Subchain in Epoxy Thermosets: Morphologies, Surface Hydrophobicity, and Dielectric Properties. The Journal of Physical Chemistry B, 120(46), 12003-12014.

289
Peponi, L., Tercjak, A., Verdejo, R., Lopez-Manchado, M. A., Mondragon, I., & Kenny, J. M. (2009). Confinement of Functionalized Graphene Sheets by Triblock Copolymers. The Journal of Physical Chemistry C, 113(42), 17973-17978. doi: 10.1021/jp9074527. Repéré à http://dx.doi.org/10.1021/jp9074527
Pirani, S. I., Krishnamachari, P., & Hashaikeh, R. (2014). Optimum loading level of
nanoclay in PLA nanocomposites: Impact on the mechanical properties and glass transition temperature. Journal of Thermoplastic Composite Materials, 27(11), 1461-1478.
Pitsa, D., & Danikas, M. G. (2011). Interfaces features in polymer nanocomposites: A review
of proposed models. Nano, 6(06), 497-508. Pleşa, I., Noţingher, P. V., Schlögl, S., Sumereder, C., & Muhr, M. (2016). Properties of
Polymer Composites Used in High-Voltage Applications. Polymers, 8(5), 173. Polizos, G., Tomer, V., Manias, E., & Randall, C. (2010). Epoxy-based nanocomposites for
electrical energy storage. II: Nanocomposites with nanofillers of reactive montmorillonite covalently-bonded with barium titanate. Journal of Applied Physics, 108(7), 074117.
Polystyrene-block-poly(ethylene-ran-butylene)-block-polystyrene. Repéré à
http://www.sigmaaldrich.com/catalog/product/aldrich/200565?lang=en®ion=CA (Access Date: April 25, 2017)
Polystyrene-block-poly(ethylene-ran-butylene)-block-polystyrene-graft-maleic anhydride.
Repéré à http://www.sigmaaldrich.com/catalog/product/aldrich/432431?lang=en®ion=CA (Access Date: February 07, 2017)
Pourrahimi, A. M., Hoang, T. A., Liu, D., Pallon, L. K., Gubanski, S., Olsson, R. T., . . .
Hedenqvist, M. S. (2016). Highly efficient interfaces in nanocomposites based on polyethylene and ZnO nano/hierarchical particles: A novel approach toward ultralow electrical conductivity insulations. Advanced Materials, 28(39), 8651-8657.
Pourrahimi, A. M., Pallon, L. K., Liu, D., Hoang, T. A., Gubanski, S., Hedenqvist, M. S., . . .
Gedde, U. W. (2016). Polyethylene Nanocomposites for the Next Generation of Ultralow-Transmission-Loss HVDC Cables: Insulation Containing Moisture-Resistant MgO Nanoparticles. ACS applied materials & interfaces, 8(23), 14824-14835.
Powell, C. E., & Beall, G. W. (2006). Physical properties of polymer/clay nanocomposites.
Current Opinion in Solid State and Materials Science, 10(2), 73-80.

290
Praeger, M., Andritsch, T., Swingler, S., & Vaughan, A. S. (2014). A simple theoretical model for the bulk properties of nanocomposite materials. Dans Electrical Insulation and Dielectric Phenomena (CEIDP), 2014 IEEE Conference on (pp. 699-702). IEEE.
Preda, I., Castellon, J., Agnel, S., Couderc, H., Frechette, M., Gao, F., . . . Vaessen, A.-F.
(2013). Dielectric response of various partially cured epoxy nanocomposites. IEEE Transactions on Dielectrics and Electrical Insulation, 20(2), 580-591.
Preda, I., Castellon, J., Frechette, M., & Agnel, S. (2014). Modelling the dielectric
permittivity of nanocomposites-the overlap model. Dans Electrical Insulating Materials (ISEIM), Proceedings of 2014 International Symposium on (pp. 17-21). IEEE.
Preda, I., Couderc, H., Fréchette, M., Savoie, S., Gao, F., Nigmatullin, R., . . . Castellon, J.
(2012). Dielectric response of modified epoxy/clay nanocomposites. Dans Electrical Insulation and Dielectric Phenomena (CEIDP), 2012 Annual Report Conference on (pp. 531-534). IEEE.
Qu, M., Deng, F., Kalkhoran, S. M., Gouldstone, A., Robisson, A., & Van Vliet, K. J. (2011).
Nanoscale visualization and multiscale mechanical implications of bound rubber interphases in rubber–carbon black nanocomposites. Soft Matter, 7(3), 1066-1077.
Reading, M., Vaughan, A. S., & Lewin, P. L. (2011). An investigation into improving the
breakdown strength and thermal conduction of an epoxy system using boron nitride. Dans Electrical Insulation and Dielectric Phenomena (CEIDP), 2011 Annual Report Conference on (pp. 636-639). IEEE.
Rittigstein, P., Priestley, R. D., Broadbelt, L. J., & Torkelson, J. M. (2007). Model polymer
nanocomposites provide an understanding of confinement effects in real nanocomposites. Nature materials, 6(4), 278-282.
Rittigstein, P., & Torkelson, J. M. (2006). Polymer–nanoparticle interfacial interactions in
polymer nanocomposites: confinement effects on glass transition temperature and suppression of physical aging. Journal of Polymer Science Part B: Polymer Physics, 44(20), 2935-2943.
Robertson, C. G., & Rackaitis, M. (2011). Further consideration of viscoelastic two glass
transition behavior of nanoparticle-filled polymers. Macromolecules, 44(5), 1177-1181.
Roy, M., Nelson, J., MacCrone, R., Schadler, L. S., Reed, C., & Keefe, R. (2005). Polymer
nanocomposite dielectrics-the role of the interface. IEEE Transactions on Dielectrics and Electrical Insulation, 12(4), 629-643.

291
Ruppel, M., Pester, C. W., Langner, K. M., Sevink, G. J. A., Schoberth, H. G., Schmidt, K., . . . Böker, A. (2013). Electric Field Induced Selective Disordering in Lamellar Block Copolymers. ACS nano, 7(5), 3854-3867. doi: 10.1021/nn3059604. Repéré à http://dx.doi.org/10.1021/nn3059604
Saleem, H., Thunga, M., Kollosche, M., Kessler, M., & Laflamme, S. (2014). Interfacial
treatment effects on behavior of soft nano-composites for highly stretchable dielectrics. Polymer, 55(17), 4531-4537.
Samant, S. P., Grabowski, C. A., Kisslinger, K., Yager, K. G., Yuan, G., Satija, S. K., . . .
Karim, A. (2016). Directed self-assembly of block copolymers for high breakdown strength polymer film capacitors. ACS applied materials & interfaces, 8(12), 7966-7976.
Sari, M. G., Moradian, S., Bastani, S., & Stribeck, N. (2012). Modification of poly
(propylene) by grafted polyester‐amide‐based dendritic nanostructures with the aim of improving its dyeability. Journal of applied polymer science, 124(3), 2449-2462.
Sarkar, B., & Alexandridis, P. (2015). Block copolymer–nanoparticle composites: Structure,
functional properties, and processing. Progress in Polymer Science, 40, 33-62. Schönhals, A., Goering, H., Schick, C., Frick, B., & Zorn, R. (2004). Glass transition of
polymers confined to nanoporous glasses. Colloid and Polymer Science, 282(8), 882-891.
Selvin, T. P., Kuruvilla, J., & Sabu, T. (2004). Mechanical properties of titanium dioxide-
filled polystyrene microcomposites. Materials Letters, 58(3), 281-289. Semenov, A. (1993). Theory of block-copolymer interfaces in the strong segregation limit.
Macromolecules, 26(24), 6617-6621. Seppala, J. E. (2012). Spatial and orientation control of cylindrical nanostructures in ABA
triblock copolymer thin films by raster solvent vapor annealing. ACS nano, 6(11), 9855-9862.
Smith, R., Liang, C., Landry, M., Nelson, J., & Schadler, L. (2008). The mechanisms leading
to the useful electrical properties of polymer nanodielectrics. IEEE Transactions on Dielectrics and Electrical Insulation, 15(1).
Solid surface energy data (SFE) for common polymers. Repéré à http://www.surface-
tension.de/solid-surface-energy.htm (Access date: February 20, 2017) Song, W. L., Wang, P., Cao, L., Anderson, A., Meziani, M. J., Farr, A. J., & Sun, Y. P.
(2012). Polymer/boron nitride nanocomposite materials for superior thermal transport performance. Angewandte Chemie International Edition, 51(26), 6498-6501.

292
Standard Test Method for Tensile Properties of Plastics. (2014). ASTM International. Standard Test Methods for Vulcanized Rubber and Thermoplastic Elastomers. (2016).
ASTM International. Starr, F. W., Schroder, T., & Glotzer, S. C. (2002). Molecular dynamics simulation of a
polymer melt with a nanoscopic particle. Macromolecules, 35, 4481. Stoyanov, H., Kollosche, M., Risse, S., McCarthy, D. N., & Kofod, G. (2011). Elastic block
copolymer nanocomposites with controlled interfacial interactions for artificial muscles with direct voltage control. Soft Matter, 7(1), 194-202.
Švab, I., Musil, V., Šmit, I., & Makarovič, M. (2007). Mechanical properties of wollastonite‐
reinforced polypropylene composites modified with SEBS and SEBS‐g‐MA elastomers. Polymer Engineering & Science, 47(11), 1873-1880.
Tadros, T. F. (2015). Interfacial phenomena and colloid stability: basic principles (Vol. 1).
Walter de Gruyter GmbH & Co KG. Takala, M., Ranta, H., Nevalainen, P., Pakonen, P., Pelto, J., Karttunen, M., . . . Sonerud, B.
(2010). Dielectric properties and partial discharge endurance of polypropylene-silica nanocomposite. IEEE Transactions on Dielectrics and Electrical Insulation, 17(4).
Talja, R. A., & Roos, Y. H. (2001). Phase and state transition effects on dielectric,
mechanical, and thermal properties of polyols. Thermochimica Acta, 380(2), 109-121. Tanaka, T., & Imai, T. (2013). Advances in nanodielectric materials over the past 50 years.
IEEE Electrical Insulation Magazine, 29(1), 10-23. Tanaka, T., Kozako, M., Fuse, N., & Ohki, Y. (2005). Proposal of a multi-core model for
polymer nanocomposite dielectrics. IEEE Transactions on Dielectrics and Electrical Insulation, 12(4), 669-681.
Tanaka, T., Matsuo, Y., & Uchida, K. (2008). Partial discharge endurance of epoxy/SiC
nanocomposite. Dans Electrical Insulation and Dielectric Phenomena, 2008. CEIDP 2008. Annual Report Conference on (pp. 13-16). IEEE.
Tanaka, T., Montanari, G., & Mulhaupt, R. (2004). Polymer nanocomposites as dielectrics
and electrical insulation-perspectives for processing technologies, material characterization and future applications. IEEE Transactions on Dielectrics and Electrical Insulation, 11(5), 763-784.
293
Terao, T., Zhi, C., Bando, Y., Mitome, M., Tang, C., & Golberg, D. (2010). Alignment of boron nitride nanotubes in polymeric composite films for thermal conductivity improvement. The Journal of Physical Chemistry C, 114(10), 4340-4344.
Thomas, S., & Zaikov, G. E. (2008). Polymer Nanocomposite Research Advances. Nova
Science Publishers. Repéré à https://books.google.ca/books?id=FU5Gtb5EBZ0C Tian, F., Lei, Q., Wang, X., & Wang, Y. (2011). Effect of deep trapping states on space
charge suppression in polyethylene/ZnO nanocomposite. Applied Physics Letters, 99(14), 142903.
Tian, F., Lei, Q., Wang, X., & Wang, Y. (2012). Investigation of electrical properties of
LDPE/ZnO nanocomposite dielectrics. IEEE Transactions on Dielectrics and Electrical Insulation, 19(3).
Tian, F., Yao, J., Li, P., Wang, Y., Wu, M., & Lei, Q. (2015). Stepwise electric field induced
charging current and its correlation with space charge formation in LDPE/ZnO nanocomposite. IEEE Transactions on Dielectrics and Electrical Insulation, 22(2), 1232-1239.
Tiemblo, P., Hoyos, M., Gómez-Elvira, J. M., Guzmán, J., García, N., Dardano, A., &
Guastavino, F. (2008). The development of electrical treeing in LDPE and its nanocomposites with spherical silica and fibrous and laminar silicates. Journal of Physics D: Applied Physics, 41(12), 125208.
Tokarský, J., Kulhánková, L., Neuwirthová, L., Kutláková, K. M., Vallová, S., Stýskala, V.,
& Čapková, P. (2016). Highly anisotropic conductivity of tablets pressed from polyaniline-montmorillonite nanocomposite. Materials Research Bulletin, 75, 139-143.
Tomer, V., Polizos, G., Randall, C., & Manias, E. (2011). Polyethylene nanocomposite
dielectrics: implications of nanofiller orientation on high field properties and energy storage. Journal of Applied Physics, 109(7), 074113.
Torchinsky, I., & Rosenman, G. (2009). Wettability modification of nanomaterials by low-
energy electron flux. Nanoscale Research Letters, 4(10), 1209. Trifkovic, M., Hedegaard, A. T., Sheikhzadeh, M., Huang, S., & Macosko, C. W. (2015).
Stabilization of PE/PEO cocontinuous blends by interfacial nanoclays. Macromolecules, 48(13), 4631-4644.
Tronto, J., Bordonal, A. C., Naal, Z., & Valim, J. B. (2013). Conducting polymers/layered
double hydroxides intercalated nanocomposites. Materials Science-Advanced Topics, 3-30.

294
Tsagaropoulos, G., & Eisenberg, A. (1995). Dynamic mechanical study of the factors affecting the two glass transition behavior of filled polymers. Similarities and differences with random ionomers. Macromolecules, 28(18), 6067-6077.
Tsagaropoulos, G., & Eisenburg, A. (1995). Direct observation of two glass transitions in
silica-filled polymers. Implications to the morphology of random ionomers. Macromolecules, 28(1), 396-398.
Tsangaris, G., Kouloumbi, N., & Kyvelidis, S. (1996). Interfacial relaxation phenomena in
particulate composites of epoxy resin with copper or iron particles. Materials Chemistry and Physics, 44(3), 245-250.
Tsekmes, I., Kochetov, R., Morshuis, P., & Smit, J. (2014). Evaluating the effect of particle
distribution and dispersion on the dielectric response of boron nitride-epoxy nanocomposites. Dans Electrical Insulation Conference (EIC), 2014 (pp. 329-332). IEEE.
Tsekmes, I. A. (2016). Analysis of the Mechanisms Determining the Thermal and Electrical
Properties of Epoxy Nanocomposites for High Voltage Applications. doi: 10.4233/uuid:c07dbb22-09c1-432b-a48a-4b122568143e
Uddin, F. (2008). Clays, nanoclays, and montmorillonite minerals. Metallurgical and
Materials Transactions A, 39(12), 2804-2814. Utracki, L. A. (2004). Clay-containing Polymeric Nanocomposites. Rapra Technology
Limited. Repéré à https://books.google.ca/books?id=YTZLPgAACAAJ Utracki, L. A. (2010). Clay-containing polymeric nanocomposites and their properties. IEEE
Electrical Insulation Magazine, 26(4). Vaia, R. A., Jandt, K. D., Kramer, E. J., & Giannelis, E. P. (1996). Microstructural Evolution
of Melt Intercalated Polymer−Organically Modified Layered Silicates Nanocomposites. Chemistry of Materials, 8(11), 2628-2635. doi: 10.1021/cm960102h. Repéré à http://dx.doi.org/10.1021/cm960102h
Vaia, R. A., & Maguire, J. F. (2006). Polymer Nanocomposites with Prescribed Morphology:
Going Beyond Nanoparticle-Filled Polymers (Preprint). DTIC Document. Vandebril, S., Vermant, J., & Moldenaers, P. (2010). Efficiently suppressing coalescence in
polymer blends using nanoparticles: role of interfacial rheology. Soft Matter, 6(14), 3353-3362.
Varlow, B., Robertson, J., & Donnelly, K. (2007). Nonlinear fillers in electrical insulating
materials. IET Science, Measurement & Technology, 1(2), 96-102.

295
Vermogen, A., Masenelli-Varlot, K., Séguéla, R., Duchet-Rumeau, J., Boucard, S., & Prele, P. (2005). Evaluation of the Structure and Dispersion in Polymer-Layered Silicate Nanocomposites. Macromolecules, 38(23), 9661-9669. doi: 10.1021/ma051249+. Repéré à http://dx.doi.org/10.1021/ma051249+
Vilgis, T. A. (1993). Strong and fragile glasses: A powerful classification and its
consequences. Physical Review B, 47(5), 2882. Virtanen, S., Krentz, T. M., Nelson, J. K., Schadler, L. S., Bell, M., Benicewicz, B., . . .
Zhao, S. (2014). Dielectric breakdown strength of epoxy bimodal-polymer-brush-grafted core functionalized silica nanocomposites. IEEE Transactions on Dielectrics and Electrical Insulation, 21(2), 563-570.
Vo, L. T., Anastasiadis, S. H., & Giannelis, E. P. (2011). Dielectric study of poly (styrene-
co-butadiene) composites with carbon black, silica, and nanoclay. Macromolecules. Wang, D., Fujinami, S., Liu, H., Nakajima, K., & Nishi, T. (2010). Investigation of true
surface morphology and nanomechanical properties of poly (styrene-b-ethylene-co-butylene-b-styrene) using nanomechanical mapping: Effects of composition. Macromolecules, 43(21), 9049-9055.
What is so special about the nanoscale? . Repéré à https://www.nano.gov/nanotech-
101/special (Access date: March 21, 2017) Wilkinson, A., Clemens, M., & Harding, V. (2004). The effects of SEBS-g-maleic anhydride
reaction on the morphology and properties of polypropylene/PA6/SEBS ternary blends. Polymer, 45(15), 5239-5249.
Wu, S., Tang, Z., Guo, B., Zhang, L., & Jia, D. (2013). Effects of interfacial interaction on
chain dynamics of rubber/graphene oxide hybrids: a dielectric relaxation spectroscopy study. RSC Advances, 3(34), 14549-14559.
Xiong, Z., Li, C., Ma, S., Feng, J., Yang, Y., Zhang, R., & Zhu, J. (2013). The properties of
poly (lactic acid)/starch blends with a functionalized plant oil: Tung oil anhydride. Carbohydrate polymers, 95(1), 77-84.
Yang, T.-I., & Kofinas, P. (2007). Dielectric properties of polymer nanoparticle composites.
Polymer, 48(3), 791-798. Yang, W., Yi, R., Yang, X., Xu, M., Hui, S., & Cao, X. (2012). Effect of particle size and
dispersion on dielectric properties in ZnO/epoxy resin composites. Trans. Electr. Electronic Materials, 13, 116-120.
Zapata, P. A., Tamayo, L., Páez, M., Cerda, E., Azócar, I., & Rabagliati, F. M. (2011).
Nanocomposites based on polyethylene and nanosilver particles produced by

296
metallocenic “in situ” polymerization: synthesis, characterization, and antimicrobial behavior. European Polymer Journal, 47(8), 1541-1549.
Zare, Y., & Garmabi, H. (2014). Attempts to simulate the modulus of polymer/carbon
nanotube nanocomposites and future trends. Polymer Reviews, 54(3), 377-400. Zazoum, B., David, E., & Ngô, A. D. (2013). LDPE/HDPE/clay nanocomposites: effects of
compatibilizer on the structure and dielectric response. Journal of Nanotechnology, 2013.
Zazoum, B., David, E., & Ngô, A. D. (2014). Correlation between Structure and Dielectric
Breakdown in LDPE/HDPE/Clay Nanocomposites. ISRN Nanomaterials, 2014. Zazoum, B., David, E., & Ngô, A. D. (2014). Structural and dielectric studies of LLDPE/O-
MMT nanocomposites. Transactions on Electrical and Electronic Materials, 15(5), 235-240.
Zazoum, B., Frechette, M., & David, E. (2016). LDPE/tio 2 nanocomposites: effect of poss
on structure and dielectric properties. IEEE Transactions on Dielectrics and Electrical Insulation, 23(5), 2505-2507.
Zhang, D.-L., Zha, J.-W., Li, C.-Q., Li, W.-K., Wang, S.-J., Wen, Y., & Dang, Z.-M. (2017).
High thermal conductivity and excellent electrical insulation performance in double-percolated three-phase polymer nanocomposites. Composites Science and Technology, 144, 36-42. doi: http://doi.org/10.1016/j.compscitech.2017.02.022. Repéré à http://www.sciencedirect.com/science/article/pii/S0266353816320747
Zhang, Q., & Archer, L. A. (2002). Poly (ethylene oxide)/silica nanocomposites: structure
and rheology. Langmuir, 18(26), 10435-10442. Zhang, T., & Luo, T. (2016). Role of chain morphology and stiffness in thermal conductivity
of amorphous polymers. The Journal of Physical Chemistry B, 120(4), 803-812. Zhao, L., Liu, G. z., Su, J. c., Pan, Y. f., & Zhang, X. b. (2011). Investigation of Thickness
Effect on Electric Breakdown Strength of Polymers Under Nanosecond Pulses. IEEE Transactions on Plasma Science, 39(7), 1613-1618. doi: 10.1109/TPS.2011.2143435
Zhao, X., Zhao, J., Cao, J.-P., Wang, X., Chen, M., & Dang, Z.-M. (2013). Tuning the
dielectric properties of polystyrene/poly (vinylidene fluoride) blends by selectively localizing carbon black nanoparticles. The Journal of Physical Chemistry B, 117(8), 2505-2515.
Zhi, C., Bando, Y., Terao, T., Tang, C., Kuwahara, H., & Golberg, D. (2009). Towards
thermoconductive, electrically insulating polymeric composites with boron nitride nanotubes as fillers. Advanced Functional Materials, 19(12), 1857-1862.

297
Zhou, X., Yu, Y., Lin, Q., & Chen, L. (2013). Effects of maleic anhydride-grafted
polypropylene (MAPP) on the physico-mechanical properties and rheological behavior of bamboo powder-polypropylene foamed composites. BioResources, 8(4), 6263-6279.
Zhou, Y., He, J., Hu, J., Huang, X., & Jiang, P. (2015). Evaluation of
polypropylene/polyolefin elastomer blends for potential recyclable HVDC cable insulation applications. IEEE Transactions on Dielectrics and Electrical Insulation, 22(2), 673-681.
Zohrevand, A., Ajji, A., & Mighri, F. (2014). Relationship between rheological and electrical
percolation in a polymer nanocomposite with semiconductor inclusions. Rheologica Acta, 53(3), 235-254.
Zou, C., Fothergill, J. C., & Rowe, S. W. (2007). A" water shell" model for the dielectric
properties of hydrated silica-filled epoxy nano-composites. Dans Solid Dielectrics, 2007. ICSD'07. IEEE International Conference on (pp. 389-392). IEEE.


![Brigadeiro - Compassion International · RECIPE Brigadeiro [BREE-gah-DARE-oh] BY ANA RAFAELA , ADAPTED BY REBECA HARCHARIK Adult Help Needed. Makes about 40 candies. Brigadeiro is](https://img.pdfslide.us/doc/110x75/5c5c481609d3f259368d189a/brigadeiro-compassion-international-recipe-brigadeiro-bree-gah-dare-oh-by.jpg)