Embed Size (px)
Citation preview

ADVANCED EXCEL FOR ENERGY
EFFICIENCY PROFESSIONALS
TIPS
TRICKS
&
TECHNIQUES
A comprehensive web based course on Microsoft
Excel specifically tailored for Energy Engineers,
Energy Managers, Energy Analysts, Consultants,
Utility Program Managers and Industry Specialists.
www.eedminc.com
(312) 450-3337
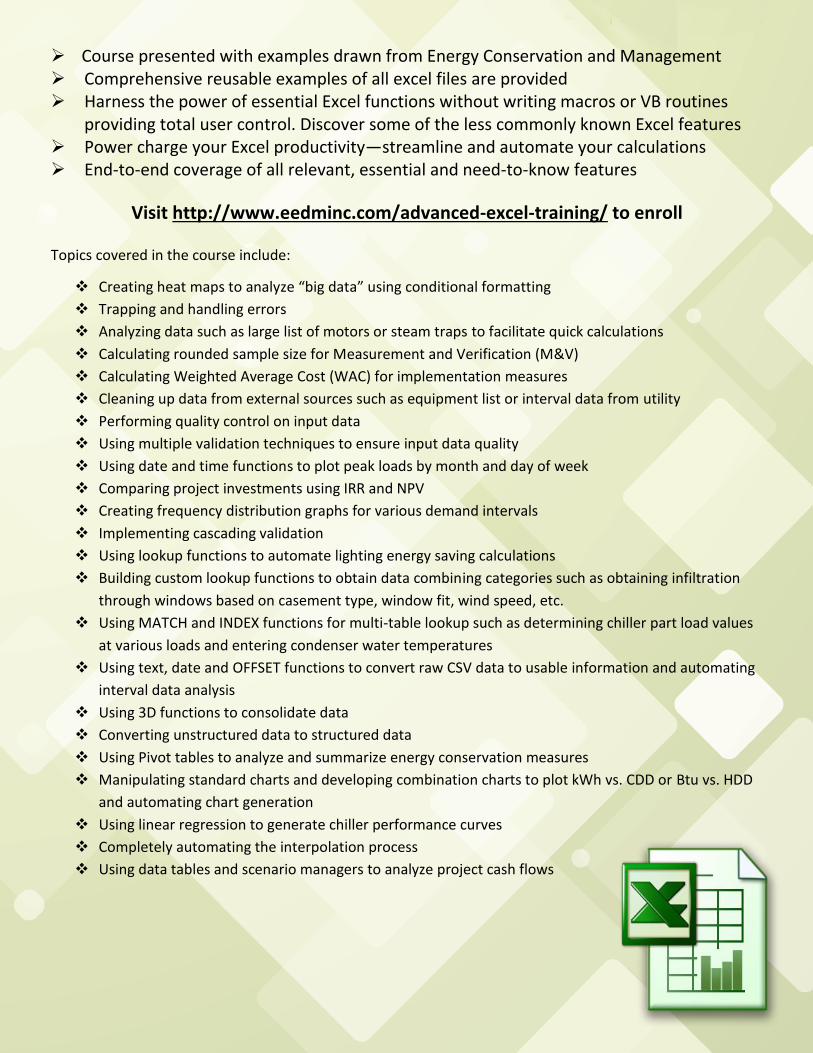
Course presented with examples drawn from Energy Conservation and Management Comprehensive reusable examples of all excel files are provided Harness the power of essential Excel functions without writing macros or VB routines providing total user control. Discover some of the less commonly known Excel features Power charge your Excel productivity—streamline and automate your calculations End-to-end coverage of all relevant, essential and need-to-know features
Visit http://www.eedminc.com/advanced-excel-training/ to enroll
Topics covered in the course include:
Creating heat maps to analyze “big data” using conditional formatting
Trapping and handling errors
Analyzing data such as large list of motors or steam traps to facilitate quick calculations
Calculating rounded sample size for Measurement and Verification (M&V)
Calculating Weighted Average Cost (WAC) for implementation measures
Cleaning up data from external sources such as equipment list or interval data from utility
Performing quality control on input data
Using multiple validation techniques to ensure input data quality
Using date and time functions to plot peak loads by month and day of week
Comparing project investments using IRR and NPV
Creating frequency distribution graphs for various demand intervals
Implementing cascading validation
Using lookup functions to automate lighting energy saving calculations
Building custom lookup functions to obtain data combining categories such as obtaining infiltration
through windows based on casement type, window fit, wind speed, etc.
Using MATCH and INDEX functions for multi-table lookup such as determining chiller part load values
at various loads and entering condenser water temperatures
Using text, date and OFFSET functions to convert raw CSV data to usable information and automating
interval data analysis
Using 3D functions to consolidate data
Converting unstructured data to structured data
Using Pivot tables to analyze and summarize energy conservation measures
Manipulating standard charts and developing combination charts to plot kWh vs. CDD or Btu vs. HDD
and automating chart generation
Using linear regression to generate chiller performance curves
Completely automating the interpolation process
Using data tables and scenario managers to analyze project cash flows
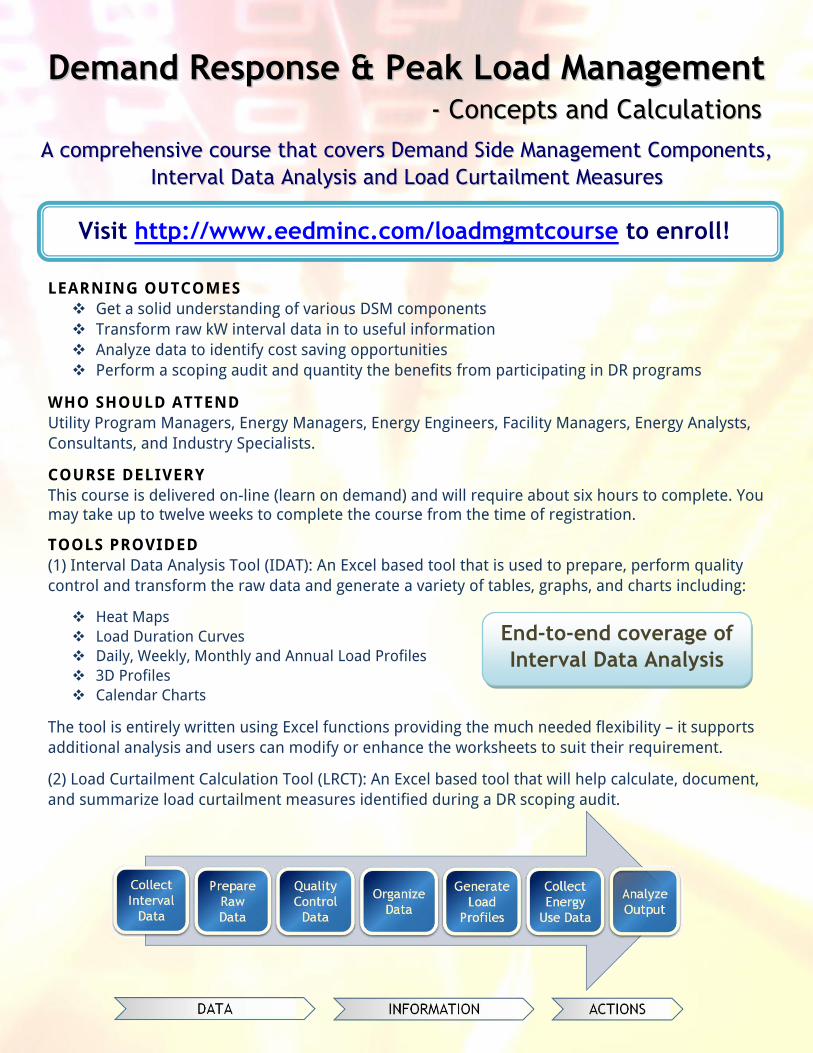
DDeemmaanndd RReessppoonnssee && PPeeaakk LLooaadd MMaannaaggeemmeenntt
-- CCoonncceeppttss aanndd CCaallccuullaattiioonnss
AA ccoommpprreehheennssiivvee ccoouurrssee tthhaatt ccoovveerrss DDeemmaanndd SSiiddee MMaannaaggeemmeenntt CCoommppoonneennttss,,
IInntteerrvvaall DDaattaa AAnnaallyyssiiss aanndd LLooaadd CCuurrttaaiillmmeenntt MMeeaassuurreess
LEARNING OUTCOMES
Get a solid understanding of various DSM components
Transform raw kW interval data in to useful information
Analyze data to identify cost saving opportunities
Perform a scoping audit and quantity the benefits from participating in DR programs
WHO SHOULD ATTEND
Utility Program Managers, Energy Managers, Energy Engineers, Facility Managers, Energy Analysts,
Consultants, and Industry Specialists.
COURSE DELIVERY
This course is delivered on-line (learn on demand) and will require about six hours to complete. You may take up to twelve weeks to complete the course from the time of registration.
TOOLS PROVIDED
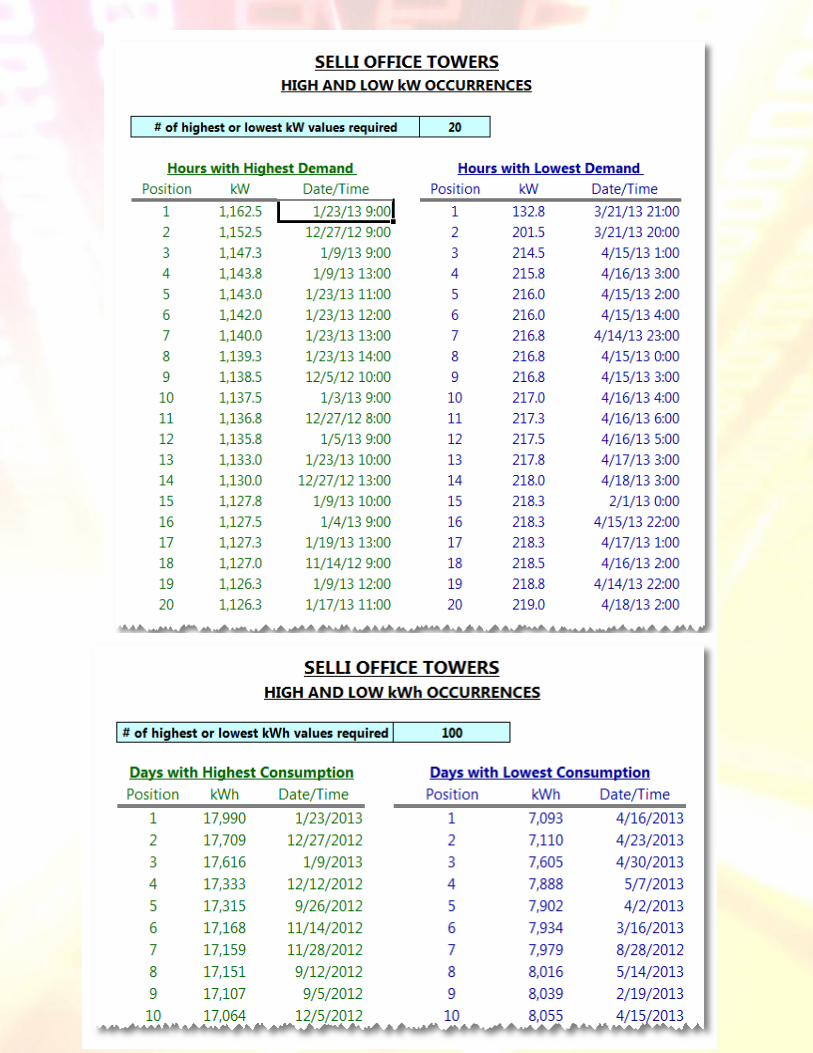
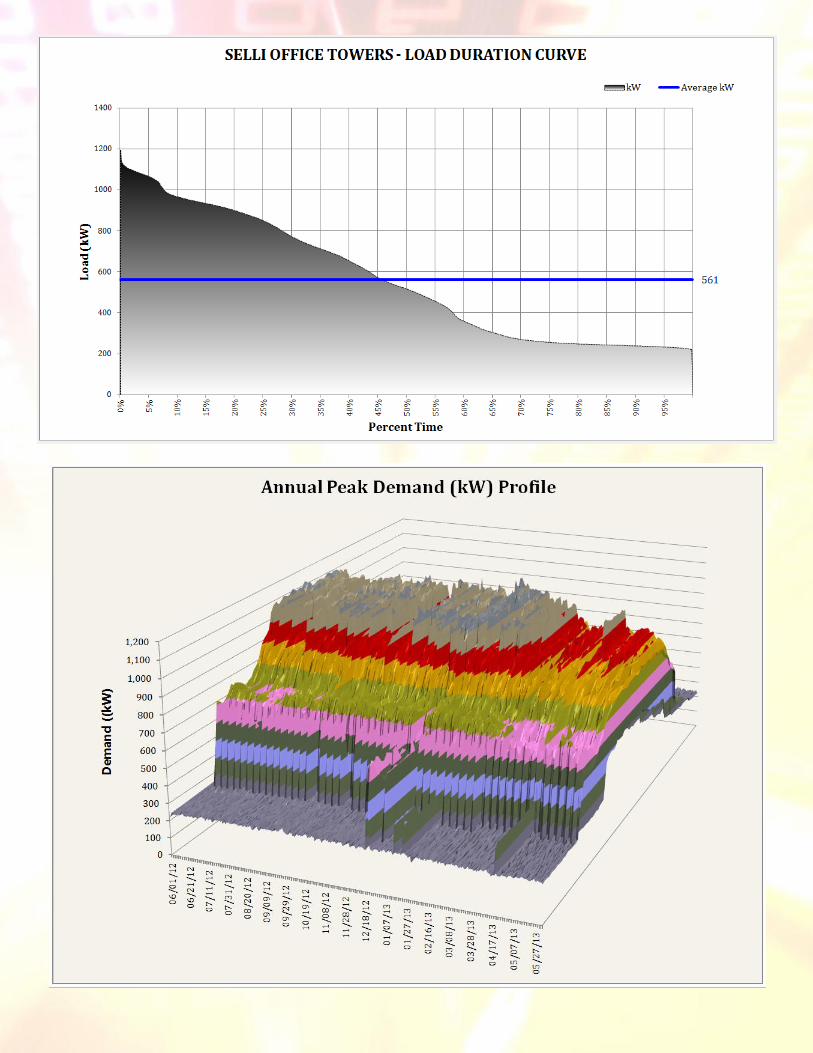
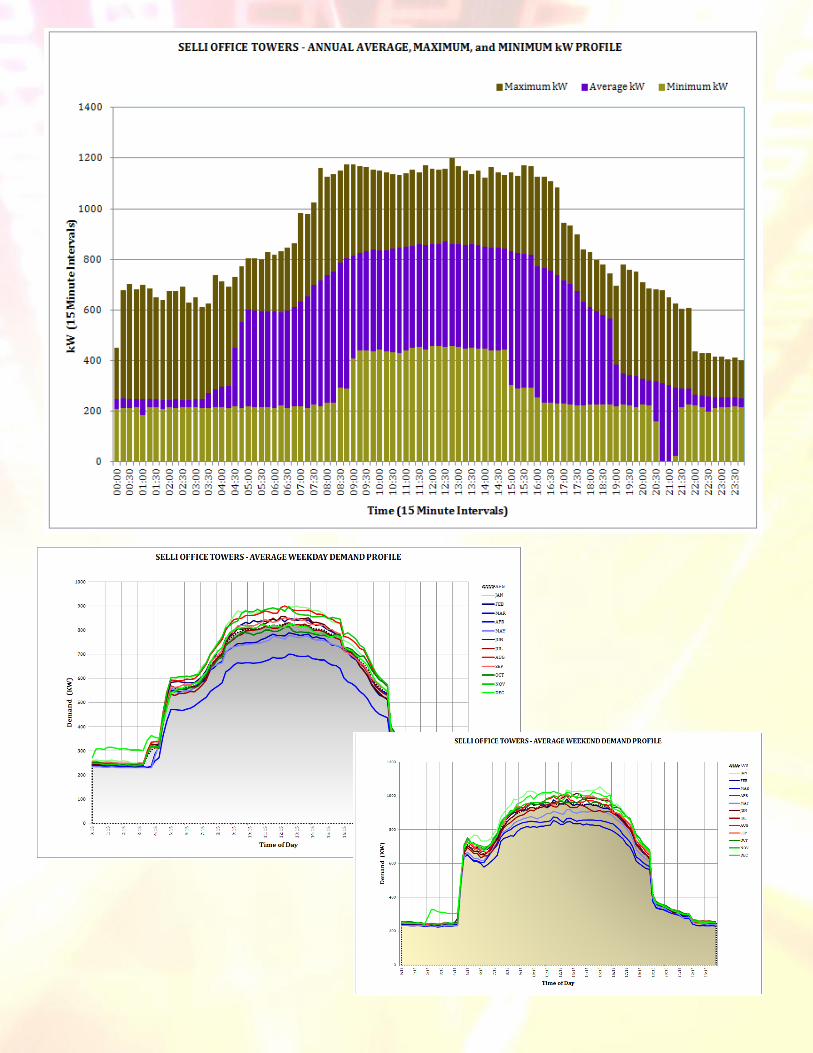
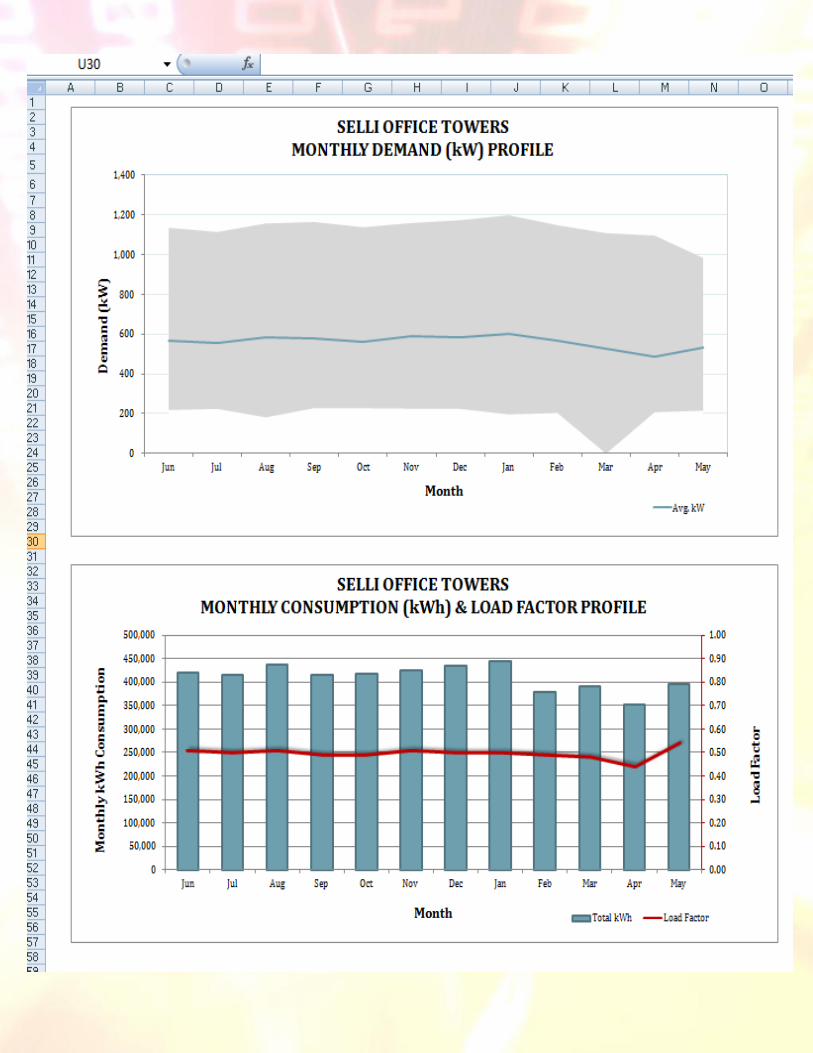
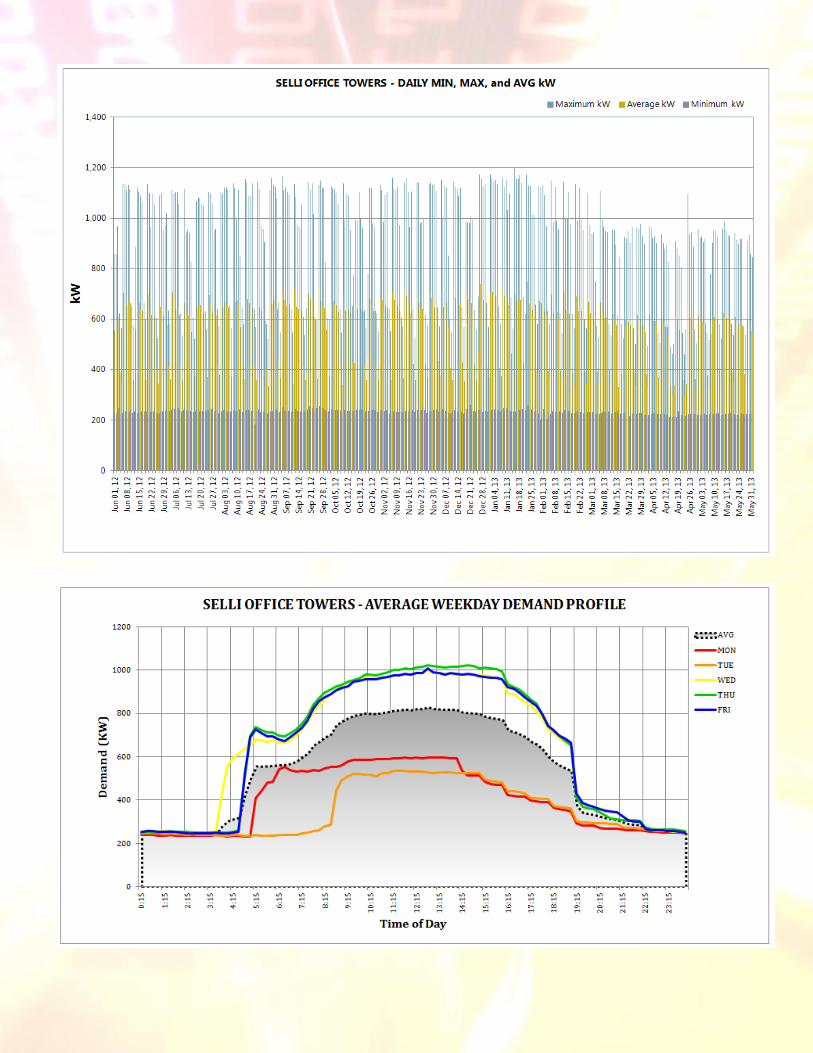
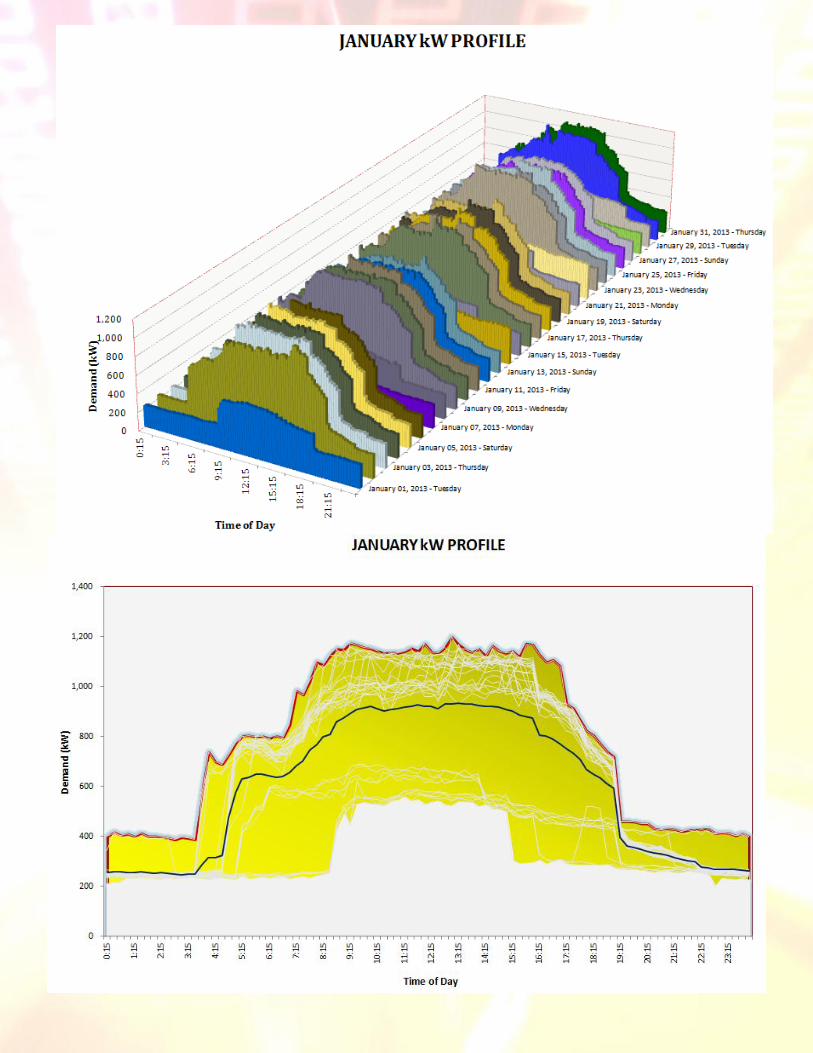
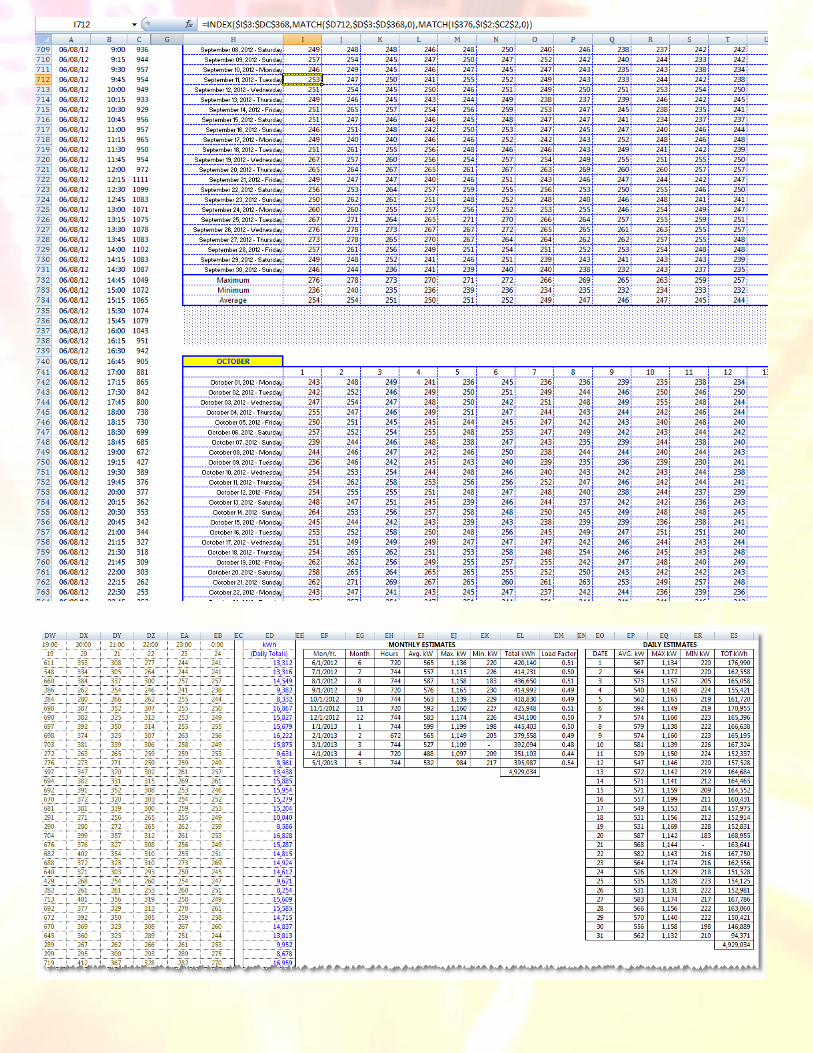
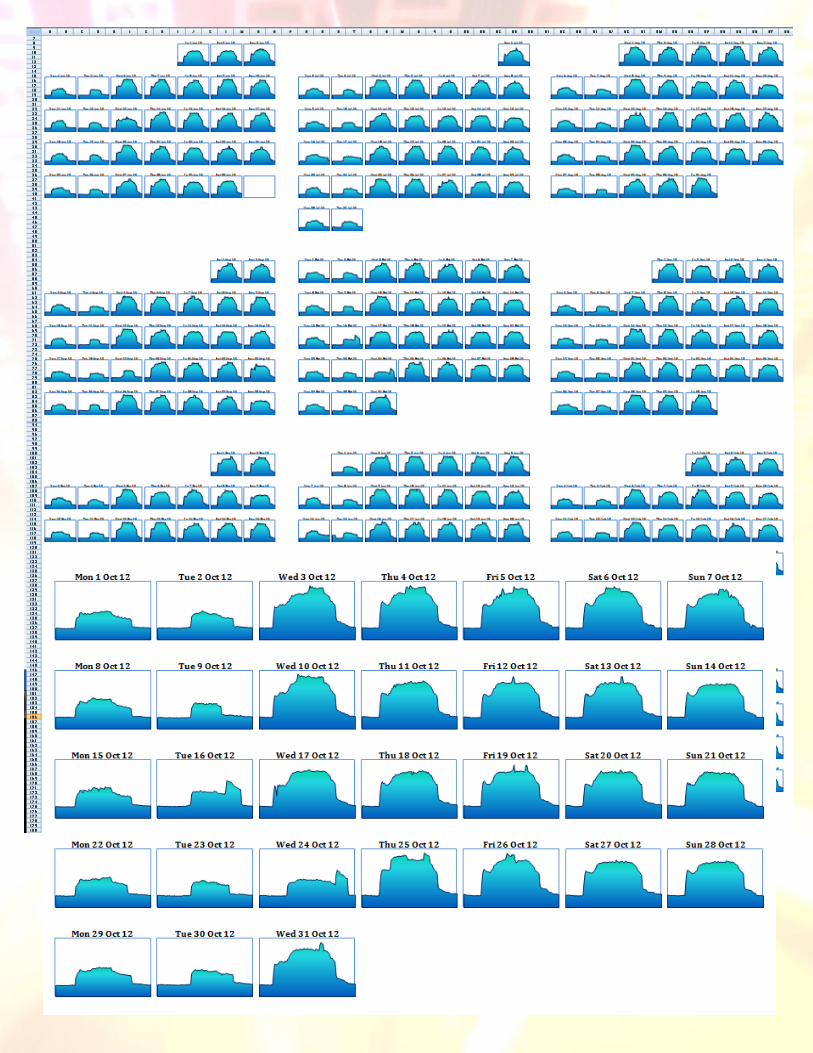
(1) Interval Data Analysis Tool (IDAT): An Excel based tool that is used to prepare, perform quality
control and transform the raw data and generate a variety of tables, graphs, and charts including:
Heat Maps
Load Duration Curves
Daily, Weekly, Monthly and Annual Load Profiles
3D Profiles
Calendar Charts
The tool is entirely written using Excel functions providing the much needed flexibility – it supports
additional analysis and users can modify or enhance the worksheets to suit their requirement.
(2) Load Curtailment Calculation Tool (LRCT): An Excel based tool that will help calculate, document,
and summarize load curtailment measures identified during a DR scoping audit.
Visit http://www.eedminc.com/loadmgmtcourse to enroll!
End-to-end coverage of
Interval Data Analysis

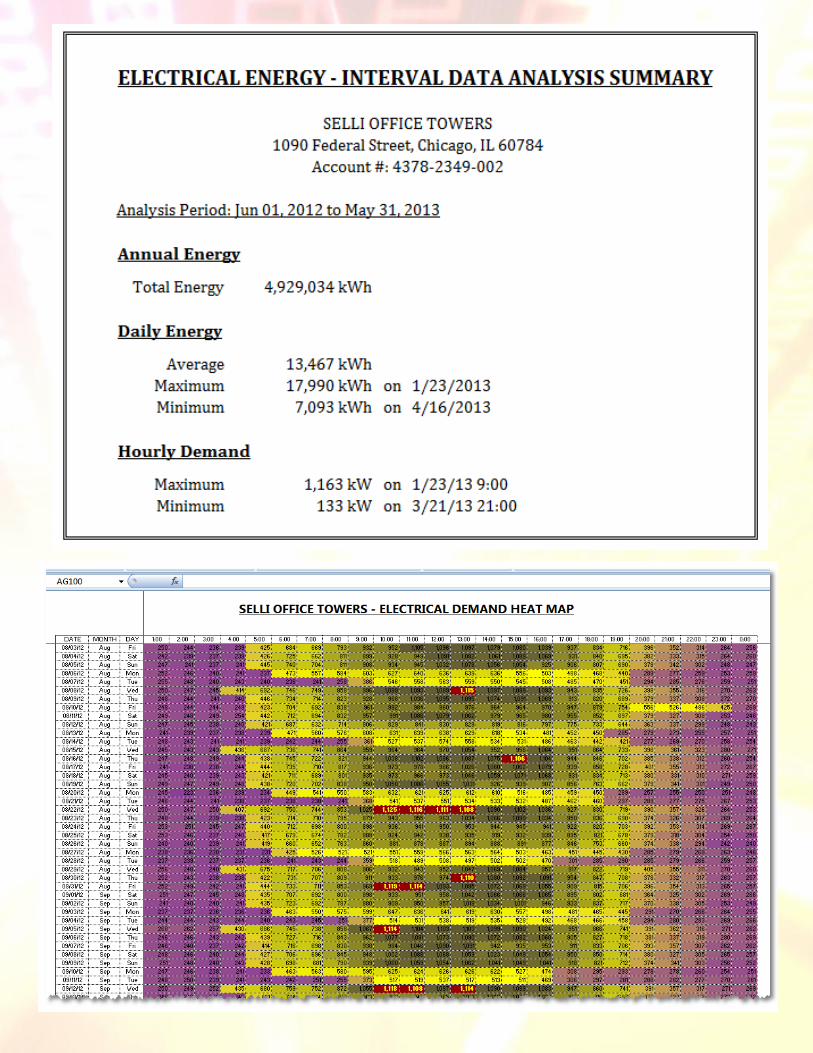
SAMPLE CHARTS AND TABLES CREATED BY IDAT
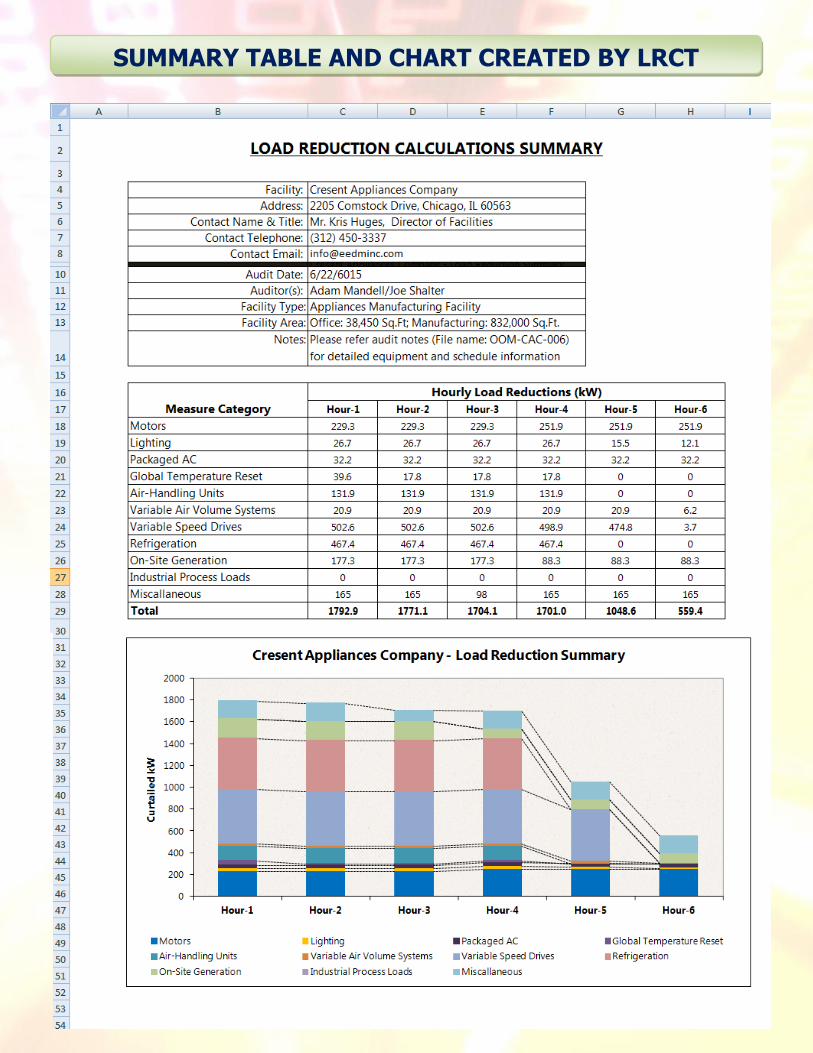
SUMMARY TABLE AND CHART CREATED BY LRCT