Embed Size (px)
Citation preview
ADVANCED EXCEL FOR ENERGY ADVANCED EXCEL FOR ENERGY ADVANCED EXCEL FOR ENERGY ADVANCED EXCEL FOR ENERGY
EFFICIENCY PROFESSIONALSEFFICIENCY PROFESSIONALS
2014 -EEDM, Inc.
EFFICIENCY PROFESSIONALSEFFICIENCY PROFESSIONALS
AEE NORTHERN OHIO CHAPTERAEE NORTHERN OHIO CHAPTER
© 2014
AEE NORTHERN OHIO CHAPTERAEE NORTHERN OHIO CHAPTER11/14/201411/14/2014
AGENDAAGENDA
� About EEDM, Inc.� About EEDM, Inc.
� Excel’s use in Energy Engineering� Excel’s use in Energy Engineering
� Excel Formulas and Functions
� Interval Data Analysis (IDA) Basics� Interval Data Analysis (IDA) Basics
� IDA Analysis using Microsoft Excel ®
2© 2014 - EEDM, Inc.
EEDM, Inc.EEDM, Inc.
� Energy Efficiency & Demand Management
� Training
� Consulting� Consulting
� Implementation Assistance
� Training in Advanced Microsoft Excel® (on-line and classroom)� Training in Advanced Microsoft Excel (on-line and classroom)
� Energy Efficiency and Demand Side Management (classroom)
� Relevant or minimal theory; “cut to the chase”
� Flexible tools� Flexible tools
� Trained people from diverse organizations
� Austin Energy, London Hydro, FP&L� Austin Energy, London Hydro, FP&L
� Michaels Energy, Research into Action, Energy Control, Inc.
� Burns and McDonnell, CB Richard Ellis, EnerNOC
3© 2014 - EEDM, Inc.
WHY EXCEL?WHY EXCEL?
� CALCULATIONS/WHAT-IF ANALYSIS
� Complex calculations and “What–If” analysis
� Many built-in functions + custom functions� Many built-in functions + custom functions
� CHARTING
� Variety of charts – Bar, line, pie, etc.� Variety of charts – Bar, line, pie, etc.
� Custom formatting and dashboards
� DATA ANALYSIS/DATABASE� DATA ANALYSIS/DATABASE
� Sorting, filtering and connecting to external data
� OTHER� OTHER
� Seamless integration with other office applications
� Collaborative environment – leave comments, call boxes, etc.
4© 2014 - EEDM, Inc.
FUNCTIONS IN EXCELFUNCTIONS IN EXCEL
� Required to take advantage of Excel’s power
� Opens door for creative data analysis and
manipulationmanipulation
� Excel 2013 has over 450 functions
� Relevancy to Energy Engineering
� Proficient in ~ 100 functions
� Combine functions for greater potential
� User defined functions (UDF)
� Steam properties
� Psychrometric properties
� Requires knowledge of VB� Requires knowledge of VB
5© 2014 - EEDM, Inc.
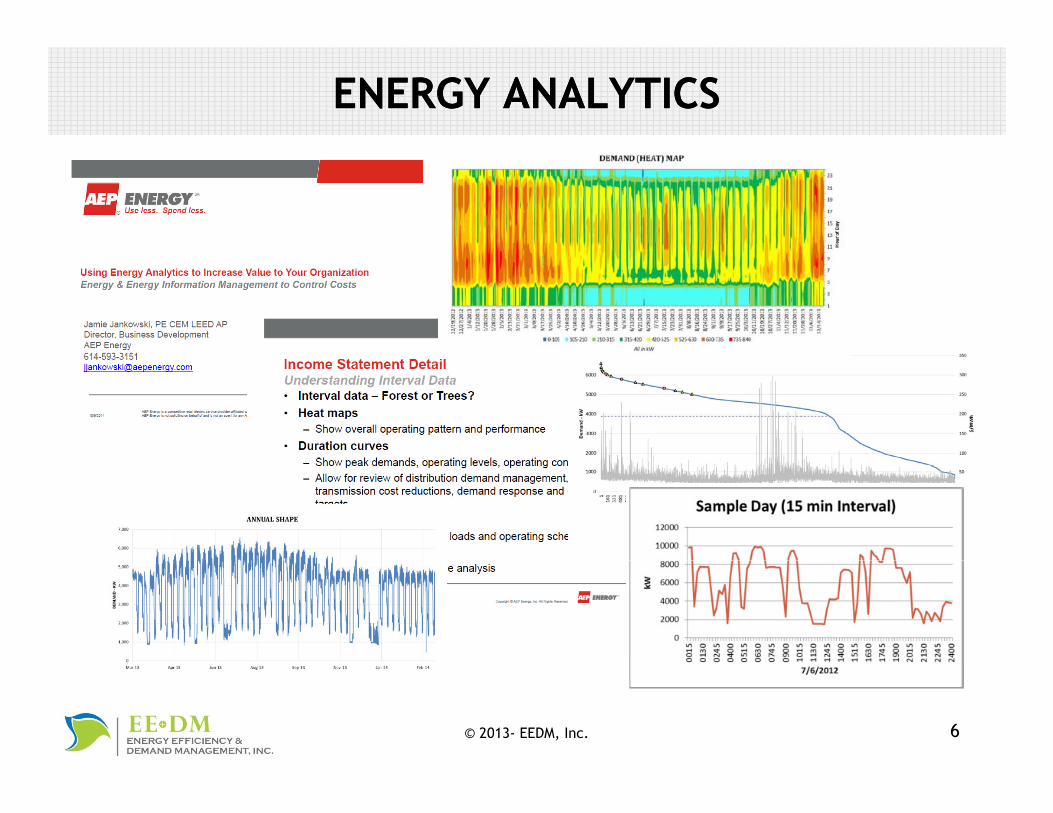
ENERGY ANALYTICSENERGY ANALYTICS
6© 2013- EEDM, Inc.
INTERVAL DATA ANALYSIS (IDA)INTERVAL DATA ANALYSIS (IDA)
� Load profiling� Analysis carried on yearly, monthly, weekly, and daily
basisbasis
� Identify problems that impact energy consumption
� Peak and base load analysis� Peak and base load analysis� Size, timing, and duration of peak
� Relationship between max and min load� Relationship between max and min load
� Identify demand reduction potential
� Load duration curves and heat maps� Load duration curves and heat maps� Magnitude of peak loads
� Clustering of peak timings
7© 2014 - EEDM, Inc.
� Clustering of peak timings
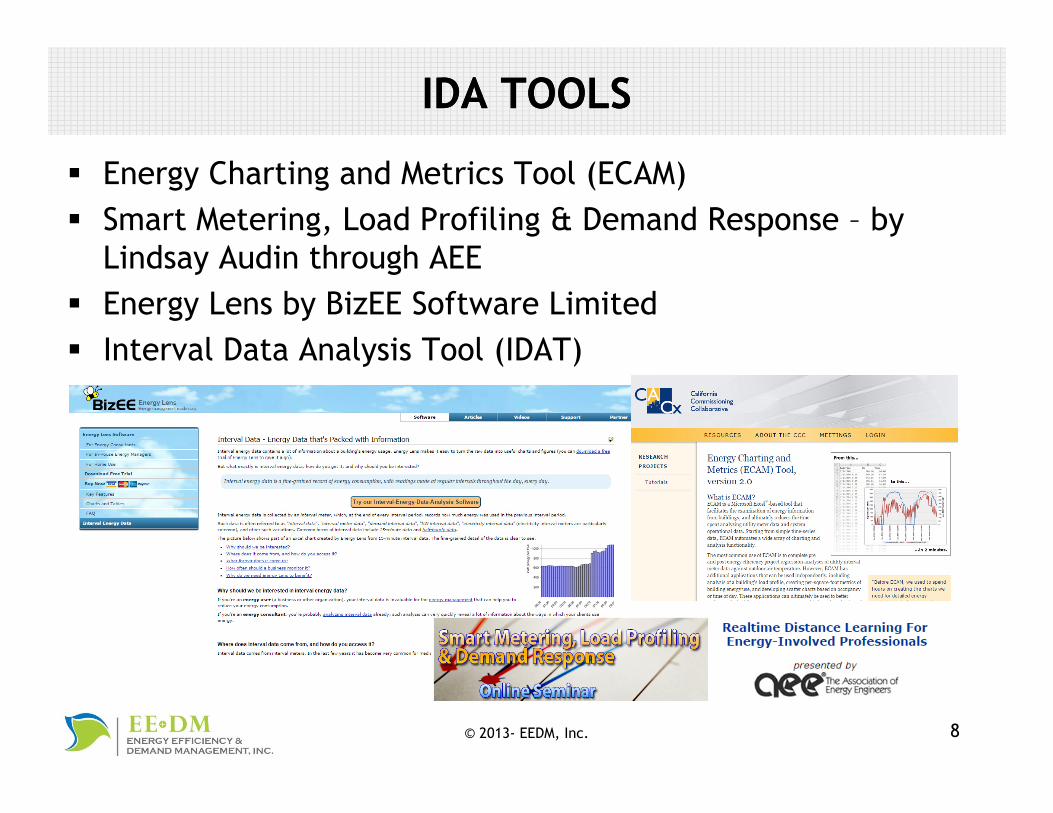
IDA TOOLSIDA TOOLS
� Energy Charting and Metrics Tool (ECAM)
� Smart Metering, Load Profiling & Demand Response – by
Lindsay Audin through AEELindsay Audin through AEE
� Energy Lens by BizEE Software Limited
� Interval Data Analysis Tool (IDAT) � Interval Data Analysis Tool (IDAT)
8© 2013- EEDM, Inc.
GETTING STARTED WITH IDAGETTING STARTED WITH IDA
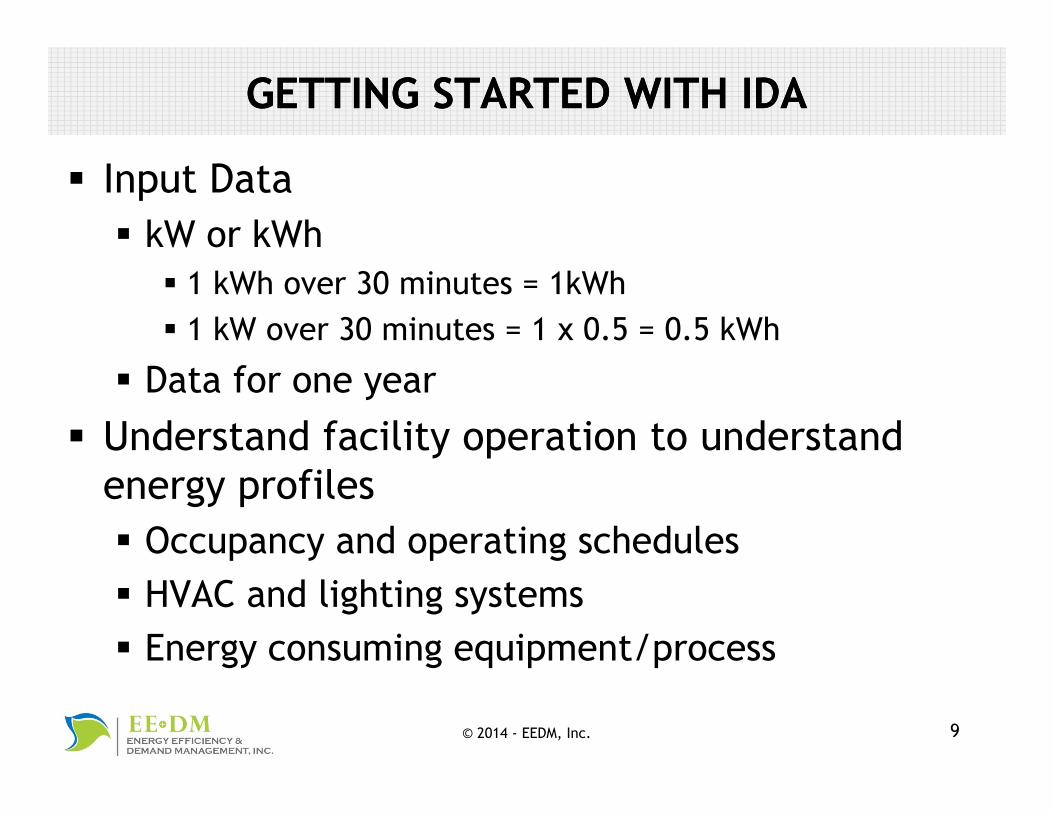
� Input Data
� kW or kWh� kW or kWh
� 1 kWh over 30 minutes = 1kWh
� 1 kW over 30 minutes = 1 x 0.5 = 0.5 kWh
� Data for one year
� Understand facility operation to understand � Understand facility operation to understand
energy profiles
� Occupancy and operating schedules� Occupancy and operating schedules
� HVAC and lighting systems
� Energy consuming equipment/process� Energy consuming equipment/process
9© 2014 - EEDM, Inc.
ANALYZING IDA OUTPUTANALYZING IDA OUTPUT
� Derive key characteristics and answer key questions
� Magnitude of energy use and load demand
� Energy use profile
� Weather impact� Weather impact
� Building operating characteristics
� Base load and variable load� Base load and variable load
� Load spikes
10© 2014 - EEDM, Inc.
LOAD DURATION CURVELOAD DURATION CURVE
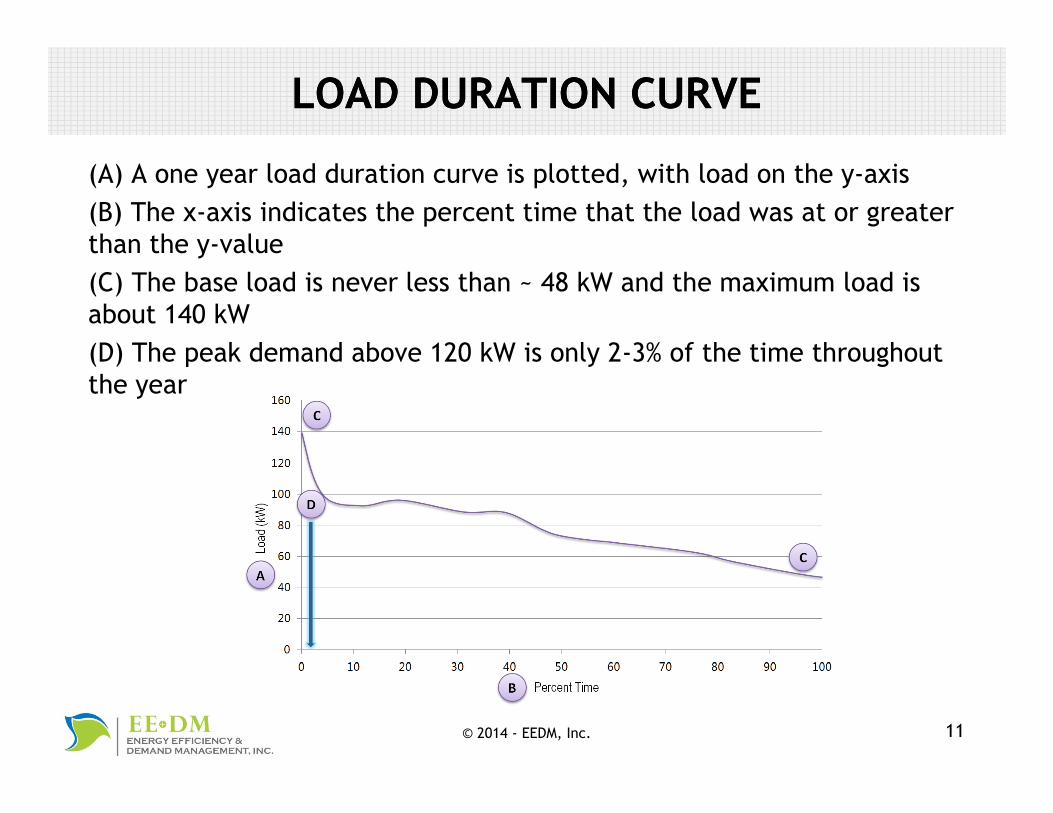
(A) A one year load duration curve is plotted, with load on the y-axis
(B) The x-axis indicates the percent time that the load was at or greater
than the y-valuethan the y-value
(C) The base load is never less than ~ 48 kW and the maximum load is
about 140 kW
(D) The peak demand above 120 kW is only 2-3% of the time throughout (D) The peak demand above 120 kW is only 2-3% of the time throughout
the year
11© 2014 - EEDM, Inc.
WHAT TO LOOK FOR IN INTERVAL DATA?WHAT TO LOOK FOR IN INTERVAL DATA?
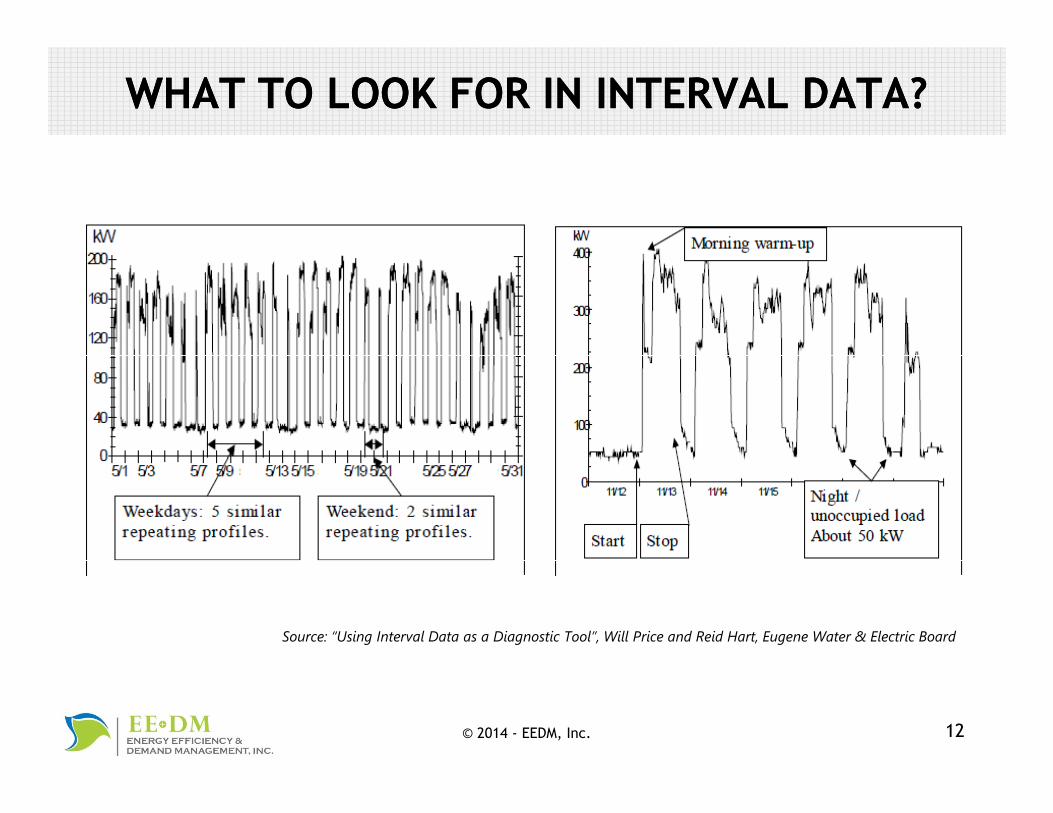
Source: “Using Interval Data as a Diagnostic Tool”, Will Price and Reid Hart, Eugene Water & Electric Board
12© 2014 - EEDM, Inc.
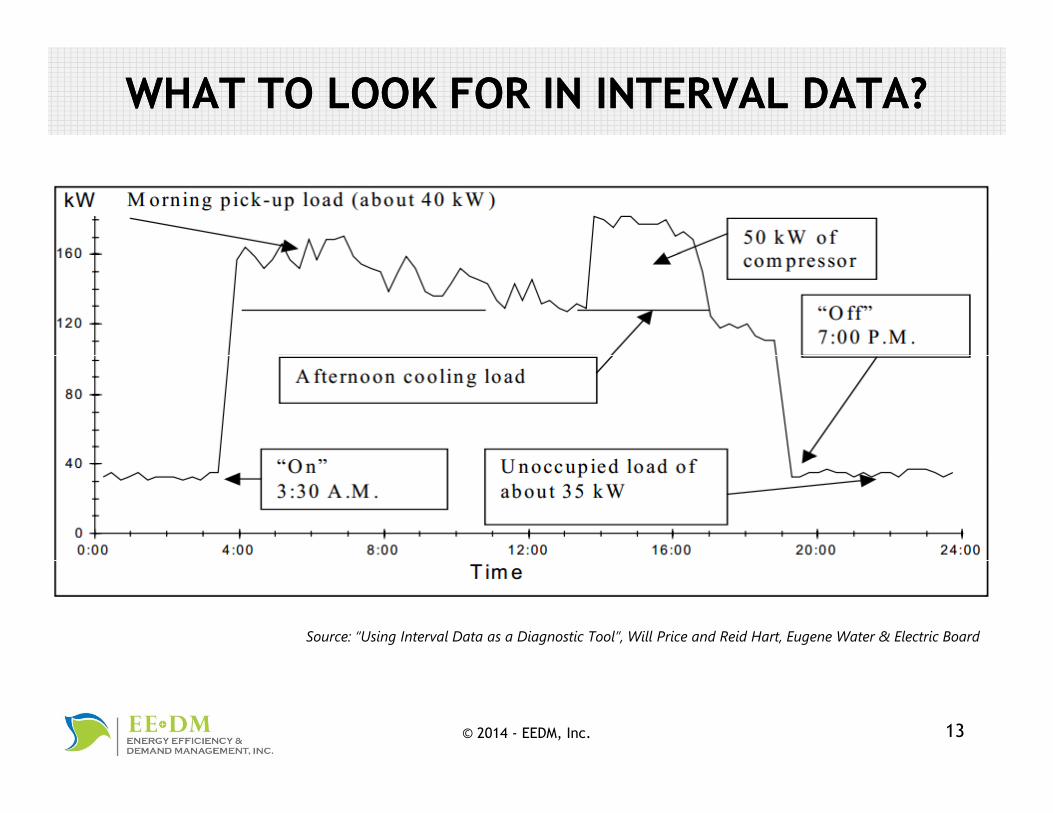
WHAT TO LOOK FOR IN INTERVAL DATA?WHAT TO LOOK FOR IN INTERVAL DATA?
Source: “Using Interval Data as a Diagnostic Tool”, Will Price and Reid Hart, Eugene Water & Electric Board
13© 2014 - EEDM, Inc.
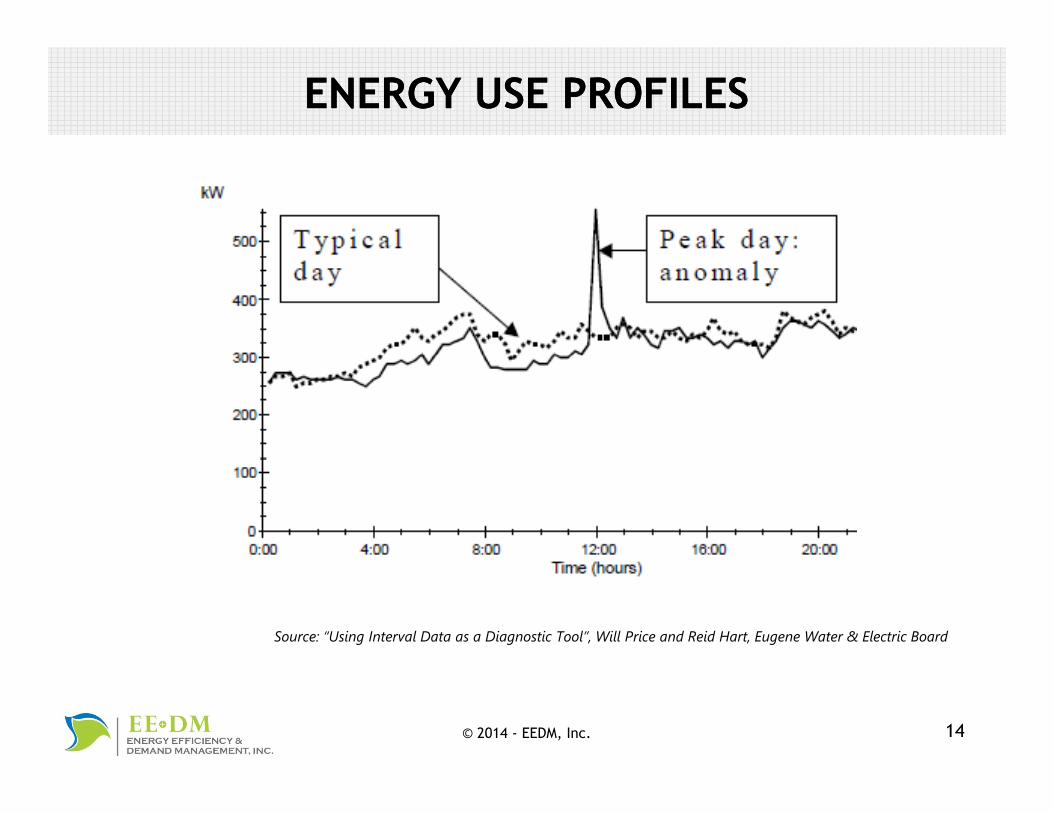
ENERGY USE PROFILESENERGY USE PROFILES
Source: “Using Interval Data as a Diagnostic Tool”, Will Price and Reid Hart, Eugene Water & Electric Board
14© 2014 - EEDM, Inc.
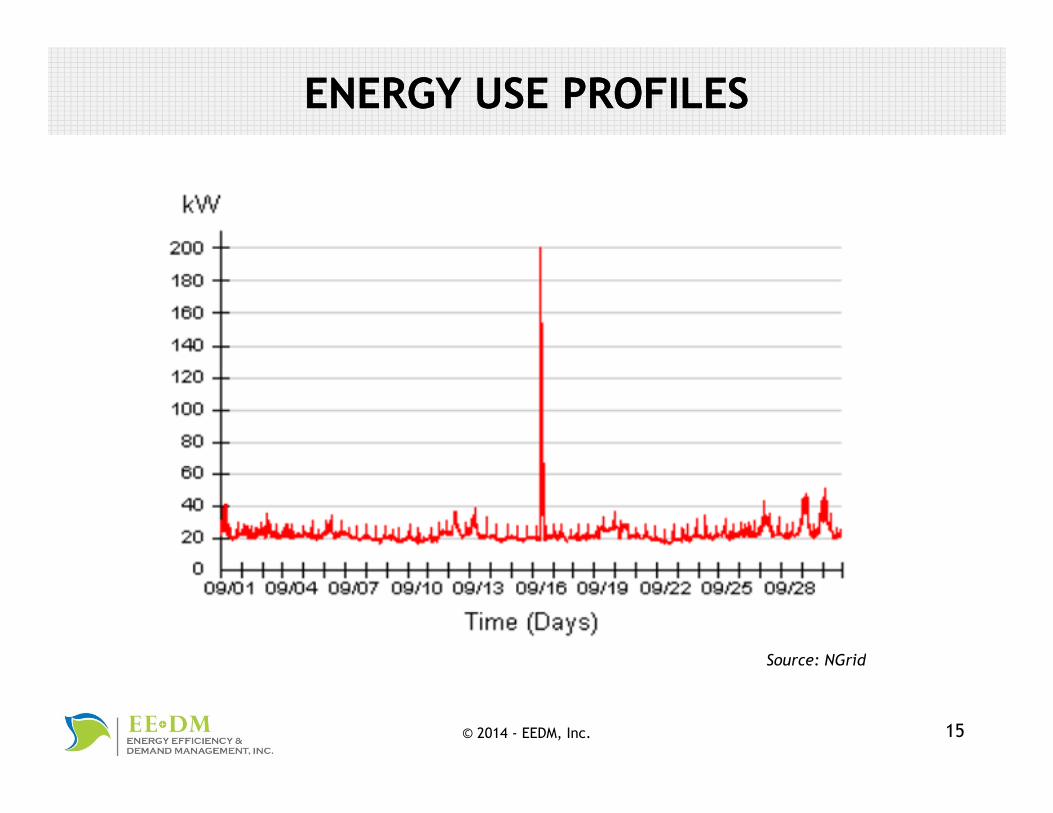
ENERGY USE PROFILESENERGY USE PROFILES
Source: NGrid
15© 2014 - EEDM, Inc.
Source: NGrid
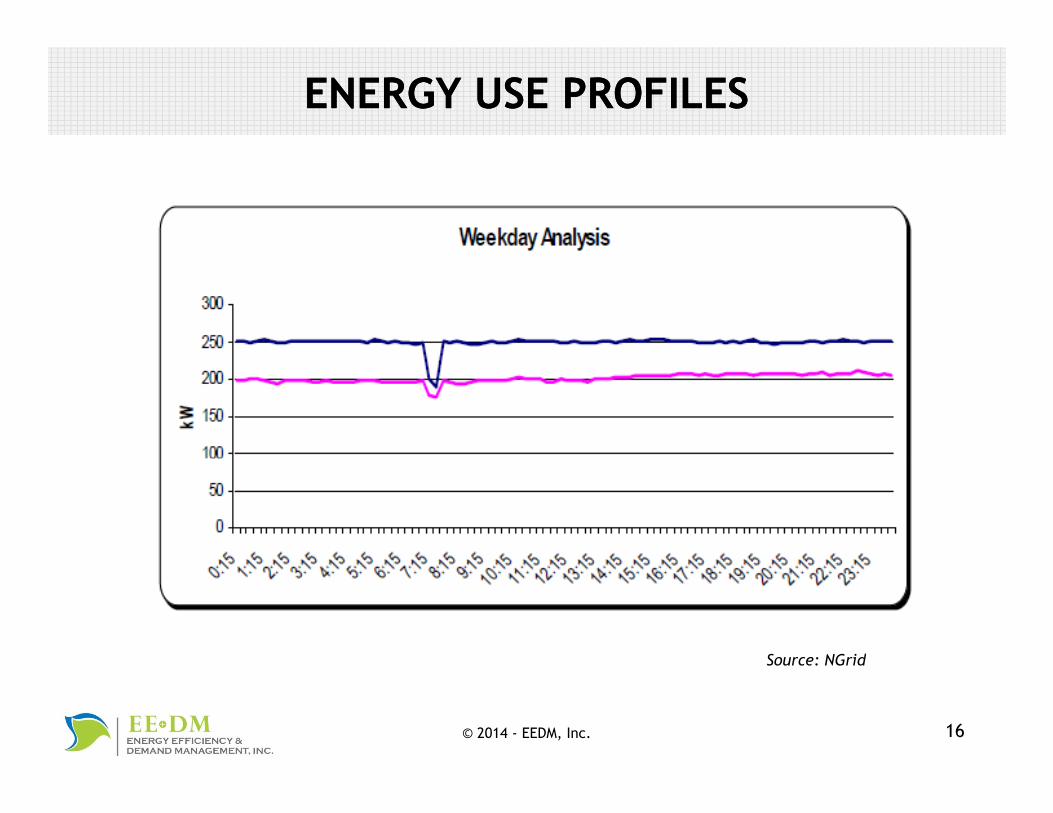
ENERGY USE PROFILESENERGY USE PROFILES
Source: NGrid
16© 2014 - EEDM, Inc.
Source: NGrid
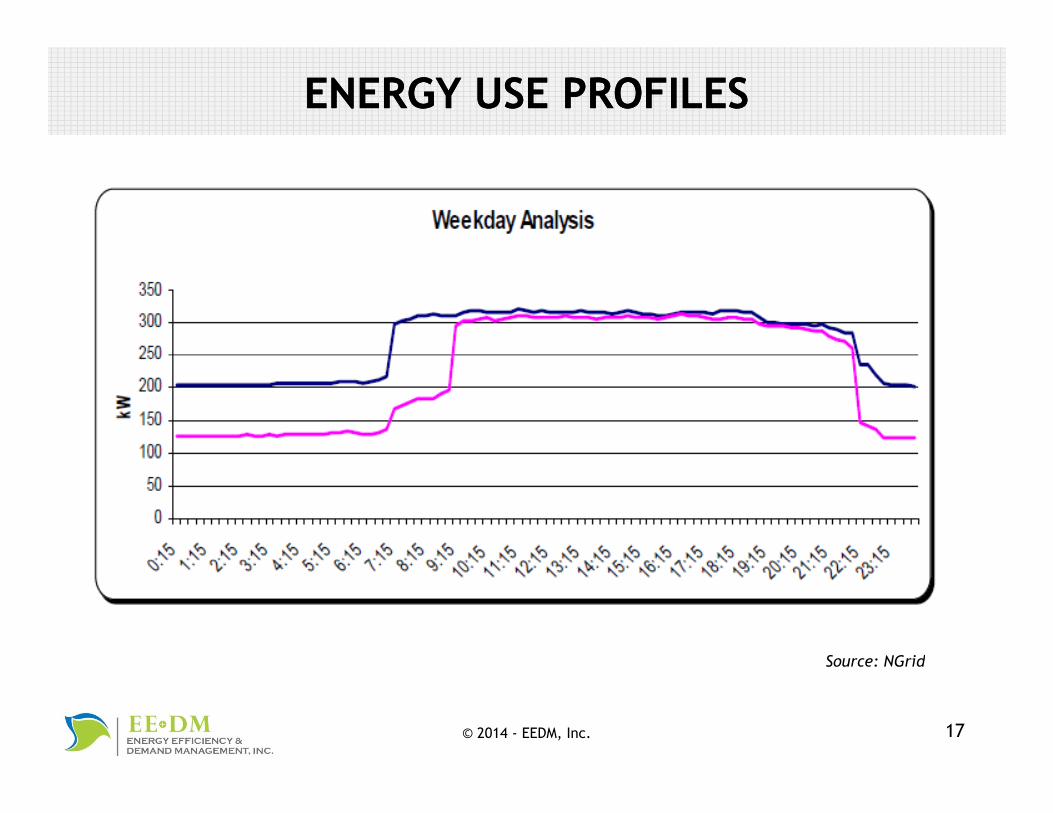
ENERGY USE PROFILESENERGY USE PROFILES
Source: NGrid
17© 2014 - EEDM, Inc.
Source: NGrid
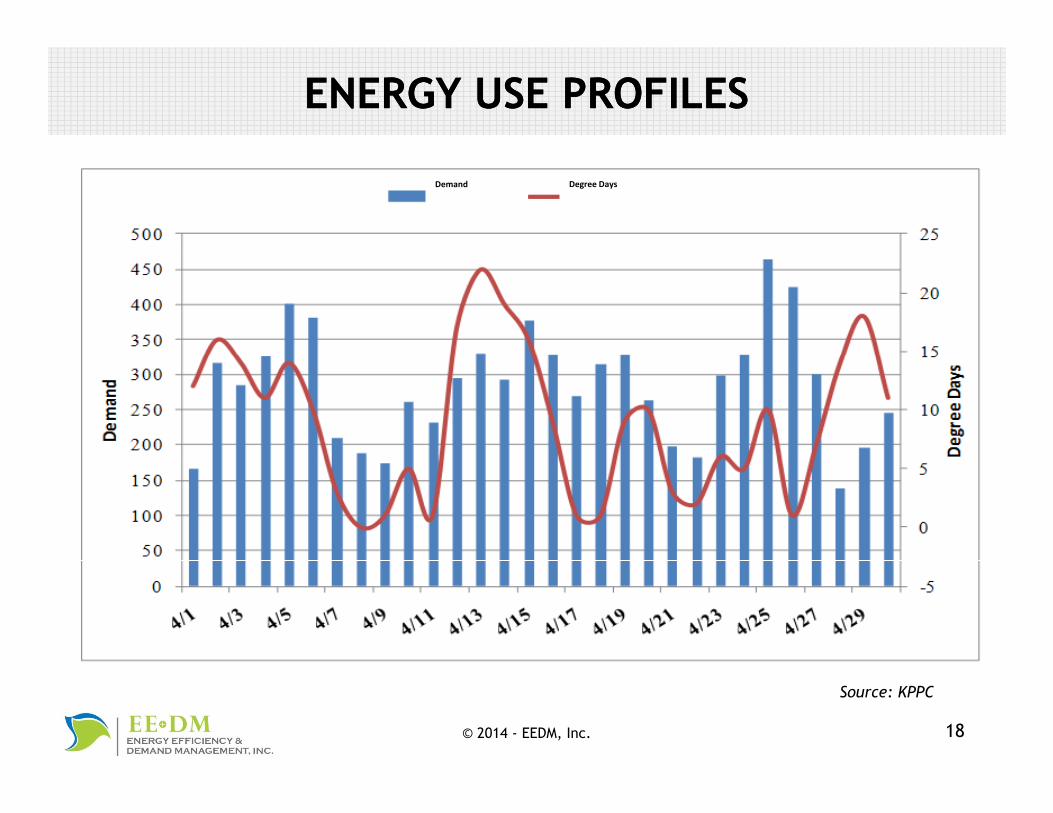
ENERGY USE PROFILESENERGY USE PROFILES
Degree DaysDemand
18© 2014 - EEDM, Inc.
Source: KPPC
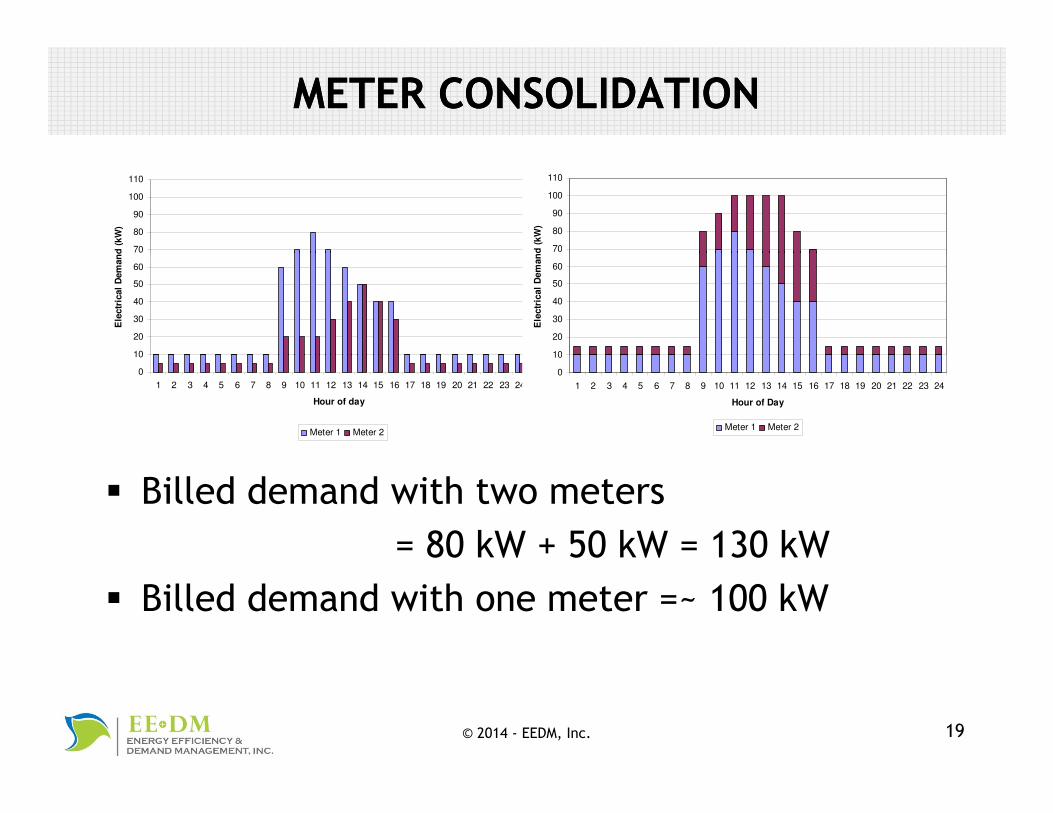
METER CONSOLIDATIONMETER CONSOLIDATION
70
80
90
100
110
Ele
ctr
ical
Dem
an
d (
kW
)
70
80
90
100
110
Ele
ctr
ical
Dem
an
d (
kW
)
10
20
30
40
50
60
70
Ele
ctr
ical
Dem
an
d (
kW
)
10
20
30
40
50
60
70
Ele
ctr
ical
Dem
an
d (
kW
)
0
10
1 2 3 4 5 6 7 8 9 10 11 12 13 14 15 16 17 18 19 20 21 22 23 24
Hour of day
Meter 1 Meter 2
0
10
1 2 3 4 5 6 7 8 9 10 11 12 13 14 15 16 17 18 19 20 21 22 23 24
Hour of Day
Meter 1 Meter 2
� Billed demand with two meters
= 80 kW + 50 kW = 130 kW = 80 kW + 50 kW = 130 kW
� Billed demand with one meter =~ 100 kW
19© 2014 - EEDM, Inc.
DISCLAIMERSDISCLAIMERS
The information contained in this presentation has been obtained from sources which Energy Efficiency The information contained in this presentation has been obtained from sources which Energy Efficiency and Demand Management, Inc. (EE & DM) believes to be reliable. We do not represent or warrant as to its accuracy or completeness. All representations and estimates included in this presentation constitute EE & DM’s judgment as of the date of the presentation and may be subject to change without notice. This presentation has been prepared solely for informational purposes. EE & DM shall not be responsible for any reliance upon any information, opinions, or statements contained herein or for any omission or error presentation has been prepared solely for informational purposes. EE & DM shall not be responsible for any reliance upon any information, opinions, or statements contained herein or for any omission or error of fact. This presentation shall not be reproduced (in whole or in part) to any other person without the prior written approval of EE & DM. Copyright 2014.
By receiving this information and any additional data, you acknowledge and agree that:
1) you are receiving no guaranty, representation or warranty of any kind from EE & DM;
2) EE & DM is not acting as your consultant or advisor for any purpose, and you will not construe or rely upon any information provided or statements made by EE & DM, including without limitation rely upon any information provided or statements made by EE & DM, including without limitation as to the advantages or disadvantages of any specific product or service, predictions about future energy markets, or any other statements, information or data, as advice or representations of any sort;
3) you are making your own decisions based solely upon your own analysis and the advice of your own advisors, if any, and are not relying on EE & DM in any way in making any decision or taking
3) you are making your own decisions based solely upon your own analysis and the advice of your own advisors, if any, and are not relying on EE & DM in any way in making any decision or taking any other action in response to the information and data or statements contained herein; and
4) some of the information and data being provided to you is proprietary and may be confidential and you agree to maintain such information and data in strict confidence
20© 2014 - EEDM, Inc.
CONTACT INFORMATIONCONTACT INFORMATION


![(5) C n & Excel Excel 7 v) Excel Excel 7 )Þ77 Excel Excel ... · (5) C n & Excel Excel 7 v) Excel Excel 7 )Þ77 Excel Excel Excel 3 97 l) 70 1900 r-kž 1937 (filllß)_] 136.8cm 136.8cm](https://img.pdfslide.us/doc/110x75/5f71a890b98d435cfa116d55/5-c-n-excel-excel-7-v-excel-excel-7-77-excel-excel-5-c-n-.jpg)