Embed Size (px)
Citation preview
Advance Report of Final Mortality Statistics, 1994by Gopal K. Singh, Ph.D.; Kenneth D. Kochanek, M.A.; andMarian F. MacDorman, Ph.D., Division of Vital Statistics
o
n
s
f
ss
o
t
b
asneisft
n
tts5
eing
t
-
.
Vol. 45, No. 3, Supplement + September 30, 1996
Final Data From the CENTERS FOR DISEASE CONTROLAND PREVENTION/National Center for Health Statistics
Abstract
Objectives—This report presents 199data on U.S. deaths and death rates accing to such demographic and mediccharacteristics as age, sex, race, Hispaorigin, marital status, educational attaiment, State of residence, autopsy statand cause of death. Trends and patterngeneral mortality, life expectancy, aninfant and maternal mortality are alsdescribed.
Methods—Descriptive tabulations odata reported on the death certificates2,278,994 deaths are presented. Chanbetween 1993 and 1994 in numbersdeaths and death rates and differencedeath rates across demographic group1994 are tested for statistical significancA decomposition procedure is usedidentify causes of death accounting fchanges in age-specific death rates alife expectancy.
This report was prepared in the Division of VJeffrey D. Maurer of the Mortality Statistics BrThomas D. Dunn of the Statistical ResourcesBranch provided computer programming suppvital statistics offices regarding collection of thetypeset by Jacqueline M. Davis of the Publica
U.S. DEPA
4rd-alnic-us,indo
ofgesofinine.tornd
Results—The age-adjusted death rafor the total population in 1994 decreaseand life expectancy at birth increased0.2 years to 75.7 years. The improvemein life expectancy was primarily due todecrease in mortality from heart diseacancer, pneumonia and influenza, ahomicide, although offsetting the positivimprovements were increases in mortalfrom Human immunodeficiency viru(HIV) infection and diabetes. The list othe 15 leading causes of death wassame as in the previous year, but the raof some causes changed. Thus, Chroliver disease and cirrhosis replaced homcide as the 10th leading cause of deaand Alzheimer’s disease moved past aerosclerosis as the 14th leading cauMortality declined for those under 1years of age and those at ages 55 yeand older but increased for those ag35–44 years; causes of death contribut
Acknowledgments
ital Statistics under the general direction of Harry Manch and Van L. Parsons of the Office of ResearchBranch provided statistical tables and content rev
ort. Staff of the Registration Methods Branch and thedeath certificate data on which this report is basedtions Branch, Division of Data Services.
RTMENT OF HEALTH AND HUMAN SEPublic Health Service
Centers for Disease Control and PreventionNational Center for Health Statistics
ed,ynt
e,d
ty
henkici-h,h-e.
arsd
to this increase were HIV infection andviral hepatitis. Mortality declined for eachof the major race and sex groups. Infanmortality rate declined by 4.8 percent to arecord low of 8.0 infant deaths per 1,000live births in 1994. Neonatal and postneo-natal mortality rates also declined forwhite and black infants. The causes contributing the most to the improvement inthe overall infant mortality were suddeninfant death syndrome and respiratorydistress syndrome.
Conclusions—The overall improve-ments in general mortality and life expect-ancy suggest a resumption of the long-term downward trend in U.S. mortality,which was briefly interrupted in 1993 byan increase in mortality associated withthe influenza epidemics. The decline inU.S. infant mortality continues the steadydownward trend of the past four decades
. Rosenberg, Chief of the Mortality Statistics Branch.and Methodology contributed to the ‘‘Technical notes.’’iew. Charles E. Royer of the Systems and ProgrammingTechnical Services Branch provided consultation to State. This report was edited by Patricia Keaton-Williams and
RVICES
CENTERS FOR DISEASE CONTROLAND PREVENTION
soh
l
o
r3r
i
e
ss
a
h
eit
m
fr
toev.9
n
f
4
e
g
g
t
t
e
le
-
n
n
een’
n
e
e
od
l
d
rs-
s
esl
u-
at
-4,
eng4nger.el44tse-ed
rs.
a-
tei-ntc-ted
all-r.l
n
t
2 Monthly Vital Statistics Report + Vol. 45, No. 3(S) + September 30, 1996
Highlights
In 1994 a record 2,278,994 deathwere registered in the United State10,441 more than the previous high2,268,553 deaths recorded in 1993. Tcrude death rate for 1994 was 875.4deaths per 100,000 population, slightlower than the 1993 rate of 880.0. Thage-adjusted death rate, which elimi-nates the distorting effects of the agingthe population, was 507.4 per 100,00U.S. standard million population, 1.1 pecent lower than the 1993 rate of 513.and 0.6 percent higher than the recolow of 504.5 in 1992.
The overall decline in mortalitybetween 1993 and 1994 representsresumption of the long-term down-ward mortality trend , which was inter-rupted by a substantial increasemortality associated with the influenzaepidemics of 1992–93. The age-adjustrate decreased between 1993 and 19for all four major race and sex groupWhite males, white females, black maleand black females.
By agedeath rates decreased substtially for those under 15 years of age anthose at ages 55 years and older. Tdeath rate increased by 1.4 percebetween 1993 and 1994 for those ag35–44 years. The causes of death contruting most to the increase in the dearate for those aged 35–44 years weHIV infection andviral hepatitis .
In 1994 life expectancyat birth was75.7 years, an increase of 0.2 years copared with life expectancy in 1993, buslightly lower than the record high o75.8 years in 1992. Women currently aexpected to outlive men by an average6.6 years, and white persons are expecto outlive black persons by an average7.0 years. Among the four major race-sgroups, white females continue to hathe highest life expectancy at birth (79years), followed by black females (73.years), white males (73.3 years), and blamales (64.9 years). The gain in life expecancy of 0.2 years for the total populatiocan be explained primarily by decreasindeath rates forheart disease, cancer,pneumonia and influenza, and homi-cide, despite increases in death ratesHIV infection and diabetes.
The ranking of theleading causesofdeath for the total population in 199
s,fe
ye
f0-,d
a
n
d94:,
n-dentdb-hre
-t
eofedfxe6
ckt-
g
or
changed as follows:Chronic liver dis-ease and cirrhosis, the 11th leading causof death in 1993, replacedhomicide asthe 10th leading cause of death in 199Alzheimer’s diseasereplacedatheroscle-rosisas the 14th leading cause of death1994. However, the first nine leadincauses of death in 1994—heart disease,cancer, stroke, Chronic obstructive pul-monary diseases and allied conditions(COPD), accidents, pneumonia andinfluenza, diabetes, HIV infection, andsuicide—remained the same leadincauses as those in 1993 with identicrankings. These nine causes accounfor 80 percent of all deaths in 1994.
Age-adjusted death ratesfor eightof the leading causes of death for the topopulation declined between 1993 and1994, with largest percentage declinoccurring fornephritis, atherosclerosis,pneumonia and influenza, homicide,and heart disease. Mortality for all otheraccidents, a component of the overaaccidents category, declined by 1.4 pcent between 1993 and 1994. In additiomortality from cancer, the second leading cause of death, showed a small bsignificant decrease.
Age-adjusted death rates increasedbetween 1993 and 1994 for three leadicauses of death:HIV infection, diabetes,and Alzheimer’s disease. The age-adjusted death rate for HIV infectioincreased by 11.6 percent between 19and 1994, higher than the rate of increain the previous year. The age-adjustdeath rate also increased by 8.7 percfor Alzheimer’s disease and by 4 percefor diabetes. The increase in Alzheimerdisease mortality likely reflects improvements in reporting and diagnosis of thdisease rather than increases in prevale
Mortality from drug-induced andalcohol-induced causesincreased signifi-cantly between 1993 and 1994. Howevthe age-adjusted death rate forfirearminjuries decreased by 3 percent betwe1993 and 1994.
In terms of mortalitysex differen-tials, the age-adjusted death rate formaleswas 70 percent higher than that ffemalesfor all causes of death combineFor each of the 15 leading causesdeath, except Alzheimer’s disease, mamortality was higher than female mortaity. The greatest sex differential was foHIV infection, where the age-adjuste
4.
in
aled
al
s
lr-n,
ut
g
93sedntts-ece.
r,
n
r.ofle-r
rate for males was 5.5 times that fofemales. The smallest sex differential wafor Alzheimer’s disease, with a male-tofemale ratio of about 1.0.
In 1994mortality levels varied byrace. Overall, age-adjusted death ratefor the black population exceeded thoseof thewhite population by about 61 per-cent. Rates for the black population weralso higher for most of the leading causeof death. The largest race differentiacontinued to be forhomicide, for whichthe age-adjusted rate for the black poplation was 6.6 times that of the whitepopulation. The three leading causes thhad lower mortality rates for the blackpopulation wereCOPD, suicide, andAlzheimer’s disease.
Leading causes of death differedby age. Overall, accidents were the leading cause of death for age groups 1–5–14, and 15–24 years. HIV infectionwas the leading cause of death for thosaged 25–44 years. Cancer was the leadicause of death for those aged 45–6years, while heart disease was the leadicause for those aged 65 years and oldThe leading cause of death was the samfor the white and black populations for alage groups except 15–24 years and 25–years. For the white population, accidenwere the leading cause for these two aggroups. For the black population, homicide was the leading cause for those ag15–24 years, while HIV infection was theleading cause for those aged 25–44 yea
The infant mortality rate (8.0 infantdeaths per 1,000 live births) reachedrecord low in 1994, continuing the longterm downward trend in infant mortality.
Among theleading causes of infantdeath, the causes contributing the mosto the improvement in the 1994 rate wersudden infant death syndrome and respratory distress syndrome. Sudden infadeath syndrome decreased from the seond to the third leading cause of infandeath between 1993 and 1994. Increasinfant mortality from perinatal infections,pneumonia and influenza, and neonathemorrhage prevented the infant mortaity rate from decreasing even furtheInfant, neonatal, and postneonatamortality rates declined for white andblack infants between 1993 and 1994. I1994 the infant mortality rate for blackinfants remained at more than twice thafor white infants.
attoen
nnusdo
nu
daeipci
esoniwa,ri
s
e
-ero
h-
nila
e
sgo
eentamfsc
im
n
4aonma5
In
rin
o
sinoerndlas
an
nt
,f-eryrsd
hd474err-4et).os,ot
de485
edrs-ast).93rsn-e
e0.s14stndsersther
-d
Monthly Vital Statistics Report + Vol. 45, No. 3(S) + September 30, 1996 3
Introduction
This report, the release of nationmortality statistics for 1994, presendetailed data on deaths and death raaccording to a number of social, demgraphic, and medical characteristics. Thdata provide important information omortality patterns among Americans bsuch variables as age, sex, race, Hispaorigin, marital status, educational attaiment, State of residence, autopsy statand cause of death. Information on themortality patterns is critical in understaning shifts in the health and social statusthe U.S. population (1).
The mortality data in this report cabe used to monitor and evaluate the crent status and long-term trends in motality and in the health of the Nation anto identify segments of the U.S. popultion at greatest risk for death from spcific diseases and injuries. Differencesdeath rates among demographic grouincluding racial/ethnic groups, may reflegroup differences in factors such as soceconomic status, access to medical caand the prevalence of specific risks.
Methods
Data shown in this report are bason information from all death certificatefiled in the 50 States and the DistrictColumbia. It is believed that more tha99 percent of deaths occurring in thcountry are registered (2). Tables shoing data by State also provide informtion for Puerto Rico, the Virgin Islandsand Guam. Cause-of-death statistics psented in this report are classifiedaccordance with theNinth Revision of theInternational Classification of Disease(ICD–9). A detailed discussion of causeof-death classification is provided in th‘‘ Technical notes.’’
Mortality data on specific demographic and medical characteristics, exceducational attainment and Hispanic ogin, cover all 50 States and the DistrictColumbia. For educational attainmendata are provided for 45 States and tDistrict of Columbia. For Hispanic origin, data reported exclude Oklahombecause it does not include the Hispaorigin item on its death certificates. Detaon reporting areas for education
lses-se
yic-s,e-f
r-r-
--ns,to-re,
d
f
s--
e-n
-
pti-ft,e
aicsl
attainment and marital status are providin the ‘‘Technical notes.’’
In this report the number of deathcrude death rate, age-specific and aadjusted death rates; infant, neonatal, pneonatal, and maternal mortality ratelife expectancy; and rate ratios are usas measures of mortality. Changes betw1993 and 1994 in numbers of deaths adeath rates and differences in death raacross demographic groups in 1994tested for statistical significance. A decoposition procedure is used to identicauses of death accounting for changeage-specific death rates and life expeancy (3,4). Additional information onthese statistical methods; random vartion and relative standard error; the coputation of derived statistics and ratepopulation denominators; and the defition of terms is presented in the ‘‘Techni-cal notes.’’
Results and discussion
Deaths and death rates
In 1994 a total of 2,278,994 deathoccurred in the United States, 10,4more than in 1993 and 103,381 more thin 1992. Before 1994 the 1993 total2,268,553 deaths was the largest finumber ever recorded. Although the nuber of deaths increased between 19931994, the crude death rate for 1994, 87per 100,000 population, was 0.5 percelower than the rate of 880.0 in 1993.1992 the death rate was 852.9.
Age-adjusted death rates are costructs that show what the level of motality would be if no changes occurredthe age composition of the populatiofrom year to year. (For a discussionage-adjusted death rates, see ‘‘Technicalnotes.’’) Thus, they are better indicatorthan unadjusted death rates for showchanges in the risk of death over a periof time when the age distribution of thpopulation is changing. Also, they abetter indicators of relative risk whecomparisons of mortality are being mafor sex or race subgroups of the popution that have different age compositionThe age-adjusted death rate in 1994 w507.4 deaths per 100,000 U.S. standmillion population, 1.1 percent lower tha
d
,e-st-s;dendesre-yint-
a--s;i-
s1nfal-nd.4nt
n--
nf
gd
e
e-.asrd
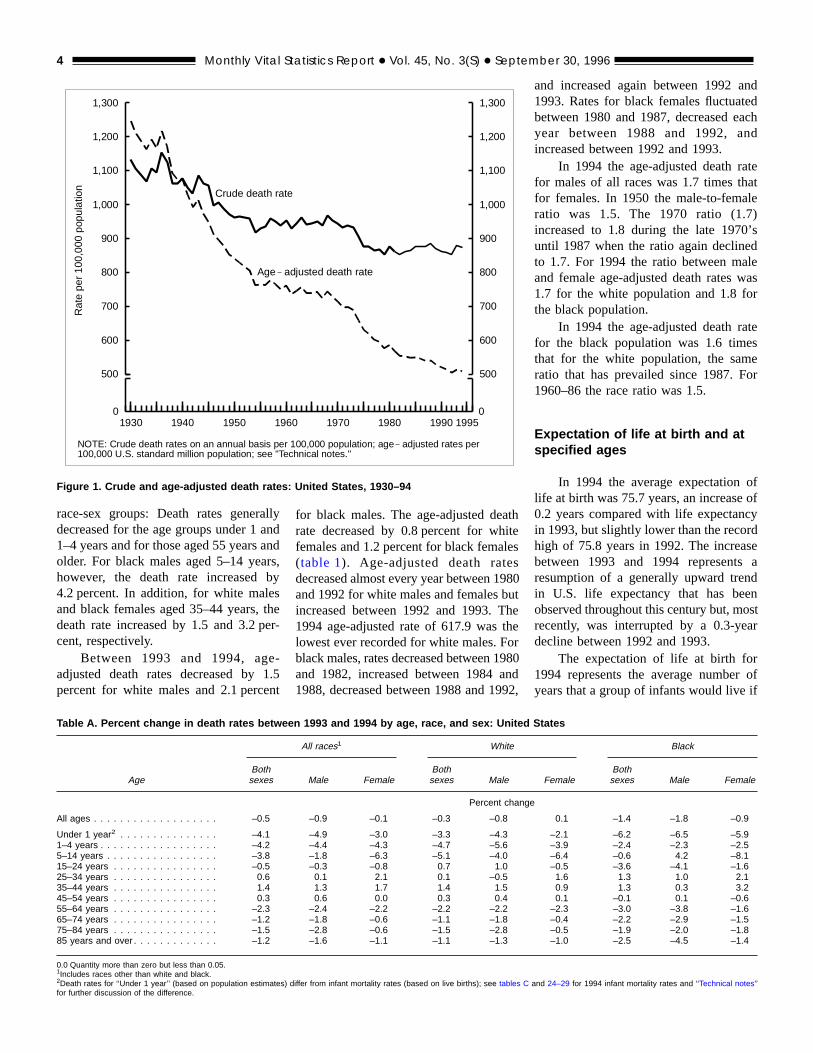
the rate of 513.3 in 1993 and 12.1 percelower than the rate of 577.0 in 1979(figure 1). The 1994 rate was, howeverslightly higher than the record low rate o504.5 in 1992. Since 1979, the ageadjusted death rate has decreased evyear except 1985, 1988, and 1993, yeawhen major influenza outbreaks increasemortality in the United States (5–9).
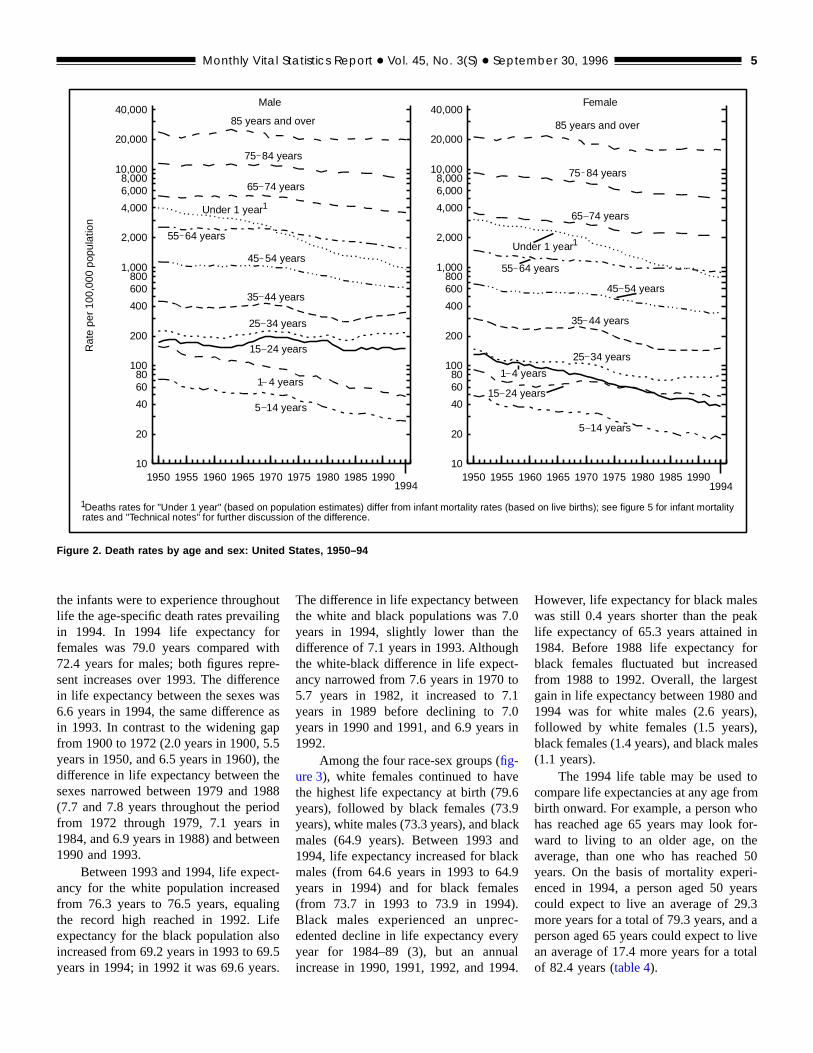
Death rates by age, sex, andrace—Between 1993 and 1994, deatrates for both sexes combined declinefor these age groups: Under 1 year, 1–years, 5–14 years, 55–64 years, 65–years, 75–84 years, and 85 years and ov(table A). The largest decrease (4.2 pecent) occurred for the age group 1–years. The death rate increased for thage group 35–44 years (1.4 percenChanges in death rates between the twyears for the age groups 15–24 year25–34 years, and 45–54 years were nstatistically significant.
The death rate for males declinebetween 1993 and 1994 for these aggroups: Under 1 year, 1–4 years, 55–6years, 65–74 years, 75–84 years, andyears and over (table A). The largestdecreases for males were for those agunder 1 year (4.9 percent) and 1–4 yea(4.4 percent). The only statistically significant increase in the male death rate wfor those aged 35–44 years (1.3 percenThe increase in death rates between 19and 1994 for males aged 35–44 yeacontinued the increase begun betwee1983 and 1984, a reversal of the downward trend for this age group since thlate 1960’s(figure 2andtable A).
For females age-specific rates havgenerally been decreasing since 195Between 1993 and 1994, death ratedeclined for these age groups: Underyear, 5–14 years, 55–64 years, 75–8years, and 85 years and over. The largedecrease in death rates between 1993 a1994 occurred for females 5–14 year(6.3 percent). The only significant increaswas for the age groups 35–44 yea(1.7 percent). Changes in female dearates between the two years for the othage groups were not statisticallysignificant.
The pattern of changes in agespecific death rates between 1993 an1994 was similar for the four major
aaarbeste
e1en
a
nddchd
tete)’sdeasr
te
er
ffy
eadnstr
off
500
600
700
800
900
1,000
1,100
1,200
1,300
1930 1940 1950 1960 1970 1980 1990 1995
Crude death rate
500
600
700
800
900
1,000
1,100
1,200
1,300
Rat
e pe
r 10
0,00
0 po
pula
tion
Age adjusted death rate
0 0
NOTE: Crude death rates on an annual basis per 100,000 population; age adjusted rates per100,000 U.S. standard million population; see "Technical notes."
Figure 1. Crude and age-adjusted death rates: United States, 1930–94
4 Monthly Vital Statistics Report + Vol. 45, No. 3(S) + September 30, 1996
race-sex groups: Death rates generdecreased for the age groups under 11–4 years and for those aged 55 yearsolder. For black males aged 5–14 yeahowever, the death rate increased4.2 percent. In addition, for white maland black females aged 35–44 years,death rate increased by 1.5 and 3.2 pcent, respectively.
Between 1993 and 1994, agadjusted death rates decreased bypercent for white males and 2.1 perc
Table A. Percent change in death rates between
AgeBothsexes
All ages . . . . . . . . . . . . . . . . . . . –0.5
Under 1 year2 . . . . . . . . . . . . . . . –4.11–4 years . . . . . . . . . . . . . . . . . . –4.25–14 years . . . . . . . . . . . . . . . . . –3.815–24 years . . . . . . . . . . . . . . . . –0.525–34 years . . . . . . . . . . . . . . . . 0.635–44 years . . . . . . . . . . . . . . . . 1.445–54 years . . . . . . . . . . . . . . . . 0.355–64 years . . . . . . . . . . . . . . . . –2.365–74 years . . . . . . . . . . . . . . . . –1.275–84 years . . . . . . . . . . . . . . . . –1.585 years and over . . . . . . . . . . . . . –1.2
0.0 Quantity more than zero but less than 0.05.1Includes races other than white and black.2Death rates for ‘‘Under 1 year’’ (based on population estimates) dfor further discussion of the difference.
llyndnds,y
her-
-.5t
for black males. The age-adjusted derate decreased by 0.8 percent for whfemales and 1.2 percent for black fema(table 1). Age-adjusted death ratedecreased almost every year between 1and 1992 for white males and females bincreased between 1992 and 1993. T1994 age-adjusted rate of 617.9 waslowest ever recorded for white males. Fblack males, rates decreased between 1and 1982, increased between 1984 a1988, decreased between 1988 and 19
1993 and 1994 by age, race, and sex: United Sta
All races1 White
Male FemaleBothsexes Male
Percent chan
–0.9 –0.1 –0.3 –0.8
–4.9 –3.0 –3.3 –4.3–4.4 –4.3 –4.7 –5.6–1.8 –6.3 –5.1 –4.0–0.3 –0.8 0.7 1.00.1 2.1 0.1 –0.51.3 1.7 1.4 1.50.6 0.0 0.3 0.4–2.4 –2.2 –2.2 –2.2–1.8 –0.6 –1.1 –1.8–2.8 –0.6 –1.5 –2.8–1.6 –1.1 –1.1 –1.3
iffer from infant mortality rates (based on live births); see tables C
thiteless980uthetheor980nd92,
and increased again between 1992 a1993. Rates for black females fluctuatebetween 1980 and 1987, decreased eayear between 1988 and 1992, anincreased between 1992 and 1993.
In 1994 the age-adjusted death rafor males of all races was 1.7 times thafor females. In 1950 the male-to-femalratio was 1.5. The 1970 ratio (1.7increased to 1.8 during the late 1970until 1987 when the ratio again declineto 1.7. For 1994 the ratio between maland female age-adjusted death rates w1.7 for the white population and 1.8 fothe black population.
In 1994 the age-adjusted death rafor the black population was 1.6 timesthat for the white population, the samratio that has prevailed since 1987. Fo1960–86 the race ratio was 1.5.
Expectation of life at birth and atspecified ages
In 1994 the average expectation olife at birth was 75.7 years, an increase o0.2 years compared with life expectancin 1993, but slightly lower than the recordhigh of 75.8 years in 1992. The increasbetween 1993 and 1994 representsresumption of a generally upward trenin U.S. life expectancy that has beeobserved throughout this century but, morecently, was interrupted by a 0.3-yeadecline between 1992 and 1993.
The expectation of life at birth for1994 represents the average numberyears that a group of infants would live i
tes
Black
FemaleBothsexes Male Female
ge
0.1 –1.4 –1.8 –0.9
–2.1 –6.2 –6.5 –5.9–3.9 –2.4 –2.3 –2.5–6.4 –0.6 4.2 –8.1–0.5 –3.6 –4.1 –1.61.6 1.3 1.0 2.10.9 1.3 0.3 3.20.1 –0.1 0.1 –0.6–2.3 –3.0 –3.8 –1.6–0.4 –2.2 –2.9 –1.5–0.5 –1.9 –2.0 –1.8–1.0 –2.5 –4.5 –1.4
and 24–29 for 1994 infant mortality rates and ‘‘Technical notes’’
u
ritecaap.5h
8oine
td
e
.s
e
e
tt..
..
c.
)
a9
k
dtd,
s
m
r-
0-rs
ael
10
20
40
6080
100
200
400
600800
1,000
2,000
4,000
6,0008,000
10,000
20,000
40,000
1950 1955 1960 1965 1970 1975 1980 1985 19901994
10
20
40
6080
100
200
400
600800
1,000
2,000
4,000
6,0008,000
10,000
20,000
40,000
1950 1955 1960 1965 1970 1975 1980 1985 19901994
Rat
e pe
r 10
0,00
0 po
pula
tion
85 years and over
75 84 years
65 74 years
55 64 years
45 54 years
35 44 years
25 34 years
15 24 years
1 4 years
5 14 years
Male
Deaths rates for "Under 1 year" (based on population estimates) differ from infant mortality rates (based on live births); see figure 5 for infant mortalityrates and "Technical notes" for further discussion of the difference.1
Under 1 year1
85 years and over
75 84 years
65 74 years
55 64 years
45 54 years
35 44 years
25 34 years
15 24 years
1 4 years
5 14 years
Female
Under 1 year1
Figure 2. Death rates by age and sex: United States, 1950–94
Monthly Vital Statistics Report + Vol. 45, No. 3(S) + September 30, 1996 5
the infants were to experience througholife the age-specific death rates prevailinin 1994. In 1994 life expectancy fofemales was 79.0 years compared w72.4 years for males; both figures reprsent increases over 1993. The differenin life expectancy between the sexes w6.6 years in 1994, the same differencein 1993. In contrast to the widening gafrom 1900 to 1972 (2.0 years in 1900, 5years in 1950, and 6.5 years in 1960), tdifference in life expectancy between thsexes narrowed between 1979 and 19(7.7 and 7.8 years throughout the perifrom 1972 through 1979, 7.1 years1984, and 6.9 years in 1988) and betwe1990 and 1993.
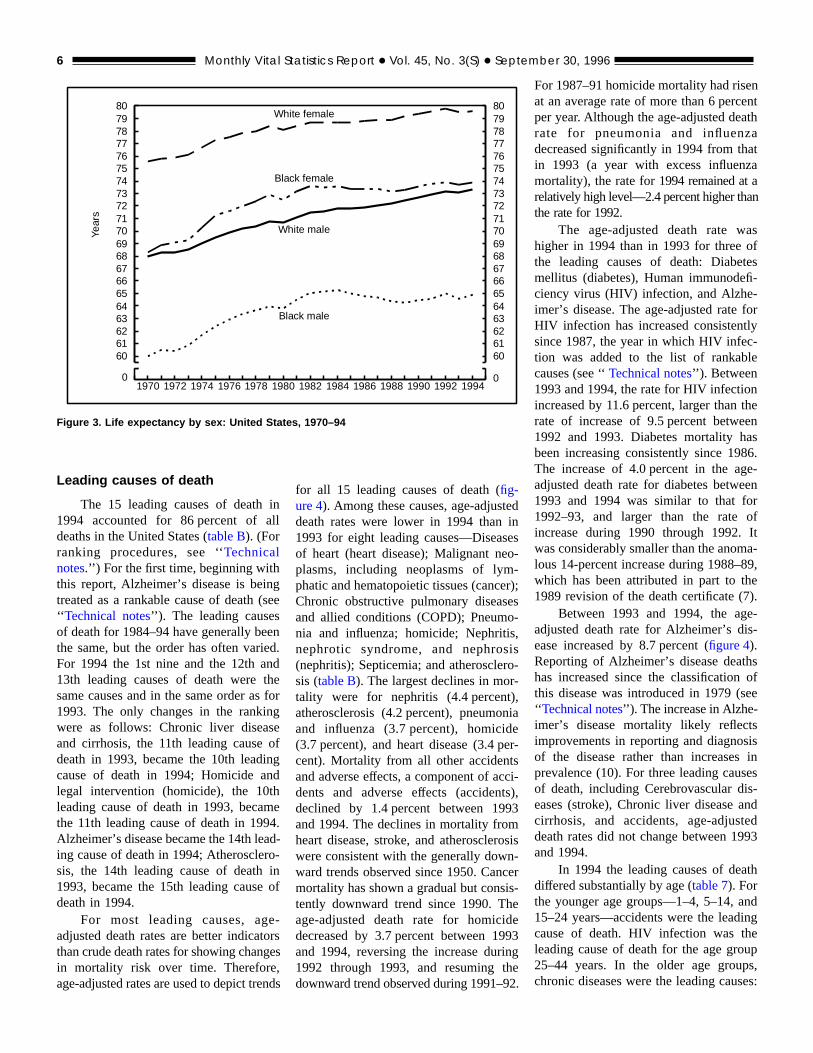
Between 1993 and 1994, life expecancy for the white population increasefrom 76.3 years to 76.5 years, equalinthe record high reached in 1992. Lifexpectancy for the black population alsincreased from 69.2 years in 1993 to 69years in 1994; in 1992 it was 69.6 year
tg
h-ess
ee8d
n
-
g
o5.
The difference in life expectancy betwethe white and black populations was 7years in 1994, slightly lower than thdifference of 7.1 years in 1993. Althougthe white-black difference in life expecancy narrowed from 7.6 years in 19705.7 years in 1982, it increased to 7years in 1989 before declining to 7years in 1990 and 1991, and 6.9 years1992.
Among the four race-sex groups (fig-ure 3), white females continued to havthe highest life expectancy at birth (79years), followed by black females (73years), white males (73.3 years), and blamales (64.9 years). Between 1993 a1994, life expectancy increased for blamales (from 64.6 years in 1993 to 64years in 1994) and for black female(from 73.7 in 1993 to 73.9 in 1994Black males experienced an unpreedented decline in life expectancy eveyear for 1984–89 (3), but an annuincrease in 1990, 1991, 1992, and 19
n.0
h-o10in
e69ckndk9s.c-ryl4.
However, life expectancy for black maleswas still 0.4 years shorter than the pealife expectancy of 65.3 years attained in1984. Before 1988 life expectancy forblack females fluctuated but increasefrom 1988 to 1992. Overall, the largesgain in life expectancy between 1980 an1994 was for white males (2.6 years)followed by white females (1.5 years),black females (1.4 years), and black male(1.1 years).
The 1994 life table may be used tocompare life expectancies at any age frobirth onward. For example, a person whohas reached age 65 years may look foward to living to an older age, on theaverage, than one who has reached 5years. On the basis of mortality experienced in 1994, a person aged 50 yeacould expect to live an average of 29.3more years for a total of 79.3 years, andperson aged 65 years could expect to livan average of 17.4 more years for a totaof 82.4 years (table 4).
een
m
a
eog
tiseo
eeoissrr-t)ndptsct9moncihid9inth9
nentthaata
n
asftesfi-
forly-le
ntheenas6.e-enrofIta-9,e).e-s-
hsofee
sisiness-nded93
th
ndngeups,es:
606162636465666768697071727374757677787980
Year
s
1970 1972 1974 1976 1978 1980 1982 1984 1986 1988 1990 1992 1994
White male
606162636465666768697071727374757677787980
White female
Black male
Black female
0 0
Figure 3. Life expectancy by sex: United States, 1970–94
6 Monthly Vital Statistics Report + Vol. 45, No. 3(S) + September 30, 1996
Leading causes of death
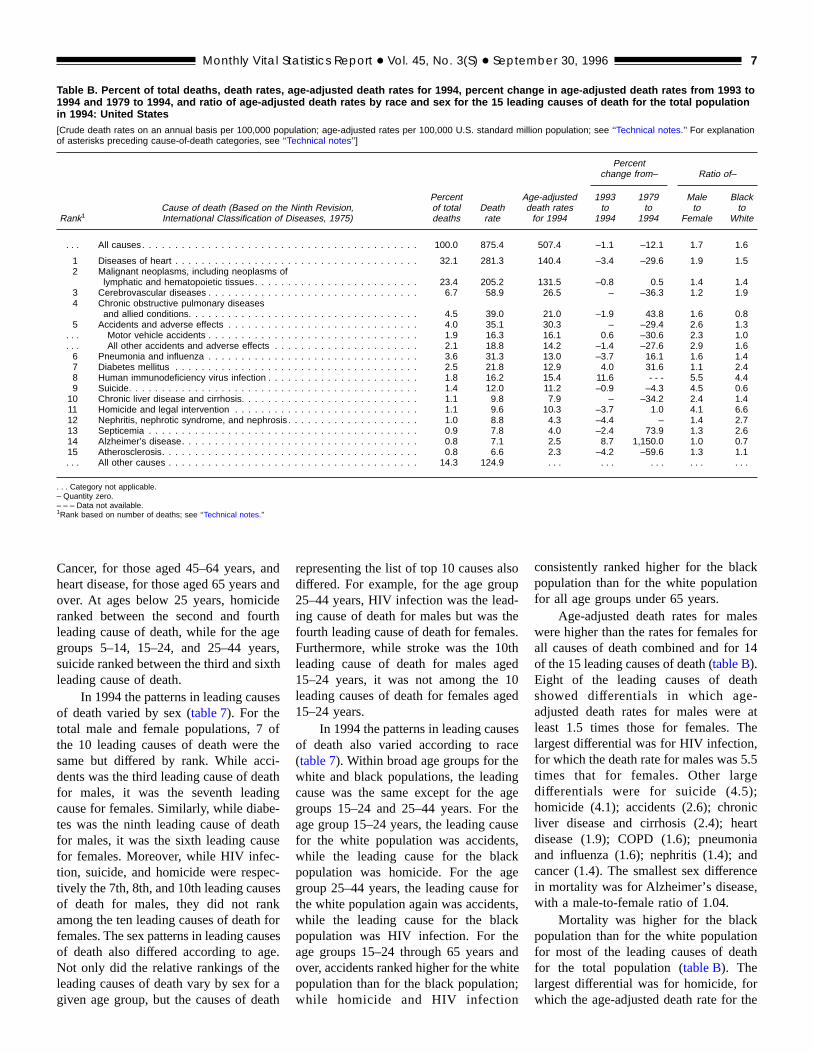
The 15 leading causes of death1994 accounted for 86 percent of adeaths in the United States (table B). (Forranking procedures, see ‘‘Technicalnotes.’’) For the first time, beginning withthis report, Alzheimer’s disease is beintreated as a rankable cause of death (‘‘ Technical notes’’). The leading causesof death for 1984–94 have generally bethe same, but the order has often variFor 1994 the 1st nine and the 12th a13th leading causes of death were tsame causes and in the same order as1993. The only changes in the rankinwere as follows: Chronic liver diseasand cirrhosis, the 11th leading causedeath in 1993, became the 10th leadicause of death in 1994; Homicide anlegal intervention (homicide), the 10tleading cause of death in 1993, becathe 11th leading cause of death in 199Alzheimer’s disease became the 14th leing cause of death in 1994; Atherosclersis, the 14th leading cause of death1993, became the 15th leading causedeath in 1994.
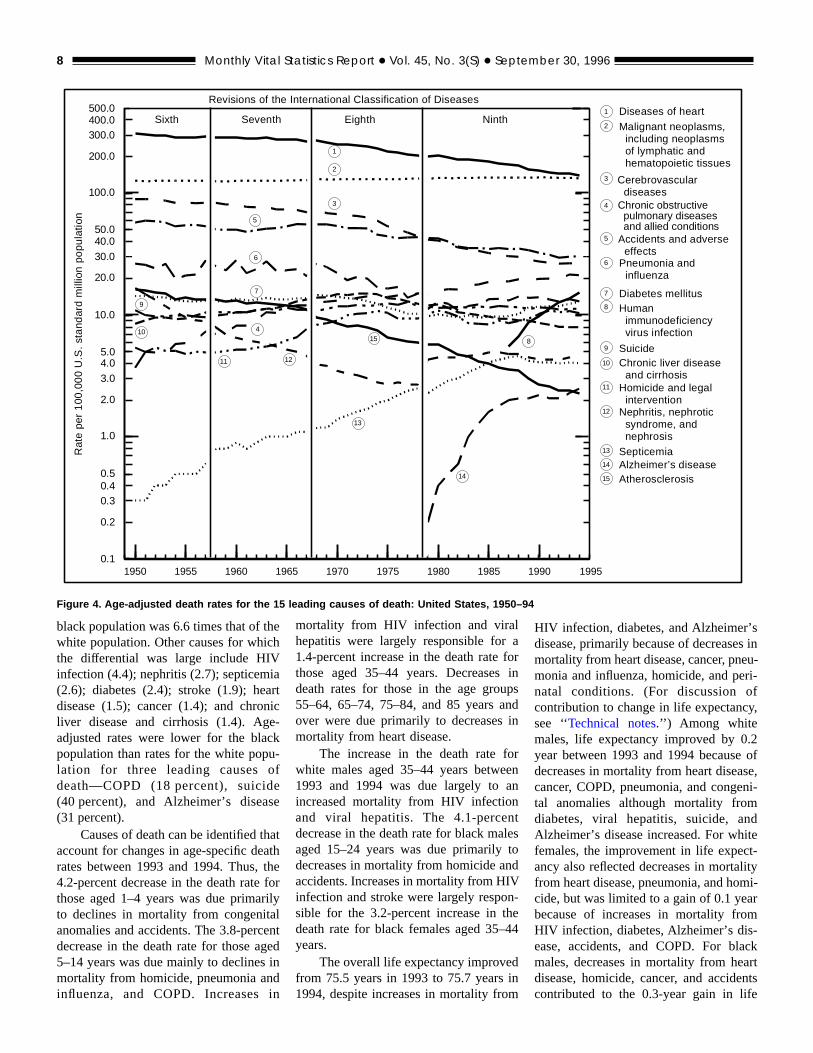
For most leading causes, agadjusted death rates are better indicatthan crude death rates for showing chanin mortality risk over time. Thereforeage-adjusted rates are used to depict tre
inll
gsee
nd.dheforgeofngdhe4.d-o-inof
-rses,nds
for all 15 leading causes of death (fig-ure 4). Among these causes, age-adjusdeath rates were lower in 1994 than1993 for eight leading causes—Diseaof heart (heart disease); Malignant nplasms, including neoplasms of lymphatic and hematopoietic tissues (cancChronic obstructive pulmonary diseasand allied conditions (COPD); Pneumnia and influenza; homicide; Nephritnephrotic syndrome, and nephro(nephritis); Septicemia; and atherosclesis (table B). The largest declines in motality were for nephritis (4.4 percenatherosclerosis (4.2 percent), pneumoand influenza (3.7 percent), homici(3.7 percent), and heart disease (3.4cent). Mortality from all other accidenand adverse effects, a component of adents and adverse effects (accidendeclined by 1.4 percent between 19and 1994. The declines in mortality froheart disease, stroke, and atherosclerwere consistent with the generally dowward trends observed since 1950. Canmortality has shown a gradual but constently downward trend since 1990. Tage-adjusted death rate for homicdecreased by 3.7 percent between 1and 1994, reversing the increase dur1992 through 1993, and resumingdownward trend observed during 1991–
ednes--r);s-,iso-
,iaeer-
ci-s),3
sis-ers-ee93ge2.
For 1987–91 homicide mortality had riseat an average rate of more than 6 percper year. Although the age-adjusted dearate for pneumonia and influenzdecreased significantly in 1994 from thin 1993 (a year with excess influenzmortality), the rate for1994 remained at arelatively high level—2.4 percent higher thathe rate for 1992.
The age-adjusted death rate whigher in 1994 than in 1993 for three othe leading causes of death: Diabemellitus (diabetes), Human immunodeciency virus (HIV) infection, and Alzhe-imer’s disease. The age-adjusted rateHIV infection has increased consistentsince 1987, the year in which HIV infection was added to the list of rankabcauses (see ‘‘Technical notes’’). Between1993 and 1994, the rate for HIV infectioincreased by 11.6 percent, larger thanrate of increase of 9.5 percent betwe1992 and 1993. Diabetes mortality hbeen increasing consistently since 198The increase of 4.0 percent in the agadjusted death rate for diabetes betwe1993 and 1994 was similar to that fo1992–93, and larger than the rateincrease during 1990 through 1992.was considerably smaller than the anomlous 14-percent increase during 1988–8which has been attributed in part to th1989 revision of the death certificate (7
Between 1993 and 1994, the agadjusted death rate for Alzheimer’s diease increased by 8.7 percent (figure 4).Reporting of Alzheimer’s disease deathas increased since the classificationthis disease was introduced in 1979 (s‘‘ Technical notes’’). The increase in Alzhe-imer’s disease mortality likely reflectimprovements in reporting and diagnosof the disease rather than increasesprevalence (10). For three leading causof death, including Cerebrovascular dieases (stroke), Chronic liver disease acirrhosis, and accidents, age-adjustdeath rates did not change between 19and 1994.
In 1994 the leading causes of deadiffered substantially by age (table 7). Forthe younger age groups—1–4, 5–14, a15–24 years—accidents were the leadicause of death. HIV infection was thleading cause of death for the age gro25–44 years. In the older age groupchronic diseases were the leading caus
a
rg
o
s
e
a
l
dh
te1
ece
hus
ft
i
k
sr4
h
ate
5
crtiade,
h
e
Table B. Percent of total deaths, death rates, age-adjusted death rates for 1994, percent change in age-adjusted death rates from 1993 to1994 and 1979 to 1994, and ratio of age-adjusted death rates by race and sex for the 15 leading causes of death for the total populationin 1994: United States[Crude death rates on an annual basis per 100,000 population; age-adjusted rates per 100,000 U.S. standard million population; see ‘‘Technical notes.’’ For explanationof asterisks preceding cause-of-death categories, see ‘‘Technical notes’’]
Rank1Cause of death (Based on the Ninth Revision,International Classification of Diseases, 1975)
Percentof totaldeaths
Deathrate
Age-adjusteddeath ratesfor 1994
Percentchange from– Ratio of–
1993to
1994
1979to
1994
Maleto
Female
Blackto
White
. . . All causes. . . . . . . . . . . . . . . . . . . . . . . . . . . . . . . . . . . . . . . . . . 100.0 875.4 507.4 –1.1 –12.1 1.7 1.6
1 Diseases of heart . . . . . . . . . . . . . . . . . . . . . . . . . . . . . . . . . . . . . 32.1 281.3 140.4 –3.4 –29.6 1.9 1.52 Malignant neoplasms, including neoplasms of
lymphatic and hematopoietic tissues. . . . . . . . . . . . . . . . . . . . . . . . . 23.4 205.2 131.5 –0.8 0.5 1.4 1.43 Cerebrovascular diseases . . . . . . . . . . . . . . . . . . . . . . . . . . . . . . . . 6.7 58.9 26.5 – –36.3 1.2 1.94 Chronic obstructive pulmonary diseases
and allied conditions. . . . . . . . . . . . . . . . . . . . . . . . . . . . . . . . . . . 4.5 39.0 21.0 –1.9 43.8 1.6 0.85 Accidents and adverse effects . . . . . . . . . . . . . . . . . . . . . . . . . . . . . 4.0 35.1 30.3 – –29.4 2.6 1.3
. . . Motor vehicle accidents . . . . . . . . . . . . . . . . . . . . . . . . . . . . . . . . 1.9 16.3 16.1 0.6 –30.6 2.3 1.0
. . . All other accidents and adverse effects . . . . . . . . . . . . . . . . . . . . . . 2.1 18.8 14.2 –1.4 –27.6 2.9 1.66 Pneumonia and influenza . . . . . . . . . . . . . . . . . . . . . . . . . . . . . . . . 3.6 31.3 13.0 –3.7 16.1 1.6 1.47 Diabetes mellitus . . . . . . . . . . . . . . . . . . . . . . . . . . . . . . . . . . . . . 2.5 21.8 12.9 4.0 31.6 1.1 2.48 Human immunodeficiency virus infection . . . . . . . . . . . . . . . . . . . . . . . 1.8 16.2 15.4 11.6 - - - 5.5 4.49 Suicide. . . . . . . . . . . . . . . . . . . . . . . . . . . . . . . . . . . . . . . . . . . . 1.4 12.0 11.2 –0.9 –4.3 4.5 0.610 Chronic liver disease and cirrhosis. . . . . . . . . . . . . . . . . . . . . . . . . . . 1.1 9.8 7.9 – –34.2 2.4 1.411 Homicide and legal intervention . . . . . . . . . . . . . . . . . . . . . . . . . . . . 1.1 9.6 10.3 –3.7 1.0 4.1 6.612 Nephritis, nephrotic syndrome, and nephrosis. . . . . . . . . . . . . . . . . . . . 1.0 8.8 4.3 –4.4 – 1.4 2.713 Septicemia . . . . . . . . . . . . . . . . . . . . . . . . . . . . . . . . . . . . . . . . . 0.9 7.8 4.0 –2.4 73.9 1.3 2.614 Alzheimer’s disease. . . . . . . . . . . . . . . . . . . . . . . . . . . . . . . . . . . . 0.8 7.1 2.5 8.7 1,150.0 1.0 0.715 Atherosclerosis. . . . . . . . . . . . . . . . . . . . . . . . . . . . . . . . . . . . . . . 0.8 6.6 2.3 –4.2 –59.6 1.3 1.1. . . All other causes . . . . . . . . . . . . . . . . . . . . . . . . . . . . . . . . . . . . . . 14.3 124.9 . . . . . . . . . . . . . . .
. . . Category not applicable.– Quantity zero.– – – Data not available.1Rank based on number of deaths; see ‘‘Technical notes.’’
Monthly Vital Statistics Report + Vol. 45, No. 3(S) + September 30, 1996 7
Cancer, for those aged 45–64 years, aheart disease, for those aged 65 yearsover. At ages below 25 years, homicidranked between the second and fouleading cause of death, while for the agroups 5–14, 15–24, and 25–44 yeasuicide ranked between the third and sixleading cause of death.
In 1994 the patterns in leading causof death varied by sex (table 7). For thetotal male and female populations, 7the 10 leading causes of death were tsame but differed by rank. While accdents was the third leading cause of deafor males, it was the seventh leadincause for females. Similarly, while diabetes was the ninth leading cause of deafor males, it was the sixth leading caufor females. Moreover, while HIV infec-tion, suicide, and homicide were respetively the 7th, 8th, and 10th leading causof death for males, they did not ranamong the ten leading causes of deathfemales. The sex patterns in leading cauof death also differed according to agNot only did the relative rankings of thleading causes of death vary by sex forgiven age group, but the causes of de
ndndethers,th
es
fhei-thg-the
c-eskforsese.
ath
representing the list of top 10 causes adiffered. For example, for the age grou25–44 years, HIV infection was the leaing cause of death for males but was tfourth leading cause of death for femaleFurthermore, while stroke was the 10leading cause of death for males ag15–24 years, it was not among theleading causes of death for females ag15–24 years.
In 1994 the patterns in leading causof death also varied according to ra(table 7). Within broad age groups for thwhite and black populations, the leadincause was the same except for the agroups 15–24 and 25–44 years. For tage group 15–24 years, the leading cafor the white population was accidentwhile the leading cause for the blacpopulation was homicide. For the aggroup 25–44 years, the leading causethe white population again was accidenwhile the leading cause for the blacpopulation was HIV infection. For theage groups 15–24 through 65 years aover, accidents ranked higher for the whpopulation than for the black populationwhile homicide and HIV infection
sop-es.hd0ed
se
ggeese,keors,k
ndte;
consistently ranked higher for the blacpopulation than for the white populationfor all age groups under 65 years.
Age-adjusted death rates for malewere higher than the rates for females foall causes of death combined and for 1of the 15 leading causes of death (table B).Eight of the leading causes of deatshowed differentials in which age-adjusted death rates for males wereleast 1.5 times those for females. Thlargest differential was for HIV infection,for which the death rate for males was 5.times that for females. Other largedifferentials were for suicide (4.5);homicide (4.1); accidents (2.6); chroniliver disease and cirrhosis (2.4); headisease (1.9); COPD (1.6); pneumonand influenza (1.6); nephritis (1.4); ancancer (1.4). The smallest sex differencin mortality was for Alzheimer’s diseasewith a male-to-female ratio of 1.04.
Mortality was higher for the blackpopulation than for the white populationfor most of the leading causes of deatfor the total population (table B). Thelargest differential was for homicide, forwhich the age-adjusted death rate for th
ia
necu
s
atfri
eg
di
f
o
a
n
nIVnh
d
m
sinu-ri-fy,
2ofe,ni-
dtet-ityi-rm-ckrtnts
Diseases of heart
Malignant neoplasms, including neoplasms of lymphatic and hematopoietic tissues
Cerebrovascular diseases
Accidents and adverse effects
Chronic obstructive pulmonary diseases and allied conditions
Pneumonia and influenza
Diabetes mellitus
Suicide
Human immunodeficiency virus infection
Homicide and legal intervention
Chronic liver disease and cirrhosis
Nephritis, nephrotic syndrome, and nephrosis
Septicemia
Atherosclerosis
2
1
7
6
3
4
5
8
9
10
11
12
13
15
0.1
0.5
1.0
5.0
10.0
50.0
100.0
500.0
1950 1955 1960 1965 1970 1975 1980 1985 1990 1995
0.2
0.30.4
2.0
3.0
4.0
20.0
30.0
40.0
200.0
300.0400.0
1
2
3
5
6
7
9
10 4
1211
15
13
8
14
Alzheimer’s disease14
Revisions of the International Classification of Diseases
Sixth Seventh Eighth Ninth
Rat
e p
er 1
00,0
00
U.S
. st
and
ard
mill
ion
po
pula
tion
Figure 4. Age-adjusted death rates for the 15 leading causes of death: United States, 1950–94
8 Monthly Vital Statistics Report + Vol. 45, No. 3(S) + September 30, 1996
black population was 6.6 times that of thwhite population. Other causes for whicthe differential was large include HIVinfection (4.4); nephritis (2.7); septicem(2.6); diabetes (2.4); stroke (1.9); headisease (1.5); cancer (1.4); and chroliver disease and cirrhosis (1.4). Agadjusted rates were lower for the blapopulation than rates for the white poplation for three leading causes odeath—COPD (18 percent), suicid(40 percent), and Alzheimer’s disea(31 percent).
Causes of death can be identified thaccount for changes in age-specific derates between 1993 and 1994. Thus,4.2-percent decrease in the death ratethose aged 1–4 years was due primato declines in mortality from congenitaanomalies and accidents. The 3.8-percdecrease in the death rate for those a5–14 years was due mainly to declinesmortality from homicide, pneumonia aninfluenza, and COPD. Increases
eh
rtic-k-fee
atthheorlylntedin
n
mortality from HIV infection and viralhepatitis were largely responsible for1.4-percent increase in the death ratethose aged 35–44 years. Decreasesdeath rates for those in the age grou55–64, 65–74, 75–84, and 85 years aover were due primarily to decreasesmortality from heart disease.
The increase in the death rate fwhite males aged 35–44 years betwe1993 and 1994 was due largely toincreased mortality from HIV infectionand viral hepatitis. The 4.1-percedecrease in the death rate for black maaged 15–24 years was due primarilydecreases in mortality from homicide aaccidents. Increases in mortality from Hinfection and stroke were largely resposible for the 3.2-percent increase in tdeath rate for black females aged 35–years.
The overall life expectancy improvefrom 75.5 years in 1993 to 75.7 years1994, despite increases in mortality fro
aorinpsndin
renn
tlestod
-e44
in
HIV infection, diabetes, and Alzheimer’disease, primarily because of decreasesmortality from heart disease, cancer, pnemonia and influenza, homicide, and penatal conditions. (For discussion ocontribution to change in life expectancsee ‘‘Technical notes.’’) Among whitemales, life expectancy improved by 0.year between 1993 and 1994 becausedecreases in mortality from heart diseascancer, COPD, pneumonia, and congetal anomalies although mortality fromdiabetes, viral hepatitis, suicide, anAlzheimer’s disease increased. For whifemales, the improvement in life expecancy also reflected decreases in mortalfrom heart disease, pneumonia, and homcide, but was limited to a gain of 0.1 yeabecause of increases in mortality froHIV infection, diabetes, Alzheimer’s disease, accidents, and COPD. For blamales, decreases in mortality from headisease, homicide, cancer, and accidecontributed to the 0.3-year gain in life
td
e
s
r
c
e
n
eph
e
ha
sitetn
att
e
oe
ar
1
eo
a
hai
en
tgumaa
pt
h
waeh
hhoh
ewrta
ehh
reno-dree64isu-
rs
s
erm-nd
ses,dstnd24rss,athlyes.ter-.6er-edutened-te.e-ss,ntse
rk
Monthly Vital Statistics Report + Vol. 45, No. 3(S) + September 30, 1996 9
expectancy. This gain occurred despoffsetting increases in mortality from HIVinfection, diabetes, stroke, hypertensioand viral hepatitis. The life expectancfor black females improved by 0.2 yeain part, because of declines in mortalifrom heart disease, cancer, and homici
Life expectancy for white males wa8.4 years higher than that for black malin 1994. Specific causes of death wimuch lower mortality for white maleinfluenced this difference. The causesdeath contributing the most to this diffeence were homicide, HIV infection, headisease, cancer, and perinatal conditioThe life expectancy for white femalewas 5.7 years higher than that for blafemales in 1994. The causes of deacontributing the most to this differencwere heart disease, cancer, HIV infectiostroke, and diabetes.
Hispanic mortality
Hispanic mortality data for 1994 arbased on deaths to residents of 49 Staand the District of Columbia. Data showin tables 14and 15 exclude Oklahomabecause it does not include the Hispaorigin item on its death certificates. (Fodetails on reporting area, see ‘‘Technicalnotes’’.) The crude, age-specific, and agadjusted death rates for the Hispanic polation can be compared with those for tnon-Hispanic white population (table 14).The crude death rate for the Hispanpopulation was 64 percent lower than thfor the non-Hispanic white populationThis difference reflects the lower agspecific mortality for the older age groupand the younger age composition of tHispanic population compared with thof the non-Hispanic white populationThe age-adjusted death rate, which cotrols for age-compositional differencewas 20 percent lower for the Hispanpopulation than for the non-Hispanic whipopulation. The ratio of the age-adjustdeath rate for the Hispanic populationthat for non-Hispanic white populatiowas 0.84 for males and 0.73 for femaleMortality of Hispanics may be somewhunderstated because of net underreporof Hispanic origin on the death certifica(see ‘‘Technical notes’’).
Within the Hispanic population, thage-adjusted death rate for males was
ite
n,yr,ye.ssth
of-rtns.skthen,
tesn
icr
-u-e
icat.-set.n-,cedo
s.tinge
1.9
times that for females. The male-tfemale ratio differed substantially by agwith Hispanic males experiencing threto four times higher death rates thHispanic females for ages 15–44 yeaThe sex ratio in Hispanic mortality rangebetween 1.2 and 1.6 for ages belowyears and between 1.4 and 2.2 for agesyears and older.
Among specified subgroups of thHispanic population, the age-adjustdeath rate was substantially lower fCuban Americans (358.1 deaths p100,000 U.S. standard million popultion), Mexican Americans (370.4), anCentral and South Americans and othand unknown Hispanics (354.0) than tage-adjusted death rate for Puerto Ric(565.8). Among Hispanic males, Mexcans had the lowest age-adjusted derate, while Puerto Ricans had the highrate. Among Hispanic females, Cubahad the lowest age-adjusted death rawhile Puerto Ricans had the highest ra
Leading causes of death for all agroups combined for the Hispanic poplation differed by rank and cause frothose for the non-Hispanic white popultion in the Hispanic reporting are(table 15). Although the two leadingcauses of death—heart disease acancer—were the same for both grouthey accounted for 57 percent of all deain 1994 for the non-Hispanic white population but for only 42 percent of the deatfor the Hispanic population.
These were the major differencesleading causes of death between the tgroups: Of the 10 leading causes of defor the Hispanic population, homicid(sixth leading cause) was not among t10 leading causes for the non-Hispanwhite population. Conversely, suicide, teighth leading cause of death for tnon-Hispanic white population, was namong the 10 leading causes for tHispanic population (table 15).
Differences in the ranking of thleading causes of death between the tpopulation groups largely reflect diffeences in age composition betweentwo groups; that is, the Hispanic popultion has a greater proportion of younpersons, and, accordingly, a largproportion of deaths due to causes tare more prevalent at younger ages. Wit
-,ens.d545
edrer-derens-athstste,e.e-
-
nds,hs-s
inoth
eiceete
o-he-gratin
broad age groups, leading causes wemore similar between the two populatiogroups. However, even within age categries some differences exist. Homicide anHIV infection consistently ranked highefor the Hispanic population than for thnon-Hispanic white population for all aggroups between 1–4 years and 45–years. Chronic liver disease and cirrhosalso ranked higher for the Hispanic poplation than for the non-Hispanic whitepopulation for those aged 45–64 yeaand 65 years and over.
Firearm mortality
In 1994 a total of 38,505 persondied from firearm injuries in the UnitedStates. This number was 2.8 percent lowthan the 39,595 deaths in 1993. Firearsuicide and homicide, the two major component causes, accounted for 49 a46 percent, respectively, of all firearminjury deaths in 1994.
Of the 38,505 firearm injury deathin 1994, 58.2 percent were for whitmales, 25.7 percent for black male10.4 percent for white females, an3.5 percent for black females. The largenumbers of firearm deaths for males afemales were for the age groups 15–and 25–34 years. Although the numbeof deaths were highest for white malethe age-adjusted and age-specific derates for firearm injuries were generalhighest for black males, followed by whitmales, black females, and white female
In 1994 the age-adjusted death rafor firearm injuries was 15.1 deaths pe100,000 U.S. standard million population, 3 percent lower than the rate of 15in 1993. The rate decreased by 14.2 pcent between 1980 and 1985, increasevery year between 1987 and 1991, bdecreased again by 2 percent betwe1991 and 1992. The 1993 age-adjustdeath rate for firearm injuries was, however, 5 percent higher than the 1992 ra
Between 1993 and 1994 the agadjusted death rate for firearm injuriedecreased by 5 percent for black male9 percent for black females, and 8 percefor white females; the rate did not decreasignificantly for white males. In 1994 therate for males was 6.2 times that fofemales, and the rate for the blac
t
e
no
9rpee
se-t
e
.n
eehea
e
s
enstl
otuoe
e9
f3f
i
foo
eoeritc
e
a
e
nc
ea
gr
coe
m
rths
ls
t;
h
es
g
al,r
heor
n
er
r
r
8alslfr-
fls-,-f;or
n
10 Monthly Vital Statistics Report + Vol. 45, No. 3(S) + September 30, 1996
population was 3.0 times that of the whipopulation.
Between 1993 and 1994 the agadjusted death rate decreased by 4 pcent for firearm homicide and 14 percefor firearm accidents. The rate did ndecrease significantly for firearm suicidbetween the two years, however. In 19the age-specific death rates for fireahomicide were highest for the age grou15–24 and 25–34 years, while the ratfor firearm suicide peaked for those ag75–84 years and 85 years and older.
Drug-induced mortality
In 1994 a total of 13,923 persondied of drug-induced causes in the UnitStates (table 19). The category druginduced causes includes not only deafrom dependent and nondependent usedrugs (legal and illegal use), but alspoisoning from medically prescribed another drugs. It excludes accidents, homcides, and other causes indirectly relatto drug use (for drug-induced causes, s‘‘ Technical notes’’). The age-adjusteddeath rate for drug-induced causes1994 was 5.0 deaths per 100,000 Ustandard million population, 4 percehigher than the rate of 4.8 in 1993. Thrate increased by 35 percent from 19831988, then declined 14 percent betwe1988 and 1990, and increased by 39 pcent between 1990 and 1994. In 1994 tage-adjusted death rate for drug-induccauses for males was 2.3 times the rfor females, and the rate for the blacpopulation was 1.8 times that for thwhite population.
Alcohol-induced mortality
In 1994 a total of 20,163 persondied of alcohol-induced causes in thUnited States (table 20). The categoryalcohol-induced causes includes not ondeaths from dependent and nondependuse of alcohol, but also accidental poisoing by alcohol. It excludes accidenthomicides, and other causes indirecrelated to alcohol use. (For alcohoinduced causes, see ‘‘Technical notes.’’)The age-adjusted death rate for alcohinduced causes in 1994 was 6.8 deaper 100,000 U.S. standard million poplation, 1.5 percent higher than the rate6.7 in 1993. The rate decreased by 20 pcent from 1980 to 1986, increased b
e
-er-tte4mssd
d
hsofodi-dee
inS.tetonr-edtek
e
lynt-,ly-
l-hs-fr-y
9 percent from 1986 to 1989, and thdecreased by 7 percent from 1989 to 19since 1991 it has shown very little changIn 1994 the age-adjusted death ratealcohol-induced causes for males wastimes the rate for females, and the ratethe black population was 2.0 times thrate for the white population.
Marital status
Eighty-nine percent of the person15 years of age and over who died1994 had been married (table 21). Theproportion was larger for females (92 pecent) than for males (86 percent) andthe white population (90 percent) than fthe black population (79 percent). Thproportion who were widowed at the timof death was considerably greater fwomen (58 percent) than for men (18 pcent) but fairly similar for both majorace groups—38 percent of the whpopulation and 33 percent of the blapopulation. Some of the differencebetween groups can be accounted fordifferences in age composition.
Educational attainment
In an area comprised of 45 Statand the District of Columbia, about 63 pecent of the persons who died in 1994 hcompleted high school (table 22) (see‘‘ Technical notes’’). In 1994 the percentwas about the same for males (63 pcent) and females (62 percent), but somwhat different for the white populatio(64 percent) compared with the blapopulation (52 percent). About the samproportion of white females and whitmales (65 percent) who died in 1994 hcompleted high school. The proportiowho had completed 4 years of collewas smaller for white females (9.6 pecent) than for whitemales (14.2 percent). Asimilar proportion of black females and blamales had completed high school (ab52 percent). Slightly more black femal(6.6 percent) than black males (5.8 percehad completed 4 years of college at the tiof death.
Infant mortality
In 1994, 31,710 infant deaths wereported (table C), 5.2 percent fewer infandeaths than the 1993 total of 33,466. Tinfant mortality rate of 8.0 infant death
n1;e.or.5ore
sn
r-rre
rr-
eksby
sr-d
r-e-
ke
dne-
kutsnt)e
e
e
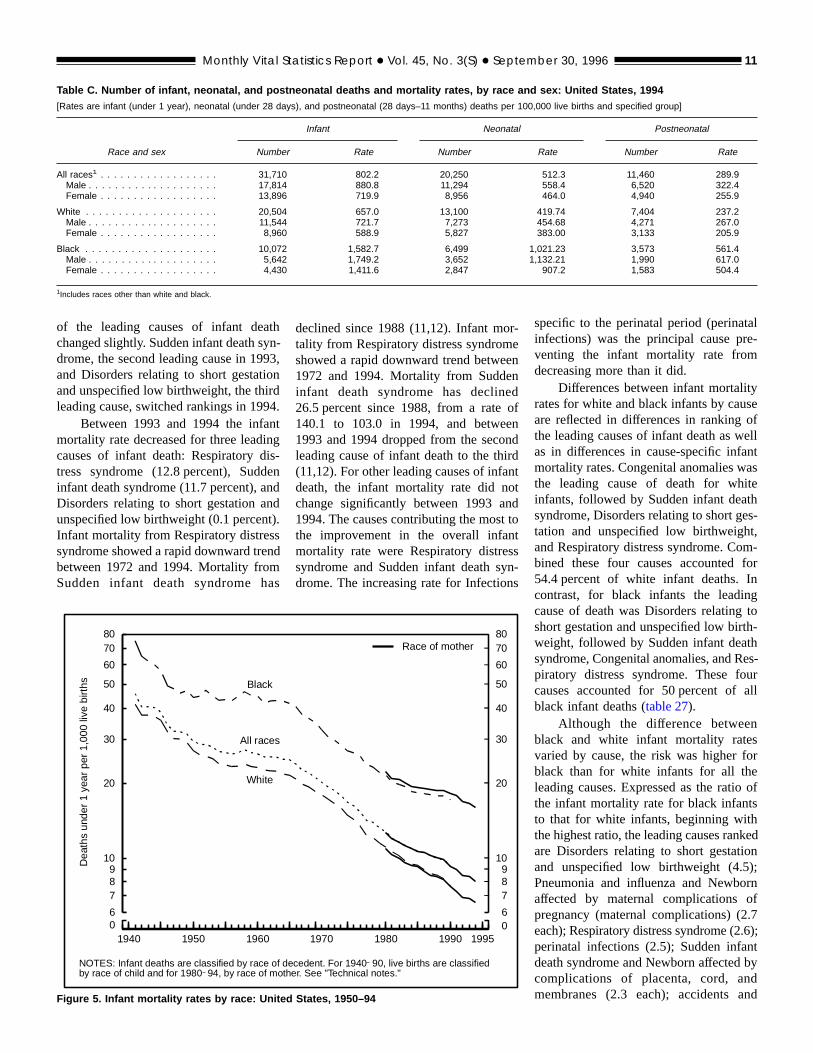
per 1,000 live births is the lowest finarate ever recorded for the United State(figure 5). It represents a decline of4.8 percent from the rate of 8.4 for theprevious year (table 24). The mortalityrate for white infants declined 2.9 percen(6.8 in 1993 compared with 6.6 in 1994)and the rate for black infants declined4.2 percent (16.5 in 1993 compared wit15.8 in 1994).
In 1994 the infant mortality rate forblack infants (15.8) was 2.4 times the ratfor white infants (6.6), the same ratio ain the previous year. Historically, theblack-white ratio has been increasin(11,12).
Between 1993 and 1994 the neonatmortality rate declined by 3.8 percentfrom 5.3 to 5.1 deaths for infants unde28 days per 1,000 live births. For whiteinfants, the rate was 4.2, compared witthe 1993 rate of 4.3; the change in thneonatal mortality rate between the twyears was not statistically significant. Foblack infants the neonatal mortality ratedeclined by 4.7 percent, from 10.7 in1993 to 10.2 in 1994. Neonatal mortalityrates historically have declined for bothraces although the declines have beemore rapid for the white population(11,12).
The postneonatal mortality rate—deaths to infants 28 days–11 months p1,000 live births—declined by 6.5 per-cent, from 3.1 in 1993 to 2.9 in 1994. Fowhite infants the postneonatal mortalityrate declined from 2.5 to 2.4 deaths pe1,000 live births. For black infants therate was 5.6 in 1994, compared with 5.in 1993; the change in the postneonatmortality rate between the two years wanot statistically significant. The historicatrend for postneonatal mortality was omore rapid declines in postneonatal motality for black than for white infants(11,12).
Among the 10 leading causes oinfant death, the first 4—Congenitaanomalies, Disorders relating to short getation and unspecified low birthweightand Respiratory distress syndrome—accounted for just over hal(53 percent) of all infant deaths in 1994and the remaining 6 causes accounted fonly 16 percent of all infant deaths(table 26). The list of 10 leading causesof infant death was unchanged betwee1993 and 1994, but the rankings of two
t
9od
nnisennt)sn
a
r
eneoenir
ontnsyn
ale-
yseofellntasteths-t,m-forn
Table C. Number of infant, neonatal, and postneonatal deaths and mortality rates, by race and sex: United States, 1994[Rates are infant (under 1 year), neonatal (under 28 days), and postneonatal (28 days–11 months) deaths per 100,000 live births and specified group]
Race and sex
Infant Neonatal Postneonatal
Number Rate Number Rate Number Rate
All races1 . . . . . . . . . . . . . . . . . . 31,710 802.2 20,250 512.3 11,460 289.9Male . . . . . . . . . . . . . . . . . . . . 17,814 880.8 11,294 558.4 6,520 322.4Female . . . . . . . . . . . . . . . . . . 13,896 719.9 8,956 464.0 4,940 255.9
White . . . . . . . . . . . . . . . . . . . . 20,504 657.0 13,100 419.74 7,404 237.2Male . . . . . . . . . . . . . . . . . . . . 11,544 721.7 7,273 454.68 4,271 267.0Female . . . . . . . . . . . . . . . . . . 8,960 588.9 5,827 383.00 3,133 205.9
Black . . . . . . . . . . . . . . . . . . . . 10,072 1,582.7 6,499 1,021.23 3,573 561.4Male . . . . . . . . . . . . . . . . . . . . 5,642 1,749.2 3,652 1,132.21 1,990 617.0Female . . . . . . . . . . . . . . . . . . 4,430 1,411.6 2,847 907.2 1,583 504.4
1Includes races other than white and black.
Monthly Vital Statistics Report + Vol. 45, No. 3(S) + September 30, 1996 11
of the leading causes of infant deachanged slightly. Sudden infant death sydrome, the second leading cause in 19and Disorders relating to short gestatiand unspecified low birthweight, the thirleading cause, switched rankings in 199
Between 1993 and 1994 the infamortality rate decreased for three leadicauses of infant death: Respiratory dtress syndrome (12.8 percent), Suddinfant death syndrome (11.7 percent), aDisorders relating to short gestation aunspecified low birthweight (0.1 percenInfant mortality from Respiratory distressyndrome showed a rapid downward trebetween 1972 and 1994. Mortality fromSudden infant death syndrome h
6
789
10
20
30
40
50
60
7080
1940 1950 1960
All races
White
Black
Dea
ths
unde
r 1
year
per
1,0
00 li
ve b
irths
0
NOTES: Infant deaths are classified by race of deby race of child and for 1980 94, by race of moth
Figure 5. Infant mortality rates by race: United Sta
hn-3,n
4.tg-ndd.
d
s
declined since 1988 (11,12). Infant motality from Respiratory distress syndromshowed a rapid downward trend betwe1972 and 1994. Mortality from Suddeinfant death syndrome has declin26.5 percent since 1988, from a rate140.1 to 103.0 in 1994, and betwe1993 and 1994 dropped from the secoleading cause of infant death to the th(11,12). For other leading causes of infadeath, the infant mortality rate did nchange significantly between 1993 a1994. The causes contributing the mosthe improvement in the overall infamortality rate were Respiratory distresyndrome and Sudden infant death sdrome. The increasing rate for Infectio
gtoh-hes-urall
nsor
ofs
edn);rnf.76);ntbydnd
1970 1980 1990 1995
6
789
10
20
30
40
50
60
7080
0
cedent. For 1940 90, live births are classifieder. See "Technical notes."
Race of mother
tes, 1950–94
-en
dfnddnttdtotsn-s
specific to the perinatal period (perinatinfections) was the principal cause prventing the infant mortality rate fromdecreasing more than it did.
Differences between infant mortalitrates for white and black infants by cauare reflected in differences in rankingthe leading causes of infant death as was in differences in cause-specific infamortality rates. Congenital anomalies wthe leading cause of death for whiinfants, followed by Sudden infant deasyndrome, Disorders relating to short getation and unspecified low birthweighand Respiratory distress syndrome. Cobined these four causes accounted54.4 percent of white infant deaths. Icontrast, for black infants the leadincause of death was Disorders relatingshort gestation and unspecified low birtweight, followed by Sudden infant deatsyndrome, Congenital anomalies, and Rpiratory distress syndrome. These focauses accounted for 50 percent ofblack infant deaths (table 27).
Although the difference betweeblack and white infant mortality ratevaried by cause, the risk was higher fblack than for white infants for all theleading causes. Expressed as the ratiothe infant mortality rate for black infantto that for white infants, beginning withthe highest ratio, the leading causes rankare Disorders relating to short gestatioand unspecified low birthweight (4.5Pneumonia and influenza and Newboaffected by maternal complications opregnancy (maternal complications) (2each); Respiratory distress syndrome (2.perinatal infections (2.5); Sudden infadeath syndrome and Newborn affectedcomplications of placenta, cord, anmembranes (2.3 each); accidents a
iae
li
a
ei-nmrtnc
tt
ives
-es.7ryratic
kofinct
r-toey79ths
en-p-ses-easendd-ntscideer-u-see-
References1. Hoyert DL, Singh GK, Rosenberg HM.
Sources of data on socioeconomic differ-ential mortality in the United States.Journal of Official Statistics. 11(3):233–60. 1995.
2. National Center for Health Statistics.Technical appendix. Vital statistics ofthe United States, 1992, vol II, mortality,
6. Gardner P, Hudson BL. Advance reportof final mortality statistics, 1993. Monthlyvital statistics report; vol 44 no 7, supp.Hyattsville, Maryland: National Centerfor Health Statistics. 1996.
7. Kochanek KD, Hudson BL. Advancereport of final mortality statistics, 1992.Monthly vital statistics report; vol 43 no6, supp. Hyattsville, Maryland: NationalCenter for Health Statistics. 1995.
8. Centers for Disease Control and Preven-tion. Morbidity and mortality weeklyreport. vol 43 no 10. Washington: PublicHealth Service. 1994.
9. Centers for Disease Control and Preven-tion. Morbidity and mortality weeklyreport. vol 44 no 28. Washington: PublicHealth Service. 1994.
10. Hoyert DL. Mortality trends for Alzhe-imer’s disease, 1979–91. National Cen-ter for Health Statistics. Vital and HealthStat 20 (28). 1996.
11. MacDorman MF, Rosenberg HM. Trendsin infant mortality by cause of death andother characteristics, 1960–88. NationalCenter for Health Statistics. Vital andHealth Stat 20 (20). 1993.
12. Singh GK, Yu SM. Infant mortality inthe United States: Trends, differentials,and projections, 1950 through 2010. AmJ Public Health. 85(7):957–64. 1995.
13. Tolson GC, Barnes JM, Gay GA, Kow-aleski JL. The 1989 revision of the U.S.standard certificates and reports. NationalCenter for Health Statistics. Vital HealthStat 4(28). 1991.
14. National Center for Health Statistics.Technical appendix. Vital statistics ofthe United States, 1989, vol II, mortality,part A. Washington: Public Health Ser-vice. 1993.
15. Hambright TZ. Comparability of maritalstatus, race, nativity, and country of ori-gin on the death certificate and matching
12 Monthly Vital Statistics Report + Vol. 45, No. 3(S) + September 30, 1996
Intrauterine hypoxia and birth asphyx(2.2 each); and Congenital anomali(1.8).
Between 1993 and 1994 decreasesmortality from Sudden infant death syndrome, congenital anomalies, Respiratodistress syndrome, Other respiratory coditions of newborn, and maternal compcations made the largest contributionsthe 3.7-percent decrease in the white infmortality rate. However, the white infanmortality rate would have decreased evfurther had it not been for increasesmortality from perinatal infections, Neonatal hemorrhage, and Pneumonia ainfluenza. Decreases in mortality froSudden infant death syndrome, Respitory distress syndrome, and Congenianomalies made the largest contributioto the 4.2-percent decrease in the blainfant mortality rate; further decrease wahowever, offset by increases in mortalifrom short gestation and low birthweighaccidents, and Pneumonia and influenz
Hispanic infant mortality—The infantmortality rate was 6.5 deaths to Hispaninfants under 1 year of age per 1,000 libirths in an area comprised of 49 Statand the District of Columbia. This wathe same as the rate for non-Hispanwhite infants. Among specified subgroups of the Hispanic population, thmortality rate for Mexican infants wa6.6 infant deaths per 1,000 live births, 8for Puerto Rican infants, and 4.5 foCuban infants. Infant mortality rates bspecified Hispanic origin and race fonon-Hispanic origin may be somewhunderstated. (For description of Hispanreporting area, see ‘‘Technical notes’’).
Maternal mortality
In 1994, 328 women were reportedto have died of maternal causes (table 30),compared with 302 in 1993. As in previ-ous years, the number does not includall deaths occurring to pregnant womenbut only to those deaths assigned to Complications of pregnancy, childbirth, andthe puerperium (ICD–9 Nos. 630–676)The maternal mortality rate for 1994 wa8.3 deaths per 100,000 live births, compared with a rate of 7.5 in 1993. Thedifference in the rates between the twyears was not statistically significant.
Black women have a higher risk omaternal death than white women. I
s
in-ryn--tonttnn
d
a-alsks,y,a.
ces
ic
1994 the maternal mortality rate for blacwomen was 18.5, three times the rate6.2 for white women. The race ratiomaternal mortality rate was 3.0 for Direobstetric causes.
Report of autopsy
For 1994 all States requested infomation on the death certificate aswhether autopsies were performed. Thwere reported as performed on 213,8decedents, or 9.4 percent of the deathat occurred in 1994 (table 31), a reduc-tion from the 9.7 percent reported for thprevious year. This continues the dowward trend in the percent of deaths autosied. The percent autopsied for all cauof death combined was heavily influenced by the low rates for the threleading causes of death—heart dise(6.6 percent), cancer (2.3 percent), astroke (2.9 percent). Among the 15 leaing causes of death, the highest percereported were for traumaticauses—homicide (97.2 percent), suic(55.1 percent), and accidents (48.4 pcent). The highest percents for nontramatic causes were for chronic liver diseaand cirrhosis (13.4 percent) and Alzhimer’s disease (7.1 percent).
e,-
.s-
o
fn
part A. Washington: Public Health Ser-vice. 1996.
3. Kochanek KD, Maurer JD, RosenbergHM. Causes of death contributing tochanges in life expectancy: United States,1984–89. National Center for Health Sta-tistics. Vital and Health Stat 20 (23).1994.
4. Arriaga EE. Changing trends in mortal-ity decline during the last decades. In:Ruzicka L, Wunsch G, Kane P, eds.Differential mortality: Methodologicalissues and biosocial factors. Oxford: Clar-endon Press. 1989.
5. Singh GK, Mathews TJ, Clarke SC, etal. Annual summary of births, marriages,divorces, and deaths: United States, 1994.Monthly vital statistics report; vol 43 no13. Hyattsville, Maryland: Public HealthService. 1995.
census record: United States, May–Aug1960. National Center for Health Statis-tics. Vital Health Stat 2(32). 1969.
16. Sorlie PD, Rogot E, Johnson NJ. Valid-ity of demographic characteristics on thedeath certificate. Epidemiology3(2):181–4. 1992.
17. Poe GS, Powell-Griner E, McLaughlinJK, et al. Comparability of the deathcertificate and the 1986 national mortal-ity followback survey. National Centerfor Health Statistics. Vital Health Stat2(118). 1993.
18. National Center for Health Statistics.Technical appendix. Vital statistics ofthe United States, 1989, vol I, natality.Washington: Public Health Service. 1992.
19. Hoyert DL. Effect on mortality rates ofthe 1989 changes in tabulating race.
National Center for Health Statistics.Vital Health Stat 20(25). 1994.
20. World Health Organization. Manual ofthe International Statistical Classifica-tion of Diseases, Injuries, and Causes ofDeath, based on the recommendations ofthe Ninth Revision Conference, 1975.Geneva: World Health Organization.1977.
21. Klebba AJ, Scott JH. Estimates ofselected comparability ratios based ondual coding of 1976 death certificates bythe Eighth and Ninth Revisions of theInternational Classification of Diseases.Monthly vital statistics report; vol 28 no11, supp. Hyattsville, Maryland: PublicHealth Service. 1980.
22. Klebba AJ, Dolman AB. Comparabilityof mortality statistics for the Seventhand Eighth Revisions of the Interna-tional Classification of Diseases, UnitedStates. National Center for Health Statis-tics. Vital Health Stat 2(66). 1975.
23. National Center for Health Statistics.Comparability of mortality statistics forthe Sixth and Seventh Revisions, UnitedStates, 1958. Vital Statistics–Specialreports; vol 51 no 4. Washington: PublicHealth Service. 1965.
24. National Center for Health Statistics.Vital statistics, instructions for classify-ing the underlying cause of death. NCHSinstruction manual; part 2a. Hyattsville,Maryland: Public Health Service. Pub-lished annually.
25. National Center for Health Statistics.Vital statistics, instructions for classify-ing multiple causes of death. NCHSinstruction manual; part 2b. Hyattsville,Maryland: Public Health Service. Pub-lished annually.
26. National Center for Health Statistics.Vital statistics, nonindexed terms, stan-dard abbreviations, and State geographiccodes used in mortality data classifica-tion. NCHS instruction manual; part 2e.Hyattsville, Maryland: Public Health Ser-vice. Published annually.
27. National Center for Health Statistics.Vital statistics, ICD–9 ACME decisiontables for classifying underlying causesof death. NCHS instruction manual; part2c. Hyattsville, Maryland: Public HealthService. Published annually.
28. National Center for Health Statistics.Vital statistics, data entry instructions forthe mortality medical indexing, classifi-cation, and retrieval system (MICAR).NCHS instruction manual; part 2g.Hyattsville, Maryland: Public Health Ser-vice. Published annually.
29. National Center for Health Statistics.Vital statistics, dictionary of valid termsfor the mortality medical indexing, clas-sification, and retrieval system (MICAR).NCHS instruction manual; part 2h.Hyattsville, Maryland: Public Health Ser-vice. Published annually.
30. Lampe TH. The nature of Alzheimer’sdisease. Alzheimer’s caregiver: Strate-gies for support. Seattle: University ofWashington Press. 1987.
31. Macera CA, Sun RK, Yeager KK,Brandes DA. Sensitivity and specificityof death certificate diagnoses for dement-ing illnesses, 1988–90. J Am GeriatrSoc. 40:479–81. 1992.
32. Newen AJ, Forster DP, Kay DWK. Deathcertification after a diagnosis of pres-enile dementia. J Epidemiol CommunityHealth. 47:293–7. 1993.
33. U.S. Bureau of the Census. Unpublisheddata from the 1990 census for persons ofSpanish origin by State.
34. U.S. Bureau of the Census. U.S. popula-tion estimates by age, sex, race, andHispanic origin: 1993. Census fileRESD0794. 1995.
35. U.S. Bureau of the Census. Residentpopulation of States, 1990–1994 bysingle year of age and sex. Census fileE94SASUS. 1995.
36. National Center for Health Statistics.Technical appendix. Vital statistics ofthe United States, 1990, vol II, mortality,part A. Washington: Public Health Ser-vice. 1994.
37. U.S. Bureau of the Census. Populationestimates based on unpublished tabula-tions prepared by the Housing and House-hold Economic Statistics Division. 1996.
38. Sirken MG. Comparison of two methodsof constructing abridged life tables byreference to a ‘‘standard’’ table. NationalCenter for Health Statistics. Vital HealthStat 2(4). 1966.
39. U.S. Bureau of the Census. Moneyincome of households, families, and per-sons in the United States: 1992. Currentpopulation reports, consumer income.Series P60–184. 1993.
40. Feinleib M, Zarate AO, eds. Reconsider-ing age adjustment procedures: Work-shop proceedings. National Center forHealth Statistics. Vital Health Stat 4(29).1992.
Monthly Vital Statistics Report + Vol. 45, No. 3(S) + September 30, 1996 13
List of detailed tables
1. Number of deaths, death rates, andage-adjusted death rates, by raceand sex: United States, 1940, 1950,1960, 1970, and 1975–94. . . . . . . 15
2. Number of deaths and death rates,by age, race, and sex: United States,1994. . . . . . . . . . . . . . . . . . . . . . 17
3. Abridged life table for the totalpopulation, 1994. . . . . . . . . . . . . 18
4. Life expectancy at selected ages byrace and sex: United States, 1994 . 18
5. Life expectancy at birth by raceand sex: United States, 1940, 1950,1960, and 1970–94. . . . . . . . . . . . 19
6. Age-specific and age-adjusted deathrates for the 15 leading causes ofdeath for the total population in1994 and selected components:United States, 1979, 1993, and1994. . . . . . . . . . . . . . . . . . . . . . 20
7. Number of deaths and death ratesfor the 10 leading causes of deathin specified age groups, by raceand sex: United States, 1994. . . . . 23
8. Number of deaths from 72 selectedcauses, Human immunodeficiencyvirus infection, andAlzheimer’s dis-ease by age: United States, 1994. . 34
9. Death rates for 72 selected causes,Human immunodeficiency virusinfection, and Alzheimer’s diseaseby age: United States, 1994. . . . . 37
10. Number of deaths from 72 selectedcauses, Human immunodeficiencyvirus infection, andAlzheimer’s dis-ease by race and sex: United States,1994. . . . . . . . . . . . . . . . . . . . . . 40
11. Death rates for 72 selected causes,Human immunodeficiency virusinfection, and Alzheimer’s diseaseby race and sex: United States,1994 . . . . . . . . . . . . . . . . . . . . . . 43
12. Age-adjusted death rates for 72selected causes, Human immunode-ficiency virus infection, and Alzhe-imer’s disease by race and sex:United States, 1994. . . . . . . . . . . 46
13. Number of deaths and death ratesfrom 16 selected subcategories ofMalignant neoplasms, includingneoplasms of lymphatic andhematopoietic tissues, by race andsex: United States, 1994. . . . . . . . 49
14. Number of deaths and death rates,by age, and age-adjusted death ratesaccording to specified Hispanic ori-gin, race for non-Hispanic origin,and sex: Total of 49 States and theDistrict of Columbia, 1994. . . . . . 50
15. Number of deaths and death ratesfor the 10 leading causes of deathfor Hispanic and white non-Hispanic origins, for specified agegroups: Total of 49 reporting Statesand the District of Columbia,1994. . . . . . . . . . . . . . . . . . . . . . 52
16. Number of deaths from injury byfirearms by age, race, and sex:United States, 1994. . . . . . . . . . . 55
17. Age-specific and age-adjusted deathrates for injury by firearms by age,race, and sex: United States, 1994 . .56
18. Number of deaths, death rates, andage-adjusted death rates for injuryby firearms, by race and sex: UnitedStates, 1979–94. . . . . . . . . . . . . . 57
19. Number of deaths, death rates, andage-adjusted death rates for drug-induced causes, by race and sex:United States, 1979–94. . . . . . . . . 58
20. Number of deaths, death rates, andage-adjusted death rates for alcohol-induced causes, by race and sex:United States, 1979–94. . . . . . . . . 59
21. Number of deaths and percent dis-tribution of deaths for ages 15 yearsand over, by marital status, raceand sex: United States,1994. . . . . . . . . . . . . . . . . . . . . . 60
22. Number of deaths and percent dis-tribution of deaths for ages 15 yearsand over, by educational attain-ment, race, and sex: Total of 45
reporting States and the District ofColumbia, 1994. . . . . . . . . . . . . . 61
23. Number of deaths and death ratesfor major causes of death for theUnited States, each division, eachState, Puerto Rico, Virgin Islands,and Guam; and by race and sex forthe United States, 1994. . . . . . . . 62
24. Infant, neonatal, and postneonatalmortality rates by race and sex:United States, 1940, 1950, 1960,1970, and 1975–94. . . . . . . . . . . . 64
25. Number of infant, neonatal, andpostneonatal deaths and mortalityrates, by specified Hispanic originand race for non-Hispanic origin:Total of 49 States and the Districtof Columbia, 1994 . . . . . . . . . . . 66
26. Percent of total deaths and infantmortality rates for 1994, percentchange in infant mortality ratesfrom 1993 to 1994 and 1979 to1994 for the 10 leading causes ofinfant death in 1994: UnitedStates. . . . . . . . . . . . . . . . . . . . . 66
27. Number of deaths under 1 year andinfant mortality rates for the 10leading causes of infant death byrace: United States, 1994. . . . . . . 67
28. Number of deaths under 1 year andinfant mortality rates for 61 selectedcauses and Human immunodefi-ciency virus infection, by race:United States, 1994. . . . . . . . . . . 68
29. Number of infant and neonataldeaths and mortality rates, by racefor the United States, each divi-sion, each State, Puerto Rico, Vir-gin Islands, and Guam, and sex forthe United States, 1994. . . . . . . . 70
30. Number of maternal deaths andmater-nal mortality rates for selected causes,by race: United States, 1994. . . . . . 71
31. Number of autopsies and percentof deaths for which autopsies werereported for the 15 leading causesof death: United States, 1994. . . . 71
List of figures
1. Crude and age-adjusted death rates:United States, 1930–94. . . . . . . . . 4
2. Death rates by age and sex: UnitedStates, 1950–94. . . . . . . . . . . . . . 5
3. Life expectancy by sex: UnitedStates, 1970–94. . . . . . . . . . . . . . . 6
4. Age-adjusted death rates for the 15leading causes of death: UnitedStates, 1950–94. . . . . . . . . . . . . . . 8
5. Infant mortality rates by race: UnitedStates, 1950–94. . . . . . . . . . . . . . . 11
14 Monthly Vital Statistics Report + Vol. 45, No. 3(S) + September 30, 1996
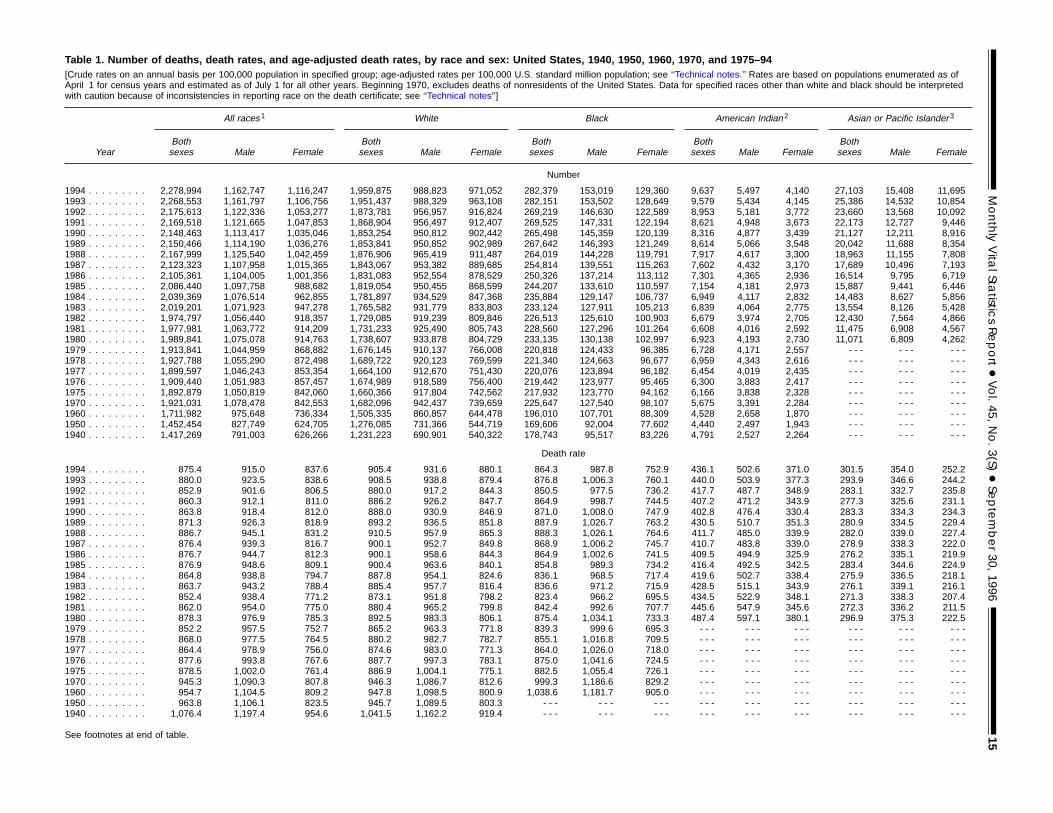
Table 1. Number of deaths, death rates, and age-adjusted death rates, by race and sex: United States, 1940, 1950, 1960, 1970, and 1975–94[Crude rates on an annual basis per 100,000 population in specified group; age-adjusted rates per 100,000 U.S. standard million population; see ‘‘Technical notes.’’ Rates are based on populations enumerated as ofApril 1 for census years and estimated as of July 1 for all other years. Beginning 1970, excludes deaths of nonresidents of the United States. Data for specified races other than white and black should be interpretedwith caution because of inconsistencies in reporting race on the death certificate; see ‘‘Technical notes’’]
Year
All races1 White Black American Indian2 Asian or Pacific Islander 3
Bothsexes Male Female
Bothsexes Male Female
Bothsexes Male Female
Bothsexes Male Female
Bothsexes Male Female
Number
1994 . . . . . . . . . 2,278,994 1,162,747 1,116,247 1,959,875 988,823 971,052 282,379 153,019 129,360 9,637 5,497 4,140 27,103 15,408 11,6951993 . . . . . . . . . 2,268,553 1,161,797 1,106,756 1,951,437 988,329 963,108 282,151 153,502 128,649 9,579 5,434 4,145 25,386 14,532 10,8541992 . . . . . . . . . 2,175,613 1,122,336 1,053,277 1,873,781 956,957 916,824 269,219 146,630 122,589 8,953 5,181 3,772 23,660 13,568 10,0921991 . . . . . . . . . 2,169,518 1,121,665 1,047,853 1,868,904 956,497 912,407 269,525 147,331 122,194 8,621 4,948 3,673 22,173 12,727 9,4461990 . . . . . . . . . 2,148,463 1,113,417 1,035,046 1,853,254 950,812 902,442 265,498 145,359 120,139 8,316 4,877 3,439 21,127 12,211 8,9161989 . . . . . . . . . 2,150,466 1,114,190 1,036,276 1,853,841 950,852 902,989 267,642 146,393 121,249 8,614 5,066 3,548 20,042 11,688 8,3541988 . . . . . . . . . 2,167,999 1,125,540 1,042,459 1,876,906 965,419 911,487 264,019 144,228 119,791 7,917 4,617 3,300 18,963 11,155 7,8081987 . . . . . . . . . 2,123,323 1,107,958 1,015,365 1,843,067 953,382 889,685 254,814 139,551 115,263 7,602 4,432 3,170 17,689 10,496 7,1931986 . . . . . . . . . 2,105,361 1,104,005 1,001,356 1,831,083 952,554 878,529 250,326 137,214 113,112 7,301 4,365 2,936 16,514 9,795 6,7191985 . . . . . . . . . 2,086,440 1,097,758 988,682 1,819,054 950,455 868,599 244,207 133,610 110,597 7,154 4,181 2,973 15,887 9,441 6,4461984 . . . . . . . . . 2,039,369 1,076,514 962,855 1,781,897 934,529 847,368 235,884 129,147 106,737 6,949 4,117 2,832 14,483 8,627 5,8561983 . . . . . . . . . 2,019,201 1,071,923 947,278 1,765,582 931,779 833,803 233,124 127,911 105,213 6,839 4,064 2,775 13,554 8,126 5,4281982 . . . . . . . . . 1,974,797 1,056,440 918,357 1,729,085 919,239 809,846 226,513 125,610 100,903 6,679 3,974 2,705 12,430 7,564 4,8661981 . . . . . . . . . 1,977,981 1,063,772 914,209 1,731,233 925,490 805,743 228,560 127,296 101,264 6,608 4,016 2,592 11,475 6,908 4,5671980 . . . . . . . . . 1,989,841 1,075,078 914,763 1,738,607 933,878 804,729 233,135 130,138 102,997 6,923 4,193 2,730 11,071 6,809 4,2621979 . . . . . . . . . 1,913,841 1,044,959 868,882 1,676,145 910,137 766,008 220,818 124,433 96,385 6,728 4,171 2,557 - - - - - - - - -1978 . . . . . . . . . 1,927,788 1,055,290 872,498 1,689,722 920,123 769,599 221,340 124,663 96,677 6,959 4,343 2,616 - - - - - - - - -1977 . . . . . . . . . 1,899,597 1,046,243 853,354 1,664,100 912,670 751,430 220,076 123,894 96,182 6,454 4,019 2,435 - - - - - - - - -1976 . . . . . . . . . 1,909,440 1,051,983 857,457 1,674,989 918,589 756,400 219,442 123,977 95,465 6,300 3,883 2,417 - - - - - - - - -1975 . . . . . . . . . 1,892,879 1,050,819 842,060 1,660,366 917,804 742,562 217,932 123,770 94,162 6,166 3,838 2,328 - - - - - - - - -1970 . . . . . . . . . 1,921,031 1,078,478 842,553 1,682,096 942,437 739,659 225,647 127,540 98,107 5,675 3,391 2,284 - - - - - - - - -1960 . . . . . . . . . 1,711,982 975,648 736,334 1,505,335 860,857 644,478 196,010 107,701 88,309 4,528 2,658 1,870 - - - - - - - - -1950 . . . . . . . . . 1,452,454 827,749 624,705 1,276,085 731,366 544,719 169,606 92,004 77,602 4,440 2,497 1,943 - - - - - - - - -1940 . . . . . . . . . 1,417,269 791,003 626,266 1,231,223 690,901 540,322 178,743 95,517 83,226 4,791 2,527 2,264 - - - - - - - - -
Death rate
1994 . . . . . . . . . 875.4 915.0 837.6 905.4 931.6 880.1 864.3 987.8 752.9 436.1 502.6 371.0 301.5 354.0 252.21993 . . . . . . . . . 880.0 923.5 838.6 908.5 938.8 879.4 876.8 1,006.3 760.1 440.0 503.9 377.3 293.9 346.6 244.21992 . . . . . . . . . 852.9 901.6 806.5 880.0 917.2 844.3 850.5 977.5 736.2 417.7 487.7 348.9 283.1 332.7 235.81991 . . . . . . . . . 860.3 912.1 811.0 886.2 926.2 847.7 864.9 998.7 744.5 407.2 471.2 343.9 277.3 325.6 231.11990 . . . . . . . . . 863.8 918.4 812.0 888.0 930.9 846.9 871.0 1,008.0 747.9 402.8 476.4 330.4 283.3 334.3 234.31989 . . . . . . . . . 871.3 926.3 818.9 893.2 936.5 851.8 887.9 1,026.7 763.2 430.5 510.7 351.3 280.9 334.5 229.41988 . . . . . . . . . 886.7 945.1 831.2 910.5 957.9 865.3 888.3 1,026.1 764.6 411.7 485.0 339.9 282.0 339.0 227.41987 . . . . . . . . . 876.4 939.3 816.7 900.1 952.7 849.8 868.9 1,006.2 745.7 410.7 483.8 339.0 278.9 338.3 222.01986 . . . . . . . . . 876.7 944.7 812.3 900.1 958.6 844.3 864.9 1,002.6 741.5 409.5 494.9 325.9 276.2 335.1 219.91985 . . . . . . . . . 876.9 948.6 809.1 900.4 963.6 840.1 854.8 989.3 734.2 416.4 492.5 342.5 283.4 344.6 224.91984 . . . . . . . . . 864.8 938.8 794.7 887.8 954.1 824.6 836.1 968.5 717.4 419.6 502.7 338.4 275.9 336.5 218.11983 . . . . . . . . . 863.7 943.2 788.4 885.4 957.7 816.4 836.6 971.2 715.9 428.5 515.1 343.9 276.1 339.1 216.11982 . . . . . . . . . 852.4 938.4 771.2 873.1 951.8 798.2 823.4 966.2 695.5 434.5 522.9 348.1 271.3 338.3 207.41981 . . . . . . . . . 862.0 954.0 775.0 880.4 965.2 799.8 842.4 992.6 707.7 445.6 547.9 345.6 272.3 336.2 211.51980 . . . . . . . . . 878.3 976.9 785.3 892.5 983.3 806.1 875.4 1,034.1 733.3 487.4 597.1 380.1 296.9 375.3 222.51979 . . . . . . . . . 852.2 957.5 752.7 865.2 963.3 771.8 839.3 999.6 695.3 - - - - - - - - - - - - - - - - - -1978 . . . . . . . . . 868.0 977.5 764.5 880.2 982.7 782.7 855.1 1,016.8 709.5 - - - - - - - - - - - - - - - - - -1977 . . . . . . . . . 864.4 978.9 756.0 874.6 983.0 771.3 864.0 1,026.0 718.0 - - - - - - - - - - - - - - - - - -1976 . . . . . . . . . 877.6 993.8 767.6 887.7 997.3 783.1 875.0 1,041.6 724.5 - - - - - - - - - - - - - - - - - -1975 . . . . . . . . . 878.5 1,002.0 761.4 886.9 1,004.1 775.1 882.5 1,055.4 726.1 - - - - - - - - - - - - - - - - - -1970 . . . . . . . . . 945.3 1,090.3 807.8 946.3 1,086.7 812.6 999.3 1,186.6 829.2 - - - - - - - - - - - - - - - - - -1960 . . . . . . . . . 954.7 1,104.5 809.2 947.8 1,098.5 800.9 1,038.6 1,181.7 905.0 - - - - - - - - - - - - - - - - - -1950 . . . . . . . . . 963.8 1,106.1 823.5 945.7 1,089.5 803.3 - - - - - - - - - - - - - - - - - - - - - - - - - - -1940 . . . . . . . . . 1,076.4 1,197.4 954.6 1,041.5 1,162.2 919.4 - - - - - - - - - - - - - - - - - - - - - - - - - - -
See footnotes at end of table.
MonthlyVita
lStatistic
sReport+Vol.45,
No.3(S)
+September30,
199615
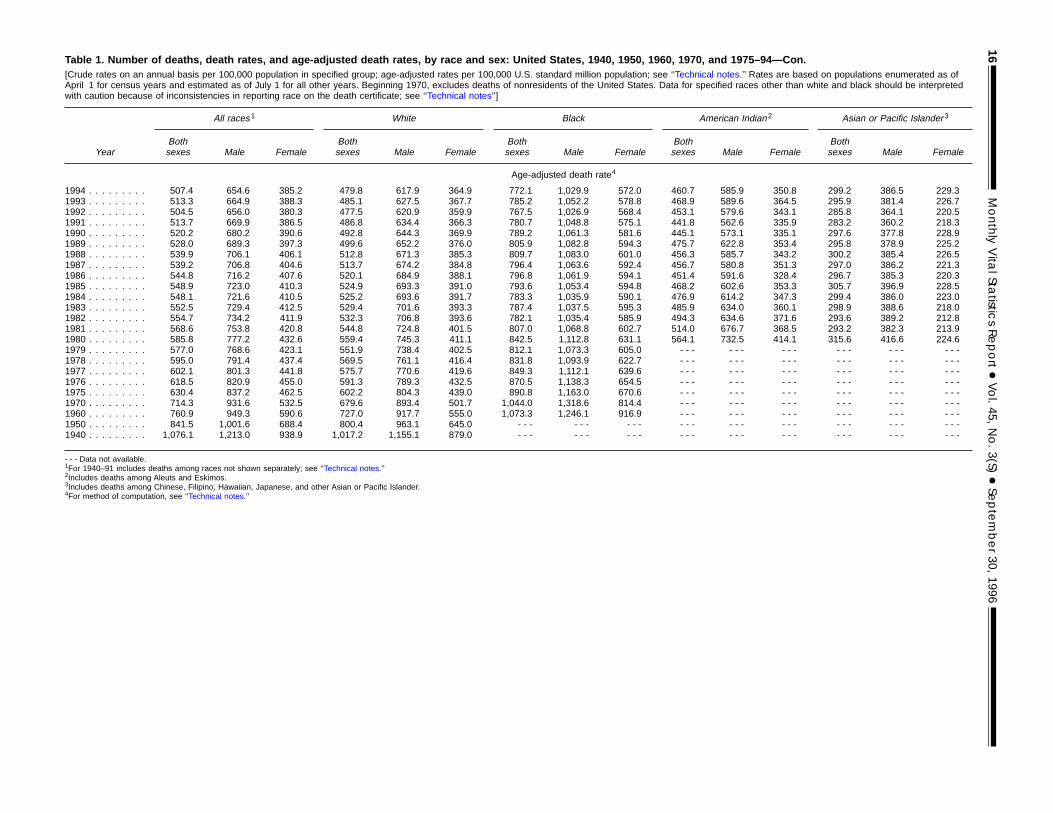
Table 1. Number of deaths, death rates, and age-adjusted death rates, by race and sex: United States, 1940, 1950, 1960, 1970, and 1975–94—Con.[Crude rates on an annual basis per 100,000 population in specified group; age-adjusted rates per 100,000 U.S. standard million population; see ‘‘Technical notes.’’ Rates are based on populations enumerated as ofApril 1 for census years and estimated as of July 1 for all other years. Beginning 1970, excludes deaths of nonresidents of the United States. Data for specified races other than white and black should be interpretedwith caution because of inconsistencies in reporting race on the death certificate; see ‘‘Technical notes’’]
Year
All races1 White Black American Indian2 Asian or Pacific Islander 3
Bothsexes Male Female
Bothsexes Male Female
Bothsexes Male Female
Bothsexes Male Female
Bothsexes Male Female
Age-adjusted death rate4
1994 . . . . . . . . . 507.4 654.6 385.2 479.8 617.9 364.9 772.1 1,029.9 572.0 460.7 585.9 350.8 299.2 386.5 229.31993 . . . . . . . . . 513.3 664.9 388.3 485.1 627.5 367.7 785.2 1,052.2 578.8 468.9 589.6 364.5 295.9 381.4 226.71992 . . . . . . . . . 504.5 656.0 380.3 477.5 620.9 359.9 767.5 1,026.9 568.4 453.1 579.6 343.1 285.8 364.1 220.51991 . . . . . . . . . 513.7 669.9 386.5 486.8 634.4 366.3 780.7 1,048.8 575.1 441.8 562.6 335.9 283.2 360.2 218.31990 . . . . . . . . . 520.2 680.2 390.6 492.8 644.3 369.9 789.2 1,061.3 581.6 445.1 573.1 335.1 297.6 377.8 228.91989 . . . . . . . . . 528.0 689.3 397.3 499.6 652.2 376.0 805.9 1,082.8 594.3 475.7 622.8 353.4 295.8 378.9 225.21988 . . . . . . . . . 539.9 706.1 406.1 512.8 671.3 385.3 809.7 1,083.0 601.0 456.3 585.7 343.2 300.2 385.4 226.51987 . . . . . . . . . 539.2 706.8 404.6 513.7 674.2 384.8 796.4 1,063.6 592.4 456.7 580.8 351.3 297.0 386.2 221.31986 . . . . . . . . . 544.8 716.2 407.6 520.1 684.9 388.1 796.8 1,061.9 594.1 451.4 591.6 328.4 296.7 385.3 220.31985 . . . . . . . . . 548.9 723.0 410.3 524.9 693.3 391.0 793.6 1,053.4 594.8 468.2 602.6 353.3 305.7 396.9 228.51984 . . . . . . . . . 548.1 721.6 410.5 525.2 693.6 391.7 783.3 1,035.9 590.1 476.9 614.2 347.3 299.4 386.0 223.01983 . . . . . . . . . 552.5 729.4 412.5 529.4 701.6 393.3 787.4 1,037.5 595.3 485.9 634.0 360.1 298.9 388.6 218.01982 . . . . . . . . . 554.7 734.2 411.9 532.3 706.8 393.6 782.1 1,035.4 585.9 494.3 634.6 371.6 293.6 389.2 212.81981 . . . . . . . . . 568.6 753.8 420.8 544.8 724.8 401.5 807.0 1,068.8 602.7 514.0 676.7 368.5 293.2 382.3 213.91980 . . . . . . . . . 585.8 777.2 432.6 559.4 745.3 411.1 842.5 1,112.8 631.1 564.1 732.5 414.1 315.6 416.6 224.61979 . . . . . . . . . 577.0 768.6 423.1 551.9 738.4 402.5 812.1 1,073.3 605.0 - - - - - - - - - - - - - - - - - -1978 . . . . . . . . . 595.0 791.4 437.4 569.5 761.1 416.4 831.8 1,093.9 622.7 - - - - - - - - - - - - - - - - - -1977 . . . . . . . . . 602.1 801.3 441.8 575.7 770.6 419.6 849.3 1,112.1 639.6 - - - - - - - - - - - - - - - - - -1976 . . . . . . . . . 618.5 820.9 455.0 591.3 789.3 432.5 870.5 1,138.3 654.5 - - - - - - - - - - - - - - - - - -1975 . . . . . . . . . 630.4 837.2 462.5 602.2 804.3 439.0 890.8 1,163.0 670.6 - - - - - - - - - - - - - - - - - -1970 . . . . . . . . . 714.3 931.6 532.5 679.6 893.4 501.7 1,044.0 1,318.6 814.4 - - - - - - - - - - - - - - - - - -1960 . . . . . . . . . 760.9 949.3 590.6 727.0 917.7 555.0 1,073.3 1,246.1 916.9 - - - - - - - - - - - - - - - - - -1950 . . . . . . . . . 841.5 1,001.6 688.4 800.4 963.1 645.0 - - - - - - - - - - - - - - - - - - - - - - - - - - -1940 . . . . . . . . . 1,076.1 1,213.0 938.9 1,017.2 1,155.1 879.0 - - - - - - - - - - - - - - - - - - - - - - - - - - -
- - - Data not available.1For 1940–91 includes deaths among races not shown separately; see ‘‘Technical notes.’’2Includes deaths among Aleuts and Eskimos.3Includes deaths among Chinese, Filipino, Hawaiian, Japanese, and other Asian or Pacific Islander.4For method of computation, see ‘‘Technical notes.’’
16MonthlyVita
lStatistic
sReport+Vol.45,
No.3(S)
+September30,
1996
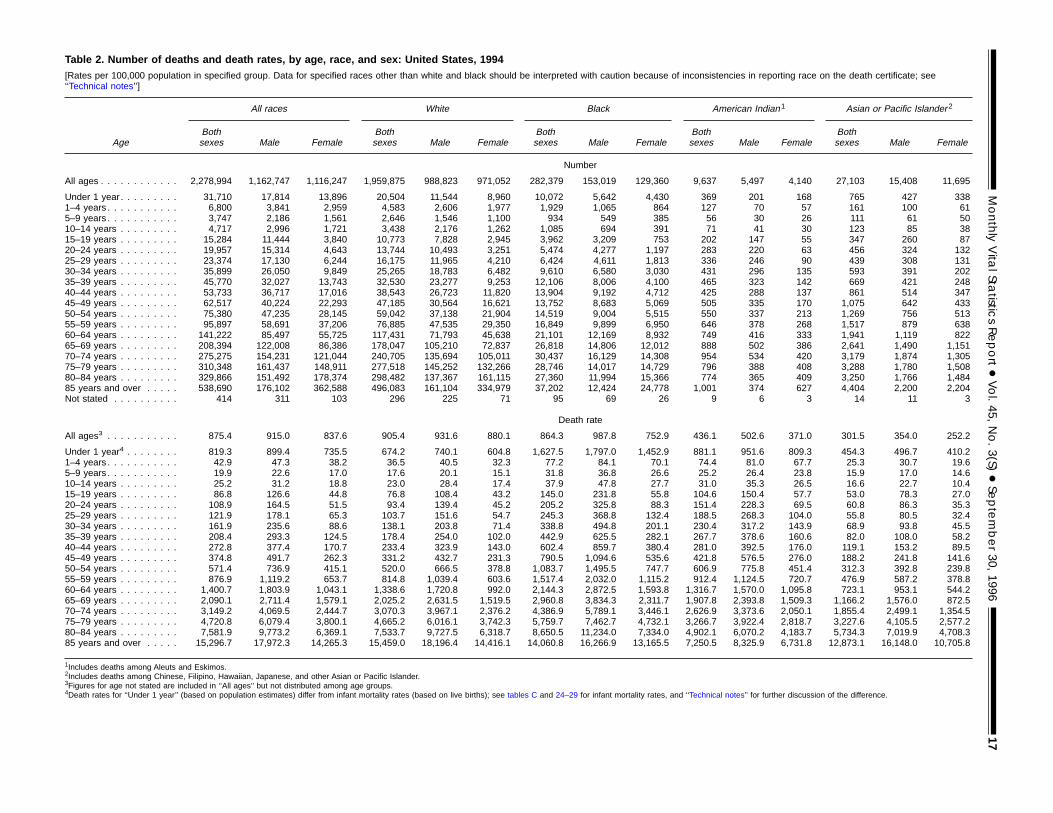
Table 2. Number of deaths and death rates, by age, race, and sex: United States, 1994[Rates per 100,000 population in specified group. Data for specified races other than white and black should be interpreted with caution because of inconsistencies in reporting race on the death certificate; see‘‘Technical notes’’]
Age
All races White Black American Indian1 Asian or Pacific Islander 2
Bothsexes Male Female
Bothsexes Male Female
Bothsexes Male Female
Bothsexes Male Female
Bothsexes Male Female
Number
All ages . . . . . . . . . . . . 2,278,994 1,162,747 1,116,247 1,959,875 988,823 971,052 282,379 153,019 129,360 9,637 5,497 4,140 27,103 15,408 11,695
Under 1 year . . . . . . . . . 31,710 17,814 13,896 20,504 11,544 8,960 10,072 5,642 4,430 369 201 168 765 427 3381–4 years . . . . . . . . . . . 6,800 3,841 2,959 4,583 2,606 1,977 1,929 1,065 864 127 70 57 161 100 615–9 years . . . . . . . . . . . 3,747 2,186 1,561 2,646 1,546 1,100 934 549 385 56 30 26 111 61 5010–14 years . . . . . . . . . 4,717 2,996 1,721 3,438 2,176 1,262 1,085 694 391 71 41 30 123 85 3815–19 years . . . . . . . . . 15,284 11,444 3,840 10,773 7,828 2,945 3,962 3,209 753 202 147 55 347 260 8720–24 years . . . . . . . . . 19,957 15,314 4,643 13,744 10,493 3,251 5,474 4,277 1,197 283 220 63 456 324 13225–29 years . . . . . . . . . 23,374 17,130 6,244 16,175 11,965 4,210 6,424 4,611 1,813 336 246 90 439 308 13130–34 years . . . . . . . . . 35,899 26,050 9,849 25,265 18,783 6,482 9,610 6,580 3,030 431 296 135 593 391 20235–39 years . . . . . . . . . 45,770 32,027 13,743 32,530 23,277 9,253 12,106 8,006 4,100 465 323 142 669 421 24840–44 years . . . . . . . . . 53,733 36,717 17,016 38,543 26,723 11,820 13,904 9,192 4,712 425 288 137 861 514 34745–49 years . . . . . . . . . 62,517 40,224 22,293 47,185 30,564 16,621 13,752 8,683 5,069 505 335 170 1,075 642 43350–54 years . . . . . . . . . 75,380 47,235 28,145 59,042 37,138 21,904 14,519 9,004 5,515 550 337 213 1,269 756 51355–59 years . . . . . . . . . 95,897 58,691 37,206 76,885 47,535 29,350 16,849 9,899 6,950 646 378 268 1,517 879 63860–64 years . . . . . . . . . 141,222 85,497 55,725 117,431 71,793 45,638 21,101 12,169 8,932 749 416 333 1,941 1,119 82265–69 years . . . . . . . . . 208,394 122,008 86,386 178,047 105,210 72,837 26,818 14,806 12,012 888 502 386 2,641 1,490 1,15170–74 years . . . . . . . . . 275,275 154,231 121,044 240,705 135,694 105,011 30,437 16,129 14,308 954 534 420 3,179 1,874 1,30575–79 years . . . . . . . . . 310,348 161,437 148,911 277,518 145,252 132,266 28,746 14,017 14,729 796 388 408 3,288 1,780 1,50880–84 years . . . . . . . . . 329,866 151,492 178,374 298,482 137,367 161,115 27,360 11,994 15,366 774 365 409 3,250 1,766 1,48485 years and over . . . . . 538,690 176,102 362,588 496,083 161,104 334,979 37,202 12,424 24,778 1,001 374 627 4,404 2,200 2,204Not stated . . . . . . . . . . 414 311 103 296 225 71 95 69 26 9 6 3 14 11 3
Death rate
All ages3 . . . . . . . . . . . 875.4 915.0 837.6 905.4 931.6 880.1 864.3 987.8 752.9 436.1 502.6 371.0 301.5 354.0 252.2
Under 1 year4 . . . . . . . . 819.3 899.4 735.5 674.2 740.1 604.8 1,627.5 1,797.0 1,452.9 881.1 951.6 809.3 454.3 496.7 410.21–4 years . . . . . . . . . . . 42.9 47.3 38.2 36.5 40.5 32.3 77.2 84.1 70.1 74.4 81.0 67.7 25.3 30.7 19.65–9 years . . . . . . . . . . . 19.9 22.6 17.0 17.6 20.1 15.1 31.8 36.8 26.6 25.2 26.4 23.8 15.9 17.0 14.610–14 years . . . . . . . . . 25.2 31.2 18.8 23.0 28.4 17.4 37.9 47.8 27.7 31.0 35.3 26.5 16.6 22.7 10.415–19 years . . . . . . . . . 86.8 126.6 44.8 76.8 108.4 43.2 145.0 231.8 55.8 104.6 150.4 57.7 53.0 78.3 27.020–24 years . . . . . . . . . 108.9 164.5 51.5 93.4 139.4 45.2 205.2 325.8 88.3 151.4 228.3 69.5 60.8 86.3 35.325–29 years . . . . . . . . . 121.9 178.1 65.3 103.7 151.6 54.7 245.3 368.8 132.4 188.5 268.3 104.0 55.8 80.5 32.430–34 years . . . . . . . . . 161.9 235.6 88.6 138.1 203.8 71.4 338.8 494.8 201.1 230.4 317.2 143.9 68.9 93.8 45.535–39 years . . . . . . . . . 208.4 293.3 124.5 178.4 254.0 102.0 442.9 625.5 282.1 267.7 378.6 160.6 82.0 108.0 58.240–44 years . . . . . . . . . 272.8 377.4 170.7 233.4 323.9 143.0 602.4 859.7 380.4 281.0 392.5 176.0 119.1 153.2 89.545–49 years . . . . . . . . . 374.8 491.7 262.3 331.2 432.7 231.3 790.5 1,094.6 535.6 421.8 576.5 276.0 188.2 241.8 141.650–54 years . . . . . . . . . 571.4 736.9 415.1 520.0 666.5 378.8 1,083.7 1,495.5 747.7 606.9 775.8 451.4 312.3 392.8 239.855–59 years . . . . . . . . . 876.9 1,119.2 653.7 814.8 1,039.4 603.6 1,517.4 2,032.0 1,115.2 912.4 1,124.5 720.7 476.9 587.2 378.860–64 years . . . . . . . . . 1,400.7 1,803.9 1,043.1 1,338.6 1,720.8 992.0 2,144.3 2,872.5 1,593.8 1,316.7 1,570.0 1,095.8 723.1 953.1 544.265–69 years . . . . . . . . . 2,090.1 2,711.4 1,579.1 2,025.2 2,631.5 1,519.5 2,960.8 3,834.3 2,311.7 1,907.8 2,393.8 1,509.3 1,166.2 1,576.0 872.570–74 years . . . . . . . . . 3,149.2 4,069.5 2,444.7 3,070.3 3,967.1 2,376.2 4,386.9 5,789.1 3,446.1 2,626.9 3,373.6 2,050.1 1,855.4 2,499.1 1,354.575–79 years . . . . . . . . . 4,720.8 6,079.4 3,800.1 4,665.2 6,016.1 3,742.3 5,759.7 7,462.7 4,732.1 3,266.7 3,922.4 2,818.7 3,227.6 4,105.5 2,577.280–84 years . . . . . . . . . 7,581.9 9,773.2 6,369.1 7,533.7 9,727.5 6,318.7 8,650.5 11,234.0 7,334.0 4,902.1 6,070.2 4,183.7 5,734.3 7,019.9 4,708.385 years and over . . . . . 15,296.7 17,972.3 14,265.3 15,459.0 18,196.4 14,416.1 14,060.8 16,266.9 13,165.5 7,250.5 8,325.9 6,731.8 12,873.1 16,148.0 10,705.8
1Includes deaths among Aleuts and Eskimos.2Includes deaths among Chinese, Filipino, Hawaiian, Japanese, and other Asian or Pacific Islander.3Figures for age not stated are included in ‘‘All ages’’ but not distributed among age groups.4Death rates for ‘‘Under 1 year’’ (based on population estimates) differ from infant mortality rates (based on live births); see tables C and 24–29 for infant mortality rates, and ‘‘Technical notes’’ for further discussion of the difference.
MonthlyVita
lStatistic
sReport+Vol.45,
No.3(S)
+September30,
199617
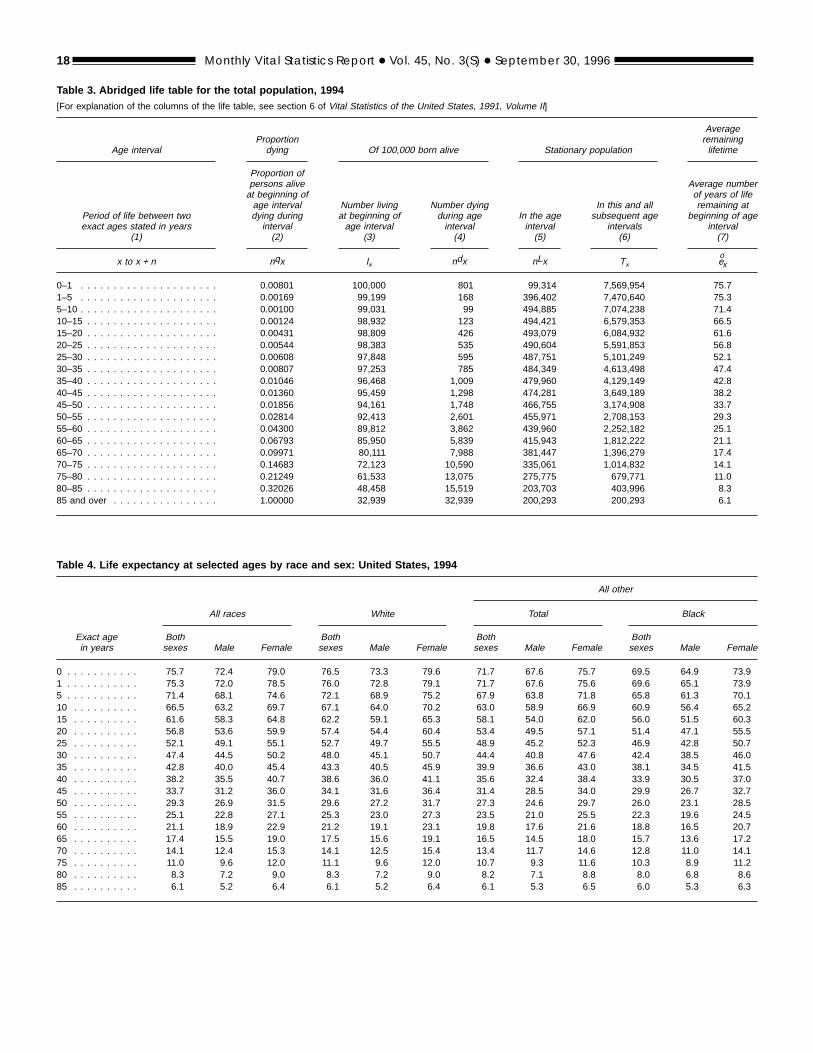
Table 3. Abridged life table for the total population, 1994[For explanation of the columns of the life table, see section 6 of Vital Statistics of the United States, 1991, Volume II]
Age intervalProportiondying Of 100,000 born alive Stationary population
Averageremaininglifetime
Period of life between twoexact ages stated in years
(1)
Proportion ofpersons aliveat beginning ofage intervaldying duringinterval(2)
Number livingat beginning ofage interval
(3)
Number dyingduring ageinterval(4)
In the ageinterval(5)
In this and allsubsequent age
intervals(6)
Average numberof years of liferemaining at
beginning of ageinterval(7)
x to x + n nqx lx ndx nLx Tx eox
0–1 . . . . . . . . . . . . . . . . . . . . . 0.00801 100,000 801 99,314 7,569,954 75.71–5 . . . . . . . . . . . . . . . . . . . . . 0.00169 99,199 168 396,402 7,470,640 75.35–10 . . . . . . . . . . . . . . . . . . . . . 0.00100 99,031 99 494,885 7,074,238 71.410–15 . . . . . . . . . . . . . . . . . . . . 0.00124 98,932 123 494,421 6,579,353 66.515–20 . . . . . . . . . . . . . . . . . . . . 0.00431 98,809 426 493,079 6,084,932 61.620–25 . . . . . . . . . . . . . . . . . . . . 0.00544 98,383 535 490,604 5,591,853 56.825–30 . . . . . . . . . . . . . . . . . . . . 0.00608 97,848 595 487,751 5,101,249 52.130–35 . . . . . . . . . . . . . . . . . . . . 0.00807 97,253 785 484,349 4,613,498 47.435–40 . . . . . . . . . . . . . . . . . . . . 0.01046 96,468 1,009 479,960 4,129,149 42.840–45 . . . . . . . . . . . . . . . . . . . . 0.01360 95,459 1,298 474,281 3,649,189 38.245–50 . . . . . . . . . . . . . . . . . . . . 0.01856 94,161 1,748 466,755 3,174,908 33.750–55 . . . . . . . . . . . . . . . . . . . . 0.02814 92,413 2,601 455,971 2,708,153 29.355–60 . . . . . . . . . . . . . . . . . . . . 0.04300 89,812 3,862 439,960 2,252,182 25.160–65 . . . . . . . . . . . . . . . . . . . . 0.06793 85,950 5,839 415,943 1,812,222 21.165–70 . . . . . . . . . . . . . . . . . . . . 0.09971 80,111 7,988 381,447 1,396,279 17.470–75 . . . . . . . . . . . . . . . . . . . . 0.14683 72,123 10,590 335,061 1,014,832 14.175–80 . . . . . . . . . . . . . . . . . . . . 0.21249 61,533 13,075 275,775 679,771 11.080–85 . . . . . . . . . . . . . . . . . . . . 0.32026 48,458 15,519 203,703 403,996 8.385 and over . . . . . . . . . . . . . . . . 1.00000 32,939 32,939 200,293 200,293 6.1
Table 4. Life expectancy at selected ages by race and sex: United States, 1994
Exact agein years
All other
All races White Total Black
Bothsexes Male Female
Bothsexes Male Female
Bothsexes Male Female
Bothsexes Male Female
0 . . . . . . . . . . . 75.7 72.4 79.0 76.5 73.3 79.6 71.7 67.6 75.7 69.5 64.9 73.91 . . . . . . . . . . . 75.3 72.0 78.5 76.0 72.8 79.1 71.7 67.6 75.6 69.6 65.1 73.95 . . . . . . . . . . . 71.4 68.1 74.6 72.1 68.9 75.2 67.9 63.8 71.8 65.8 61.3 70.110 . . . . . . . . . . 66.5 63.2 69.7 67.1 64.0 70.2 63.0 58.9 66.9 60.9 56.4 65.215 . . . . . . . . . . 61.6 58.3 64.8 62.2 59.1 65.3 58.1 54.0 62.0 56.0 51.5 60.320 . . . . . . . . . . 56.8 53.6 59.9 57.4 54.4 60.4 53.4 49.5 57.1 51.4 47.1 55.525 . . . . . . . . . . 52.1 49.1 55.1 52.7 49.7 55.5 48.9 45.2 52.3 46.9 42.8 50.730 . . . . . . . . . . 47.4 44.5 50.2 48.0 45.1 50.7 44.4 40.8 47.6 42.4 38.5 46.035 . . . . . . . . . . 42.8 40.0 45.4 43.3 40.5 45.9 39.9 36.6 43.0 38.1 34.5 41.540 . . . . . . . . . . 38.2 35.5 40.7 38.6 36.0 41.1 35.6 32.4 38.4 33.9 30.5 37.045 . . . . . . . . . . 33.7 31.2 36.0 34.1 31.6 36.4 31.4 28.5 34.0 29.9 26.7 32.750 . . . . . . . . . . 29.3 26.9 31.5 29.6 27.2 31.7 27.3 24.6 29.7 26.0 23.1 28.555 . . . . . . . . . . 25.1 22.8 27.1 25.3 23.0 27.3 23.5 21.0 25.5 22.3 19.6 24.560 . . . . . . . . . . 21.1 18.9 22.9 21.2 19.1 23.1 19.8 17.6 21.6 18.8 16.5 20.765 . . . . . . . . . . 17.4 15.5 19.0 17.5 15.6 19.1 16.5 14.5 18.0 15.7 13.6 17.270 . . . . . . . . . . 14.1 12.4 15.3 14.1 12.5 15.4 13.4 11.7 14.6 12.8 11.0 14.175 . . . . . . . . . . 11.0 9.6 12.0 11.1 9.6 12.0 10.7 9.3 11.6 10.3 8.9 11.280 . . . . . . . . . . 8.3 7.2 9.0 8.3 7.2 9.0 8.2 7.1 8.8 8.0 6.8 8.685 . . . . . . . . . . 6.1 5.2 6.4 6.1 5.2 6.4 6.1 5.3 6.5 6.0 5.3 6.3
18 Monthly Vital Statistics Report + Vol. 45, No. 3(S) + September 30, 1996
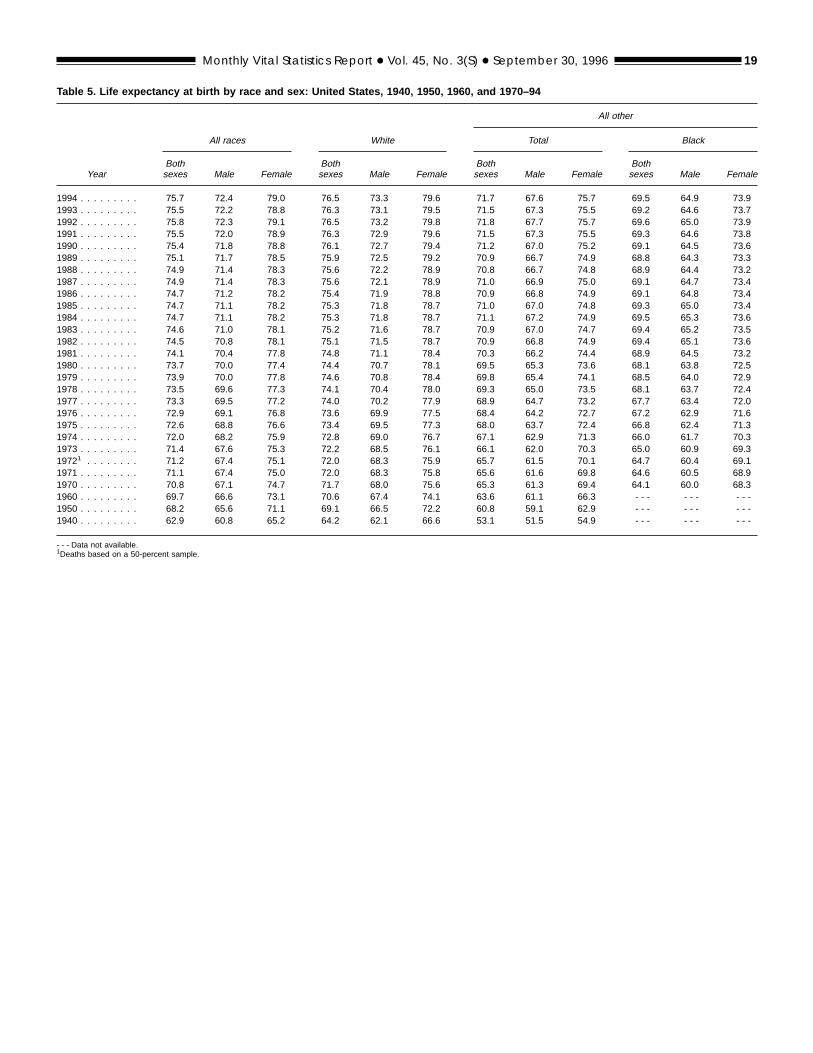
Table 5. Life expectancy at birth by race and sex: United States, 1940, 1950, 1960, and 1970–94
Year
All other
All races White Total Black
Bothsexes Male Female
Bothsexes Male Female
Bothsexes Male Female
Bothsexes Male Female
1994 . . . . . . . . . 75.7 72.4 79.0 76.5 73.3 79.6 71.7 67.6 75.7 69.5 64.9 73.91993 . . . . . . . . . 75.5 72.2 78.8 76.3 73.1 79.5 71.5 67.3 75.5 69.2 64.6 73.71992 . . . . . . . . . 75.8 72.3 79.1 76.5 73.2 79.8 71.8 67.7 75.7 69.6 65.0 73.91991 . . . . . . . . . 75.5 72.0 78.9 76.3 72.9 79.6 71.5 67.3 75.5 69.3 64.6 73.81990 . . . . . . . . . 75.4 71.8 78.8 76.1 72.7 79.4 71.2 67.0 75.2 69.1 64.5 73.61989 . . . . . . . . . 75.1 71.7 78.5 75.9 72.5 79.2 70.9 66.7 74.9 68.8 64.3 73.31988 . . . . . . . . . 74.9 71.4 78.3 75.6 72.2 78.9 70.8 66.7 74.8 68.9 64.4 73.21987 . . . . . . . . . 74.9 71.4 78.3 75.6 72.1 78.9 71.0 66.9 75.0 69.1 64.7 73.41986 . . . . . . . . . 74.7 71.2 78.2 75.4 71.9 78.8 70.9 66.8 74.9 69.1 64.8 73.41985 . . . . . . . . . 74.7 71.1 78.2 75.3 71.8 78.7 71.0 67.0 74.8 69.3 65.0 73.41984 . . . . . . . . . 74.7 71.1 78.2 75.3 71.8 78.7 71.1 67.2 74.9 69.5 65.3 73.61983 . . . . . . . . . 74.6 71.0 78.1 75.2 71.6 78.7 70.9 67.0 74.7 69.4 65.2 73.51982 . . . . . . . . . 74.5 70.8 78.1 75.1 71.5 78.7 70.9 66.8 74.9 69.4 65.1 73.61981 . . . . . . . . . 74.1 70.4 77.8 74.8 71.1 78.4 70.3 66.2 74.4 68.9 64.5 73.21980 . . . . . . . . . 73.7 70.0 77.4 74.4 70.7 78.1 69.5 65.3 73.6 68.1 63.8 72.51979 . . . . . . . . . 73.9 70.0 77.8 74.6 70.8 78.4 69.8 65.4 74.1 68.5 64.0 72.91978 . . . . . . . . . 73.5 69.6 77.3 74.1 70.4 78.0 69.3 65.0 73.5 68.1 63.7 72.41977 . . . . . . . . . 73.3 69.5 77.2 74.0 70.2 77.9 68.9 64.7 73.2 67.7 63.4 72.01976 . . . . . . . . . 72.9 69.1 76.8 73.6 69.9 77.5 68.4 64.2 72.7 67.2 62.9 71.61975 . . . . . . . . . 72.6 68.8 76.6 73.4 69.5 77.3 68.0 63.7 72.4 66.8 62.4 71.31974 . . . . . . . . . 72.0 68.2 75.9 72.8 69.0 76.7 67.1 62.9 71.3 66.0 61.7 70.31973 . . . . . . . . . 71.4 67.6 75.3 72.2 68.5 76.1 66.1 62.0 70.3 65.0 60.9 69.319721 . . . . . . . . 71.2 67.4 75.1 72.0 68.3 75.9 65.7 61.5 70.1 64.7 60.4 69.11971 . . . . . . . . . 71.1 67.4 75.0 72.0 68.3 75.8 65.6 61.6 69.8 64.6 60.5 68.91970 . . . . . . . . . 70.8 67.1 74.7 71.7 68.0 75.6 65.3 61.3 69.4 64.1 60.0 68.31960 . . . . . . . . . 69.7 66.6 73.1 70.6 67.4 74.1 63.6 61.1 66.3 - - - - - - - - -1950 . . . . . . . . . 68.2 65.6 71.1 69.1 66.5 72.2 60.8 59.1 62.9 - - - - - - - - -1940 . . . . . . . . . 62.9 60.8 65.2 64.2 62.1 66.6 53.1 51.5 54.9 - - - - - - - - -
- - - Data not available.1Deaths based on a 50-percent sample.
Monthly Vital Statistics Report + Vol. 45, No. 3(S) + September 30, 1996 19
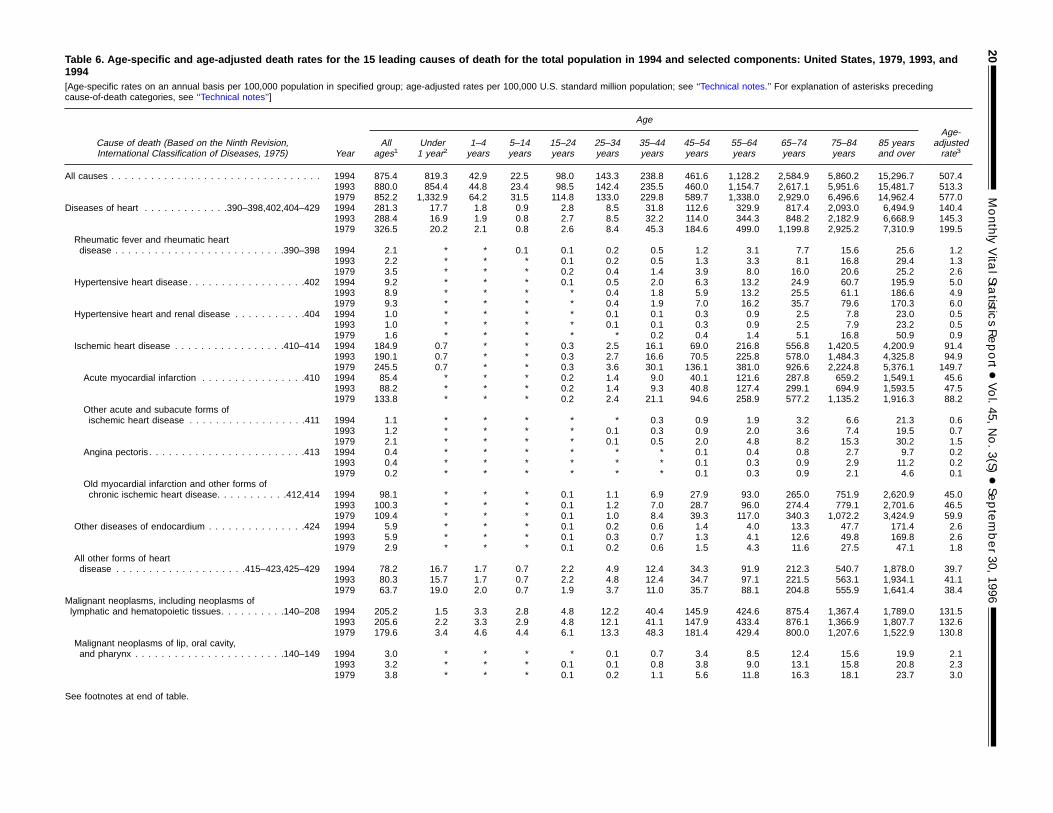
Table 6. Age-specific and age-adjusted death rates for the 15 leading causes of death for the total population in 1994 and selected components: United States, 1979, 1993, and1994[Age-specific rates on an annual basis per 100,000 population in specified group; age-adjusted rates per 100,000 U.S. standard million population; see ‘‘Technical notes.’’ For explanation of asterisks precedingcause-of-death categories, see ‘‘Technical notes’’]
Cause of death (Based on the Ninth Revision,International Classification of Diseases, 1975) Year
AgeAge-
adjustedrate3
Allages1
Under1 year2
1–4years
5–14years
15–24years
25–34years
35–44years
45–54years
55–64years
65–74years
75–84years
85 yearsand over
All causes . . . . . . . . . . . . . . . . . . . . . . . . . . . . . . . . 1994 875.4 819.3 42.9 22.5 98.0 143.3 238.8 461.6 1,128.2 2,584.9 5,860.2 15,296.7 507.41993 880.0 854.4 44.8 23.4 98.5 142.4 235.5 460.0 1,154.7 2,617.1 5,951.6 15,481.7 513.31979 852.2 1,332.9 64.2 31.5 114.8 133.0 229.8 589.7 1,338.0 2,929.0 6,496.6 14,962.4 577.0
Diseases of heart . . . . . . . . . . . . .390–398,402,404–429 1994 281.3 17.7 1.8 0.9 2.8 8.5 31.8 112.6 329.9 817.4 2,093.0 6,494.9 140.41993 288.4 16.9 1.9 0.8 2.7 8.5 32.2 114.0 344.3 848.2 2,182.9 6,668.9 145.31979 326.5 20.2 2.1 0.8 2.6 8.4 45.3 184.6 499.0 1,199.8 2,925.2 7,310.9 199.5
Rheumatic fever and rheumatic heartdisease . . . . . . . . . . . . . . . . . . . . . . . . . .390–398 1994 2.1 * * 0.1 0.1 0.2 0.5 1.2 3.1 7.7 15.6 25.6 1.2
1993 2.2 * * * 0.1 0.2 0.5 1.3 3.3 8.1 16.8 29.4 1.31979 3.5 * * * 0.2 0.4 1.4 3.9 8.0 16.0 20.6 25.2 2.6
Hypertensive heart disease. . . . . . . . . . . . . . . . . .402 1994 9.2 * * * 0.1 0.5 2.0 6.3 13.2 24.9 60.7 195.9 5.01993 8.9 * * * * 0.4 1.8 5.9 13.2 25.5 61.1 186.6 4.91979 9.3 * * * * 0.4 1.9 7.0 16.2 35.7 79.6 170.3 6.0
Hypertensive heart and renal disease . . . . . . . . . . .404 1994 1.0 * * * * 0.1 0.1 0.3 0.9 2.5 7.8 23.0 0.51993 1.0 * * * * 0.1 0.1 0.3 0.9 2.5 7.9 23.2 0.51979 1.6 * * * * * 0.2 0.4 1.4 5.1 16.8 50.9 0.9
Ischemic heart disease . . . . . . . . . . . . . . . . .410–414 1994 184.9 0.7 * * 0.3 2.5 16.1 69.0 216.8 556.8 1,420.5 4,200.9 91.41993 190.1 0.7 * * 0.3 2.7 16.6 70.5 225.8 578.0 1,484.3 4,325.8 94.91979 245.5 0.7 * * 0.3 3.6 30.1 136.1 381.0 926.6 2,224.8 5,376.1 149.7
Acute myocardial infarction . . . . . . . . . . . . . . . .410 1994 85.4 * * * 0.2 1.4 9.0 40.1 121.6 287.8 659.2 1,549.1 45.61993 88.2 * * * 0.2 1.4 9.3 40.8 127.4 299.1 694.9 1,593.5 47.51979 133.8 * * * 0.2 2.4 21.1 94.6 258.9 577.2 1,135.2 1,916.3 88.2
Other acute and subacute forms ofischemic heart disease . . . . . . . . . . . . . . . . . .411 1994 1.1 * * * * * 0.3 0.9 1.9 3.2 6.6 21.3 0.6
1993 1.2 * * * * 0.1 0.3 0.9 2.0 3.6 7.4 19.5 0.71979 2.1 * * * * 0.1 0.5 2.0 4.8 8.2 15.3 30.2 1.5
Angina pectoris . . . . . . . . . . . . . . . . . . . . . . . .413 1994 0.4 * * * * * * 0.1 0.4 0.8 2.7 9.7 0.21993 0.4 * * * * * * 0.1 0.3 0.9 2.9 11.2 0.21979 0.2 * * * * * * 0.1 0.3 0.9 2.1 4.6 0.1
Old myocardial infarction and other forms ofchronic ischemic heart disease. . . . . . . . . . .412,414 1994 98.1 * * * 0.1 1.1 6.9 27.9 93.0 265.0 751.9 2,620.9 45.0
1993 100.3 * * * 0.1 1.2 7.0 28.7 96.0 274.4 779.1 2,701.6 46.51979 109.4 * * * 0.1 1.0 8.4 39.3 117.0 340.3 1,072.2 3,424.9 59.9
Other diseases of endocardium . . . . . . . . . . . . . . .424 1994 5.9 * * * 0.1 0.2 0.6 1.4 4.0 13.3 47.7 171.4 2.61993 5.9 * * * 0.1 0.3 0.7 1.3 4.1 12.6 49.8 169.8 2.61979 2.9 * * * 0.1 0.2 0.6 1.5 4.3 11.6 27.5 47.1 1.8
All other forms of heartdisease . . . . . . . . . . . . . . . . . . . .415–423,425–429 1994 78.2 16.7 1.7 0.7 2.2 4.9 12.4 34.3 91.9 212.3 540.7 1,878.0 39.7
1993 80.3 15.7 1.7 0.7 2.2 4.8 12.4 34.7 97.1 221.5 563.1 1,934.1 41.11979 63.7 19.0 2.0 0.7 1.9 3.7 11.0 35.7 88.1 204.8 555.9 1,641.4 38.4
Malignant neoplasms, including neoplasms oflymphatic and hematopoietic tissues. . . . . . . . . .140–208 1994 205.2 1.5 3.3 2.8 4.8 12.2 40.4 145.9 424.6 875.4 1,367.4 1,789.0 131.5
1993 205.6 2.2 3.3 2.9 4.8 12.1 41.1 147.9 433.4 876.1 1,366.9 1,807.7 132.61979 179.6 3.4 4.6 4.4 6.1 13.3 48.3 181.4 429.4 800.0 1,207.6 1,522.9 130.8
Malignant neoplasms of lip, oral cavity,and pharynx . . . . . . . . . . . . . . . . . . . . . . .140–149 1994 3.0 * * * * 0.1 0.7 3.4 8.5 12.4 15.6 19.9 2.1
1993 3.2 * * * 0.1 0.1 0.8 3.8 9.0 13.1 15.8 20.8 2.31979 3.8 * * * 0.1 0.2 1.1 5.6 11.8 16.3 18.1 23.7 3.0
See footnotes at end of table.
20MonthlyVita
lStatistic
sReport+Vol.45,
No.3(S)
+September30,
1996
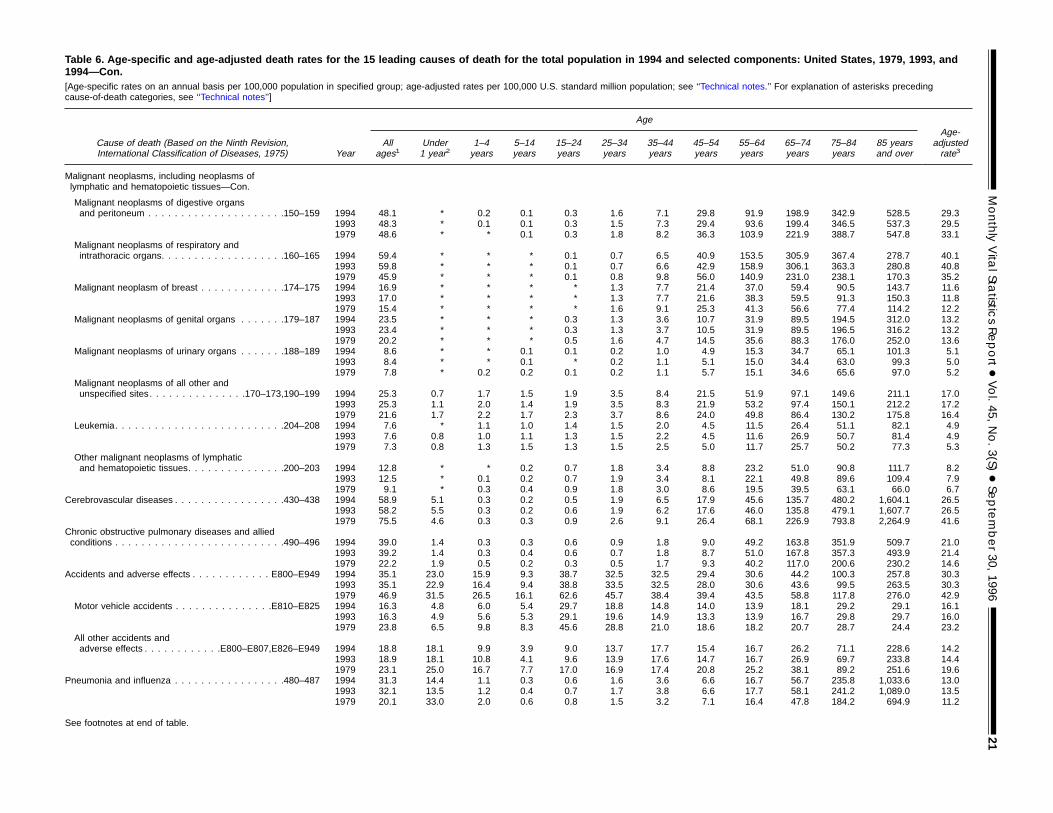
Table 6. Age-specific and age-adjusted death rates for the 15 leading causes of death for the total population in 1994 and selected components: United States, 1979, 1993, and1994—Con.[Age-specific rates on an annual basis per 100,000 population in specified group; age-adjusted rates per 100,000 U.S. standard million population; see ‘‘Technical notes.’’ For explanation of asterisks precedingcause-of-death categories, see ‘‘Technical notes’’]
Cause of death (Based on the Ninth Revision,International Classification of Diseases, 1975) Year
AgeAge-
adjustedrate3
Allages1
Under1 year2
1–4years
5–14years
15–24years
25–34years
35–44years
45–54years
55–64years
65–74years
75–84years
85 yearsand over
Malignant neoplasms, including neoplasms oflymphatic and hematopoietic tissues—Con.
Malignant neoplasms of digestive organsand peritoneum . . . . . . . . . . . . . . . . . . . . .150–159 1994 48.1 * 0.2 0.1 0.3 1.6 7.1 29.8 91.9 198.9 342.9 528.5 29.3
1993 48.3 * 0.1 0.1 0.3 1.5 7.3 29.4 93.6 199.4 346.5 537.3 29.51979 48.6 * * 0.1 0.3 1.8 8.2 36.3 103.9 221.9 388.7 547.8 33.1
Malignant neoplasms of respiratory andintrathoracic organs. . . . . . . . . . . . . . . . . . .160–165 1994 59.4 * * * 0.1 0.7 6.5 40.9 153.5 305.9 367.4 278.7 40.1
1993 59.8 * * * 0.1 0.7 6.6 42.9 158.9 306.1 363.3 280.8 40.81979 45.9 * * * 0.1 0.8 9.8 56.0 140.9 231.0 238.1 170.3 35.2
Malignant neoplasm of breast . . . . . . . . . . . . .174–175 1994 16.9 * * * * 1.3 7.7 21.4 37.0 59.4 90.5 143.7 11.61993 17.0 * * * * 1.3 7.7 21.6 38.3 59.5 91.3 150.3 11.81979 15.4 * * * * 1.6 9.1 25.3 41.3 56.6 77.4 114.2 12.2
Malignant neoplasms of genital organs . . . . . . .179–187 1994 23.5 * * * 0.3 1.3 3.6 10.7 31.9 89.5 194.5 312.0 13.21993 23.4 * * * 0.3 1.3 3.7 10.5 31.9 89.5 196.5 316.2 13.21979 20.2 * * * 0.5 1.6 4.7 14.5 35.6 88.3 176.0 252.0 13.6
Malignant neoplasms of urinary organs . . . . . . .188–189 1994 8.6 * * 0.1 0.1 0.2 1.0 4.9 15.3 34.7 65.1 101.3 5.11993 8.4 * * 0.1 * 0.2 1.1 5.1 15.0 34.4 63.0 99.3 5.01979 7.8 * 0.2 0.2 0.1 0.2 1.1 5.7 15.1 34.6 65.6 97.0 5.2
Malignant neoplasms of all other andunspecified sites. . . . . . . . . . . . . . .170–173,190–199 1994 25.3 0.7 1.7 1.5 1.9 3.5 8.4 21.5 51.9 97.1 149.6 211.1 17.0
1993 25.3 1.1 2.0 1.4 1.9 3.5 8.3 21.9 53.2 97.4 150.1 212.2 17.21979 21.6 1.7 2.2 1.7 2.3 3.7 8.6 24.0 49.8 86.4 130.2 175.8 16.4
Leukemia. . . . . . . . . . . . . . . . . . . . . . . . . .204–208 1994 7.6 * 1.1 1.0 1.4 1.5 2.0 4.5 11.5 26.4 51.1 82.1 4.91993 7.6 0.8 1.0 1.1 1.3 1.5 2.2 4.5 11.6 26.9 50.7 81.4 4.91979 7.3 0.8 1.3 1.5 1.3 1.5 2.5 5.0 11.7 25.7 50.2 77.3 5.3
Other malignant neoplasms of lymphaticand hematopoietic tissues. . . . . . . . . . . . . . .200–203 1994 12.8 * * 0.2 0.7 1.8 3.4 8.8 23.2 51.0 90.8 111.7 8.2
1993 12.5 * 0.1 0.2 0.7 1.9 3.4 8.1 22.1 49.8 89.6 109.4 7.91979 9.1 * 0.3 0.4 0.9 1.8 3.0 8.6 19.5 39.5 63.1 66.0 6.7
Cerebrovascular diseases . . . . . . . . . . . . . . . . .430–438 1994 58.9 5.1 0.3 0.2 0.5 1.9 6.5 17.9 45.6 135.7 480.2 1,604.1 26.51993 58.2 5.5 0.3 0.2 0.6 1.9 6.2 17.6 46.0 135.8 479.1 1,607.7 26.51979 75.5 4.6 0.3 0.3 0.9 2.6 9.1 26.4 68.1 226.9 793.8 2,264.9 41.6
Chronic obstructive pulmonary diseases and alliedconditions . . . . . . . . . . . . . . . . . . . . . . . . . .490–496 1994 39.0 1.4 0.3 0.3 0.6 0.9 1.8 9.0 49.2 163.8 351.9 509.7 21.0
1993 39.2 1.4 0.3 0.4 0.6 0.7 1.8 8.7 51.0 167.8 357.3 493.9 21.41979 22.2 1.9 0.5 0.2 0.3 0.5 1.7 9.3 40.2 117.0 200.6 230.2 14.6
Accidents and adverse effects . . . . . . . . . . . . E800–E949 1994 35.1 23.0 15.9 9.3 38.7 32.5 32.5 29.4 30.6 44.2 100.3 257.8 30.31993 35.1 22.9 16.4 9.4 38.8 33.5 32.5 28.0 30.6 43.6 99.5 263.5 30.31979 46.9 31.5 26.5 16.1 62.6 45.7 38.4 39.4 43.5 58.8 117.8 276.0 42.9
Motor vehicle accidents . . . . . . . . . . . . . . .E810–E825 1994 16.3 4.8 6.0 5.4 29.7 18.8 14.8 14.0 13.9 18.1 29.2 29.1 16.11993 16.3 4.9 5.6 5.3 29.1 19.6 14.9 13.3 13.9 16.7 29.8 29.7 16.01979 23.8 6.5 9.8 8.3 45.6 28.8 21.0 18.6 18.2 20.7 28.7 24.4 23.2
All other accidents andadverse effects . . . . . . . . . . . .E800–E807,E826–E949 1994 18.8 18.1 9.9 3.9 9.0 13.7 17.7 15.4 16.7 26.2 71.1 228.6 14.2
1993 18.9 18.1 10.8 4.1 9.6 13.9 17.6 14.7 16.7 26.9 69.7 233.8 14.41979 23.1 25.0 16.7 7.7 17.0 16.9 17.4 20.8 25.2 38.1 89.2 251.6 19.6
Pneumonia and influenza . . . . . . . . . . . . . . . . .480–487 1994 31.3 14.4 1.1 0.3 0.6 1.6 3.6 6.6 16.7 56.7 235.8 1,033.6 13.01993 32.1 13.5 1.2 0.4 0.7 1.7 3.8 6.6 17.7 58.1 241.2 1,089.0 13.51979 20.1 33.0 2.0 0.6 0.8 1.5 3.2 7.1 16.4 47.8 184.2 694.9 11.2
See footnotes at end of table.
MonthlyVita
lStatistic
sReport+Vol.45,
No.3(S)
+September30,
199621
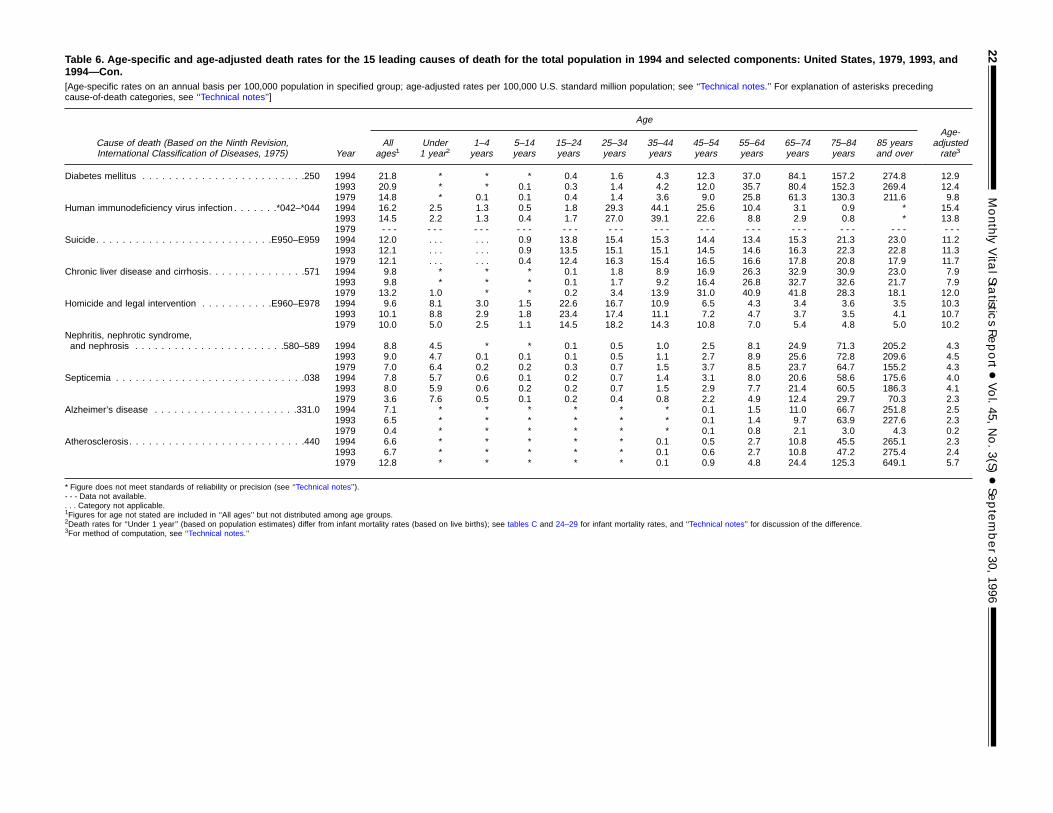
Table 6. Age-specific and age-adjusted death rates for the 15 leading causes of death for the total population in 1994 and selected components: United States, 1979, 1993, and1994—Con.[Age-specific rates on an annual basis per 100,000 population in specified group; age-adjusted rates per 100,000 U.S. standard million population; see ‘‘Technical notes.’’ For explanation of asterisks precedingcause-of-death categories, see ‘‘Technical notes’’]
Cause of death (Based on the Ninth Revision,International Classification of Diseases, 1975) Year
AgeAge-
adjustedrate3
Allages1
Under1 year2
1–4years
5–14years
15–24years
25–34years
35–44years
45–54years
55–64years
65–74years
75–84years
85 yearsand over
Diabetes mellitus . . . . . . . . . . . . . . . . . . . . . . . . .250 1994 21.8 * * * 0.4 1.6 4.3 12.3 37.0 84.1 157.2 274.8 12.91993 20.9 * * 0.1 0.3 1.4 4.2 12.0 35.7 80.4 152.3 269.4 12.41979 14.8 * 0.1 0.1 0.4 1.4 3.6 9.0 25.8 61.3 130.3 211.6 9.8
Human immunodeficiency virus infection . . . . . . .*042–*044 1994 16.2 2.5 1.3 0.5 1.8 29.3 44.1 25.6 10.4 3.1 0.9 * 15.41993 14.5 2.2 1.3 0.4 1.7 27.0 39.1 22.6 8.8 2.9 0.8 * 13.81979 - - - - - - - - - - - - - - - - - - - - - - - - - - - - - - - - - - - - - - -
Suicide. . . . . . . . . . . . . . . . . . . . . . . . . . .E950–E959 1994 12.0 . . . . . . 0.9 13.8 15.4 15.3 14.4 13.4 15.3 21.3 23.0 11.21993 12.1 . . . . . . 0.9 13.5 15.1 15.1 14.5 14.6 16.3 22.3 22.8 11.31979 12.1 . . . . . . 0.4 12.4 16.3 15.4 16.5 16.6 17.8 20.8 17.9 11.7
Chronic liver disease and cirrhosis. . . . . . . . . . . . . . .571 1994 9.8 * * * 0.1 1.8 8.9 16.9 26.3 32.9 30.9 23.0 7.91993 9.8 * * * 0.1 1.7 9.2 16.4 26.8 32.7 32.6 21.7 7.91979 13.2 1.0 * * 0.2 3.4 13.9 31.0 40.9 41.8 28.3 18.1 12.0
Homicide and legal intervention . . . . . . . . . . .E960–E978 1994 9.6 8.1 3.0 1.5 22.6 16.7 10.9 6.5 4.3 3.4 3.6 3.5 10.31993 10.1 8.8 2.9 1.8 23.4 17.4 11.1 7.2 4.7 3.7 3.5 4.1 10.71979 10.0 5.0 2.5 1.1 14.5 18.2 14.3 10.8 7.0 5.4 4.8 5.0 10.2
Nephritis, nephrotic syndrome,and nephrosis . . . . . . . . . . . . . . . . . . . . . . .580–589 1994 8.8 4.5 * * 0.1 0.5 1.0 2.5 8.1 24.9 71.3 205.2 4.3
1993 9.0 4.7 0.1 0.1 0.1 0.5 1.1 2.7 8.9 25.6 72.8 209.6 4.51979 7.0 6.4 0.2 0.2 0.3 0.7 1.5 3.7 8.5 23.7 64.7 155.2 4.3
Septicemia . . . . . . . . . . . . . . . . . . . . . . . . . . . . .038 1994 7.8 5.7 0.6 0.1 0.2 0.7 1.4 3.1 8.0 20.6 58.6 175.6 4.01993 8.0 5.9 0.6 0.2 0.2 0.7 1.5 2.9 7.7 21.4 60.5 186.3 4.11979 3.6 7.6 0.5 0.1 0.2 0.4 0.8 2.2 4.9 12.4 29.7 70.3 2.3
Alzheimer’s disease . . . . . . . . . . . . . . . . . . . . . .331.0 1994 7.1 * * * * * * 0.1 1.5 11.0 66.7 251.8 2.51993 6.5 * * * * * * 0.1 1.4 9.7 63.9 227.6 2.31979 0.4 * * * * * * 0.1 0.8 2.1 3.0 4.3 0.2
Atherosclerosis. . . . . . . . . . . . . . . . . . . . . . . . . . .440 1994 6.6 * * * * * 0.1 0.5 2.7 10.8 45.5 265.1 2.31993 6.7 * * * * * 0.1 0.6 2.7 10.8 47.2 275.4 2.41979 12.8 * * * * * 0.1 0.9 4.8 24.4 125.3 649.1 5.7
* Figure does not meet standards of reliability or precision (see ‘‘Technical notes’’).- - - Data not available.. . . Category not applicable.1Figures for age not stated are included in ‘‘All ages’’ but not distributed among age groups.2Death rates for ‘‘Under 1 year’’ (based on population estimates) differ from infant mortality rates (based on live births); see tables C and 24–29 for infant mortality rates, and ‘‘Technical notes’’ for discussion of the difference.3For method of computation, see ‘‘Technical notes.’’
22MonthlyVita
lStatistic
sReport+Vol.45,
No.3(S)
+September30,
1996
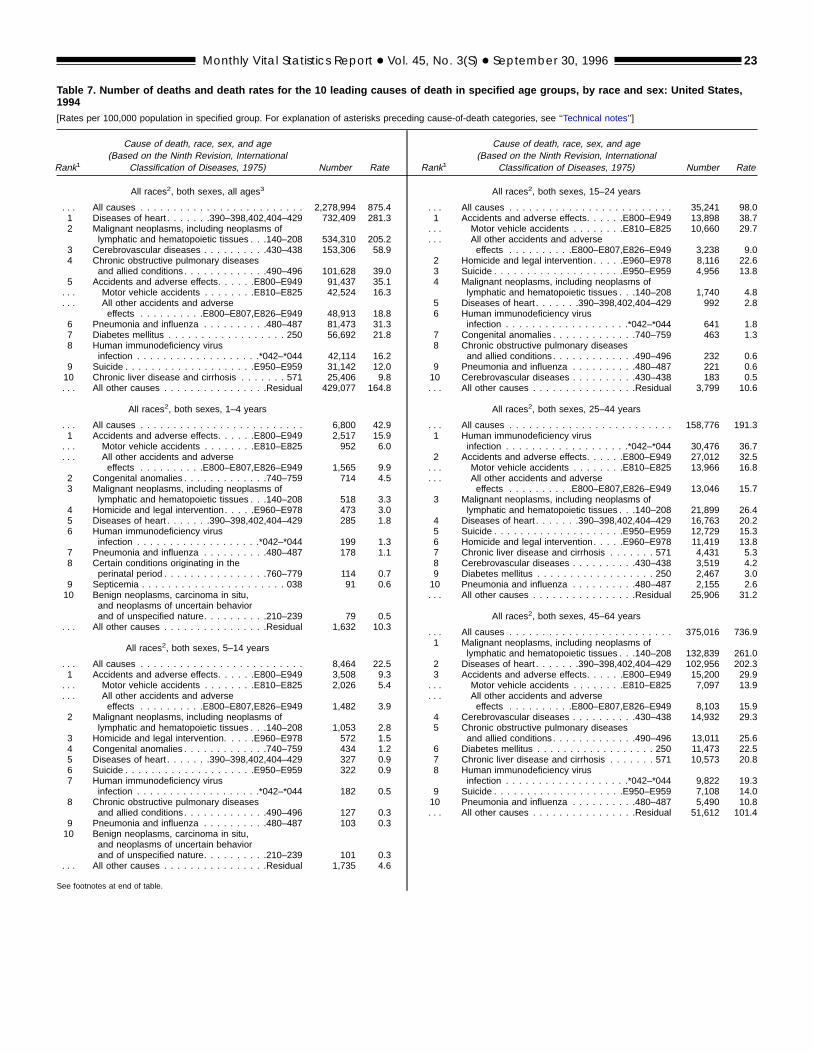
Table 7. Number of deaths and death rates for the 10 leading causes of death in specified age groups, by race and sex: United States,1994[Rates per 100,000 population in specified group. For explanation of asterisks preceding cause-of-death categories, see ‘‘Technical notes’’]
Rank1
Cause of death, race, sex, and age(Based on the Ninth Revision, International
Classification of Diseases, 1975) Number Rate
All races2, both sexes, all ages3
. . . All causes . . . . . . . . . . . . . . . . . . . . . . . . . 2,278,994 875.41 Diseases of heart . . . . . . .390–398,402,404–429 732,409 281.32 Malignant neoplasms, including neoplasms of
lymphatic and hematopoietic tissues . . .140–208 534,310 205.23 Cerebrovascular diseases . . . . . . . . . .430–438 153,306 58.94 Chronic obstructive pulmonary diseases
and allied conditions. . . . . . . . . . . . .490–496 101,628 39.05 Accidents and adverse effects. . . . . .E800–E949 91,437 35.1. . . Motor vehicle accidents . . . . . . . .E810–E825 42,524 16.3. . . All other accidents and adverse
effects . . . . . . . . . .E800–E807,E826–E949 48,913 18.86 Pneumonia and influenza . . . . . . . . . .480–487 81,473 31.37 Diabetes mellitus . . . . . . . . . . . . . . . . . . 250 56,692 21.88 Human immunodeficiency virus
infection . . . . . . . . . . . . . . . . . . .*042–*044 42,114 16.29 Suicide . . . . . . . . . . . . . . . . . . . .E950–E959 31,142 12.010 Chronic liver disease and cirrhosis . . . . . . . 571 25,406 9.8. . . All other causes . . . . . . . . . . . . . . . .Residual 429,077 164.8
All races2, both sexes, 1–4 years
. . . All causes . . . . . . . . . . . . . . . . . . . . . . . . . 6,800 42.91 Accidents and adverse effects. . . . . .E800–E949 2,517 15.9. . . Motor vehicle accidents . . . . . . . .E810–E825 952 6.0. . . All other accidents and adverse
effects . . . . . . . . . .E800–E807,E826–E949 1,565 9.92 Congenital anomalies . . . . . . . . . . . . .740–759 714 4.53 Malignant neoplasms, including neoplasms of
lymphatic and hematopoietic tissues . . .140–208 518 3.34 Homicide and legal intervention. . . . .E960–E978 473 3.05 Diseases of heart . . . . . . .390–398,402,404–429 285 1.86 Human immunodeficiency virus
infection . . . . . . . . . . . . . . . . . . .*042–*044 199 1.37 Pneumonia and influenza . . . . . . . . . .480–487 178 1.18 Certain conditions originating in the
perinatal period . . . . . . . . . . . . . . . .760–779 114 0.79 Septicemia . . . . . . . . . . . . . . . . . . . . . . 038 91 0.610 Benign neoplasms, carcinoma in situ,
and neoplasms of uncertain behaviorand of unspecified nature. . . . . . . . . .210–239 79 0.5
. . . All other causes . . . . . . . . . . . . . . . .Residual 1,632 10.3
All races2, both sexes, 5–14 years
. . . All causes . . . . . . . . . . . . . . . . . . . . . . . . . 8,464 22.51 Accidents and adverse effects. . . . . .E800–E949 3,508 9.3. . . Motor vehicle accidents . . . . . . . .E810–E825 2,026 5.4. . . All other accidents and adverse
effects . . . . . . . . . .E800–E807,E826–E949 1,482 3.92 Malignant neoplasms, including neoplasms of
lymphatic and hematopoietic tissues . . .140–208 1,053 2.83 Homicide and legal intervention. . . . .E960–E978 572 1.54 Congenital anomalies . . . . . . . . . . . . .740–759 434 1.25 Diseases of heart . . . . . . .390–398,402,404–429 327 0.96 Suicide . . . . . . . . . . . . . . . . . . . .E950–E959 322 0.97 Human immunodeficiency virus
infection . . . . . . . . . . . . . . . . . . .*042–*044 182 0.58 Chronic obstructive pulmonary diseases
and allied conditions. . . . . . . . . . . . .490–496 127 0.39 Pneumonia and influenza . . . . . . . . . .480–487 103 0.310 Benign neoplasms, carcinoma in situ,
and neoplasms of uncertain behaviorand of unspecified nature. . . . . . . . . .210–239 101 0.3
. . . All other causes . . . . . . . . . . . . . . . .Residual 1,735 4.6
See footnotes at end of table.
Rank1
Cause of death, race, sex, and age(Based on the Ninth Revision, International
Classification of Diseases, 1975) Number Rate
All races2, both sexes, 15–24 years
. . . All causes . . . . . . . . . . . . . . . . . . . . . . . . . 35,241 98.01 Accidents and adverse effects. . . . . .E800–E949 13,898 38.7. . . Motor vehicle accidents . . . . . . . .E810–E825 10,660 29.7. . . All other accidents and adverse
effects . . . . . . . . . .E800–E807,E826–E949 3,238 9.02 Homicide and legal intervention. . . . .E960–E978 8,116 22.63 Suicide . . . . . . . . . . . . . . . . . . . .E950–E959 4,956 13.84 Malignant neoplasms, including neoplasms of
lymphatic and hematopoietic tissues . . .140–208 1,740 4.85 Diseases of heart . . . . . . .390–398,402,404–429 992 2.86 Human immunodeficiency virus
infection . . . . . . . . . . . . . . . . . . .*042–*044 641 1.87 Congenital anomalies . . . . . . . . . . . . .740–759 463 1.38 Chronic obstructive pulmonary diseases
and allied conditions. . . . . . . . . . . . .490–496 232 0.69 Pneumonia and influenza . . . . . . . . . .480–487 221 0.610 Cerebrovascular diseases . . . . . . . . . .430–438 183 0.5. . . All other causes . . . . . . . . . . . . . . . .Residual 3,799 10.6
All races2, both sexes, 25–44 years
. . . All causes . . . . . . . . . . . . . . . . . . . . . . . . . 158,776 191.31 Human immunodeficiency virus
infection . . . . . . . . . . . . . . . . . . .*042–*044 30,476 36.72 Accidents and adverse effects. . . . . .E800–E949 27,012 32.5. . . Motor vehicle accidents . . . . . . . .E810–E825 13,966 16.8. . . All other accidents and adverse
effects . . . . . . . . . .E800–E807,E826–E949 13,046 15.73 Malignant neoplasms, including neoplasms of
lymphatic and hematopoietic tissues . . .140–208 21,899 26.44 Diseases of heart . . . . . . .390–398,402,404–429 16,763 20.25 Suicide . . . . . . . . . . . . . . . . . . . .E950–E959 12,729 15.36 Homicide and legal intervention. . . . .E960–E978 11,419 13.87 Chronic liver disease and cirrhosis . . . . . . . 571 4,431 5.38 Cerebrovascular diseases . . . . . . . . . .430–438 3,519 4.29 Diabetes mellitus . . . . . . . . . . . . . . . . . . 250 2,467 3.010 Pneumonia and influenza . . . . . . . . . .480–487 2,155 2.6. . . All other causes . . . . . . . . . . . . . . . .Residual 25,906 31.2
All races2, both sexes, 45–64 years
. . . All causes . . . . . . . . . . . . . . . . . . . . . . . . . 375,016 736.91 Malignant neoplasms, including neoplasms of
lymphatic and hematopoietic tissues . . .140–208 132,839 261.02 Diseases of heart . . . . . . .390–398,402,404–429 102,956 202.33 Accidents and adverse effects. . . . . .E800–E949 15,200 29.9. . . Motor vehicle accidents . . . . . . . .E810–E825 7,097 13.9. . . All other accidents and adverse
effects . . . . . . . . . .E800–E807,E826–E949 8,103 15.94 Cerebrovascular diseases . . . . . . . . . .430–438 14,932 29.35 Chronic obstructive pulmonary diseases
and allied conditions. . . . . . . . . . . . .490–496 13,011 25.66 Diabetes mellitus . . . . . . . . . . . . . . . . . . 250 11,473 22.57 Chronic liver disease and cirrhosis . . . . . . . 571 10,573 20.88 Human immunodeficiency virus
infection . . . . . . . . . . . . . . . . . . .*042–*044 9,822 19.39 Suicide . . . . . . . . . . . . . . . . . . . .E950–E959 7,108 14.010 Pneumonia and influenza . . . . . . . . . .480–487 5,490 10.8. . . All other causes . . . . . . . . . . . . . . . .Residual 51,612 101.4
Monthly Vital Statistics Report + Vol. 45, No. 3(S) + September 30, 1996 23
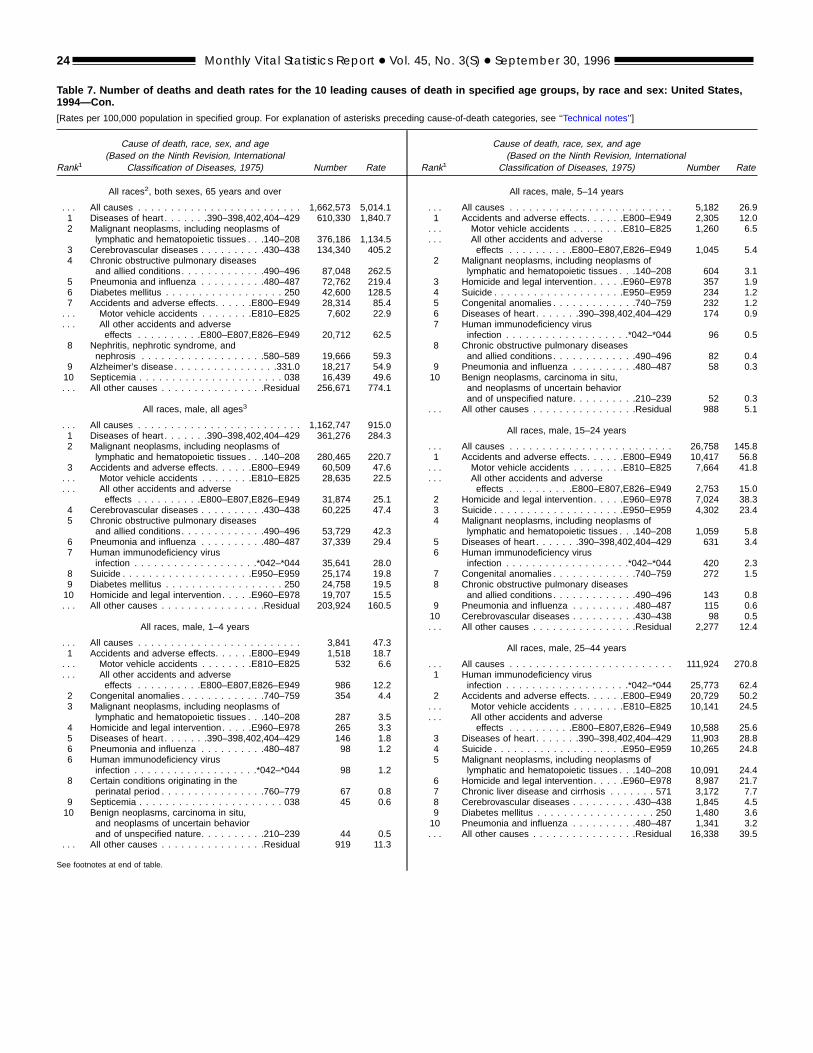
Rank1
Cause of death, race, sex, and age(Based on the Ninth Revision, International
Classification of Diseases, 1975) Number Rate
All races2, both sexes, 65 years and over
. . . All causes . . . . . . . . . . . . . . . . . . . . . . . . . 1,662,573 5,014.11 Diseases of heart . . . . . . .390–398,402,404–429 610,330 1,840.72 Malignant neoplasms, including neoplasms of
lymphatic and hematopoietic tissues . . .140–208 376,186 1,134.53 Cerebrovascular diseases . . . . . . . . . .430–438 134,340 405.24 Chronic obstructive pulmonary diseases
and allied conditions. . . . . . . . . . . . .490–496 87,048 262.55 Pneumonia and influenza . . . . . . . . . .480–487 72,762 219.46 Diabetes mellitus . . . . . . . . . . . . . . . . . . 250 42,600 128.57 Accidents and adverse effects. . . . . .E800–E949 28,314 85.4. . . Motor vehicle accidents . . . . . . . .E810–E825 7,602 22.9. . . All other accidents and adverse
effects . . . . . . . . . .E800–E807,E826–E949 20,712 62.58 Nephritis, nephrotic syndrome, and
nephrosis . . . . . . . . . . . . . . . . . . .580–589 19,666 59.39 Alzheimer’s disease . . . . . . . . . . . . . . . .331.0 18,217 54.910 Septicemia . . . . . . . . . . . . . . . . . . . . . . 038 16,439 49.6. . . All other causes . . . . . . . . . . . . . . . .Residual 256,671 774.1
All races, male, all ages3
. . . All causes . . . . . . . . . . . . . . . . . . . . . . . . . 1,162,747 915.01 Diseases of heart . . . . . . .390–398,402,404–429 361,276 284.32 Malignant neoplasms, including neoplasms of
lymphatic and hematopoietic tissues . . .140–208 280,465 220.73 Accidents and adverse effects. . . . . .E800–E949 60,509 47.6. . . Motor vehicle accidents . . . . . . . .E810–E825 28,635 22.5. . . All other accidents and adverse
effects . . . . . . . . . .E800–E807,E826–E949 31,874 25.14 Cerebrovascular diseases . . . . . . . . . .430–438 60,225 47.45 Chronic obstructive pulmonary diseases
and allied conditions. . . . . . . . . . . . .490–496 53,729 42.36 Pneumonia and influenza . . . . . . . . . .480–487 37,339 29.47 Human immunodeficiency virus
infection . . . . . . . . . . . . . . . . . . .*042–*044 35,641 28.08 Suicide . . . . . . . . . . . . . . . . . . . .E950–E959 25,174 19.89 Diabetes mellitus . . . . . . . . . . . . . . . . . . 250 24,758 19.510 Homicide and legal intervention. . . . .E960–E978 19,707 15.5. . . All other causes . . . . . . . . . . . . . . . .Residual 203,924 160.5
All races, male, 1–4 years
. . . All causes . . . . . . . . . . . . . . . . . . . . . . . . . 3,841 47.31 Accidents and adverse effects. . . . . .E800–E949 1,518 18.7. . . Motor vehicle accidents . . . . . . . .E810–E825 532 6.6. . . All other accidents and adverse
effects . . . . . . . . . .E800–E807,E826–E949 986 12.22 Congenital anomalies . . . . . . . . . . . . .740–759 354 4.43 Malignant neoplasms, including neoplasms of
lymphatic and hematopoietic tissues . . .140–208 287 3.54 Homicide and legal intervention. . . . .E960–E978 265 3.35 Diseases of heart . . . . . . .390–398,402,404–429 146 1.86 Pneumonia and influenza . . . . . . . . . .480–487 98 1.26 Human immunodeficiency virus
infection . . . . . . . . . . . . . . . . . . .*042–*044 98 1.28 Certain conditions originating in the
perinatal period . . . . . . . . . . . . . . . .760–779 67 0.89 Septicemia . . . . . . . . . . . . . . . . . . . . . . 038 45 0.610 Benign neoplasms, carcinoma in situ,
and neoplasms of uncertain behaviorand of unspecified nature. . . . . . . . . .210–239 44 0.5
. . . All other causes . . . . . . . . . . . . . . . .Residual 919 11.3
See footnotes at end of table.
Rank1
Cause of death, race, sex, and age(Based on the Ninth Revision, International
Classification of Diseases, 1975) Number Rate
All races, male, 5–14 years
. . . All causes . . . . . . . . . . . . . . . . . . . . . . . . . 5,182 26.91 Accidents and adverse effects. . . . . .E800–E949 2,305 12.0. . . Motor vehicle accidents . . . . . . . .E810–E825 1,260 6.5. . . All other accidents and adverse
effects . . . . . . . . . .E800–E807,E826–E949 1,045 5.42 Malignant neoplasms, including neoplasms of
lymphatic and hematopoietic tissues . . .140–208 604 3.13 Homicide and legal intervention. . . . .E960–E978 357 1.94 Suicide . . . . . . . . . . . . . . . . . . . .E950–E959 234 1.25 Congenital anomalies . . . . . . . . . . . . .740–759 232 1.26 Diseases of heart . . . . . . .390–398,402,404–429 174 0.97 Human immunodeficiency virus
infection . . . . . . . . . . . . . . . . . . .*042–*044 96 0.58 Chronic obstructive pulmonary diseases
and allied conditions. . . . . . . . . . . . .490–496 82 0.49 Pneumonia and influenza . . . . . . . . . .480–487 58 0.310 Benign neoplasms, carcinoma in situ,
and neoplasms of uncertain behaviorand of unspecified nature. . . . . . . . . .210–239 52 0.3
. . . All other causes . . . . . . . . . . . . . . . .Residual 988 5.1
All races, male, 15–24 years
. . . All causes . . . . . . . . . . . . . . . . . . . . . . . . . 26,758 145.81 Accidents and adverse effects. . . . . .E800–E949 10,417 56.8. . . Motor vehicle accidents . . . . . . . .E810–E825 7,664 41.8. . . All other accidents and adverse
effects . . . . . . . . . .E800–E807,E826–E949 2,753 15.02 Homicide and legal intervention. . . . .E960–E978 7,024 38.33 Suicide . . . . . . . . . . . . . . . . . . . .E950–E959 4,302 23.44 Malignant neoplasms, including neoplasms of
lymphatic and hematopoietic tissues . . .140–208 1,059 5.85 Diseases of heart . . . . . . .390–398,402,404–429 631 3.46 Human immunodeficiency virus
infection . . . . . . . . . . . . . . . . . . .*042–*044 420 2.37 Congenital anomalies . . . . . . . . . . . . .740–759 272 1.58 Chronic obstructive pulmonary diseases
and allied conditions. . . . . . . . . . . . .490–496 143 0.89 Pneumonia and influenza . . . . . . . . . .480–487 115 0.610 Cerebrovascular diseases . . . . . . . . . .430–438 98 0.5. . . All other causes . . . . . . . . . . . . . . . .Residual 2,277 12.4
All races, male, 25–44 years
. . . All causes . . . . . . . . . . . . . . . . . . . . . . . . . 111,924 270.81 Human immunodeficiency virus
infection . . . . . . . . . . . . . . . . . . .*042–*044 25,773 62.42 Accidents and adverse effects. . . . . .E800–E949 20,729 50.2. . . Motor vehicle accidents . . . . . . . .E810–E825 10,141 24.5. . . All other accidents and adverse
effects . . . . . . . . . .E800–E807,E826–E949 10,588 25.63 Diseases of heart . . . . . . .390–398,402,404–429 11,903 28.84 Suicide . . . . . . . . . . . . . . . . . . . .E950–E959 10,265 24.85 Malignant neoplasms, including neoplasms of
lymphatic and hematopoietic tissues . . .140–208 10,091 24.46 Homicide and legal intervention. . . . .E960–E978 8,987 21.77 Chronic liver disease and cirrhosis . . . . . . . 571 3,172 7.78 Cerebrovascular diseases . . . . . . . . . .430–438 1,845 4.59 Diabetes mellitus . . . . . . . . . . . . . . . . . . 250 1,480 3.610 Pneumonia and influenza . . . . . . . . . .480–487 1,341 3.2. . . All other causes . . . . . . . . . . . . . . . .Residual 16,338 39.5
Table 7. Number of deaths and death rates for the 10 leading causes of death in specified age groups, by race and sex: United States,1994—Con.[Rates per 100,000 population in specified group. For explanation of asterisks preceding cause-of-death categories, see ‘‘Technical notes’’]
24 Monthly Vital Statistics Report + Vol. 45, No. 3(S) + September 30, 1996
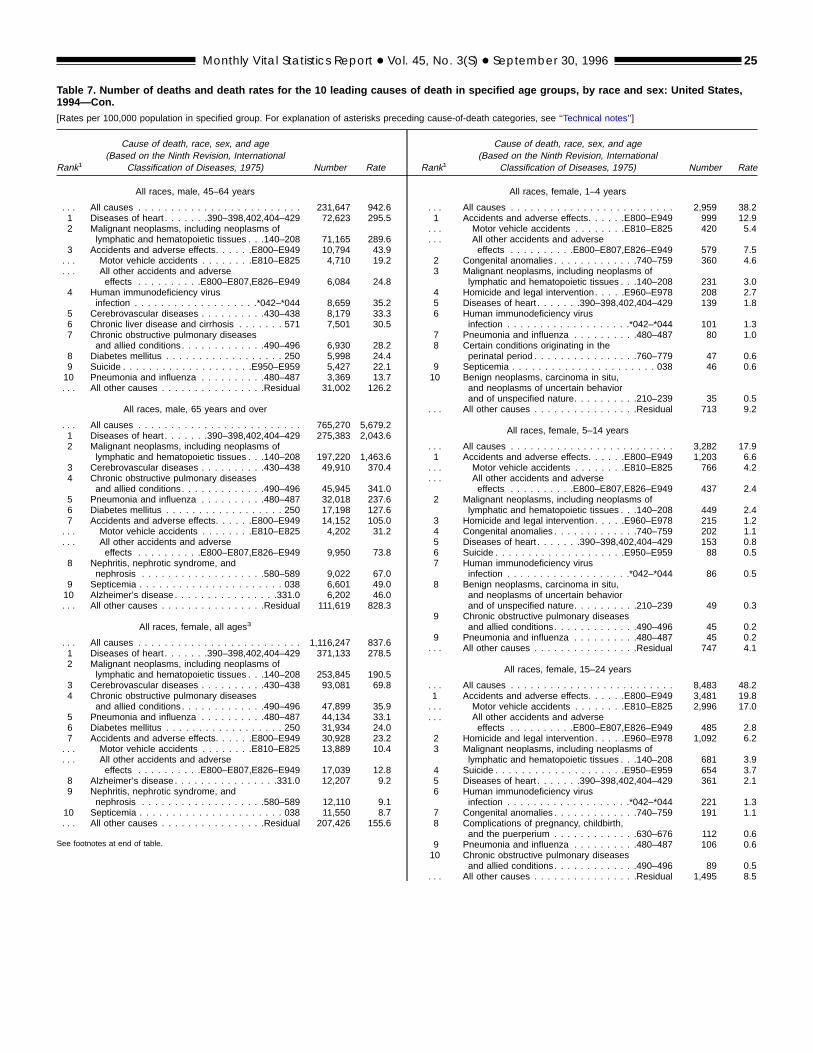
Rank1
Cause of death, race, sex, and age(Based on the Ninth Revision, International
Classification of Diseases, 1975) Number Rate
All races, male, 45–64 years
. . . All causes . . . . . . . . . . . . . . . . . . . . . . . . . 231,647 942.61 Diseases of heart . . . . . . .390–398,402,404–429 72,623 295.52 Malignant neoplasms, including neoplasms of
lymphatic and hematopoietic tissues . . .140–208 71,165 289.63 Accidents and adverse effects. . . . . .E800–E949 10,794 43.9. . . Motor vehicle accidents . . . . . . . .E810–E825 4,710 19.2. . . All other accidents and adverse
effects . . . . . . . . . .E800–E807,E826–E949 6,084 24.84 Human immunodeficiency virus
infection . . . . . . . . . . . . . . . . . . .*042–*044 8,659 35.25 Cerebrovascular diseases . . . . . . . . . .430–438 8,179 33.36 Chronic liver disease and cirrhosis . . . . . . . 571 7,501 30.57 Chronic obstructive pulmonary diseases
and allied conditions. . . . . . . . . . . . .490–496 6,930 28.28 Diabetes mellitus . . . . . . . . . . . . . . . . . . 250 5,998 24.49 Suicide . . . . . . . . . . . . . . . . . . . .E950–E959 5,427 22.110 Pneumonia and influenza . . . . . . . . . .480–487 3,369 13.7. . . All other causes . . . . . . . . . . . . . . . .Residual 31,002 126.2
All races, male, 65 years and over
. . . All causes . . . . . . . . . . . . . . . . . . . . . . . . . 765,270 5,679.21 Diseases of heart . . . . . . .390–398,402,404–429 275,383 2,043.62 Malignant neoplasms, including neoplasms of
lymphatic and hematopoietic tissues . . .140–208 197,220 1,463.63 Cerebrovascular diseases . . . . . . . . . .430–438 49,910 370.44 Chronic obstructive pulmonary diseases
and allied conditions. . . . . . . . . . . . .490–496 45,945 341.05 Pneumonia and influenza . . . . . . . . . .480–487 32,018 237.66 Diabetes mellitus . . . . . . . . . . . . . . . . . . 250 17,198 127.67 Accidents and adverse effects. . . . . .E800–E949 14,152 105.0. . . Motor vehicle accidents . . . . . . . .E810–E825 4,202 31.2. . . All other accidents and adverse
effects . . . . . . . . . .E800–E807,E826–E949 9,950 73.88 Nephritis, nephrotic syndrome, and
nephrosis . . . . . . . . . . . . . . . . . . .580–589 9,022 67.09 Septicemia . . . . . . . . . . . . . . . . . . . . . . 038 6,601 49.010 Alzheimer’s disease . . . . . . . . . . . . . . . .331.0 6,202 46.0. . . All other causes . . . . . . . . . . . . . . . .Residual 111,619 828.3
All races, female, all ages3
. . . All causes . . . . . . . . . . . . . . . . . . . . . . . . . 1,116,247 837.61 Diseases of heart . . . . . . .390–398,402,404–429 371,133 278.52 Malignant neoplasms, including neoplasms of
lymphatic and hematopoietic tissues . . .140–208 253,845 190.53 Cerebrovascular diseases . . . . . . . . . .430–438 93,081 69.84 Chronic obstructive pulmonary diseases
and allied conditions. . . . . . . . . . . . .490–496 47,899 35.95 Pneumonia and influenza . . . . . . . . . .480–487 44,134 33.16 Diabetes mellitus . . . . . . . . . . . . . . . . . . 250 31,934 24.07 Accidents and adverse effects. . . . . .E800–E949 30,928 23.2. . . Motor vehicle accidents . . . . . . . .E810–E825 13,889 10.4. . . All other accidents and adverse
effects . . . . . . . . . .E800–E807,E826–E949 17,039 12.88 Alzheimer’s disease . . . . . . . . . . . . . . . .331.0 12,207 9.29 Nephritis, nephrotic syndrome, and
nephrosis . . . . . . . . . . . . . . . . . . .580–589 12,110 9.110 Septicemia . . . . . . . . . . . . . . . . . . . . . . 038 11,550 8.7. . . All other causes . . . . . . . . . . . . . . . .Residual 207,426 155.6
See footnotes at end of table.
Rank1
Cause of death, race, sex, and age(Based on the Ninth Revision, International
Classification of Diseases, 1975) Number Rate
All races, female, 1–4 years
. . . All causes . . . . . . . . . . . . . . . . . . . . . . . . . 2,959 38.21 Accidents and adverse effects. . . . . .E800–E949 999 12.9. . . Motor vehicle accidents . . . . . . . .E810–E825 420 5.4. . . All other accidents and adverse
effects . . . . . . . . . .E800–E807,E826–E949 579 7.52 Congenital anomalies . . . . . . . . . . . . .740–759 360 4.63 Malignant neoplasms, including neoplasms of
lymphatic and hematopoietic tissues . . .140–208 231 3.04 Homicide and legal intervention. . . . .E960–E978 208 2.75 Diseases of heart . . . . . . .390–398,402,404–429 139 1.86 Human immunodeficiency virus
infection . . . . . . . . . . . . . . . . . . .*042–*044 101 1.37 Pneumonia and influenza . . . . . . . . . .480–487 80 1.08 Certain conditions originating in the
perinatal period . . . . . . . . . . . . . . . .760–779 47 0.69 Septicemia . . . . . . . . . . . . . . . . . . . . . . 038 46 0.610 Benign neoplasms, carcinoma in situ,
and neoplasms of uncertain behaviorand of unspecified nature. . . . . . . . . .210–239 35 0.5
. . . All other causes . . . . . . . . . . . . . . . .Residual 713 9.2
All races, female, 5–14 years
. . . All causes . . . . . . . . . . . . . . . . . . . . . . . . . 3,282 17.91 Accidents and adverse effects. . . . . .E800–E949 1,203 6.6. . . Motor vehicle accidents . . . . . . . .E810–E825 766 4.2. . . All other accidents and adverse
effects . . . . . . . . . .E800–E807,E826–E949 437 2.42 Malignant neoplasms, including neoplasms of
lymphatic and hematopoietic tissues . . .140–208 449 2.43 Homicide and legal intervention. . . . .E960–E978 215 1.24 Congenital anomalies . . . . . . . . . . . . .740–759 202 1.15 Diseases of heart . . . . . . .390–398,402,404–429 153 0.86 Suicide . . . . . . . . . . . . . . . . . . . .E950–E959 88 0.57 Human immunodeficiency virus
infection . . . . . . . . . . . . . . . . . . .*042–*044 86 0.58 Benign neoplasms, carcinoma in situ,
and neoplasms of uncertain behaviorand of unspecified nature. . . . . . . . . .210–239 49 0.3
9 Chronic obstructive pulmonary diseasesand allied conditions. . . . . . . . . . . . .490–496 45 0.2
9 Pneumonia and influenza . . . . . . . . . .480–487 45 0.2. . . All other causes . . . . . . . . . . . . . . . .Residual 747 4.1
All races, female, 15–24 years
. . . All causes . . . . . . . . . . . . . . . . . . . . . . . . . 8,483 48.21 Accidents and adverse effects. . . . . .E800–E949 3,481 19.8. . . Motor vehicle accidents . . . . . . . .E810–E825 2,996 17.0. . . All other accidents and adverse
effects . . . . . . . . . .E800–E807,E826–E949 485 2.82 Homicide and legal intervention. . . . .E960–E978 1,092 6.23 Malignant neoplasms, including neoplasms of
lymphatic and hematopoietic tissues . . .140–208 681 3.94 Suicide . . . . . . . . . . . . . . . . . . . .E950–E959 654 3.75 Diseases of heart . . . . . . .390–398,402,404–429 361 2.16 Human immunodeficiency virus
infection . . . . . . . . . . . . . . . . . . .*042–*044 221 1.37 Congenital anomalies . . . . . . . . . . . . .740–759 191 1.18 Complications of pregnancy, childbirth,
and the puerperium . . . . . . . . . . . . .630–676 112 0.69 Pneumonia and influenza . . . . . . . . . .480–487 106 0.610 Chronic obstructive pulmonary diseases
and allied conditions. . . . . . . . . . . . .490–496 89 0.5. . . All other causes . . . . . . . . . . . . . . . .Residual 1,495 8.5
Table 7. Number of deaths and death rates for the 10 leading causes of death in specified age groups, by race and sex: United States,1994—Con.[Rates per 100,000 population in specified group. For explanation of asterisks preceding cause-of-death categories, see ‘‘Technical notes’’]
Monthly Vital Statistics Report + Vol. 45, No. 3(S) + September 30, 1996 25
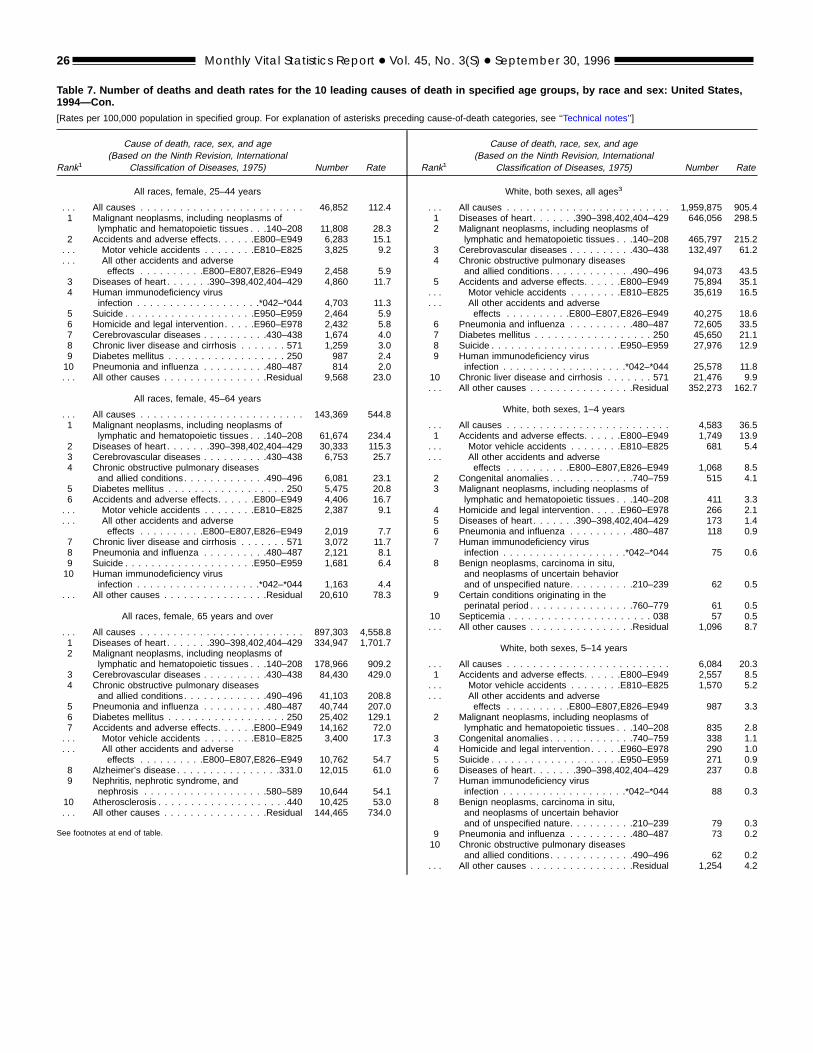
Rank1
Cause of death, race, sex, and age(Based on the Ninth Revision, International
Classification of Diseases, 1975) Number Rate
All races, female, 25–44 years
. . . All causes . . . . . . . . . . . . . . . . . . . . . . . . . 46,852 112.41 Malignant neoplasms, including neoplasms of
lymphatic and hematopoietic tissues . . .140–208 11,808 28.32 Accidents and adverse effects. . . . . .E800–E949 6,283 15.1. . . Motor vehicle accidents . . . . . . . .E810–E825 3,825 9.2. . . All other accidents and adverse
effects . . . . . . . . . .E800–E807,E826–E949 2,458 5.93 Diseases of heart . . . . . . .390–398,402,404–429 4,860 11.74 Human immunodeficiency virus
infection . . . . . . . . . . . . . . . . . . .*042–*044 4,703 11.35 Suicide . . . . . . . . . . . . . . . . . . . .E950–E959 2,464 5.96 Homicide and legal intervention. . . . .E960–E978 2,432 5.87 Cerebrovascular diseases . . . . . . . . . .430–438 1,674 4.08 Chronic liver disease and cirrhosis . . . . . . . 571 1,259 3.09 Diabetes mellitus . . . . . . . . . . . . . . . . . . 250 987 2.410 Pneumonia and influenza . . . . . . . . . .480–487 814 2.0. . . All other causes . . . . . . . . . . . . . . . .Residual 9,568 23.0
All races, female, 45–64 years
. . . All causes . . . . . . . . . . . . . . . . . . . . . . . . . 143,369 544.81 Malignant neoplasms, including neoplasms of
lymphatic and hematopoietic tissues . . .140–208 61,674 234.42 Diseases of heart . . . . . . .390–398,402,404–429 30,333 115.33 Cerebrovascular diseases . . . . . . . . . .430–438 6,753 25.74 Chronic obstructive pulmonary diseases
and allied conditions. . . . . . . . . . . . .490–496 6,081 23.15 Diabetes mellitus . . . . . . . . . . . . . . . . . . 250 5,475 20.86 Accidents and adverse effects. . . . . .E800–E949 4,406 16.7. . . Motor vehicle accidents . . . . . . . .E810–E825 2,387 9.1. . . All other accidents and adverse
effects . . . . . . . . . .E800–E807,E826–E949 2,019 7.77 Chronic liver disease and cirrhosis . . . . . . . 571 3,072 11.78 Pneumonia and influenza . . . . . . . . . .480–487 2,121 8.19 Suicide . . . . . . . . . . . . . . . . . . . .E950–E959 1,681 6.410 Human immunodeficiency virus
infection . . . . . . . . . . . . . . . . . . .*042–*044 1,163 4.4. . . All other causes . . . . . . . . . . . . . . . .Residual 20,610 78.3
All races, female, 65 years and over
. . . All causes . . . . . . . . . . . . . . . . . . . . . . . . . 897,303 4,558.81 Diseases of heart . . . . . . .390–398,402,404–429 334,947 1,701.72 Malignant neoplasms, including neoplasms of
lymphatic and hematopoietic tissues . . .140–208 178,966 909.23 Cerebrovascular diseases . . . . . . . . . .430–438 84,430 429.04 Chronic obstructive pulmonary diseases
and allied conditions. . . . . . . . . . . . .490–496 41,103 208.85 Pneumonia and influenza . . . . . . . . . .480–487 40,744 207.06 Diabetes mellitus . . . . . . . . . . . . . . . . . . 250 25,402 129.17 Accidents and adverse effects. . . . . .E800–E949 14,162 72.0. . . Motor vehicle accidents . . . . . . . .E810–E825 3,400 17.3. . . All other accidents and adverse
effects . . . . . . . . . .E800–E807,E826–E949 10,762 54.78 Alzheimer’s disease . . . . . . . . . . . . . . . .331.0 12,015 61.09 Nephritis, nephrotic syndrome, and
nephrosis . . . . . . . . . . . . . . . . . . .580–589 10,644 54.110 Atherosclerosis . . . . . . . . . . . . . . . . . . . .440 10,425 53.0. . . All other causes . . . . . . . . . . . . . . . .Residual 144,465 734.0
See footnotes at end of table.
Rank1
Cause of death, race, sex, and age(Based on the Ninth Revision, International
Classification of Diseases, 1975) Number Rate
White, both sexes, all ages3
. . . All causes . . . . . . . . . . . . . . . . . . . . . . . . . 1,959,875 905.41 Diseases of heart . . . . . . .390–398,402,404–429 646,056 298.52 Malignant neoplasms, including neoplasms of
lymphatic and hematopoietic tissues . . .140–208 465,797 215.23 Cerebrovascular diseases . . . . . . . . . .430–438 132,497 61.24 Chronic obstructive pulmonary diseases
and allied conditions. . . . . . . . . . . . .490–496 94,073 43.55 Accidents and adverse effects. . . . . .E800–E949 75,894 35.1. . . Motor vehicle accidents . . . . . . . .E810–E825 35,619 16.5. . . All other accidents and adverse
effects . . . . . . . . . .E800–E807,E826–E949 40,275 18.66 Pneumonia and influenza . . . . . . . . . .480–487 72,605 33.57 Diabetes mellitus . . . . . . . . . . . . . . . . . . 250 45,650 21.18 Suicide . . . . . . . . . . . . . . . . . . . .E950–E959 27,976 12.99 Human immunodeficiency virus
infection . . . . . . . . . . . . . . . . . . .*042–*044 25,578 11.810 Chronic liver disease and cirrhosis . . . . . . . 571 21,476 9.9. . . All other causes . . . . . . . . . . . . . . . .Residual 352,273 162.7
White, both sexes, 1–4 years
. . . All causes . . . . . . . . . . . . . . . . . . . . . . . . . 4,583 36.51 Accidents and adverse effects. . . . . .E800–E949 1,749 13.9. . . Motor vehicle accidents . . . . . . . .E810–E825 681 5.4. . . All other accidents and adverse
effects . . . . . . . . . .E800–E807,E826–E949 1,068 8.52 Congenital anomalies . . . . . . . . . . . . .740–759 515 4.13 Malignant neoplasms, including neoplasms of
lymphatic and hematopoietic tissues . . .140–208 411 3.34 Homicide and legal intervention. . . . .E960–E978 266 2.15 Diseases of heart . . . . . . .390–398,402,404–429 173 1.46 Pneumonia and influenza . . . . . . . . . .480–487 118 0.97 Human immunodeficiency virus
infection . . . . . . . . . . . . . . . . . . .*042–*044 75 0.68 Benign neoplasms, carcinoma in situ,
and neoplasms of uncertain behaviorand of unspecified nature. . . . . . . . . .210–239 62 0.5
9 Certain conditions originating in theperinatal period . . . . . . . . . . . . . . . .760–779 61 0.5
10 Septicemia . . . . . . . . . . . . . . . . . . . . . . 038 57 0.5. . . All other causes . . . . . . . . . . . . . . . .Residual 1,096 8.7
White, both sexes, 5–14 years
. . . All causes . . . . . . . . . . . . . . . . . . . . . . . . . 6,084 20.31 Accidents and adverse effects. . . . . .E800–E949 2,557 8.5. . . Motor vehicle accidents . . . . . . . .E810–E825 1,570 5.2. . . All other accidents and adverse
effects . . . . . . . . . .E800–E807,E826–E949 987 3.32 Malignant neoplasms, including neoplasms of
lymphatic and hematopoietic tissues . . .140–208 835 2.83 Congenital anomalies . . . . . . . . . . . . .740–759 338 1.14 Homicide and legal intervention. . . . .E960–E978 290 1.05 Suicide . . . . . . . . . . . . . . . . . . . .E950–E959 271 0.96 Diseases of heart . . . . . . .390–398,402,404–429 237 0.87 Human immunodeficiency virus
infection . . . . . . . . . . . . . . . . . . .*042–*044 88 0.38 Benign neoplasms, carcinoma in situ,
and neoplasms of uncertain behaviorand of unspecified nature. . . . . . . . . .210–239 79 0.3
9 Pneumonia and influenza . . . . . . . . . .480–487 73 0.210 Chronic obstructive pulmonary diseases
and allied conditions. . . . . . . . . . . . .490–496 62 0.2. . . All other causes . . . . . . . . . . . . . . . .Residual 1,254 4.2
Table 7. Number of deaths and death rates for the 10 leading causes of death in specified age groups, by race and sex: United States,1994—Con.[Rates per 100,000 population in specified group. For explanation of asterisks preceding cause-of-death categories, see ‘‘Technical notes’’]
26 Monthly Vital Statistics Report + Vol. 45, No. 3(S) + September 30, 1996
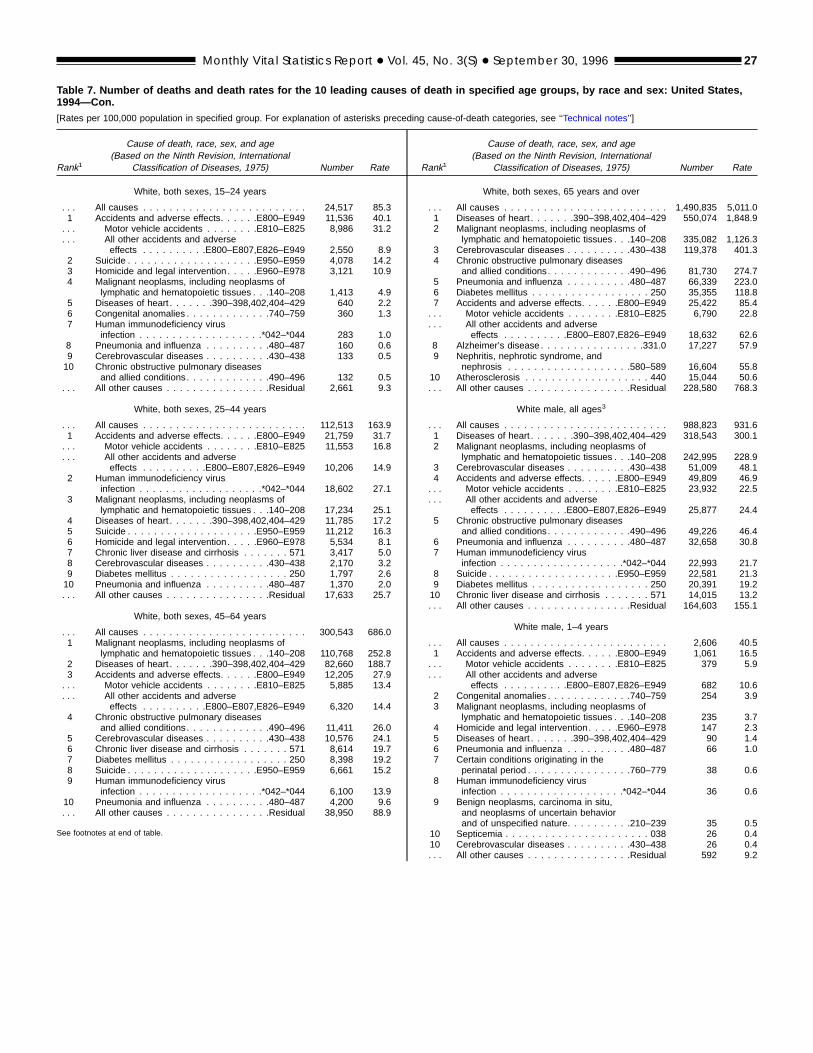
Rank1
Cause of death, race, sex, and age(Based on the Ninth Revision, International
Classification of Diseases, 1975) Number Rate
White, both sexes, 15–24 years
. . . All causes . . . . . . . . . . . . . . . . . . . . . . . . . 24,517 85.31 Accidents and adverse effects. . . . . .E800–E949 11,536 40.1. . . Motor vehicle accidents . . . . . . . .E810–E825 8,986 31.2. . . All other accidents and adverse
effects . . . . . . . . . .E800–E807,E826–E949 2,550 8.92 Suicide . . . . . . . . . . . . . . . . . . . .E950–E959 4,078 14.23 Homicide and legal intervention. . . . .E960–E978 3,121 10.94 Malignant neoplasms, including neoplasms of
lymphatic and hematopoietic tissues . . .140–208 1,413 4.95 Diseases of heart . . . . . . .390–398,402,404–429 640 2.26 Congenital anomalies . . . . . . . . . . . . .740–759 360 1.37 Human immunodeficiency virus
infection . . . . . . . . . . . . . . . . . . .*042–*044 283 1.08 Pneumonia and influenza . . . . . . . . . .480–487 160 0.69 Cerebrovascular diseases . . . . . . . . . .430–438 133 0.510 Chronic obstructive pulmonary diseases
and allied conditions. . . . . . . . . . . . .490–496 132 0.5. . . All other causes . . . . . . . . . . . . . . . .Residual 2,661 9.3
White, both sexes, 25–44 years
. . . All causes . . . . . . . . . . . . . . . . . . . . . . . . . 112,513 163.91 Accidents and adverse effects. . . . . .E800–E949 21,759 31.7. . . Motor vehicle accidents . . . . . . . .E810–E825 11,553 16.8. . . All other accidents and adverse
effects . . . . . . . . . .E800–E807,E826–E949 10,206 14.92 Human immunodeficiency virus
infection . . . . . . . . . . . . . . . . . . .*042–*044 18,602 27.13 Malignant neoplasms, including neoplasms of
lymphatic and hematopoietic tissues . . .140–208 17,234 25.14 Diseases of heart . . . . . . .390–398,402,404–429 11,785 17.25 Suicide . . . . . . . . . . . . . . . . . . . .E950–E959 11,212 16.36 Homicide and legal intervention. . . . .E960–E978 5,534 8.17 Chronic liver disease and cirrhosis . . . . . . . 571 3,417 5.08 Cerebrovascular diseases . . . . . . . . . .430–438 2,170 3.29 Diabetes mellitus . . . . . . . . . . . . . . . . . . 250 1,797 2.610 Pneumonia and influenza . . . . . . . . . .480–487 1,370 2.0. . . All other causes . . . . . . . . . . . . . . . .Residual 17,633 25.7
White, both sexes, 45–64 years
. . . All causes . . . . . . . . . . . . . . . . . . . . . . . . . 300,543 686.01 Malignant neoplasms, including neoplasms of
lymphatic and hematopoietic tissues . . .140–208 110,768 252.82 Diseases of heart . . . . . . .390–398,402,404–429 82,660 188.73 Accidents and adverse effects. . . . . .E800–E949 12,205 27.9. . . Motor vehicle accidents . . . . . . . .E810–E825 5,885 13.4. . . All other accidents and adverse
effects . . . . . . . . . .E800–E807,E826–E949 6,320 14.44 Chronic obstructive pulmonary diseases
and allied conditions. . . . . . . . . . . . .490–496 11,411 26.05 Cerebrovascular diseases . . . . . . . . . .430–438 10,576 24.16 Chronic liver disease and cirrhosis . . . . . . . 571 8,614 19.77 Diabetes mellitus . . . . . . . . . . . . . . . . . . 250 8,398 19.28 Suicide . . . . . . . . . . . . . . . . . . . .E950–E959 6,661 15.29 Human immunodeficiency virus
infection . . . . . . . . . . . . . . . . . . .*042–*044 6,100 13.910 Pneumonia and influenza . . . . . . . . . .480–487 4,200 9.6. . . All other causes . . . . . . . . . . . . . . . .Residual 38,950 88.9
See footnotes at end of table.
Rank1
Cause of death, race, sex, and age(Based on the Ninth Revision, International
Classification of Diseases, 1975) Number Rate
White, both sexes, 65 years and over
. . . All causes . . . . . . . . . . . . . . . . . . . . . . . . . 1,490,835 5,011.01 Diseases of heart . . . . . . .390–398,402,404–429 550,074 1,848.92 Malignant neoplasms, including neoplasms of
lymphatic and hematopoietic tissues . . .140–208 335,082 1,126.33 Cerebrovascular diseases . . . . . . . . . .430–438 119,378 401.34 Chronic obstructive pulmonary diseases
and allied conditions. . . . . . . . . . . . .490–496 81,730 274.75 Pneumonia and influenza . . . . . . . . . .480–487 66,339 223.06 Diabetes mellitus . . . . . . . . . . . . . . . . . . 250 35,355 118.87 Accidents and adverse effects. . . . . .E800–E949 25,422 85.4. . . Motor vehicle accidents . . . . . . . .E810–E825 6,790 22.8. . . All other accidents and adverse
effects . . . . . . . . . .E800–E807,E826–E949 18,632 62.68 Alzheimer’s disease . . . . . . . . . . . . . . . .331.0 17,227 57.99 Nephritis, nephrotic syndrome, and
nephrosis . . . . . . . . . . . . . . . . . . .580–589 16,604 55.810 Atherosclerosis . . . . . . . . . . . . . . . . . . . 440 15,044 50.6. . . All other causes . . . . . . . . . . . . . . . .Residual 228,580 768.3
White male, all ages3
. . . All causes . . . . . . . . . . . . . . . . . . . . . . . . . 988,823 931.61 Diseases of heart . . . . . . .390–398,402,404–429 318,543 300.12 Malignant neoplasms, including neoplasms of
lymphatic and hematopoietic tissues . . .140–208 242,995 228.93 Cerebrovascular diseases . . . . . . . . . .430–438 51,009 48.14 Accidents and adverse effects. . . . . .E800–E949 49,809 46.9. . . Motor vehicle accidents . . . . . . . .E810–E825 23,932 22.5. . . All other accidents and adverse
effects . . . . . . . . . .E800–E807,E826–E949 25,877 24.45 Chronic obstructive pulmonary diseases
and allied conditions. . . . . . . . . . . . .490–496 49,226 46.46 Pneumonia and influenza . . . . . . . . . .480–487 32,658 30.87 Human immunodeficiency virus
infection . . . . . . . . . . . . . . . . . . .*042–*044 22,993 21.78 Suicide . . . . . . . . . . . . . . . . . . . .E950–E959 22,581 21.39 Diabetes mellitus . . . . . . . . . . . . . . . . . . 250 20,391 19.210 Chronic liver disease and cirrhosis . . . . . . . 571 14,015 13.2. . . All other causes . . . . . . . . . . . . . . . .Residual 164,603 155.1
White male, 1–4 years
. . . All causes . . . . . . . . . . . . . . . . . . . . . . . . . 2,606 40.51 Accidents and adverse effects. . . . . .E800–E949 1,061 16.5. . . Motor vehicle accidents . . . . . . . .E810–E825 379 5.9. . . All other accidents and adverse
effects . . . . . . . . . .E800–E807,E826–E949 682 10.62 Congenital anomalies . . . . . . . . . . . . .740–759 254 3.93 Malignant neoplasms, including neoplasms of
lymphatic and hematopoietic tissues . . .140–208 235 3.74 Homicide and legal intervention. . . . .E960–E978 147 2.35 Diseases of heart . . . . . . .390–398,402,404–429 90 1.46 Pneumonia and influenza . . . . . . . . . .480–487 66 1.07 Certain conditions originating in the
perinatal period . . . . . . . . . . . . . . . .760–779 38 0.68 Human immunodeficiency virus
infection . . . . . . . . . . . . . . . . . . .*042–*044 36 0.69 Benign neoplasms, carcinoma in situ,
and neoplasms of uncertain behaviorand of unspecified nature. . . . . . . . . .210–239 35 0.5
10 Septicemia . . . . . . . . . . . . . . . . . . . . . . 038 26 0.410 Cerebrovascular diseases . . . . . . . . . .430–438 26 0.4. . . All other causes . . . . . . . . . . . . . . . .Residual 592 9.2
Table 7. Number of deaths and death rates for the 10 leading causes of death in specified age groups, by race and sex: United States,1994—Con.[Rates per 100,000 population in specified group. For explanation of asterisks preceding cause-of-death categories, see ‘‘Technical notes’’]
Monthly Vital Statistics Report + Vol. 45, No. 3(S) + September 30, 1996 27
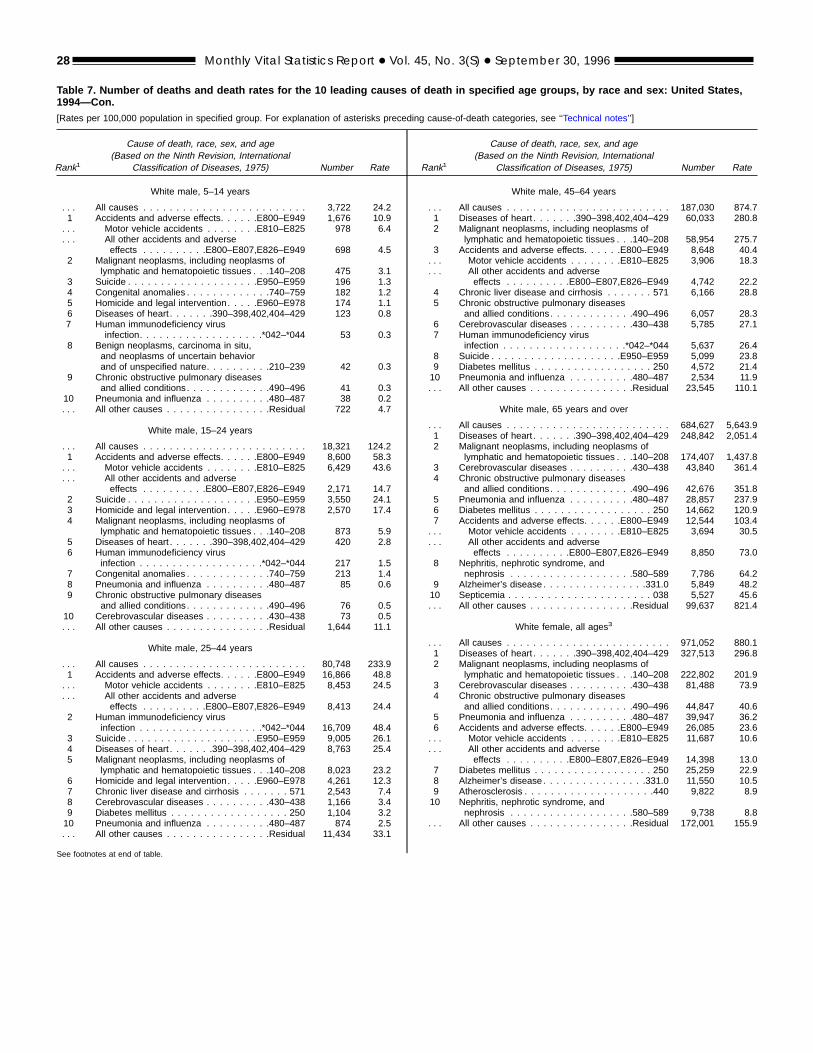
Rank1
Cause of death, race, sex, and age(Based on the Ninth Revision, International
Classification of Diseases, 1975) Number Rate
White male, 5–14 years
. . . All causes . . . . . . . . . . . . . . . . . . . . . . . . . 3,722 24.21 Accidents and adverse effects. . . . . .E800–E949 1,676 10.9. . . Motor vehicle accidents . . . . . . . .E810–E825 978 6.4. . . All other accidents and adverse
effects . . . . . . . . . .E800–E807,E826–E949 698 4.52 Malignant neoplasms, including neoplasms of
lymphatic and hematopoietic tissues . . .140–208 475 3.13 Suicide . . . . . . . . . . . . . . . . . . . .E950–E959 196 1.34 Congenital anomalies . . . . . . . . . . . . .740–759 182 1.25 Homicide and legal intervention. . . . .E960–E978 174 1.16 Diseases of heart . . . . . . .390–398,402,404–429 123 0.87 Human immunodeficiency virus
infection. . . . . . . . . . . . . . . . . . .*042–*044 53 0.38 Benign neoplasms, carcinoma in situ,
and neoplasms of uncertain behaviorand of unspecified nature. . . . . . . . . .210–239 42 0.3
9 Chronic obstructive pulmonary diseasesand allied conditions. . . . . . . . . . . . .490–496 41 0.3
10 Pneumonia and influenza . . . . . . . . . .480–487 38 0.2. . . All other causes . . . . . . . . . . . . . . . .Residual 722 4.7
White male, 15–24 years
. . . All causes . . . . . . . . . . . . . . . . . . . . . . . . . 18,321 124.21 Accidents and adverse effects. . . . . .E800–E949 8,600 58.3. . . Motor vehicle accidents . . . . . . . .E810–E825 6,429 43.6. . . All other accidents and adverse
effects . . . . . . . . . .E800–E807,E826–E949 2,171 14.72 Suicide . . . . . . . . . . . . . . . . . . . .E950–E959 3,550 24.13 Homicide and legal intervention. . . . .E960–E978 2,570 17.44 Malignant neoplasms, including neoplasms of
lymphatic and hematopoietic tissues . . .140–208 873 5.95 Diseases of heart . . . . . . .390–398,402,404–429 420 2.86 Human immunodeficiency virus
infection . . . . . . . . . . . . . . . . . . .*042–*044 217 1.57 Congenital anomalies . . . . . . . . . . . . .740–759 213 1.48 Pneumonia and influenza . . . . . . . . . .480–487 85 0.69 Chronic obstructive pulmonary diseases
and allied conditions. . . . . . . . . . . . .490–496 76 0.510 Cerebrovascular diseases . . . . . . . . . .430–438 73 0.5. . . All other causes . . . . . . . . . . . . . . . .Residual 1,644 11.1
White male, 25–44 years
. . . All causes . . . . . . . . . . . . . . . . . . . . . . . . . 80,748 233.91 Accidents and adverse effects. . . . . .E800–E949 16,866 48.8. . . Motor vehicle accidents . . . . . . . .E810–E825 8,453 24.5. . . All other accidents and adverse
effects . . . . . . . . . .E800–E807,E826–E949 8,413 24.42 Human immunodeficiency virus
infection . . . . . . . . . . . . . . . . . . .*042–*044 16,709 48.43 Suicide . . . . . . . . . . . . . . . . . . . .E950–E959 9,005 26.14 Diseases of heart . . . . . . .390–398,402,404–429 8,763 25.45 Malignant neoplasms, including neoplasms of
lymphatic and hematopoietic tissues . . .140–208 8,023 23.26 Homicide and legal intervention. . . . .E960–E978 4,261 12.37 Chronic liver disease and cirrhosis . . . . . . . 571 2,543 7.48 Cerebrovascular diseases . . . . . . . . . .430–438 1,166 3.49 Diabetes mellitus . . . . . . . . . . . . . . . . . . 250 1,104 3.210 Pneumonia and influenza . . . . . . . . . .480–487 874 2.5. . . All other causes . . . . . . . . . . . . . . . .Residual 11,434 33.1
See footnotes at end of table.
Rank1
Cause of death, race, sex, and age(Based on the Ninth Revision, International
Classification of Diseases, 1975) Number Rate
White male, 45–64 years
. . . All causes . . . . . . . . . . . . . . . . . . . . . . . . . 187,030 874.71 Diseases of heart . . . . . . .390–398,402,404–429 60,033 280.82 Malignant neoplasms, including neoplasms of
lymphatic and hematopoietic tissues . . .140–208 58,954 275.73 Accidents and adverse effects. . . . . .E800–E949 8,648 40.4. . . Motor vehicle accidents . . . . . . . .E810–E825 3,906 18.3. . . All other accidents and adverse
effects . . . . . . . . . .E800–E807,E826–E949 4,742 22.24 Chronic liver disease and cirrhosis . . . . . . . 571 6,166 28.85 Chronic obstructive pulmonary diseases
and allied conditions. . . . . . . . . . . . .490–496 6,057 28.36 Cerebrovascular diseases . . . . . . . . . .430–438 5,785 27.17 Human immunodeficiency virus
infection . . . . . . . . . . . . . . . . . . .*042–*044 5,637 26.48 Suicide . . . . . . . . . . . . . . . . . . . .E950–E959 5,099 23.89 Diabetes mellitus . . . . . . . . . . . . . . . . . . 250 4,572 21.410 Pneumonia and influenza . . . . . . . . . .480–487 2,534 11.9. . . All other causes . . . . . . . . . . . . . . . .Residual 23,545 110.1
White male, 65 years and over
. . . All causes . . . . . . . . . . . . . . . . . . . . . . . . . 684,627 5,643.91 Diseases of heart . . . . . . .390–398,402,404–429 248,842 2,051.42 Malignant neoplasms, including neoplasms of
lymphatic and hematopoietic tissues . . .140–208 174,407 1,437.83 Cerebrovascular diseases . . . . . . . . . .430–438 43,840 361.44 Chronic obstructive pulmonary diseases
and allied conditions. . . . . . . . . . . . .490–496 42,676 351.85 Pneumonia and influenza . . . . . . . . . .480–487 28,857 237.96 Diabetes mellitus . . . . . . . . . . . . . . . . . . 250 14,662 120.97 Accidents and adverse effects. . . . . .E800–E949 12,544 103.4. . . Motor vehicle accidents . . . . . . . .E810–E825 3,694 30.5. . . All other accidents and adverse
effects . . . . . . . . . .E800–E807,E826–E949 8,850 73.08 Nephritis, nephrotic syndrome, and
nephrosis . . . . . . . . . . . . . . . . . . .580–589 7,786 64.29 Alzheimer’s disease . . . . . . . . . . . . . . . .331.0 5,849 48.210 Septicemia . . . . . . . . . . . . . . . . . . . . . . 038 5,527 45.6. . . All other causes . . . . . . . . . . . . . . . .Residual 99,637 821.4
White female, all ages3
. . . All causes . . . . . . . . . . . . . . . . . . . . . . . . . 971,052 880.11 Diseases of heart . . . . . . .390–398,402,404–429 327,513 296.82 Malignant neoplasms, including neoplasms of
lymphatic and hematopoietic tissues . . .140–208 222,802 201.93 Cerebrovascular diseases . . . . . . . . . .430–438 81,488 73.94 Chronic obstructive pulmonary diseases
and allied conditions. . . . . . . . . . . . .490–496 44,847 40.65 Pneumonia and influenza . . . . . . . . . .480–487 39,947 36.26 Accidents and adverse effects. . . . . .E800–E949 26,085 23.6. . . Motor vehicle accidents . . . . . . . .E810–E825 11,687 10.6. . . All other accidents and adverse
effects . . . . . . . . . .E800–E807,E826–E949 14,398 13.07 Diabetes mellitus . . . . . . . . . . . . . . . . . . 250 25,259 22.98 Alzheimer’s disease . . . . . . . . . . . . . . . .331.0 11,550 10.59 Atherosclerosis . . . . . . . . . . . . . . . . . . . .440 9,822 8.910 Nephritis, nephrotic syndrome, and
nephrosis . . . . . . . . . . . . . . . . . . .580–589 9,738 8.8. . . All other causes . . . . . . . . . . . . . . . .Residual 172,001 155.9
Table 7. Number of deaths and death rates for the 10 leading causes of death in specified age groups, by race and sex: United States,1994—Con.[Rates per 100,000 population in specified group. For explanation of asterisks preceding cause-of-death categories, see ‘‘Technical notes’’]
28 Monthly Vital Statistics Report + Vol. 45, No. 3(S) + September 30, 1996
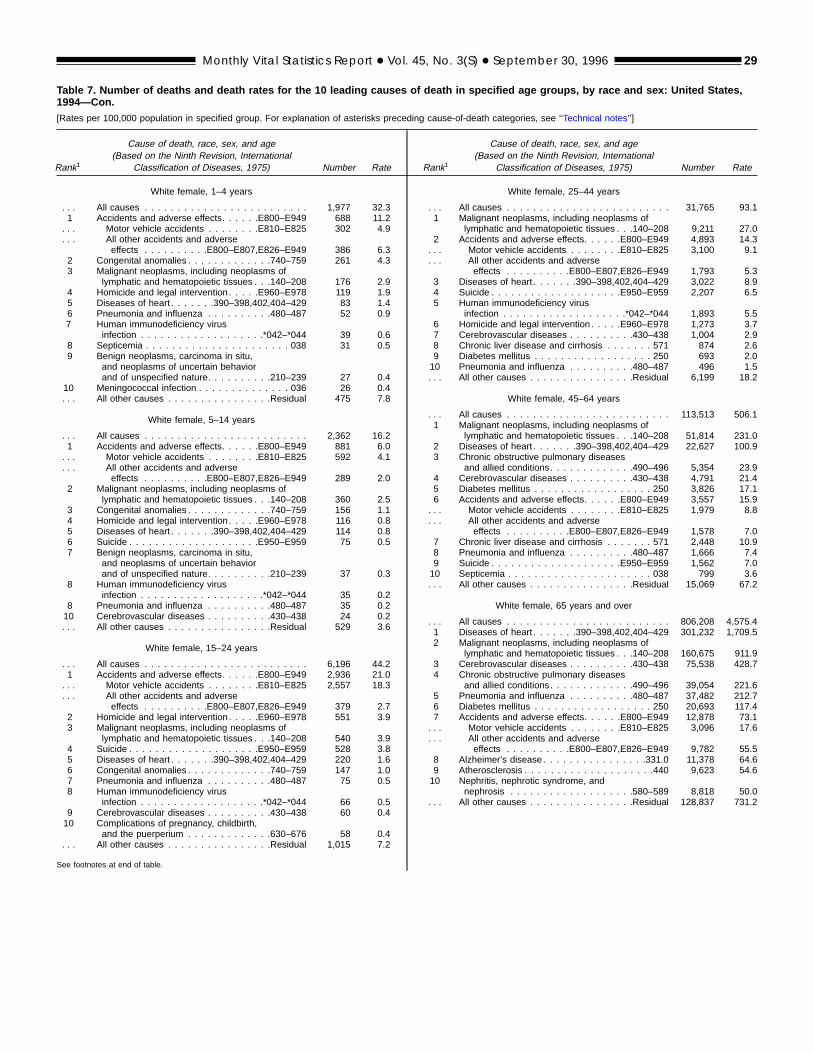
Rank1
Cause of death, race, sex, and age(Based on the Ninth Revision, International
Classification of Diseases, 1975) Number Rate
White female, 1–4 years
. . . All causes . . . . . . . . . . . . . . . . . . . . . . . . . 1,977 32.31 Accidents and adverse effects. . . . . .E800–E949 688 11.2. . . Motor vehicle accidents . . . . . . . .E810–E825 302 4.9. . . All other accidents and adverse
effects . . . . . . . . . .E800–E807,E826–E949 386 6.32 Congenital anomalies . . . . . . . . . . . . .740–759 261 4.33 Malignant neoplasms, including neoplasms of
lymphatic and hematopoietic tissues . . .140–208 176 2.94 Homicide and legal intervention. . . . .E960–E978 119 1.95 Diseases of heart . . . . . . .390–398,402,404–429 83 1.46 Pneumonia and influenza . . . . . . . . . .480–487 52 0.97 Human immunodeficiency virus
infection . . . . . . . . . . . . . . . . . . .*042–*044 39 0.68 Septicemia . . . . . . . . . . . . . . . . . . . . . . 038 31 0.59 Benign neoplasms, carcinoma in situ,
and neoplasms of uncertain behaviorand of unspecified nature. . . . . . . . . .210–239 27 0.4
10 Meningococcal infection . . . . . . . . . . . . . . 036 26 0.4. . . All other causes . . . . . . . . . . . . . . . .Residual 475 7.8
White female, 5–14 years
. . . All causes . . . . . . . . . . . . . . . . . . . . . . . . . 2,362 16.21 Accidents and adverse effects. . . . . .E800–E949 881 6.0. . . Motor vehicle accidents . . . . . . . .E810–E825 592 4.1. . . All other accidents and adverse
effects . . . . . . . . . .E800–E807,E826–E949 289 2.02 Malignant neoplasms, including neoplasms of
lymphatic and hematopoietic tissues . . .140–208 360 2.53 Congenital anomalies . . . . . . . . . . . . .740–759 156 1.14 Homicide and legal intervention. . . . .E960–E978 116 0.85 Diseases of heart . . . . . . .390–398,402,404–429 114 0.86 Suicide . . . . . . . . . . . . . . . . . . . .E950–E959 75 0.57 Benign neoplasms, carcinoma in situ,
and neoplasms of uncertain behaviorand of unspecified nature. . . . . . . . . .210–239 37 0.3
8 Human immunodeficiency virusinfection . . . . . . . . . . . . . . . . . . .*042–*044 35 0.2
8 Pneumonia and influenza . . . . . . . . . .480–487 35 0.210 Cerebrovascular diseases . . . . . . . . . .430–438 24 0.2. . . All other causes . . . . . . . . . . . . . . . .Residual 529 3.6
White female, 15–24 years
. . . All causes . . . . . . . . . . . . . . . . . . . . . . . . . 6,196 44.21 Accidents and adverse effects. . . . . .E800–E949 2,936 21.0. . . Motor vehicle accidents . . . . . . . .E810–E825 2,557 18.3. . . All other accidents and adverse
effects . . . . . . . . . .E800–E807,E826–E949 379 2.72 Homicide and legal intervention. . . . .E960–E978 551 3.93 Malignant neoplasms, including neoplasms of
lymphatic and hematopoietic tissues . . .140–208 540 3.94 Suicide . . . . . . . . . . . . . . . . . . . .E950–E959 528 3.85 Diseases of heart . . . . . . .390–398,402,404–429 220 1.66 Congenital anomalies . . . . . . . . . . . . .740–759 147 1.07 Pneumonia and influenza . . . . . . . . . .480–487 75 0.58 Human immunodeficiency virus
infection . . . . . . . . . . . . . . . . . . .*042–*044 66 0.59 Cerebrovascular diseases . . . . . . . . . .430–438 60 0.410 Complications of pregnancy, childbirth,
and the puerperium . . . . . . . . . . . . .630–676 58 0.4. . . All other causes . . . . . . . . . . . . . . . .Residual 1,015 7.2
See footnotes at end of table.
Rank1
Cause of death, race, sex, and age(Based on the Ninth Revision, International
Classification of Diseases, 1975) Number Rate
White female, 25–44 years
. . . All causes . . . . . . . . . . . . . . . . . . . . . . . . . 31,765 93.11 Malignant neoplasms, including neoplasms of
lymphatic and hematopoietic tissues . . .140–208 9,211 27.02 Accidents and adverse effects. . . . . .E800–E949 4,893 14.3. . . Motor vehicle accidents . . . . . . . .E810–E825 3,100 9.1. . . All other accidents and adverse
effects . . . . . . . . . .E800–E807,E826–E949 1,793 5.33 Diseases of heart . . . . . . .390–398,402,404–429 3,022 8.94 Suicide . . . . . . . . . . . . . . . . . . . .E950–E959 2,207 6.55 Human immunodeficiency virus
infection . . . . . . . . . . . . . . . . . . .*042–*044 1,893 5.56 Homicide and legal intervention. . . . .E960–E978 1,273 3.77 Cerebrovascular diseases . . . . . . . . . .430–438 1,004 2.98 Chronic liver disease and cirrhosis . . . . . . . 571 874 2.69 Diabetes mellitus . . . . . . . . . . . . . . . . . . 250 693 2.010 Pneumonia and influenza . . . . . . . . . .480–487 496 1.5. . . All other causes . . . . . . . . . . . . . . . .Residual 6,199 18.2
White female, 45–64 years
. . . All causes . . . . . . . . . . . . . . . . . . . . . . . . . 113,513 506.11 Malignant neoplasms, including neoplasms of
lymphatic and hematopoietic tissues . . .140–208 51,814 231.02 Diseases of heart . . . . . . .390–398,402,404–429 22,627 100.93 Chronic obstructive pulmonary diseases
and allied conditions. . . . . . . . . . . . .490–496 5,354 23.94 Cerebrovascular diseases . . . . . . . . . .430–438 4,791 21.45 Diabetes mellitus . . . . . . . . . . . . . . . . . . 250 3,826 17.16 Accidents and adverse effects. . . . . .E800–E949 3,557 15.9. . . Motor vehicle accidents . . . . . . . .E810–E825 1,979 8.8. . . All other accidents and adverse
effects . . . . . . . . . .E800–E807,E826–E949 1,578 7.07 Chronic liver disease and cirrhosis . . . . . . . 571 2,448 10.98 Pneumonia and influenza . . . . . . . . . .480–487 1,666 7.49 Suicide . . . . . . . . . . . . . . . . . . . .E950–E959 1,562 7.010 Septicemia . . . . . . . . . . . . . . . . . . . . . . 038 799 3.6. . . All other causes . . . . . . . . . . . . . . . .Residual 15,069 67.2
White female, 65 years and over
. . . All causes . . . . . . . . . . . . . . . . . . . . . . . . . 806,208 4,575.41 Diseases of heart . . . . . . .390–398,402,404–429 301,232 1,709.52 Malignant neoplasms, including neoplasms of
lymphatic and hematopoietic tissues . . .140–208 160,675 911.93 Cerebrovascular diseases . . . . . . . . . .430–438 75,538 428.74 Chronic obstructive pulmonary diseases
and allied conditions. . . . . . . . . . . . .490–496 39,054 221.65 Pneumonia and influenza . . . . . . . . . .480–487 37,482 212.76 Diabetes mellitus . . . . . . . . . . . . . . . . . . 250 20,693 117.47 Accidents and adverse effects. . . . . .E800–E949 12,878 73.1. . . Motor vehicle accidents . . . . . . . .E810–E825 3,096 17.6. . . All other accidents and adverse
effects . . . . . . . . . .E800–E807,E826–E949 9,782 55.58 Alzheimer’s disease . . . . . . . . . . . . . . . .331.0 11,378 64.69 Atherosclerosis . . . . . . . . . . . . . . . . . . . .440 9,623 54.610 Nephritis, nephrotic syndrome, and
nephrosis . . . . . . . . . . . . . . . . . . .580–589 8,818 50.0. . . All other causes . . . . . . . . . . . . . . . .Residual 128,837 731.2
Table 7. Number of deaths and death rates for the 10 leading causes of death in specified age groups, by race and sex: United States,1994—Con.[Rates per 100,000 population in specified group. For explanation of asterisks preceding cause-of-death categories, see ‘‘Technical notes’’]
Monthly Vital Statistics Report + Vol. 45, No. 3(S) + September 30, 1996 29
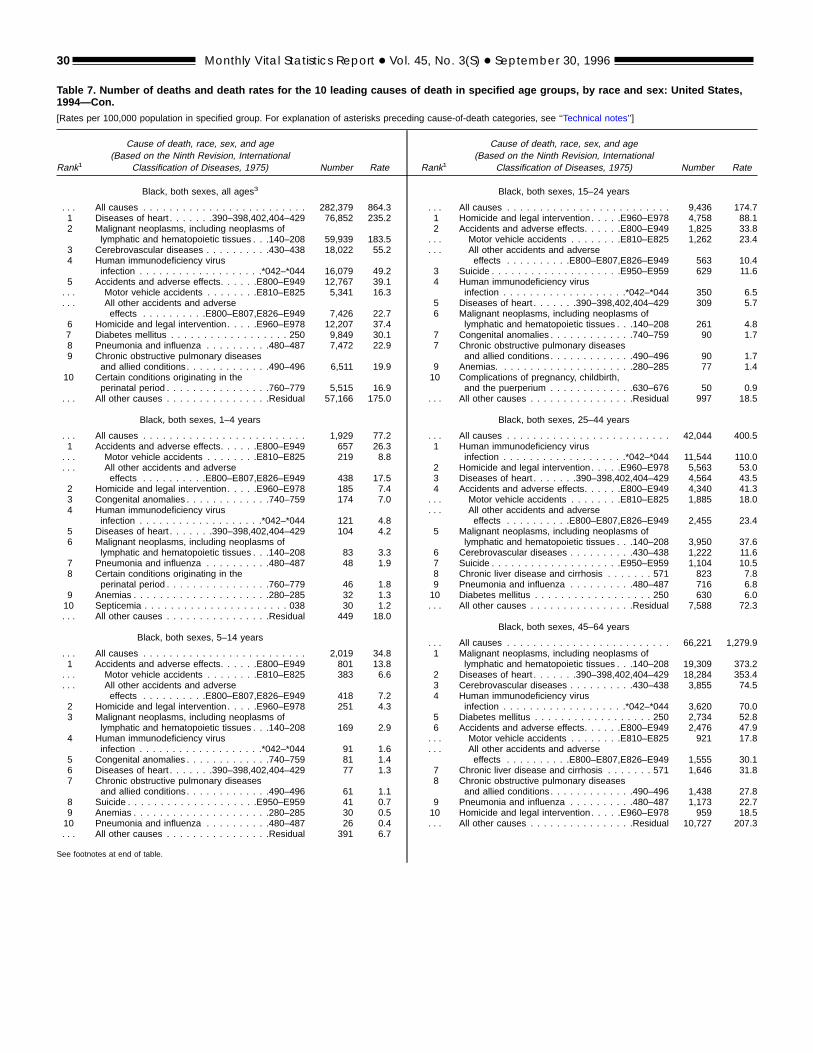
Rank1
Cause of death, race, sex, and age(Based on the Ninth Revision, International
Classification of Diseases, 1975) Number Rate
Black, both sexes, all ages3
. . . All causes . . . . . . . . . . . . . . . . . . . . . . . . . 282,379 864.31 Diseases of heart . . . . . . .390–398,402,404–429 76,852 235.22 Malignant neoplasms, including neoplasms of
lymphatic and hematopoietic tissues . . .140–208 59,939 183.53 Cerebrovascular diseases . . . . . . . . . .430–438 18,022 55.24 Human immunodeficiency virus
infection . . . . . . . . . . . . . . . . . . .*042–*044 16,079 49.25 Accidents and adverse effects. . . . . .E800–E949 12,767 39.1. . . Motor vehicle accidents . . . . . . . .E810–E825 5,341 16.3. . . All other accidents and adverse
effects . . . . . . . . . .E800–E807,E826–E949 7,426 22.76 Homicide and legal intervention. . . . .E960–E978 12,207 37.47 Diabetes mellitus . . . . . . . . . . . . . . . . . . 250 9,849 30.18 Pneumonia and influenza . . . . . . . . . .480–487 7,472 22.99 Chronic obstructive pulmonary diseases
and allied conditions. . . . . . . . . . . . .490–496 6,511 19.910 Certain conditions originating in the
perinatal period . . . . . . . . . . . . . . . .760–779 5,515 16.9. . . All other causes . . . . . . . . . . . . . . . .Residual 57,166 175.0
Black, both sexes, 1–4 years
. . . All causes . . . . . . . . . . . . . . . . . . . . . . . . . 1,929 77.21 Accidents and adverse effects. . . . . .E800–E949 657 26.3. . . Motor vehicle accidents . . . . . . . .E810–E825 219 8.8. . . All other accidents and adverse
effects . . . . . . . . . .E800–E807,E826–E949 438 17.52 Homicide and legal intervention. . . . .E960–E978 185 7.43 Congenital anomalies . . . . . . . . . . . . .740–759 174 7.04 Human immunodeficiency virus
infection . . . . . . . . . . . . . . . . . . .*042–*044 121 4.85 Diseases of heart . . . . . . .390–398,402,404–429 104 4.26 Malignant neoplasms, including neoplasms of
lymphatic and hematopoietic tissues . . .140–208 83 3.37 Pneumonia and influenza . . . . . . . . . .480–487 48 1.98 Certain conditions originating in the
perinatal period . . . . . . . . . . . . . . . .760–779 46 1.89 Anemias . . . . . . . . . . . . . . . . . . . . .280–285 32 1.310 Septicemia . . . . . . . . . . . . . . . . . . . . . . 038 30 1.2. . . All other causes . . . . . . . . . . . . . . . .Residual 449 18.0
Black, both sexes, 5–14 years
. . . All causes . . . . . . . . . . . . . . . . . . . . . . . . . 2,019 34.81 Accidents and adverse effects. . . . . .E800–E949 801 13.8. . . Motor vehicle accidents . . . . . . . .E810–E825 383 6.6. . . All other accidents and adverse
effects . . . . . . . . . .E800–E807,E826–E949 418 7.22 Homicide and legal intervention. . . . .E960–E978 251 4.33 Malignant neoplasms, including neoplasms of
lymphatic and hematopoietic tissues . . .140–208 169 2.94 Human immunodeficiency virus
infection . . . . . . . . . . . . . . . . . . .*042–*044 91 1.65 Congenital anomalies . . . . . . . . . . . . .740–759 81 1.46 Diseases of heart . . . . . . .390–398,402,404–429 77 1.37 Chronic obstructive pulmonary diseases
and allied conditions. . . . . . . . . . . . .490–496 61 1.18 Suicide . . . . . . . . . . . . . . . . . . . .E950–E959 41 0.79 Anemias . . . . . . . . . . . . . . . . . . . . .280–285 30 0.510 Pneumonia and influenza . . . . . . . . . .480–487 26 0.4. . . All other causes . . . . . . . . . . . . . . . .Residual 391 6.7
See footnotes at end of table.
Rank1
Cause of death, race, sex, and age(Based on the Ninth Revision, International
Classification of Diseases, 1975) Number Rate
Black, both sexes, 15–24 years
. . . All causes . . . . . . . . . . . . . . . . . . . . . . . . . 9,436 174.71 Homicide and legal intervention. . . . .E960–E978 4,758 88.12 Accidents and adverse effects. . . . . .E800–E949 1,825 33.8. . . Motor vehicle accidents . . . . . . . .E810–E825 1,262 23.4. . . All other accidents and adverse
effects . . . . . . . . . .E800–E807,E826–E949 563 10.43 Suicide . . . . . . . . . . . . . . . . . . . .E950–E959 629 11.64 Human immunodeficiency virus
infection . . . . . . . . . . . . . . . . . . .*042–*044 350 6.55 Diseases of heart . . . . . . .390–398,402,404–429 309 5.76 Malignant neoplasms, including neoplasms of
lymphatic and hematopoietic tissues . . .140–208 261 4.87 Congenital anomalies . . . . . . . . . . . . .740–759 90 1.77 Chronic obstructive pulmonary diseases
and allied conditions. . . . . . . . . . . . .490–496 90 1.79 Anemias. . . . . . . . . . . . . . . . . . . . .280–285 77 1.410 Complications of pregnancy, childbirth,
and the puerperium . . . . . . . . . . . . .630–676 50 0.9. . . All other causes . . . . . . . . . . . . . . . .Residual 997 18.5
Black, both sexes, 25–44 years
. . . All causes . . . . . . . . . . . . . . . . . . . . . . . . . 42,044 400.51 Human immunodeficiency virus
infection . . . . . . . . . . . . . . . . . . .*042–*044 11,544 110.02 Homicide and legal intervention. . . . .E960–E978 5,563 53.03 Diseases of heart . . . . . . .390–398,402,404–429 4,564 43.54 Accidents and adverse effects. . . . . .E800–E949 4,340 41.3. . . Motor vehicle accidents . . . . . . . .E810–E825 1,885 18.0. . . All other accidents and adverse
effects . . . . . . . . . .E800–E807,E826–E949 2,455 23.45 Malignant neoplasms, including neoplasms of
lymphatic and hematopoietic tissues . . .140–208 3,950 37.66 Cerebrovascular diseases . . . . . . . . . .430–438 1,222 11.67 Suicide . . . . . . . . . . . . . . . . . . . .E950–E959 1,104 10.58 Chronic liver disease and cirrhosis . . . . . . . 571 823 7.89 Pneumonia and influenza . . . . . . . . . .480–487 716 6.810 Diabetes mellitus . . . . . . . . . . . . . . . . . . 250 630 6.0. . . All other causes . . . . . . . . . . . . . . . .Residual 7,588 72.3
Black, both sexes, 45–64 years
. . . All causes . . . . . . . . . . . . . . . . . . . . . . . . . 66,221 1,279.91 Malignant neoplasms, including neoplasms of
lymphatic and hematopoietic tissues . . .140–208 19,309 373.22 Diseases of heart . . . . . . .390–398,402,404–429 18,284 353.43 Cerebrovascular diseases . . . . . . . . . .430–438 3,855 74.54 Human immunodeficiency virus
infection . . . . . . . . . . . . . . . . . . .*042–*044 3,620 70.05 Diabetes mellitus . . . . . . . . . . . . . . . . . . 250 2,734 52.86 Accidents and adverse effects. . . . . .E800–E949 2,476 47.9. . . Motor vehicle accidents . . . . . . . .E810–E825 921 17.8. . . All other accidents and adverse
effects . . . . . . . . . .E800–E807,E826–E949 1,555 30.17 Chronic liver disease and cirrhosis . . . . . . . 571 1,646 31.88 Chronic obstructive pulmonary diseases
and allied conditions. . . . . . . . . . . . .490–496 1,438 27.89 Pneumonia and influenza . . . . . . . . . .480–487 1,173 22.710 Homicide and legal intervention. . . . .E960–E978 959 18.5. . . All other causes . . . . . . . . . . . . . . . .Residual 10,727 207.3
Table 7. Number of deaths and death rates for the 10 leading causes of death in specified age groups, by race and sex: United States,1994—Con.[Rates per 100,000 population in specified group. For explanation of asterisks preceding cause-of-death categories, see ‘‘Technical notes’’]
30 Monthly Vital Statistics Report + Vol. 45, No. 3(S) + September 30, 1996
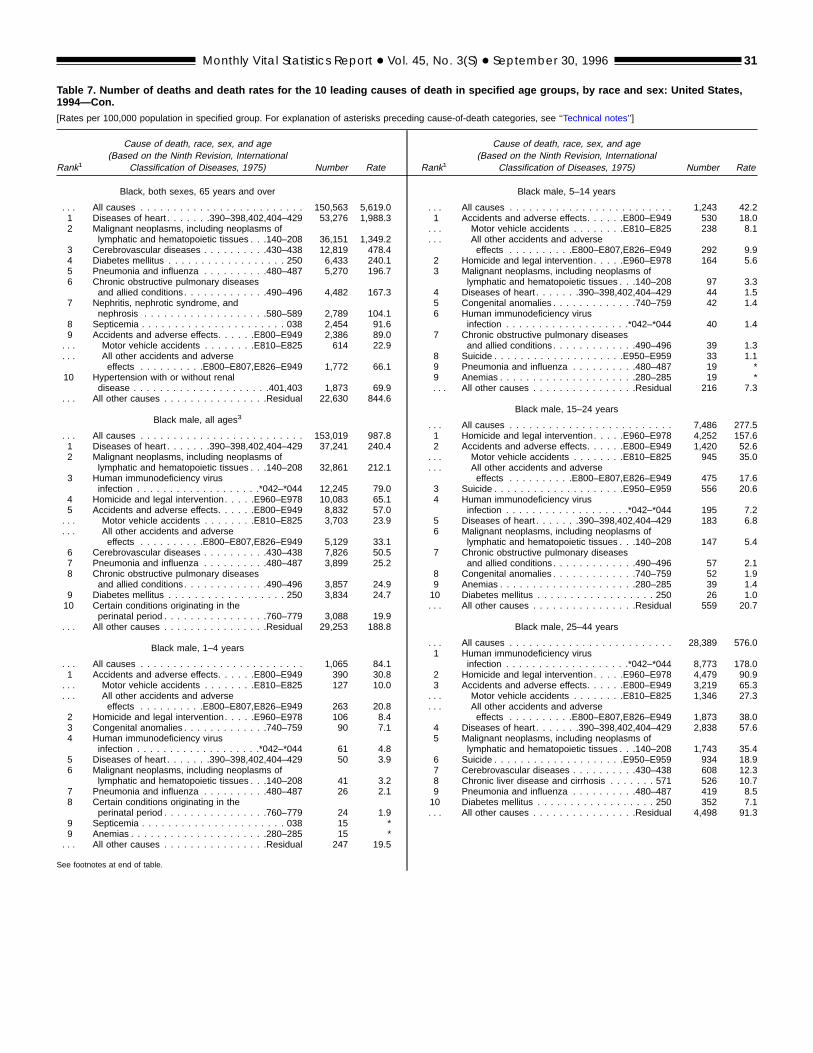
Rank1
Cause of death, race, sex, and age(Based on the Ninth Revision, International
Classification of Diseases, 1975) Number Rate
Black, both sexes, 65 years and over
. . . All causes . . . . . . . . . . . . . . . . . . . . . . . . . 150,563 5,619.01 Diseases of heart . . . . . . .390–398,402,404–429 53,276 1,988.32 Malignant neoplasms, including neoplasms of
lymphatic and hematopoietic tissues . . .140–208 36,151 1,349.23 Cerebrovascular diseases . . . . . . . . . .430–438 12,819 478.44 Diabetes mellitus . . . . . . . . . . . . . . . . . . 250 6,433 240.15 Pneumonia and influenza . . . . . . . . . .480–487 5,270 196.76 Chronic obstructive pulmonary diseases
and allied conditions. . . . . . . . . . . . .490–496 4,482 167.37 Nephritis, nephrotic syndrome, and
nephrosis . . . . . . . . . . . . . . . . . . .580–589 2,789 104.18 Septicemia . . . . . . . . . . . . . . . . . . . . . . 038 2,454 91.69 Accidents and adverse effects. . . . . .E800–E949 2,386 89.0. . . Motor vehicle accidents . . . . . . . .E810–E825 614 22.9. . . All other accidents and adverse
effects . . . . . . . . . .E800–E807,E826–E949 1,772 66.110 Hypertension with or without renal
disease . . . . . . . . . . . . . . . . . . . . .401,403 1,873 69.9. . . All other causes . . . . . . . . . . . . . . . .Residual 22,630 844.6
Black male, all ages3
. . . All causes . . . . . . . . . . . . . . . . . . . . . . . . . 153,019 987.81 Diseases of heart . . . . . . .390–398,402,404–429 37,241 240.42 Malignant neoplasms, including neoplasms of
lymphatic and hematopoietic tissues . . .140–208 32,861 212.13 Human immunodeficiency virus
infection . . . . . . . . . . . . . . . . . . .*042–*044 12,245 79.04 Homicide and legal intervention. . . . .E960–E978 10,083 65.15 Accidents and adverse effects. . . . . .E800–E949 8,832 57.0. . . Motor vehicle accidents . . . . . . . .E810–E825 3,703 23.9. . . All other accidents and adverse
effects . . . . . . . . . .E800–E807,E826–E949 5,129 33.16 Cerebrovascular diseases . . . . . . . . . .430–438 7,826 50.57 Pneumonia and influenza . . . . . . . . . .480–487 3,899 25.28 Chronic obstructive pulmonary diseases
and allied conditions. . . . . . . . . . . . .490–496 3,857 24.99 Diabetes mellitus . . . . . . . . . . . . . . . . . . 250 3,834 24.710 Certain conditions originating in the
perinatal period . . . . . . . . . . . . . . . .760–779 3,088 19.9. . . All other causes . . . . . . . . . . . . . . . .Residual 29,253 188.8
Black male, 1–4 years
. . . All causes . . . . . . . . . . . . . . . . . . . . . . . . . 1,065 84.11 Accidents and adverse effects. . . . . .E800–E949 390 30.8. . . Motor vehicle accidents . . . . . . . .E810–E825 127 10.0. . . All other accidents and adverse
effects . . . . . . . . . .E800–E807,E826–E949 263 20.82 Homicide and legal intervention. . . . .E960–E978 106 8.43 Congenital anomalies . . . . . . . . . . . . .740–759 90 7.14 Human immunodeficiency virus
infection . . . . . . . . . . . . . . . . . . .*042–*044 61 4.85 Diseases of heart . . . . . . .390–398,402,404–429 50 3.96 Malignant neoplasms, including neoplasms of
lymphatic and hematopoietic tissues . . .140–208 41 3.27 Pneumonia and influenza . . . . . . . . . .480–487 26 2.18 Certain conditions originating in the
perinatal period . . . . . . . . . . . . . . . .760–779 24 1.99 Septicemia . . . . . . . . . . . . . . . . . . . . . . 038 15 *9 Anemias . . . . . . . . . . . . . . . . . . . . .280–285 15 *. . . All other causes . . . . . . . . . . . . . . . .Residual 247 19.5
See footnotes at end of table.
Rank1
Cause of death, race, sex, and age(Based on the Ninth Revision, International
Classification of Diseases, 1975) Number Rate
Black male, 5–14 years
. . . All causes . . . . . . . . . . . . . . . . . . . . . . . . . 1,243 42.21 Accidents and adverse effects. . . . . .E800–E949 530 18.0. . . Motor vehicle accidents . . . . . . . .E810–E825 238 8.1. . . All other accidents and adverse
effects . . . . . . . . . .E800–E807,E826–E949 292 9.92 Homicide and legal intervention. . . . .E960–E978 164 5.63 Malignant neoplasms, including neoplasms of
lymphatic and hematopoietic tissues . . .140–208 97 3.34 Diseases of heart . . . . . . .390–398,402,404–429 44 1.55 Congenital anomalies . . . . . . . . . . . . .740–759 42 1.46 Human immunodeficiency virus
infection . . . . . . . . . . . . . . . . . . .*042–*044 40 1.47 Chronic obstructive pulmonary diseases
and allied conditions. . . . . . . . . . . . .490–496 39 1.38 Suicide . . . . . . . . . . . . . . . . . . . .E950–E959 33 1.19 Pneumonia and influenza . . . . . . . . . .480–487 19 *9 Anemias . . . . . . . . . . . . . . . . . . . . .280–285 19 *. . . All other causes . . . . . . . . . . . . . . . .Residual 216 7.3
Black male, 15–24 years
. . . All causes . . . . . . . . . . . . . . . . . . . . . . . . . 7,486 277.51 Homicide and legal intervention. . . . .E960–E978 4,252 157.62 Accidents and adverse effects. . . . . .E800–E949 1,420 52.6. . . Motor vehicle accidents . . . . . . . .E810–E825 945 35.0. . . All other accidents and adverse
effects . . . . . . . . . .E800–E807,E826–E949 475 17.63 Suicide . . . . . . . . . . . . . . . . . . . .E950–E959 556 20.64 Human immunodeficiency virus
infection . . . . . . . . . . . . . . . . . . .*042–*044 195 7.25 Diseases of heart . . . . . . .390–398,402,404–429 183 6.86 Malignant neoplasms, including neoplasms of
lymphatic and hematopoietic tissues . . .140–208 147 5.47 Chronic obstructive pulmonary diseases
and allied conditions. . . . . . . . . . . . .490–496 57 2.18 Congenital anomalies . . . . . . . . . . . . .740–759 52 1.99 Anemias . . . . . . . . . . . . . . . . . . . . .280–285 39 1.410 Diabetes mellitus . . . . . . . . . . . . . . . . . . 250 26 1.0. . . All other causes . . . . . . . . . . . . . . . .Residual 559 20.7
Black male, 25–44 years
. . . All causes . . . . . . . . . . . . . . . . . . . . . . . . . 28,389 576.01 Human immunodeficiency virus
infection . . . . . . . . . . . . . . . . . . .*042–*044 8,773 178.02 Homicide and legal intervention. . . . .E960–E978 4,479 90.93 Accidents and adverse effects. . . . . .E800–E949 3,219 65.3. . . Motor vehicle accidents . . . . . . . .E810–E825 1,346 27.3. . . All other accidents and adverse
effects . . . . . . . . . .E800–E807,E826–E949 1,873 38.04 Diseases of heart . . . . . . .390–398,402,404–429 2,838 57.65 Malignant neoplasms, including neoplasms of
lymphatic and hematopoietic tissues . . .140–208 1,743 35.46 Suicide . . . . . . . . . . . . . . . . . . . .E950–E959 934 18.97 Cerebrovascular diseases . . . . . . . . . .430–438 608 12.38 Chronic liver disease and cirrhosis . . . . . . . 571 526 10.79 Pneumonia and influenza . . . . . . . . . .480–487 419 8.510 Diabetes mellitus . . . . . . . . . . . . . . . . . . 250 352 7.1. . . All other causes . . . . . . . . . . . . . . . .Residual 4,498 91.3
Table 7. Number of deaths and death rates for the 10 leading causes of death in specified age groups, by race and sex: United States,1994—Con.[Rates per 100,000 population in specified group. For explanation of asterisks preceding cause-of-death categories, see ‘‘Technical notes’’]
Monthly Vital Statistics Report + Vol. 45, No. 3(S) + September 30, 1996 31
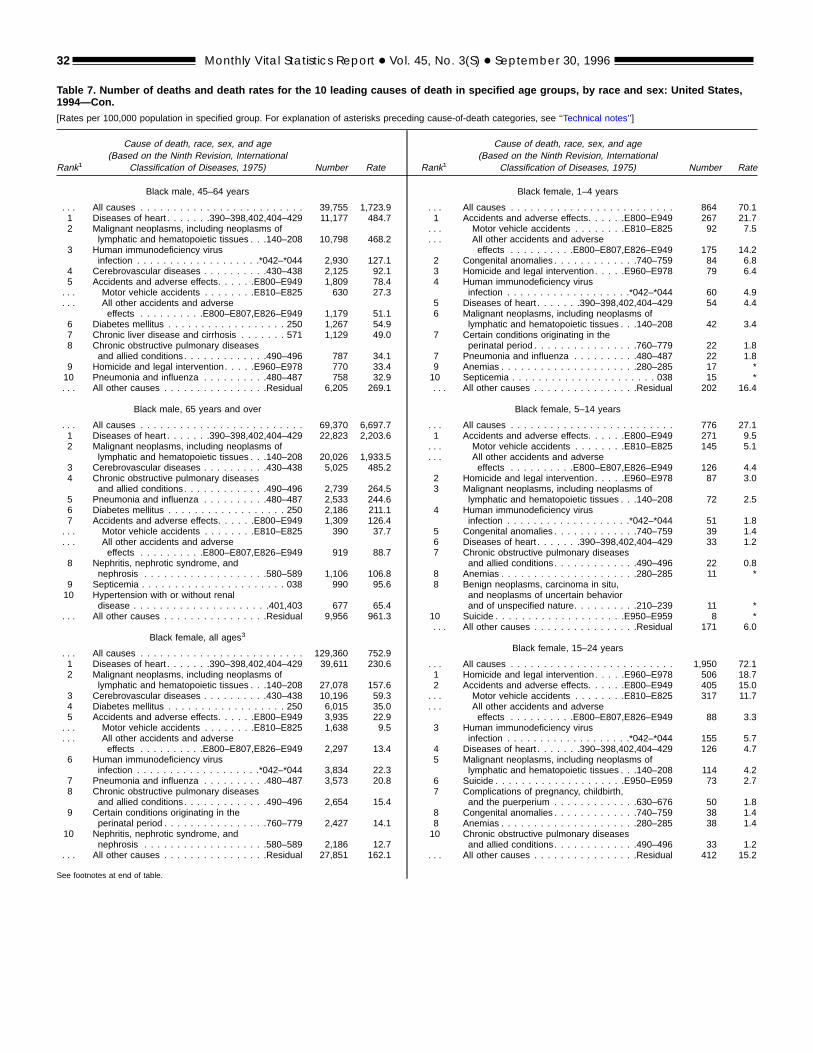
Rank1
Cause of death, race, sex, and age(Based on the Ninth Revision, International
Classification of Diseases, 1975) Number Rate
Black male, 45–64 years
. . . All causes . . . . . . . . . . . . . . . . . . . . . . . . . 39,755 1,723.91 Diseases of heart . . . . . . .390–398,402,404–429 11,177 484.72 Malignant neoplasms, including neoplasms of
lymphatic and hematopoietic tissues . . .140–208 10,798 468.23 Human immunodeficiency virus
infection . . . . . . . . . . . . . . . . . . .*042–*044 2,930 127.14 Cerebrovascular diseases . . . . . . . . . .430–438 2,125 92.15 Accidents and adverse effects. . . . . .E800–E949 1,809 78.4. . . Motor vehicle accidents . . . . . . . .E810–E825 630 27.3. . . All other accidents and adverse
effects . . . . . . . . . .E800–E807,E826–E949 1,179 51.16 Diabetes mellitus . . . . . . . . . . . . . . . . . . 250 1,267 54.97 Chronic liver disease and cirrhosis . . . . . . . 571 1,129 49.08 Chronic obstructive pulmonary diseases
and allied conditions. . . . . . . . . . . . .490–496 787 34.19 Homicide and legal intervention. . . . .E960–E978 770 33.410 Pneumonia and influenza . . . . . . . . . .480–487 758 32.9. . . All other causes . . . . . . . . . . . . . . . .Residual 6,205 269.1
Black male, 65 years and over
. . . All causes . . . . . . . . . . . . . . . . . . . . . . . . . 69,370 6,697.71 Diseases of heart . . . . . . .390–398,402,404–429 22,823 2,203.62 Malignant neoplasms, including neoplasms of
lymphatic and hematopoietic tissues . . .140–208 20,026 1,933.53 Cerebrovascular diseases . . . . . . . . . .430–438 5,025 485.24 Chronic obstructive pulmonary diseases
and allied conditions. . . . . . . . . . . . .490–496 2,739 264.55 Pneumonia and influenza . . . . . . . . . .480–487 2,533 244.66 Diabetes mellitus . . . . . . . . . . . . . . . . . . 250 2,186 211.17 Accidents and adverse effects. . . . . .E800–E949 1,309 126.4. . . Motor vehicle accidents . . . . . . . .E810–E825 390 37.7. . . All other accidents and adverse
effects . . . . . . . . . .E800–E807,E826–E949 919 88.78 Nephritis, nephrotic syndrome, and
nephrosis . . . . . . . . . . . . . . . . . . .580–589 1,106 106.89 Septicemia . . . . . . . . . . . . . . . . . . . . . . 038 990 95.610 Hypertension with or without renal
disease . . . . . . . . . . . . . . . . . . . . .401,403 677 65.4. . . All other causes . . . . . . . . . . . . . . . .Residual 9,956 961.3
Black female, all ages3
. . . All causes . . . . . . . . . . . . . . . . . . . . . . . . . 129,360 752.91 Diseases of heart . . . . . . .390–398,402,404–429 39,611 230.62 Malignant neoplasms, including neoplasms of
lymphatic and hematopoietic tissues . . .140–208 27,078 157.63 Cerebrovascular diseases . . . . . . . . . .430–438 10,196 59.34 Diabetes mellitus . . . . . . . . . . . . . . . . . . 250 6,015 35.05 Accidents and adverse effects. . . . . .E800–E949 3,935 22.9. . . Motor vehicle accidents . . . . . . . .E810–E825 1,638 9.5. . . All other accidents and adverse
effects . . . . . . . . . .E800–E807,E826–E949 2,297 13.46 Human immunodeficiency virus
infection . . . . . . . . . . . . . . . . . . .*042–*044 3,834 22.37 Pneumonia and influenza . . . . . . . . . .480–487 3,573 20.88 Chronic obstructive pulmonary diseases
and allied conditions. . . . . . . . . . . . .490–496 2,654 15.49 Certain conditions originating in the
perinatal period . . . . . . . . . . . . . . . .760–779 2,427 14.110 Nephritis, nephrotic syndrome, and
nephrosis . . . . . . . . . . . . . . . . . . .580–589 2,186 12.7. . . All other causes . . . . . . . . . . . . . . . .Residual 27,851 162.1
See footnotes at end of table.
Rank1
Cause of death, race, sex, and age(Based on the Ninth Revision, International
Classification of Diseases, 1975) Number Rate
Black female, 1–4 years
. . . All causes . . . . . . . . . . . . . . . . . . . . . . . . . 864 70.11 Accidents and adverse effects. . . . . .E800–E949 267 21.7. . . Motor vehicle accidents . . . . . . . .E810–E825 92 7.5. . . All other accidents and adverse
effects . . . . . . . . . .E800–E807,E826–E949 175 14.22 Congenital anomalies . . . . . . . . . . . . .740–759 84 6.83 Homicide and legal intervention. . . . .E960–E978 79 6.44 Human immunodeficiency virus
infection . . . . . . . . . . . . . . . . . . .*042–*044 60 4.95 Diseases of heart . . . . . . .390–398,402,404–429 54 4.46 Malignant neoplasms, including neoplasms of
lymphatic and hematopoietic tissues . . .140–208 42 3.47 Certain conditions originating in the
perinatal period . . . . . . . . . . . . . . . .760–779 22 1.87 Pneumonia and influenza . . . . . . . . . .480–487 22 1.89 Anemias . . . . . . . . . . . . . . . . . . . . .280–285 17 *10 Septicemia . . . . . . . . . . . . . . . . . . . . . . 038 15 *. . . All other causes . . . . . . . . . . . . . . . .Residual 202 16.4
Black female, 5–14 years
. . . All causes . . . . . . . . . . . . . . . . . . . . . . . . . 776 27.11 Accidents and adverse effects. . . . . .E800–E949 271 9.5. . . Motor vehicle accidents . . . . . . . .E810–E825 145 5.1. . . All other accidents and adverse
effects . . . . . . . . . .E800–E807,E826–E949 126 4.42 Homicide and legal intervention. . . . .E960–E978 87 3.03 Malignant neoplasms, including neoplasms of
lymphatic and hematopoietic tissues . . .140–208 72 2.54 Human immunodeficiency virus
infection . . . . . . . . . . . . . . . . . . .*042–*044 51 1.85 Congenital anomalies . . . . . . . . . . . . .740–759 39 1.46 Diseases of heart . . . . . . .390–398,402,404–429 33 1.27 Chronic obstructive pulmonary diseases
and allied conditions. . . . . . . . . . . . .490–496 22 0.88 Anemias . . . . . . . . . . . . . . . . . . . . .280–285 11 *8 Benign neoplasms, carcinoma in situ,
and neoplasms of uncertain behaviorand of unspecified nature. . . . . . . . . .210–239 11 *
10 Suicide . . . . . . . . . . . . . . . . . . . .E950–E959 8 *. . . All other causes . . . . . . . . . . . . . . . .Residual 171 6.0
Black female, 15–24 years
. . . All causes . . . . . . . . . . . . . . . . . . . . . . . . . 1,950 72.11 Homicide and legal intervention. . . . .E960–E978 506 18.72 Accidents and adverse effects. . . . . .E800–E949 405 15.0. . . Motor vehicle accidents . . . . . . . .E810–E825 317 11.7. . . All other accidents and adverse
effects . . . . . . . . . .E800–E807,E826–E949 88 3.33 Human immunodeficiency virus
infection . . . . . . . . . . . . . . . . . . .*042–*044 155 5.74 Diseases of heart . . . . . . .390–398,402,404–429 126 4.75 Malignant neoplasms, including neoplasms of
lymphatic and hematopoietic tissues . . .140–208 114 4.26 Suicide . . . . . . . . . . . . . . . . . . . .E950–E959 73 2.77 Complications of pregnancy, childbirth,
and the puerperium . . . . . . . . . . . . .630–676 50 1.88 Congenital anomalies . . . . . . . . . . . . .740–759 38 1.48 Anemias . . . . . . . . . . . . . . . . . . . . .280–285 38 1.410 Chronic obstructive pulmonary diseases
and allied conditions. . . . . . . . . . . . .490–496 33 1.2. . . All other causes . . . . . . . . . . . . . . . .Residual 412 15.2
Table 7. Number of deaths and death rates for the 10 leading causes of death in specified age groups, by race and sex: United States,1994—Con.[Rates per 100,000 population in specified group. For explanation of asterisks preceding cause-of-death categories, see ‘‘Technical notes’’]
32 Monthly Vital Statistics Report + Vol. 45, No. 3(S) + September 30, 1996
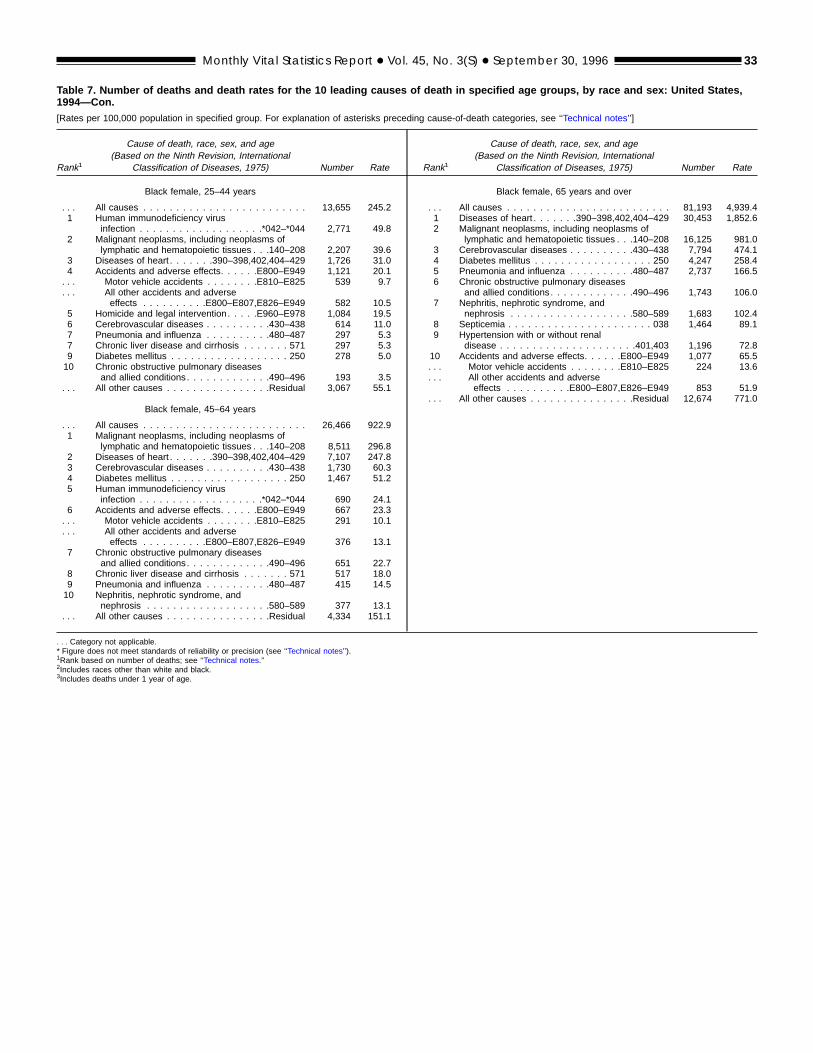
Rank1
Cause of death, race, sex, and age(Based on the Ninth Revision, International
Classification of Diseases, 1975) Number Rate
Black female, 25–44 years
. . . All causes . . . . . . . . . . . . . . . . . . . . . . . . . 13,655 245.21 Human immunodeficiency virus
infection . . . . . . . . . . . . . . . . . . .*042–*044 2,771 49.82 Malignant neoplasms, including neoplasms of
lymphatic and hematopoietic tissues . . .140–208 2,207 39.63 Diseases of heart . . . . . . .390–398,402,404–429 1,726 31.04 Accidents and adverse effects. . . . . .E800–E949 1,121 20.1. . . Motor vehicle accidents . . . . . . . .E810–E825 539 9.7. . . All other accidents and adverse
effects . . . . . . . . . .E800–E807,E826–E949 582 10.55 Homicide and legal intervention. . . . .E960–E978 1,084 19.56 Cerebrovascular diseases . . . . . . . . . .430–438 614 11.07 Pneumonia and influenza . . . . . . . . . .480–487 297 5.37 Chronic liver disease and cirrhosis . . . . . . . 571 297 5.39 Diabetes mellitus . . . . . . . . . . . . . . . . . . 250 278 5.010 Chronic obstructive pulmonary diseases
and allied conditions. . . . . . . . . . . . .490–496 193 3.5. . . All other causes . . . . . . . . . . . . . . . .Residual 3,067 55.1
Black female, 45–64 years
. . . All causes . . . . . . . . . . . . . . . . . . . . . . . . . 26,466 922.91 Malignant neoplasms, including neoplasms of
lymphatic and hematopoietic tissues . . .140–208 8,511 296.82 Diseases of heart . . . . . . .390–398,402,404–429 7,107 247.83 Cerebrovascular diseases . . . . . . . . . .430–438 1,730 60.34 Diabetes mellitus . . . . . . . . . . . . . . . . . . 250 1,467 51.25 Human immunodeficiency virus
infection . . . . . . . . . . . . . . . . . . .*042–*044 690 24.16 Accidents and adverse effects. . . . . .E800–E949 667 23.3. . . Motor vehicle accidents . . . . . . . .E810–E825 291 10.1. . . All other accidents and adverse
effects . . . . . . . . . .E800–E807,E826–E949 376 13.17 Chronic obstructive pulmonary diseases
and allied conditions. . . . . . . . . . . . .490–496 651 22.78 Chronic liver disease and cirrhosis . . . . . . . 571 517 18.09 Pneumonia and influenza . . . . . . . . . .480–487 415 14.510 Nephritis, nephrotic syndrome, and
nephrosis . . . . . . . . . . . . . . . . . . .580–589 377 13.1. . . All other causes . . . . . . . . . . . . . . . .Residual 4,334 151.1
Rank1
Cause of death, race, sex, and age(Based on the Ninth Revision, International
Classification of Diseases, 1975) Number Rate
Black female, 65 years and over
. . . All causes . . . . . . . . . . . . . . . . . . . . . . . . . 81,193 4,939.41 Diseases of heart . . . . . . .390–398,402,404–429 30,453 1,852.62 Malignant neoplasms, including neoplasms of
lymphatic and hematopoietic tissues . . .140–208 16,125 981.03 Cerebrovascular diseases . . . . . . . . . .430–438 7,794 474.14 Diabetes mellitus . . . . . . . . . . . . . . . . . . 250 4,247 258.45 Pneumonia and influenza . . . . . . . . . .480–487 2,737 166.56 Chronic obstructive pulmonary diseases
and allied conditions. . . . . . . . . . . . .490–496 1,743 106.07 Nephritis, nephrotic syndrome, and
nephrosis . . . . . . . . . . . . . . . . . . .580–589 1,683 102.48 Septicemia . . . . . . . . . . . . . . . . . . . . . . 038 1,464 89.19 Hypertension with or without renal
disease . . . . . . . . . . . . . . . . . . . . .401,403 1,196 72.810 Accidents and adverse effects. . . . . .E800–E949 1,077 65.5. . . Motor vehicle accidents . . . . . . . .E810–E825 224 13.6. . . All other accidents and adverse
effects . . . . . . . . . .E800–E807,E826–E949 853 51.9. . . All other causes . . . . . . . . . . . . . . . .Residual 12,674 771.0
Table 7. Number of deaths and death rates for the 10 leading causes of death in specified age groups, by race and sex: United States,1994—Con.[Rates per 100,000 population in specified group. For explanation of asterisks preceding cause-of-death categories, see ‘‘Technical notes’’]
Monthly Vital Statistics Report + Vol. 45, No. 3(S) + September 30, 1996 33
. . . Category not applicable.* Figure does not meet standards of reliability or precision (see ‘‘Technical notes’’).1Rank based on number of deaths; see ‘‘Technical notes.’’2Includes races other than white and black.3Includes deaths under 1 year of age.
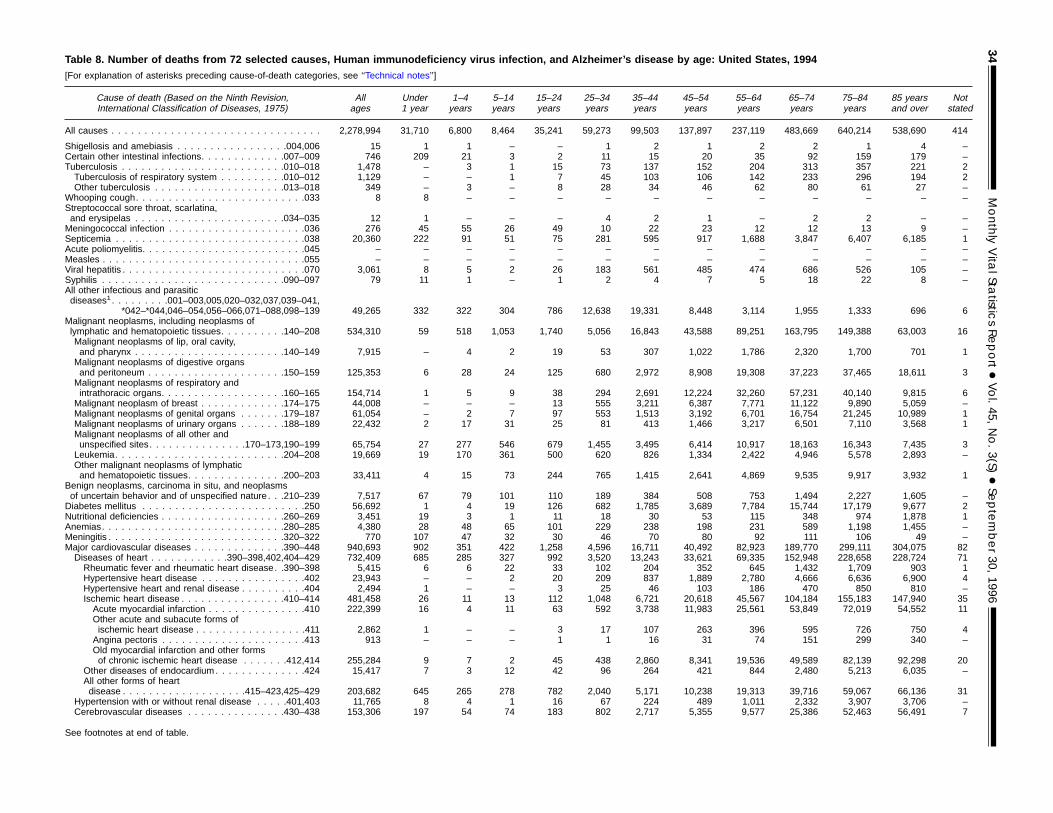
Table 8. Number of deaths from 72 selected causes, Human immunodeficiency virus infection, and Alzheimer’s disease by age: United States, 1994[For explanation of asterisks preceding cause-of-death categories, see ‘‘Technical notes’’]
Cause of death (Based on the Ninth Revision,International Classification of Diseases, 1975)
Allages
Under1 year
1–4years
5–14years
15–24years
25–34years
35–44years
45–54years
55–64years
65–74years
75–84years
85 yearsand over
Notstated
All causes . . . . . . . . . . . . . . . . . . . . . . . . . . . . . . . . 2,278,994 31,710 6,800 8,464 35,241 59,273 99,503 137,897 237,119 483,669 640,214 538,690 414
Shigellosis and amebiasis . . . . . . . . . . . . . . . . .004,006 15 1 1 – – 1 2 1 2 2 1 4 –Certain other intestinal infections. . . . . . . . . . . . .007–009 746 209 21 3 2 11 15 20 35 92 159 179 –Tuberculosis . . . . . . . . . . . . . . . . . . . . . . . . .010–018 1,478 – 3 1 15 73 137 152 204 313 357 221 2Tuberculosis of respiratory system . . . . . . . . . .010–012 1,129 – – 1 7 45 103 106 142 233 296 194 2Other tuberculosis . . . . . . . . . . . . . . . . . . . .013–018 349 – 3 – 8 28 34 46 62 80 61 27 –
Whooping cough. . . . . . . . . . . . . . . . . . . . . . . . . .033 8 8 – – – – – – – – – – –Streptococcal sore throat, scarlatina,and erysipelas . . . . . . . . . . . . . . . . . . . . . . .034–035 12 1 – – – 4 2 1 – 2 2 – –Meningococcal infection . . . . . . . . . . . . . . . . . . . . .036 276 45 55 26 49 10 22 23 12 12 13 9 –Septicemia . . . . . . . . . . . . . . . . . . . . . . . . . . . . .038 20,360 222 91 51 75 281 595 917 1,688 3,847 6,407 6,185 1Acute poliomyelitis. . . . . . . . . . . . . . . . . . . . . . . . .045 – – – – – – – – – – – – –Measles . . . . . . . . . . . . . . . . . . . . . . . . . . . . . . .055 – – – – – – – – – – – – –Viral hepatitis . . . . . . . . . . . . . . . . . . . . . . . . . . . .070 3,061 8 5 2 26 183 561 485 474 686 526 105 –Syphilis . . . . . . . . . . . . . . . . . . . . . . . . . . . .090–097 79 11 1 – 1 2 4 7 5 18 22 8 –All other infectious and parasiticdiseases1. . . . . . . . .001–003,005,020–032,037,039–041,
*042–*044,046–054,056–066,071–088,098–139 49,265 332 322 304 786 12,638 19,331 8,448 3,114 1,955 1,333 696 6Malignant neoplasms, including neoplasms oflymphatic and hematopoietic tissues. . . . . . . . . .140–208 534,310 59 518 1,053 1,740 5,056 16,843 43,588 89,251 163,795 149,388 63,003 16Malignant neoplasms of lip, oral cavity,and pharynx . . . . . . . . . . . . . . . . . . . . . . .140–149 7,915 – 4 2 19 53 307 1,022 1,786 2,320 1,700 701 1Malignant neoplasms of digestive organsand peritoneum . . . . . . . . . . . . . . . . . . . . .150–159 125,353 6 28 24 125 680 2,972 8,908 19,308 37,223 37,465 18,611 3Malignant neoplasms of respiratory andintrathoracic organs. . . . . . . . . . . . . . . . . . .160–165 154,714 1 5 9 38 294 2,691 12,224 32,260 57,231 40,140 9,815 6Malignant neoplasm of breast . . . . . . . . . . . . .174–175 44,008 – – – 13 555 3,211 6,387 7,771 11,122 9,890 5,059 –Malignant neoplasms of genital organs . . . . . . .179–187 61,054 – 2 7 97 553 1,513 3,192 6,701 16,754 21,245 10,989 1Malignant neoplasms of urinary organs . . . . . . .188–189 22,432 2 17 31 25 81 413 1,466 3,217 6,501 7,110 3,568 1Malignant neoplasms of all other andunspecified sites. . . . . . . . . . . . . . .170–173,190–199 65,754 27 277 546 679 1,455 3,495 6,414 10,917 18,163 16,343 7,435 3Leukemia. . . . . . . . . . . . . . . . . . . . . . . . . .204–208 19,669 19 170 361 500 620 826 1,334 2,422 4,946 5,578 2,893 –Other malignant neoplasms of lymphaticand hematopoietic tissues. . . . . . . . . . . . . . .200–203 33,411 4 15 73 244 765 1,415 2,641 4,869 9,535 9,917 3,932 1
Benign neoplasms, carcinoma in situ, and neoplasmsof uncertain behavior and of unspecified nature . . .210–239 7,517 67 79 101 110 189 384 508 753 1,494 2,227 1,605 –Diabetes mellitus . . . . . . . . . . . . . . . . . . . . . . . . .250 56,692 1 4 19 126 682 1,785 3,689 7,784 15,744 17,179 9,677 2Nutritional deficiencies . . . . . . . . . . . . . . . . . . .260–269 3,451 19 3 1 11 18 30 53 115 348 974 1,878 1Anemias. . . . . . . . . . . . . . . . . . . . . . . . . . . .280–285 4,380 28 48 65 101 229 238 198 231 589 1,198 1,455 –Meningitis . . . . . . . . . . . . . . . . . . . . . . . . . . .320–322 770 107 47 32 30 46 70 80 92 111 106 49 –Major cardiovascular diseases . . . . . . . . . . . . . .390–448 940,693 902 351 422 1,258 4,596 16,711 40,492 82,923 189,770 299,111 304,075 82Diseases of heart . . . . . . . . . . . .390–398,402,404–429 732,409 685 285 327 992 3,520 13,243 33,621 69,335 152,948 228,658 228,724 71Rheumatic fever and rheumatic heart disease. .390–398 5,415 6 6 22 33 102 204 352 645 1,432 1,709 903 1Hypertensive heart disease . . . . . . . . . . . . . . . .402 23,943 – – 2 20 209 837 1,889 2,780 4,666 6,636 6,900 4Hypertensive heart and renal disease . . . . . . . . . .404 2,494 1 – – 3 25 46 103 186 470 850 810 –Ischemic heart disease . . . . . . . . . . . . . . . .410–414 481,458 26 11 13 112 1,048 6,721 20,618 45,567 104,184 155,183 147,940 35Acute myocardial infarction . . . . . . . . . . . . . . .410 222,399 16 4 11 63 592 3,738 11,983 25,561 53,849 72,019 54,552 11Other acute and subacute forms ofischemic heart disease . . . . . . . . . . . . . . . . .411 2,862 1 – – 3 17 107 263 396 595 726 750 4Angina pectoris . . . . . . . . . . . . . . . . . . . . . .413 913 – – – 1 1 16 31 74 151 299 340 –Old myocardial infarction and other formsof chronic ischemic heart disease . . . . . . .412,414 255,284 9 7 2 45 438 2,860 8,341 19,536 49,589 82,139 92,298 20
Other diseases of endocardium . . . . . . . . . . . . . .424 15,417 7 3 12 42 96 264 421 844 2,480 5,213 6,035 –All other forms of heartdisease . . . . . . . . . . . . . . . . . . .415–423,425–429 203,682 645 265 278 782 2,040 5,171 10,238 19,313 39,716 59,067 66,136 31
Hypertension with or without renal disease . . . . .401,403 11,765 8 4 1 16 67 224 489 1,011 2,332 3,907 3,706 –Cerebrovascular diseases . . . . . . . . . . . . . . .430–438 153,306 197 54 74 183 802 2,717 5,355 9,577 25,386 52,463 56,491 7
See footnotes at end of table.
34MonthlyVita
lStatistic
sReport+Vol.45,
No.3(S)
+September30,
1996
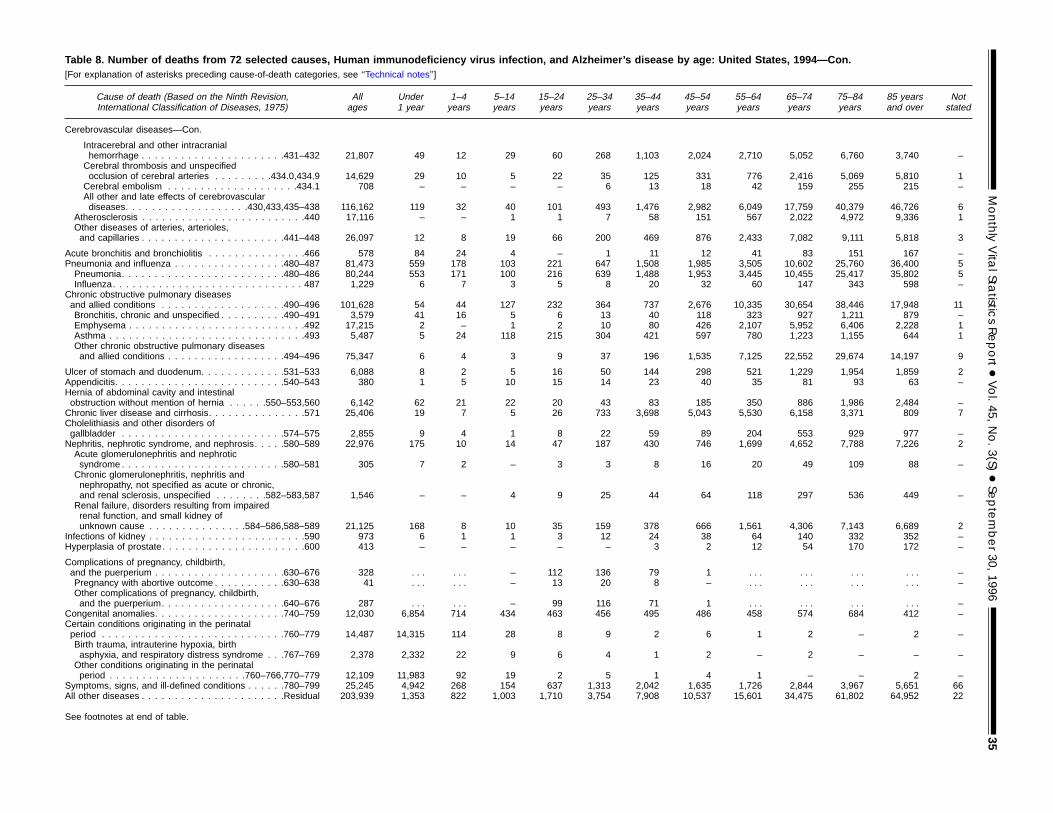
Table 8. Number of deaths from 72 selected causes, Human immunodeficiency virus infection, and Alzheimer’s disease by age: United States, 1994—Con.[For explanation of asterisks preceding cause-of-death categories, see ‘‘Technical notes’’]
Cause of death (Based on the Ninth Revision,International Classification of Diseases, 1975)
Allages
Under1 year
1–4years
5–14years
15–24years
25–34years
35–44years
45–54years
55–64years
65–74years
75–84years
85 yearsand over
Notstated
Cerebrovascular diseases—Con.
Intracerebral and other intracranialhemorrhage . . . . . . . . . . . . . . . . . . . . . .431–432 21,807 49 12 29 60 268 1,103 2,024 2,710 5,052 6,760 3,740 –Cerebral thrombosis and unspecifiedocclusion of cerebral arteries . . . . . . . . .434.0,434.9 14,629 29 10 5 22 35 125 331 776 2,416 5,069 5,810 1Cerebral embolism . . . . . . . . . . . . . . . . . . . .434.1 708 – – – – 6 13 18 42 159 255 215 –All other and late effects of cerebrovasculardiseases. . . . . . . . . . . . . . . . . . .430,433,435–438 116,162 119 32 40 101 493 1,476 2,982 6,049 17,759 40,379 46,726 6
Atherosclerosis . . . . . . . . . . . . . . . . . . . . . . . . .440 17,116 – – 1 1 7 58 151 567 2,022 4,972 9,336 1Other diseases of arteries, arterioles,and capillaries . . . . . . . . . . . . . . . . . . . . . .441–448 26,097 12 8 19 66 200 469 876 2,433 7,082 9,111 5,818 3
Acute bronchitis and bronchiolitis . . . . . . . . . . . . . . .466 578 84 24 4 – 1 11 12 41 83 151 167 –Pneumonia and influenza . . . . . . . . . . . . . . . . .480–487 81,473 559 178 103 221 647 1,508 1,985 3,505 10,602 25,760 36,400 5Pneumonia. . . . . . . . . . . . . . . . . . . . . . . . .480–486 80,244 553 171 100 216 639 1,488 1,953 3,445 10,455 25,417 35,802 5Influenza. . . . . . . . . . . . . . . . . . . . . . . . . . . . . 487 1,229 6 7 3 5 8 20 32 60 147 343 598 –
Chronic obstructive pulmonary diseasesand allied conditions . . . . . . . . . . . . . . . . . . .490–496 101,628 54 44 127 232 364 737 2,676 10,335 30,654 38,446 17,948 11Bronchitis, chronic and unspecified . . . . . . . . . .490–491 3,579 41 16 5 6 13 40 118 323 927 1,211 879 –Emphysema . . . . . . . . . . . . . . . . . . . . . . . . . . .492 17,215 2 – 1 2 10 80 426 2,107 5,952 6,406 2,228 1Asthma . . . . . . . . . . . . . . . . . . . . . . . . . . . . . .493 5,487 5 24 118 215 304 421 597 780 1,223 1,155 644 1Other chronic obstructive pulmonary diseasesand allied conditions . . . . . . . . . . . . . . . . . .494–496 75,347 6 4 3 9 37 196 1,535 7,125 22,552 29,674 14,197 9
Ulcer of stomach and duodenum. . . . . . . . . . . . .531–533 6,088 8 2 5 16 50 144 298 521 1,229 1,954 1,859 2Appendicitis. . . . . . . . . . . . . . . . . . . . . . . . . .540–543 380 1 5 10 15 14 23 40 35 81 93 63 –Hernia of abdominal cavity and intestinalobstruction without mention of hernia . . . . . .550–553,560 6,142 62 21 22 20 43 83 185 350 886 1,986 2,484 –Chronic liver disease and cirrhosis. . . . . . . . . . . . . . .571 25,406 19 7 5 26 733 3,698 5,043 5,530 6,158 3,371 809 7Cholelithiasis and other disorders ofgallbladder . . . . . . . . . . . . . . . . . . . . . . . . .574–575 2,855 9 4 1 8 22 59 89 204 553 929 977 –Nephritis, nephrotic syndrome, and nephrosis. . . . .580–589 22,976 175 10 14 47 187 430 746 1,699 4,652 7,788 7,226 2Acute glomerulonephritis and nephroticsyndrome . . . . . . . . . . . . . . . . . . . . . . . . .580–581 305 7 2 – 3 3 8 16 20 49 109 88 –Chronic glomerulonephritis, nephritis andnephropathy, not specified as acute or chronic,and renal sclerosis, unspecified . . . . . . . .582–583,587 1,546 – – 4 9 25 44 64 118 297 536 449 –Renal failure, disorders resulting from impairedrenal function, and small kidney ofunknown cause . . . . . . . . . . . . . . .584–586,588–589 21,125 168 8 10 35 159 378 666 1,561 4,306 7,143 6,689 2
Infections of kidney . . . . . . . . . . . . . . . . . . . . . . . .590 973 6 1 1 3 12 24 38 64 140 332 352 –Hyperplasia of prostate. . . . . . . . . . . . . . . . . . . . . .600 413 – – – – – 3 2 12 54 170 172 –
Complications of pregnancy, childbirth,and the puerperium . . . . . . . . . . . . . . . . . . . .630–676 328 . . . . . . – 112 136 79 1 . . . . . . . . . . . . –Pregnancy with abortive outcome . . . . . . . . . . .630–638 41 . . . . . . – 13 20 8 – . . . . . . . . . . . . –Other complications of pregnancy, childbirth,and the puerperium. . . . . . . . . . . . . . . . . . .640–676 287 . . . . . . – 99 116 71 1 . . . . . . . . . . . . –
Congenital anomalies. . . . . . . . . . . . . . . . . . . .740–759 12,030 6,854 714 434 463 456 495 486 458 574 684 412 –Certain conditions originating in the perinatalperiod . . . . . . . . . . . . . . . . . . . . . . . . . . . .760–779 14,487 14,315 114 28 8 9 2 6 1 2 – 2 –Birth trauma, intrauterine hypoxia, birthasphyxia, and respiratory distress syndrome . . .767–769 2,378 2,332 22 9 6 4 1 2 – 2 – – –Other conditions originating in the perinatalperiod . . . . . . . . . . . . . . . . . . . . .760–766,770–779 12,109 11,983 92 19 2 5 1 4 1 – – 2 –
Symptoms, signs, and ill-defined conditions . . . . . .780–799 25,245 4,942 268 154 637 1,313 2,042 1,635 1,726 2,844 3,967 5,651 66All other diseases . . . . . . . . . . . . . . . . . . . . . .Residual 203,939 1,353 822 1,003 1,710 3,754 7,908 10,537 15,601 34,475 61,802 64,952 22
See footnotes at end of table.
MonthlyVita
lStatistic
sReport+Vol.45,
No.3(S)
+September30,
199635
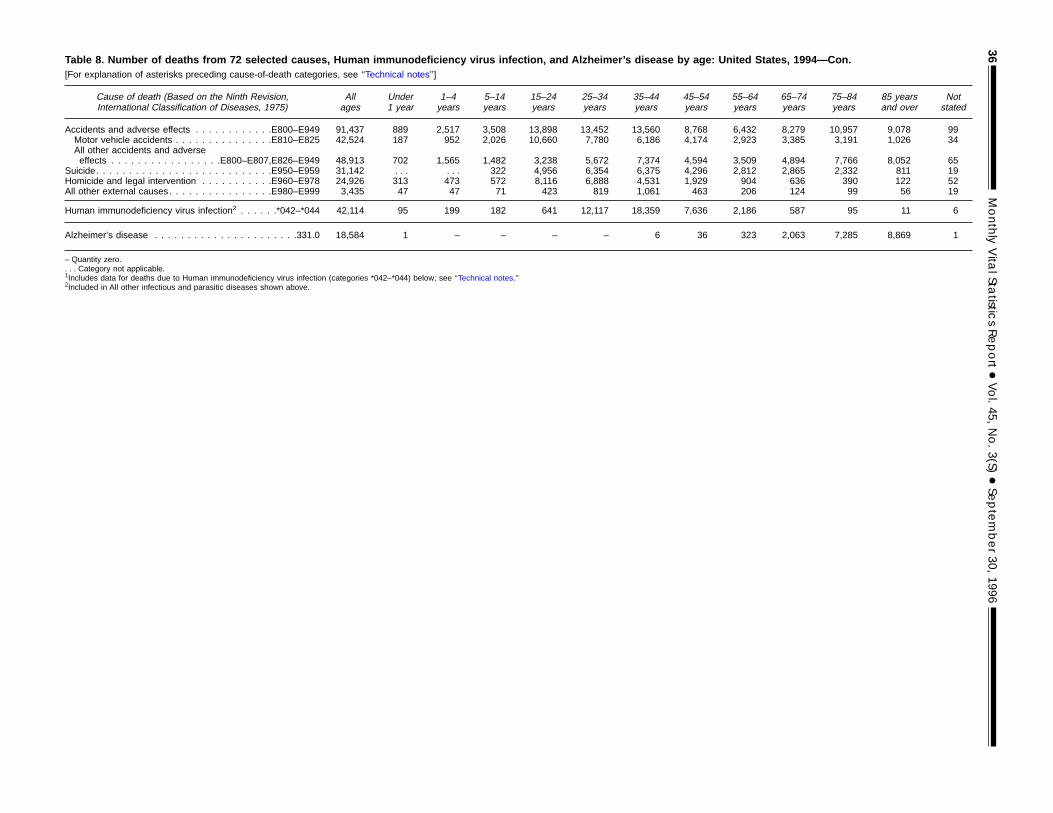
Table 8. Number of deaths from 72 selected causes, Human immunodeficiency virus infection, and Alzheimer’s disease by age: United States, 1994—Con.[For explanation of asterisks preceding cause-of-death categories, see ‘‘Technical notes’’]
Cause of death (Based on the Ninth Revision,International Classification of Diseases, 1975)
Allages
Under1 year
1–4years
5–14years
15–24years
25–34years
35–44years
45–54years
55–64years
65–74years
75–84years
85 yearsand over
Notstated
Accidents and adverse effects . . . . . . . . . . . .E800–E949 91,437 889 2,517 3,508 13,898 13,452 13,560 8,768 6,432 8,279 10,957 9,078 99Motor vehicle accidents . . . . . . . . . . . . . . .E810–E825 42,524 187 952 2,026 10,660 7,780 6,186 4,174 2,923 3,385 3,191 1,026 34All other accidents and adverseeffects . . . . . . . . . . . . . . . . .E800–E807,E826–E949 48,913 702 1,565 1,482 3,238 5,672 7,374 4,594 3,509 4,894 7,766 8,052 65
Suicide. . . . . . . . . . . . . . . . . . . . . . . . . . .E950–E959 31,142 . . . . . . 322 4,956 6,354 6,375 4,296 2,812 2,865 2,332 811 19Homicide and legal intervention . . . . . . . . . . .E960–E978 24,926 313 473 572 8,116 6,888 4,531 1,929 904 636 390 122 52All other external causes. . . . . . . . . . . . . . . .E980–E999 3,435 47 47 71 423 819 1,061 463 206 124 99 56 19
Human immunodeficiency virus infection2 . . . . . .*042–*044 42,114 95 199 182 641 12,117 18,359 7,636 2,186 587 95 11 6
Alzheimer’s disease . . . . . . . . . . . . . . . . . . . . . .331.0 18,584 1 – – – – 6 36 323 2,063 7,285 8,869 1
– Quantity zero.. . . Category not applicable.1Includes data for deaths due to Human immunodeficiency virus infection (categories *042–*044) below; see ‘‘Technical notes.’’2Included in All other infectious and parasitic diseases shown above.
36MonthlyVita
lStatistic
sReport+Vol.45,
No.3(S)
+September30,
1996
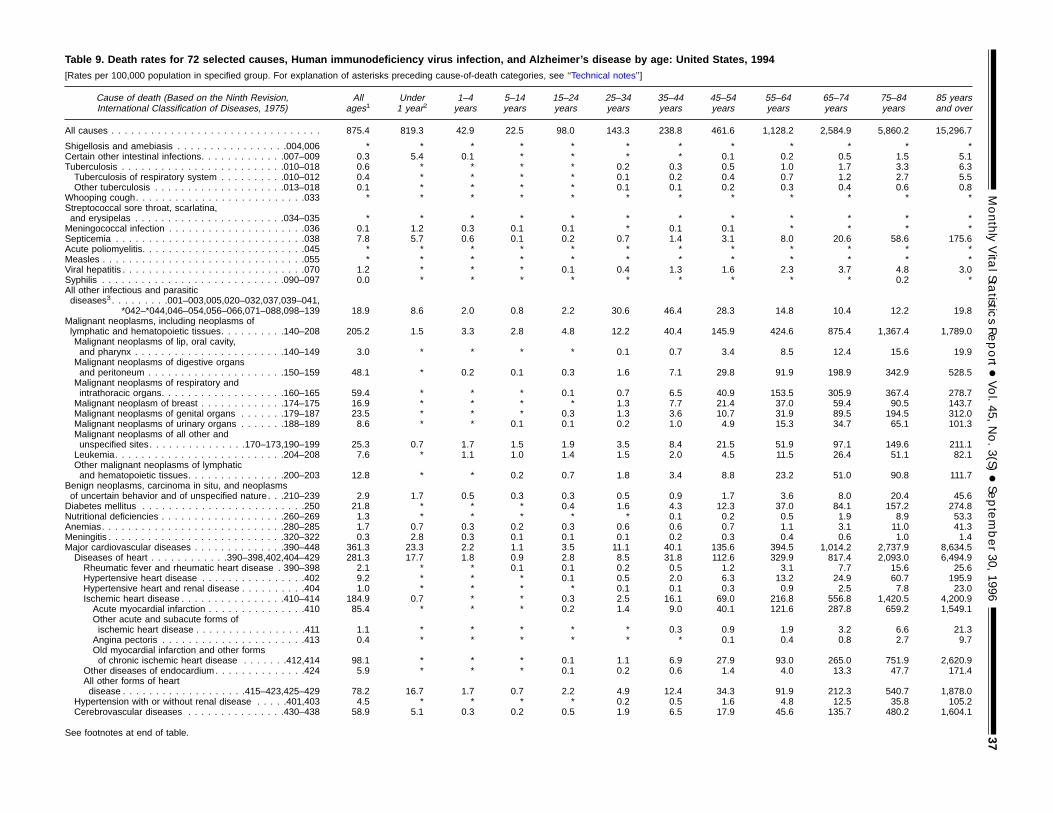
Table 9. Death rates for 72 selected causes, Human immunodeficiency virus infection, and Alzheimer’s disease by age: United States, 1994[Rates per 100,000 population in specified group. For explanation of asterisks preceding cause-of-death categories, see ‘‘Technical notes’’]
Cause of death (Based on the Ninth Revision,International Classification of Diseases, 1975)
Allages1
Under1 year2
1–4years
5–14years
15–24years
25–34years
35–44years
45–54years
55–64years
65–74years
75–84years
85 yearsand over
All causes . . . . . . . . . . . . . . . . . . . . . . . . . . . . . . . . 875.4 819.3 42.9 22.5 98.0 143.3 238.8 461.6 1,128.2 2,584.9 5,860.2 15,296.7
Shigellosis and amebiasis . . . . . . . . . . . . . . . . .004,006 * * * * * * * * * * * *Certain other intestinal infections. . . . . . . . . . . . .007–009 0.3 5.4 0.1 * * * * 0.1 0.2 0.5 1.5 5.1Tuberculosis . . . . . . . . . . . . . . . . . . . . . . . . .010–018 0.6 * * * * 0.2 0.3 0.5 1.0 1.7 3.3 6.3Tuberculosis of respiratory system . . . . . . . . . .010–012 0.4 * * * * 0.1 0.2 0.4 0.7 1.2 2.7 5.5Other tuberculosis . . . . . . . . . . . . . . . . . . . .013–018 0.1 * * * * 0.1 0.1 0.2 0.3 0.4 0.6 0.8
Whooping cough. . . . . . . . . . . . . . . . . . . . . . . . . .033 * * * * * * * * * * * *Streptococcal sore throat, scarlatina,and erysipelas . . . . . . . . . . . . . . . . . . . . . . .034–035 * * * * * * * * * * * *Meningococcal infection . . . . . . . . . . . . . . . . . . . . .036 0.1 1.2 0.3 0.1 0.1 * 0.1 0.1 * * * *Septicemia . . . . . . . . . . . . . . . . . . . . . . . . . . . . .038 7.8 5.7 0.6 0.1 0.2 0.7 1.4 3.1 8.0 20.6 58.6 175.6Acute poliomyelitis. . . . . . . . . . . . . . . . . . . . . . . . .045 * * * * * * * * * * * *Measles . . . . . . . . . . . . . . . . . . . . . . . . . . . . . . .055 * * * * * * * * * * * *Viral hepatitis . . . . . . . . . . . . . . . . . . . . . . . . . . . .070 1.2 * * * 0.1 0.4 1.3 1.6 2.3 3.7 4.8 3.0Syphilis . . . . . . . . . . . . . . . . . . . . . . . . . . . .090–097 0.0 * * * * * * * * * 0.2 *All other infectious and parasiticdiseases3. . . . . . . . .001–003,005,020–032,037,039–041,
*042–*044,046–054,056–066,071–088,098–139 18.9 8.6 2.0 0.8 2.2 30.6 46.4 28.3 14.8 10.4 12.2 19.8Malignant neoplasms, including neoplasms oflymphatic and hematopoietic tissues. . . . . . . . . .140–208 205.2 1.5 3.3 2.8 4.8 12.2 40.4 145.9 424.6 875.4 1,367.4 1,789.0Malignant neoplasms of lip, oral cavity,and pharynx . . . . . . . . . . . . . . . . . . . . . . .140–149 3.0 * * * * 0.1 0.7 3.4 8.5 12.4 15.6 19.9Malignant neoplasms of digestive organsand peritoneum . . . . . . . . . . . . . . . . . . . . .150–159 48.1 * 0.2 0.1 0.3 1.6 7.1 29.8 91.9 198.9 342.9 528.5Malignant neoplasms of respiratory andintrathoracic organs. . . . . . . . . . . . . . . . . . .160–165 59.4 * * * 0.1 0.7 6.5 40.9 153.5 305.9 367.4 278.7Malignant neoplasm of breast . . . . . . . . . . . . .174–175 16.9 * * * * 1.3 7.7 21.4 37.0 59.4 90.5 143.7Malignant neoplasms of genital organs . . . . . . .179–187 23.5 * * * 0.3 1.3 3.6 10.7 31.9 89.5 194.5 312.0Malignant neoplasms of urinary organs . . . . . . .188–189 8.6 * * 0.1 0.1 0.2 1.0 4.9 15.3 34.7 65.1 101.3Malignant neoplasms of all other andunspecified sites. . . . . . . . . . . . . . .170–173,190–199 25.3 0.7 1.7 1.5 1.9 3.5 8.4 21.5 51.9 97.1 149.6 211.1Leukemia. . . . . . . . . . . . . . . . . . . . . . . . . .204–208 7.6 * 1.1 1.0 1.4 1.5 2.0 4.5 11.5 26.4 51.1 82.1Other malignant neoplasms of lymphaticand hematopoietic tissues. . . . . . . . . . . . . . .200–203 12.8 * * 0.2 0.7 1.8 3.4 8.8 23.2 51.0 90.8 111.7
Benign neoplasms, carcinoma in situ, and neoplasmsof uncertain behavior and of unspecified nature . . .210–239 2.9 1.7 0.5 0.3 0.3 0.5 0.9 1.7 3.6 8.0 20.4 45.6Diabetes mellitus . . . . . . . . . . . . . . . . . . . . . . . . .250 21.8 * * * 0.4 1.6 4.3 12.3 37.0 84.1 157.2 274.8Nutritional deficiencies . . . . . . . . . . . . . . . . . . .260–269 1.3 * * * * * 0.1 0.2 0.5 1.9 8.9 53.3Anemias. . . . . . . . . . . . . . . . . . . . . . . . . . . .280–285 1.7 0.7 0.3 0.2 0.3 0.6 0.6 0.7 1.1 3.1 11.0 41.3Meningitis . . . . . . . . . . . . . . . . . . . . . . . . . . .320–322 0.3 2.8 0.3 0.1 0.1 0.1 0.2 0.3 0.4 0.6 1.0 1.4Major cardiovascular diseases . . . . . . . . . . . . . .390–448 361.3 23.3 2.2 1.1 3.5 11.1 40.1 135.6 394.5 1,014.2 2,737.9 8,634.5Diseases of heart . . . . . . . . . . . .390–398,402,404–429 281.3 17.7 1.8 0.9 2.8 8.5 31.8 112.6 329.9 817.4 2,093.0 6,494.9Rheumatic fever and rheumatic heart disease . 390–398 2.1 * * 0.1 0.1 0.2 0.5 1.2 3.1 7.7 15.6 25.6Hypertensive heart disease . . . . . . . . . . . . . . . .402 9.2 * * * 0.1 0.5 2.0 6.3 13.2 24.9 60.7 195.9Hypertensive heart and renal disease . . . . . . . . . .404 1.0 * * * * 0.1 0.1 0.3 0.9 2.5 7.8 23.0Ischemic heart disease . . . . . . . . . . . . . . . .410–414 184.9 0.7 * * 0.3 2.5 16.1 69.0 216.8 556.8 1,420.5 4,200.9Acute myocardial infarction . . . . . . . . . . . . . . .410 85.4 * * * 0.2 1.4 9.0 40.1 121.6 287.8 659.2 1,549.1Other acute and subacute forms ofischemic heart disease . . . . . . . . . . . . . . . . .411 1.1 * * * * * 0.3 0.9 1.9 3.2 6.6 21.3Angina pectoris . . . . . . . . . . . . . . . . . . . . . .413 0.4 * * * * * * 0.1 0.4 0.8 2.7 9.7Old myocardial infarction and other formsof chronic ischemic heart disease . . . . . . .412,414 98.1 * * * 0.1 1.1 6.9 27.9 93.0 265.0 751.9 2,620.9
Other diseases of endocardium . . . . . . . . . . . . . .424 5.9 * * * 0.1 0.2 0.6 1.4 4.0 13.3 47.7 171.4All other forms of heartdisease . . . . . . . . . . . . . . . . . . .415–423,425–429 78.2 16.7 1.7 0.7 2.2 4.9 12.4 34.3 91.9 212.3 540.7 1,878.0
Hypertension with or without renal disease . . . . .401,403 4.5 * * * * 0.2 0.5 1.6 4.8 12.5 35.8 105.2Cerebrovascular diseases . . . . . . . . . . . . . . .430–438 58.9 5.1 0.3 0.2 0.5 1.9 6.5 17.9 45.6 135.7 480.2 1,604.1
See footnotes at end of table.
MonthlyVita
lStatistic
sReport+Vol.45,
No.3(S)
+September30,
199637

Table 9. Death rates for 72 selected causes, Human immunodeficiency virus infection, and Alzheimer’s disease by age: United States, 1994—Con.[Rates per 100,000 population in specified group. For explanation of asterisks preceding cause-of-death categories, see ‘‘Technical notes’’]
Cause of death (Based on the Ninth Revision,International Classification of Diseases, 1975)
Allages1
Under1 year2
1–4years
5–14years
15–24years
25–34years
35–44years
45–54years
55–64years
65–74years
75–84years
85 yearsand over
Cerebrovascular diseases—Con.
Intracerebral and other intracranialhemorrhage . . . . . . . . . . . . . . . . . . . . . .431–432 8.4 1.3 * 0.1 0.2 0.6 2.6 6.8 12.9 27.0 61.9 106.2Cerebral thrombosis and unspecifiedocclusion of cerebral arteries . . . . . . . . .434.0,434.9 5.6 0.7 * * 0.1 0.1 0.3 1.1 3.7 12.9 46.4 165.0Cerebral embolism . . . . . . . . . . . . . . . . . . . .434.1 0.3 * * * * * * * 0.2 0.8 2.3 6.1All other and late effects of cerebrovasculardiseases . . . . . . . . . . . . . . . . . .430, 433,435–438 44.6 3.1 0.2 0.1 0.3 1.2 3.5 10.0 28.8 94.9 369.6 1,326.8
Atherosclerosis . . . . . . . . . . . . . . . . . . . . . . . . .440 6.6 * * * * * 0.1 0.5 2.7 10.8 45.5 265.1Other diseases of arteries, arterioles,and capillaries . . . . . . . . . . . . . . . . . . . . . .441–448 10.0 * * * 0.2 0.5 1.1 2.9 11.6 37.8 83.4 165.2
Acute bronchitis and bronchiolitis . . . . . . . . . . . . . . .466 0.2 2.2 0.2 * * * * * 0.2 0.4 1.4 4.7Pneumonia and influenza . . . . . . . . . . . . . . . . .480–487 31.3 14.4 1.1 0.3 0.6 1.6 3.6 6.6 16.7 56.7 235.8 1,033.6Pneumonia. . . . . . . . . . . . . . . . . . . . . . . . .480–486 30.8 14.3 1.1 0.3 0.6 1.5 3.6 6.5 16.4 55.9 232.7 1,016.6Influenza . . . . . . . . . . . . . . . . . . . . . . . . . . . . .487 0.5 * * * * * 0.0 0.1 0.3 0.8 3.1 17.0
Chronic obstructive pulmonary diseasesand allied conditions . . . . . . . . . . . . . . . . . . .490–496 39.0 1.4 0.3 0.3 0.6 0.9 1.8 9.0 49.2 163.8 351.9 509.7Bronchitis, chronic and unspecified . . . . . . . . . .490–491 1.4 1.1 * * * * 0.1 0.4 1.5 5.0 11.1 25.0Emphysema . . . . . . . . . . . . . . . . . . . . . . . . . . .492 6.6 * * * * * 0.2 1.4 10.0 31.8 58.6 63.3Asthma . . . . . . . . . . . . . . . . . . . . . . . . . . . . . .493 2.1 * 0.2 0.3 0.6 0.7 1.0 2.0 3.7 6.5 10.6 18.3Other chronic obstructive pulmonary diseasesand allied conditions . . . . . . . . . . . . . . . . . .494–496 28.9 * * * * 0.1 0.5 5.1 33.9 120.5 271.6 403.1
Ulcer of stomach and duodenum. . . . . . . . . . . . .531–533 2.3 * * * * 0.1 0.3 1.0 2.5 6.6 17.9 52.8Appendicitis. . . . . . . . . . . . . . . . . . . . . . . . . .540–543 0.1 * * * * * 0.1 0.1 0.2 0.4 0.9 1.8Hernia of abdominal cavity and intestinalobstruction without mention of hernia . . . . . .550–553,560 2.4 1.6 0.1 0.1 0.1 0.1 0.2 0.6 1.7 4.7 18.2 70.5Chronic liver disease and cirrhosis. . . . . . . . . . . . . . .571 9.8 * * * 0.1 1.8 8.9 16.9 26.3 32.9 30.9 23.0Cholelithiasis and other disorders ofgallbladder . . . . . . . . . . . . . . . . . . . . . . . . .574–575 1.1 * * * * 0.1 0.1 0.3 1.0 3.0 8.5 27.7Nephritis, nephrotic syndrome, and nephrosis. . . . .580–589 8.8 4.5 * * 0.1 0.5 1.0 2.5 8.1 24.9 71.3 205.2Acute glomerulonephritis and nephroticsyndrome . . . . . . . . . . . . . . . . . . . . . . . . .580–581 0.1 * * * * * * * 0.1 0.3 1.0 2.5Chronic glomerulonephritis, nephritis andnephropathy, not specified as acute or chronic,and renal sclerosis, unspecified . . . . . . . .582–583,587 0.6 * * * * 0.1 0.1 0.2 0.6 1.6 4.9 12.7Renal failure, disorders resulting from impairedrenal function, and small kidney ofunknown cause . . . . . . . . . . . . . . .584–586,588–589 8.1 4.3 * * 0.1 0.4 0.9 2.2 7.4 23.0 65.4 189.9
Infections of kidney . . . . . . . . . . . . . . . . . . . . . . . .590 0.4 * * * * * 0.1 0.1 0.3 0.7 3.0 10.0Hyperplasia of prostate. . . . . . . . . . . . . . . . . . . . . .600 0.2 * * * * * * * * 0.3 1.6 4.9
Complications of pregnancy, childbirth,and the puerperium . . . . . . . . . . . . . . . . . . . .630–676 0.1 . . . . . . * 0.3 0.3 0.2 * . . . . . . . . . . . .Pregnancy with abortive outcome . . . . . . . . . . .630–638 0.0 . . . . . . * * 0.0 * * . . . . . . . . . . . .Other complications of pregnancy, childbirth,and the puerperium. . . . . . . . . . . . . . . . . . .640–676 0.1 . . . . . . * 0.3 0.3 0.2 * . . . . . . . . . . . .
Congenital anomalies. . . . . . . . . . . . . . . . . . . .740–759 4.6 177.1 4.5 1.2 1.3 1.1 1.2 1.6 2.2 3.1 6.3 11.7Certain conditions originating in the perinatalperiod . . . . . . . . . . . . . . . . . . . . . . . . . . . .760–779 5.6 369.9 0.7 0.1 * * * * * * * *Birth trauma, intrauterine hypoxia, birthasphyxia, and respiratory distress syndrome . . .767–769 0.9 60.3 0.1 * * * * * * * * *Other conditions originating in the perinatalperiod . . . . . . . . . . . . . . . . . . . . .760–766,770–779 4.7 309.6 0.6 * * * * * * * * *
Symptoms, signs, and ill-defined conditions . . . . . .780–799 9.7 127.7 1.7 0.4 1.8 3.2 4.9 5.5 8.2 15.2 36.3 160.5All other diseases . . . . . . . . . . . . . . . . . . . . . .Residual 78.3 35.0 5.2 2.7 4.8 9.1 19.0 35.3 74.2 184.2 565.7 1,844.4
See footnotes at end of table.
38MonthlyVita
lStatistic
sReport+Vol.45,
No.3(S)
+September30,
1996
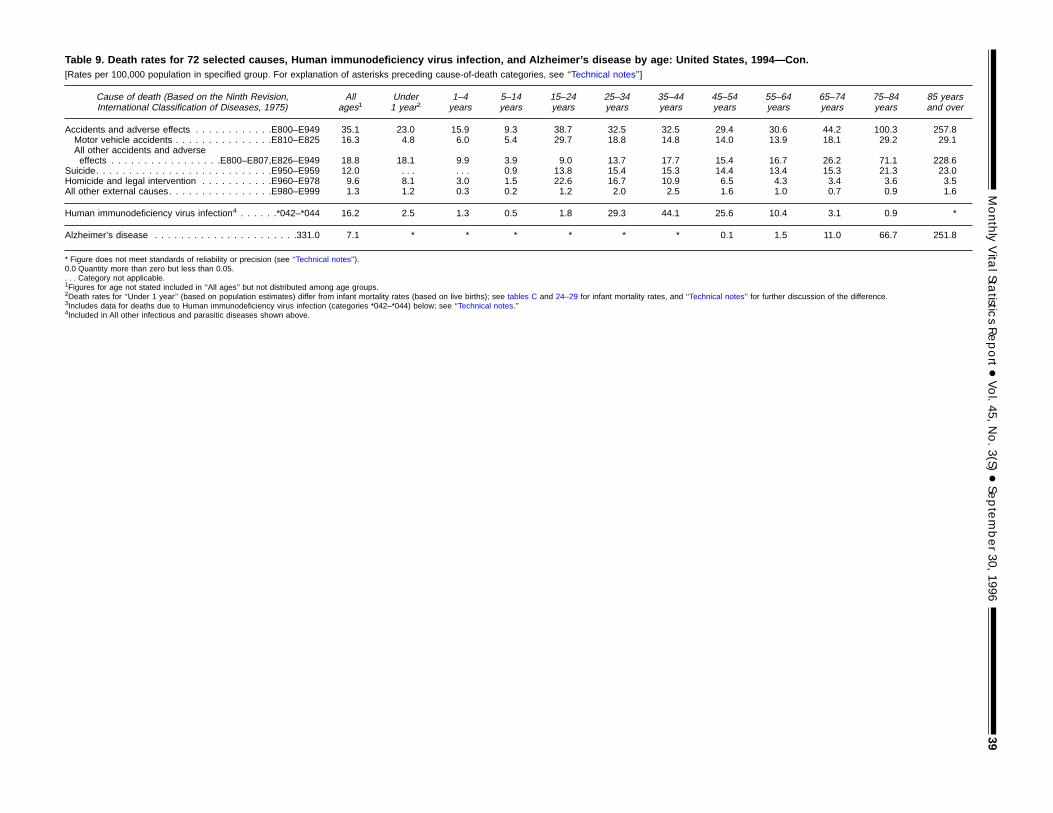
Table 9. Death rates for 72 selected causes, Human immunodeficiency virus infection, and Alzheimer’s disease by age: United States, 1994—Con.[Rates per 100,000 population in specified group. For explanation of asterisks preceding cause-of-death categories, see ‘‘Technical notes’’]
Cause of death (Based on the Ninth Revision,International Classification of Diseases, 1975)
Allages1
Under1 year2
1–4years
5–14years
15–24years
25–34years
35–44years
45–54years
55–64years
65–74years
75–84years
85 yearsand over
Accidents and adverse effects . . . . . . . . . . . .E800–E949 35.1 23.0 15.9 9.3 38.7 32.5 32.5 29.4 30.6 44.2 100.3 257.8Motor vehicle accidents . . . . . . . . . . . . . . .E810–E825 16.3 4.8 6.0 5.4 29.7 18.8 14.8 14.0 13.9 18.1 29.2 29.1All other accidents and adverseeffects . . . . . . . . . . . . . . . . .E800–E807,E826–E949 18.8 18.1 9.9 3.9 9.0 13.7 17.7 15.4 16.7 26.2 71.1 228.6
Suicide. . . . . . . . . . . . . . . . . . . . . . . . . . .E950–E959 12.0 . . . . . . 0.9 13.8 15.4 15.3 14.4 13.4 15.3 21.3 23.0Homicide and legal intervention . . . . . . . . . . .E960–E978 9.6 8.1 3.0 1.5 22.6 16.7 10.9 6.5 4.3 3.4 3.6 3.5All other external causes. . . . . . . . . . . . . . . .E980–E999 1.3 1.2 0.3 0.2 1.2 2.0 2.5 1.6 1.0 0.7 0.9 1.6
Human immunodeficiency virus infection4 . . . . . .*042–*044 16.2 2.5 1.3 0.5 1.8 29.3 44.1 25.6 10.4 3.1 0.9 *
Alzheimer’s disease . . . . . . . . . . . . . . . . . . . . . .331.0 7.1 * * * * * * 0.1 1.5 11.0 66.7 251.8
* Figure does not meet standards of reliability or precision (see ‘‘Technical notes’’).0.0 Quantity more than zero but less than 0.05.. . . Category not applicable.1Figures for age not stated included in ‘‘All ages’’ but not distributed among age groups.2Death rates for ‘‘Under 1 year’’ (based on population estimates) differ from infant mortality rates (based on live births); see tables C and 24–29 for infant mortality rates, and ‘‘Technical notes’’ for further discussion of the difference.3Includes data for deaths due to Human immunodeficiency virus infection (categories *042–*044) below; see ‘‘Technical notes.’’4Included in All other infectious and parasitic diseases shown above.
MonthlyVita
lStatistic
sReport+Vol.45,
No.3(S)
+September30,
199639
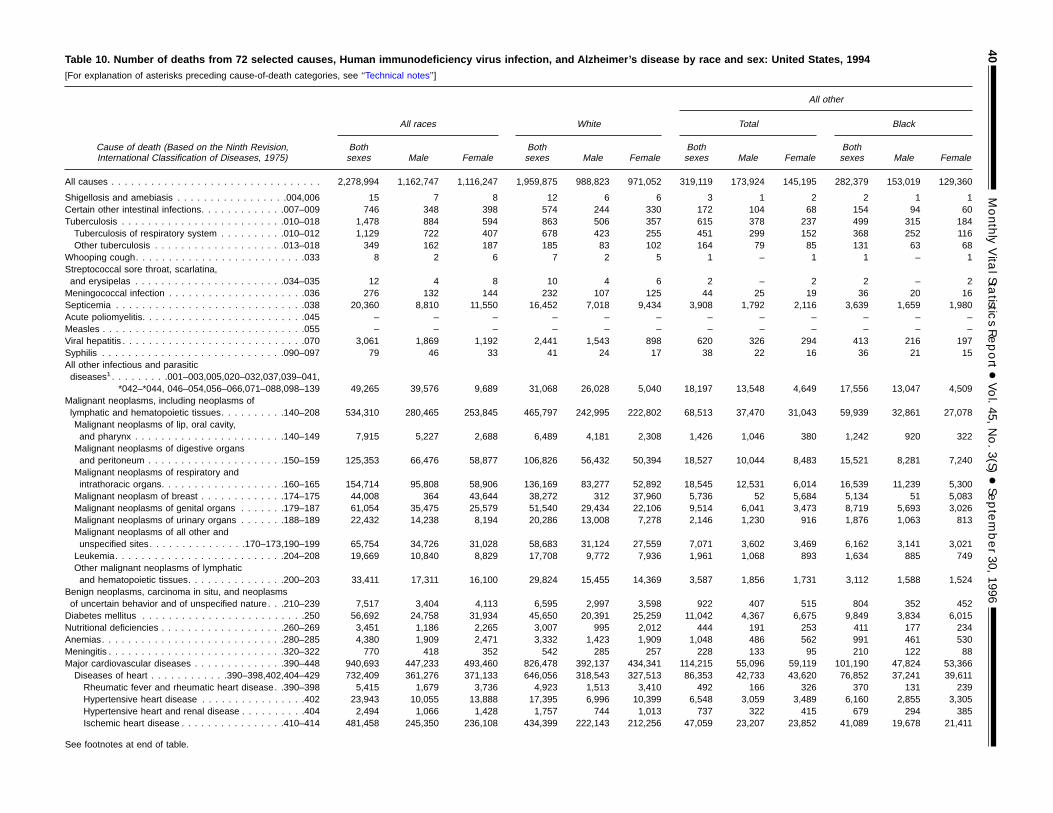
Table 10. Number of deaths from 72 selected causes, Human immunodeficiency virus infection, and Alzheimer’s disease by race and sex: United States, 1994[For explanation of asterisks preceding cause-of-death categories, see ‘‘Technical notes’’]
Cause of death (Based on the Ninth Revision,International Classification of Diseases, 1975)
All other
All races White Total Black
Bothsexes Male Female
Bothsexes Male Female
Bothsexes Male Female
Bothsexes Male Female
All causes . . . . . . . . . . . . . . . . . . . . . . . . . . . . . . . . 2,278,994 1,162,747 1,116,247 1,959,875 988,823 971,052 319,119 173,924 145,195 282,379 153,019 129,360
Shigellosis and amebiasis . . . . . . . . . . . . . . . . .004,006 15 7 8 12 6 6 3 1 2 2 1 1Certain other intestinal infections. . . . . . . . . . . . .007–009 746 348 398 574 244 330 172 104 68 154 94 60Tuberculosis . . . . . . . . . . . . . . . . . . . . . . . . .010–018 1,478 884 594 863 506 357 615 378 237 499 315 184Tuberculosis of respiratory system . . . . . . . . . .010–012 1,129 722 407 678 423 255 451 299 152 368 252 116Other tuberculosis . . . . . . . . . . . . . . . . . . . .013–018 349 162 187 185 83 102 164 79 85 131 63 68
Whooping cough. . . . . . . . . . . . . . . . . . . . . . . . . .033 8 2 6 7 2 5 1 – 1 1 – 1Streptococcal sore throat, scarlatina,and erysipelas . . . . . . . . . . . . . . . . . . . . . . .034–035 12 4 8 10 4 6 2 – 2 2 – 2Meningococcal infection . . . . . . . . . . . . . . . . . . . . .036 276 132 144 232 107 125 44 25 19 36 20 16Septicemia . . . . . . . . . . . . . . . . . . . . . . . . . . . . .038 20,360 8,810 11,550 16,452 7,018 9,434 3,908 1,792 2,116 3,639 1,659 1,980Acute poliomyelitis. . . . . . . . . . . . . . . . . . . . . . . . .045 – – – – – – – – – – – –Measles . . . . . . . . . . . . . . . . . . . . . . . . . . . . . . .055 – – – – – – – – – – – –Viral hepatitis . . . . . . . . . . . . . . . . . . . . . . . . . . . .070 3,061 1,869 1,192 2,441 1,543 898 620 326 294 413 216 197Syphilis . . . . . . . . . . . . . . . . . . . . . . . . . . . .090–097 79 46 33 41 24 17 38 22 16 36 21 15All other infectious and parasiticdiseases1. . . . . . . . .001–003,005,020–032,037,039–041,
*042–*044, 046–054,056–066,071–088,098–139 49,265 39,576 9,689 31,068 26,028 5,040 18,197 13,548 4,649 17,556 13,047 4,509Malignant neoplasms, including neoplasms oflymphatic and hematopoietic tissues. . . . . . . . . .140–208 534,310 280,465 253,845 465,797 242,995 222,802 68,513 37,470 31,043 59,939 32,861 27,078Malignant neoplasms of lip, oral cavity,and pharynx . . . . . . . . . . . . . . . . . . . . . . .140–149 7,915 5,227 2,688 6,489 4,181 2,308 1,426 1,046 380 1,242 920 322Malignant neoplasms of digestive organsand peritoneum . . . . . . . . . . . . . . . . . . . . .150–159 125,353 66,476 58,877 106,826 56,432 50,394 18,527 10,044 8,483 15,521 8,281 7,240Malignant neoplasms of respiratory andintrathoracic organs. . . . . . . . . . . . . . . . . . .160–165 154,714 95,808 58,906 136,169 83,277 52,892 18,545 12,531 6,014 16,539 11,239 5,300Malignant neoplasm of breast . . . . . . . . . . . . .174–175 44,008 364 43,644 38,272 312 37,960 5,736 52 5,684 5,134 51 5,083Malignant neoplasms of genital organs . . . . . . .179–187 61,054 35,475 25,579 51,540 29,434 22,106 9,514 6,041 3,473 8,719 5,693 3,026Malignant neoplasms of urinary organs . . . . . . .188–189 22,432 14,238 8,194 20,286 13,008 7,278 2,146 1,230 916 1,876 1,063 813Malignant neoplasms of all other andunspecified sites. . . . . . . . . . . . . . .170–173,190–199 65,754 34,726 31,028 58,683 31,124 27,559 7,071 3,602 3,469 6,162 3,141 3,021Leukemia. . . . . . . . . . . . . . . . . . . . . . . . . .204–208 19,669 10,840 8,829 17,708 9,772 7,936 1,961 1,068 893 1,634 885 749Other malignant neoplasms of lymphaticand hematopoietic tissues. . . . . . . . . . . . . . .200–203 33,411 17,311 16,100 29,824 15,455 14,369 3,587 1,856 1,731 3,112 1,588 1,524
Benign neoplasms, carcinoma in situ, and neoplasmsof uncertain behavior and of unspecified nature . . .210–239 7,517 3,404 4,113 6,595 2,997 3,598 922 407 515 804 352 452Diabetes mellitus . . . . . . . . . . . . . . . . . . . . . . . . .250 56,692 24,758 31,934 45,650 20,391 25,259 11,042 4,367 6,675 9,849 3,834 6,015Nutritional deficiencies . . . . . . . . . . . . . . . . . . .260–269 3,451 1,186 2,265 3,007 995 2,012 444 191 253 411 177 234Anemias. . . . . . . . . . . . . . . . . . . . . . . . . . . .280–285 4,380 1,909 2,471 3,332 1,423 1,909 1,048 486 562 991 461 530Meningitis . . . . . . . . . . . . . . . . . . . . . . . . . . .320–322 770 418 352 542 285 257 228 133 95 210 122 88Major cardiovascular diseases . . . . . . . . . . . . . .390–448 940,693 447,233 493,460 826,478 392,137 434,341 114,215 55,096 59,119 101,190 47,824 53,366Diseases of heart . . . . . . . . . . . .390–398,402,404–429 732,409 361,276 371,133 646,056 318,543 327,513 86,353 42,733 43,620 76,852 37,241 39,611Rheumatic fever and rheumatic heart disease. .390–398 5,415 1,679 3,736 4,923 1,513 3,410 492 166 326 370 131 239Hypertensive heart disease . . . . . . . . . . . . . . . .402 23,943 10,055 13,888 17,395 6,996 10,399 6,548 3,059 3,489 6,160 2,855 3,305Hypertensive heart and renal disease . . . . . . . . . .404 2,494 1,066 1,428 1,757 744 1,013 737 322 415 679 294 385Ischemic heart disease . . . . . . . . . . . . . . . .410–414 481,458 245,350 236,108 434,399 222,143 212,256 47,059 23,207 23,852 41,089 19,678 21,411
See footnotes at end of table.
40MonthlyVita
lStatistic
sReport+Vol.45,
No.3(S)
+September30,
1996
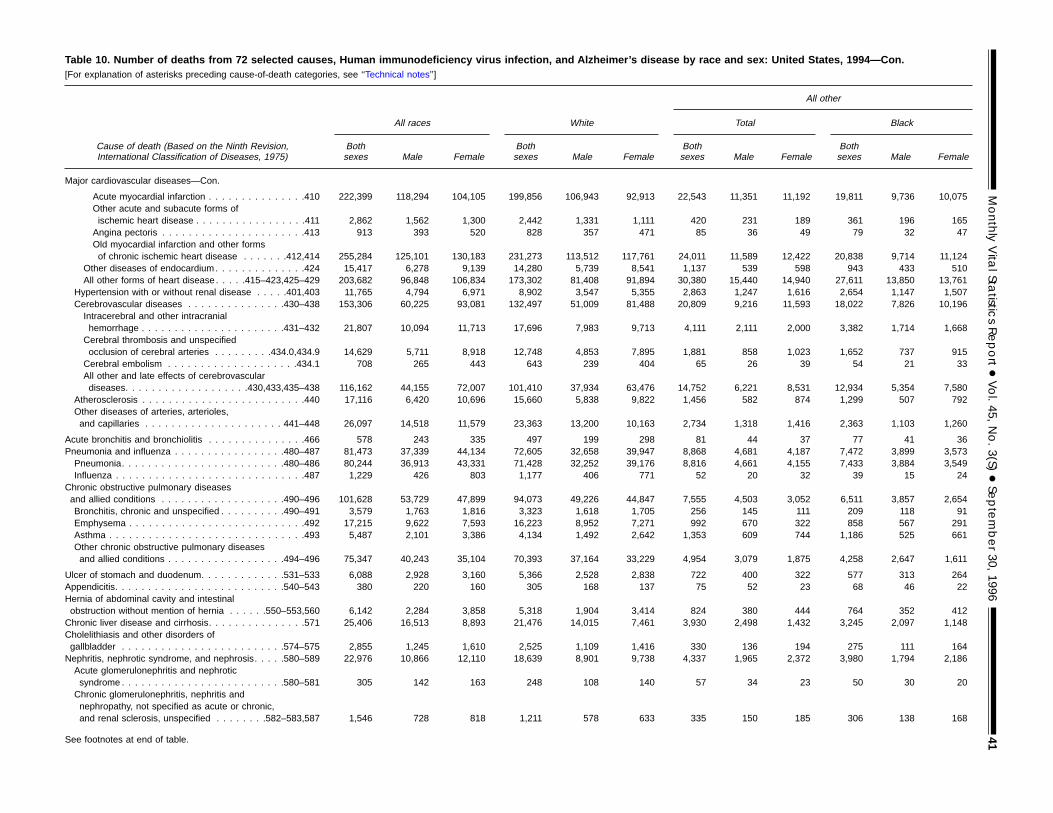
Table 10. Number of deaths from 72 selected causes, Human immunodeficiency virus infection, and Alzheimer’s disease by race and sex: United States, 1994—Con.[For explanation of asterisks preceding cause-of-death categories, see ‘‘Technical notes’’]
Cause of death (Based on the Ninth Revision,International Classification of Diseases, 1975)
All other
All races White Total Black
Bothsexes Male Female
Bothsexes Male Female
Bothsexes Male Female
Bothsexes Male Female
Major cardiovascular diseases—Con.
Acute myocardial infarction . . . . . . . . . . . . . . .410 222,399 118,294 104,105 199,856 106,943 92,913 22,543 11,351 11,192 19,811 9,736 10,075Other acute and subacute forms ofischemic heart disease . . . . . . . . . . . . . . . . .411 2,862 1,562 1,300 2,442 1,331 1,111 420 231 189 361 196 165Angina pectoris . . . . . . . . . . . . . . . . . . . . . .413 913 393 520 828 357 471 85 36 49 79 32 47Old myocardial infarction and other formsof chronic ischemic heart disease . . . . . . .412,414 255,284 125,101 130,183 231,273 113,512 117,761 24,011 11,589 12,422 20,838 9,714 11,124
Other diseases of endocardium . . . . . . . . . . . . . .424 15,417 6,278 9,139 14,280 5,739 8,541 1,137 539 598 943 433 510All other forms of heart disease . . . . .415–423,425–429 203,682 96,848 106,834 173,302 81,408 91,894 30,380 15,440 14,940 27,611 13,850 13,761
Hypertension with or without renal disease . . . . .401,403 11,765 4,794 6,971 8,902 3,547 5,355 2,863 1,247 1,616 2,654 1,147 1,507Cerebrovascular diseases . . . . . . . . . . . . . . .430–438 153,306 60,225 93,081 132,497 51,009 81,488 20,809 9,216 11,593 18,022 7,826 10,196Intracerebral and other intracranialhemorrhage . . . . . . . . . . . . . . . . . . . . . .431–432 21,807 10,094 11,713 17,696 7,983 9,713 4,111 2,111 2,000 3,382 1,714 1,668Cerebral thrombosis and unspecifiedocclusion of cerebral arteries . . . . . . . . .434.0,434.9 14,629 5,711 8,918 12,748 4,853 7,895 1,881 858 1,023 1,652 737 915Cerebral embolism . . . . . . . . . . . . . . . . . . . .434.1 708 265 443 643 239 404 65 26 39 54 21 33All other and late effects of cerebrovasculardiseases. . . . . . . . . . . . . . . . . . .430,433,435–438 116,162 44,155 72,007 101,410 37,934 63,476 14,752 6,221 8,531 12,934 5,354 7,580
Atherosclerosis . . . . . . . . . . . . . . . . . . . . . . . . .440 17,116 6,420 10,696 15,660 5,838 9,822 1,456 582 874 1,299 507 792Other diseases of arteries, arterioles,and capillaries . . . . . . . . . . . . . . . . . . . . . 441–448 26,097 14,518 11,579 23,363 13,200 10,163 2,734 1,318 1,416 2,363 1,103 1,260
Acute bronchitis and bronchiolitis . . . . . . . . . . . . . . .466 578 243 335 497 199 298 81 44 37 77 41 36Pneumonia and influenza . . . . . . . . . . . . . . . . .480–487 81,473 37,339 44,134 72,605 32,658 39,947 8,868 4,681 4,187 7,472 3,899 3,573Pneumonia. . . . . . . . . . . . . . . . . . . . . . . . .480–486 80,244 36,913 43,331 71,428 32,252 39,176 8,816 4,661 4,155 7,433 3,884 3,549Influenza . . . . . . . . . . . . . . . . . . . . . . . . . . . . .487 1,229 426 803 1,177 406 771 52 20 32 39 15 24
Chronic obstructive pulmonary diseasesand allied conditions . . . . . . . . . . . . . . . . . . .490–496 101,628 53,729 47,899 94,073 49,226 44,847 7,555 4,503 3,052 6,511 3,857 2,654Bronchitis, chronic and unspecified . . . . . . . . . .490–491 3,579 1,763 1,816 3,323 1,618 1,705 256 145 111 209 118 91Emphysema . . . . . . . . . . . . . . . . . . . . . . . . . . .492 17,215 9,622 7,593 16,223 8,952 7,271 992 670 322 858 567 291Asthma . . . . . . . . . . . . . . . . . . . . . . . . . . . . . .493 5,487 2,101 3,386 4,134 1,492 2,642 1,353 609 744 1,186 525 661Other chronic obstructive pulmonary diseasesand allied conditions . . . . . . . . . . . . . . . . . .494–496 75,347 40,243 35,104 70,393 37,164 33,229 4,954 3,079 1,875 4,258 2,647 1,611
Ulcer of stomach and duodenum. . . . . . . . . . . . .531–533 6,088 2,928 3,160 5,366 2,528 2,838 722 400 322 577 313 264Appendicitis. . . . . . . . . . . . . . . . . . . . . . . . . .540–543 380 220 160 305 168 137 75 52 23 68 46 22Hernia of abdominal cavity and intestinalobstruction without mention of hernia . . . . . .550–553,560 6,142 2,284 3,858 5,318 1,904 3,414 824 380 444 764 352 412Chronic liver disease and cirrhosis. . . . . . . . . . . . . . .571 25,406 16,513 8,893 21,476 14,015 7,461 3,930 2,498 1,432 3,245 2,097 1,148Cholelithiasis and other disorders ofgallbladder . . . . . . . . . . . . . . . . . . . . . . . . .574–575 2,855 1,245 1,610 2,525 1,109 1,416 330 136 194 275 111 164Nephritis, nephrotic syndrome, and nephrosis. . . . .580–589 22,976 10,866 12,110 18,639 8,901 9,738 4,337 1,965 2,372 3,980 1,794 2,186Acute glomerulonephritis and nephroticsyndrome . . . . . . . . . . . . . . . . . . . . . . . . .580–581 305 142 163 248 108 140 57 34 23 50 30 20Chronic glomerulonephritis, nephritis andnephropathy, not specified as acute or chronic,and renal sclerosis, unspecified . . . . . . . .582–583,587 1,546 728 818 1,211 578 633 335 150 185 306 138 168
See footnotes at end of table.
MonthlyVita
lStatistic
sReport+Vol.45,
No.3(S)
+September30,
199641
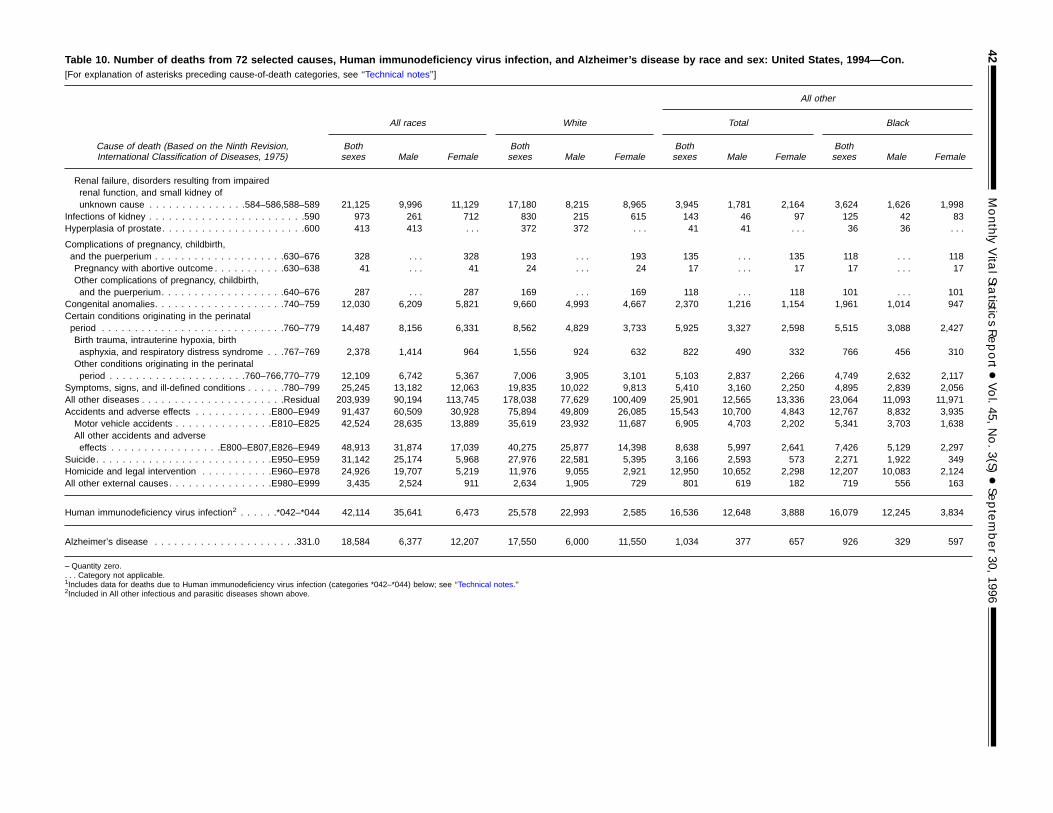
Table 10. Number of deaths from 72 selected causes, Human immunodeficiency virus infection, and Alzheimer’s disease by race and sex: United States, 1994—Con.[For explanation of asterisks preceding cause-of-death categories, see ‘‘Technical notes’’]
Cause of death (Based on the Ninth Revision,International Classification of Diseases, 1975)
All other
All races White Total Black
Bothsexes Male Female
Bothsexes Male Female
Bothsexes Male Female
Bothsexes Male Female
Renal failure, disorders resulting from impairedrenal function, and small kidney ofunknown cause . . . . . . . . . . . . . . .584–586,588–589 21,125 9,996 11,129 17,180 8,215 8,965 3,945 1,781 2,164 3,624 1,626 1,998
Infections of kidney . . . . . . . . . . . . . . . . . . . . . . . .590 973 261 712 830 215 615 143 46 97 125 42 83Hyperplasia of prostate. . . . . . . . . . . . . . . . . . . . . .600 413 413 . . . 372 372 . . . 41 41 . . . 36 36 . . .
Complications of pregnancy, childbirth,and the puerperium . . . . . . . . . . . . . . . . . . . .630–676 328 . . . 328 193 . . . 193 135 . . . 135 118 . . . 118Pregnancy with abortive outcome . . . . . . . . . . .630–638 41 . . . 41 24 . . . 24 17 . . . 17 17 . . . 17Other complications of pregnancy, childbirth,and the puerperium. . . . . . . . . . . . . . . . . . .640–676 287 . . . 287 169 . . . 169 118 . . . 118 101 . . . 101
Congenital anomalies. . . . . . . . . . . . . . . . . . . .740–759 12,030 6,209 5,821 9,660 4,993 4,667 2,370 1,216 1,154 1,961 1,014 947Certain conditions originating in the perinatalperiod . . . . . . . . . . . . . . . . . . . . . . . . . . . .760–779 14,487 8,156 6,331 8,562 4,829 3,733 5,925 3,327 2,598 5,515 3,088 2,427Birth trauma, intrauterine hypoxia, birthasphyxia, and respiratory distress syndrome . . .767–769 2,378 1,414 964 1,556 924 632 822 490 332 766 456 310Other conditions originating in the perinatalperiod . . . . . . . . . . . . . . . . . . . . .760–766,770–779 12,109 6,742 5,367 7,006 3,905 3,101 5,103 2,837 2,266 4,749 2,632 2,117
Symptoms, signs, and ill-defined conditions . . . . . .780–799 25,245 13,182 12,063 19,835 10,022 9,813 5,410 3,160 2,250 4,895 2,839 2,056All other diseases . . . . . . . . . . . . . . . . . . . . . .Residual 203,939 90,194 113,745 178,038 77,629 100,409 25,901 12,565 13,336 23,064 11,093 11,971Accidents and adverse effects . . . . . . . . . . . .E800–E949 91,437 60,509 30,928 75,894 49,809 26,085 15,543 10,700 4,843 12,767 8,832 3,935Motor vehicle accidents . . . . . . . . . . . . . . .E810–E825 42,524 28,635 13,889 35,619 23,932 11,687 6,905 4,703 2,202 5,341 3,703 1,638All other accidents and adverseeffects . . . . . . . . . . . . . . . . .E800–E807,E826–E949 48,913 31,874 17,039 40,275 25,877 14,398 8,638 5,997 2,641 7,426 5,129 2,297
Suicide. . . . . . . . . . . . . . . . . . . . . . . . . . .E950–E959 31,142 25,174 5,968 27,976 22,581 5,395 3,166 2,593 573 2,271 1,922 349Homicide and legal intervention . . . . . . . . . . .E960–E978 24,926 19,707 5,219 11,976 9,055 2,921 12,950 10,652 2,298 12,207 10,083 2,124All other external causes. . . . . . . . . . . . . . . .E980–E999 3,435 2,524 911 2,634 1,905 729 801 619 182 719 556 163
Human immunodeficiency virus infection2 . . . . . .*042–*044 42,114 35,641 6,473 25,578 22,993 2,585 16,536 12,648 3,888 16,079 12,245 3,834
Alzheimer’s disease . . . . . . . . . . . . . . . . . . . . . .331.0 18,584 6,377 12,207 17,550 6,000 11,550 1,034 377 657 926 329 597
– Quantity zero.. . . Category not applicable.1Includes data for deaths due to Human immunodeficiency virus infection (categories *042–*044) below; see ‘‘Technical notes.’’2Included in All other infectious and parasitic diseases shown above.
42MonthlyVita
lStatistic
sReport+Vol.45,
No.3(S)
+September30,
1996
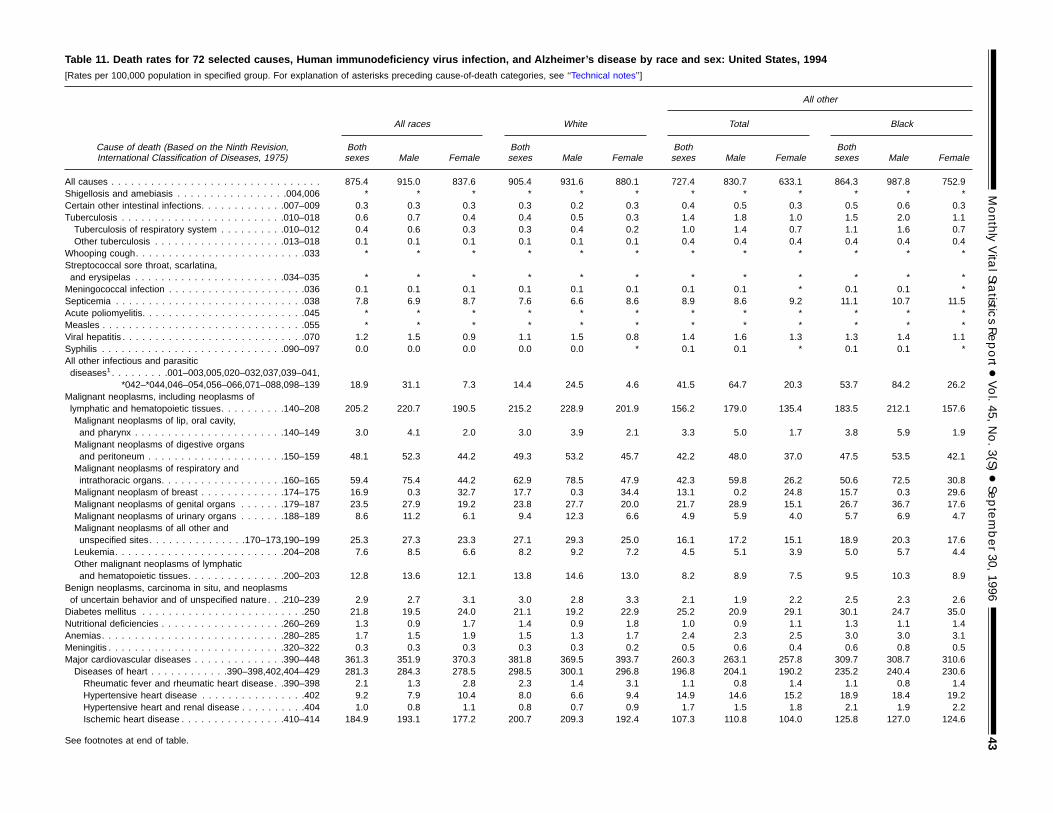
Table 11. Death rates for 72 selected causes, Human immunodeficiency virus infection, and Alzheimer’s disease by race and sex: United States, 1994[Rates per 100,000 population in specified group. For explanation of asterisks preceding cause-of-death categories, see ‘‘Technical notes’’]
Cause of death (Based on the Ninth Revision,International Classification of Diseases, 1975)
All other
All races White Total Black
Bothsexes Male Female
Bothsexes Male Female
Bothsexes Male Female
Bothsexes Male Female
All causes . . . . . . . . . . . . . . . . . . . . . . . . . . . . . . . . 875.4 915.0 837.6 905.4 931.6 880.1 727.4 830.7 633.1 864.3 987.8 752.9Shigellosis and amebiasis . . . . . . . . . . . . . . . . .004,006 * * * * * * * * * * * *Certain other intestinal infections. . . . . . . . . . . . .007–009 0.3 0.3 0.3 0.3 0.2 0.3 0.4 0.5 0.3 0.5 0.6 0.3Tuberculosis . . . . . . . . . . . . . . . . . . . . . . . . .010–018 0.6 0.7 0.4 0.4 0.5 0.3 1.4 1.8 1.0 1.5 2.0 1.1Tuberculosis of respiratory system . . . . . . . . . .010–012 0.4 0.6 0.3 0.3 0.4 0.2 1.0 1.4 0.7 1.1 1.6 0.7Other tuberculosis . . . . . . . . . . . . . . . . . . . .013–018 0.1 0.1 0.1 0.1 0.1 0.1 0.4 0.4 0.4 0.4 0.4 0.4
Whooping cough. . . . . . . . . . . . . . . . . . . . . . . . . .033 * * * * * * * * * * * *Streptococcal sore throat, scarlatina,and erysipelas . . . . . . . . . . . . . . . . . . . . . . .034–035 * * * * * * * * * * * *Meningococcal infection . . . . . . . . . . . . . . . . . . . . .036 0.1 0.1 0.1 0.1 0.1 0.1 0.1 0.1 * 0.1 0.1 *Septicemia . . . . . . . . . . . . . . . . . . . . . . . . . . . . .038 7.8 6.9 8.7 7.6 6.6 8.6 8.9 8.6 9.2 11.1 10.7 11.5Acute poliomyelitis. . . . . . . . . . . . . . . . . . . . . . . . .045 * * * * * * * * * * * *Measles . . . . . . . . . . . . . . . . . . . . . . . . . . . . . . .055 * * * * * * * * * * * *Viral hepatitis . . . . . . . . . . . . . . . . . . . . . . . . . . . .070 1.2 1.5 0.9 1.1 1.5 0.8 1.4 1.6 1.3 1.3 1.4 1.1Syphilis . . . . . . . . . . . . . . . . . . . . . . . . . . . .090–097 0.0 0.0 0.0 0.0 0.0 * 0.1 0.1 * 0.1 0.1 *All other infectious and parasiticdiseases1. . . . . . . . .001–003,005,020–032,037,039–041,
*042–*044,046–054,056–066,071–088,098–139 18.9 31.1 7.3 14.4 24.5 4.6 41.5 64.7 20.3 53.7 84.2 26.2Malignant neoplasms, including neoplasms oflymphatic and hematopoietic tissues. . . . . . . . . .140–208 205.2 220.7 190.5 215.2 228.9 201.9 156.2 179.0 135.4 183.5 212.1 157.6Malignant neoplasms of lip, oral cavity,and pharynx . . . . . . . . . . . . . . . . . . . . . . .140–149 3.0 4.1 2.0 3.0 3.9 2.1 3.3 5.0 1.7 3.8 5.9 1.9Malignant neoplasms of digestive organsand peritoneum . . . . . . . . . . . . . . . . . . . . .150–159 48.1 52.3 44.2 49.3 53.2 45.7 42.2 48.0 37.0 47.5 53.5 42.1Malignant neoplasms of respiratory andintrathoracic organs. . . . . . . . . . . . . . . . . . .160–165 59.4 75.4 44.2 62.9 78.5 47.9 42.3 59.8 26.2 50.6 72.5 30.8Malignant neoplasm of breast . . . . . . . . . . . . .174–175 16.9 0.3 32.7 17.7 0.3 34.4 13.1 0.2 24.8 15.7 0.3 29.6Malignant neoplasms of genital organs . . . . . . .179–187 23.5 27.9 19.2 23.8 27.7 20.0 21.7 28.9 15.1 26.7 36.7 17.6Malignant neoplasms of urinary organs . . . . . . .188–189 8.6 11.2 6.1 9.4 12.3 6.6 4.9 5.9 4.0 5.7 6.9 4.7Malignant neoplasms of all other andunspecified sites. . . . . . . . . . . . . . .170–173,190–199 25.3 27.3 23.3 27.1 29.3 25.0 16.1 17.2 15.1 18.9 20.3 17.6Leukemia. . . . . . . . . . . . . . . . . . . . . . . . . .204–208 7.6 8.5 6.6 8.2 9.2 7.2 4.5 5.1 3.9 5.0 5.7 4.4Other malignant neoplasms of lymphaticand hematopoietic tissues. . . . . . . . . . . . . . .200–203 12.8 13.6 12.1 13.8 14.6 13.0 8.2 8.9 7.5 9.5 10.3 8.9
Benign neoplasms, carcinoma in situ, and neoplasmsof uncertain behavior and of unspecified nature . . .210–239 2.9 2.7 3.1 3.0 2.8 3.3 2.1 1.9 2.2 2.5 2.3 2.6Diabetes mellitus . . . . . . . . . . . . . . . . . . . . . . . . .250 21.8 19.5 24.0 21.1 19.2 22.9 25.2 20.9 29.1 30.1 24.7 35.0Nutritional deficiencies . . . . . . . . . . . . . . . . . . .260–269 1.3 0.9 1.7 1.4 0.9 1.8 1.0 0.9 1.1 1.3 1.1 1.4Anemias. . . . . . . . . . . . . . . . . . . . . . . . . . . .280–285 1.7 1.5 1.9 1.5 1.3 1.7 2.4 2.3 2.5 3.0 3.0 3.1Meningitis . . . . . . . . . . . . . . . . . . . . . . . . . . .320–322 0.3 0.3 0.3 0.3 0.3 0.2 0.5 0.6 0.4 0.6 0.8 0.5Major cardiovascular diseases . . . . . . . . . . . . . .390–448 361.3 351.9 370.3 381.8 369.5 393.7 260.3 263.1 257.8 309.7 308.7 310.6Diseases of heart . . . . . . . . . . . .390–398,402,404–429 281.3 284.3 278.5 298.5 300.1 296.8 196.8 204.1 190.2 235.2 240.4 230.6Rheumatic fever and rheumatic heart disease. .390–398 2.1 1.3 2.8 2.3 1.4 3.1 1.1 0.8 1.4 1.1 0.8 1.4Hypertensive heart disease . . . . . . . . . . . . . . . .402 9.2 7.9 10.4 8.0 6.6 9.4 14.9 14.6 15.2 18.9 18.4 19.2Hypertensive heart and renal disease . . . . . . . . . .404 1.0 0.8 1.1 0.8 0.7 0.9 1.7 1.5 1.8 2.1 1.9 2.2Ischemic heart disease . . . . . . . . . . . . . . . .410–414 184.9 193.1 177.2 200.7 209.3 192.4 107.3 110.8 104.0 125.8 127.0 124.6
See footnotes at end of table.
MonthlyVita
lStatistic
sReport+Vol.45,
No.3(S)
+September30,
199643
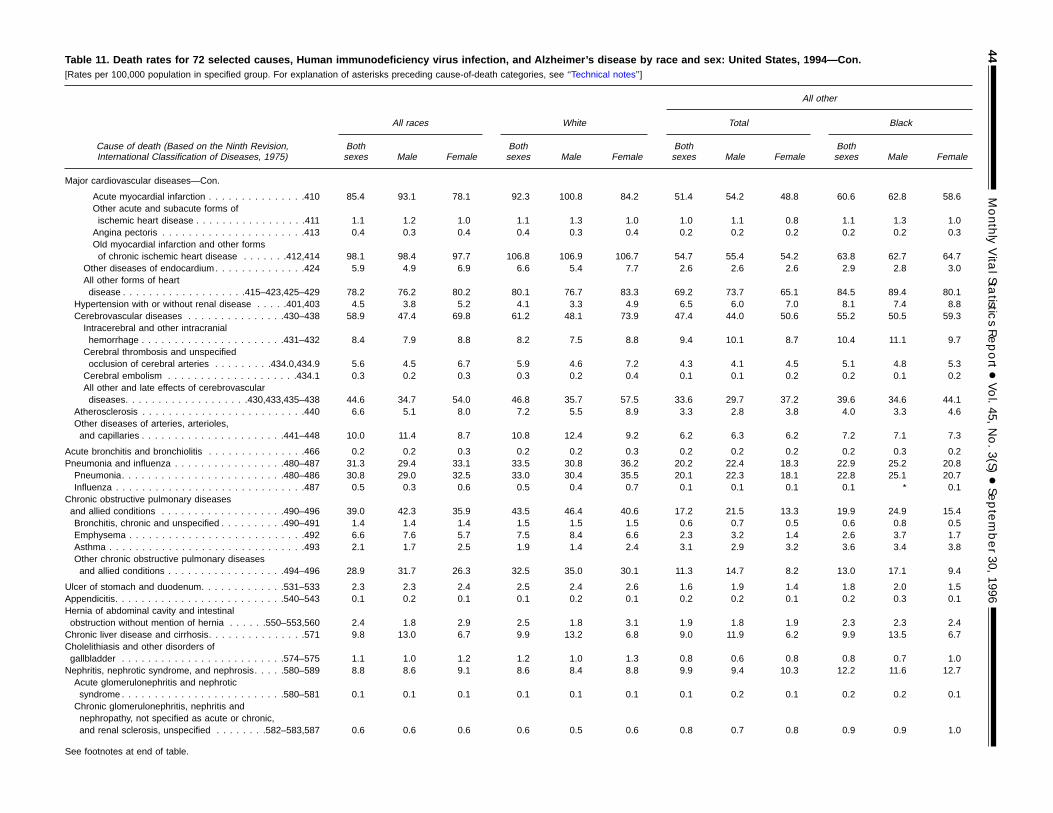
Table 11. Death rates for 72 selected causes, Human immunodeficiency virus infection, and Alzheimer’s disease by race and sex: United States, 1994—Con.[Rates per 100,000 population in specified group. For explanation of asterisks preceding cause-of-death categories, see ‘‘Technical notes’’]
Cause of death (Based on the Ninth Revision,International Classification of Diseases, 1975)
All other
All races White Total Black
Bothsexes Male Female
Bothsexes Male Female
Bothsexes Male Female
Bothsexes Male Female
Major cardiovascular diseases—Con.
Acute myocardial infarction . . . . . . . . . . . . . . .410 85.4 93.1 78.1 92.3 100.8 84.2 51.4 54.2 48.8 60.6 62.8 58.6Other acute and subacute forms ofischemic heart disease . . . . . . . . . . . . . . . . .411 1.1 1.2 1.0 1.1 1.3 1.0 1.0 1.1 0.8 1.1 1.3 1.0Angina pectoris . . . . . . . . . . . . . . . . . . . . . .413 0.4 0.3 0.4 0.4 0.3 0.4 0.2 0.2 0.2 0.2 0.2 0.3Old myocardial infarction and other formsof chronic ischemic heart disease . . . . . . .412,414 98.1 98.4 97.7 106.8 106.9 106.7 54.7 55.4 54.2 63.8 62.7 64.7
Other diseases of endocardium . . . . . . . . . . . . . .424 5.9 4.9 6.9 6.6 5.4 7.7 2.6 2.6 2.6 2.9 2.8 3.0All other forms of heartdisease . . . . . . . . . . . . . . . . . . .415–423,425–429 78.2 76.2 80.2 80.1 76.7 83.3 69.2 73.7 65.1 84.5 89.4 80.1
Hypertension with or without renal disease . . . . .401,403 4.5 3.8 5.2 4.1 3.3 4.9 6.5 6.0 7.0 8.1 7.4 8.8Cerebrovascular diseases . . . . . . . . . . . . . . .430–438 58.9 47.4 69.8 61.2 48.1 73.9 47.4 44.0 50.6 55.2 50.5 59.3Intracerebral and other intracranialhemorrhage . . . . . . . . . . . . . . . . . . . . . .431–432 8.4 7.9 8.8 8.2 7.5 8.8 9.4 10.1 8.7 10.4 11.1 9.7Cerebral thrombosis and unspecifiedocclusion of cerebral arteries . . . . . . . . .434.0,434.9 5.6 4.5 6.7 5.9 4.6 7.2 4.3 4.1 4.5 5.1 4.8 5.3Cerebral embolism . . . . . . . . . . . . . . . . . . . .434.1 0.3 0.2 0.3 0.3 0.2 0.4 0.1 0.1 0.2 0.2 0.1 0.2All other and late effects of cerebrovasculardiseases. . . . . . . . . . . . . . . . . . .430,433,435–438 44.6 34.7 54.0 46.8 35.7 57.5 33.6 29.7 37.2 39.6 34.6 44.1
Atherosclerosis . . . . . . . . . . . . . . . . . . . . . . . . .440 6.6 5.1 8.0 7.2 5.5 8.9 3.3 2.8 3.8 4.0 3.3 4.6Other diseases of arteries, arterioles,and capillaries . . . . . . . . . . . . . . . . . . . . . .441–448 10.0 11.4 8.7 10.8 12.4 9.2 6.2 6.3 6.2 7.2 7.1 7.3
Acute bronchitis and bronchiolitis . . . . . . . . . . . . . . .466 0.2 0.2 0.3 0.2 0.2 0.3 0.2 0.2 0.2 0.2 0.3 0.2Pneumonia and influenza . . . . . . . . . . . . . . . . .480–487 31.3 29.4 33.1 33.5 30.8 36.2 20.2 22.4 18.3 22.9 25.2 20.8Pneumonia. . . . . . . . . . . . . . . . . . . . . . . . .480–486 30.8 29.0 32.5 33.0 30.4 35.5 20.1 22.3 18.1 22.8 25.1 20.7Influenza . . . . . . . . . . . . . . . . . . . . . . . . . . . . .487 0.5 0.3 0.6 0.5 0.4 0.7 0.1 0.1 0.1 0.1 * 0.1
Chronic obstructive pulmonary diseasesand allied conditions . . . . . . . . . . . . . . . . . . .490–496 39.0 42.3 35.9 43.5 46.4 40.6 17.2 21.5 13.3 19.9 24.9 15.4Bronchitis, chronic and unspecified . . . . . . . . . .490–491 1.4 1.4 1.4 1.5 1.5 1.5 0.6 0.7 0.5 0.6 0.8 0.5Emphysema . . . . . . . . . . . . . . . . . . . . . . . . . . .492 6.6 7.6 5.7 7.5 8.4 6.6 2.3 3.2 1.4 2.6 3.7 1.7Asthma . . . . . . . . . . . . . . . . . . . . . . . . . . . . . .493 2.1 1.7 2.5 1.9 1.4 2.4 3.1 2.9 3.2 3.6 3.4 3.8Other chronic obstructive pulmonary diseasesand allied conditions . . . . . . . . . . . . . . . . . .494–496 28.9 31.7 26.3 32.5 35.0 30.1 11.3 14.7 8.2 13.0 17.1 9.4
Ulcer of stomach and duodenum. . . . . . . . . . . . .531–533 2.3 2.3 2.4 2.5 2.4 2.6 1.6 1.9 1.4 1.8 2.0 1.5Appendicitis. . . . . . . . . . . . . . . . . . . . . . . . . .540–543 0.1 0.2 0.1 0.1 0.2 0.1 0.2 0.2 0.1 0.2 0.3 0.1Hernia of abdominal cavity and intestinalobstruction without mention of hernia . . . . . .550–553,560 2.4 1.8 2.9 2.5 1.8 3.1 1.9 1.8 1.9 2.3 2.3 2.4Chronic liver disease and cirrhosis. . . . . . . . . . . . . . .571 9.8 13.0 6.7 9.9 13.2 6.8 9.0 11.9 6.2 9.9 13.5 6.7Cholelithiasis and other disorders ofgallbladder . . . . . . . . . . . . . . . . . . . . . . . . .574–575 1.1 1.0 1.2 1.2 1.0 1.3 0.8 0.6 0.8 0.8 0.7 1.0Nephritis, nephrotic syndrome, and nephrosis. . . . .580–589 8.8 8.6 9.1 8.6 8.4 8.8 9.9 9.4 10.3 12.2 11.6 12.7Acute glomerulonephritis and nephroticsyndrome . . . . . . . . . . . . . . . . . . . . . . . . .580–581 0.1 0.1 0.1 0.1 0.1 0.1 0.1 0.2 0.1 0.2 0.2 0.1Chronic glomerulonephritis, nephritis andnephropathy, not specified as acute or chronic,and renal sclerosis, unspecified . . . . . . . .582–583,587 0.6 0.6 0.6 0.6 0.5 0.6 0.8 0.7 0.8 0.9 0.9 1.0
See footnotes at end of table.
44MonthlyVita
lStatistic
sReport+Vol.45,
No.3(S)
+September30,
1996
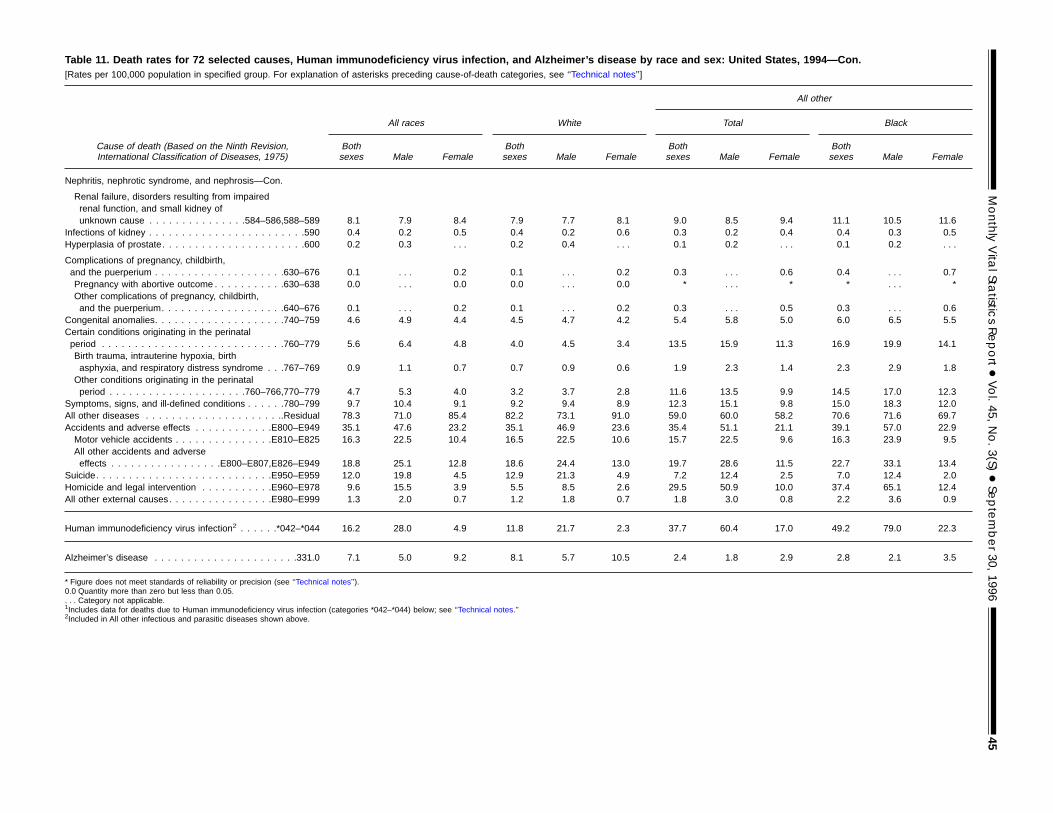
Table 11. Death rates for 72 selected causes, Human immunodeficiency virus infection, and Alzheimer’s disease by race and sex: United States, 1994—Con.[Rates per 100,000 population in specified group. For explanation of asterisks preceding cause-of-death categories, see ‘‘Technical notes’’]
Cause of death (Based on the Ninth Revision,International Classification of Diseases, 1975)
All other
All races White Total Black
Bothsexes Male Female
Bothsexes Male Female
Bothsexes Male Female
Bothsexes Male Female
Nephritis, nephrotic syndrome, and nephrosis—Con.
Renal failure, disorders resulting from impairedrenal function, and small kidney ofunknown cause . . . . . . . . . . . . . . .584–586,588–589 8.1 7.9 8.4 7.9 7.7 8.1 9.0 8.5 9.4 11.1 10.5 11.6
Infections of kidney . . . . . . . . . . . . . . . . . . . . . . . .590 0.4 0.2 0.5 0.4 0.2 0.6 0.3 0.2 0.4 0.4 0.3 0.5Hyperplasia of prostate. . . . . . . . . . . . . . . . . . . . . .600 0.2 0.3 . . . 0.2 0.4 . . . 0.1 0.2 . . . 0.1 0.2 . . .
Complications of pregnancy, childbirth,and the puerperium . . . . . . . . . . . . . . . . . . . .630–676 0.1 . . . 0.2 0.1 . . . 0.2 0.3 . . . 0.6 0.4 . . . 0.7Pregnancy with abortive outcome . . . . . . . . . . .630–638 0.0 . . . 0.0 0.0 . . . 0.0 * . . . * * . . . *Other complications of pregnancy, childbirth,and the puerperium. . . . . . . . . . . . . . . . . . .640–676 0.1 . . . 0.2 0.1 . . . 0.2 0.3 . . . 0.5 0.3 . . . 0.6
Congenital anomalies. . . . . . . . . . . . . . . . . . . .740–759 4.6 4.9 4.4 4.5 4.7 4.2 5.4 5.8 5.0 6.0 6.5 5.5Certain conditions originating in the perinatalperiod . . . . . . . . . . . . . . . . . . . . . . . . . . . .760–779 5.6 6.4 4.8 4.0 4.5 3.4 13.5 15.9 11.3 16.9 19.9 14.1Birth trauma, intrauterine hypoxia, birthasphyxia, and respiratory distress syndrome . . .767–769 0.9 1.1 0.7 0.7 0.9 0.6 1.9 2.3 1.4 2.3 2.9 1.8Other conditions originating in the perinatalperiod . . . . . . . . . . . . . . . . . . . . .760–766,770–779 4.7 5.3 4.0 3.2 3.7 2.8 11.6 13.5 9.9 14.5 17.0 12.3
Symptoms, signs, and ill-defined conditions . . . . . .780–799 9.7 10.4 9.1 9.2 9.4 8.9 12.3 15.1 9.8 15.0 18.3 12.0All other diseases . . . . . . . . . . . . . . . . . . . . ..Residual 78.3 71.0 85.4 82.2 73.1 91.0 59.0 60.0 58.2 70.6 71.6 69.7Accidents and adverse effects . . . . . . . . . . . .E800–E949 35.1 47.6 23.2 35.1 46.9 23.6 35.4 51.1 21.1 39.1 57.0 22.9Motor vehicle accidents . . . . . . . . . . . . . . .E810–E825 16.3 22.5 10.4 16.5 22.5 10.6 15.7 22.5 9.6 16.3 23.9 9.5All other accidents and adverseeffects . . . . . . . . . . . . . . . . .E800–E807,E826–E949 18.8 25.1 12.8 18.6 24.4 13.0 19.7 28.6 11.5 22.7 33.1 13.4
Suicide. . . . . . . . . . . . . . . . . . . . . . . . . . .E950–E959 12.0 19.8 4.5 12.9 21.3 4.9 7.2 12.4 2.5 7.0 12.4 2.0Homicide and legal intervention . . . . . . . . . . .E960–E978 9.6 15.5 3.9 5.5 8.5 2.6 29.5 50.9 10.0 37.4 65.1 12.4All other external causes. . . . . . . . . . . . . . . .E980–E999 1.3 2.0 0.7 1.2 1.8 0.7 1.8 3.0 0.8 2.2 3.6 0.9
Human immunodeficiency virus infection2 . . . . . .*042–*044 16.2 28.0 4.9 11.8 21.7 2.3 37.7 60.4 17.0 49.2 79.0 22.3
Alzheimer’s disease . . . . . . . . . . . . . . . . . . . . . .331.0 7.1 5.0 9.2 8.1 5.7 10.5 2.4 1.8 2.9 2.8 2.1 3.5
* Figure does not meet standards of reliability or precision (see ‘‘Technical notes’’).0.0 Quantity more than zero but less than 0.05.. . . Category not applicable.1Includes data for deaths due to Human immunodeficiency virus infection (categories *042–*044) below; see ‘‘Technical notes.’’2Included in All other infectious and parasitic diseases shown above.
MonthlyVita
lStatistic
sReport+Vol.45,
No.3(S)
+September30,
199645
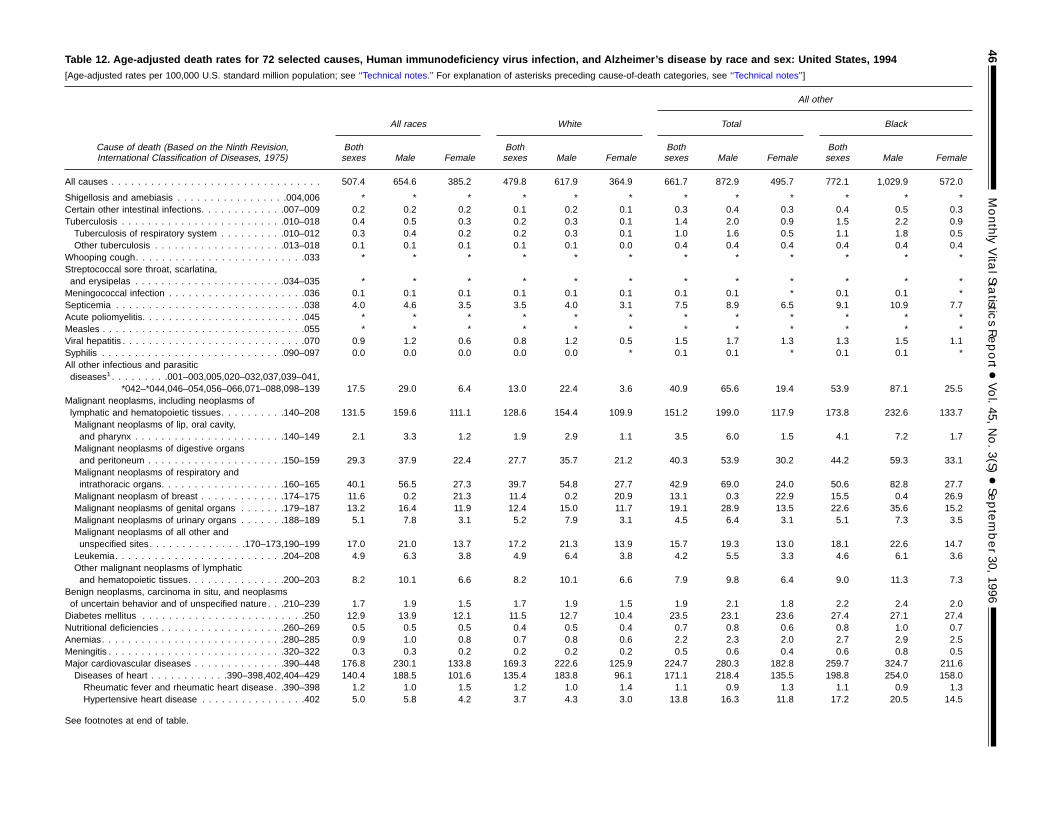
Table 12. Age-adjusted death rates for 72 selected causes, Human immunodeficiency virus infection, and Alzheimer’s disease by race and sex: United States, 1994[Age-adjusted rates per 100,000 U.S. standard million population; see ‘‘Technical notes.’’ For explanation of asterisks preceding cause-of-death categories, see ‘‘Technical notes’’]
Cause of death (Based on the Ninth Revision,International Classification of Diseases, 1975)
All other
All races White Total Black
Bothsexes Male Female
Bothsexes Male Female
Bothsexes Male Female
Bothsexes Male Female
All causes . . . . . . . . . . . . . . . . . . . . . . . . . . . . . . . . 507.4 654.6 385.2 479.8 617.9 364.9 661.7 872.9 495.7 772.1 1,029.9 572.0
Shigellosis and amebiasis . . . . . . . . . . . . . . . . .004,006 * * * * * * * * * * * *Certain other intestinal infections. . . . . . . . . . . . .007–009 0.2 0.2 0.2 0.1 0.2 0.1 0.3 0.4 0.3 0.4 0.5 0.3Tuberculosis . . . . . . . . . . . . . . . . . . . . . . . . .010–018 0.4 0.5 0.3 0.2 0.3 0.1 1.4 2.0 0.9 1.5 2.2 0.9Tuberculosis of respiratory system . . . . . . . . . .010–012 0.3 0.4 0.2 0.2 0.3 0.1 1.0 1.6 0.5 1.1 1.8 0.5Other tuberculosis . . . . . . . . . . . . . . . . . . . .013–018 0.1 0.1 0.1 0.1 0.1 0.0 0.4 0.4 0.4 0.4 0.4 0.4
Whooping cough. . . . . . . . . . . . . . . . . . . . . . . . . .033 * * * * * * * * * * * *Streptococcal sore throat, scarlatina,and erysipelas . . . . . . . . . . . . . . . . . . . . . . .034–035 * * * * * * * * * * * *Meningococcal infection . . . . . . . . . . . . . . . . . . . . .036 0.1 0.1 0.1 0.1 0.1 0.1 0.1 0.1 * 0.1 0.1 *Septicemia . . . . . . . . . . . . . . . . . . . . . . . . . . . . .038 4.0 4.6 3.5 3.5 4.0 3.1 7.5 8.9 6.5 9.1 10.9 7.7Acute poliomyelitis. . . . . . . . . . . . . . . . . . . . . . . . .045 * * * * * * * * * * * *Measles . . . . . . . . . . . . . . . . . . . . . . . . . . . . . . .055 * * * * * * * * * * * *Viral hepatitis . . . . . . . . . . . . . . . . . . . . . . . . . . . .070 0.9 1.2 0.6 0.8 1.2 0.5 1.5 1.7 1.3 1.3 1.5 1.1Syphilis . . . . . . . . . . . . . . . . . . . . . . . . . . . .090–097 0.0 0.0 0.0 0.0 0.0 * 0.1 0.1 * 0.1 0.1 *All other infectious and parasiticdiseases1. . . . . . . . .001–003,005,020–032,037,039–041,
*042–*044,046–054,056–066,071–088,098–139 17.5 29.0 6.4 13.0 22.4 3.6 40.9 65.6 19.4 53.9 87.1 25.5Malignant neoplasms, including neoplasms oflymphatic and hematopoietic tissues. . . . . . . . . .140–208 131.5 159.6 111.1 128.6 154.4 109.9 151.2 199.0 117.9 173.8 232.6 133.7Malignant neoplasms of lip, oral cavity,and pharynx . . . . . . . . . . . . . . . . . . . . . . .140–149 2.1 3.3 1.2 1.9 2.9 1.1 3.5 6.0 1.5 4.1 7.2 1.7Malignant neoplasms of digestive organsand peritoneum . . . . . . . . . . . . . . . . . . . . .150–159 29.3 37.9 22.4 27.7 35.7 21.2 40.3 53.9 30.2 44.2 59.3 33.1Malignant neoplasms of respiratory andintrathoracic organs. . . . . . . . . . . . . . . . . . .160–165 40.1 56.5 27.3 39.7 54.8 27.7 42.9 69.0 24.0 50.6 82.8 27.7Malignant neoplasm of breast . . . . . . . . . . . . .174–175 11.6 0.2 21.3 11.4 0.2 20.9 13.1 0.3 22.9 15.5 0.4 26.9Malignant neoplasms of genital organs . . . . . . .179–187 13.2 16.4 11.9 12.4 15.0 11.7 19.1 28.9 13.5 22.6 35.6 15.2Malignant neoplasms of urinary organs . . . . . . .188–189 5.1 7.8 3.1 5.2 7.9 3.1 4.5 6.4 3.1 5.1 7.3 3.5Malignant neoplasms of all other andunspecified sites. . . . . . . . . . . . . . .170–173,190–199 17.0 21.0 13.7 17.2 21.3 13.9 15.7 19.3 13.0 18.1 22.6 14.7Leukemia. . . . . . . . . . . . . . . . . . . . . . . . . .204–208 4.9 6.3 3.8 4.9 6.4 3.8 4.2 5.5 3.3 4.6 6.1 3.6Other malignant neoplasms of lymphaticand hematopoietic tissues. . . . . . . . . . . . . . .200–203 8.2 10.1 6.6 8.2 10.1 6.6 7.9 9.8 6.4 9.0 11.3 7.3
Benign neoplasms, carcinoma in situ, and neoplasmsof uncertain behavior and of unspecified nature . . .210–239 1.7 1.9 1.5 1.7 1.9 1.5 1.9 2.1 1.8 2.2 2.4 2.0Diabetes mellitus . . . . . . . . . . . . . . . . . . . . . . . . .250 12.9 13.9 12.1 11.5 12.7 10.4 23.5 23.1 23.6 27.4 27.1 27.4Nutritional deficiencies . . . . . . . . . . . . . . . . . . .260–269 0.5 0.5 0.5 0.4 0.5 0.4 0.7 0.8 0.6 0.8 1.0 0.7Anemias. . . . . . . . . . . . . . . . . . . . . . . . . . . .280–285 0.9 1.0 0.8 0.7 0.8 0.6 2.2 2.3 2.0 2.7 2.9 2.5Meningitis . . . . . . . . . . . . . . . . . . . . . . . . . . .320–322 0.3 0.3 0.2 0.2 0.2 0.2 0.5 0.6 0.4 0.6 0.8 0.5Major cardiovascular diseases . . . . . . . . . . . . . .390–448 176.8 230.1 133.8 169.3 222.6 125.9 224.7 280.3 182.8 259.7 324.7 211.6Diseases of heart . . . . . . . . . . . .390–398,402,404–429 140.4 188.5 101.6 135.4 183.8 96.1 171.1 218.4 135.5 198.8 254.0 158.0Rheumatic fever and rheumatic heart disease. .390–398 1.2 1.0 1.5 1.2 1.0 1.4 1.1 0.9 1.3 1.1 0.9 1.3Hypertensive heart disease . . . . . . . . . . . . . . . .402 5.0 5.8 4.2 3.7 4.3 3.0 13.8 16.3 11.8 17.2 20.5 14.5
See footnotes at end of table.
46MonthlyVita
lStatistic
sReport+Vol.45,
No.3(S)
+September30,
1996
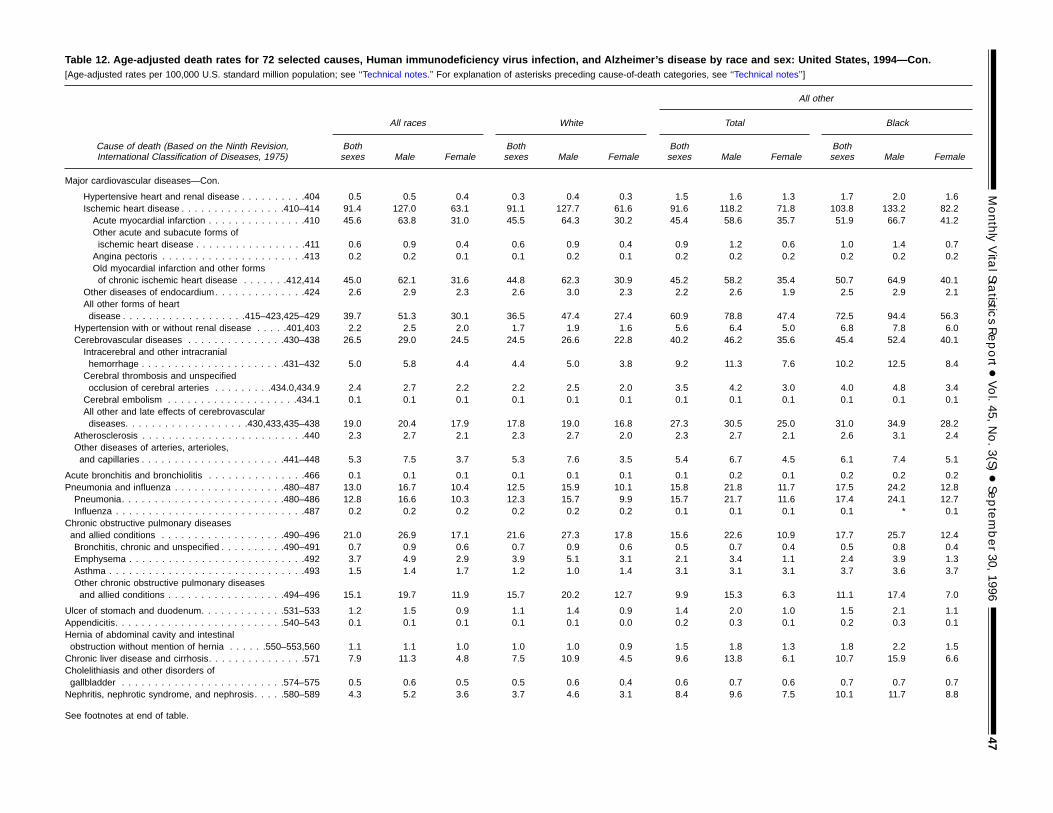
Table 12. Age-adjusted death rates for 72 selected causes, Human immunodeficiency virus infection, and Alzheimer’s disease by race and sex: United States, 1994—Con.[Age-adjusted rates per 100,000 U.S. standard million population; see ‘‘Technical notes.’’ For explanation of asterisks preceding cause-of-death categories, see ‘‘Technical notes’’]
Cause of death (Based on the Ninth Revision,International Classification of Diseases, 1975)
All other
All races White Total Black
Bothsexes Male Female
Bothsexes Male Female
Bothsexes Male Female
Bothsexes Male Female
Major cardiovascular diseases—Con.
Hypertensive heart and renal disease . . . . . . . . . .404 0.5 0.5 0.4 0.3 0.4 0.3 1.5 1.6 1.3 1.7 2.0 1.6Ischemic heart disease . . . . . . . . . . . . . . . .410–414 91.4 127.0 63.1 91.1 127.7 61.6 91.6 118.2 71.8 103.8 133.2 82.2Acute myocardial infarction . . . . . . . . . . . . . . .410 45.6 63.8 31.0 45.5 64.3 30.2 45.4 58.6 35.7 51.9 66.7 41.2Other acute and subacute forms ofischemic heart disease . . . . . . . . . . . . . . . . .411 0.6 0.9 0.4 0.6 0.9 0.4 0.9 1.2 0.6 1.0 1.4 0.7Angina pectoris . . . . . . . . . . . . . . . . . . . . . .413 0.2 0.2 0.1 0.1 0.2 0.1 0.2 0.2 0.2 0.2 0.2 0.2Old myocardial infarction and other formsof chronic ischemic heart disease . . . . . . .412,414 45.0 62.1 31.6 44.8 62.3 30.9 45.2 58.2 35.4 50.7 64.9 40.1
Other diseases of endocardium . . . . . . . . . . . . . .424 2.6 2.9 2.3 2.6 3.0 2.3 2.2 2.6 1.9 2.5 2.9 2.1All other forms of heartdisease . . . . . . . . . . . . . . . . . . .415–423,425–429 39.7 51.3 30.1 36.5 47.4 27.4 60.9 78.8 47.4 72.5 94.4 56.3
Hypertension with or without renal disease . . . . .401,403 2.2 2.5 2.0 1.7 1.9 1.6 5.6 6.4 5.0 6.8 7.8 6.0Cerebrovascular diseases . . . . . . . . . . . . . . .430–438 26.5 29.0 24.5 24.5 26.6 22.8 40.2 46.2 35.6 45.4 52.4 40.1Intracerebral and other intracranialhemorrhage . . . . . . . . . . . . . . . . . . . . . .431–432 5.0 5.8 4.4 4.4 5.0 3.8 9.2 11.3 7.6 10.2 12.5 8.4Cerebral thrombosis and unspecifiedocclusion of cerebral arteries . . . . . . . . .434.0,434.9 2.4 2.7 2.2 2.2 2.5 2.0 3.5 4.2 3.0 4.0 4.8 3.4Cerebral embolism . . . . . . . . . . . . . . . . . . . .434.1 0.1 0.1 0.1 0.1 0.1 0.1 0.1 0.1 0.1 0.1 0.1 0.1All other and late effects of cerebrovasculardiseases. . . . . . . . . . . . . . . . . . .430,433,435–438 19.0 20.4 17.9 17.8 19.0 16.8 27.3 30.5 25.0 31.0 34.9 28.2
Atherosclerosis . . . . . . . . . . . . . . . . . . . . . . . . .440 2.3 2.7 2.1 2.3 2.7 2.0 2.3 2.7 2.1 2.6 3.1 2.4Other diseases of arteries, arterioles,and capillaries . . . . . . . . . . . . . . . . . . . . . .441–448 5.3 7.5 3.7 5.3 7.6 3.5 5.4 6.7 4.5 6.1 7.4 5.1
Acute bronchitis and bronchiolitis . . . . . . . . . . . . . . .466 0.1 0.1 0.1 0.1 0.1 0.1 0.1 0.2 0.1 0.2 0.2 0.2Pneumonia and influenza . . . . . . . . . . . . . . . . .480–487 13.0 16.7 10.4 12.5 15.9 10.1 15.8 21.8 11.7 17.5 24.2 12.8Pneumonia. . . . . . . . . . . . . . . . . . . . . . . . .480–486 12.8 16.6 10.3 12.3 15.7 9.9 15.7 21.7 11.6 17.4 24.1 12.7Influenza . . . . . . . . . . . . . . . . . . . . . . . . . . . . .487 0.2 0.2 0.2 0.2 0.2 0.2 0.1 0.1 0.1 0.1 * 0.1
Chronic obstructive pulmonary diseasesand allied conditions . . . . . . . . . . . . . . . . . . .490–496 21.0 26.9 17.1 21.6 27.3 17.8 15.6 22.6 10.9 17.7 25.7 12.4Bronchitis, chronic and unspecified . . . . . . . . . .490–491 0.7 0.9 0.6 0.7 0.9 0.6 0.5 0.7 0.4 0.5 0.8 0.4Emphysema . . . . . . . . . . . . . . . . . . . . . . . . . . .492 3.7 4.9 2.9 3.9 5.1 3.1 2.1 3.4 1.1 2.4 3.9 1.3Asthma . . . . . . . . . . . . . . . . . . . . . . . . . . . . . .493 1.5 1.4 1.7 1.2 1.0 1.4 3.1 3.1 3.1 3.7 3.6 3.7Other chronic obstructive pulmonary diseasesand allied conditions . . . . . . . . . . . . . . . . . .494–496 15.1 19.7 11.9 15.7 20.2 12.7 9.9 15.3 6.3 11.1 17.4 7.0
Ulcer of stomach and duodenum. . . . . . . . . . . . .531–533 1.2 1.5 0.9 1.1 1.4 0.9 1.4 2.0 1.0 1.5 2.1 1.1Appendicitis. . . . . . . . . . . . . . . . . . . . . . . . . .540–543 0.1 0.1 0.1 0.1 0.1 0.0 0.2 0.3 0.1 0.2 0.3 0.1Hernia of abdominal cavity and intestinalobstruction without mention of hernia . . . . . .550–553,560 1.1 1.1 1.0 1.0 1.0 0.9 1.5 1.8 1.3 1.8 2.2 1.5Chronic liver disease and cirrhosis. . . . . . . . . . . . . . .571 7.9 11.3 4.8 7.5 10.9 4.5 9.6 13.8 6.1 10.7 15.9 6.6Cholelithiasis and other disorders ofgallbladder . . . . . . . . . . . . . . . . . . . . . . . . .574–575 0.5 0.6 0.5 0.5 0.6 0.4 0.6 0.7 0.6 0.7 0.7 0.7Nephritis, nephrotic syndrome, and nephrosis. . . . .580–589 4.3 5.2 3.6 3.7 4.6 3.1 8.4 9.6 7.5 10.1 11.7 8.8
See footnotes at end of table.
MonthlyVita
lStatistic
sReport+Vol.45,
No.3(S)
+September30,
199647
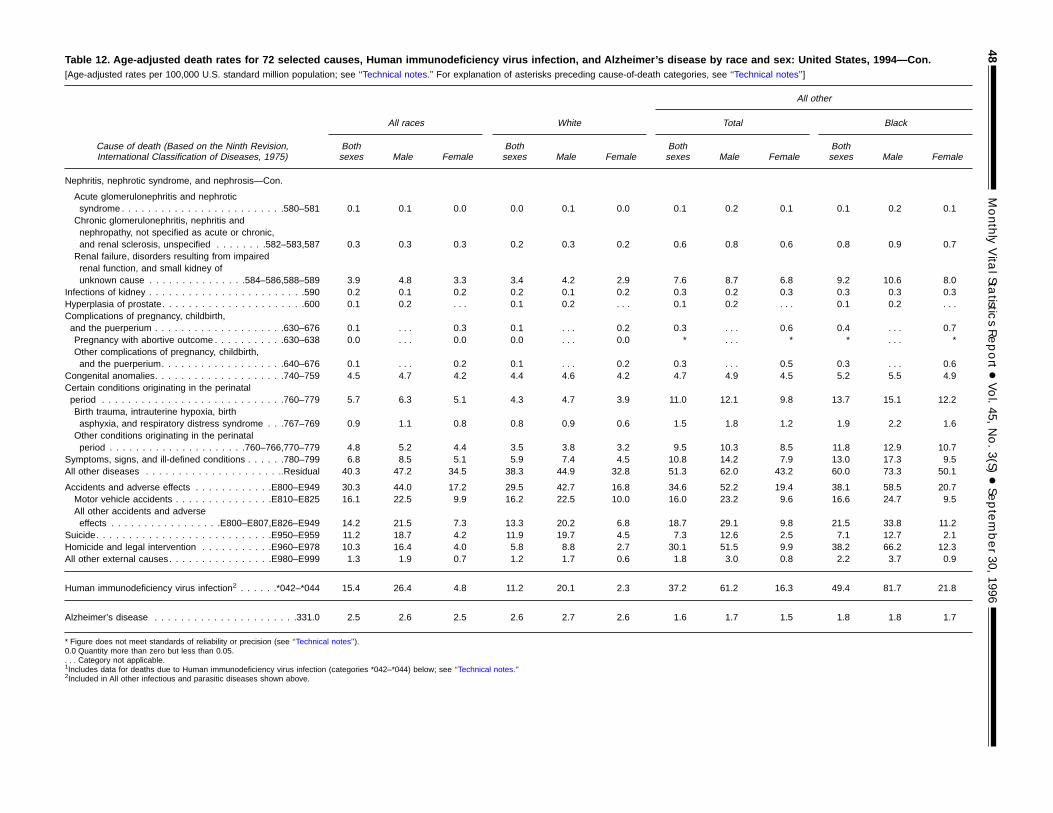
Table 12. Age-adjusted death rates for 72 selected causes, Human immunodeficiency virus infection, and Alzheimer’s disease by race and sex: United States, 1994—Con.[Age-adjusted rates per 100,000 U.S. standard million population; see ‘‘Technical notes.’’ For explanation of asterisks preceding cause-of-death categories, see ‘‘Technical notes’’]
Cause of death (Based on the Ninth Revision,International Classification of Diseases, 1975)
All other
All races White Total Black
Bothsexes Male Female
Bothsexes Male Female
Bothsexes Male Female
Bothsexes Male Female
Nephritis, nephrotic syndrome, and nephrosis—Con.
Acute glomerulonephritis and nephroticsyndrome . . . . . . . . . . . . . . . . . . . . . . . . .580–581 0.1 0.1 0.0 0.0 0.1 0.0 0.1 0.2 0.1 0.1 0.2 0.1Chronic glomerulonephritis, nephritis andnephropathy, not specified as acute or chronic,and renal sclerosis, unspecified . . . . . . . .582–583,587 0.3 0.3 0.3 0.2 0.3 0.2 0.6 0.8 0.6 0.8 0.9 0.7Renal failure, disorders resulting from impairedrenal function, and small kidney ofunknown cause . . . . . . . . . . . . . . .584–586,588–589 3.9 4.8 3.3 3.4 4.2 2.9 7.6 8.7 6.8 9.2 10.6 8.0
Infections of kidney . . . . . . . . . . . . . . . . . . . . . . . .590 0.2 0.1 0.2 0.2 0.1 0.2 0.3 0.2 0.3 0.3 0.3 0.3Hyperplasia of prostate. . . . . . . . . . . . . . . . . . . . . .600 0.1 0.2 . . . 0.1 0.2 . . . 0.1 0.2 . . . 0.1 0.2 . . .Complications of pregnancy, childbirth,and the puerperium . . . . . . . . . . . . . . . . . . . .630–676 0.1 . . . 0.3 0.1 . . . 0.2 0.3 . . . 0.6 0.4 . . . 0.7Pregnancy with abortive outcome . . . . . . . . . . .630–638 0.0 . . . 0.0 0.0 . . . 0.0 * . . . * * . . . *Other complications of pregnancy, childbirth,and the puerperium. . . . . . . . . . . . . . . . . . .640–676 0.1 . . . 0.2 0.1 . . . 0.2 0.3 . . . 0.5 0.3 . . . 0.6
Congenital anomalies. . . . . . . . . . . . . . . . . . . .740–759 4.5 4.7 4.2 4.4 4.6 4.2 4.7 4.9 4.5 5.2 5.5 4.9Certain conditions originating in the perinatalperiod . . . . . . . . . . . . . . . . . . . . . . . . . . . .760–779 5.7 6.3 5.1 4.3 4.7 3.9 11.0 12.1 9.8 13.7 15.1 12.2Birth trauma, intrauterine hypoxia, birthasphyxia, and respiratory distress syndrome . . .767–769 0.9 1.1 0.8 0.8 0.9 0.6 1.5 1.8 1.2 1.9 2.2 1.6Other conditions originating in the perinatalperiod . . . . . . . . . . . . . . . . . . . . .760–766,770–779 4.8 5.2 4.4 3.5 3.8 3.2 9.5 10.3 8.5 11.8 12.9 10.7
Symptoms, signs, and ill-defined conditions . . . . . .780–799 6.8 8.5 5.1 5.9 7.4 4.5 10.8 14.2 7.9 13.0 17.3 9.5All other diseases . . . . . . . . . . . . . . . . . . . . ..Residual 40.3 47.2 34.5 38.3 44.9 32.8 51.3 62.0 43.2 60.0 73.3 50.1
Accidents and adverse effects . . . . . . . . . . . .E800–E949 30.3 44.0 17.2 29.5 42.7 16.8 34.6 52.2 19.4 38.1 58.5 20.7Motor vehicle accidents . . . . . . . . . . . . . . .E810–E825 16.1 22.5 9.9 16.2 22.5 10.0 16.0 23.2 9.6 16.6 24.7 9.5All other accidents and adverseeffects . . . . . . . . . . . . . . . . .E800–E807,E826–E949 14.2 21.5 7.3 13.3 20.2 6.8 18.7 29.1 9.8 21.5 33.8 11.2
Suicide. . . . . . . . . . . . . . . . . . . . . . . . . . .E950–E959 11.2 18.7 4.2 11.9 19.7 4.5 7.3 12.6 2.5 7.1 12.7 2.1Homicide and legal intervention . . . . . . . . . . .E960–E978 10.3 16.4 4.0 5.8 8.8 2.7 30.1 51.5 9.9 38.2 66.2 12.3All other external causes. . . . . . . . . . . . . . . .E980–E999 1.3 1.9 0.7 1.2 1.7 0.6 1.8 3.0 0.8 2.2 3.7 0.9
Human immunodeficiency virus infection2 . . . . . .*042–*044 15.4 26.4 4.8 11.2 20.1 2.3 37.2 61.2 16.3 49.4 81.7 21.8
Alzheimer’s disease . . . . . . . . . . . . . . . . . . . . . .331.0 2.5 2.6 2.5 2.6 2.7 2.6 1.6 1.7 1.5 1.8 1.8 1.7
* Figure does not meet standards of reliability or precision (see ‘‘Technical notes’’).0.0 Quantity more than zero but less than 0.05.. . . Category not applicable.1Includes data for deaths due to Human immunodeficiency virus infection (categories *042–*044) below; see ‘‘Technical notes.’’2Included in All other infectious and parasitic diseases shown above.
48MonthlyVita
lStatistic
sReport+Vol.45,
No.3(S)
+September30,
1996
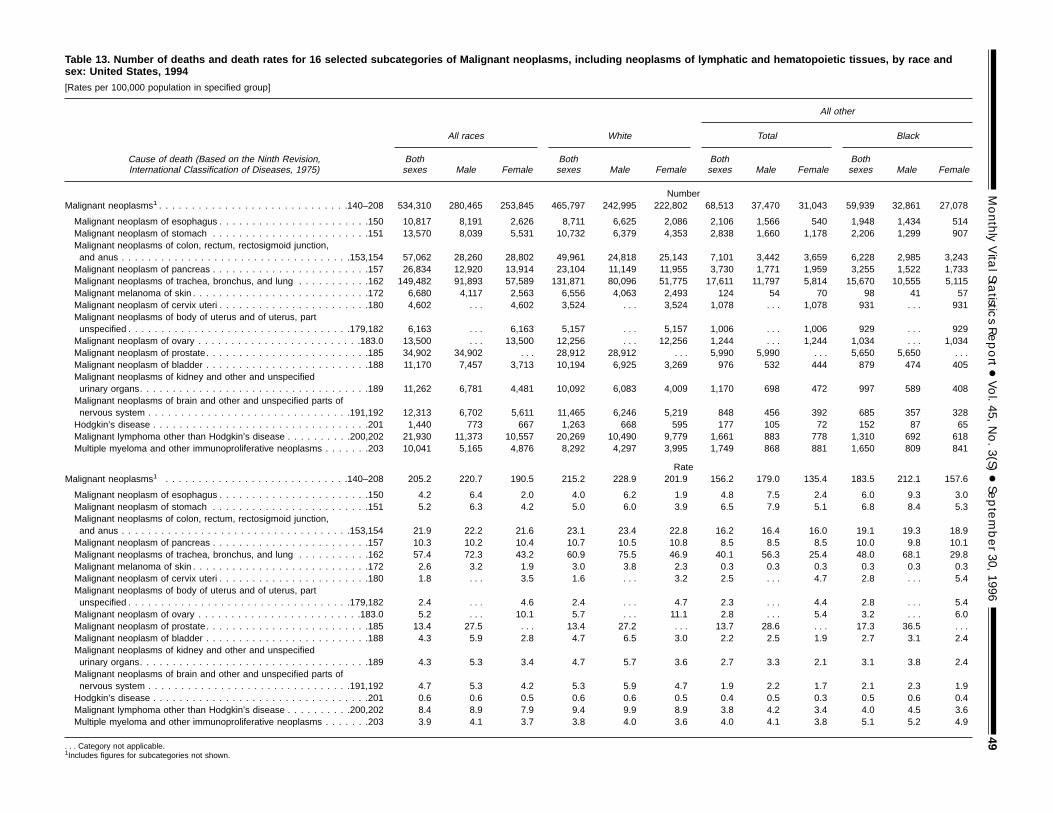
Table 13. Number of deaths and death rates for 16 selected subcategories of Malignant neoplasms, including neoplasms of lymphatic and hematopoietic tissues, by race andsex: United States, 1994[Rates per 100,000 population in specified group]
Cause of death (Based on the Ninth Revision,International Classification of Diseases, 1975)
All other
All races White Total Black
Bothsexes Male Female
Bothsexes Male Female
Bothsexes Male Female
Bothsexes Male Female
NumberMalignant neoplasms1 . . . . . . . . . . . . . . . . . . . . . . . . . . . . .140–208 534,310 280,465 253,845 465,797 242,995 222,802 68,513 37,470 31,043 59,939 32,861 27,078
Malignant neoplasm of esophagus . . . . . . . . . . . . . . . . . . . . . . .150 10,817 8,191 2,626 8,711 6,625 2,086 2,106 1,566 540 1,948 1,434 514Malignant neoplasm of stomach . . . . . . . . . . . . . . . . . . . . . . . .151 13,570 8,039 5,531 10,732 6,379 4,353 2,838 1,660 1,178 2,206 1,299 907Malignant neoplasms of colon, rectum, rectosigmoid junction,and anus . . . . . . . . . . . . . . . . . . . . . . . . . . . . . . . . . . .153,154 57,062 28,260 28,802 49,961 24,818 25,143 7,101 3,442 3,659 6,228 2,985 3,243Malignant neoplasm of pancreas . . . . . . . . . . . . . . . . . . . . . . . .157 26,834 12,920 13,914 23,104 11,149 11,955 3,730 1,771 1,959 3,255 1,522 1,733Malignant neoplasms of trachea, bronchus, and lung . . . . . . . . . . .162 149,482 91,893 57,589 131,871 80,096 51,775 17,611 11,797 5,814 15,670 10,555 5,115Malignant melanoma of skin . . . . . . . . . . . . . . . . . . . . . . . . . . .172 6,680 4,117 2,563 6,556 4,063 2,493 124 54 70 98 41 57Malignant neoplasm of cervix uteri . . . . . . . . . . . . . . . . . . . . . . .180 4,602 . . . 4,602 3,524 . . . 3,524 1,078 . . . 1,078 931 . . . 931Malignant neoplasms of body of uterus and of uterus, partunspecified . . . . . . . . . . . . . . . . . . . . . . . . . . . . . . . . . .179,182 6,163 . . . 6,163 5,157 . . . 5,157 1,006 . . . 1,006 929 . . . 929Malignant neoplasm of ovary . . . . . . . . . . . . . . . . . . . . . . . . .183.0 13,500 . . . 13,500 12,256 . . . 12,256 1,244 . . . 1,244 1,034 . . . 1,034Malignant neoplasm of prostate. . . . . . . . . . . . . . . . . . . . . . . . .185 34,902 34,902 . . . 28,912 28,912 . . . 5,990 5,990 . . . 5,650 5,650 . . .Malignant neoplasm of bladder . . . . . . . . . . . . . . . . . . . . . . . . .188 11,170 7,457 3,713 10,194 6,925 3,269 976 532 444 879 474 405Malignant neoplasms of kidney and other and unspecifiedurinary organs. . . . . . . . . . . . . . . . . . . . . . . . . . . . . . . . . . .189 11,262 6,781 4,481 10,092 6,083 4,009 1,170 698 472 997 589 408Malignant neoplasms of brain and other and unspecified parts ofnervous system . . . . . . . . . . . . . . . . . . . . . . . . . . . . . . .191,192 12,313 6,702 5,611 11,465 6,246 5,219 848 456 392 685 357 328Hodgkin’s disease . . . . . . . . . . . . . . . . . . . . . . . . . . . . . . . . .201 1,440 773 667 1,263 668 595 177 105 72 152 87 65Malignant lymphoma other than Hodgkin’s disease . . . . . . . . . .200,202 21,930 11,373 10,557 20,269 10,490 9,779 1,661 883 778 1,310 692 618Multiple myeloma and other immunoproliferative neoplasms . . . . . . .203 10,041 5,165 4,876 8,292 4,297 3,995 1,749 868 881 1,650 809 841
RateMalignant neoplasms1 . . . . . . . . . . . . . . . . . . . . . . . . . . . .140–208 205.2 220.7 190.5 215.2 228.9 201.9 156.2 179.0 135.4 183.5 212.1 157.6
Malignant neoplasm of esophagus . . . . . . . . . . . . . . . . . . . . . . .150 4.2 6.4 2.0 4.0 6.2 1.9 4.8 7.5 2.4 6.0 9.3 3.0Malignant neoplasm of stomach . . . . . . . . . . . . . . . . . . . . . . . .151 5.2 6.3 4.2 5.0 6.0 3.9 6.5 7.9 5.1 6.8 8.4 5.3Malignant neoplasms of colon, rectum, rectosigmoid junction,and anus . . . . . . . . . . . . . . . . . . . . . . . . . . . . . . . . . . .153,154 21.9 22.2 21.6 23.1 23.4 22.8 16.2 16.4 16.0 19.1 19.3 18.9Malignant neoplasm of pancreas . . . . . . . . . . . . . . . . . . . . . . . .157 10.3 10.2 10.4 10.7 10.5 10.8 8.5 8.5 8.5 10.0 9.8 10.1Malignant neoplasms of trachea, bronchus, and lung . . . . . . . . . . .162 57.4 72.3 43.2 60.9 75.5 46.9 40.1 56.3 25.4 48.0 68.1 29.8Malignant melanoma of skin . . . . . . . . . . . . . . . . . . . . . . . . . . .172 2.6 3.2 1.9 3.0 3.8 2.3 0.3 0.3 0.3 0.3 0.3 0.3Malignant neoplasm of cervix uteri . . . . . . . . . . . . . . . . . . . . . . .180 1.8 . . . 3.5 1.6 . . . 3.2 2.5 . . . 4.7 2.8 . . . 5.4Malignant neoplasms of body of uterus and of uterus, partunspecified . . . . . . . . . . . . . . . . . . . . . . . . . . . . . . . . . .179,182 2.4 . . . 4.6 2.4 . . . 4.7 2.3 . . . 4.4 2.8 . . . 5.4Malignant neoplasm of ovary . . . . . . . . . . . . . . . . . . . . . . . . .183.0 5.2 . . . 10.1 5.7 . . . 11.1 2.8 . . . 5.4 3.2 . . . 6.0Malignant neoplasm of prostate. . . . . . . . . . . . . . . . . . . . . . . . .185 13.4 27.5 . . . 13.4 27.2 . . . 13.7 28.6 . . . 17.3 36.5 . . .Malignant neoplasm of bladder . . . . . . . . . . . . . . . . . . . . . . . . .188 4.3 5.9 2.8 4.7 6.5 3.0 2.2 2.5 1.9 2.7 3.1 2.4Malignant neoplasms of kidney and other and unspecifiedurinary organs. . . . . . . . . . . . . . . . . . . . . . . . . . . . . . . . . . .189 4.3 5.3 3.4 4.7 5.7 3.6 2.7 3.3 2.1 3.1 3.8 2.4Malignant neoplasms of brain and other and unspecified parts ofnervous system . . . . . . . . . . . . . . . . . . . . . . . . . . . . . . .191,192 4.7 5.3 4.2 5.3 5.9 4.7 1.9 2.2 1.7 2.1 2.3 1.9Hodgkin’s disease . . . . . . . . . . . . . . . . . . . . . . . . . . . . . . . . .201 0.6 0.6 0.5 0.6 0.6 0.5 0.4 0.5 0.3 0.5 0.6 0.4Malignant lymphoma other than Hodgkin’s disease . . . . . . . . . .200,202 8.4 8.9 7.9 9.4 9.9 8.9 3.8 4.2 3.4 4.0 4.5 3.6Multiple myeloma and other immunoproliferative neoplasms . . . . . . .203 3.9 4.1 3.7 3.8 4.0 3.6 4.0 4.1 3.8 5.1 5.2 4.9
. . . Category not applicable.1Includes figures for subcategories not shown.
MonthlyVita
lStatistic
sReport+Vol.45,
No.3(S)
+September30,
199649
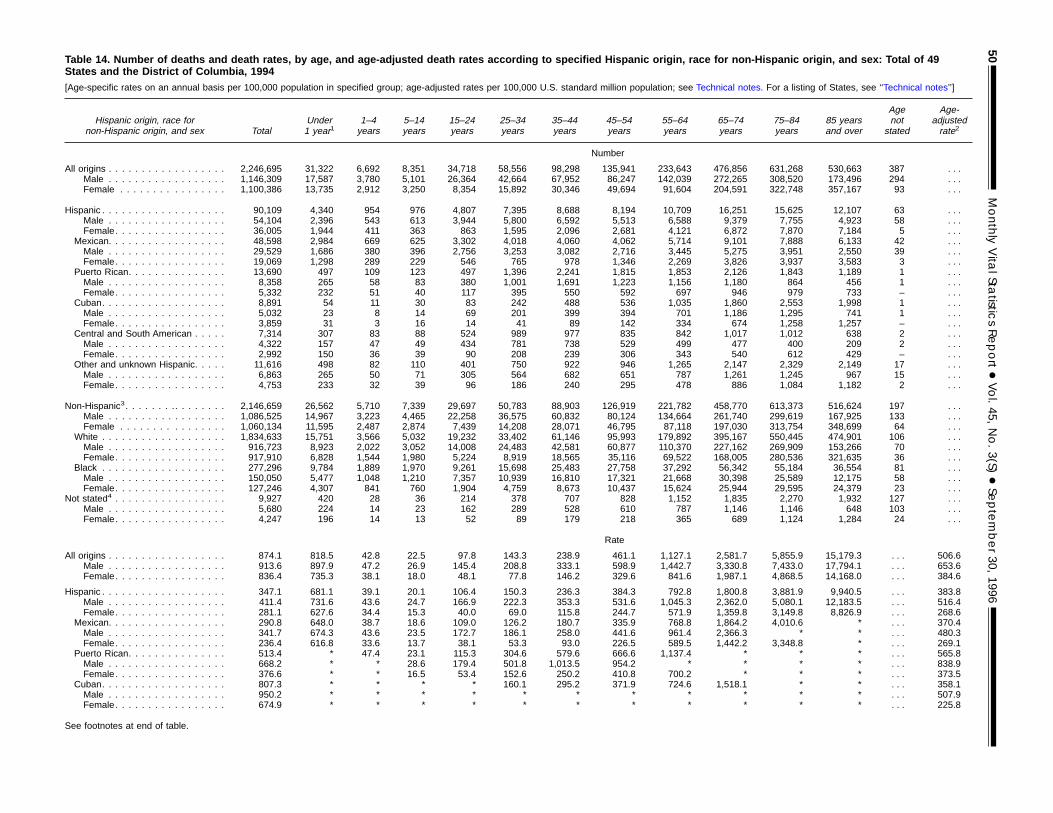
Table 14. Number of deaths and death rates, by age, and age-adjusted death rates according to specified Hispanic origin, race for non-Hispanic origin, and sex: Total of 49States and the District of Columbia, 1994[Age-specific rates on an annual basis per 100,000 population in specified group; age-adjusted rates per 100,000 U.S. standard million population; see Technical notes. For a listing of States, see ‘‘Technical notes’’]
Hispanic origin, race fornon-Hispanic origin, and sex Total
Under1 year1
1–4years
5–14years
15–24years
25–34years
35–44years
45–54years
55–64years
65–74years
75–84years
85 yearsand over
Agenot
stated
Age-adjustedrate2
Number
All origins . . . . . . . . . . . . . . . . . . 2,246,695 31,322 6,692 8,351 34,718 58,556 98,298 135,941 233,643 476,856 631,268 530,663 387 . . .Male . . . . . . . . . . . . . . . . . . 1,146,309 17,587 3,780 5,101 26,364 42,664 67,952 86,247 142,039 272,265 308,520 173,496 294 . . .Female . . . . . . . . . . . . . . . . 1,100,386 13,735 2,912 3,250 8,354 15,892 30,346 49,694 91,604 204,591 322,748 357,167 93 . . .
Hispanic . . . . . . . . . . . . . . . . . . . 90,109 4,340 954 976 4,807 7,395 8,688 8,194 10,709 16,251 15,625 12,107 63 . . .Male . . . . . . . . . . . . . . . . . . 54,104 2,396 543 613 3,944 5,800 6,592 5,513 6,588 9,379 7,755 4,923 58 . . .Female. . . . . . . . . . . . . . . . . 36,005 1,944 411 363 863 1,595 2,096 2,681 4,121 6,872 7,870 7,184 5 . . .
Mexican. . . . . . . . . . . . . . . . . . 48,598 2,984 669 625 3,302 4,018 4,060 4,062 5,714 9,101 7,888 6,133 42 . . .Male . . . . . . . . . . . . . . . . . . 29,529 1,686 380 396 2,756 3,253 3,082 2,716 3,445 5,275 3,951 2,550 39 . . .Female. . . . . . . . . . . . . . . . . 19,069 1,298 289 229 546 765 978 1,346 2,269 3,826 3,937 3,583 3 . . .
Puerto Rican. . . . . . . . . . . . . . . 13,690 497 109 123 497 1,396 2,241 1,815 1,853 2,126 1,843 1,189 1 . . .Male . . . . . . . . . . . . . . . . . . 8,358 265 58 83 380 1,001 1,691 1,223 1,156 1,180 864 456 1 . . .Female. . . . . . . . . . . . . . . . . 5,332 232 51 40 117 395 550 592 697 946 979 733 – . . .
Cuban. . . . . . . . . . . . . . . . . . . 8,891 54 11 30 83 242 488 536 1,035 1,860 2,553 1,998 1 . . .Male . . . . . . . . . . . . . . . . . . 5,032 23 8 14 69 201 399 394 701 1,186 1,295 741 1 . . .Female. . . . . . . . . . . . . . . . . 3,859 31 3 16 14 41 89 142 334 674 1,258 1,257 – . . .
Central and South American . . . . . 7,314 307 83 88 524 989 977 835 842 1,017 1,012 638 2 . . .Male . . . . . . . . . . . . . . . . . . 4,322 157 47 49 434 781 738 529 499 477 400 209 2 . . .Female. . . . . . . . . . . . . . . . . 2,992 150 36 39 90 208 239 306 343 540 612 429 – . . .
Other and unknown Hispanic. . . . . 11,616 498 82 110 401 750 922 946 1,265 2,147 2,329 2,149 17 . . .Male . . . . . . . . . . . . . . . . . . 6,863 265 50 71 305 564 682 651 787 1,261 1,245 967 15 . . .Female. . . . . . . . . . . . . . . . . 4,753 233 32 39 96 186 240 295 478 886 1,084 1,182 2 . . .
Non-Hispanic3. . . . . . . .. . . . . . . . 2,146,659 26,562 5,710 7,339 29,697 50,783 88,903 126,919 221,782 458,770 613,373 516,624 197 . . .Male . . . . . . . . . . . . . . . . . . 1,086,525 14,967 3,223 4,465 22,258 36,575 60,832 80,124 134,664 261,740 299,619 167,925 133 . . .Female . . . . . . . . . . . . . . . . 1,060,134 11,595 2,487 2,874 7,439 14,208 28,071 46,795 87,118 197,030 313,754 348,699 64 . . .
White . . . . . . . . . . . . . . . . . . . 1,834,633 15,751 3,566 5,032 19,232 33,402 61,146 95,993 179,892 395,167 550,445 474,901 106 . . .Male . . . . . . . . . . . . . . . . . . 916,723 8,923 2,022 3,052 14,008 24,483 42,581 60,877 110,370 227,162 269,909 153,266 70 . . .Female. . . . . . . . . . . . . . . . . 917,910 6,828 1,544 1,980 5,224 8,919 18,565 35,116 69,522 168,005 280,536 321,635 36 . . .
Black . . . . . . . . . . . . . . . . . . . 277,296 9,784 1,889 1,970 9,261 15,698 25,483 27,758 37,292 56,342 55,184 36,554 81 . . .Male . . . . . . . . . . . . . . . . . . 150,050 5,477 1,048 1,210 7,357 10,939 16,810 17,321 21,668 30,398 25,589 12,175 58 . . .Female. . . . . . . . . . . . . . . . . 127,246 4,307 841 760 1,904 4,759 8,673 10,437 15,624 25,944 29,595 24,379 23 . . .
Not stated4 . . . . . . . . . . . . . . . . . 9,927 420 28 36 214 378 707 828 1,152 1,835 2,270 1,932 127 . . .Male . . . . . . . . . . . . . . . . . . 5,680 224 14 23 162 289 528 610 787 1,146 1,146 648 103 . . .Female. . . . . . . . . . . . . . . . . 4,247 196 14 13 52 89 179 218 365 689 1,124 1,284 24 . . .
Rate
All origins . . . . . . . . . . . . . . . . . . 874.1 818.5 42.8 22.5 97.8 143.3 238.9 461.1 1,127.1 2,581.7 5,855.9 15,179.3 . . . 506.6Male . . . . . . . . . . . . . . . . . . 913.6 897.9 47.2 26.9 145.4 208.8 333.1 598.9 1,442.7 3,330.8 7,433.0 17,794.1 . . . 653.6Female. . . . . . . . . . . . . . . . . 836.4 735.3 38.1 18.0 48.1 77.8 146.2 329.6 841.6 1,987.1 4,868.5 14,168.0 . . . 384.6
Hispanic . . . . . . . . . . . . . . . . . . . 347.1 681.1 39.1 20.1 106.4 150.3 236.3 384.3 792.8 1,800.8 3,881.9 9,940.5 . . . 383.8Male . . . . . . . . . . . . . . . . . . 411.4 731.6 43.6 24.7 166.9 222.3 353.3 531.6 1,045.3 2,362.0 5,080.1 12,183.5 . . . 516.4Female. . . . . . . . . . . . . . . . . 281.1 627.6 34.4 15.3 40.0 69.0 115.8 244.7 571.9 1,359.8 3,149.8 8,826.9 . . . 268.6
Mexican. . . . . . . . . . . . . . . . . . 290.8 648.0 38.7 18.6 109.0 126.2 180.7 335.9 768.8 1,864.2 4,010.6 * . . . 370.4Male . . . . . . . . . . . . . . . . . . 341.7 674.3 43.6 23.5 172.7 186.1 258.0 441.6 961.4 2,366.3 * * . . . 480.3Female. . . . . . . . . . . . . . . . . 236.4 616.8 33.6 13.7 38.1 53.3 93.0 226.5 589.5 1,442.2 3,348.8 * . . . 269.1
Puerto Rican. . . . . . . . . . . . . . . 513.4 * 47.4 23.1 115.3 304.6 579.6 666.6 1,137.4 * * * . . . 565.8Male . . . . . . . . . . . . . . . . . . 668.2 * * 28.6 179.4 501.8 1,013.5 954.2 * * * * . . . 838.9Female. . . . . . . . . . . . . . . . . 376.6 * * 16.5 53.4 152.6 250.2 410.8 700.2 * * * . . . 373.5
Cuban. . . . . . . . . . . . . . . . . . . 807.3 * * * * 160.1 295.2 371.9 724.6 1,518.1 * * . . . 358.1Male . . . . . . . . . . . . . . . . . . 950.2 * * * * * * * * * * * . . . 507.9Female. . . . . . . . . . . . . . . . . 674.9 * * * * * * * * * * * . . . 225.8
See footnotes at end of table.
50MonthlyVita
lStatistic
sReport+Vol.45,
No.3(S)
+September30,
1996
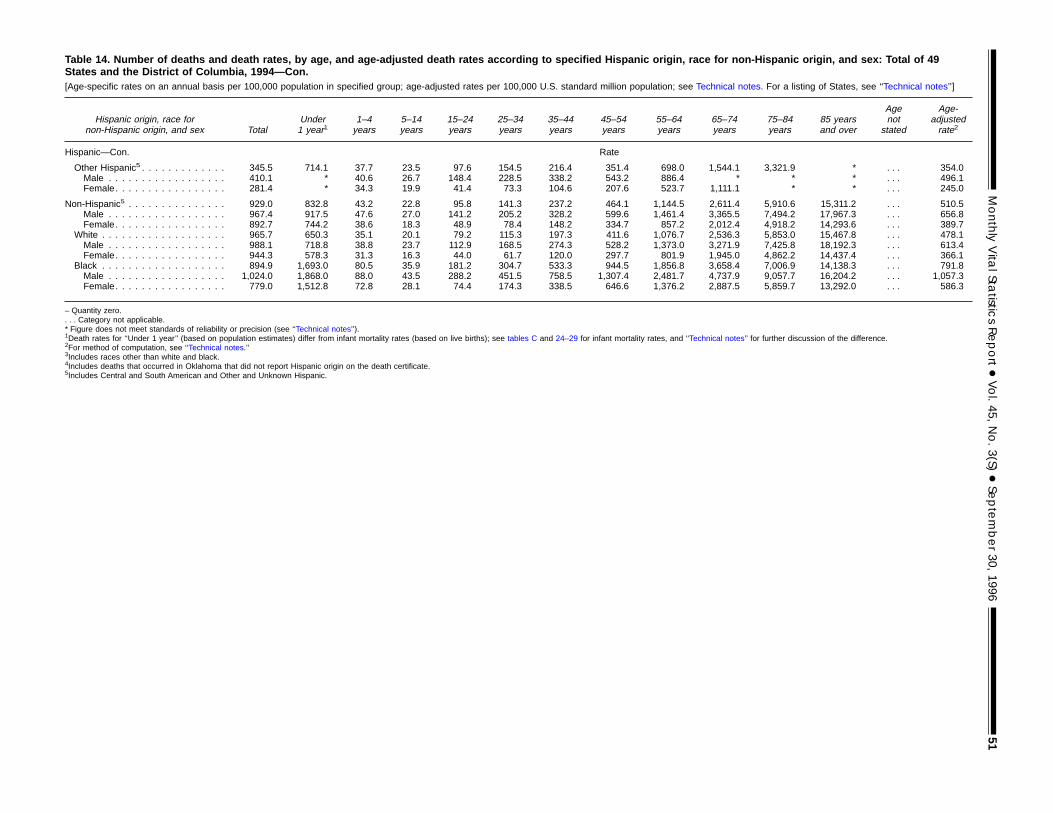
Table 14. Number of deaths and death rates, by age, and age-adjusted death rates according to specified Hispanic origin, race for non-Hispanic origin, and sex: Total of 49States and the District of Columbia, 1994—Con.[Age-specific rates on an annual basis per 100,000 population in specified group; age-adjusted rates per 100,000 U.S. standard million population; see Technical notes. For a listing of States, see ‘‘Technical notes’’]
Hispanic origin, race fornon-Hispanic origin, and sex Total
Under1 year1
1–4years
5–14years
15–24years
25–34years
35–44years
45–54years
55–64years
65–74years
75–84years
85 yearsand over
Agenot
stated
Age-adjustedrate2
Hispanic—Con. Rate
Other Hispanic5 . . . . . . . . . . . . . 345.5 714.1 37.7 23.5 97.6 154.5 216.4 351.4 698.0 1,544.1 3,321.9 * . . . 354.0Male . . . . . . . . . . . . . . . . . . 410.1 * 40.6 26.7 148.4 228.5 338.2 543.2 886.4 * * * . . . 496.1Female. . . . . . . . . . . . . . . . . 281.4 * 34.3 19.9 41.4 73.3 104.6 207.6 523.7 1,111.1 * * . . . 245.0
Non-Hispanic5 . . . . . . . . . . . . . . . 929.0 832.8 43.2 22.8 95.8 141.3 237.2 464.1 1,144.5 2,611.4 5,910.6 15,311.2 . . . 510.5Male . . . . . . . . . . . . . . . . . . 967.4 917.5 47.6 27.0 141.2 205.2 328.2 599.6 1,461.4 3,365.5 7,494.2 17,967.3 . . . 656.8Female. . . . . . . . . . . . . . . . . 892.7 744.2 38.6 18.3 48.9 78.4 148.2 334.7 857.2 2,012.4 4,918.2 14,293.6 . . . 389.7
White . . . . . . . . . . . . . . . . . . . 965.7 650.3 35.1 20.1 79.2 115.3 197.3 411.6 1,076.7 2,536.3 5,853.0 15,467.8 . . . 478.1Male . . . . . . . . . . . . . . . . . . 988.1 718.8 38.8 23.7 112.9 168.5 274.3 528.2 1,373.0 3,271.9 7,425.8 18,192.3 . . . 613.4Female. . . . . . . . . . . . . . . . . 944.3 578.3 31.3 16.3 44.0 61.7 120.0 297.7 801.9 1,945.0 4,862.2 14,437.4 . . . 366.1
Black . . . . . . . . . . . . . . . . . . . 894.9 1,693.0 80.5 35.9 181.2 304.7 533.3 944.5 1,856.8 3,658.4 7,006.9 14,138.3 . . . 791.8Male . . . . . . . . . . . . . . . . . . 1,024.0 1,868.0 88.0 43.5 288.2 451.5 758.5 1,307.4 2,481.7 4,737.9 9,057.7 16,204.2 . . . 1,057.3Female. . . . . . . . . . . . . . . . . 779.0 1,512.8 72.8 28.1 74.4 174.3 338.5 646.6 1,376.2 2,887.5 5,859.7 13,292.0 . . . 586.3
– Quantity zero.. . . Category not applicable.* Figure does not meet standards of reliability or precision (see ‘‘Technical notes’’).1Death rates for ‘‘Under 1 year’’ (based on population estimates) differ from infant mortality rates (based on live births); see tables C and 24–29 for infant mortality rates, and ‘‘Technical notes’’ for further discussion of the difference.2For method of computation, see ‘‘Technical notes.’’3Includes races other than white and black.4Includes deaths that occurred in Oklahoma that did not report Hispanic origin on the death certificate.5Includes Central and South American and Other and Unknown Hispanic.
MonthlyVita
lStatistic
sReport+Vol.45,
No.3(S)
+September30,
199651
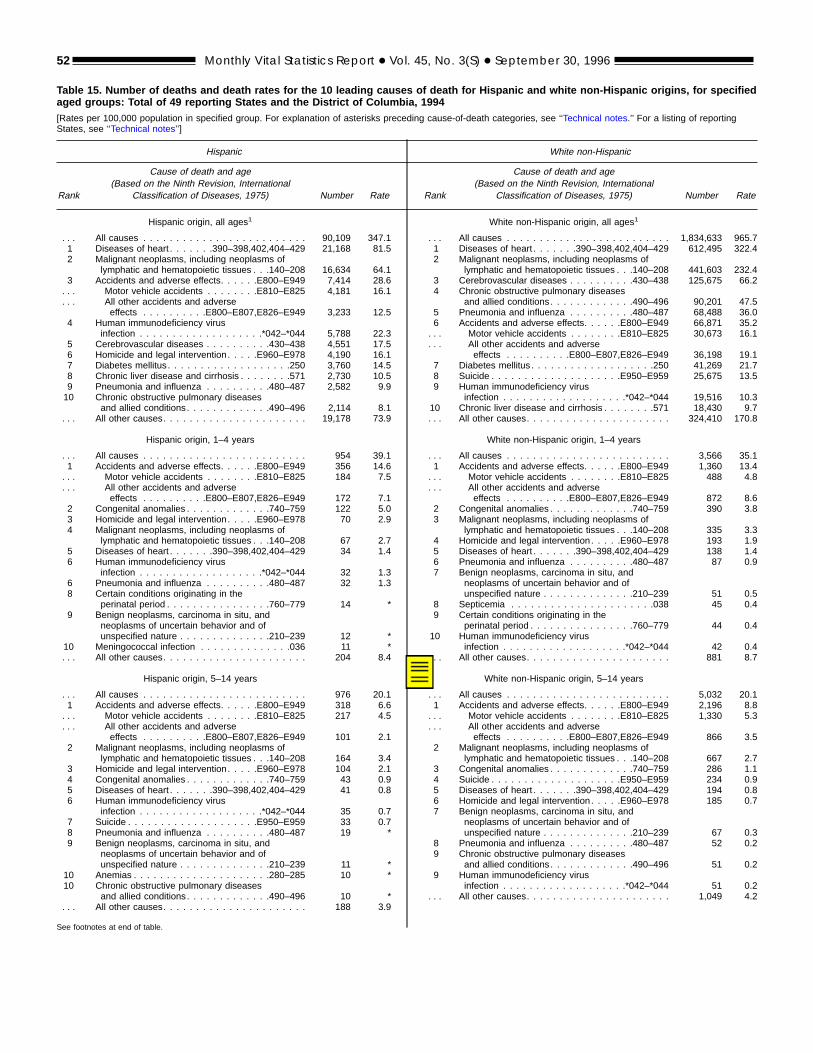
Table 15. Number of deaths and death rates for the 10 leading causes of death for Hispanic and white non-Hispanic origins, for specifiedaged groups: Total of 49 reporting States and the District of Columbia, 1994[Rates per 100,000 population in specified group. For explanation of asterisks preceding cause-of-death categories, see ‘‘Technical notes.’’ For a listing of reportingStates, see ‘‘Technical notes’’]
Hispanic
Rank
Cause of death and age(Based on the Ninth Revision, International
Classification of Diseases, 1975) Number Rate
Hispanic origin, all ages1
. . . All causes . . . . . . . . . . . . . . . . . . . . . . . . . 90,109 347.11 Diseases of heart . . . . . . .390–398,402,404–429 21,168 81.52 Malignant neoplasms, including neoplasms of
lymphatic and hematopoietic tissues . . .140–208 16,634 64.13 Accidents and adverse effects. . . . . .E800–E949 7,414 28.6. . . Motor vehicle accidents . . . . . . . .E810–E825 4,181 16.1. . . All other accidents and adverse
effects . . . . . . . . . .E800–E807,E826–E949 3,233 12.54 Human immunodeficiency virus
infection . . . . . . . . . . . . . . . . . . .*042–*044 5,788 22.35 Cerebrovascular diseases . . . . . . . . . .430–438 4,551 17.56 Homicide and legal intervention. . . . .E960–E978 4,190 16.17 Diabetes mellitus. . . . . . . . . . . . . . . . . . .250 3,760 14.58 Chronic liver disease and cirrhosis . . . . . . . .571 2,730 10.59 Pneumonia and influenza . . . . . . . . . .480–487 2,582 9.910 Chronic obstructive pulmonary diseases
and allied conditions. . . . . . . . . . . . .490–496 2,114 8.1. . . All other causes. . . . . . . . . . . . . . . . . . . . . . 19,178 73.9
Hispanic origin, 1–4 years
. . . All causes . . . . . . . . . . . . . . . . . . . . . . . . . 954 39.11 Accidents and adverse effects. . . . . .E800–E949 356 14.6. . . Motor vehicle accidents . . . . . . . .E810–E825 184 7.5. . . All other accidents and adverse
effects . . . . . . . . . .E800–E807,E826–E949 172 7.12 Congenital anomalies . . . . . . . . . . . . .740–759 122 5.03 Homicide and legal intervention. . . . .E960–E978 70 2.94 Malignant neoplasms, including neoplasms of
lymphatic and hematopoietic tissues . . .140–208 67 2.75 Diseases of heart . . . . . . .390–398,402,404–429 34 1.46 Human immunodeficiency virus
infection . . . . . . . . . . . . . . . . . . .*042–*044 32 1.36 Pneumonia and influenza . . . . . . . . . .480–487 32 1.38 Certain conditions originating in the
perinatal period . . . . . . . . . . . . . . . .760–779 14 *9 Benign neoplasms, carcinoma in situ, and
neoplasms of uncertain behavior and ofunspecified nature . . . . . . . . . . . . . .210–239 12 *
10 Meningococcal infection . . . . . . . . . . . . . .036 11 *. . . All other causes. . . . . . . . . . . . . . . . . . . . . . 204 8.4
Hispanic origin, 5–14 years
. . . All causes . . . . . . . . . . . . . . . . . . . . . . . . . 976 20.11 Accidents and adverse effects. . . . . .E800–E949 318 6.6. . . Motor vehicle accidents . . . . . . . .E810–E825 217 4.5. . . All other accidents and adverse
effects . . . . . . . . . .E800–E807,E826–E949 101 2.12 Malignant neoplasms, including neoplasms of
lymphatic and hematopoietic tissues . . .140–208 164 3.43 Homicide and legal intervention. . . . .E960–E978 104 2.14 Congenital anomalies . . . . . . . . . . . . .740–759 43 0.95 Diseases of heart . . . . . . .390–398,402,404–429 41 0.86 Human immunodeficiency virus
infection . . . . . . . . . . . . . . . . . . .*042–*044 35 0.77 Suicide . . . . . . . . . . . . . . . . . . . .E950–E959 33 0.78 Pneumonia and influenza . . . . . . . . . .480–487 19 *9 Benign neoplasms, carcinoma in situ, and
neoplasms of uncertain behavior and ofunspecified nature . . . . . . . . . . . . . .210–239 11 *
10 Anemias . . . . . . . . . . . . . . . . . . . . .280–285 10 *10 Chronic obstructive pulmonary diseases
and allied conditions. . . . . . . . . . . . .490–496 10 *. . . All other causes. . . . . . . . . . . . . . . . . . . . . . 188 3.9
See footnotes at end of table.
White non-Hispanic
Rank
Cause of death and age(Based on the Ninth Revision, International
Classification of Diseases, 1975) Number Rate
White non-Hispanic origin, all ages1
. . . All causes . . . . . . . . . . . . . . . . . . . . . . . . . 1,834,633 965.71 Diseases of heart . . . . . . .390–398,402,404–429 612,495 322.42 Malignant neoplasms, including neoplasms of
lymphatic and hematopoietic tissues . . .140–208 441,603 232.43 Cerebrovascular diseases . . . . . . . . . .430–438 125,675 66.24 Chronic obstructive pulmonary diseases
and allied conditions. . . . . . . . . . . . .490–496 90,201 47.55 Pneumonia and influenza . . . . . . . . . .480–487 68,488 36.06 Accidents and adverse effects. . . . . .E800–E949 66,871 35.2. . . Motor vehicle accidents . . . . . . . .E810–E825 30,673 16.1. . . All other accidents and adverse
effects . . . . . . . . . .E800–E807,E826–E949 36,198 19.17 Diabetes mellitus. . . . . . . . . . . . . . . . . . .250 41,269 21.78 Suicide . . . . . . . . . . . . . . . . . . . .E950–E959 25,675 13.59 Human immunodeficiency virus
infection . . . . . . . . . . . . . . . . . . .*042–*044 19,516 10.310 Chronic liver disease and cirrhosis . . . . . . . .571 18,430 9.7. . . All other causes. . . . . . . . . . . . . . . . . . . . . . 324,410 170.8
White non-Hispanic origin, 1–4 years
. . . All causes . . . . . . . . . . . . . . . . . . . . . . . . . 3,566 35.11 Accidents and adverse effects. . . . . .E800–E949 1,360 13.4. . . Motor vehicle accidents . . . . . . . .E810–E825 488 4.8. . . All other accidents and adverse
effects . . . . . . . . . .E800–E807,E826–E949 872 8.62 Congenital anomalies . . . . . . . . . . . . .740–759 390 3.83 Malignant neoplasms, including neoplasms of
lymphatic and hematopoietic tissues . . .140–208 335 3.34 Homicide and legal intervention. . . . .E960–E978 193 1.95 Diseases of heart . . . . . . .390–398,402,404–429 138 1.46 Pneumonia and influenza . . . . . . . . . .480–487 87 0.97 Benign neoplasms, carcinoma in situ, and
neoplasms of uncertain behavior and ofunspecified nature . . . . . . . . . . . . . .210–239 51 0.5
8 Septicemia . . . . . . . . . . . . . . . . . . . . . .038 45 0.49 Certain conditions originating in the
perinatal period . . . . . . . . . . . . . . . .760–779 44 0.410 Human immunodeficiency virus
infection . . . . . . . . . . . . . . . . . . .*042–*044 42 0.4. . . All other causes. . . . . . . . . . . . . . . . . . . . . . 881 8.7
White non-Hispanic origin, 5–14 years
. . . All causes . . . . . . . . . . . . . . . . . . . . . . . . . 5,032 20.11 Accidents and adverse effects. . . . . .E800–E949 2,196 8.8. . . Motor vehicle accidents . . . . . . . .E810–E825 1,330 5.3. . . All other accidents and adverse
effects . . . . . . . . . .E800–E807,E826–E949 866 3.52 Malignant neoplasms, including neoplasms of
lymphatic and hematopoietic tissues . . .140–208 667 2.73 Congenital anomalies . . . . . . . . . . . . .740–759 286 1.14 Suicide . . . . . . . . . . . . . . . . . . . .E950–E959 234 0.95 Diseases of heart . . . . . . .390–398,402,404–429 194 0.86 Homicide and legal intervention. . . . .E960–E978 185 0.77 Benign neoplasms, carcinoma in situ, and
neoplasms of uncertain behavior and ofunspecified nature . . . . . . . . . . . . . .210–239 67 0.3
8 Pneumonia and influenza . . . . . . . . . .480–487 52 0.29 Chronic obstructive pulmonary diseases
and allied conditions. . . . . . . . . . . . .490–496 51 0.29 Human immunodeficiency virus
infection . . . . . . . . . . . . . . . . . . .*042–*044 51 0.2. . . All other causes. . . . . . . . . . . . . . . . . . . . . . 1,049 4.2
52 Monthly Vital Statistics Report + Vol. 45, No. 3(S) + September 30, 1996
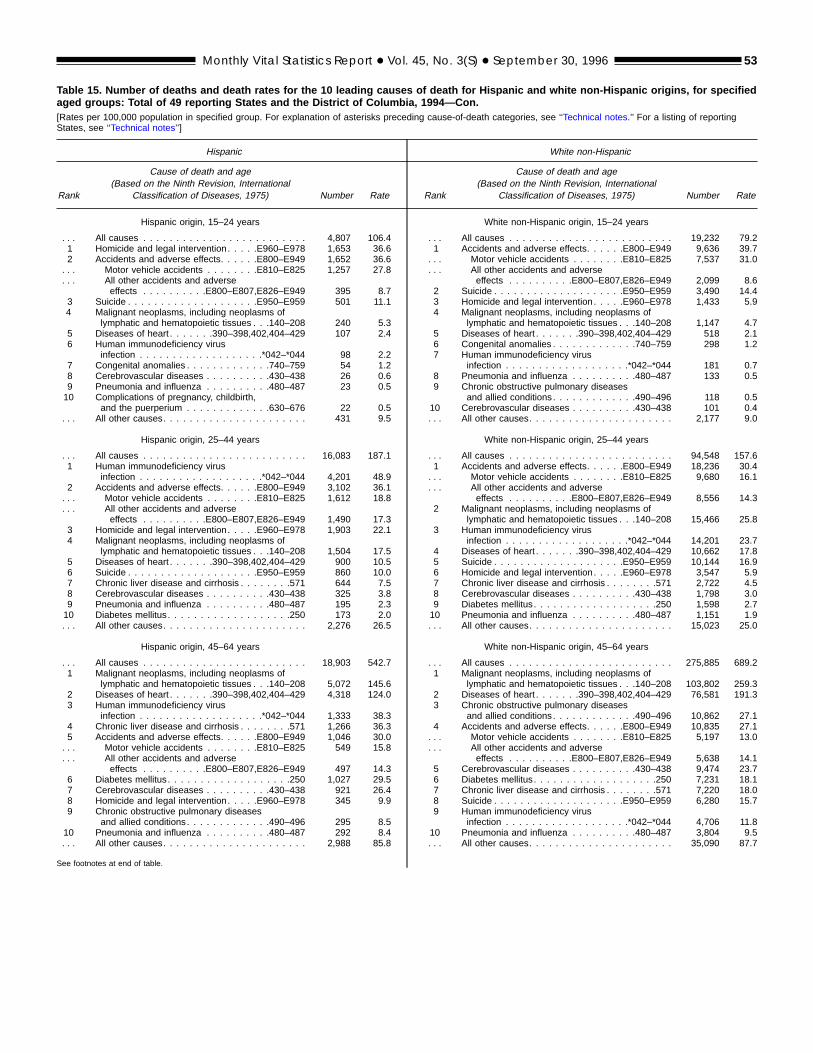
Table 15. Number of deaths and death rates for the 10 leading causes of death for Hispanic and white non-Hispanic origins, for specifiedaged groups: Total of 49 reporting States and the District of Columbia, 1994—Con.[Rates per 100,000 population in specified group. For explanation of asterisks preceding cause-of-death categories, see ‘‘Technical notes.’’ For a listing of reportingStates, see ‘‘Technical notes’’]
Hispanic
Rank
Cause of death and age(Based on the Ninth Revision, International
Classification of Diseases, 1975) Number Rate
Hispanic origin, 15–24 years
. . . All causes . . . . . . . . . . . . . . . . . . . . . . . . . 4,807 106.41 Homicide and legal intervention. . . . .E960–E978 1,653 36.62 Accidents and adverse effects. . . . . .E800–E949 1,652 36.6. . . Motor vehicle accidents . . . . . . . .E810–E825 1,257 27.8. . . All other accidents and adverse
effects . . . . . . . . . .E800–E807,E826–E949 395 8.73 Suicide . . . . . . . . . . . . . . . . . . . .E950–E959 501 11.14 Malignant neoplasms, including neoplasms of
lymphatic and hematopoietic tissues . . .140–208 240 5.35 Diseases of heart . . . . . . .390–398,402,404–429 107 2.46 Human immunodeficiency virus
infection . . . . . . . . . . . . . . . . . . .*042–*044 98 2.27 Congenital anomalies . . . . . . . . . . . . .740–759 54 1.28 Cerebrovascular diseases . . . . . . . . . .430–438 26 0.69 Pneumonia and influenza . . . . . . . . . .480–487 23 0.510 Complications of pregnancy, childbirth,
and the puerperium . . . . . . . . . . . . .630–676 22 0.5. . . All other causes. . . . . . . . . . . . . . . . . . . . . . 431 9.5
Hispanic origin, 25–44 years
. . . All causes . . . . . . . . . . . . . . . . . . . . . . . . . 16,083 187.11 Human immunodeficiency virus
infection . . . . . . . . . . . . . . . . . . .*042–*044 4,201 48.92 Accidents and adverse effects. . . . . .E800–E949 3,102 36.1. . . Motor vehicle accidents . . . . . . . .E810–E825 1,612 18.8. . . All other accidents and adverse
effects . . . . . . . . . .E800–E807,E826–E949 1,490 17.33 Homicide and legal intervention. . . . .E960–E978 1,903 22.14 Malignant neoplasms, including neoplasms of
lymphatic and hematopoietic tissues . . .140–208 1,504 17.55 Diseases of heart . . . . . . .390–398,402,404–429 900 10.56 Suicide . . . . . . . . . . . . . . . . . . . .E950–E959 860 10.07 Chronic liver disease and cirrhosis . . . . . . . .571 644 7.58 Cerebrovascular diseases . . . . . . . . . .430–438 325 3.89 Pneumonia and influenza . . . . . . . . . .480–487 195 2.310 Diabetes mellitus. . . . . . . . . . . . . . . . . . .250 173 2.0. . . All other causes. . . . . . . . . . . . . . . . . . . . . . 2,276 26.5
Hispanic origin, 45–64 years
. . . All causes . . . . . . . . . . . . . . . . . . . . . . . . . 18,903 542.71 Malignant neoplasms, including neoplasms of
lymphatic and hematopoietic tissues . . .140–208 5,072 145.62 Diseases of heart . . . . . . .390–398,402,404–429 4,318 124.03 Human immunodeficiency virus
infection . . . . . . . . . . . . . . . . . . .*042–*044 1,333 38.34 Chronic liver disease and cirrhosis . . . . . . . .571 1,266 36.35 Accidents and adverse effects. . . . . .E800–E949 1,046 30.0. . . Motor vehicle accidents . . . . . . . .E810–E825 549 15.8. . . All other accidents and adverse
effects . . . . . . . . . .E800–E807,E826–E949 497 14.36 Diabetes mellitus. . . . . . . . . . . . . . . . . . .250 1,027 29.57 Cerebrovascular diseases . . . . . . . . . .430–438 921 26.48 Homicide and legal intervention. . . . .E960–E978 345 9.99 Chronic obstructive pulmonary diseases
and allied conditions. . . . . . . . . . . . .490–496 295 8.510 Pneumonia and influenza . . . . . . . . . .480–487 292 8.4. . . All other causes. . . . . . . . . . . . . . . . . . . . . . 2,988 85.8
See footnotes at end of table.
White non-Hispanic
Rank
Cause of death and age(Based on the Ninth Revision, International
Classification of Diseases, 1975) Number Rate
White non-Hispanic origin, 15–24 years
. . . All causes . . . . . . . . . . . . . . . . . . . . . . . . . 19,232 79.21 Accidents and adverse effects. . . . . .E800–E949 9,636 39.7. . . Motor vehicle accidents . . . . . . . .E810–E825 7,537 31.0. . . All other accidents and adverse
effects . . . . . . . . . .E800–E807,E826–E949 2,099 8.62 Suicide . . . . . . . . . . . . . . . . . . . .E950–E959 3,490 14.43 Homicide and legal intervention. . . . .E960–E978 1,433 5.94 Malignant neoplasms, including neoplasms of
lymphatic and hematopoietic tissues . . .140–208 1,147 4.75 Diseases of heart . . . . . . .390–398,402,404–429 518 2.16 Congenital anomalies . . . . . . . . . . . . .740–759 298 1.27 Human immunodeficiency virus
infection . . . . . . . . . . . . . . . . . . .*042–*044 181 0.78 Pneumonia and influenza . . . . . . . . . .480–487 133 0.59 Chronic obstructive pulmonary diseases
and allied conditions. . . . . . . . . . . . .490–496 118 0.510 Cerebrovascular diseases . . . . . . . . . .430–438 101 0.4. . . All other causes. . . . . . . . . . . . . . . . . . . . . . 2,177 9.0
White non-Hispanic origin, 25–44 years
. . . All causes . . . . . . . . . . . . . . . . . . . . . . . . . 94,548 157.61 Accidents and adverse effects. . . . . .E800–E949 18,236 30.4. . . Motor vehicle accidents . . . . . . . .E810–E825 9,680 16.1. . . All other accidents and adverse
effects . . . . . . . . . .E800–E807,E826–E949 8,556 14.32 Malignant neoplasms, including neoplasms of
lymphatic and hematopoietic tissues . . .140–208 15,466 25.83 Human immunodeficiency virus
infection . . . . . . . . . . . . . . . . . . .*042–*044 14,201 23.74 Diseases of heart . . . . . . .390–398,402,404–429 10,662 17.85 Suicide . . . . . . . . . . . . . . . . . . . .E950–E959 10,144 16.96 Homicide and legal intervention. . . . .E960–E978 3,547 5.97 Chronic liver disease and cirrhosis . . . . . . . .571 2,722 4.58 Cerebrovascular diseases . . . . . . . . . .430–438 1,798 3.09 Diabetes mellitus. . . . . . . . . . . . . . . . . . .250 1,598 2.710 Pneumonia and influenza . . . . . . . . . .480–487 1,151 1.9. . . All other causes. . . . . . . . . . . . . . . . . . . . . . 15,023 25.0
White non-Hispanic origin, 45–64 years
. . . All causes . . . . . . . . . . . . . . . . . . . . . . . . . 275,885 689.21 Malignant neoplasms, including neoplasms of
lymphatic and hematopoietic tissues . . .140–208 103,802 259.32 Diseases of heart . . . . . . .390–398,402,404–429 76,581 191.33 Chronic obstructive pulmonary diseases
and allied conditions. . . . . . . . . . . . .490–496 10,862 27.14 Accidents and adverse effects. . . . . .E800–E949 10,835 27.1. . . Motor vehicle accidents . . . . . . . .E810–E825 5,197 13.0. . . All other accidents and adverse
effects . . . . . . . . . .E800–E807,E826–E949 5,638 14.15 Cerebrovascular diseases . . . . . . . . . .430–438 9,474 23.76 Diabetes mellitus. . . . . . . . . . . . . . . . . . .250 7,231 18.17 Chronic liver disease and cirrhosis . . . . . . . .571 7,220 18.08 Suicide . . . . . . . . . . . . . . . . . . . .E950–E959 6,280 15.79 Human immunodeficiency virus
infection . . . . . . . . . . . . . . . . . . .*042–*044 4,706 11.810 Pneumonia and influenza . . . . . . . . . .480–487 3,804 9.5. . . All other causes. . . . . . . . . . . . . . . . . . . . . . 35,090 87.7
Monthly Vital Statistics Report + Vol. 45, No. 3(S) + September 30, 1996 53
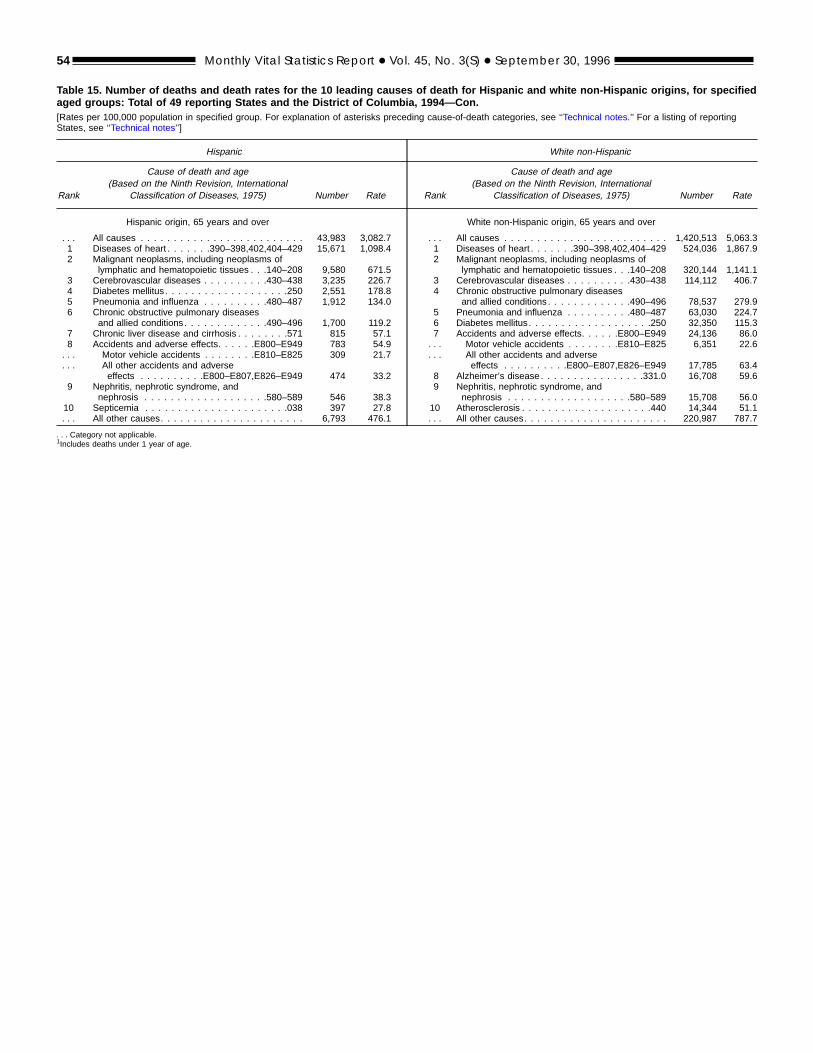
Table 15. Number of deaths and death rates for the 10 leading causes of death for Hispanic and white non-Hispanic origins, for specifiedaged groups: Total of 49 reporting States and the District of Columbia, 1994—Con.[Rates per 100,000 population in specified group. For explanation of asterisks preceding cause-of-death categories, see ‘‘Technical notes.’’ For a listing of reportingStates, see ‘‘Technical notes’’]
Hispanic
Rank
Cause of death and age(Based on the Ninth Revision, International
Classification of Diseases, 1975) Number Rate
Hispanic origin, 65 years and over
. . . All causes . . . . . . . . . . . . . . . . . . . . . . . . . 43,983 3,082.71 Diseases of heart . . . . . . .390–398,402,404–429 15,671 1,098.42 Malignant neoplasms, including neoplasms of
lymphatic and hematopoietic tissues . . .140–208 9,580 671.53 Cerebrovascular diseases . . . . . . . . . .430–438 3,235 226.74 Diabetes mellitus. . . . . . . . . . . . . . . . . . .250 2,551 178.85 Pneumonia and influenza . . . . . . . . . .480–487 1,912 134.06 Chronic obstructive pulmonary diseases
and allied conditions. . . . . . . . . . . . .490–496 1,700 119.27 Chronic liver disease and cirrhosis . . . . . . . .571 815 57.18 Accidents and adverse effects. . . . . .E800–E949 783 54.9. . . Motor vehicle accidents . . . . . . . .E810–E825 309 21.7. . . All other accidents and adverse
effects . . . . . . . . . .E800–E807,E826–E949 474 33.29 Nephritis, nephrotic syndrome, and
nephrosis . . . . . . . . . . . . . . . . . . .580–589 546 38.310 Septicemia . . . . . . . . . . . . . . . . . . . . . .038 397 27.8. . . All other causes. . . . . . . . . . . . . . . . . . . . . . 6,793 476.1
White non-Hispanic
Rank
Cause of death and age(Based on the Ninth Revision, International
Classification of Diseases, 1975) Number Rate
White non-Hispanic origin, 65 years and over
. . . All causes . . . . . . . . . . . . . . . . . . . . . . . . . 1,420,513 5,063.31 Diseases of heart . . . . . . .390–398,402,404–429 524,036 1,867.92 Malignant neoplasms, including neoplasms of
lymphatic and hematopoietic tissues . . .140–208 320,144 1,141.13 Cerebrovascular diseases . . . . . . . . . .430–438 114,112 406.74 Chronic obstructive pulmonary diseases
and allied conditions. . . . . . . . . . . . .490–496 78,537 279.95 Pneumonia and influenza . . . . . . . . . .480–487 63,030 224.76 Diabetes mellitus. . . . . . . . . . . . . . . . . . .250 32,350 115.37 Accidents and adverse effects. . . . . .E800–E949 24,136 86.0. . . Motor vehicle accidents . . . . . . . .E810–E825 6,351 22.6. . . All other accidents and adverse
effects . . . . . . . . . .E800–E807,E826–E949 17,785 63.48 Alzheimer’s disease . . . . . . . . . . . . . . . .331.0 16,708 59.69 Nephritis, nephrotic syndrome, and
nephrosis . . . . . . . . . . . . . . . . . . .580–589 15,708 56.010 Atherosclerosis . . . . . . . . . . . . . . . . . . . .440 14,344 51.1. . . All other causes. . . . . . . . . . . . . . . . . . . . . . 220,987 787.7
54 Monthly Vital Statistics Report + Vol. 45, No. 3(S) + September 30, 1996
. . . Category not applicable.1Includes deaths under 1 year of age.
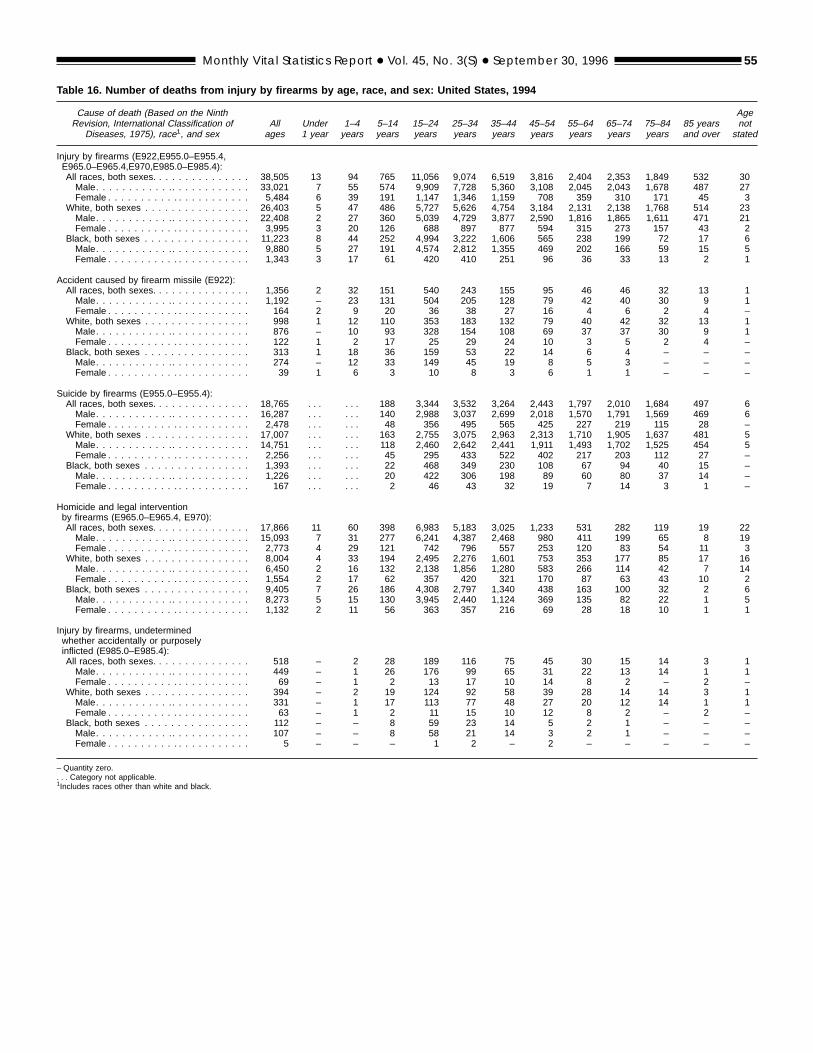
Table 16. Number of deaths from injury by firearms by age, race, and sex: United States, 1994
Cause of death (Based on the NinthRevision, International Classification of
Diseases, 1975), race1, and sexAllages
Under1 year
1–4years
5–14years
15–24years
25–34years
35–44years
45–54years
55–64years
65–74years
75–84years
85 yearsand over
Agenot
stated
Injury by firearms (E922,E955.0–E955.4,E965.0–E965.4,E970,E985.0–E985.4):All races, both sexes. . . . . . . . . . . . . . . 38,505 13 94 765 11,056 9,074 6,519 3,816 2,404 2,353 1,849 532 30Male. . . . . . . . . . . .. . . . . . . . . . . . 33,021 7 55 574 9,909 7,728 5,360 3,108 2,045 2,043 1,678 487 27Female . . . . . . . . . . . . . . . . . . . . . . 5,484 6 39 191 1,147 1,346 1,159 708 359 310 171 45 3
White, both sexes . . . . . . . . . . . . . . . . 26,403 5 47 486 5,727 5,626 4,754 3,184 2,131 2,138 1,768 514 23Male. . . . . . . . . . . .. . . . . . . . . . . . 22,408 2 27 360 5,039 4,729 3,877 2,590 1,816 1,865 1,611 471 21Female . . . . . . . . . . . . . . . . . . . . . . 3,995 3 20 126 688 897 877 594 315 273 157 43 2
Black, both sexes . . . . . . . . . . . . . . . . 11,223 8 44 252 4,994 3,222 1,606 565 238 199 72 17 6Male. . . . . . . . . . . .. . . . . . . . . . . . 9,880 5 27 191 4,574 2,812 1,355 469 202 166 59 15 5Female . . . . . . . . . . . . . . . . . . . . . . 1,343 3 17 61 420 410 251 96 36 33 13 2 1
Accident caused by firearm missile (E922):All races, both sexes. . . . . . . . . . . . . . . 1,356 2 32 151 540 243 155 95 46 46 32 13 1Male. . . . . . . . . . . .. . . . . . . . . . . . 1,192 – 23 131 504 205 128 79 42 40 30 9 1Female . . . . . . . . . . . . . . . . . . . . . . 164 2 9 20 36 38 27 16 4 6 2 4 –
White, both sexes . . . . . . . . . . . . . . . . 998 1 12 110 353 183 132 79 40 42 32 13 1Male. . . . . . . . . . . .. . . . . . . . . . . . 876 – 10 93 328 154 108 69 37 37 30 9 1Female . . . . . . . . . . . . . . . . . . . . . . 122 1 2 17 25 29 24 10 3 5 2 4 –
Black, both sexes . . . . . . . . . . . . . . . . 313 1 18 36 159 53 22 14 6 4 – – –Male. . . . . . . . . . . .. . . . . . . . . . . . 274 – 12 33 149 45 19 8 5 3 – – –Female . . . . . . . . . . . . . . . . . . . . . . 39 1 6 3 10 8 3 6 1 1 – – –
Suicide by firearms (E955.0–E955.4):All races, both sexes. . . . . . . . . . . . . . . 18,765 . . . . . . 188 3,344 3,532 3,264 2,443 1,797 2,010 1,684 497 6Male. . . . . . . . . . . .. . . . . . . . . . . . 16,287 . . . . . . 140 2,988 3,037 2,699 2,018 1,570 1,791 1,569 469 6Female . . . . . . . . . . . . . . . . . . . . . . 2,478 . . . . . . 48 356 495 565 425 227 219 115 28 –
White, both sexes . . . . . . . . . . . . . . . . 17,007 . . . . . . 163 2,755 3,075 2,963 2,313 1,710 1,905 1,637 481 5Male. . . . . . . . . . . .. . . . . . . . . . . . 14,751 . . . . . . 118 2,460 2,642 2,441 1,911 1,493 1,702 1,525 454 5Female . . . . . . . . . . . . . . . . . . . . . . 2,256 . . . . . . 45 295 433 522 402 217 203 112 27 –
Black, both sexes . . . . . . . . . . . . . . . . 1,393 . . . . . . 22 468 349 230 108 67 94 40 15 –Male. . . . . . . . . . . .. . . . . . . . . . . . 1,226 . . . . . . 20 422 306 198 89 60 80 37 14 –Female . . . . . . . . . . . . . . . . . . . . . . 167 . . . . . . 2 46 43 32 19 7 14 3 1 –
Homicide and legal interventionby firearms (E965.0–E965.4, E970):All races, both sexes. . . . . . . . . . . . . . . 17,866 11 60 398 6,983 5,183 3,025 1,233 531 282 119 19 22Male. . . . . . . . . . . .. . . . . . . . . . . . 15,093 7 31 277 6,241 4,387 2,468 980 411 199 65 8 19Female . . . . . . . . . . . . . . . . . . . . . . 2,773 4 29 121 742 796 557 253 120 83 54 11 3
White, both sexes . . . . . . . . . . . . . . . . 8,004 4 33 194 2,495 2,276 1,601 753 353 177 85 17 16Male. . . . . . . . . . . .. . . . . . . . . . . . 6,450 2 16 132 2,138 1,856 1,280 583 266 114 42 7 14Female . . . . . . . . . . . . . . . . . . . . . . 1,554 2 17 62 357 420 321 170 87 63 43 10 2
Black, both sexes . . . . . . . . . . . . . . . . 9,405 7 26 186 4,308 2,797 1,340 438 163 100 32 2 6Male. . . . . . . . . . . .. . . . . . . . . . . . 8,273 5 15 130 3,945 2,440 1,124 369 135 82 22 1 5Female . . . . . . . . . . . . . . . . . . . . . . 1,132 2 11 56 363 357 216 69 28 18 10 1 1
Injury by firearms, undeterminedwhether accidentally or purposelyinflicted (E985.0–E985.4):All races, both sexes. . . . . . . . . . . . . . . 518 – 2 28 189 116 75 45 30 15 14 3 1Male. . . . . . . . . . . .. . . . . . . . . . . . 449 – 1 26 176 99 65 31 22 13 14 1 1Female . . . . . . . . . . . . . . . . . . . . . . 69 – 1 2 13 17 10 14 8 2 – 2 –
White, both sexes . . . . . . . . . . . . . . . . 394 – 2 19 124 92 58 39 28 14 14 3 1Male. . . . . . . . . . . .. . . . . . . . . . . . 331 – 1 17 113 77 48 27 20 12 14 1 1Female . . . . . . . . . . . . . . . . . . . . . . 63 – 1 2 11 15 10 12 8 2 – 2 –
Black, both sexes . . . . . . . . . . . . . . . . 112 – – 8 59 23 14 5 2 1 – – –Male. . . . . . . . . . . .. . . . . . . . . . . . 107 – – 8 58 21 14 3 2 1 – – –Female . . . . . . . . . . . . . . . . . . . . . . 5 – – – 1 2 – 2 – – – – –
– Quantity zero.. . . Category not applicable.1Includes races other than white and black.
Monthly Vital Statistics Report + Vol. 45, No. 3(S) + September 30, 1996 55
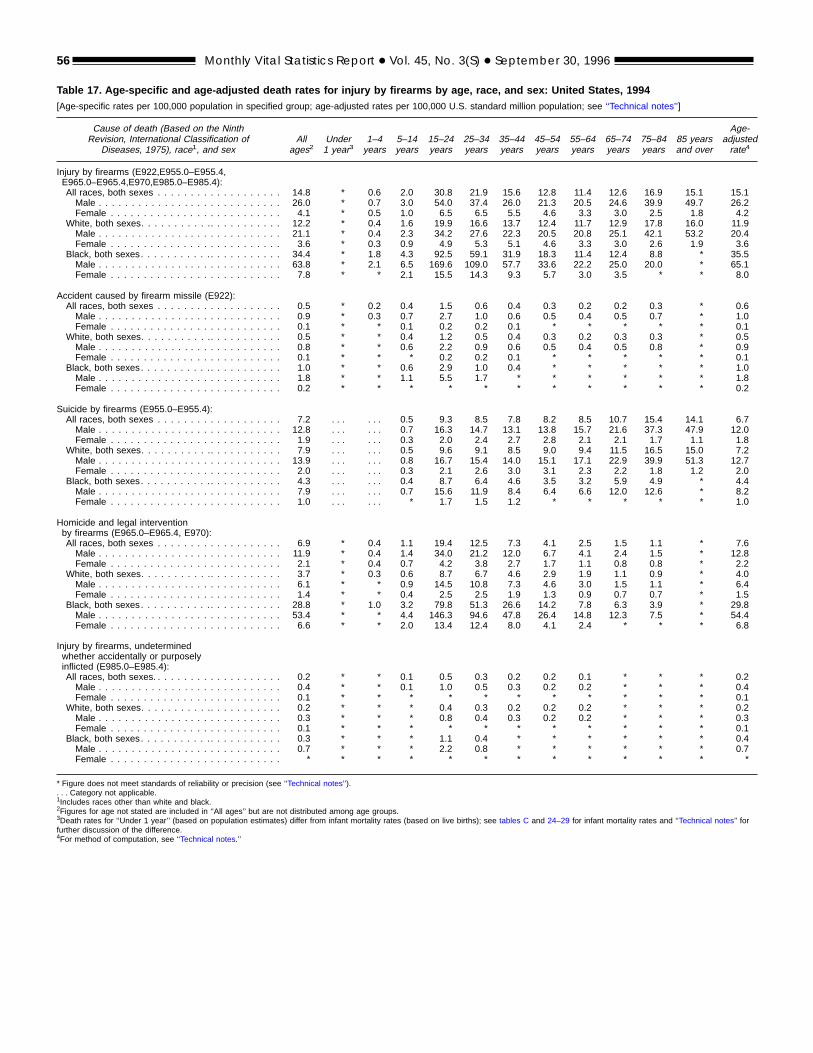
Table 17. Age-specific and age-adjusted death rates for injury by firearms by age, race, and sex: United States, 1994[Age-specific rates per 100,000 population in specified group; age-adjusted rates per 100,000 U.S. standard million population; see ‘‘Technical notes’’]
Cause of death (Based on the NinthRevision, International Classification of
Diseases, 1975), race1, and sexAll
ages2Under1 year3
1–4years
5–14years
15–24years
25–34years
35–44years
45–54years
55–64years
65–74years
75–84years
85 yearsand over
Age-adjustedrate4
Injury by firearms (E922,E955.0–E955.4,E965.0–E965.4,E970,E985.0–E985.4):All races, both sexes . . . . . . . . . . . . . . . . . . . 14.8 * 0.6 2.0 30.8 21.9 15.6 12.8 11.4 12.6 16.9 15.1 15.1Male . . . . . . . . . . . . . . . . . . . . . . . . . . . . 26.0 * 0.7 3.0 54.0 37.4 26.0 21.3 20.5 24.6 39.9 49.7 26.2Female . . . . . . . . . . . . . . . . . . . . . . . . . . 4.1 * 0.5 1.0 6.5 6.5 5.5 4.6 3.3 3.0 2.5 1.8 4.2
White, both sexes. . . . . . . . . . .. . . . . . . . . . . 12.2 * 0.4 1.6 19.9 16.6 13.7 12.4 11.7 12.9 17.8 16.0 11.9Male . . . . . . . . . . . . . . . . . . . . . . . . . . . . 21.1 * 0.4 2.3 34.2 27.6 22.3 20.5 20.8 25.1 42.1 53.2 20.4Female . . . . . . . . . . . . . . . . . . . . . . . . . . 3.6 * 0.3 0.9 4.9 5.3 5.1 4.6 3.3 3.0 2.6 1.9 3.6
Black, both sexes. . . . . . . . . . . . . . . . . . . . . . 34.4 * 1.8 4.3 92.5 59.1 31.9 18.3 11.4 12.4 8.8 * 35.5Male . . . . . . . . . . . . . . . . . . . . . . . . . . . . 63.8 * 2.1 6.5 169.6 109.0 57.7 33.6 22.2 25.0 20.0 * 65.1Female . . . . . . . . . . . . . . . . . . . . . . . . . . 7.8 * * 2.1 15.5 14.3 9.3 5.7 3.0 3.5 * * 8.0
Accident caused by firearm missile (E922):All races, both sexes . . . . . . . . . . . . . . . . . . . 0.5 * 0.2 0.4 1.5 0.6 0.4 0.3 0.2 0.2 0.3 * 0.6Male . . . . . . . . . . . . . . . . . . . . . . . . . . . . 0.9 * 0.3 0.7 2.7 1.0 0.6 0.5 0.4 0.5 0.7 * 1.0Female . . . . . . . . . . . . . . . . . . . . . . . . . . 0.1 * * 0.1 0.2 0.2 0.1 * * * * * 0.1
White, both sexes. . . . . . . . . . .. . . . . . . . . . . 0.5 * * 0.4 1.2 0.5 0.4 0.3 0.2 0.3 0.3 * 0.5Male . . . . . . . . . . . . . . . . . . . . . . . . . . . . 0.8 * * 0.6 2.2 0.9 0.6 0.5 0.4 0.5 0.8 * 0.9Female . . . . . . . . . . . . . . . . . . . . . . . . . . 0.1 * * * 0.2 0.2 0.1 * * * * * 0.1
Black, both sexes. . . . . . . . . . . . . . . . . . . . . . 1.0 * * 0.6 2.9 1.0 0.4 * * * * * 1.0Male . . . . . . . . . . . . . . . . . . . . . . . . . . . . 1.8 * * 1.1 5.5 1.7 * * * * * * 1.8Female . . . . . . . . . . . . . . . . . . . . . . . . . . 0.2 * * * * * * * * * * * 0.2
Suicide by firearms (E955.0–E955.4):All races, both sexes . . . . . . . . . . . . . . . . . . . 7.2 . . . . . . 0.5 9.3 8.5 7.8 8.2 8.5 10.7 15.4 14.1 6.7Male . . . . . . . . . . . . . . . . . . . . . . . . . . . . 12.8 . . . . . . 0.7 16.3 14.7 13.1 13.8 15.7 21.6 37.3 47.9 12.0Female . . . . . . . . . . . . . . . . . . . . . . . . . . 1.9 . . . . . . 0.3 2.0 2.4 2.7 2.8 2.1 2.1 1.7 1.1 1.8
White, both sexes. . . . . . . . . . .. . . . . . . . . . . 7.9 . . . . . . 0.5 9.6 9.1 8.5 9.0 9.4 11.5 16.5 15.0 7.2Male . . . . . . . . . . . . . . . . . . . . . . . . . . . . 13.9 . . . . . . 0.8 16.7 15.4 14.0 15.1 17.1 22.9 39.9 51.3 12.7Female . . . . . . . . . . . . . . . . . . . . . . . . . . 2.0 . . . . . . 0.3 2.1 2.6 3.0 3.1 2.3 2.2 1.8 1.2 2.0
Black, both sexes. . . . . . . . . . . . . . . . . . . . . . 4.3 . . . . . . 0.4 8.7 6.4 4.6 3.5 3.2 5.9 4.9 * 4.4Male . . . . . . . . . . . . . . . . . . . . . . . . . . . . 7.9 . . . . . . 0.7 15.6 11.9 8.4 6.4 6.6 12.0 12.6 * 8.2Female . . . . . . . . . . . . . . . . . . . . . . . . . . 1.0 . . . . . . * 1.7 1.5 1.2 * * * * * 1.0
Homicide and legal interventionby firearms (E965.0–E965.4, E970):All races, both sexes . . . . . . . . . . . . . . . . . . . 6.9 * 0.4 1.1 19.4 12.5 7.3 4.1 2.5 1.5 1.1 * 7.6Male . . . . . . . . . . . . . . . . . . . . . . . . . . . . 11.9 * 0.4 1.4 34.0 21.2 12.0 6.7 4.1 2.4 1.5 * 12.8Female . . . . . . . . . . . . . . . . . . . . . . . . . . 2.1 * 0.4 0.7 4.2 3.8 2.7 1.7 1.1 0.8 0.8 * 2.2
White, both sexes. . . . . . . . . . .. . . . . . . . . . . 3.7 * 0.3 0.6 8.7 6.7 4.6 2.9 1.9 1.1 0.9 * 4.0Male . . . . . . . . . . . . . . . . . . . . . . . . . . . . 6.1 * * 0.9 14.5 10.8 7.3 4.6 3.0 1.5 1.1 * 6.4Female . . . . . . . . . . . . . . . . . . . . . . . . . . 1.4 * * 0.4 2.5 2.5 1.9 1.3 0.9 0.7 0.7 * 1.5
Black, both sexes. . . . . . . . . . . . . . . . . . . . . . 28.8 * 1.0 3.2 79.8 51.3 26.6 14.2 7.8 6.3 3.9 * 29.8Male . . . . . . . . . . . . . . . . . . . . . . . . . . . . 53.4 * * 4.4 146.3 94.6 47.8 26.4 14.8 12.3 7.5 * 54.4Female . . . . . . . . . . . . . . . . . . . . . . . . . . 6.6 * * 2.0 13.4 12.4 8.0 4.1 2.4 * * * 6.8
Injury by firearms, undeterminedwhether accidentally or purposelyinflicted (E985.0–E985.4):All races, both sexes. . . . . . . . . . . . . . . . . . . . 0.2 * * 0.1 0.5 0.3 0.2 0.2 0.1 * * * 0.2Male . . . . . . . . . . . . . . . . . . . . . . . . . . . . 0.4 * * 0.1 1.0 0.5 0.3 0.2 0.2 * * * 0.4Female . . . . . . . . . . . . . . . . . . . . . . . . . . 0.1 * * * * * * * * * * * 0.1
White, both sexes. . . . . . . . . . .. . . . . . . . . . . 0.2 * * * 0.4 0.3 0.2 0.2 0.2 * * * 0.2Male . . . . . . . . . . . . . . . . . . . . . . . . . . . . 0.3 * * * 0.8 0.4 0.3 0.2 0.2 * * * 0.3Female . . . . . . . . . . . . . . . . . . . . . . . . . . 0.1 * * * * * * * * * * * 0.1
Black, both sexes. . . . . . . . . . . . . . . . . . . . . . 0.3 * * * 1.1 0.4 * * * * * * 0.4Male . . . . . . . . . . . . . . . . . . . . . . . . . . . . 0.7 * * * 2.2 0.8 * * * * * * 0.7Female . . . . . . . . . . . . . . . . . . . . . . . . . . * * * * * * * * * * * * *
* Figure does not meet standards of reliability or precision (see ‘‘Technical notes’’).. . . Category not applicable.1Includes races other than white and black.2Figures for age not stated are included in ‘‘All ages’’ but are not distributed among age groups.3Death rates for ‘‘Under 1 year’’ (based on population estimates) differ from infant mortality rates (based on live births); see tables C and 24–29 for infant mortality rates and ‘‘Technical notes’’ forfurther discussion of the difference.4For method of computation, see ‘‘Technical notes.’’
56 Monthly Vital Statistics Report + Vol. 45, No. 3(S) + September 30, 1996
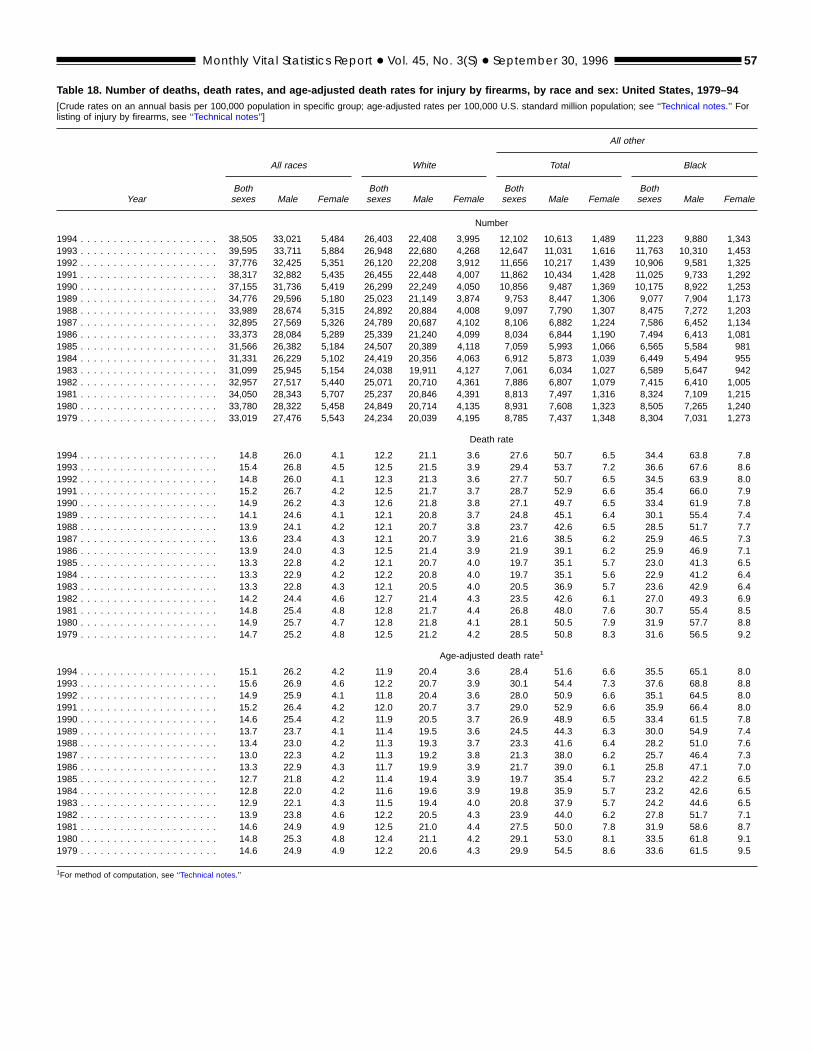
Table 18. Number of deaths, death rates, and age-adjusted death rates for injury by firearms, by race and sex: United States, 1979–94[Crude rates on an annual basis per 100,000 population in specific group; age-adjusted rates per 100,000 U.S. standard million population; see ‘‘Technical notes.’’ Forlisting of injury by firearms, see ‘‘Technical notes’’]
Year
All other
All races White Total Black
Bothsexes Male Female
Bothsexes Male Female
Bothsexes Male Female
Bothsexes Male Female
Number
1994 . . . . . . . . . . . . . . . . . . . . . 38,505 33,021 5,484 26,403 22,408 3,995 12,102 10,613 1,489 11,223 9,880 1,3431993 . . . . . . . . . . . . . . . . . . . . . 39,595 33,711 5,884 26,948 22,680 4,268 12,647 11,031 1,616 11,763 10,310 1,4531992 . . . . . . . . . . . . . . . . . . . . . 37,776 32,425 5,351 26,120 22,208 3,912 11,656 10,217 1,439 10,906 9,581 1,3251991 . . . . . . . . . . . . . . . . . . . . . 38,317 32,882 5,435 26,455 22,448 4,007 11,862 10,434 1,428 11,025 9,733 1,2921990 . . . . . . . . . . . . . . . . . . . . . 37,155 31,736 5,419 26,299 22,249 4,050 10,856 9,487 1,369 10,175 8,922 1,2531989 . . . . . . . . . . . . . . . . . . . . . 34,776 29,596 5,180 25,023 21,149 3,874 9,753 8,447 1,306 9,077 7,904 1,1731988 . . . . . . . . . . . . . . . . . . . . . 33,989 28,674 5,315 24,892 20,884 4,008 9,097 7,790 1,307 8,475 7,272 1,2031987 . . . . . . . . . . . . . . . . . . . . . 32,895 27,569 5,326 24,789 20,687 4,102 8,106 6,882 1,224 7,586 6,452 1,1341986 . . . . . . . . . . . . . . . . . . . . . 33,373 28,084 5,289 25,339 21,240 4,099 8,034 6,844 1,190 7,494 6,413 1,0811985 . . . . . . . . . . . . . . . . . . . . . 31,566 26,382 5,184 24,507 20,389 4,118 7,059 5,993 1,066 6,565 5,584 9811984 . . . . . . . . . . . . . . . . . . . . . 31,331 26,229 5,102 24,419 20,356 4,063 6,912 5,873 1,039 6,449 5,494 9551983 . . . . . . . . . . . . . . . . . . . . . 31,099 25,945 5,154 24,038 19,911 4,127 7,061 6,034 1,027 6,589 5,647 9421982 . . . . . . . . . . . . . . . . . . . . . 32,957 27,517 5,440 25,071 20,710 4,361 7,886 6,807 1,079 7,415 6,410 1,0051981 . . . . . . . . . . . . . . . . . . . . . 34,050 28,343 5,707 25,237 20,846 4,391 8,813 7,497 1,316 8,324 7,109 1,2151980 . . . . . . . . . . . . . . . . . . . . . 33,780 28,322 5,458 24,849 20,714 4,135 8,931 7,608 1,323 8,505 7,265 1,2401979 . . . . . . . . . . . . . . . . . . . . . 33,019 27,476 5,543 24,234 20,039 4,195 8,785 7,437 1,348 8,304 7,031 1,273
Death rate
1994 . . . . . . . . . . . . . . . . . . . . . 14.8 26.0 4.1 12.2 21.1 3.6 27.6 50.7 6.5 34.4 63.8 7.81993 . . . . . . . . . . . . . . . . . . . . . 15.4 26.8 4.5 12.5 21.5 3.9 29.4 53.7 7.2 36.6 67.6 8.61992 . . . . . . . . . . . . . . . . . . . . . 14.8 26.0 4.1 12.3 21.3 3.6 27.7 50.7 6.5 34.5 63.9 8.01991 . . . . . . . . . . . . . . . . . . . . . 15.2 26.7 4.2 12.5 21.7 3.7 28.7 52.9 6.6 35.4 66.0 7.91990 . . . . . . . . . . . . . . . . . . . . . 14.9 26.2 4.3 12.6 21.8 3.8 27.1 49.7 6.5 33.4 61.9 7.81989 . . . . . . . . . . . . . . . . . . . . . 14.1 24.6 4.1 12.1 20.8 3.7 24.8 45.1 6.4 30.1 55.4 7.41988 . . . . . . . . . . . . . . . . . . . . . 13.9 24.1 4.2 12.1 20.7 3.8 23.7 42.6 6.5 28.5 51.7 7.71987 . . . . . . . . . . . . . . . . . . . . . 13.6 23.4 4.3 12.1 20.7 3.9 21.6 38.5 6.2 25.9 46.5 7.31986 . . . . . . . . . . . . . . . . . . . . . 13.9 24.0 4.3 12.5 21.4 3.9 21.9 39.1 6.2 25.9 46.9 7.11985 . . . . . . . . . . . . . . . . . . . . . 13.3 22.8 4.2 12.1 20.7 4.0 19.7 35.1 5.7 23.0 41.3 6.51984 . . . . . . . . . . . . . . . . . . . . . 13.3 22.9 4.2 12.2 20.8 4.0 19.7 35.1 5.6 22.9 41.2 6.41983 . . . . . . . . . . . . . . . . . . . . . 13.3 22.8 4.3 12.1 20.5 4.0 20.5 36.9 5.7 23.6 42.9 6.41982 . . . . . . . . . . . . . . . . . . . . . 14.2 24.4 4.6 12.7 21.4 4.3 23.5 42.6 6.1 27.0 49.3 6.91981 . . . . . . . . . . . . . . . . . . . . . 14.8 25.4 4.8 12.8 21.7 4.4 26.8 48.0 7.6 30.7 55.4 8.51980 . . . . . . . . . . . . . . . . . . . . . 14.9 25.7 4.7 12.8 21.8 4.1 28.1 50.5 7.9 31.9 57.7 8.81979 . . . . . . . . . . . . . . . . . . . . . 14.7 25.2 4.8 12.5 21.2 4.2 28.5 50.8 8.3 31.6 56.5 9.2
Age-adjusted death rate1
1994 . . . . . . . . . . . . . . . . . . . . . 15.1 26.2 4.2 11.9 20.4 3.6 28.4 51.6 6.6 35.5 65.1 8.01993 . . . . . . . . . . . . . . . . . . . . . 15.6 26.9 4.6 12.2 20.7 3.9 30.1 54.4 7.3 37.6 68.8 8.81992 . . . . . . . . . . . . . . . . . . . . . 14.9 25.9 4.1 11.8 20.4 3.6 28.0 50.9 6.6 35.1 64.5 8.01991 . . . . . . . . . . . . . . . . . . . . . 15.2 26.4 4.2 12.0 20.7 3.7 29.0 52.9 6.6 35.9 66.4 8.01990 . . . . . . . . . . . . . . . . . . . . . 14.6 25.4 4.2 11.9 20.5 3.7 26.9 48.9 6.5 33.4 61.5 7.81989 . . . . . . . . . . . . . . . . . . . . . 13.7 23.7 4.1 11.4 19.5 3.6 24.5 44.3 6.3 30.0 54.9 7.41988 . . . . . . . . . . . . . . . . . . . . . 13.4 23.0 4.2 11.3 19.3 3.7 23.3 41.6 6.4 28.2 51.0 7.61987 . . . . . . . . . . . . . . . . . . . . . 13.0 22.3 4.2 11.3 19.2 3.8 21.3 38.0 6.2 25.7 46.4 7.31986 . . . . . . . . . . . . . . . . . . . . . 13.3 22.9 4.3 11.7 19.9 3.9 21.7 39.0 6.1 25.8 47.1 7.01985 . . . . . . . . . . . . . . . . . . . . . 12.7 21.8 4.2 11.4 19.4 3.9 19.7 35.4 5.7 23.2 42.2 6.51984 . . . . . . . . . . . . . . . . . . . . . 12.8 22.0 4.2 11.6 19.6 3.9 19.8 35.9 5.7 23.2 42.6 6.51983 . . . . . . . . . . . . . . . . . . . . . 12.9 22.1 4.3 11.5 19.4 4.0 20.8 37.9 5.7 24.2 44.6 6.51982 . . . . . . . . . . . . . . . . . . . . . 13.9 23.8 4.6 12.2 20.5 4.3 23.9 44.0 6.2 27.8 51.7 7.11981 . . . . . . . . . . . . . . . . . . . . . 14.6 24.9 4.9 12.5 21.0 4.4 27.5 50.0 7.8 31.9 58.6 8.71980 . . . . . . . . . . . . . . . . . . . . . 14.8 25.3 4.8 12.4 21.1 4.2 29.1 53.0 8.1 33.5 61.8 9.11979 . . . . . . . . . . . . . . . . . . . . . 14.6 24.9 4.9 12.2 20.6 4.3 29.9 54.5 8.6 33.6 61.5 9.5
1For method of computation, see ‘‘Technical notes.’’
Monthly Vital Statistics Report + Vol. 45, No. 3(S) + September 30, 1996 57
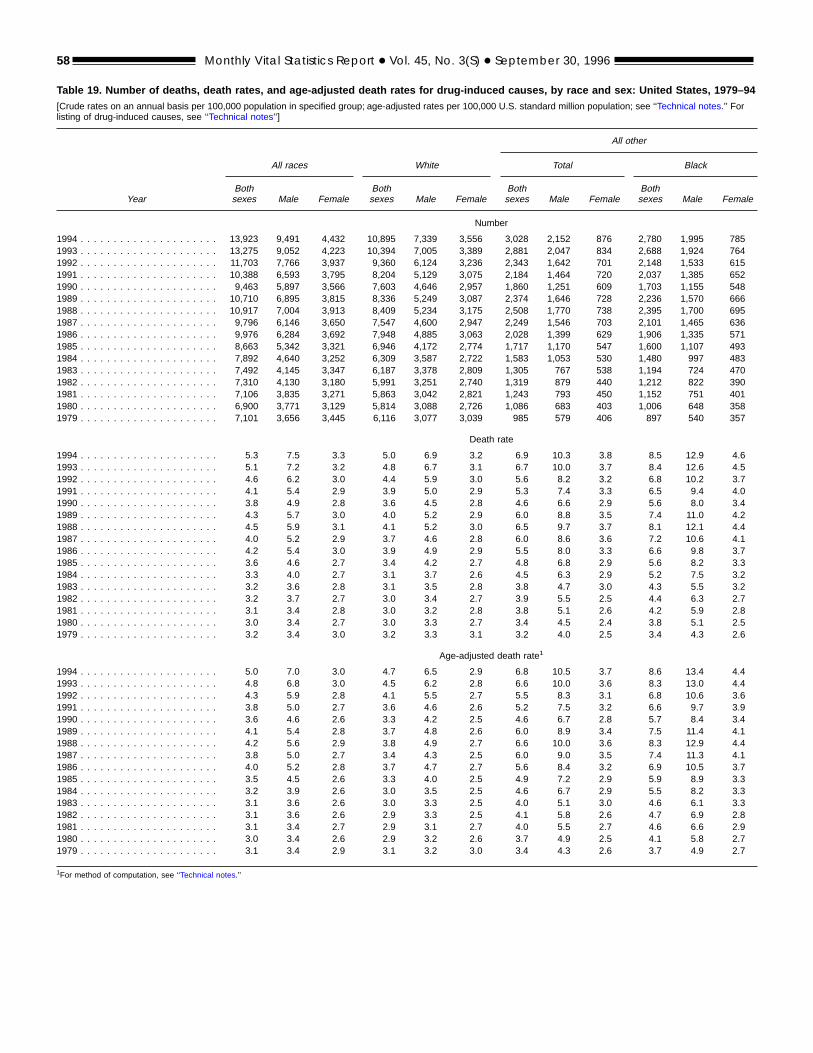
Table 19. Number of deaths, death rates, and age-adjusted death rates for drug-induced causes, by race and sex: United States, 1979–94[Crude rates on an annual basis per 100,000 population in specified group; age-adjusted rates per 100,000 U.S. standard million population; see ‘‘Technical notes.’’ Forlisting of drug-induced causes, see ‘‘Technical notes’’]
Year
All other
All races White Total Black
Bothsexes Male Female
Bothsexes Male Female
Bothsexes Male Female
Bothsexes Male Female
Number
1994 . . . . . . . . . . . . . . . . . . . . . 13,923 9,491 4,432 10,895 7,339 3,556 3,028 2,152 876 2,780 1,995 7851993 . . . . . . . . . . . . . . . . . . . . . 13,275 9,052 4,223 10,394 7,005 3,389 2,881 2,047 834 2,688 1,924 7641992 . . . . . . . . . . . . . . . . . . . . . 11,703 7,766 3,937 9,360 6,124 3,236 2,343 1,642 701 2,148 1,533 6151991 . . . . . . . . . . . . . . . . . . . . . 10,388 6,593 3,795 8,204 5,129 3,075 2,184 1,464 720 2,037 1,385 6521990 . . . . . . . . . . . . . . . . . . . . . 9,463 5,897 3,566 7,603 4,646 2,957 1,860 1,251 609 1,703 1,155 5481989 . . . . . . . . . . . . . . . . . . . . . 10,710 6,895 3,815 8,336 5,249 3,087 2,374 1,646 728 2,236 1,570 6661988 . . . . . . . . . . . . . . . . . . . . . 10,917 7,004 3,913 8,409 5,234 3,175 2,508 1,770 738 2,395 1,700 6951987 . . . . . . . . . . . . . . . . . . . . . 9,796 6,146 3,650 7,547 4,600 2,947 2,249 1,546 703 2,101 1,465 6361986 . . . . . . . . . . . . . . . . . . . . . 9,976 6,284 3,692 7,948 4,885 3,063 2,028 1,399 629 1,906 1,335 5711985 . . . . . . . . . . . . . . . . . . . . . 8,663 5,342 3,321 6,946 4,172 2,774 1,717 1,170 547 1,600 1,107 4931984 . . . . . . . . . . . . . . . . . . . . . 7,892 4,640 3,252 6,309 3,587 2,722 1,583 1,053 530 1,480 997 4831983 . . . . . . . . . . . . . . . . . . . . . 7,492 4,145 3,347 6,187 3,378 2,809 1,305 767 538 1,194 724 4701982 . . . . . . . . . . . . . . . . . . . . . 7,310 4,130 3,180 5,991 3,251 2,740 1,319 879 440 1,212 822 3901981 . . . . . . . . . . . . . . . . . . . . . 7,106 3,835 3,271 5,863 3,042 2,821 1,243 793 450 1,152 751 4011980 . . . . . . . . . . . . . . . . . . . . . 6,900 3,771 3,129 5,814 3,088 2,726 1,086 683 403 1,006 648 3581979 . . . . . . . . . . . . . . . . . . . . . 7,101 3,656 3,445 6,116 3,077 3,039 985 579 406 897 540 357
Death rate
1994 . . . . . . . . . . . . . . . . . . . . . 5.3 7.5 3.3 5.0 6.9 3.2 6.9 10.3 3.8 8.5 12.9 4.61993 . . . . . . . . . . . . . . . . . . . . . 5.1 7.2 3.2 4.8 6.7 3.1 6.7 10.0 3.7 8.4 12.6 4.51992 . . . . . . . . . . . . . . . . . . . . . 4.6 6.2 3.0 4.4 5.9 3.0 5.6 8.2 3.2 6.8 10.2 3.71991 . . . . . . . . . . . . . . . . . . . . . 4.1 5.4 2.9 3.9 5.0 2.9 5.3 7.4 3.3 6.5 9.4 4.01990 . . . . . . . . . . . . . . . . . . . . . 3.8 4.9 2.8 3.6 4.5 2.8 4.6 6.6 2.9 5.6 8.0 3.41989 . . . . . . . . . . . . . . . . . . . . . 4.3 5.7 3.0 4.0 5.2 2.9 6.0 8.8 3.5 7.4 11.0 4.21988 . . . . . . . . . . . . . . . . . . . . . 4.5 5.9 3.1 4.1 5.2 3.0 6.5 9.7 3.7 8.1 12.1 4.41987 . . . . . . . . . . . . . . . . . . . . . 4.0 5.2 2.9 3.7 4.6 2.8 6.0 8.6 3.6 7.2 10.6 4.11986 . . . . . . . . . . . . . . . . . . . . . 4.2 5.4 3.0 3.9 4.9 2.9 5.5 8.0 3.3 6.6 9.8 3.71985 . . . . . . . . . . . . . . . . . . . . . 3.6 4.6 2.7 3.4 4.2 2.7 4.8 6.8 2.9 5.6 8.2 3.31984 . . . . . . . . . . . . . . . . . . . . . 3.3 4.0 2.7 3.1 3.7 2.6 4.5 6.3 2.9 5.2 7.5 3.21983 . . . . . . . . . . . . . . . . . . . . . 3.2 3.6 2.8 3.1 3.5 2.8 3.8 4.7 3.0 4.3 5.5 3.21982 . . . . . . . . . . . . . . . . . . . . . 3.2 3.7 2.7 3.0 3.4 2.7 3.9 5.5 2.5 4.4 6.3 2.71981 . . . . . . . . . . . . . . . . . . . . . 3.1 3.4 2.8 3.0 3.2 2.8 3.8 5.1 2.6 4.2 5.9 2.81980 . . . . . . . . . . . . . . . . . . . . . 3.0 3.4 2.7 3.0 3.3 2.7 3.4 4.5 2.4 3.8 5.1 2.51979 . . . . . . . . . . . . . . . . . . . . . 3.2 3.4 3.0 3.2 3.3 3.1 3.2 4.0 2.5 3.4 4.3 2.6
Age-adjusted death rate1
1994 . . . . . . . . . . . . . . . . . . . . . 5.0 7.0 3.0 4.7 6.5 2.9 6.8 10.5 3.7 8.6 13.4 4.41993 . . . . . . . . . . . . . . . . . . . . . 4.8 6.8 3.0 4.5 6.2 2.8 6.6 10.0 3.6 8.3 13.0 4.41992 . . . . . . . . . . . . . . . . . . . . . 4.3 5.9 2.8 4.1 5.5 2.7 5.5 8.3 3.1 6.8 10.6 3.61991 . . . . . . . . . . . . . . . . . . . . . 3.8 5.0 2.7 3.6 4.6 2.6 5.2 7.5 3.2 6.6 9.7 3.91990 . . . . . . . . . . . . . . . . . . . . . 3.6 4.6 2.6 3.3 4.2 2.5 4.6 6.7 2.8 5.7 8.4 3.41989 . . . . . . . . . . . . . . . . . . . . . 4.1 5.4 2.8 3.7 4.8 2.6 6.0 8.9 3.4 7.5 11.4 4.11988 . . . . . . . . . . . . . . . . . . . . . 4.2 5.6 2.9 3.8 4.9 2.7 6.6 10.0 3.6 8.3 12.9 4.41987 . . . . . . . . . . . . . . . . . . . . . 3.8 5.0 2.7 3.4 4.3 2.5 6.0 9.0 3.5 7.4 11.3 4.11986 . . . . . . . . . . . . . . . . . . . . . 4.0 5.2 2.8 3.7 4.7 2.7 5.6 8.4 3.2 6.9 10.5 3.71985 . . . . . . . . . . . . . . . . . . . . . 3.5 4.5 2.6 3.3 4.0 2.5 4.9 7.2 2.9 5.9 8.9 3.31984 . . . . . . . . . . . . . . . . . . . . . 3.2 3.9 2.6 3.0 3.5 2.5 4.6 6.7 2.9 5.5 8.2 3.31983 . . . . . . . . . . . . . . . . . . . . . 3.1 3.6 2.6 3.0 3.3 2.5 4.0 5.1 3.0 4.6 6.1 3.31982 . . . . . . . . . . . . . . . . . . . . . 3.1 3.6 2.6 2.9 3.3 2.5 4.1 5.8 2.6 4.7 6.9 2.81981 . . . . . . . . . . . . . . . . . . . . . 3.1 3.4 2.7 2.9 3.1 2.7 4.0 5.5 2.7 4.6 6.6 2.91980 . . . . . . . . . . . . . . . . . . . . . 3.0 3.4 2.6 2.9 3.2 2.6 3.7 4.9 2.5 4.1 5.8 2.71979 . . . . . . . . . . . . . . . . . . . . . 3.1 3.4 2.9 3.1 3.2 3.0 3.4 4.3 2.6 3.7 4.9 2.7
1For method of computation, see ‘‘Technical notes.’’
58 Monthly Vital Statistics Report + Vol. 45, No. 3(S) + September 30, 1996
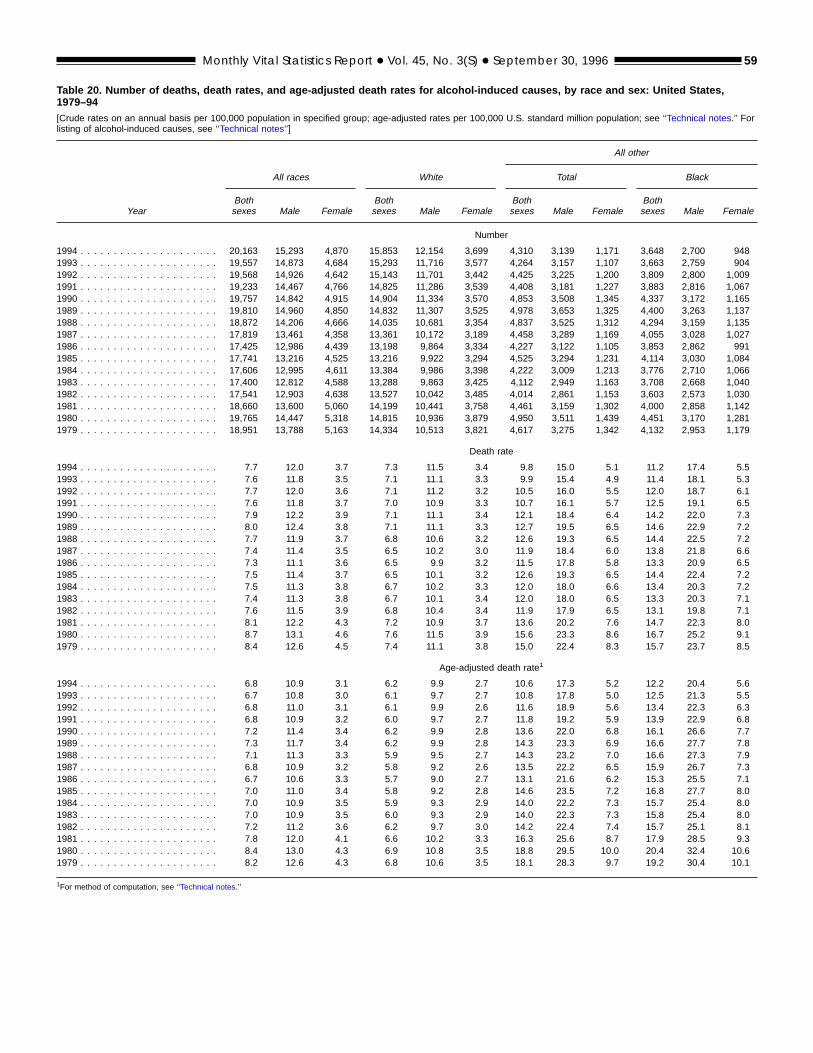
Table 20. Number of deaths, death rates, and age-adjusted death rates for alcohol-induced causes, by race and sex: United States,1979–94[Crude rates on an annual basis per 100,000 population in specified group; age-adjusted rates per 100,000 U.S. standard million population; see ‘‘Technical notes.’’ Forlisting of alcohol-induced causes, see ‘‘Technical notes’’]
Year
All other
All races White Total Black
Bothsexes Male Female
Bothsexes Male Female
Bothsexes Male Female
Bothsexes Male Female
Number
1994 . . . . . . . . . . . . . . . . . . . . . 20,163 15,293 4,870 15,853 12,154 3,699 4,310 3,139 1,171 3,648 2,700 9481993 . . . . . . . . . . . . . . . . . . . . . 19,557 14,873 4,684 15,293 11,716 3,577 4,264 3,157 1,107 3,663 2,759 9041992 . . . . . . . . . . . . . . . . . . . . . 19,568 14,926 4,642 15,143 11,701 3,442 4,425 3,225 1,200 3,809 2,800 1,0091991 . . . . . . . . . . . . . . . . . . . . . 19,233 14,467 4,766 14,825 11,286 3,539 4,408 3,181 1,227 3,883 2,816 1,0671990 . . . . . . . . . . . . . . . . . . . . . 19,757 14,842 4,915 14,904 11,334 3,570 4,853 3,508 1,345 4,337 3,172 1,1651989 . . . . . . . . . . . . . . . . . . . . . 19,810 14,960 4,850 14,832 11,307 3,525 4,978 3,653 1,325 4,400 3,263 1,1371988 . . . . . . . . . . . . . . . . . . . . . 18,872 14,206 4,666 14,035 10,681 3,354 4,837 3,525 1,312 4,294 3,159 1,1351987 . . . . . . . . . . . . . . . . . . . . . 17,819 13,461 4,358 13,361 10,172 3,189 4,458 3,289 1,169 4,055 3,028 1,0271986 . . . . . . . . . . . . . . . . . . . . . 17,425 12,986 4,439 13,198 9,864 3,334 4,227 3,122 1,105 3,853 2,862 9911985 . . . . . . . . . . . . . . . . . . . . . 17,741 13,216 4,525 13,216 9,922 3,294 4,525 3,294 1,231 4,114 3,030 1,0841984 . . . . . . . . . . . . . . . . . . . . . 17,606 12,995 4,611 13,384 9,986 3,398 4,222 3,009 1,213 3,776 2,710 1,0661983 . . . . . . . . . . . . . . . . . . . . . 17,400 12,812 4,588 13,288 9,863 3,425 4,112 2,949 1,163 3,708 2,668 1,0401982 . . . . . . . . . . . . . . . . . . . . . 17,541 12,903 4,638 13,527 10,042 3,485 4,014 2,861 1,153 3,603 2,573 1,0301981 . . . . . . . . . . . . . . . . . . . . . 18,660 13,600 5,060 14,199 10,441 3,758 4,461 3,159 1,302 4,000 2,858 1,1421980 . . . . . . . . . . . . . . . . . . . . . 19,765 14,447 5,318 14,815 10,936 3,879 4,950 3,511 1,439 4,451 3,170 1,2811979 . . . . . . . . . . . . . . . . . . . . . 18,951 13,788 5,163 14,334 10,513 3,821 4,617 3,275 1,342 4,132 2,953 1,179
Death rate
1994 . . . . . . . . . . . . . . . . . . . . . 7.7 12.0 3.7 7.3 11.5 3.4 9.8 15.0 5.1 11.2 17.4 5.51993 . . . . . . . . . . . . . . . . . . . . . 7.6 11.8 3.5 7.1 11.1 3.3 9.9 15.4 4.9 11.4 18.1 5.31992 . . . . . . . . . . . . . . . . . . . . . 7.7 12.0 3.6 7.1 11.2 3.2 10.5 16.0 5.5 12.0 18.7 6.11991 . . . . . . . . . . . . . . . . . . . . . 7.6 11.8 3.7 7.0 10.9 3.3 10.7 16.1 5.7 12.5 19.1 6.51990 . . . . . . . . . . . . . . . . . . . . . 7.9 12.2 3.9 7.1 11.1 3.4 12.1 18.4 6.4 14.2 22.0 7.31989 . . . . . . . . . . . . . . . . . . . . . 8.0 12.4 3.8 7.1 11.1 3.3 12.7 19.5 6.5 14.6 22.9 7.21988 . . . . . . . . . . . . . . . . . . . . . 7.7 11.9 3.7 6.8 10.6 3.2 12.6 19.3 6.5 14.4 22.5 7.21987 . . . . . . . . . . . . . . . . . . . . . 7.4 11.4 3.5 6.5 10.2 3.0 11.9 18.4 6.0 13.8 21.8 6.61986 . . . . . . . . . . . . . . . . . . . . . 7.3 11.1 3.6 6.5 9.9 3.2 11.5 17.8 5.8 13.3 20.9 6.51985 . . . . . . . . . . . . . . . . . . . . . 7.5 11.4 3.7 6.5 10.1 3.2 12.6 19.3 6.5 14.4 22.4 7.21984 . . . . . . . . . . . . . . . . . . . . . 7.5 11.3 3.8 6.7 10.2 3.3 12.0 18.0 6.6 13.4 20.3 7.21983 . . . . . . . . . . . . . . . . . . . . . 7.4 11.3 3.8 6.7 10.1 3.4 12.0 18.0 6.5 13.3 20.3 7.11982 . . . . . . . . . . . . . . . . . . . . . 7.6 11.5 3.9 6.8 10.4 3.4 11.9 17.9 6.5 13.1 19.8 7.11981 . . . . . . . . . . . . . . . . . . . . . 8.1 12.2 4.3 7.2 10.9 3.7 13.6 20.2 7.6 14.7 22.3 8.01980 . . . . . . . . . . . . . . . . . . . . . 8.7 13.1 4.6 7.6 11.5 3.9 15.6 23.3 8.6 16.7 25.2 9.11979 . . . . . . . . . . . . . . . . . . . . . 8.4 12.6 4.5 7.4 11.1 3.8 15.0 22.4 8.3 15.7 23.7 8.5
Age-adjusted death rate1
1994 . . . . . . . . . . . . . . . . . . . . . 6.8 10.9 3.1 6.2 9.9 2.7 10.6 17.3 5.2 12.2 20.4 5.61993 . . . . . . . . . . . . . . . . . . . . . 6.7 10.8 3.0 6.1 9.7 2.7 10.8 17.8 5.0 12.5 21.3 5.51992 . . . . . . . . . . . . . . . . . . . . . 6.8 11.0 3.1 6.1 9.9 2.6 11.6 18.9 5.6 13.4 22.3 6.31991 . . . . . . . . . . . . . . . . . . . . . 6.8 10.9 3.2 6.0 9.7 2.7 11.8 19.2 5.9 13.9 22.9 6.81990 . . . . . . . . . . . . . . . . . . . . . 7.2 11.4 3.4 6.2 9.9 2.8 13.6 22.0 6.8 16.1 26.6 7.71989 . . . . . . . . . . . . . . . . . . . . . 7.3 11.7 3.4 6.2 9.9 2.8 14.3 23.3 6.9 16.6 27.7 7.81988 . . . . . . . . . . . . . . . . . . . . . 7.1 11.3 3.3 5.9 9.5 2.7 14.3 23.2 7.0 16.6 27.3 7.91987 . . . . . . . . . . . . . . . . . . . . . 6.8 10.9 3.2 5.8 9.2 2.6 13.5 22.2 6.5 15.9 26.7 7.31986 . . . . . . . . . . . . . . . . . . . . . 6.7 10.6 3.3 5.7 9.0 2.7 13.1 21.6 6.2 15.3 25.5 7.11985 . . . . . . . . . . . . . . . . . . . . . 7.0 11.0 3.4 5.8 9.2 2.8 14.6 23.5 7.2 16.8 27.7 8.01984 . . . . . . . . . . . . . . . . . . . . . 7.0 10.9 3.5 5.9 9.3 2.9 14.0 22.2 7.3 15.7 25.4 8.01983 . . . . . . . . . . . . . . . . . . . . . 7.0 10.9 3.5 6.0 9.3 2.9 14.0 22.3 7.3 15.8 25.4 8.01982 . . . . . . . . . . . . . . . . . . . . . 7.2 11.2 3.6 6.2 9.7 3.0 14.2 22.4 7.4 15.7 25.1 8.11981 . . . . . . . . . . . . . . . . . . . . . 7.8 12.0 4.1 6.6 10.2 3.3 16.3 25.6 8.7 17.9 28.5 9.31980 . . . . . . . . . . . . . . . . . . . . . 8.4 13.0 4.3 6.9 10.8 3.5 18.8 29.5 10.0 20.4 32.4 10.61979 . . . . . . . . . . . . . . . . . . . . . 8.2 12.6 4.3 6.8 10.6 3.5 18.1 28.3 9.7 19.2 30.4 10.1
1For method of computation, see ‘‘Technical notes.’’
Monthly Vital Statistics Report + Vol. 45, No. 3(S) + September 30, 1996 59
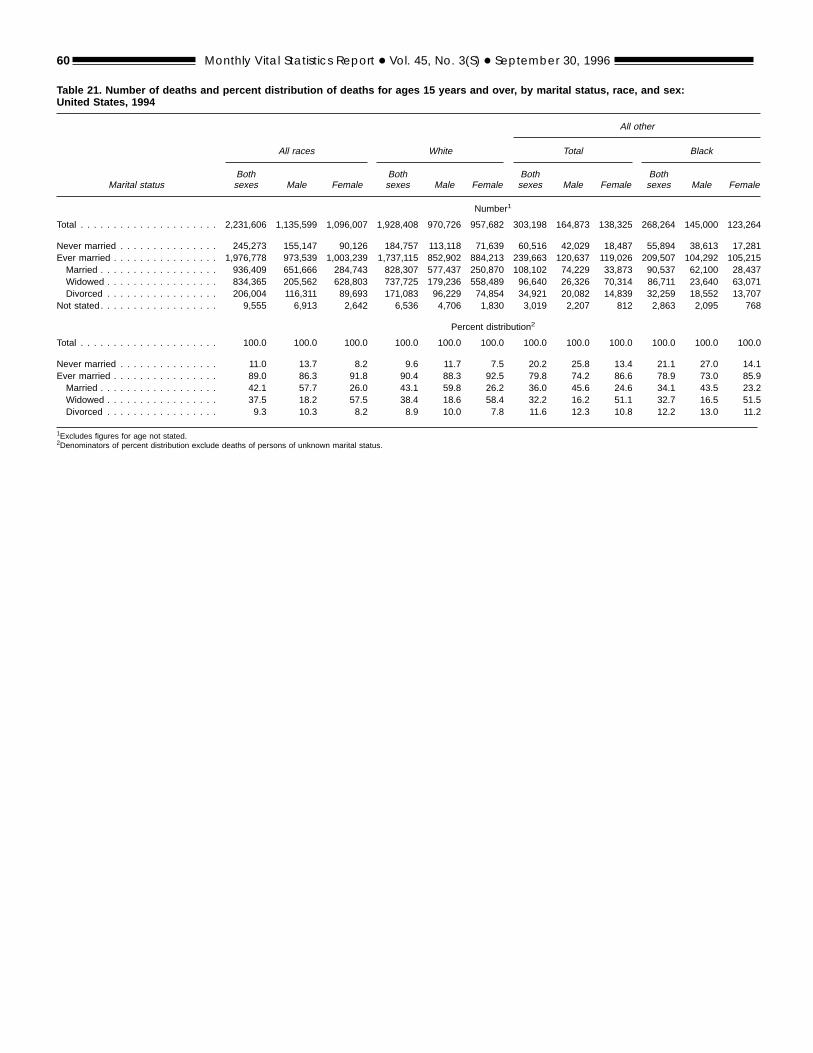
Table 21. Number of deaths and percent distribution of deaths for ages 15 years and over, by marital status, race, and sex:United States, 1994
Marital status
All other
All races White Total Black
Bothsexes Male Female
Bothsexes Male Female
Bothsexes Male Female
Bothsexes Male Female
Number1
Total . . . . . . . . . . . . . . . . . . . . . 2,231,606 1,135,599 1,096,007 1,928,408 970,726 957,682 303,198 164,873 138,325 268,264 145,000 123,264
Never married . . . . . . . . . . . . . . . 245,273 155,147 90,126 184,757 113,118 71,639 60,516 42,029 18,487 55,894 38,613 17,281Ever married . . . . . . . . . . . . . . . . 1,976,778 973,539 1,003,239 1,737,115 852,902 884,213 239,663 120,637 119,026 209,507 104,292 105,215Married . . . . . . . . . . . . . . . . . . 936,409 651,666 284,743 828,307 577,437 250,870 108,102 74,229 33,873 90,537 62,100 28,437Widowed . . . . . . . . . . . . . . . . . 834,365 205,562 628,803 737,725 179,236 558,489 96,640 26,326 70,314 86,711 23,640 63,071Divorced . . . . . . . . . . . . . . . . . 206,004 116,311 89,693 171,083 96,229 74,854 34,921 20,082 14,839 32,259 18,552 13,707
Not stated. . . . . . . . . . . . . . . . . . 9,555 6,913 2,642 6,536 4,706 1,830 3,019 2,207 812 2,863 2,095 768
Percent distribution2
Total . . . . . . . . . . . . . . . . . . . . . 100.0 100.0 100.0 100.0 100.0 100.0 100.0 100.0 100.0 100.0 100.0 100.0
Never married . . . . . . . . . . . . . . . 11.0 13.7 8.2 9.6 11.7 7.5 20.2 25.8 13.4 21.1 27.0 14.1Ever married . . . . . . . . . . . . . . . . 89.0 86.3 91.8 90.4 88.3 92.5 79.8 74.2 86.6 78.9 73.0 85.9Married . . . . . . . . . . . . . . . . . . 42.1 57.7 26.0 43.1 59.8 26.2 36.0 45.6 24.6 34.1 43.5 23.2Widowed . . . . . . . . . . . . . . . . . 37.5 18.2 57.5 38.4 18.6 58.4 32.2 16.2 51.1 32.7 16.5 51.5Divorced . . . . . . . . . . . . . . . . . 9.3 10.3 8.2 8.9 10.0 7.8 11.6 12.3 10.8 12.2 13.0 11.2
1Excludes figures for age not stated.2Denominators of percent distribution exclude deaths of persons of unknown marital status.
60 Monthly Vital Statistics Report + Vol. 45, No. 3(S) + September 30, 1996
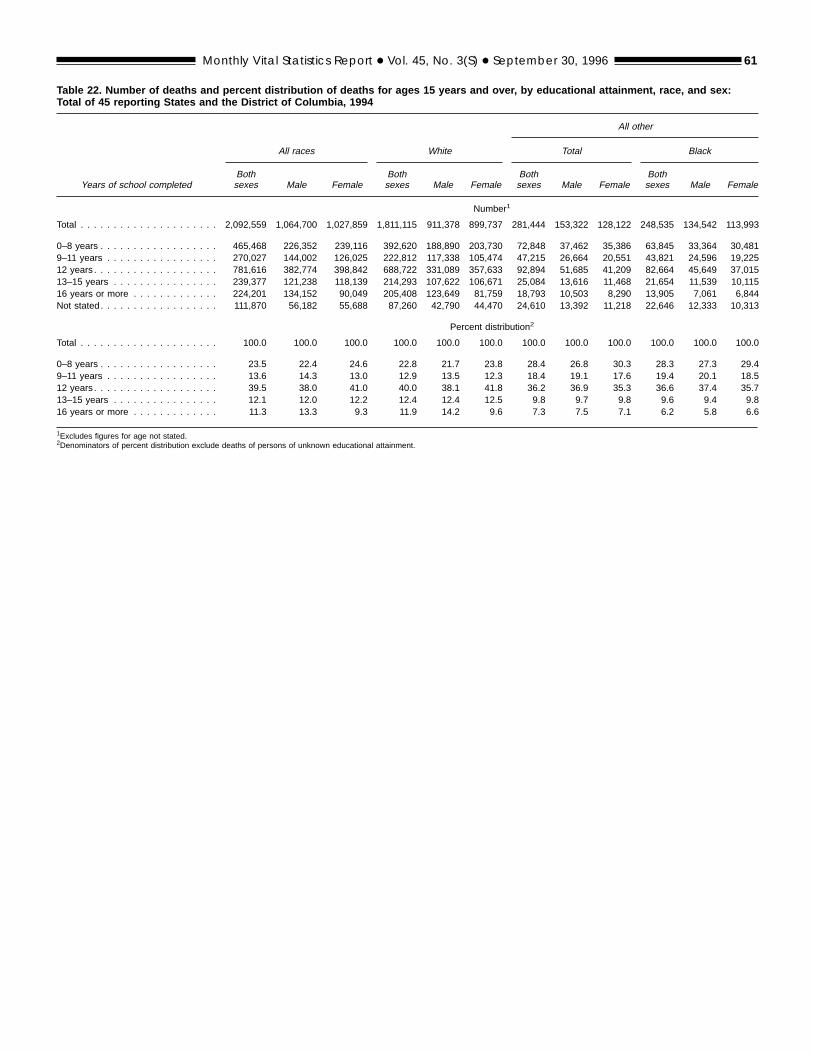
Table 22. Number of deaths and percent distribution of deaths for ages 15 years and over, by educational attainment, race, and sex:Total of 45 reporting States and the District of Columbia, 1994
Years of school completed
All other
All races White Total Black
Bothsexes Male Female
Bothsexes Male Female
Bothsexes Male Female
Bothsexes Male Female
Number1
Total . . . . . . . . . . . . . . . . . . . . . 2,092,559 1,064,700 1,027,859 1,811,115 911,378 899,737 281,444 153,322 128,122 248,535 134,542 113,993
0–8 years . . . . . . . . . . . . . . . . . . 465,468 226,352 239,116 392,620 188,890 203,730 72,848 37,462 35,386 63,845 33,364 30,4819–11 years . . . . . . . . . . . . . . . . . 270,027 144,002 126,025 222,812 117,338 105,474 47,215 26,664 20,551 43,821 24,596 19,22512 years . . . . . . . . . . . . . . . . . . . 781,616 382,774 398,842 688,722 331,089 357,633 92,894 51,685 41,209 82,664 45,649 37,01513–15 years . . . . . . . . . . . . . . . . 239,377 121,238 118,139 214,293 107,622 106,671 25,084 13,616 11,468 21,654 11,539 10,11516 years or more . . . . . . . . . . . . . 224,201 134,152 90,049 205,408 123,649 81,759 18,793 10,503 8,290 13,905 7,061 6,844Not stated. . . . . . . . . . . . . . . . . . 111,870 56,182 55,688 87,260 42,790 44,470 24,610 13,392 11,218 22,646 12,333 10,313
Percent distribution2
Total . . . . . . . . . . . . . . . . . . . . . 100.0 100.0 100.0 100.0 100.0 100.0 100.0 100.0 100.0 100.0 100.0 100.0
0–8 years . . . . . . . . . . . . . . . . . . 23.5 22.4 24.6 22.8 21.7 23.8 28.4 26.8 30.3 28.3 27.3 29.49–11 years . . . . . . . . . . . . . . . . . 13.6 14.3 13.0 12.9 13.5 12.3 18.4 19.1 17.6 19.4 20.1 18.512 years . . . . . . . . . . . . . . . . . . . 39.5 38.0 41.0 40.0 38.1 41.8 36.2 36.9 35.3 36.6 37.4 35.713–15 years . . . . . . . . . . . . . . . . 12.1 12.0 12.2 12.4 12.4 12.5 9.8 9.7 9.8 9.6 9.4 9.816 years or more . . . . . . . . . . . . . 11.3 13.3 9.3 11.9 14.2 9.6 7.3 7.5 7.1 6.2 5.8 6.6
1Excludes figures for age not stated.2Denominators of percent distribution exclude deaths of persons of unknown educational attainment.
Monthly Vital Statistics Report + Vol. 45, No. 3(S) + September 30, 1996 61
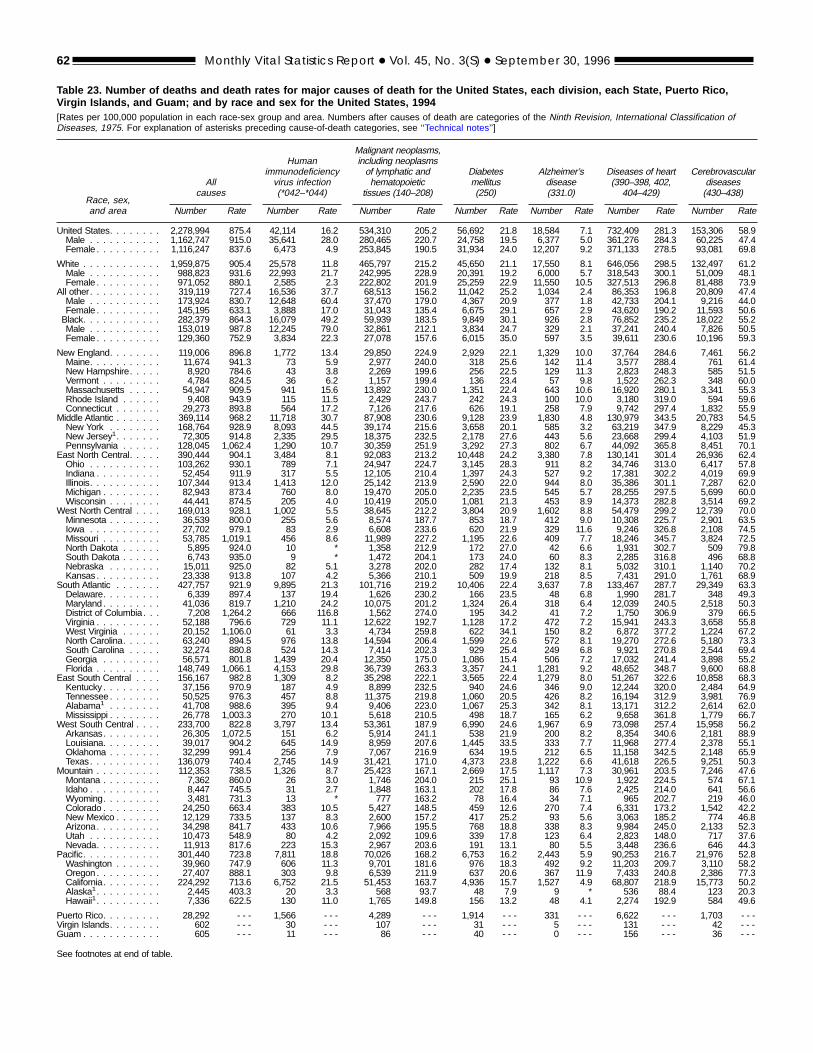
Table 23. Number of deaths and death rates for major causes of death for the United States, each division, each State, Puerto Rico,Virgin Islands, and Guam; and by race and sex for the United States, 1994[Rates per 100,000 population in each race-sex group and area. Numbers after causes of death are categories of the Ninth Revision, International Classification ofDiseases, 1975. For explanation of asterisks preceding cause-of-death categories, see ‘‘Technical notes’’]
Race, sex,and area
Allcauses
Humanimmunodeficiencyvirus infection(*042–*044)
Malignant neoplasms,including neoplasmsof lymphatic andhematopoietic
tissues (140–208)
Diabetesmellitus(250)
Alzheimer’sdisease(331.0)
Diseases of heart(390–398, 402,
404–429)
Cerebrovasculardiseases(430–438)
Number Rate Number Rate Number Rate Number Rate Number Rate Number Rate Number Rate
United States. . . . . . . . 2,278,994 875.4 42,114 16.2 534,310 205.2 56,692 21.8 18,584 7.1 732,409 281.3 153,306 58.9Male . . . . . . . . . . . 1,162,747 915.0 35,641 28.0 280,465 220.7 24,758 19.5 6,377 5.0 361,276 284.3 60,225 47.4Female . . . . . . . . . . 1,116,247 837.6 6,473 4.9 253,845 190.5 31,934 24.0 12,207 9.2 371,133 278.5 93,081 69.8
White . . . . . . . . . . . . 1,959,875 905.4 25,578 11.8 465,797 215.2 45,650 21.1 17,550 8.1 646,056 298.5 132,497 61.2Male . . . . . . . . . . . 988,823 931.6 22,993 21.7 242,995 228.9 20,391 19.2 6,000 5.7 318,543 300.1 51,009 48.1Female . . . . . . . . . . 971,052 880.1 2,585 2.3 222,802 201.9 25,259 22.9 11,550 10.5 327,513 296.8 81,488 73.9
All other. . . . . . . . . . . 319,119 727.4 16,536 37.7 68,513 156.2 11,042 25.2 1,034 2.4 86,353 196.8 20,809 47.4Male . . . . . . . . . . . 173,924 830.7 12,648 60.4 37,470 179.0 4,367 20.9 377 1.8 42,733 204.1 9,216 44.0Female . . . . . . . . . . 145,195 633.1 3,888 17.0 31,043 135.4 6,675 29.1 657 2.9 43,620 190.2 11,593 50.6Black. . . . . . . . . . . . 282,379 864.3 16,079 49.2 59,939 183.5 9,849 30.1 926 2.8 76,852 235.2 18,022 55.2Male . . . . . . . . . . . 153,019 987.8 12,245 79.0 32,861 212.1 3,834 24.7 329 2.1 37,241 240.4 7,826 50.5Female . . . . . . . . . . 129,360 752.9 3,834 22.3 27,078 157.6 6,015 35.0 597 3.5 39,611 230.6 10,196 59.3
New England. . . . . . . . 119,006 896.8 1,772 13.4 29,850 224.9 2,929 22.1 1,329 10.0 37,764 284.6 7,461 56.2Maine. . . . . . . . . . . 11,674 941.3 73 5.9 2,977 240.0 318 25.6 142 11.4 3,577 288.4 761 61.4New Hampshire. . . . . 8,920 784.6 43 3.8 2,269 199.6 256 22.5 129 11.3 2,823 248.3 585 51.5Vermont . . . . . . . . . 4,784 824.5 36 6.2 1,157 199.4 136 23.4 57 9.8 1,522 262.3 348 60.0Massachusetts . . . . . 54,947 909.5 941 15.6 13,892 230.0 1,351 22.4 643 10.6 16,920 280.1 3,341 55.3Rhode Island . . . . . . 9,408 943.9 115 11.5 2,429 243.7 242 24.3 100 10.0 3,180 319.0 594 59.6Connecticut . . . . . . . 29,273 893.8 564 17.2 7,126 217.6 626 19.1 258 7.9 9,742 297.4 1,832 55.9
Middle Atlantic . . . . . . . 369,114 968.2 11,718 30.7 87,908 230.6 9,128 23.9 1,830 4.8 130,979 343.5 20,783 54.5New York . . . . . . . . 168,764 928.9 8,093 44.5 39,174 215.6 3,658 20.1 585 3.2 63,219 347.9 8,229 45.3New Jersey1. . . . . . . 72,305 914.8 2,335 29.5 18,375 232.5 2,178 27.6 443 5.6 23,668 299.4 4,103 51.9Pennsylvania . . . . . . 128,045 1,062.4 1,290 10.7 30,359 251.9 3,292 27.3 802 6.7 44,092 365.8 8,451 70.1
East North Central. . . . . 390,444 904.1 3,484 8.1 92,083 213.2 10,448 24.2 3,380 7.8 130,141 301.4 26,936 62.4Ohio . . . . . . . . . . . 103,262 930.1 789 7.1 24,947 224.7 3,145 28.3 911 8.2 34,746 313.0 6,417 57.8Indiana . . . . . . . . . . 52,454 911.9 317 5.5 12,105 210.4 1,397 24.3 527 9.2 17,381 302.2 4,019 69.9Illinois. . . . . . . . . . . 107,344 913.4 1,413 12.0 25,142 213.9 2,590 22.0 944 8.0 35,386 301.1 7,287 62.0Michigan . . . . . . . . . 82,943 873.4 760 8.0 19,470 205.0 2,235 23.5 545 5.7 28,255 297.5 5,699 60.0Wisconsin . . . . . . . . 44,441 874.5 205 4.0 10,419 205.0 1,081 21.3 453 8.9 14,373 282.8 3,514 69.2
West North Central . . . . 169,013 928.1 1,002 5.5 38,645 212.2 3,804 20.9 1,602 8.8 54,479 299.2 12,739 70.0Minnesota . . . . . . . . 36,539 800.0 255 5.6 8,574 187.7 853 18.7 412 9.0 10,308 225.7 2,901 63.5Iowa . . . . . . . . . . . 27,702 979.1 83 2.9 6,608 233.6 620 21.9 329 11.6 9,246 326.8 2,108 74.5Missouri . . . . . . . . . 53,785 1,019.1 456 8.6 11,989 227.2 1,195 22.6 409 7.7 18,246 345.7 3,824 72.5North Dakota . . . . . . 5,895 924.0 10 * 1,358 212.9 172 27.0 42 6.6 1,931 302.7 509 79.8South Dakota . . . . . . 6,743 935.0 9 * 1,472 204.1 173 24.0 60 8.3 2,285 316.8 496 68.8Nebraska . . . . . . . . 15,011 925.0 82 5.1 3,278 202.0 282 17.4 132 8.1 5,032 310.1 1,140 70.2Kansas . . . . . . . . . . 23,338 913.8 107 4.2 5,366 210.1 509 19.9 218 8.5 7,431 291.0 1,761 68.9
South Atlantic . . . . . . . 427,757 921.9 9,895 21.3 101,716 219.2 10,406 22.4 3,637 7.8 133,467 287.7 29,349 63.3Delaware. . . . . . . . . 6,339 897.4 137 19.4 1,626 230.2 166 23.5 48 6.8 1,990 281.7 348 49.3Maryland . . . . . . . . . 41,036 819.7 1,210 24.2 10,075 201.2 1,324 26.4 318 6.4 12,039 240.5 2,518 50.3District of Columbia. . . 7,208 1,264.2 666 116.8 1,562 274.0 195 34.2 41 7.2 1,750 306.9 379 66.5Virginia . . . . . . . . . . 52,188 796.6 729 11.1 12,622 192.7 1,128 17.2 472 7.2 15,941 243.3 3,658 55.8West Virginia . . . . . . 20,152 1,106.0 61 3.3 4,734 259.8 622 34.1 150 8.2 6,872 377.2 1,224 67.2North Carolina. . . . . . 63,240 894.5 976 13.8 14,594 206.4 1,599 22.6 572 8.1 19,270 272.6 5,180 73.3South Carolina . . . . . 32,274 880.8 524 14.3 7,414 202.3 929 25.4 249 6.8 9,921 270.8 2,544 69.4Georgia . . . . . . . . . 56,571 801.8 1,439 20.4 12,350 175.0 1,086 15.4 506 7.2 17,032 241.4 3,898 55.2Florida . . . . . . . . . . 148,749 1,066.1 4,153 29.8 36,739 263.3 3,357 24.1 1,281 9.2 48,652 348.7 9,600 68.8
East South Central . . . . 156,167 982.8 1,309 8.2 35,298 222.1 3,565 22.4 1,279 8.0 51,267 322.6 10,858 68.3Kentucky . . . . . . . . . 37,156 970.9 187 4.9 8,899 232.5 940 24.6 346 9.0 12,244 320.0 2,484 64.9Tennessee . . . . . . . . 50,525 976.3 457 8.8 11,375 219.8 1,060 20.5 426 8.2 16,194 312.9 3,981 76.9Alabama1 . . . . . . . . 41,708 988.6 395 9.4 9,406 223.0 1,067 25.3 342 8.1 13,171 312.2 2,614 62.0Mississippi . . . . . . . . 26,778 1,003.3 270 10.1 5,618 210.5 498 18.7 165 6.2 9,658 361.8 1,779 66.7
West South Central . . . . 233,700 822.8 3,797 13.4 53,361 187.9 6,990 24.6 1,967 6.9 73,098 257.4 15,958 56.2Arkansas. . . . . . . . . 26,305 1,072.5 151 6.2 5,914 241.1 538 21.9 200 8.2 8,354 340.6 2,181 88.9Louisiana. . . . . . . . . 39,017 904.2 645 14.9 8,959 207.6 1,445 33.5 333 7.7 11,968 277.4 2,378 55.1Oklahoma . . . . . . . . 32,299 991.4 256 7.9 7,067 216.9 634 19.5 212 6.5 11,158 342.5 2,148 65.9Texas. . . . . . . . . . . 136,079 740.4 2,745 14.9 31,421 171.0 4,373 23.8 1,222 6.6 41,618 226.5 9,251 50.3
Mountain . . . . . . . . . . 112,353 738.5 1,326 8.7 25,423 167.1 2,669 17.5 1,117 7.3 30,961 203.5 7,246 47.6Montana . . . . . . . . . 7,362 860.0 26 3.0 1,746 204.0 215 25.1 93 10.9 1,922 224.5 574 67.1Idaho . . . . . . . . . . . 8,447 745.5 31 2.7 1,848 163.1 202 17.8 86 7.6 2,425 214.0 641 56.6Wyoming. . . . . . . . . 3,481 731.3 13 * 777 163.2 78 16.4 34 7.1 965 202.7 219 46.0Colorado . . . . . . . . . 24,250 663.4 383 10.5 5,427 148.5 459 12.6 270 7.4 6,331 173.2 1,542 42.2New Mexico . . . . . . . 12,129 733.5 137 8.3 2,600 157.2 417 25.2 93 5.6 3,063 185.2 774 46.8Arizona. . . . . . . . . . 34,298 841.7 433 10.6 7,966 195.5 768 18.8 338 8.3 9,984 245.0 2,133 52.3Utah . . . . . . . . . . . 10,473 548.9 80 4.2 2,092 109.6 339 17.8 123 6.4 2,823 148.0 717 37.6Nevada. . . . . . . . . . 11,913 817.6 223 15.3 2,967 203.6 191 13.1 80 5.5 3,448 236.6 646 44.3
Pacific. . . . . . . . . . . . 301,440 723.8 7,811 18.8 70,026 168.2 6,753 16.2 2,443 5.9 90,253 216.7 21,976 52.8Washington . . . . . . . 39,960 747.9 606 11.3 9,701 181.6 976 18.3 492 9.2 11,203 209.7 3,110 58.2Oregon . . . . . . . . . . 27,407 888.1 303 9.8 6,539 211.9 637 20.6 367 11.9 7,433 240.8 2,386 77.3California. . . . . . . . . 224,292 713.6 6,752 21.5 51,453 163.7 4,936 15.7 1,527 4.9 68,807 218.9 15,773 50.2Alaska1. . . . . . . . . . 2,445 403.3 20 3.3 568 93.7 48 7.9 9 * 536 88.4 123 20.3Hawaii1. . . . . . . . . . 7,336 622.5 130 11.0 1,765 149.8 156 13.2 48 4.1 2,274 192.9 584 49.6
Puerto Rico. . . . . . . . . 28,292 - - - 1,566 - - - 4,289 - - - 1,914 - - - 331 - - - 6,622 - - - 1,703 - - -Virgin Islands. . . . . . . . 602 - - - 30 - - - 107 - - - 31 - - - 5 - - - 131 - - - 42 - - -Guam . . . . . . . . . . . . 605 - - - 11 - - - 86 - - - 40 - - - 0 - - - 156 - - - 36 - - -
See footnotes at end of table.
62 Monthly Vital Statistics Report + Vol. 45, No. 3(S) + September 30, 1996
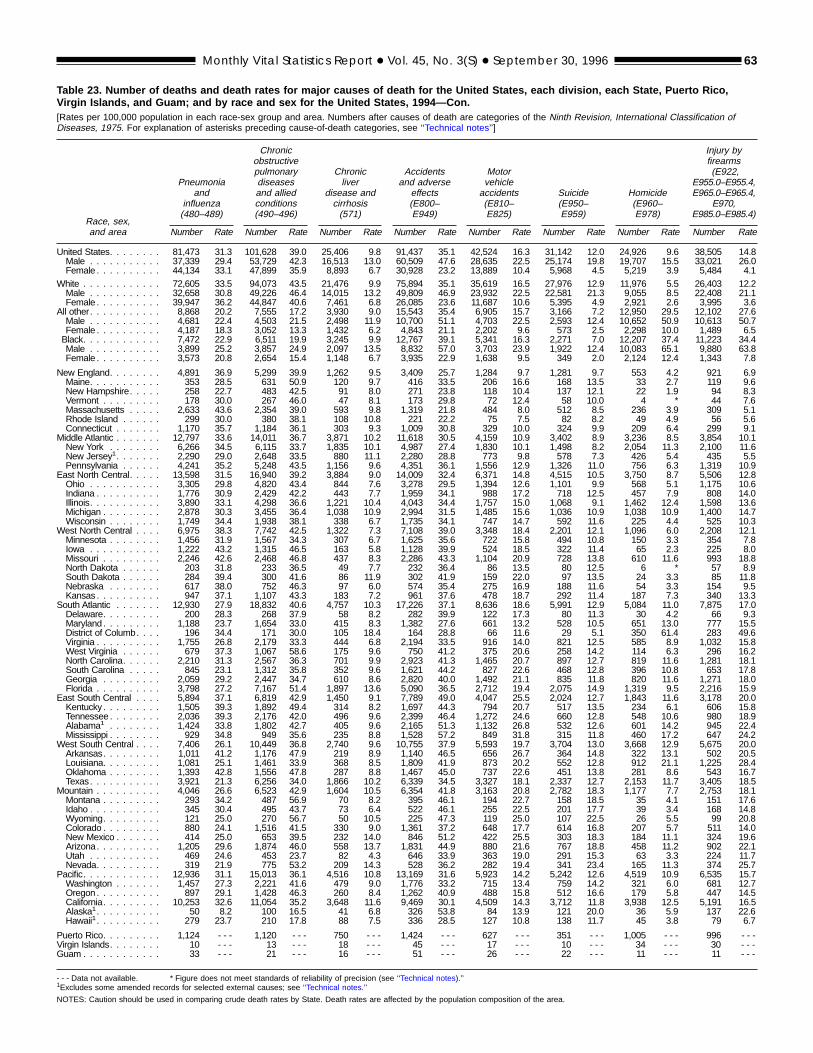
Table 23. Number of deaths and death rates for major causes of death for the United States, each division, each State, Puerto Rico,Virgin Islands, and Guam; and by race and sex for the United States, 1994—Con.[Rates per 100,000 population in each race-sex group and area. Numbers after causes of death are categories of the Ninth Revision, International Classification ofDiseases, 1975. For explanation of asterisks preceding cause-of-death categories, see ‘‘Technical notes’’]
Race, sex,and area
Pneumoniaand
influenza(480–489)
Chronicobstructivepulmonarydiseasesand alliedconditions(490–496)
Chronicliver
disease andcirrhosis(571)
Accidentsand adverse
effects(E800–E949)
Motorvehicleaccidents(E810–E825)
Suicide(E950–E959)
Homicide(E960–E978)
Injury byfirearms(E922,
E955.0–E955.4,E965.0–E965.4,
E970,E985.0–E985.4)
Number Rate Number Rate Number Rate Number Rate Number Rate Number Rate Number Rate Number Rate
United States. . . . . . . . 81,473 31.3 101,628 39.0 25,406 9.8 91,437 35.1 42,524 16.3 31,142 12.0 24,926 9.6 38,505 14.8Male . . . . . . . . . . . 37,339 29.4 53,729 42.3 16,513 13.0 60,509 47.6 28,635 22.5 25,174 19.8 19,707 15.5 33,021 26.0Female . . . . . . . . . . 44,134 33.1 47,899 35.9 8,893 6.7 30,928 23.2 13,889 10.4 5,968 4.5 5,219 3.9 5,484 4.1
White . . . . . . . . . . . . 72,605 33.5 94,073 43.5 21,476 9.9 75,894 35.1 35,619 16.5 27,976 12.9 11,976 5.5 26,403 12.2Male . . . . . . . . . . . 32,658 30.8 49,226 46.4 14,015 13.2 49,809 46.9 23,932 22.5 22,581 21.3 9,055 8.5 22,408 21.1Female . . . . . . . . . . 39,947 36.2 44,847 40.6 7,461 6.8 26,085 23.6 11,687 10.6 5,395 4.9 2,921 2.6 3,995 3.6
All other. . . . . . . . . . . 8,868 20.2 7,555 17.2 3,930 9.0 15,543 35.4 6,905 15.7 3,166 7.2 12,950 29.5 12,102 27.6Male . . . . . . . . . . . 4,681 22.4 4,503 21.5 2,498 11.9 10,700 51.1 4,703 22.5 2,593 12.4 10,652 50.9 10,613 50.7Female . . . . . . . . . . 4,187 18.3 3,052 13.3 1,432 6.2 4,843 21.1 2,202 9.6 573 2.5 2,298 10.0 1,489 6.5Black. . . . . . . . . . . . 7,472 22.9 6,511 19.9 3,245 9.9 12,767 39.1 5,341 16.3 2,271 7.0 12,207 37.4 11,223 34.4Male . . . . . . . . . . . 3,899 25.2 3,857 24.9 2,097 13.5 8,832 57.0 3,703 23.9 1,922 12.4 10,083 65.1 9,880 63.8Female . . . . . . . . . . 3,573 20.8 2,654 15.4 1,148 6.7 3,935 22.9 1,638 9.5 349 2.0 2,124 12.4 1,343 7.8
New England. . . . . . . . 4,891 36.9 5,299 39.9 1,262 9.5 3,409 25.7 1,284 9.7 1,281 9.7 553 4.2 921 6.9Maine. . . . . . . . . . . 353 28.5 631 50.9 120 9.7 416 33.5 206 16.6 168 13.5 33 2.7 119 9.6New Hampshire. . . . . 258 22.7 483 42.5 91 8.0 271 23.8 118 10.4 137 12.1 22 1.9 94 8.3Vermont . . . . . . . . . 178 30.0 267 46.0 47 8.1 173 29.8 72 12.4 58 10.0 4 * 44 7.6Massachusetts . . . . . 2,633 43.6 2,354 39.0 593 9.8 1,319 21.8 484 8.0 512 8.5 236 3.9 309 5.1Rhode Island . . . . . . 299 30.0 380 38.1 108 10.8 221 22.2 75 7.5 82 8.2 49 4.9 56 5.6Connecticut . . . . . . . 1,170 35.7 1,184 36.1 303 9.3 1,009 30.8 329 10.0 324 9.9 209 6.4 299 9.1
Middle Atlantic . . . . . . . 12,797 33.6 14,011 36.7 3,871 10.2 11,618 30.5 4,159 10.9 3,402 8.9 3,236 8.5 3,854 10.1New York . . . . . . . . 6,266 34.5 6,115 33.7 1,835 10.1 4,987 27.4 1,830 10.1 1,498 8.2 2,054 11.3 2,100 11.6New Jersey1. . . . . . . 2,290 29.0 2,648 33.5 880 11.1 2,280 28.8 773 9.8 578 7.3 426 5.4 435 5.5Pennsylvania . . . . . . 4,241 35.2 5,248 43.5 1,156 9.6 4,351 36.1 1,556 12.9 1,326 11.0 756 6.3 1,319 10.9
East North Central. . . . . 13,598 31.5 16,940 39.2 3,884 9.0 14,009 32.4 6,371 14.8 4,515 10.5 3,750 8.7 5,506 12.8Ohio . . . . . . . . . . . 3,305 29.8 4,820 43.4 844 7.6 3,278 29.5 1,394 12.6 1,101 9.9 568 5.1 1,175 10.6Indiana . . . . . . . . . . 1,776 30.9 2,429 42.2 443 7.7 1,959 34.1 988 17.2 718 12.5 457 7.9 808 14.0Illinois. . . . . . . . . . . 3,890 33.1 4,298 36.6 1,221 10.4 4,043 34.4 1,757 15.0 1,068 9.1 1,462 12.4 1,598 13.6Michigan . . . . . . . . . 2,878 30.3 3,455 36.4 1,038 10.9 2,994 31.5 1,485 15.6 1,036 10.9 1,038 10.9 1,400 14.7Wisconsin . . . . . . . . 1,749 34.4 1,938 38.1 338 6.7 1,735 34.1 747 14.7 592 11.6 225 4.4 525 10.3
West North Central . . . . 6,975 38.3 7,742 42.5 1,322 7.3 7,108 39.0 3,348 18.4 2,201 12.1 1,096 6.0 2,208 12.1Minnesota . . . . . . . . 1,456 31.9 1,567 34.3 307 6.7 1,625 35.6 722 15.8 494 10.8 150 3.3 354 7.8Iowa . . . . . . . . . . . 1,222 43.2 1,315 46.5 163 5.8 1,128 39.9 524 18.5 322 11.4 65 2.3 225 8.0Missouri . . . . . . . . . 2,246 42.6 2,468 46.8 437 8.3 2,286 43.3 1,104 20.9 728 13.8 610 11.6 993 18.8North Dakota . . . . . . 203 31.8 233 36.5 49 7.7 232 36.4 86 13.5 80 12.5 6 * 57 8.9South Dakota . . . . . . 284 39.4 300 41.6 86 11.9 302 41.9 159 22.0 97 13.5 24 3.3 85 11.8Nebraska . . . . . . . . 617 38.0 752 46.3 97 6.0 574 35.4 275 16.9 188 11.6 54 3.3 154 9.5Kansas . . . . . . . . . . 947 37.1 1,107 43.3 183 7.2 961 37.6 478 18.7 292 11.4 187 7.3 340 13.3
South Atlantic . . . . . . . 12,930 27.9 18,832 40.6 4,757 10.3 17,226 37.1 8,636 18.6 5,991 12.9 5,084 11.0 7,875 17.0Delaware. . . . . . . . . 200 28.3 268 37.9 58 8.2 282 39.9 122 17.3 80 11.3 30 4.2 66 9.3Maryland . . . . . . . . . 1,188 23.7 1,654 33.0 415 8.3 1,382 27.6 661 13.2 528 10.5 651 13.0 777 15.5District of Columb. . . . 196 34.4 171 30.0 105 18.4 164 28.8 66 11.6 29 5.1 350 61.4 283 49.6Virginia . . . . . . . . . . 1,755 26.8 2,179 33.3 444 6.8 2,194 33.5 916 14.0 821 12.5 585 8.9 1,032 15.8West Virginia . . . . . . 679 37.3 1,067 58.6 175 9.6 750 41.2 375 20.6 258 14.2 114 6.3 296 16.2North Carolina. . . . . . 2,210 31.3 2,567 36.3 701 9.9 2,923 41.3 1,465 20.7 897 12.7 819 11.6 1,281 18.1South Carolina . . . . . 845 23.1 1,312 35.8 352 9.6 1,621 44.2 827 22.6 468 12.8 396 10.8 653 17.8Georgia . . . . . . . . . 2,059 29.2 2,447 34.7 610 8.6 2,820 40.0 1,492 21.1 835 11.8 820 11.6 1,271 18.0Florida . . . . . . . . . . 3,798 27.2 7,167 51.4 1,897 13.6 5,090 36.5 2,712 19.4 2,075 14.9 1,319 9.5 2,216 15.9
East South Central . . . . 5,894 37.1 6,819 42.9 1,450 9.1 7,789 49.0 4,047 25.5 2,024 12.7 1,843 11.6 3,178 20.0Kentucky . . . . . . . . . 1,505 39.3 1,892 49.4 314 8.2 1,697 44.3 794 20.7 517 13.5 234 6.1 606 15.8Tennessee . . . . . . . . 2,036 39.3 2,176 42.0 496 9.6 2,399 46.4 1,272 24.6 660 12.8 548 10.6 980 18.9Alabama1 . . . . . . . . 1,424 33.8 1,802 42.7 405 9.6 2,165 51.3 1,132 26.8 532 12.6 601 14.2 945 22.4Mississippi . . . . . . . . 929 34.8 949 35.6 235 8.8 1,528 57.2 849 31.8 315 11.8 460 17.2 647 24.2
West South Central . . . . 7,406 26.1 10,449 36.8 2,740 9.6 10,755 37.9 5,593 19.7 3,704 13.0 3,668 12.9 5,675 20.0Arkansas. . . . . . . . . 1,011 41.2 1,176 47.9 219 8.9 1,140 46.5 656 26.7 364 14.8 322 13.1 502 20.5Louisiana. . . . . . . . . 1,081 25.1 1,461 33.9 368 8.5 1,809 41.9 873 20.2 552 12.8 912 21.1 1,225 28.4Oklahoma . . . . . . . . 1,393 42.8 1,556 47.8 287 8.8 1,467 45.0 737 22.6 451 13.8 281 8.6 543 16.7Texas. . . . . . . . . . . 3,921 21.3 6,256 34.0 1,866 10.2 6,339 34.5 3,327 18.1 2,337 12.7 2,153 11.7 3,405 18.5
Mountain . . . . . . . . . . 4,046 26.6 6,523 42.9 1,604 10.5 6,354 41.8 3,163 20.8 2,782 18.3 1,177 7.7 2,753 18.1Montana . . . . . . . . . 293 34.2 487 56.9 70 8.2 395 46.1 194 22.7 158 18.5 35 4.1 151 17.6Idaho . . . . . . . . . . . 345 30.4 495 43.7 73 6.4 522 46.1 255 22.5 201 17.7 39 3.4 168 14.8Wyoming. . . . . . . . . 121 25.0 270 56.7 50 10.5 225 47.3 119 25.0 107 22.5 26 5.5 99 20.8Colorado . . . . . . . . . 880 24.1 1,516 41.5 330 9.0 1,361 37.2 648 17.7 614 16.8 207 5.7 511 14.0New Mexico . . . . . . . 414 25.0 653 39.5 232 14.0 846 51.2 422 25.5 303 18.3 184 11.1 324 19.6Arizona. . . . . . . . . . 1,205 29.6 1,874 46.0 558 13.7 1,831 44.9 880 21.6 767 18.8 458 11.2 902 22.1Utah . . . . . . . . . . . 469 24.6 453 23.7 82 4.3 646 33.9 363 19.0 291 15.3 63 3.3 224 11.7Nevada. . . . . . . . . . 319 21.9 775 53.2 209 14.3 528 36.2 282 19.4 341 23.4 165 11.3 374 25.7
Pacific. . . . . . . . . . . . 12,936 31.1 15,013 36.1 4,516 10.8 13,169 31.6 5,923 14.2 5,242 12.6 4,519 10.9 6,535 15.7Washington . . . . . . . 1,457 27.3 2,221 41.6 479 9.0 1,776 33.2 715 13.4 759 14.2 321 6.0 681 12.7Oregon . . . . . . . . . . 897 29.1 1,428 46.3 260 8.4 1,262 40.9 488 15.8 512 16.6 179 5.8 447 14.5California. . . . . . . . . 10,253 32.6 11,054 35.2 3,648 11.6 9,469 30.1 4,509 14.3 3,712 11.8 3,938 12.5 5,191 16.5Alaska1. . . . . . . . . . 50 8.2 100 16.5 41 6.8 326 53.8 84 13.9 121 20.0 36 5.9 137 22.6Hawaii1. . . . . . . . . . 279 23.7 210 17.8 88 7.5 336 28.5 127 10.8 138 11.7 45 3.8 79 6.7
Puerto Rico. . . . . . . . . 1,124 - - - 1,120 - - - 750 - - - 1,424 - - - 627 - - - 351 - - - 1,005 - - - 996 - - -Virgin Islands. . . . . . . . 10 - - - 13 - - - 18 - - - 45 - - - 17 - - - 10 - - - 34 - - - 30 - - -Guam . . . . . . . . . . . . 33 - - - 21 - - - 16 - - - 51 - - - 26 - - - 22 - - - 11 - - - 11 - - -
- - - Data not available. * Figure does not meet standards of reliability of precision (see ‘‘Technical notes).’’1Excludes some amended records for selected external causes; see ‘‘Technical notes.’’
NOTES: Caution should be used in comparing crude death rates by State. Death rates are affected by the population composition of the area.
Monthly Vital Statistics Report + Vol. 45, No. 3(S) + September 30, 1996 63
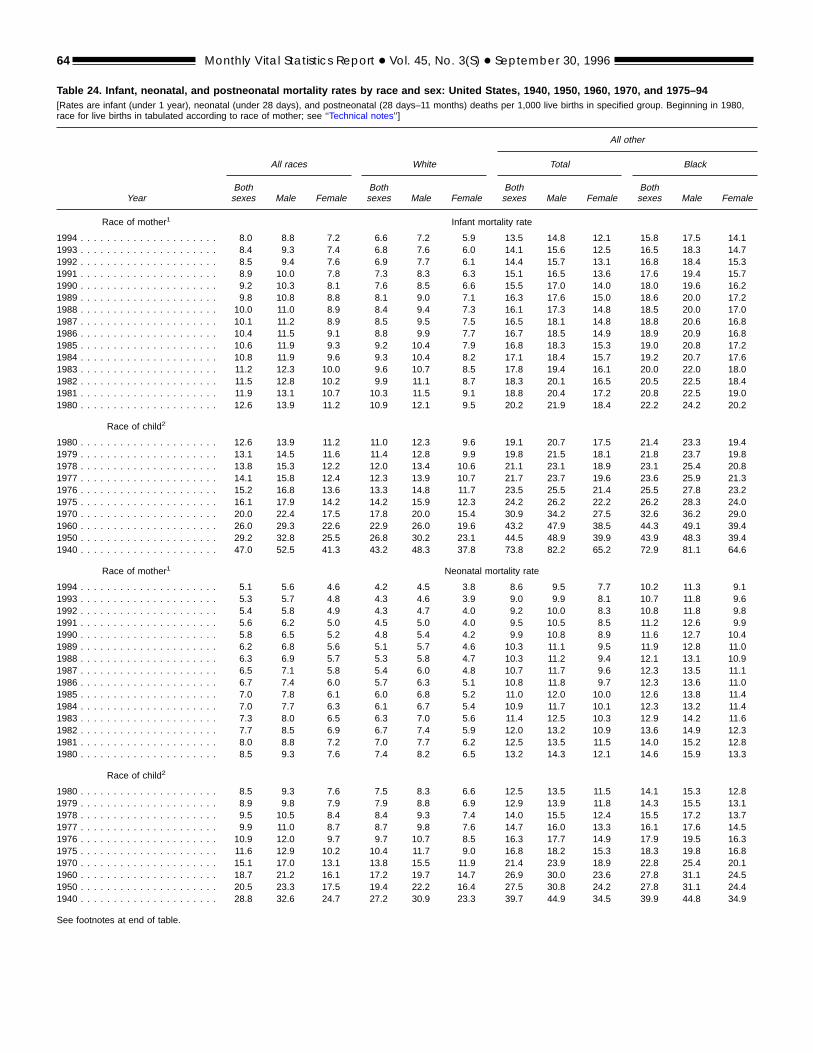
Table 24. Infant, neonatal, and postneonatal mortality rates by race and sex: United States, 1940, 1950, 1960, 1970, and 1975–94[Rates are infant (under 1 year), neonatal (under 28 days), and postneonatal (28 days–11 months) deaths per 1,000 live births in specified group. Beginning in 1980,race for live births in tabulated according to race of mother; see ‘‘Technical notes’’]
Year
All other
All races White Total Black
Bothsexes Male Female
Bothsexes Male Female
Bothsexes Male Female
Bothsexes Male Female
Race of mother1 Infant mortality rate
1994 . . . . . . . . . . . . . . . . . . . . . 8.0 8.8 7.2 6.6 7.2 5.9 13.5 14.8 12.1 15.8 17.5 14.11993 . . . . . . . . . . . . . . . . . . . . . 8.4 9.3 7.4 6.8 7.6 6.0 14.1 15.6 12.5 16.5 18.3 14.71992 . . . . . . . . . . . . . . . . . . . . . 8.5 9.4 7.6 6.9 7.7 6.1 14.4 15.7 13.1 16.8 18.4 15.31991 . . . . . . . . . . . . . . . . . . . . . 8.9 10.0 7.8 7.3 8.3 6.3 15.1 16.5 13.6 17.6 19.4 15.71990 . . . . . . . . . . . . . . . . . . . . . 9.2 10.3 8.1 7.6 8.5 6.6 15.5 17.0 14.0 18.0 19.6 16.21989 . . . . . . . . . . . . . . . . . . . . . 9.8 10.8 8.8 8.1 9.0 7.1 16.3 17.6 15.0 18.6 20.0 17.21988 . . . . . . . . . . . . . . . . . . . . . 10.0 11.0 8.9 8.4 9.4 7.3 16.1 17.3 14.8 18.5 20.0 17.01987 . . . . . . . . . . . . . . . . . . . . . 10.1 11.2 8.9 8.5 9.5 7.5 16.5 18.1 14.8 18.8 20.6 16.81986 . . . . . . . . . . . . . . . . . . . . . 10.4 11.5 9.1 8.8 9.9 7.7 16.7 18.5 14.9 18.9 20.9 16.81985 . . . . . . . . . . . . . . . . . . . . . 10.6 11.9 9.3 9.2 10.4 7.9 16.8 18.3 15.3 19.0 20.8 17.21984 . . . . . . . . . . . . . . . . . . . . . 10.8 11.9 9.6 9.3 10.4 8.2 17.1 18.4 15.7 19.2 20.7 17.61983 . . . . . . . . . . . . . . . . . . . . . 11.2 12.3 10.0 9.6 10.7 8.5 17.8 19.4 16.1 20.0 22.0 18.01982 . . . . . . . . . . . . . . . . . . . . . 11.5 12.8 10.2 9.9 11.1 8.7 18.3 20.1 16.5 20.5 22.5 18.41981 . . . . . . . . . . . . . . . . . . . . . 11.9 13.1 10.7 10.3 11.5 9.1 18.8 20.4 17.2 20.8 22.5 19.01980 . . . . . . . . . . . . . . . . . . . . . 12.6 13.9 11.2 10.9 12.1 9.5 20.2 21.9 18.4 22.2 24.2 20.2
Race of child2
1980 . . . . . . . . . . . . . . . . . . . . . 12.6 13.9 11.2 11.0 12.3 9.6 19.1 20.7 17.5 21.4 23.3 19.41979 . . . . . . . . . . . . . . . . . . . . . 13.1 14.5 11.6 11.4 12.8 9.9 19.8 21.5 18.1 21.8 23.7 19.81978 . . . . . . . . . . . . . . . . . . . . . 13.8 15.3 12.2 12.0 13.4 10.6 21.1 23.1 18.9 23.1 25.4 20.81977 . . . . . . . . . . . . . . . . . . . . . 14.1 15.8 12.4 12.3 13.9 10.7 21.7 23.7 19.6 23.6 25.9 21.31976 . . . . . . . . . . . . . . . . . . . . . 15.2 16.8 13.6 13.3 14.8 11.7 23.5 25.5 21.4 25.5 27.8 23.21975 . . . . . . . . . . . . . . . . . . . . . 16.1 17.9 14.2 14.2 15.9 12.3 24.2 26.2 22.2 26.2 28.3 24.01970 . . . . . . . . . . . . . . . . . . . . . 20.0 22.4 17.5 17.8 20.0 15.4 30.9 34.2 27.5 32.6 36.2 29.01960 . . . . . . . . . . . . . . . . . . . . . 26.0 29.3 22.6 22.9 26.0 19.6 43.2 47.9 38.5 44.3 49.1 39.41950 . . . . . . . . . . . . . . . . . . . . . 29.2 32.8 25.5 26.8 30.2 23.1 44.5 48.9 39.9 43.9 48.3 39.41940 . . . . . . . . . . . . . . . . . . . . . 47.0 52.5 41.3 43.2 48.3 37.8 73.8 82.2 65.2 72.9 81.1 64.6
Race of mother1 Neonatal mortality rate
1994 . . . . . . . . . . . . . . . . . . . . . 5.1 5.6 4.6 4.2 4.5 3.8 8.6 9.5 7.7 10.2 11.3 9.11993 . . . . . . . . . . . . . . . . . . . . . 5.3 5.7 4.8 4.3 4.6 3.9 9.0 9.9 8.1 10.7 11.8 9.61992 . . . . . . . . . . . . . . . . . . . . . 5.4 5.8 4.9 4.3 4.7 4.0 9.2 10.0 8.3 10.8 11.8 9.81991 . . . . . . . . . . . . . . . . . . . . . 5.6 6.2 5.0 4.5 5.0 4.0 9.5 10.5 8.5 11.2 12.6 9.91990 . . . . . . . . . . . . . . . . . . . . . 5.8 6.5 5.2 4.8 5.4 4.2 9.9 10.8 8.9 11.6 12.7 10.41989 . . . . . . . . . . . . . . . . . . . . . 6.2 6.8 5.6 5.1 5.7 4.6 10.3 11.1 9.5 11.9 12.8 11.01988 . . . . . . . . . . . . . . . . . . . . . 6.3 6.9 5.7 5.3 5.8 4.7 10.3 11.2 9.4 12.1 13.1 10.91987 . . . . . . . . . . . . . . . . . . . . . 6.5 7.1 5.8 5.4 6.0 4.8 10.7 11.7 9.6 12.3 13.5 11.11986 . . . . . . . . . . . . . . . . . . . . . 6.7 7.4 6.0 5.7 6.3 5.1 10.8 11.8 9.7 12.3 13.6 11.01985 . . . . . . . . . . . . . . . . . . . . . 7.0 7.8 6.1 6.0 6.8 5.2 11.0 12.0 10.0 12.6 13.8 11.41984 . . . . . . . . . . . . . . . . . . . . . 7.0 7.7 6.3 6.1 6.7 5.4 10.9 11.7 10.1 12.3 13.2 11.41983 . . . . . . . . . . . . . . . . . . . . . 7.3 8.0 6.5 6.3 7.0 5.6 11.4 12.5 10.3 12.9 14.2 11.61982 . . . . . . . . . . . . . . . . . . . . . 7.7 8.5 6.9 6.7 7.4 5.9 12.0 13.2 10.9 13.6 14.9 12.31981 . . . . . . . . . . . . . . . . . . . . . 8.0 8.8 7.2 7.0 7.7 6.2 12.5 13.5 11.5 14.0 15.2 12.81980 . . . . . . . . . . . . . . . . . . . . . 8.5 9.3 7.6 7.4 8.2 6.5 13.2 14.3 12.1 14.6 15.9 13.3
Race of child2
1980 . . . . . . . . . . . . . . . . . . . . . 8.5 9.3 7.6 7.5 8.3 6.6 12.5 13.5 11.5 14.1 15.3 12.81979 . . . . . . . . . . . . . . . . . . . . . 8.9 9.8 7.9 7.9 8.8 6.9 12.9 13.9 11.8 14.3 15.5 13.11978 . . . . . . . . . . . . . . . . . . . . . 9.5 10.5 8.4 8.4 9.3 7.4 14.0 15.5 12.4 15.5 17.2 13.71977 . . . . . . . . . . . . . . . . . . . . . 9.9 11.0 8.7 8.7 9.8 7.6 14.7 16.0 13.3 16.1 17.6 14.51976 . . . . . . . . . . . . . . . . . . . . . 10.9 12.0 9.7 9.7 10.7 8.5 16.3 17.7 14.9 17.9 19.5 16.31975 . . . . . . . . . . . . . . . . . . . . . 11.6 12.9 10.2 10.4 11.7 9.0 16.8 18.2 15.3 18.3 19.8 16.81970 . . . . . . . . . . . . . . . . . . . . . 15.1 17.0 13.1 13.8 15.5 11.9 21.4 23.9 18.9 22.8 25.4 20.11960 . . . . . . . . . . . . . . . . . . . . . 18.7 21.2 16.1 17.2 19.7 14.7 26.9 30.0 23.6 27.8 31.1 24.51950 . . . . . . . . . . . . . . . . . . . . . 20.5 23.3 17.5 19.4 22.2 16.4 27.5 30.8 24.2 27.8 31.1 24.41940 . . . . . . . . . . . . . . . . . . . . . 28.8 32.6 24.7 27.2 30.9 23.3 39.7 44.9 34.5 39.9 44.8 34.9
See footnotes at end of table.
64 Monthly Vital Statistics Report + Vol. 45, No. 3(S) + September 30, 1996
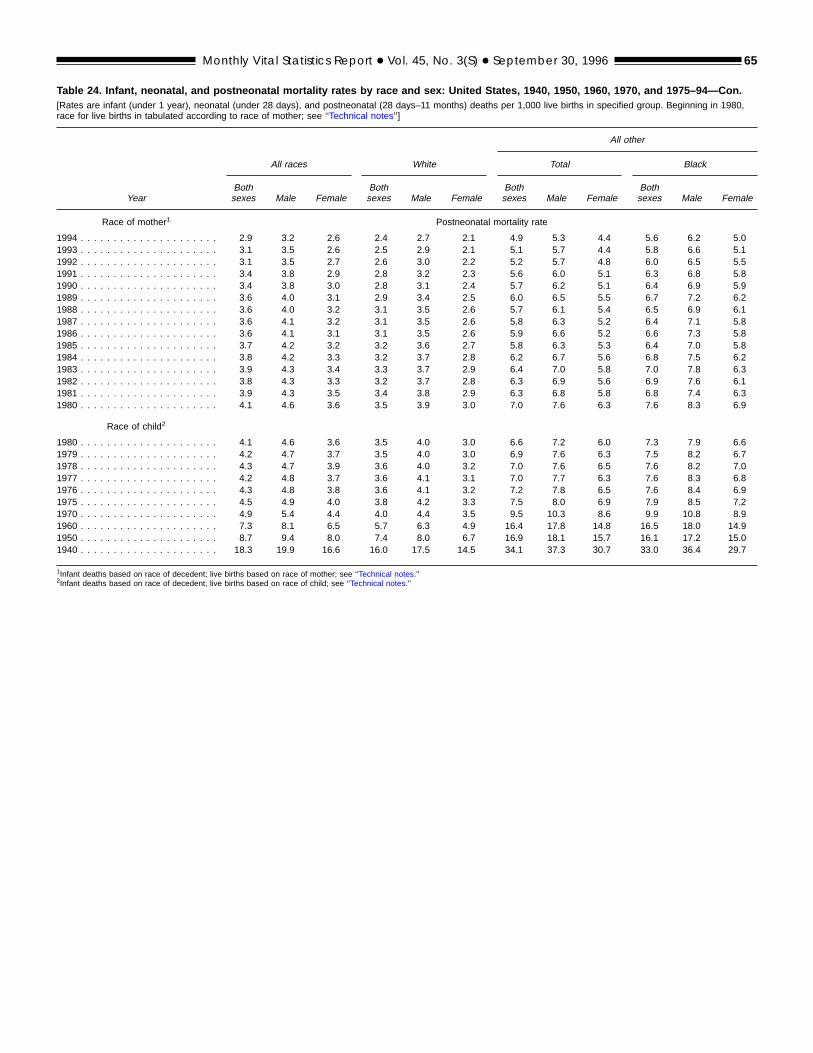
Table 24. Infant, neonatal, and postneonatal mortality rates by race and sex: United States, 1940, 1950, 1960, 1970, and 1975–94—Con.[Rates are infant (under 1 year), neonatal (under 28 days), and postneonatal (28 days–11 months) deaths per 1,000 live births in specified group. Beginning in 1980,race for live births in tabulated according to race of mother; see ‘‘Technical notes’’]
Year
All other
All races White Total Black
Bothsexes Male Female
Bothsexes Male Female
Bothsexes Male Female
Bothsexes Male Female
Race of mother1 Postneonatal mortality rate
1994 . . . . . . . . . . . . . . . . . . . . . 2.9 3.2 2.6 2.4 2.7 2.1 4.9 5.3 4.4 5.6 6.2 5.01993 . . . . . . . . . . . . . . . . . . . . . 3.1 3.5 2.6 2.5 2.9 2.1 5.1 5.7 4.4 5.8 6.6 5.11992 . . . . . . . . . . . . . . . . . . . . . 3.1 3.5 2.7 2.6 3.0 2.2 5.2 5.7 4.8 6.0 6.5 5.51991 . . . . . . . . . . . . . . . . . . . . . 3.4 3.8 2.9 2.8 3.2 2.3 5.6 6.0 5.1 6.3 6.8 5.81990 . . . . . . . . . . . . . . . . . . . . . 3.4 3.8 3.0 2.8 3.1 2.4 5.7 6.2 5.1 6.4 6.9 5.91989 . . . . . . . . . . . . . . . . . . . . . 3.6 4.0 3.1 2.9 3.4 2.5 6.0 6.5 5.5 6.7 7.2 6.21988 . . . . . . . . . . . . . . . . . . . . . 3.6 4.0 3.2 3.1 3.5 2.6 5.7 6.1 5.4 6.5 6.9 6.11987 . . . . . . . . . . . . . . . . . . . . . 3.6 4.1 3.2 3.1 3.5 2.6 5.8 6.3 5.2 6.4 7.1 5.81986 . . . . . . . . . . . . . . . . . . . . . 3.6 4.1 3.1 3.1 3.5 2.6 5.9 6.6 5.2 6.6 7.3 5.81985 . . . . . . . . . . . . . . . . . . . . . 3.7 4.2 3.2 3.2 3.6 2.7 5.8 6.3 5.3 6.4 7.0 5.81984 . . . . . . . . . . . . . . . . . . . . . 3.8 4.2 3.3 3.2 3.7 2.8 6.2 6.7 5.6 6.8 7.5 6.21983 . . . . . . . . . . . . . . . . . . . . . 3.9 4.3 3.4 3.3 3.7 2.9 6.4 7.0 5.8 7.0 7.8 6.31982 . . . . . . . . . . . . . . . . . . . . . 3.8 4.3 3.3 3.2 3.7 2.8 6.3 6.9 5.6 6.9 7.6 6.11981 . . . . . . . . . . . . . . . . . . . . . 3.9 4.3 3.5 3.4 3.8 2.9 6.3 6.8 5.8 6.8 7.4 6.31980 . . . . . . . . . . . . . . . . . . . . . 4.1 4.6 3.6 3.5 3.9 3.0 7.0 7.6 6.3 7.6 8.3 6.9
Race of child2
1980 . . . . . . . . . . . . . . . . . . . . . 4.1 4.6 3.6 3.5 4.0 3.0 6.6 7.2 6.0 7.3 7.9 6.61979 . . . . . . . . . . . . . . . . . . . . . 4.2 4.7 3.7 3.5 4.0 3.0 6.9 7.6 6.3 7.5 8.2 6.71978 . . . . . . . . . . . . . . . . . . . . . 4.3 4.7 3.9 3.6 4.0 3.2 7.0 7.6 6.5 7.6 8.2 7.01977 . . . . . . . . . . . . . . . . . . . . . 4.2 4.8 3.7 3.6 4.1 3.1 7.0 7.7 6.3 7.6 8.3 6.81976 . . . . . . . . . . . . . . . . . . . . . 4.3 4.8 3.8 3.6 4.1 3.2 7.2 7.8 6.5 7.6 8.4 6.91975 . . . . . . . . . . . . . . . . . . . . . 4.5 4.9 4.0 3.8 4.2 3.3 7.5 8.0 6.9 7.9 8.5 7.21970 . . . . . . . . . . . . . . . . . . . . . 4.9 5.4 4.4 4.0 4.4 3.5 9.5 10.3 8.6 9.9 10.8 8.91960 . . . . . . . . . . . . . . . . . . . . . 7.3 8.1 6.5 5.7 6.3 4.9 16.4 17.8 14.8 16.5 18.0 14.91950 . . . . . . . . . . . . . . . . . . . . . 8.7 9.4 8.0 7.4 8.0 6.7 16.9 18.1 15.7 16.1 17.2 15.01940 . . . . . . . . . . . . . . . . . . . . . 18.3 19.9 16.6 16.0 17.5 14.5 34.1 37.3 30.7 33.0 36.4 29.7
1Infant deaths based on race of decedent; live births based on race of mother; see ‘‘Technical notes.’’2Infant deaths based on race of decedent; live births based on race of child; see ‘‘Technical notes.’’
Monthly Vital Statistics Report + Vol. 45, No. 3(S) + September 30, 1996 65
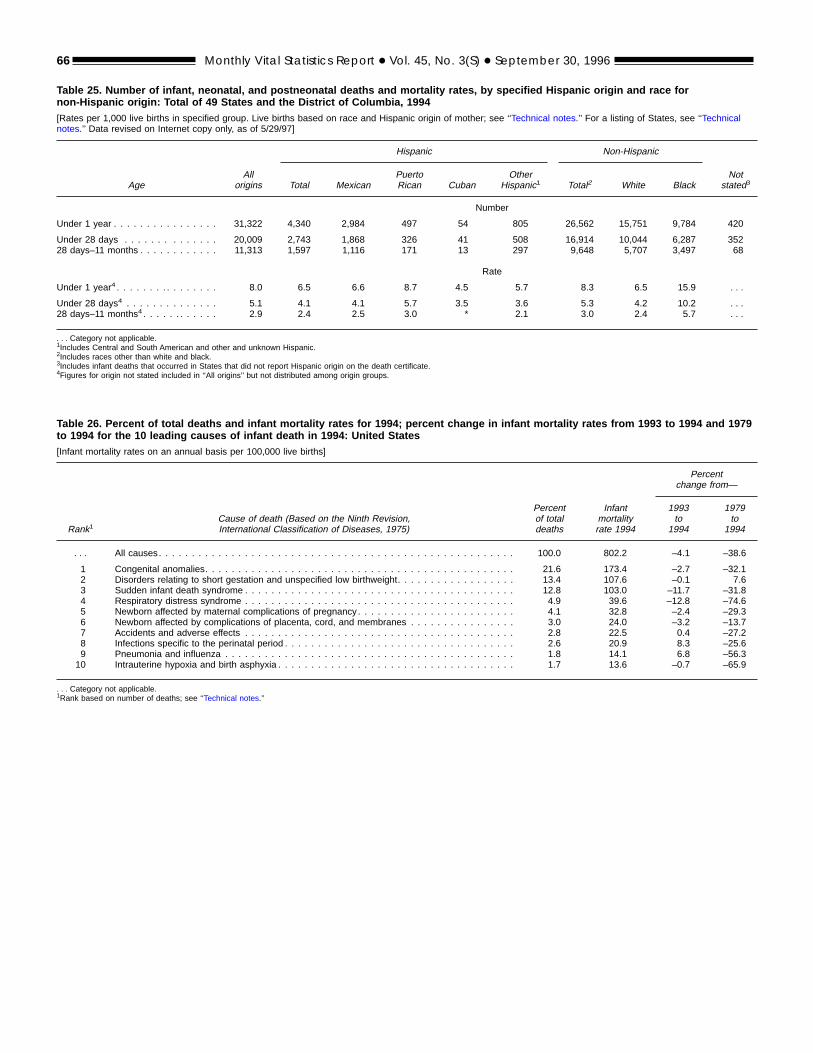
Table 25. Number of infant, neonatal, and postneonatal deaths and mortality rates, by specified Hispanic origin and race fornon-Hispanic origin: Total of 49 States and the District of Columbia, 1994[Rates per 1,000 live births in specified group. Live births based on race and Hispanic origin of mother; see ‘‘Technical notes.’’ For a listing of States, see ‘‘Technicalnotes.’’ Data revised on Internet copy only, as of 5/29/97]
AgeAll
origins
Hispanic Non-Hispanic
Notstated3Total Mexican
PuertoRican Cuban
OtherHispanic1 Total2 White Black
Number
Under 1 year . . . . . . . . . . . . . . . . 31,322 4,340 2,984 497 54 805 26,562 15,751 9,784 420
Under 28 days . . . . . . . . . . . . . . 20,009 2,743 1,868 326 41 508 16,914 10,044 6,287 35228 days–11 months . . . . . . . . . . . . 11,313 1,597 1,116 171 13 297 9,648 5,707 3,497 68
Rate
Under 1 year4 . . . . . . . . . . . . . . . . 8.0 6.5 6.6 8.7 4.5 5.7 8.3 6.5 15.9 . . .
Under 28 days4 . . . . . . . . . . . . . . 5.1 4.1 4.1 5.7 3.5 3.6 5.3 4.2 10.2 . . .28 days–11 months4 . . . . . . . . . . . . 2.9 2.4 2.5 3.0 * 2.1 3.0 2.4 5.7 . . .
. . . Category not applicable.1Includes Central and South American and other and unknown Hispanic.2Includes races other than white and black.3Includes infant deaths that occurred in States that did not report Hispanic origin on the death certificate.4Figures for origin not stated included in ‘‘All origins’’ but not distributed among origin groups.
Table 26. Percent of total deaths and infant mortality rates for 1994; percent change in infant mortality rates from 1993 to 1994 and 1979to 1994 for the 10 leading causes of infant death in 1994: United States[Infant mortality rates on an annual basis per 100,000 live births]
Rank1Cause of death (Based on the Ninth Revision,International Classification of Diseases, 1975)
Percentchange from—
Percentof totaldeaths
Infantmortalityrate 1994
1993to
1994
1979to
1994
. . . All causes. . . . . . . . . . . . . . . . . . . . . . . . . . . . . . . . . . . . . . . . . . . . . . . . . . . . . . 100.0 802.2 –4.1 –38.6
1 Congenital anomalies. . . . . . . . . . . . . . . . . . . . . . . . . . . . . . . . . . . . . . . . . . . . . . . 21.6 173.4 –2.7 –32.12 Disorders relating to short gestation and unspecified low birthweight. . . . . . . . . . . . . . . . . . 13.4 107.6 –0.1 7.63 Sudden infant death syndrome . . . . . . . . . . . . . . . . . . . . . . . . . . . . . . . . . . . . . . . . . 12.8 103.0 –11.7 –31.84 Respiratory distress syndrome . . . . . . . . . . . . . . . . . . . . . . . . . . . . . . . . . . . . . . . . . 4.9 39.6 –12.8 –74.65 Newborn affected by maternal complications of pregnancy . . . . . . . . . . . . . . . . . . . . . . . . 4.1 32.8 –2.4 –29.36 Newborn affected by complications of placenta, cord, and membranes . . . . . . . . . . . . . . . . 3.0 24.0 –3.2 –13.77 Accidents and adverse effects . . . . . . . . . . . . . . . . . . . . . . . . . . . . . . . . . . . . . . . . . 2.8 22.5 0.4 –27.28 Infections specific to the perinatal period . . . . . . . . . . . . . . . . . . . . . . . . . . . . . . . . . . . 2.6 20.9 8.3 –25.69 Pneumonia and influenza . . . . . . . . . . . . . . . . . . . . . . . . . . . . . . . . . . . . . . . . . . . . 1.8 14.1 6.8 –56.310 Intrauterine hypoxia and birth asphyxia . . . . . . . . . . . . . . . . . . . . . . . . . . . . . . . . . . . . 1.7 13.6 –0.7 –65.9
. . . Category not applicable.1Rank based on number of deaths; see ‘‘Technical notes.’’
66 Monthly Vital Statistics Report + Vol. 45, No. 3(S) + September 30, 1996
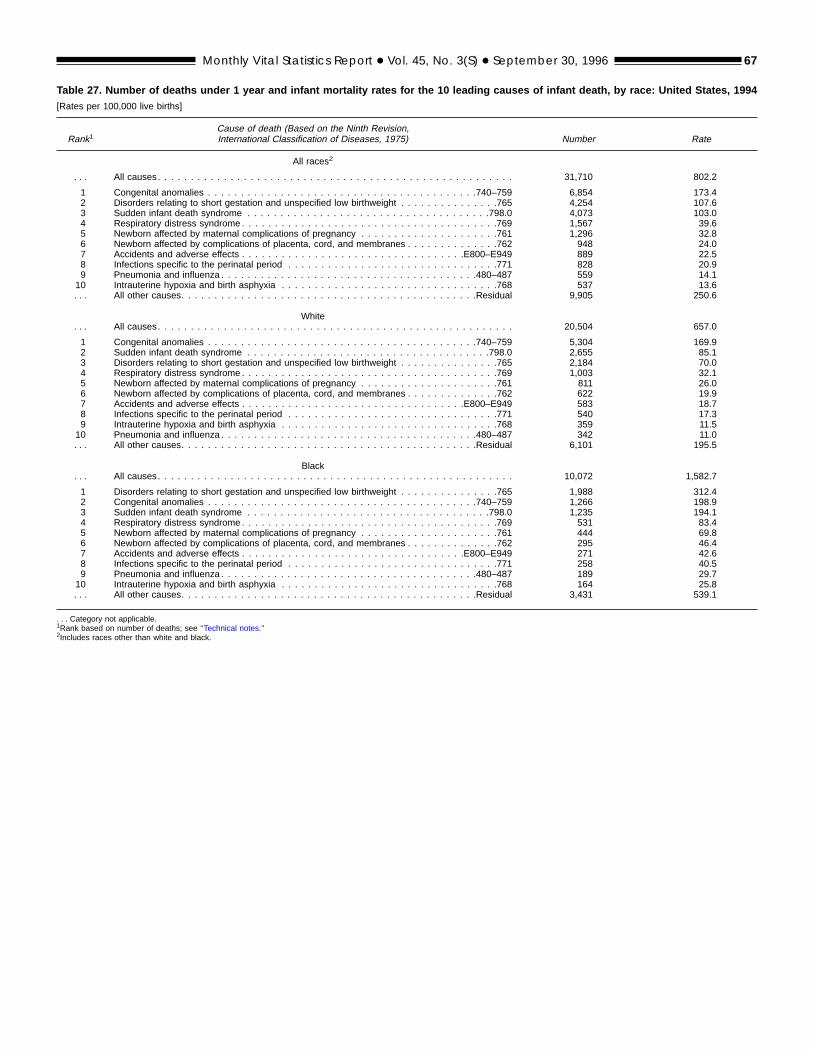
Table 27. Number of deaths under 1 year and infant mortality rates for the 10 leading causes of infant death, by race: United States, 1994[Rates per 100,000 live births]
Rank1Cause of death (Based on the Ninth Revision,International Classification of Diseases, 1975) Number Rate
All races2
. . . All causes. . . . . . . . . . . . . . . . . . . . . . . . . . . . . . . . . . . . . . . . . . . . . . . . . . . . . . 31,710 802.2
1 Congenital anomalies . . . . . . . . . . . . . . . . . . . . . . . . . . . . . . . . . . . . . . . . .740–759 6,854 173.42 Disorders relating to short gestation and unspecified low birthweight . . . . . . . . . . . . . . .765 4,254 107.63 Sudden infant death syndrome . . . . . . . . . . . . . . . . . . . . . . . . . . . . . . . . . . . . .798.0 4,073 103.04 Respiratory distress syndrome . . . . . . . . . . . . . . . . . . . . . . . . . . . . . . . . . . . . . . .769 1,567 39.65 Newborn affected by maternal complications of pregnancy . . . . . . . . . . . . . . . . . . . . .761 1,296 32.86 Newborn affected by complications of placenta, cord, and membranes . . . . . . . . . . . . . .762 948 24.07 Accidents and adverse effects . . . . . . . . . . . . . . . . . . . . . . . . . . . . . . . . . .E800–E949 889 22.58 Infections specific to the perinatal period . . . . . . . . . . . . . . . . . . . . . . . . . . . . . . . .771 828 20.99 Pneumonia and influenza . . . . . . . . . . . . . . . . . . . . . . . . . . . . . . . . . . . . . . .480–487 559 14.110 Intrauterine hypoxia and birth asphyxia . . . . . . . . . . . . . . . . . . . . . . . . . . . . . . . . .768 537 13.6. . . All other causes. . . . . . . . . . . . . . . . . . . . . . . . . . . . . . . . . . . . . . . . . . . . .Residual 9,905 250.6
White. . . All causes. . . . . . . . . . . . . . . . . . . . . . . . . . . . . . . . . . . . . . . . . . . . . . . . . . . . . . 20,504 657.0
1 Congenital anomalies . . . . . . . . . . . . . . . . . . . . . . . . . . . . . . . . . . . . . . . . .740–759 5,304 169.92 Sudden infant death syndrome . . . . . . . . . . . . . . . . . . . . . . . . . . . . . . . . . . . . .798.0 2,655 85.13 Disorders relating to short gestation and unspecified low birthweight . . . . . . . . . . . . . . .765 2,184 70.04 Respiratory distress syndrome . . . . . . . . . . . . . . . . . . . . . . . . . . . . . . . . . . . . . . .769 1,003 32.15 Newborn affected by maternal complications of pregnancy . . . . . . . . . . . . . . . . . . . . .761 811 26.06 Newborn affected by complications of placenta, cord, and membranes . . . . . . . . . . . . . .762 622 19.97 Accidents and adverse effects . . . . . . . . . . . . . . . . . . . . . . . . . . . . . . . . . .E800–E949 583 18.78 Infections specific to the perinatal period . . . . . . . . . . . . . . . . . . . . . . . . . . . . . . . .771 540 17.39 Intrauterine hypoxia and birth asphyxia . . . . . . . . . . . . . . . . . . . . . . . . . . . . . . . . .768 359 11.510 Pneumonia and influenza . . . . . . . . . . . . . . . . . . . . . . . . . . . . . . . . . . . . . . .480–487 342 11.0. . . All other causes. . . . . . . . . . . . . . . . . . . . . . . . . . . . . . . . . . . . . . . . . . . . .Residual 6,101 195.5
Black. . . All causes. . . . . . . . . . . . . . . . . . . . . . . . . . . . . . . . . . . . . . . . . . . . . . . . . . . . . . 10,072 1,582.7
1 Disorders relating to short gestation and unspecified low birthweight . . . . . . . . . . . . . . .765 1,988 312.42 Congenital anomalies . . . . . . . . . . . . . . . . . . . . . . . . . . . . . . . . . . . . . . . . .740–759 1,266 198.93 Sudden infant death syndrome . . . . . . . . . . . . . . . . . . . . . . . . . . . . . . . . . . . . .798.0 1,235 194.14 Respiratory distress syndrome . . . . . . . . . . . . . . . . . . . . . . . . . . . . . . . . . . . . . . .769 531 83.45 Newborn affected by maternal complications of pregnancy . . . . . . . . . . . . . . . . . . . . .761 444 69.86 Newborn affected by complications of placenta, cord, and membranes . . . . . . . . . . . . . .762 295 46.47 Accidents and adverse effects . . . . . . . . . . . . . . . . . . . . . . . . . . . . . . . . . .E800–E949 271 42.68 Infections specific to the perinatal period . . . . . . . . . . . . . . . . . . . . . . . . . . . . . . . .771 258 40.59 Pneumonia and influenza . . . . . . . . . . . . . . . . . . . . . . . . . . . . . . . . . . . . . . .480–487 189 29.710 Intrauterine hypoxia and birth asphyxia . . . . . . . . . . . . . . . . . . . . . . . . . . . . . . . . .768 164 25.8. . . All other causes. . . . . . . . . . . . . . . . . . . . . . . . . . . . . . . . . . . . . . . . . . . . .Residual 3,431 539.1
. . . Category not applicable.1Rank based on number of deaths; see ‘‘Technical notes.’’2Includes races other than white and black.
Monthly Vital Statistics Report + Vol. 45, No. 3(S) + September 30, 1996 67
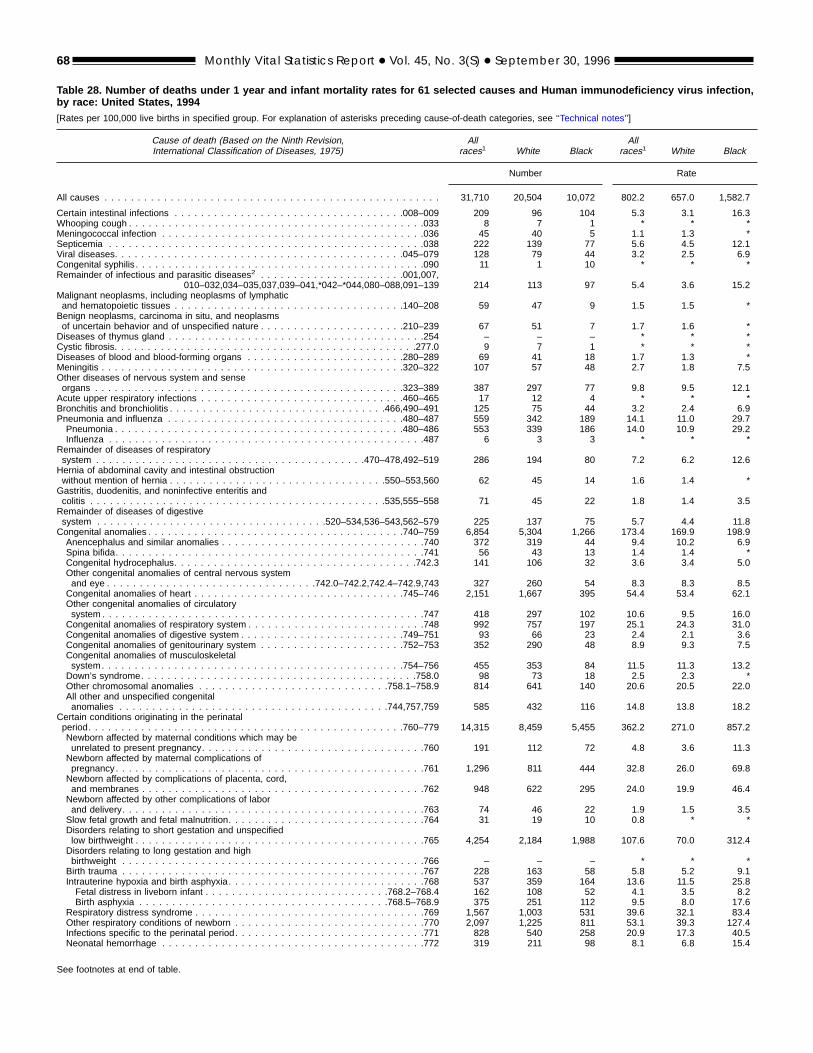
Table 28. Number of deaths under 1 year and infant mortality rates for 61 selected causes and Human immunodeficiency virus infection,by race: United States, 1994[Rates per 100,000 live births in specified group. For explanation of asterisks preceding cause-of-death categories, see ‘‘Technical notes’’]
Cause of death (Based on the Ninth Revision,International Classification of Diseases, 1975)
Allraces1 White Black
Allraces1 White Black
Number Rate
All causes . . . . . . . . . . . . . . . . . . . . . . . . . . . . . . . . . . . . . . . . . . . . . . . . . . . 31,710 20,504 10,072 802.2 657.0 1,582.7
Certain intestinal infections . . . . . . . . . . . . . . . . . . . . . . . . . . . . . . . . . . .008–009 209 96 104 5.3 3.1 16.3Whooping cough . . . . . . . . . . . . . . . . . . . . . . . . . . . . . . . . . . . . . . . . . . . . .033 8 7 1 * * *Meningococcal infection . . . . . . . . . . . . . . . . . . . . . . . . . . . . . . . . . . . . . . . .036 45 40 5 1.1 1.3 *Septicemia . . . . . . . . . . . . . . . . . . . . . . . . . . . . . . . . . . . . . . . . . . . . . . . .038 222 139 77 5.6 4.5 12.1Viral diseases. . . . . . . . . . . . . . . . . . . . . . . . . . . . . . . . . . . . . . . . . . . .045–079 128 79 44 3.2 2.5 6.9Congenital syphilis. . . . . . . . . . . . . . . . . . . . . . . . . . . . . . . . . . . . . . . . . . . .090 11 1 10 * * *Remainder of infectious and parasitic diseases2 . . . . . . . . . . . . . . . . . . . . . .001,007,
010–032,034–035,037,039–041,*042–*044,080–088,091–139 214 113 97 5.4 3.6 15.2Malignant neoplasms, including neoplasms of lymphaticand hematopoietic tissues . . . . . . . . . . . . . . . . . . . . . . . . . . . . . . . . . . .140–208 59 47 9 1.5 1.5 *Benign neoplasms, carcinoma in situ, and neoplasmsof uncertain behavior and of unspecified nature . . . . . . . . . . . . . . . . . . . . . .210–239 67 51 7 1.7 1.6 *Diseases of thymus gland . . . . . . . . . . . . . . . . . . . . . . . . . . . . . . . . . . . . . . .254 – – – * * *Cystic fibrosis. . . . . . . . . . . . . . . . . . . . . . . . . . . . . . . . . . . . . . . . . . . . . .277.0 9 7 1 * * *Diseases of blood and blood-forming organs . . . . . . . . . . . . . . . . . . . . . . . .280–289 69 41 18 1.7 1.3 *Meningitis . . . . . . . . . . . . . . . . . . . . . . . . . . . . . . . . . . . . . . . . . . . . . .320–322 107 57 48 2.7 1.8 7.5Other diseases of nervous system and senseorgans . . . . . . . . . . . . . . . . . . . . . . . . . . . . . . . . . . . . . . . . . . . . . . .323–389 387 297 77 9.8 9.5 12.1Acute upper respiratory infections . . . . . . . . . . . . . . . . . . . . . . . . . . . . . . .460–465 17 12 4 * * *Bronchitis and bronchiolitis . . . . . . . . . . . . . . . . . . . . . . . . . . . . . . . . .466,490–491 125 75 44 3.2 2.4 6.9Pneumonia and influenza . . . . . . . . . . . . . . . . . . . . . . . . . . . . . . . . . . . .480–487 559 342 189 14.1 11.0 29.7Pneumonia . . . . . . . . . . . . . . . . . . . . . . . . . . . . . . . . . . . . . . . . . . . .480–486 553 339 186 14.0 10.9 29.2Influenza . . . . . . . . . . . . . . . . . . . . . . . . . . . . . . . . . . . . . . . . . . . . . . . .487 6 3 3 * * *
Remainder of diseases of respiratorysystem . . . . . . . . . . . . . . . . . . . . . . . . . . . . . . . . . . . . . . . . .470–478,492–519 286 194 80 7.2 6.2 12.6Hernia of abdominal cavity and intestinal obstructionwithout mention of hernia . . . . . . . . . . . . . . . . . . . . . . . . . . . . . . . . .550–553,560 62 45 14 1.6 1.4 *Gastritis, duodenitis, and noninfective enteritis andcolitis . . . . . . . . . . . . . . . . . . . . . . . . . . . . . . . . . . . . . . . . . . . . .535,555–558 71 45 22 1.8 1.4 3.5Remainder of diseases of digestivesystem . . . . . . . . . . . . . . . . . . . . . . . . . . . . . . . . . . .520–534,536–543,562–579 225 137 75 5.7 4.4 11.8Congenital anomalies . . . . . . . . . . . . . . . . . . . . . . . . . . . . . . . . . . . . . . .740–759 6,854 5,304 1,266 173.4 169.9 198.9Anencephalus and similar anomalies . . . . . . . . . . . . . . . . . . . . . . . . . . . . . . .740 372 319 44 9.4 10.2 6.9Spina bifida. . . . . . . . . . . . . . . . . . . . . . . . . . . . . . . . . . . . . . . . . . . . . . .741 56 43 13 1.4 1.4 *Congenital hydrocephalus. . . . . . . . . . . . . . . . . . . . . . . . . . . . . . . . . . . . .742.3 141 106 32 3.6 3.4 5.0Other congenital anomalies of central nervous systemand eye . . . . . . . . . . . . . . . . . . . . . . . . . . . . . . . .742.0–742.2,742.4–742.9,743 327 260 54 8.3 8.3 8.5Congenital anomalies of heart . . . . . . . . . . . . . . . . . . . . . . . . . . . . . . . .745–746 2,151 1,667 395 54.4 53.4 62.1Other congenital anomalies of circulatorysystem . . . . . . . . . . . . . . . . . . . . . . . . . . . . . . . . . . . . . . . . . . . . . . . . .747 418 297 102 10.6 9.5 16.0Congenital anomalies of respiratory system . . . . . . . . . . . . . . . . . . . . . . . . . . .748 992 757 197 25.1 24.3 31.0Congenital anomalies of digestive system . . . . . . . . . . . . . . . . . . . . . . . . .749–751 93 66 23 2.4 2.1 3.6Congenital anomalies of genitourinary system . . . . . . . . . . . . . . . . . . . . . .752–753 352 290 48 8.9 9.3 7.5Congenital anomalies of musculoskeletalsystem. . . . . . . . . . . . . . . . . . . . . . . . . . . . . . . . . . . . . . . . . . . . . .754–756 455 353 84 11.5 11.3 13.2Down’s syndrome. . . . . . . . . . . . . . . . . . . . . . . . . . . . . . . . . . . . . . . . . .758.0 98 73 18 2.5 2.3 *Other chromosomal anomalies . . . . . . . . . . . . . . . . . . . . . . . . . . . . .758.1–758.9 814 641 140 20.6 20.5 22.0All other and unspecified congenitalanomalies . . . . . . . . . . . . . . . . . . . . . . . . . . . . . . . . . . . . . . . . .744,757,759 585 432 116 14.8 13.8 18.2
Certain conditions originating in the perinatalperiod. . . . . . . . . . . . . . . . . . . . . . . . . . . . . . . . . . . . . . . . . . . . . . . .760–779 14,315 8,459 5,455 362.2 271.0 857.2Newborn affected by maternal conditions which may beunrelated to present pregnancy. . . . . . . . . . . . . . . . . . . . . . . . . . . . . . . . . .760 191 112 72 4.8 3.6 11.3Newborn affected by maternal complications ofpregnancy. . . . . . . . . . . . . . . . . . . . . . . . . . . . . . . . . . . . . . . . . . . . . . .761 1,296 811 444 32.8 26.0 69.8Newborn affected by complications of placenta, cord,and membranes . . . . . . . . . . . . . . . . . . . . . . . . . . . . . . . . . . . . . . . . . . .762 948 622 295 24.0 19.9 46.4Newborn affected by other complications of laborand delivery. . . . . . . . . . . . . . . . . . . . . . . . . . . . . . . . . . . . . . . . . . . . . .763 74 46 22 1.9 1.5 3.5Slow fetal growth and fetal malnutrition. . . . . . . . . . . . . . . . . . . . . . . . . . . . . .764 31 19 10 0.8 * *Disorders relating to short gestation and unspecifiedlow birthweight . . . . . . . . . . . . . . . . . . . . . . . . . . . . . . . . . . . . . . . . . . . .765 4,254 2,184 1,988 107.6 70.0 312.4Disorders relating to long gestation and highbirthweight . . . . . . . . . . . . . . . . . . . . . . . . . . . . . . . . . . . . . . . . . . . . . .766 – – – * * *Birth trauma . . . . . . . . . . . . . . . . . . . . . . . . . . . . . . . . . . . . . . . . . . . . . .767 228 163 58 5.8 5.2 9.1Intrauterine hypoxia and birth asphyxia. . . . . . . . . . . . . . . . . . . . . . . . . . . . . .768 537 359 164 13.6 11.5 25.8Fetal distress in liveborn infant . . . . . . . . . . . . . . . . . . . . . . . . . . . .768.2–768.4 162 108 52 4.1 3.5 8.2Birth asphyxia . . . . . . . . . . . . . . . . . . . . . . . . . . . . . . . . . . . . . .768.5–768.9 375 251 112 9.5 8.0 17.6
Respiratory distress syndrome . . . . . . . . . . . . . . . . . . . . . . . . . . . . . . . . . . .769 1,567 1,003 531 39.6 32.1 83.4Other respiratory conditions of newborn . . . . . . . . . . . . . . . . . . . . . . . . . . . . .770 2,097 1,225 811 53.1 39.3 127.4Infections specific to the perinatal period. . . . . . . . . . . . . . . . . . . . . . . . . . . . .771 828 540 258 20.9 17.3 40.5Neonatal hemorrhage . . . . . . . . . . . . . . . . . . . . . . . . . . . . . . . . . . . . . . . .772 319 211 98 8.1 6.8 15.4
See footnotes at end of table.
68 Monthly Vital Statistics Report + Vol. 45, No. 3(S) + September 30, 1996
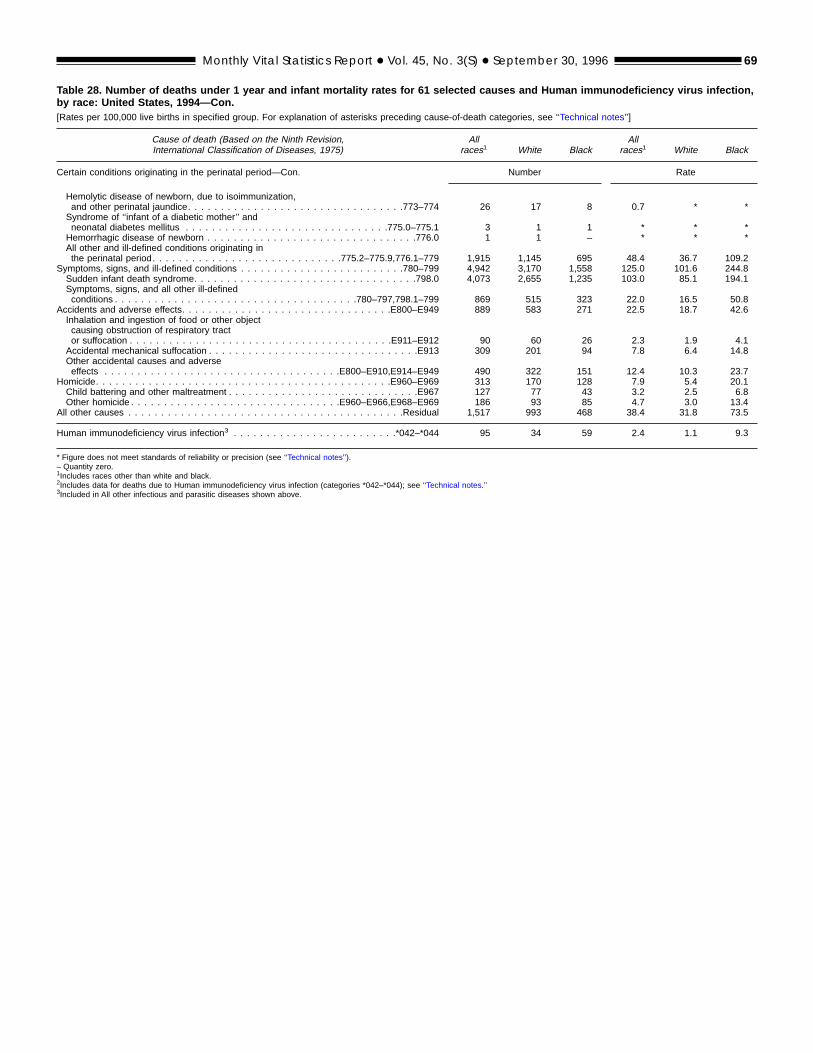
Table 28. Number of deaths under 1 year and infant mortality rates for 61 selected causes and Human immunodeficiency virus infection,by race: United States, 1994—Con.[Rates per 100,000 live births in specified group. For explanation of asterisks preceding cause-of-death categories, see ‘‘Technical notes’’]
Cause of death (Based on the Ninth Revision,International Classification of Diseases, 1975)
Allraces1 White Black
Allraces1 White Black
Certain conditions originating in the perinatal period—Con. Number Rate
Hemolytic disease of newborn, due to isoimmunization,and other perinatal jaundice. . . . . . . . . . . . . . . . . . . . . . . . . . . . . . . . .773–774 26 17 8 0.7 * *Syndrome of ‘‘infant of a diabetic mother’’ andneonatal diabetes mellitus . . . . . . . . . . . . . . . . . . . . . . . . . . . . . . .775.0–775.1 3 1 1 * * *Hemorrhagic disease of newborn . . . . . . . . . . . . . . . . . . . . . . . . . . . . . . . .776.0 1 1 – * * *All other and ill-defined conditions originating inthe perinatal period. . . . . . . . . . . . . . . . . . . . . . . . . . . . .775.2–775.9,776.1–779 1,915 1,145 695 48.4 36.7 109.2
Symptoms, signs, and ill-defined conditions . . . . . . . . . . . . . . . . . . . . . . . . .780–799 4,942 3,170 1,558 125.0 101.6 244.8Sudden infant death syndrome. . . . . . . . . . . . . . . . . . . . . . . . . . . . . . . . . .798.0 4,073 2,655 1,235 103.0 85.1 194.1Symptoms, signs, and all other ill-definedconditions . . . . . . . . . . . . . . . . . . . . . . . . . . . . . . . . . . . . .780–797,798.1–799 869 515 323 22.0 16.5 50.8
Accidents and adverse effects. . . . . . . . . . . . . . . . . . . . . . . . . . . . . . . .E800–E949 889 583 271 22.5 18.7 42.6Inhalation and ingestion of food or other objectcausing obstruction of respiratory tractor suffocation . . . . . . . . . . . . . . . . . . . . . . . . . . . . . . . . . . . . . . . .E911–E912 90 60 26 2.3 1.9 4.1Accidental mechanical suffocation . . . . . . . . . . . . . . . . . . . . . . . . . . . . . . . .E913 309 201 94 7.8 6.4 14.8Other accidental causes and adverseeffects . . . . . . . . . . . . . . . . . . . . . . . . . . . . . . . . . . . .E800–E910,E914–E949 490 322 151 12.4 10.3 23.7
Homicide. . . . . . . . . . . . . . . . . . . . . . . . . . . . . . . . . . . . . . . . . . . . .E960–E969 313 170 128 7.9 5.4 20.1Child battering and other maltreatment . . . . . . . . . . . . . . . . . . . . . . . . . . . . .E967 127 77 43 3.2 2.5 6.8Other homicide . . . . . . . . . . . . . . . . . . . . . . . . . . . . . . . .E960–E966,E968–E969 186 93 85 4.7 3.0 13.4
All other causes . . . . . . . . . . . . . . . . . . . . . . . . . . . . . . . . . . . . . . . . . .Residual 1,517 993 468 38.4 31.8 73.5
Human immunodeficiency virus infection3 . . . . . . . . . . . . . . . . . . . . . . . . .*042–*044 95 34 59 2.4 1.1 9.3
* Figure does not meet standards of reliability or precision (see ‘‘Technical notes’’).– Quantity zero.1Includes races other than white and black.2Includes data for deaths due to Human immunodeficiency virus infection (categories *042–*044); see ‘‘Technical notes.’’3Included in All other infectious and parasitic diseases shown above.
Monthly Vital Statistics Report + Vol. 45, No. 3(S) + September 30, 1996 69
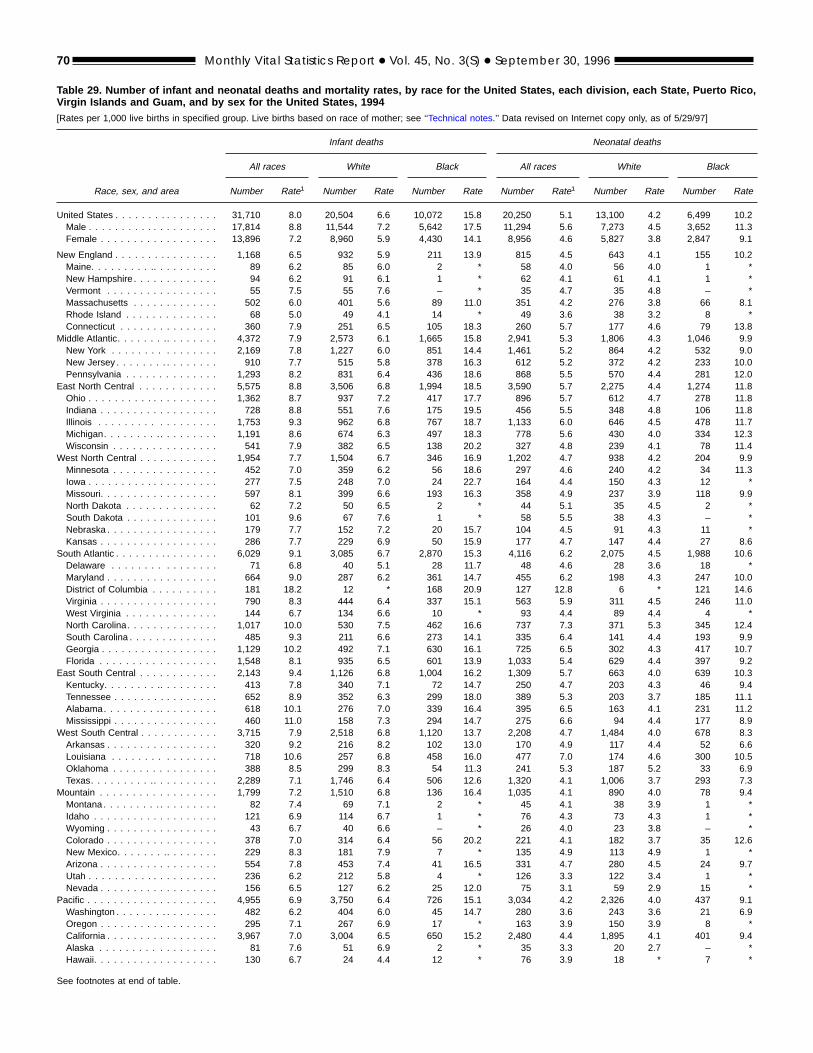
Table 29. Number of infant and neonatal deaths and mortality rates, by race for the United States, each division, each State, Puerto Rico,Virgin Islands and Guam, and by sex for the United States, 1994[Rates per 1,000 live births in specified group. Live births based on race of mother; see ‘‘Technical notes.’’ Data revised on Internet copy only, as of 5/29/97]
Race, sex, and area
Infant deaths Neonatal deaths
All races White Black All races White Black
Number Rate1 Number Rate Number Rate Number Rate1 Number Rate Number Rate
United States . . . . . . . . . . . . . . . . 31,710 8.0 20,504 6.6 10,072 15.8 20,250 5.1 13,100 4.2 6,499 10.2Male . . . . . . . . . . . . . . . . . . . . 17,814 8.8 11,544 7.2 5,642 17.5 11,294 5.6 7,273 4.5 3,652 11.3Female . . . . . . . . . . . . . . . . . . 13,896 7.2 8,960 5.9 4,430 14.1 8,956 4.6 5,827 3.8 2,847 9.1
New England . . . . . . . . . . . . . . . . 1,168 6.5 932 5.9 211 13.9 815 4.5 643 4.1 155 10.2Maine. . . . . . . . . .. . . . . . . . . . 89 6.2 85 6.0 2 * 58 4.0 56 4.0 1 *New Hampshire . . . . . . . . . . . . . 94 6.2 91 6.1 1 * 62 4.1 61 4.1 1 *Vermont . . . . . . . . . . . . . . . . . 55 7.5 55 7.6 – * 35 4.7 35 4.8 – *Massachusetts . . . . . . . . . . . . . 502 6.0 401 5.6 89 11.0 351 4.2 276 3.8 66 8.1Rhode Island . . . . . . . . . . . . . . 68 5.0 49 4.1 14 * 49 3.6 38 3.2 8 *Connecticut . . . . . . . . . . . . . . . 360 7.9 251 6.5 105 18.3 260 5.7 177 4.6 79 13.8
Middle Atlantic. . . . . . . .. . . . . . . . 4,372 7.9 2,573 6.1 1,665 15.8 2,941 5.3 1,806 4.3 1,046 9.9New York . . . . . . . . . . . . . . . . 2,169 7.8 1,227 6.0 851 14.4 1,461 5.2 864 4.2 532 9.0New Jersey . . . . . . . . . . . . . . . . 910 7.7 515 5.8 378 16.3 612 5.2 372 4.2 233 10.0Pennsylvania . . . . . . . . . . . . . . 1,293 8.2 831 6.4 436 18.6 868 5.5 570 4.4 281 12.0
East North Central . . . . . . . . . . . . 5,575 8.8 3,506 6.8 1,994 18.5 3,590 5.7 2,275 4.4 1,274 11.8Ohio . . . . . . . . . . . . . . . . . . . . 1,362 8.7 937 7.2 417 17.7 896 5.7 612 4.7 278 11.8Indiana . . . . . . . . . . . . . . . . . . 728 8.8 551 7.6 175 19.5 456 5.5 348 4.8 106 11.8Illinois . . . . . . . . . . . . . . . . . . 1,753 9.3 962 6.8 767 18.7 1,133 6.0 646 4.5 478 11.7Michigan. . . . . . . . .. . . . . . . . . 1,191 8.6 674 6.3 497 18.3 778 5.6 430 4.0 334 12.3Wisconsin . . . . . . . . . . . . . . . . 541 7.9 382 6.5 138 20.2 327 4.8 239 4.1 78 11.4
West North Central . . . . . . . . . . . . 1,954 7.7 1,504 6.7 346 16.9 1,202 4.7 938 4.2 204 9.9Minnesota . . . . . . . . . . . . . . . . 452 7.0 359 6.2 56 18.6 297 4.6 240 4.2 34 11.3Iowa . . . . . . . . . . . . . . . . . . . . 277 7.5 248 7.0 24 22.7 164 4.4 150 4.3 12 *Missouri. . . . . . . . . . . . . . . . . . 597 8.1 399 6.6 193 16.3 358 4.9 237 3.9 118 9.9North Dakota . . . . . . . . . . . . . . 62 7.2 50 6.5 2 * 44 5.1 35 4.5 2 *South Dakota . . . . . . . . . . . . . . 101 9.6 67 7.6 1 * 58 5.5 38 4.3 – *Nebraska . . . . . . . . . . . . . . . . . 179 7.7 152 7.2 20 15.7 104 4.5 91 4.3 11 *Kansas . . . . . . . . . . . . . . . . . . 286 7.7 229 6.9 50 15.9 177 4.7 147 4.4 27 8.6
South Atlantic . . . . . . . . . . . . . . . . 6,029 9.1 3,085 6.7 2,870 15.3 4,116 6.2 2,075 4.5 1,988 10.6Delaware . . . . . . . . . . . . . . . . 71 6.8 40 5.1 28 11.7 48 4.6 28 3.6 18 *Maryland . . . . . . . . . . . . . . . . . 664 9.0 287 6.2 361 14.7 455 6.2 198 4.3 247 10.0District of Columbia . . . . . . . . . . 181 18.2 12 * 168 20.9 127 12.8 6 * 121 14.6Virginia . . . . . . . . . . . . . . . . . . 790 8.3 444 6.4 337 15.1 563 5.9 311 4.5 246 11.0West Virginia . . . . . . . . . . . . . . 144 6.7 134 6.6 10 * 93 4.4 89 4.4 4 *North Carolina. . . . . . . . . . . . . . 1,017 10.0 530 7.5 462 16.6 737 7.3 371 5.3 345 12.4South Carolina . . . . . . . . . . . . . . 485 9.3 211 6.6 273 14.1 335 6.4 141 4.4 193 9.9Georgia . . . . . . . . . . . . . . . . . . 1,129 10.2 492 7.1 630 16.1 725 6.5 302 4.3 417 10.7Florida . . . . . . . . . . . . . . . . . . 1,548 8.1 935 6.5 601 13.9 1,033 5.4 629 4.4 397 9.2
East South Central . . . . . . . . . . . . 2,143 9.4 1,126 6.8 1,004 16.2 1,309 5.7 663 4.0 639 10.3Kentucky. . . . . . . . .. . . . . . . . . 413 7.8 340 7.1 72 14.7 250 4.7 203 4.3 46 9.4Tennessee . . . . . . . . . . . . . . . . 652 8.9 352 6.3 299 18.0 389 5.3 203 3.7 185 11.1Alabama. . . . . . . . . . . . . . . . . . 618 10.1 276 7.0 339 16.4 395 6.5 163 4.1 231 11.2Mississippi . . . . . . . . . . . . . . . . 460 11.0 158 7.3 294 14.7 275 6.6 94 4.4 177 8.9
West South Central . . . . . . . . . . . . 3,715 7.9 2,518 6.8 1,120 13.7 2,208 4.7 1,484 4.0 678 8.3Arkansas . . . . . . . . . . . . . . . . . 320 9.2 216 8.2 102 13.0 170 4.9 117 4.4 52 6.6Louisiana . . . . . . . . . . . . . . . . 718 10.6 257 6.8 458 16.0 477 7.0 174 4.6 300 10.5Oklahoma . . . . . . . . . . . . . . . . 388 8.5 299 8.3 54 11.3 241 5.3 187 5.2 33 6.9Texas. . . . . . . . . .. . . . . . . . . . 2,289 7.1 1,746 6.4 506 12.6 1,320 4.1 1,006 3.7 293 7.3
Mountain . . . . . . . . . . . . . . . . . . 1,799 7.2 1,510 6.8 136 16.4 1,035 4.1 890 4.0 78 9.4Montana . . . . . . . . . . . . . . . . . . 82 7.4 69 7.1 2 * 45 4.1 38 3.9 1 *Idaho . . . . . . . . . . . . . . . . . . . 121 6.9 114 6.7 1 * 76 4.3 73 4.3 1 *Wyoming . . . . . . . . . . . . . . . . . 43 6.7 40 6.6 – * 26 4.0 23 3.8 – *Colorado . . . . . . . . . . . . . . . . . 378 7.0 314 6.4 56 20.2 221 4.1 182 3.7 35 12.6New Mexico. . . . . . . .. . . . . . . . 229 8.3 181 7.9 7 * 135 4.9 113 4.9 1 *Arizona . . . . . . . . . . . . . . . . . . 554 7.8 453 7.4 41 16.5 331 4.7 280 4.5 24 9.7Utah . . . . . . . . . . . . . . . . . . . . 236 6.2 212 5.8 4 * 126 3.3 122 3.4 1 *Nevada . . . . . . . . . . . . . . . . . . 156 6.5 127 6.2 25 12.0 75 3.1 59 2.9 15 *
Pacific . . . . . . . . . . . . . . . . . . . . 4,955 6.9 3,750 6.4 726 15.1 3,034 4.2 2,326 4.0 437 9.1Washington . . . . . . . . . . . . . . . . 482 6.2 404 6.0 45 14.7 280 3.6 243 3.6 21 6.9Oregon . . . . . . . . . . . . . . . . . . 295 7.1 267 6.9 17 * 163 3.9 150 3.9 8 *California . . . . . . . . . . . . . . . . . 3,967 7.0 3,004 6.5 650 15.2 2,480 4.4 1,895 4.1 401 9.4Alaska . . . . . . . . . . . . . . . . . . 81 7.6 51 6.9 2 * 35 3.3 20 2.7 – *Hawaii. . . . . . . . . . . . . . . . . . . 130 6.7 24 4.4 12 * 76 3.9 18 * 7 *
See footnotes at end of table.
70 Monthly Vital Statistics Report + Vol. 45, No. 3(S) + September 30, 1996
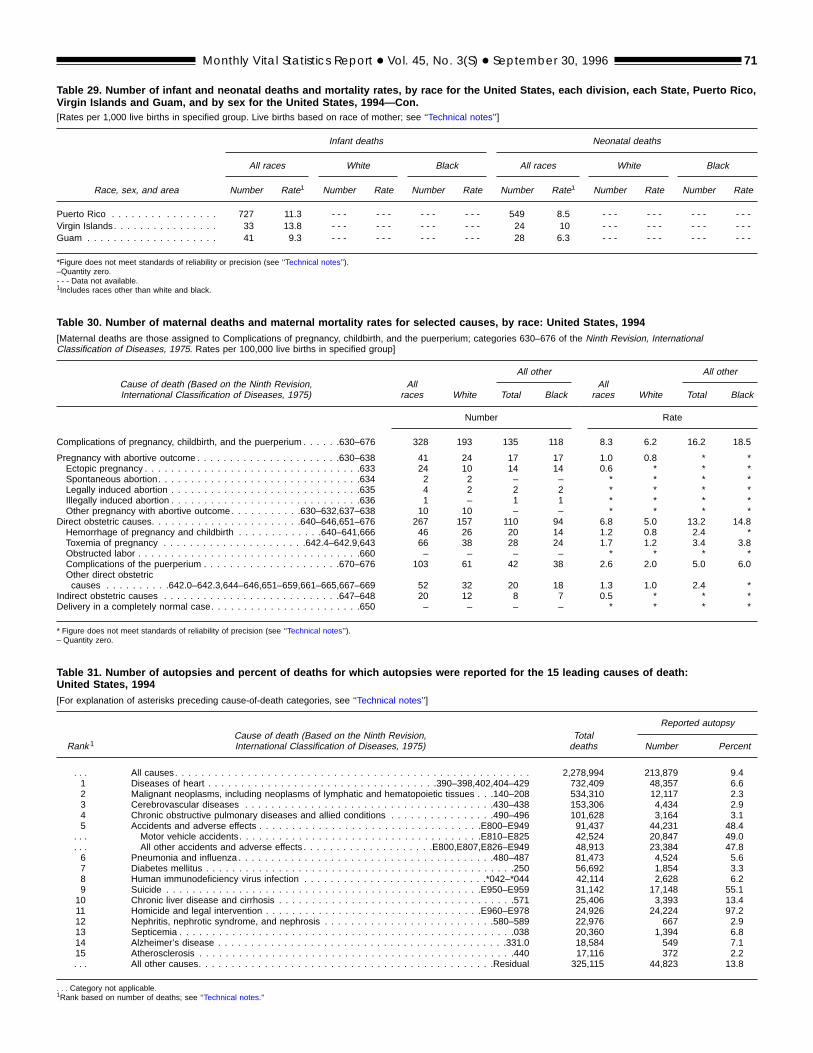
Table 29. Number of infant and neonatal deaths and mortality rates, by race for the United States, each division, each State, Puerto Rico,Virgin Islands and Guam, and by sex for the United States, 1994—Con.[Rates per 1,000 live births in specified group. Live births based on race of mother; see ‘‘Technical notes’’]
Race, sex, and area
Infant deaths Neonatal deaths
All races White Black All races White Black
Number Rate1 Number Rate Number Rate Number Rate1 Number Rate Number Rate
Puerto Rico . . . . . . . . . . . . . . . . 727 11.3 - - - - - - - - - - - - 549 8.5 - - - - - - - - - - - -Virgin Islands. . . . . . . . . . . . . . . . 33 13.8 - - - - - - - - - - - - 24 10 - - - - - - - - - - - -Guam . . . . . . . . . . . . . . . . . . . . 41 9.3 - - - - - - - - - - - - 28 6.3 - - - - - - - - - - - -
*Figure does not meet standards of reliability or precision (see ‘‘Technical notes’’).–Quantity zero.- - - Data not available.1Includes races other than white and black.
Table 30. Number of maternal deaths and maternal mortality rates for selected causes, by race: United States, 1994[Maternal deaths are those assigned to Complications of pregnancy, childbirth, and the puerperium; categories 630–676 of the Ninth Revision, InternationalClassification of Diseases, 1975. Rates per 100,000 live births in specified group]
Cause of death (Based on the Ninth Revision,International Classification of Diseases, 1975)
Allraces White
All otherAll
races White
All other
Total Black Total Black
Number Rate
Complications of pregnancy, childbirth, and the puerperium . . . . . .630–676 328 193 135 118 8.3 6.2 16.2 18.5
Pregnancy with abortive outcome . . . . . . . . . . . . . . . . . . . . . .630–638 41 24 17 17 1.0 0.8 * *Ectopic pregnancy . . . . . . . . . . . . . . . . . . . . . . . . . . . . . . . . .633 24 10 14 14 0.6 * * *Spontaneous abortion. . . . . . . . . . . . . . . . . . . . . . . . . . . . . . .634 2 2 – – * * * *Legally induced abortion . . . . . . . . . . . . . . . . . . . . . . . . . . . . .635 4 2 2 2 * * * *Illegally induced abortion . . . . . . . . . . . . . . . . . . . . . . . . . . . . .636 1 – 1 1 * * * *Other pregnancy with abortive outcome . . . . . . . . . . .630–632,637–638 10 10 – – * * * *
Direct obstetric causes. . . . . . . . . . . . . . . . . . . . . . .640–646,651–676 267 157 110 94 6.8 5.0 13.2 14.8Hemorrhage of pregnancy and childbirth . . . . . . . . . . . . .640–641,666 46 26 20 14 1.2 0.8 2.4 *Toxemia of pregnancy . . . . . . . . . . . . . . . . . . . . . .642.4–642.9,643 66 38 28 24 1.7 1.2 3.4 3.8Obstructed labor . . . . . . . . . . . . . . . . . . . . . . . . . . . . . . . . . .660 – – – – * * * *Complications of the puerperium . . . . . . . . . . . . . . . . . . . . .670–676 103 61 42 38 2.6 2.0 5.0 6.0Other direct obstetriccauses . . . . . . . . . .642.0–642.3,644–646,651–659,661–665,667–669 52 32 20 18 1.3 1.0 2.4 *
Indirect obstetric causes . . . . . . . . . . . . . . . . . . . . . . . . . . .647–648 20 12 8 7 0.5 * * *Delivery in a completely normal case. . . . . . . . . . . . . . . . . . . . . . .650 – – – – * * * *
* Figure does not meet standards of reliability of precision (see ‘‘Technical notes’’).– Quantity zero.
Table 31. Number of autopsies and percent of deaths for which autopsies were reported for the 15 leading causes of death:United States, 1994[For explanation of asterisks preceding cause-of-death categories, see ‘‘Technical notes’’]
Rank1Cause of death (Based on the Ninth Revision,International Classification of Diseases, 1975)
Totaldeaths
Reported autopsy
Number Percent
. . . All causes. . . . . . . . . . . . . . . . . . . . . . . . . . . . . . . . . . . . . . . . . . . . . . . . . . . . . . 2,278,994 213,879 9.41 Diseases of heart . . . . . . . . . . . . . . . . . . . . . . . . . . . . . . . . . . .390–398,402,404–429 732,409 48,357 6.62 Malignant neoplasms, including neoplasms of lymphatic and hematopoietic tissues . . .140–208 534,310 12,117 2.33 Cerebrovascular diseases . . . . . . . . . . . . . . . . . . . . . . . . . . . . . . . . . . . . . .430–438 153,306 4,434 2.94 Chronic obstructive pulmonary diseases and allied conditions . . . . . . . . . . . . . . . .490–496 101,628 3,164 3.15 Accidents and adverse effects . . . . . . . . . . . . . . . . . . . . . . . . . . . . . . . . . .E800–E949 91,437 44,231 48.4
. . . Motor vehicle accidents. . . . . . . . . . . . . . . . . . . . . . . . . . . . . . . . . . . . .E810–E825 42,524 20,847 49.0
. . . All other accidents and adverse effects . . . . . . . . . . . . . . . . . . . .E800,E807,E826–E949 48,913 23,384 47.86 Pneumonia and influenza . . . . . . . . . . . . . . . . . . . . . . . . . . . . . . . . . . . . . . .480–487 81,473 4,524 5.67 Diabetes mellitus . . . . . . . . . . . . . . . . . . . . . . . . . . . . . . . . . . . . . . . . . . . . . . .250 56,692 1,854 3.38 Human immunodeficiency virus infection . . . . . . . . . . . . . . . . . . . . . . . . . . . .*042–*044 42,114 2,628 6.29 Suicide . . . . . . . . . . . . . . . . . . . . . . . . . . . . . . . . . . . . . . . . . . . . . . . .E950–E959 31,142 17,148 55.110 Chronic liver disease and cirrhosis . . . . . . . . . . . . . . . . . . . . . . . . . . . . . . . . . . . .571 25,406 3,393 13.411 Homicide and legal intervention . . . . . . . . . . . . . . . . . . . . . . . . . . . . . . . . .E960–E978 24,926 24,224 97.212 Nephritis, nephrotic syndrome, and nephrosis . . . . . . . . . . . . . . . . . . . . . . . . . .580–589 22,976 667 2.913 Septicemia . . . . . . . . . . . . . . . . . . . . . . . . . . . . . . . . . . . . . . . . . . . . . . . . . . .038 20,360 1,394 6.814 Alzheimer’s disease . . . . . . . . . . . . . . . . . . . . . . . . . . . . . . . . . . . . . . . . . . . .331.0 18,584 549 7.115 Atherosclerosis . . . . . . . . . . . . . . . . . . . . . . . . . . . . . . . . . . . . . . . . . . . . . . . .440 17,116 372 2.2. . . All other causes. . . . . . . . . . . . . . . . . . . . . . . . . . . . . . . . . . . . . . . . . . . . .Residual 325,115 44,823 13.8
. . . Category not applicable.1Rank based on number of deaths; see ‘‘Technical notes.’’
Monthly Vital Statistics Report + Vol. 45, No. 3(S) + September 30, 1996 71

inmaiaicd
issme
hsht
faao
ink
-nrir
e
t
ce-
e
a
fedeithA
e
ehied
ca
lineu
e
l
n
s
e
tr
y,re
y
tn
is-ht.ne
e
st
eths;7,ns-f-s
fs,hdr
,
s.b--
72 Monthly Vital Statistics Report + Vol. 45, No. 3(S) + September 30, 1996
Technical notes
Nature and sources of data
Data in this report are based on infomation from all death certificates filedthe 50 States and the District of Colubia. The U.S. Standard Certificate of Dewas revised in 1989; for additional detasee the 1989 revision of the U.S. standcertificates and reports (13) and TechnAppendix ofVital Statistics of the UniteStates, 1989,Volume II, Mortality, part A(14).
Mortality statistics are based on infomation coded by the States and providto the National Center for Health Stattics (NCHS) through the Vital StatisticCooperative Program (VSCP) and frocopies of the original certificates receivby NCHS from the State registratiooffices. In 1994 all the States and tDistrict of Columbia participated in thiprogram and submitted part or all of tmortality data for 1994 in electronic dafiles to NCHS. The 40 States in the VSCthat submitted precoded medical dataall deaths are Alabama, Alaska, ArkansCalifornia, Colorado, Connecticut, Delware, Florida, Georgia, Hawaii, IdahIndiana, Iowa, Kansas, Louisiana, MainMaryland, Massachusetts, Michigan, Mnesota, Mississippi, Montana, NebrasNevada, New Hampshire, New York Sta(excluding New York City), North Carolina, North Dakota, Oklahoma, OregoPennsylvania, Rhode Island, South Calina, South Dakota, Texas, Vermont, Vginia, Washington, Wisconsin, anWyoming. Of these 40 States, MainMontana, North Dakota, and Wyomincontracted with a private companyprovide precoded medical data to NCHKansas continued to provide the medidata for Alaska. The remaining 10 StatNew York City, and the District of Columbia submitted copies of the original cetificates from which NCHS coded thmedical data. For 1994 all States submted precoded demographic data fordeaths.
Data for the entire United States reto events occurring within the UniteStates. Data shown for geographic arare by place of residence. Beginning w1970 mortality statistics exclude deaof nonresidents of the United States.data exclude fetal deaths.
r-
-thlsrdal
r-ed-
dne
eaPors,-,e,-a,te
,o--d,goS.als,
r-
it-ll
r
asthsll
Race
Quality of race data—A number ofstudies have been conducted on the rability of race reported on the death cetificate by comparing race on the deacertificate with that reported on anothdata collection instrument, such as tcensus or a survey. Differences may arbecause of differences in who providrace information on the compared recorRace information on the death certificais reported by the funeral director aprovided by an informant or in the absenof an informant, on the basis of observtion. In contrast, race on the census orthe Current Population Survey is sereported and, therefore, may be consered more valid. A high level of agreemebetween the death certificate and the csus or survey report is essential to assunbiased death rates by race.
Results from several studies (15–1show that a person self-reported as Amecan Indian or Asian on census or survrecords was sometimes reported as whon the death certificate. The net effectmisclassification is an underestimationdeaths and death rates for the smaminority races.
Other races and race not stated—Beginning in 1992 all records coded a‘‘Other races’’ (0.01 percent of the totadeaths) were assigned to the specifirace of the previous record. Records fwhich race was unknown, not stated,not classifiable (0.26 percent of the totdeaths) were assigned the racial desigtion of the previous record.
Infant and maternal mortality rates—Beginning with the 1989 data year, thmethod of tabulating live births by racwas changed from race of child to racemother. This change affects infant anmaternal mortality rates because live birtare the denominators of these rates. (Fadditional details see the Technical Appedix to Vital Statistics of the United State1989, Volume I, Natality (18,19).) Toimprove continuity and ease of interprtation, trend data by race in this repohave been retabulated by race of mothfor all years beginning with the 1980 dayear. For 1989–94, as in previous yeainfant and maternal deaths continue totabulated by the race of the decedent.
Quantitatively, the change in the basfor tabulating live births by race results i
li-r-thresess.tese-onf-d-tn-re
7)ri-yiteofofler
sledororala-
eeofdhsorn-,
-rteras,be
isn
more white births and fewer black birthsand births of other races. Consequentlinfant and maternal mortality rates undethe new tabulating procedure tend to babout 2 percent lower for white infantsand about 5 percent higher for blackinfants than when they are computed bthe previous method of tabulating livebirths by race of child. Rates for mosother minority races also are higher whecomputed by race of mother (14,19).
Infant mortality rates for specifiedrace may be biased because of inconstencies in reporting race between the birtand death certificates for the same infanEstimates of reporting bias have beemade by comparing rates based on thlinked files of infant deaths and livebirths with those in which the race ofinfant death is based on information fromthe death certificate (14).
Cause-of-death classification
The mortality statistics presented herwere compiled in accordance with theWorld Health Organization (WHO) regu-lations, which specify that member nationclassify causes of death by the currenManual of the International StatisticalClassification of Diseases, Injuries, andCauses of Death(20). Causes of death for1979–94 were classified according to thmanual. For earlier years causes of deawere classified according to the revisionthen in use—1968–78, Eighth Revision1958–67, Seventh Revision; and 1949–5Sixth Revision. Changes in classificatioof causes of death due to these revisionmay result in discontinuities in cause-ofdeath trends. Consequently, cause-odeath comparisons among revisionrequire consideration of comparabilityratios and, where available, estimates otheir standard errors. Comparability ratiobetween the Eighth and Ninth Revisionsbetween the Seventh and EightRevisions, and between the Sixth anSeventh Revisions may be found in otheNCHS reports (21–23).
Besides specifying the classificationWHO regulations outline the form ofmedical certification and the procedureto be used in coding cause of deathCause-of-death data presented in this pulication were coded by procedures outlined in annual issues of theNCHSInstruction Manual(24–26).
Sh
ao
eah
l
et
a
)uR
ieDa
fe
r
nr
dn
kar
tlhn
oisb
rb
n
e
s
s
-
h-
c
,--
sie
sn
ta
t
t aso-
-i-
t-s
-
.d
r-
n-
ds.
-,-nt
i--yo.s.,r-yees
o
,0,.
d
Monthly Vital Statistics Report + Vol. 45, No. 3(S) + September 30, 1996 73
Before data for 1968, mortality medcal data were based on manual codingan underlying cause of death for eacertificate in accordance with WHO ruleEffective with data year 1968, NCHconverted to computerized coding of tunderlying cause and manual codingall causes (multiple causes) on the decertificate. In this system, called Autmated Classification of Medical Entitie(ACME) (27), the multiple cause codserve as inputs to the computer softwthat employs WHO rules to select tunderlying cause. Many States haimplemented ACME and provide mutiple cause and underlying cause dataNCHS in electronic form; for those Statthat did not, NCHS coded the mortalimedical data using ACME.
The ACME system is used to selethe underlying cause of death fordeath certificates in the United States.addition, NCHS recently introduced twcomputer systems as inputs to ACMBeginning with 1990 data, the systecalled Mortality Medical Indexing, Classification, and Retrieval (MICAR) (28,29was introduced to automate coding mtiple causes of death. In addition, MICAprovides more detailed information othe conditions reported on death certcates than is available through the Intnational Classification of Diseases (ICcode structure. Then, beginning with dyear 1993, a system called SuperMICAwas introduced as an enhancement ofMICAR system. SuperMICAR allows fototal literal entry of the multiple cause-odeath text as reported by the certifiThis information is automatically codeby the MICAR and ACME computesystems.
For 1994 approximately 12 perceof the Nation’s death records wemultiple-cause coded using SuperMCAR; 72 percent, using MICAR; an16 percent, using ACME. This represedata from 10 States that were codedSuperMICAR and data from 32 Statethe District of Columbia, and New YorCity that were coded by MICAR. Datfor the remaining eight States were pcessed using only the ACME system.
In this report tabulations of cause-odeath statistics are based solely onunderlying cause of death. The undering cause is defined by WHO as tdisease or injury that initiated the seque
i-ofchs.
eofth-ssreeve-tosy
ctllInoE.m-,l-
nfi-r-)taRther-r.d
teI-
tsbys,
o-
f-hey-ece
of events leading directly to death or athe circumstances of the accident or vilence that produced the fatal injury. Itselected from the conditions enteredthe physician in the cause-of-death setion of the death certificate. When mothan one cause or condition is enteredthe physician, the underlying causedetermined by the sequence of conditioon the certificate, provisions of the ICDand associated selection rules. Generamore medical information is reported odeath certificates than is directly reflectin the underlying cause of death.
Codes for HIV infection
Beginning with data for 1987, NCHSintroduced categories *042–*044 for clasifying and coding Human immunodeficiency virus (HIV) infection. The asteriskbefore the category numbers indicate ththey are not part of theNinth Revision,International Classification of Disease(ICD–9). Deaths classified to HIV infection for 1994 are intables 8–12. They areincluded, but not shown separately, in tcategory ‘‘All other infectious and parasitic diseases’’ in the List of 72 SelecteCauses of Death and in the catego‘‘Remainder of infectious and parasitidiseases’’ in the List of 61 Selected Causof Infant Deaths. Before 1987 deathinvolving HIV infection were classifiedto ‘‘Deficiency of cell-mediated immu-nity’’ (ICD–9 No. 279.1), contained inthe category ‘‘All other diseases’’; to‘‘Pneumocystosis’’ (ICD–9 No. 136.3)contained in the category ‘‘All other infectious and parasitic diseases’’; to ‘‘Malignant neoplasms, including neoplasmslymphatic and hematopoietic tissues’’; anto a number of other causes. As a conquence, cause-of-death data beginnwith 1987 are not strictly comparablwith data for previous years.
Alzheimer’s disease deaths
Alzheimer’s disease is a progresively debilitating disease that falls withia class of disorders generally referredas dementia. These disorders, characized by cognitive and mental deteriortion, may manifest in sudden oprogressive forms. Alzheimer’s diseasethe major type of progressive demenwithin the class of disorders (30).
s-
yc-eyiss,lly,nd
--
at
s
e
dry
ess
ofde-ng
-
toer--risia
Alzheimer’s mortality is believed tobe underreported. Research shows thasubstantial number of death certificatefor persons diagnosed with dementia dnot mention the condition (31,32). Underreporting is believed to be due to failureto report a condition considered to contribute to death, judgment that this condtion did not contribute to death, or failureto diagnose the condition. A separate caegory for Alzheimer’s disease death(ICD–9 No. 331.0) was introduced in theICD–9.
Codes for firearm deaths
Causes of death attributable to firearm mortality include ICD–9 No. E922,Accident caused by firearm missile; NosE955.0–E955.4, Suicide and self-inflicteinjury by firearms; E965.0–E965.4 andE970, Assault by firearms and legal intevention; and E985.0–E985.4, Injury byfirearms, undetermined whether accidetally or purposely inflicted. Injury byfirearm causes exclude explosives another causes indirectly related to firearm
Codes for drug-induced deaths
Causes of death attributable to druginduced mortality include ICD–9 No. 292Drug psychoses; No. 304, Drug dependence; Nos. 305.2–305.9, Nondependeuse of drugs not including alcohol andtobacco; Nos. E850–E858, Accidental posoning by drugs, medicaments, and biologicals; Nos. E950.0–E950.5, Suicide bdrugs, medicaments, and biologicals; NE962.0, Assault from poisoning by drugand medicaments; and NosE980.0–E980.5, Poisoning by drugsmedicaments, and biologicals, undetemined whether accidentally or purposelinflicted. Drug-induced causes excludaccidents, homicides, and other causindirectly related to drug use.
Codes for alcohol-induced deaths
Causes of death attributable talcohol-induced mortality include ICD–9No. 291, Alcoholic psychoses; No. 303Alcohol dependence syndrome; No. 305.Nondependent abuse of alcohol; No357.5, Alcoholic polyneuropathy; No.425.5, Alcoholic cardiomyopathy; No.535.3, Alcoholic gastritis; Nos.571.0–571.3, Chronic liver disease an
.3ol
o
nl-
eera-u-
e
nin
9
1
et
7hv
lmn
the
te
laadc
t
fhto
h
i
in
cndoo
r-
,t
ad-tor-rofar-f-es,
ehe.u-).90use-alu-oreyl-,n
k
fe
tes.
74 Monthly Vital Statistics Report + Vol. 45, No. 3(S) + September 30, 1996
cirrhosis, specified as alcoholic; No. 790Excessive blood level of alcohol; and NE860, Accidental poisoning by alcohonot elsewhere classified. Alcohol-inducecauses exclude accidents, homicides, aother causes indirectly related to alcohuse.
Quality of reporting of cause ofdeath
One index of the quality of reportingcauses of death is the proportion of deacertificates coded to the Ninth RevisioChapter XVI; Symptoms, signs, and ildefined conditions (ICD–9 Nos. 780–799Although deaths occur for which thunderlying causes are impossible to detmine, this proportion indicates the caand consideration given to the certifiction by the medical certifier. This proportion also may be used as a rough measof the specificity of the medical diagnoses made by the certifier in variouareas. In 1994, 1.11 percent of all reportdeaths in the United States were assignto Symptoms, signs, and ill-defined coditions compared with 1.17 percent1993. Although the percent of deathfrom this cause for all ages combinegenerally has remained stable since 19decreases have occurred for 10-year agroups for 15–44 years. Increases sin1990 have occurred for age groups 5–years and 85 years and over.
Cause-of-death rankings
The cause-of-death rankings infig-ure 4 and tables B, 6, 7, 15,and 31 arebased on the List of 72 Selected Causof Death, HIV Infection (ICD–9 Nos.*042–*044) and Alzheimer’s diseas(ICD–9 No. 331.0). The cause-of-dearanking for infants intables 26and27arebased on the List of 61 Selected Causof Infant Death and HIV Infection. HIVinfection was added to the lists of rankabcauses effective with data year 198Alzheimer’s disease was added to tlists of rankable causes of death effectiwith data year 1994.
The group titles Major cardiovascular diseases and Symptoms, signs, aill-defined conditions are not ranked fromthe List of 72 Selected Causes; Certaconditions originating in the perinata
,.,dndl
th;
).
r-e-
re
sded-
sd0,gece4
es
h
es
le.ee
-nd
inl
period and Symptoms, signs, and idefined conditions are not ranked frothe List of 61 Selected Causes of InfaDeath. In addition, category titles thabegin with the words ‘‘Other’’ and ‘‘Allother’’ are not ranked to determine thleading causes of death. When one oftitles that represents a subtotal is rank(for example, Tuberculosis), its component parts are not ranked (in this casTuberculosis of respiratory system anOther tuberculosis).
Hispanic origin
For 1994 mortality data for theHispanic-origin population are based odeaths to residents of 49 States andDistrict of Columbia whose data werapproximately 80 percent or more complete on a place-of-occurrence basis aconsidered to be sufficiently comparabto be used for analysis. Data includeStates except Oklahoma, which wexcluded because its death certificatesnot include an item to identify Hispanior ethnic origin.
Infant mortality rates for theHispanic-origin population are based onumbers of resident infant deaths reporto be of Hispanic origin and numbers oresident live births by Hispanic origin omother for the same 49 States and tDistrict of Columbia. In computing infanmortality rates, deaths and live birthsunknown origin are not distributed amonthe specified Hispanic and non-Hispangroups. Because the percent of infadeaths of unknown origin was 1.3 and tpercent of live births of unknown originwas 1.1 for the 49 States and the Distrof Columbia for 1994, infant mortalityrates in this report by specified Hispanorigin and race for non-Hispanic origimay be underestimated.
Small numbers of infant deaths fospecific Hispanic-origin groups can resuin infant mortality rates subject to relatively large random variation (see ‘‘Ran-dom variation’’).
In 1990 the 49 States and the Distriof Columbia accounted for 99.6 perceof the Hispanic population in the UniteStates, including about 99.5 percentthe Mexican population, 99.8 percentthe Puerto Rican population, 99.9 perce
l-
tt
eed-e,d
nhe
-ndellsid
nedf
e
fgicnte
ct
c
rlt-
tt
ffnt
of the Cuban population, and 99.7 pecent of the Other Hispanic population(33).
Educational attainment
Beginning with the 1989 data yearmortality data on educational attainmenare being tabulated from informationreported on the death certificate. Asresult of the revision of the U.S. StandarCertificate of Death (14), an item indicating educational attainment was addedthe certificates of numerous States. Motality data on educational attainment fo1994 are based on deaths to residentsthe 45 States and the District of Columbiwhose data were approximately 80 pecent or more complete on a place-ooccurrence basis. Data include all Statexcept Georgia, Kentucky, OklahomaRhode Island, and South Dakota.
Population bases for computingrates
The population used for computingdeath rates in this report (furnished by thU.S. Bureau of the Census) represents tpopulation residing in the specified areaDeath rates for 1994 are based on poplation estimates as of July 1, 1994 (34,35The estimates are based on the 19census level counts. The 1990 censlevel counts by race were modified to bconsistent with U.S. Office of Management and Budget categories and historiccategories for death data (36). The poplation estimates for Mexicans, PuertRicans, Cubans, and Other Hispanics abased on the Current Population Surveadjusted to resident population contrototals (37) for 49 States (excluding Oklahoma) and the District of Columbia andas such, are subject to sampling variatio(see ‘‘Random variation’’).
Infant mortality rates infigure 5andtables Cand 24–29 are the most com-monly used index for measuring the risof dying during the first year of life. Theyare calculated by dividing the number oinfant deaths in a calendar year by thnumber of live births registered for thesame period and are presented as raper 1,000 or per 100,000 live births
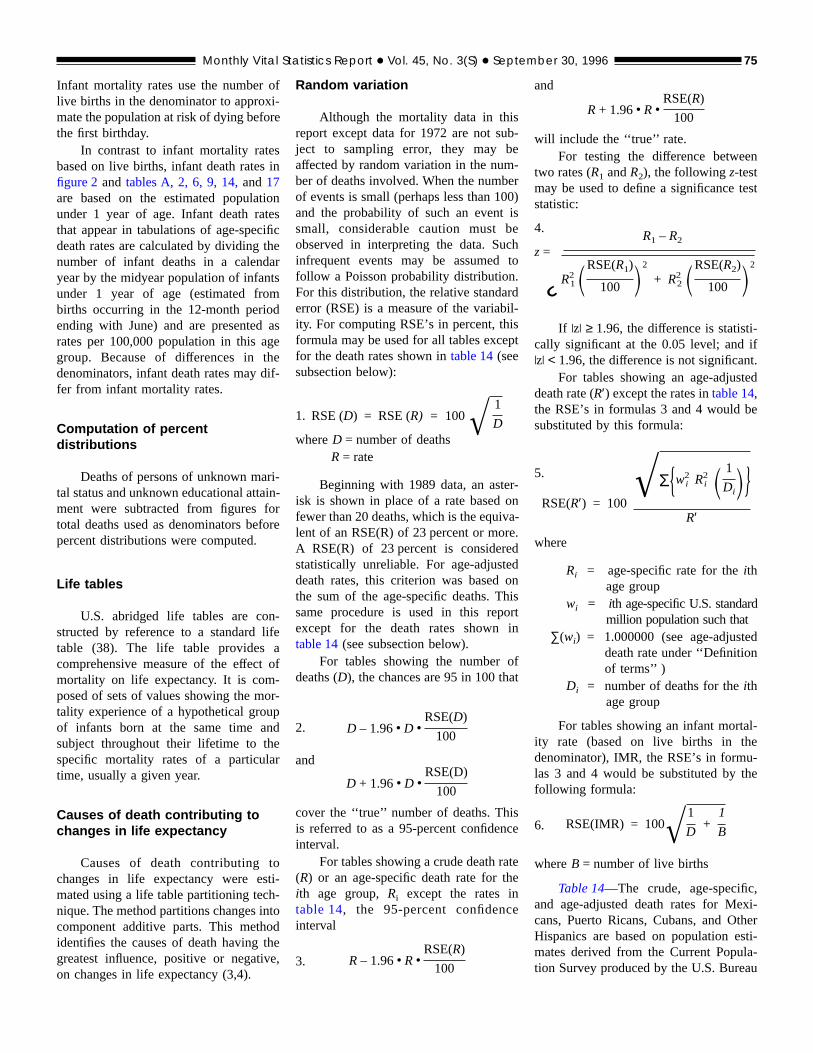
oi-re
si
oefihatsmdagei
iin
o
ifao-
pder
ot
t
he
s
e
e0ibc
.riisp
ro
e
eohoi
oa
s
h
e
n
st
.d
d
d
-
e
,i-erti--u
Monthly Vital Statistics Report + Vol. 45, No. 3(S) + September 30, 1996 75
Infant mortality rates use the numberlive births in the denominator to approxmate the population at risk of dying befothe first birthday.
In contrast to infant mortality ratebased on live births, infant death ratesfigure 2andtables A, 2, 6, 9, 14,and17are based on the estimated populatiunder 1 year of age. Infant death ratthat appear in tabulations of age-specideath rates are calculated by dividing tnumber of infant deaths in a calendyear by the midyear population of infanunder 1 year of age (estimated frobirths occurring in the 12-month perioending with June) and are presentedrates per 100,000 population in this agroup. Because of differences in thdenominators, infant death rates may dfer from infant mortality rates.
Computation of percentdistributions
Deaths of persons of unknown martal status and unknown educational attament were subtracted from figures fototal deaths used as denominators befpercent distributions were computed.
Life tables
U.S. abridged life tables are constructed by reference to a standard ltable (38). The life table providescomprehensive measure of the effectmortality on life expectancy. It is composed of sets of values showing the motality experience of a hypothetical grouof infants born at the same time ansubject throughout their lifetime to thspecific mortality rates of a particulatime, usually a given year.
Causes of death contributing tochanges in life expectancy
Causes of death contributing tchanges in life expectancy were esmated using a life table partitioning technique. The method partitions changes incomponent additive parts. This methoidentifies the causes of death having tgreatest influence, positive or negativon changes in life expectancy (3,4).
f
n
nscer
se
f-
--rre
-e
f
r-
i--ode,
Random variation
Although the mortality data in thireport except data for 1972 are not suject to sampling error, they may baffected by random variation in the number of deaths involved. When the numbof events is small (perhaps less than 1and the probability of such an eventsmall, considerable caution mustobserved in interpreting the data. Suinfrequent events may be assumedfollow a Poisson probability distributionFor this distribution, the relative standaerror (RSE) is a measure of the variabity. For computing RSE’s in percent, thformula may be used for all tables excefor the death rates shown intable 14(seesubsection below):
1. RSE (D) = RSE (R) = 100Π1
DwhereD = number of deaths
R= rate
Beginning with 1989 data, an asteisk is shown in place of a rate basedfewer than 20 deaths, which is the equivlent of an RSE(R) of 23 percent or morA RSE(R) of 23 percent is considerestatistically unreliable. For age-adjustdeath rates, this criterion was basedthe sum of the age-specific deaths. Tsame procedure is used in this repexcept for the death rates showntable 14(see subsection below).
For tables showing the numberdeaths (D), the chances are 95 in 100 th
2. D – 1.96v D vRSE(D)
100
and
D + 1.96v D vRSE(D)
100
cover the ‘‘true’’ number of deaths. Thiis referred to as a 95-percent confideninterval.
For tables showing a crude death ra(R) or an age-specific death rate for tith age group,Ri except the rates intable 14, the 95-percent confidencinterval
3. R –1.96v R vRSE(R)
100
b-
-r0)sehto
dl-
t
-na-.ddnisrtn
ft
ce
tee
and
R+ 1.96v R vRSE(R)
100
will include the ‘‘true’’ rate.For testing the difference betwee
two rates (R1 andR2), the followingz-testmay be used to define a significance testatistic:
4.
z=R1 –R2
˛ R21SRSE(R1)100 D2
+ R22SRSE(R2)100 D2
If ?z? ≥ 1.96, the difference is statisti-cally significant at the 0.05 level; and if?z? < 1.96, the difference is not significant
For tables showing an age-adjustedeath rate (R′) except the rates intable 14,the RSE’s in formulas 3 and 4 would besubstituted by this formula:
5.
RSE(R′) = 100
ŒΣ{w2i R2i S 1DiD}
R′
where
Ri = age-specific rate for theithage group
wi = ith age-specific U.S. standarmillion population such that
∑(wi) = 1.000000 (see age-adjustedeath rate under ‘‘Definitionof terms’’ )
Di = number of deaths for theithage group
For tables showing an infant mortality rate (based on live births in thedenominator), IMR, the RSE’s in formu-las 3 and 4 would be substituted by thfollowing formula:
6. RSE(IMR) = 100Œ1
D+
1
B
whereB = number of live births
Table 14—The crude, age-specificand age-adjusted death rates for Mexcans, Puerto Ricans, Cubans, and OthHispanics are based on population esmates derived from the Current Population Survey produced by the U.S. Burea
aioe
cs
ntece
etei
snh
e
m
t
d
rdver-edn.
r
e
t
ts
-
e
-
-
de-h
76 Monthly Vital Statistics Report + Vol. 45, No. 3(S) + September 30, 1996
of the Census. As a result, the ratessubject to the variability of the denomnator as well as the numerator. Ftable 14the following RSE formulas werused to determine a RSE of 23 percentmore for the purpose of showing the raor an asterisk.
For crude,R, and age-specific deatrates,Ri,
7.
RSE(R) = 100ŒS1DD + 0.67 Sa + bPDand for age-adjusted death rates,R′,
RSE(R′) = 100•
8.
˛ S{w2i R2i S 1DiD+ 0.67Sa+ b
PiD }R'
where
D = number of deathsP = population estimate used fo
computing the rateDi = number of deaths for theith age
groupPi = population estimate used for com
puting for the ith age-specificdeath rate
For all origins, total Hispanic, totanon-Hispanic, non-Hispanic white, annon-Hispanic black populations,
a = 0.000000 andb = 0
and for Mexican, Puerto RicanCuban, and Other Hispanic populations
a = –0.000297 andb = 6,865
Thea andb factors are Current Population Survey standard error paramete(39).
3 4
re-r
orte
h
r
-
ld
,,
-rs
To compute 95-percent confidenintervals andz-tests for the death rateshown in table 14, the RSE formulas 7and 8 may be substituted as appropriafor the RSE’s used in formulas 3 and 4
Infant and maternal mortality rates—Comparisons made in the text amoinfant, neonatal, postneonatal, and manal mortality rates, unless otherwise spefied, are statistically significant at th0.05 level of significance. Lack of comment in the text about any two rates donot mean that the difference was tesand found not to be significant at thlevel.
Availability of mortality data
Mortality data are available in electronic format (data tapes and CD-ROM’from the National Technical InformatioService. Data are also available in tVital Statistics of the United States, Vol-ume II, Mortality, Parts A and B,Vitaland Health Statistics, Series 20, and thMonthly Vital Statistics Reportand supple-ments through NCHS. Additional unpublished tabulations are available froNCHS or through its Internet site ahttp://www.cdc.gov/nchswww/nchshome.h
Definitions of terms
Infant deaths—Deaths of infants ageunder 1 year.
Neonatal deaths—Deaths of infantsaged 0–27 days.
Postneonatal deaths—Deaths ofinfants aged 28 days–1 year.
Crude death rate—Total deaths pe100,000 population for a specified perioThe crude death rate represents the aage chance of dying during a specifiperiod for persons in the entire populatio
e
te,.
gr-i-
-sds
-)
e
-
tm.
.
Age-specific death rate—Deaths per100,000 population in a specified agegroup, such as 1–4 years or 5–9 years foa specified period.
Age-adjusted death rate—The deathrate used to make comparisons of relativmortality risks across groups and overtime. However, it should be viewed as aconstruct or an index rather than as direcor actual measure of mortality risk. Sta-tistically, it is a weighted average of theage-specific death rates, where the weighrepresent the fixed population proportionsby age (40). The age-adjusted rates presented in this report were computed bythe direct method, that is, by applying theage-specific death rates for a given causof death to the U.S. standard millionpopulation (relative age distribution of1940 enumerated population of the UnitedStates), which is shown below along withthe corresponding weights used for computing the RSE(R′) in the preceding for-mulas:
Age Number Weight (wi)
All ages . . . . . . . . . 1,000,000 1.000000
Under 1 year . . . . . . 15,343 0.0153431–4 years . . . . . . . . 64,718 0.0647185–14 years. . . . . . . . 170,355 0.17035515–24 years . . . . . . . 181,677 0.18167725–34 years . . . . . . . 162,066 0.16206635–44 years . . . . . . . 139,237 0.13923745–54 years . . . . . . . 117,811 0.11781155–64 years . . . . . . . 80,294 0.08029465–74 years . . . . . . . 48,426 0.04842675–84 years . . . . . . . 17,303 0.01730385 years and over . . . 2,770 0.002770
By using the same standard population, the rates for the total population andfor each race-sex group were adjusteseparately. The age-adjusted rates werbased on 10-year age groups. It is important not to compare age-adjusted deatrates with crude rates.
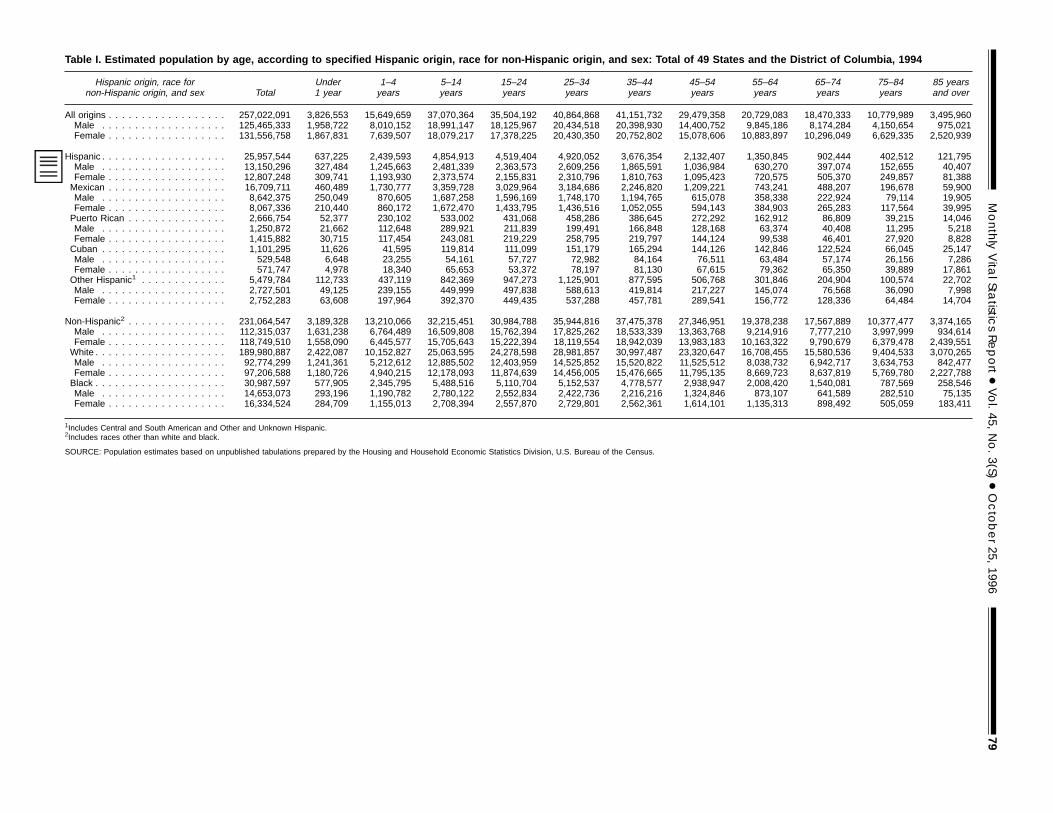
Table I. Estimated population by age, according to specified Hispanic origin, race for non-Hispanic origin, and sex: Total of 49 States and the District of Columbia, 1994
Hispanic origin, race fornon-Hispanic origin, and sex Total
Under1 year
1–4years
5–14years
15–24years
25–34years
35–44years
45–54years
55–64years
65–74years
75–84years
85 yearsand over
All origins . . . . . . . . . . . . . . . . . . 257,022,091 3,826,553 15,649,659 37,070,364 35,504,192 40,864,868 41,151,732 29,479,358 20,729,083 18,470,333 10,779,989 3,495,960Male . . . . . . . . . . . . . . . . . . . 125,465,333 1,958,722 8,010,152 18,991,147 18,125,967 20,434,518 20,398,930 14,400,752 9,845,186 8,174,284 4,150,654 975,021Female . . . . . . . . . . . . . . . . . . 131,556,758 1,867,831 7,639,507 18,079,217 17,378,225 20,430,350 20,752,802 15,078,606 10,883,897 10,296,049 6,629,335 2,520,939
Hispanic . . . . . . . . . . . . . . . . . . . 25,957,544 637,225 2,439,593 4,854,913 4,519,404 4,920,052 3,676,354 2,132,407 1,350,845 902,444 402,512 121,795Male . . . . . . . . . . . . . . . . . . . 13,150,296 327,484 1,245,663 2,481,339 2,363,573 2,609,256 1,865,591 1,036,984 630,270 397,074 152,655 40,407Female . . . . . . . . . . . . . . . . . . 12,807,248 309,741 1,193,930 2,373,574 2,155,831 2,310,796 1,810,763 1,095,423 720,575 505,370 249,857 81,388Mexican . . . . . . . . . . . . . . . . . . 16,709,711 460,489 1,730,777 3,359,728 3,029,964 3,184,686 2,246,820 1,209,221 743,241 488,207 196,678 59,900Male . . . . . . . . . . . . . . . . . . . 8,642,375 250,049 870,605 1,687,258 1,596,169 1,748,170 1,194,765 615,078 358,338 222,924 79,114 19,905Female . . . . . . . . . . . . . . . . . . 8,067,336 210,440 860,172 1,672,470 1,433,795 1,436,516 1,052,055 594,143 384,903 265,283 117,564 39,995Puerto Rican . . . . . . . . . . . . . . . 2,666,754 52,377 230,102 533,002 431,068 458,286 386,645 272,292 162,912 86,809 39,215 14,046Male . . . . . . . . . . . . . . . . . . . 1,250,872 21,662 112,648 289,921 211,839 199,491 166,848 128,168 63,374 40,408 11,295 5,218Female . . . . . . . . . . . . . . . . . . 1,415,882 30,715 117,454 243,081 219,229 258,795 219,797 144,124 99,538 46,401 27,920 8,828Cuban . . . . . . . . . . . . . . . . . . . 1,101,295 11,626 41,595 119,814 111,099 151,179 165,294 144,126 142,846 122,524 66,045 25,147Male . . . . . . . . . . . . . . . . . . . 529,548 6,648 23,255 54,161 57,727 72,982 84,164 76,511 63,484 57,174 26,156 7,286Female . . . . . . . . . . . . . . . . . . 571,747 4,978 18,340 65,653 53,372 78,197 81,130 67,615 79,362 65,350 39,889 17,861Other Hispanic1 . . . . . . . . . . . . . 5,479,784 112,733 437,119 842,369 947,273 1,125,901 877,595 506,768 301,846 204,904 100,574 22,702Male . . . . . . . . . . . . . . . . . . . 2,727,501 49,125 239,155 449,999 497,838 588,613 419,814 217,227 145,074 76,568 36,090 7,998Female . . . . . . . . . . . . . . . . . . 2,752,283 63,608 197,964 392,370 449,435 537,288 457,781 289,541 156,772 128,336 64,484 14,704
Non-Hispanic2 . . . . . . . . . . . . . . . 231,064,547 3,189,328 13,210,066 32,215,451 30,984,788 35,944,816 37,475,378 27,346,951 19,378,238 17,567,889 10,377,477 3,374,165Male . . . . . . . . . . . . . . . . . . . 112,315,037 1,631,238 6,764,489 16,509,808 15,762,394 17,825,262 18,533,339 13,363,768 9,214,916 7,777,210 3,997,999 934,614Female . . . . . . . . . . . . . . . . . . 118,749,510 1,558,090 6,445,577 15,705,643 15,222,394 18,119,554 18,942,039 13,983,183 10,163,322 9,790,679 6,379,478 2,439,551White . . . . . . . . . . . . . . . . . . . . 189,980,887 2,422,087 10,152,827 25,063,595 24,278,598 28,981,857 30,997,487 23,320,647 16,708,455 15,580,536 9,404,533 3,070,265Male . . . . . . . . . . . . . . . . . . . 92,774,299 1,241,361 5,212,612 12,885,502 12,403,959 14,525,852 15,520,822 11,525,512 8,038,732 6,942,717 3,634,753 842,477Female . . . . . . . . . . . . . . . . . . 97,206,588 1,180,726 4,940,215 12,178,093 11,874,639 14,456,005 15,476,665 11,795,135 8,669,723 8,637,819 5,769,780 2,227,788Black . . . . . . . . . . . . . . . . . . . . 30,987,597 577,905 2,345,795 5,488,516 5,110,704 5,152,537 4,778,577 2,938,947 2,008,420 1,540,081 787,569 258,546Male . . . . . . . . . . . . . . . . . . . 14,653,073 293,196 1,190,782 2,780,122 2,552,834 2,422,736 2,216,216 1,324,846 873,107 641,589 282,510 75,135Female . . . . . . . . . . . . . . . . . . 16,334,524 284,709 1,155,013 2,708,394 2,557,870 2,729,801 2,562,361 1,614,101 1,135,313 898,492 505,059 183,411
1Includes Central and South American and Other and Unknown Hispanic.2Includes races other than white and black.
SOURCE: Population estimates based on unpublished tabulations prepared by the Housing and Household Economic Statistics Division, U.S. Bureau of the Census.
MonthlyVita
lStatistic
sReport+Vol.45,
No.3(S)
+October25,
199679
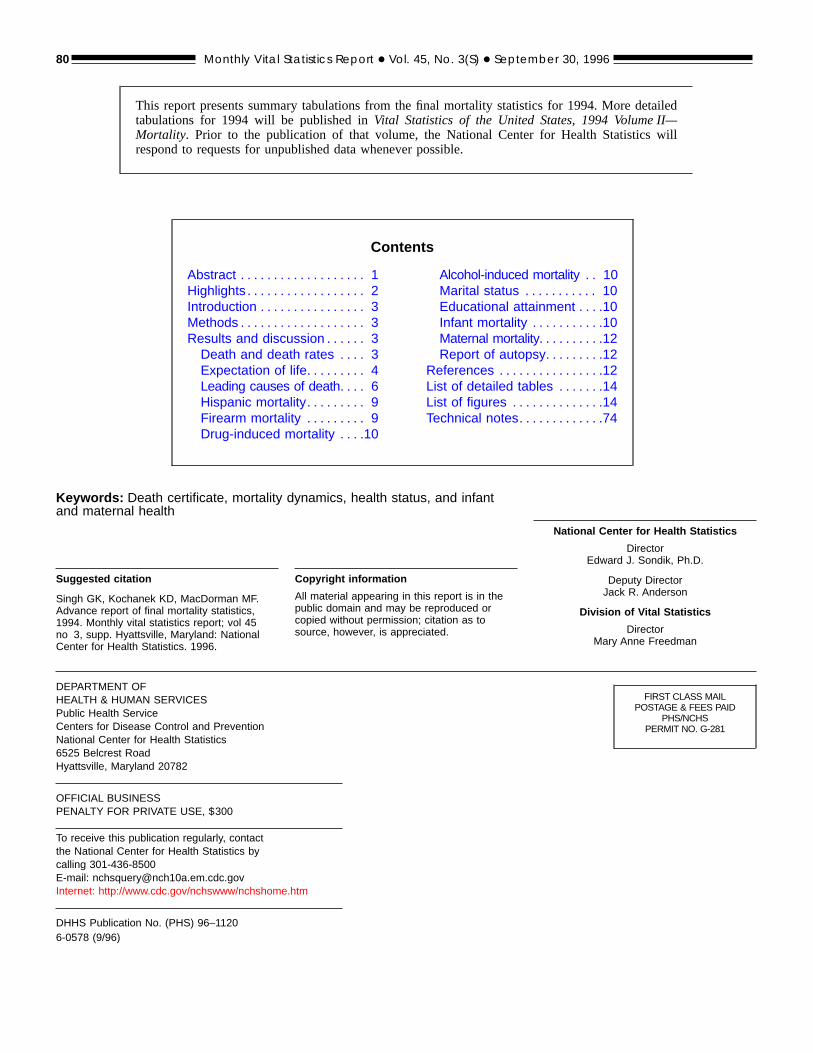
Suggested citation
Singh GK, Kochanek KD, MacDorman MF.Advance report of final mortality statistics,1994. Monthly vital statistics report; vol 45no 3, supp. Hyattsville, Maryland: NationalCenter for Health Statistics. 1996.
Copyright information
All material appearing in this report is in thepublic domain and may be reproduced orcopied without permission; citation as tosource, however, is appreciated.
National Center for Health Statistics
DirectorEdward J. Sondik, Ph.D.
Deputy DirectorJack R. Anderson
Division of Vital Statistics
DirectorMary Anne Freedman
Contents
Abstract . . . . . . . . . . . . . . . . . . . 1Highlights . . . . . . . . . . . . . . . . . . 2Introduction . . . . . . . . . . . . . . . . 3Methods . . . . . . . . . . . . . . . . . . . 3Results and discussion . . . . . . 3Death and death rates . . . . 3Expectation of life. . . . . . . . . 4Leading causes of death. . . . 6Hispanic mortality. . . . . . . . . 9Firearm mortality . . . . . . . . . 9Drug-induced mortality . . . .10
Alcohol-induced mortality . . 10Marital status . . . . . . . . . . . 10Educational attainment . . . .10Infant mortality . . . . . . . . . . .10Maternal mortality. . . . . . . . . .12Report of autopsy. . . . . . . . .12
References . . . . . . . . . . . . . . . .12List of detailed tables . . . . . . .14List of figures . . . . . . . . . . . . . .14Technical notes. . . . . . . . . . . . .74
This report presents summary tabulations from the final mortality statistics for 1994. More detailedtabulations for 1994 will be published inVital Statistics of the United States, 1994 Volume II—Mortality. Prior to the publication of that volume, the National Center for Health Statistics willrespond to requests for unpublished data whenever possible.
Keywords: Death certificate, mortality dynamics, health status, and infantand maternal health
80 Monthly Vital Statistics Report + Vol. 45, No. 3(S) + September 30, 1996
DEPARTMENT OFHEALTH & HUMAN SERVICESPublic Health ServiceCenters for Disease Control and PreventionNational Center for Health Statistics6525 Belcrest RoadHyattsville, Maryland 20782
OFFICIAL BUSINESSPENALTY FOR PRIVATE USE, $300
To receive this publication regularly, contactthe National Center for Health Statistics bycalling 301-436-8500E-mail: [email protected]
DHHS Publication No. (PHS) 96–1120
Internet: http://www.cdc.gov/nchswww/nchshome.htm
6-0578 (9/96)
FIRST CLASS MAILPOSTAGE & FEES PAID
PHS/NCHSPERMIT NO. G-281


![Home [] · 2021. 2. 24. · samsung samsung samsung samsung samsung advance advance advance advance advance advance advance advance advance advance 223sw 2233sw 2233sw 2233sw 933sn](https://img.pdfslide.us/doc/110x75/613cd1974c23507cb6359ff0/home-2021-2-24-samsung-samsung-samsung-samsung-samsung-advance-advance.jpg)