Embed Size (px)
Citation preview

Surface Science 547 (2003) 85–98
www.elsevier.com/locate/susc
Adsorption and diffusion energetics of hydrogen atomson Fe(1 1 0) from first principles
D.E. Jiang, Emily A. Carter *
Department of Chemistry and Biochemistry, Box 951569, University of California, Los Angeles, CA 90095-1569, USA
Received 10 August 2003; accepted for publication 4 October 2003
Abstract
Spin-polarized density functional theory (DFT) has been used to characterize hydrogen atom adsorption and dif-
fusion energetics on the Fe(1 1 0) surface. The Kohn-Sham equations are solved with periodic boundary conditions and
within the all-electron projector-augmented-wave (PAW) formalism, using a generalized gradient approximation
(GGA) to account for electron exchange and correlation. We investigate the site preference of H on Fe(1 1 0) for 0.25,
0.50, and 1.0 ML coverages and find that the quasi three-fold site is the only stable minimum (in agreement with
experiment). We find the long and short bridge sites to be transition states for H diffusion on Fe(1 1 0), while the on top
site is a rank-2 saddle point. The preference of the three-fold site is rationalized via an analysis of the site- and orbital-
resolved density of states. An analysis of charge density differences suggests that the H–Fe interaction is quite covalent,
with only �0.1 electron transferred from Fe atoms to H in the three-fold site of Fe(1 1 0). We also compare two ex-
perimentally observed 0.50 ML phases for H/Fe(1 1 0): a graphitic (2 · 2)-2H and a (2 · 1) phase. We confirm the LEED
data that the Fe(1 1 0)-(2 · 2)-2H superstructure is more stable at low temperature. The predicted adsorption structure
and weak substrate reconstruction for the Fe(1 1 0)-(2 · 2)-2H phase roughly agree with experiment, though discrep-
ancies do exist regarding the H-surface height and the H–H distance. Moreover, trends in work function with coverage
are predicted to be qualitatively different than older measurements, with even the sign of the work function changes in
question. Lastly, a zig–zag diffusion path for H atoms on Fe(1 1 0) is proposed, involving a very low (<0.2 eV) barrier.
� 2003 Elsevier B.V. All rights reserved.
Keywords: Density functional calculations; Chemisorption; Iron; Hydrogen atom; Surface diffusion
1. Introduction
The interaction of hydrogen with transition
metal surfaces is of great fundamental and
practical interest in both heterogeneous catalysis
* Corresponding author. Tel.: +1-310-206-5118; fax: +1-310-
267-0319.
E-mail address: [email protected] (E.A. Carter).
0039-6028/$ - see front matter � 2003 Elsevier B.V. All rights reserv
doi:10.1016/j.susc.2003.10.007
and metallurgy. Transition metal surfaces cata-lyze numerous hydrogenation reactions. Hydrogen
chemisorption on iron is particularly important,
not only as a reactant in Fe-catalyzed ammonia
synthesis [1], the Fischer–Tropsch reaction [2] (and
many others), but also because hydrogen is known
to embrittle steels [3,4], causing fracture and ulti-
mately failure of the steel component.
The adsorption of hydrogen on low-index Fesurfaces has been investigated experimentally for
ed.
86 D.E. Jiang, E.A. Carter / Surface Science 547 (2003) 85–98
more than 25 years [5–9]. Molecular hydrogen is
found to adsorb dissociatively on these surfaces
and the process is strongly exothermic. The fol-
lowing survey of the literature focuses only on the
adsorption of H on the Fe(1 1 0) surface, which is
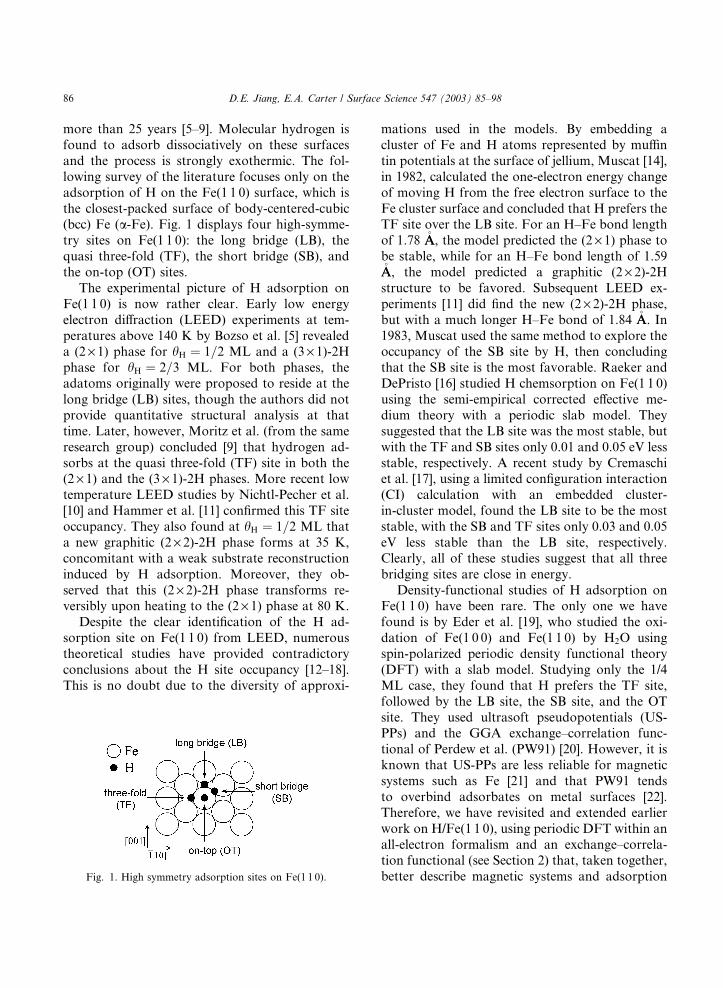
the closest-packed surface of body-centered-cubic(bcc) Fe (a-Fe). Fig. 1 displays four high-symme-try sites on Fe(1 1 0): the long bridge (LB), the
quasi three-fold (TF), the short bridge (SB), and
the on-top (OT) sites.
The experimental picture of H adsorption on
Fe(1 1 0) is now rather clear. Early low energy
electron diffraction (LEED) experiments at tem-
peratures above 140 K by Bozso et al. [5] revealeda (2 · 1) phase for hH ¼ 1=2 ML and a (3 · 1)-2Hphase for hH ¼ 2=3 ML. For both phases, the
adatoms originally were proposed to reside at the
long bridge (LB) sites, though the authors did not
provide quantitative structural analysis at that
time. Later, however, Moritz et al. (from the same
research group) concluded [9] that hydrogen ad-
sorbs at the quasi three-fold (TF) site in both the(2 · 1) and the (3 · 1)-2H phases. More recent low
temperature LEED studies by Nichtl-Pecher et al.
[10] and Hammer et al. [11] confirmed this TF site
occupancy. They also found at hH ¼ 1=2 ML thata new graphitic (2 · 2)-2H phase forms at 35 K,
concomitant with a weak substrate reconstruction
induced by H adsorption. Moreover, they ob-
served that this (2 · 2)-2H phase transforms re-versibly upon heating to the (2 · 1) phase at 80 K.Despite the clear identification of the H ad-
sorption site on Fe(1 1 0) from LEED, numerous
theoretical studies have provided contradictory
conclusions about the H site occupancy [12–18].
This is no doubt due to the diversity of approxi-
Fig. 1. High symmetry adsorption sites on Fe(1 1 0).
mations used in the models. By embedding a
cluster of Fe and H atoms represented by muffin
tin potentials at the surface of jellium, Muscat [14],
in 1982, calculated the one-electron energy change
of moving H from the free electron surface to the
Fe cluster surface and concluded that H prefers theTF site over the LB site. For an H–Fe bond length
of 1.78 �AA, the model predicted the (2 · 1) phase tobe stable, while for an H–Fe bond length of 1.59�AA, the model predicted a graphitic (2 · 2)-2Hstructure to be favored. Subsequent LEED ex-
periments [11] did find the new (2 · 2)-2H phase,
but with a much longer H–Fe bond of 1.84 �AA. In1983, Muscat used the same method to explore theoccupancy of the SB site by H, then concluding
that the SB site is the most favorable. Raeker and
DePristo [16] studied H chemsorption on Fe(1 1 0)
using the semi-empirical corrected effective me-
dium theory with a periodic slab model. They
suggested that the LB site was the most stable, but
with the TF and SB sites only 0.01 and 0.05 eV less
stable, respectively. A recent study by Cremaschiet al. [17], using a limited configuration interaction
(CI) calculation with an embedded cluster-
in-cluster model, found the LB site to be the most
stable, with the SB and TF sites only 0.03 and 0.05
eV less stable than the LB site, respectively.
Clearly, all of these studies suggest that all three
bridging sites are close in energy.
Density-functional studies of H adsorption onFe(1 1 0) have been rare. The only one we have
found is by Eder et al. [19], who studied the oxi-
dation of Fe(1 0 0) and Fe(1 1 0) by H2O using
spin-polarized periodic density functional theory
(DFT) with a slab model. Studying only the 1/4
ML case, they found that H prefers the TF site,
followed by the LB site, the SB site, and the OT
site. They used ultrasoft pseudopotentials (US-PPs) and the GGA exchange–correlation func-
tional of Perdew et al. (PW91) [20]. However, it is
known that US-PPs are less reliable for magnetic
systems such as Fe [21] and that PW91 tends
to overbind adsorbates on metal surfaces [22].
Therefore, we have revisited and extended earlier
work on H/Fe(1 1 0), using periodic DFT within an
all-electron formalism and an exchange–correla-tion functional (see Section 2) that, taken together,
better describe magnetic systems and adsorption

D.E. Jiang, E.A. Carter / Surface Science 547 (2003) 85–98 87
energetics, with a goal to resolve the discrepancies
among early theoretical studies (and experiment).
Moreover, in Eder et al.�s work and other earliertheoretical studies, the hydrogen coverage was
limited to 0.25 ML or below and the nature of the
various high-symmetry sites, i.e., whether a site isminimum or a saddle point, was not determined.
We extend earlier work by examining the full
coverage range and by determining the nature of
critical points on the potential energy surface, in
order to compare with experiment and to provide
a reference point for further simulations of surface
diffusion and H-embrittlement of iron.
The paper is organized as follows. In Section 2,we present the theoretical method employed. Re-
sults for the clean Fe(1 1 0) surface are presented in
Section 3.1. We then compare the energy of H
adsorption on various sites for hH ¼ 1=4 and 1 MLin Section 3.2. Section 3.3 offers a comparison of
the (2 · 2)-2H and (2 · 1) phases formed at
hH ¼ 1=2 ML. In Section 3.4, we show how the
work function and charge distribution change withcoverage. We discuss our results in Section 4 and
conclude in Section 5.
Table 1
Equilibrium lattice constant (a), bulk modulus (B), and mag-netic moment (M) of ferromagnetic bcc Fe using PAW–GGA(PW91) DFT
Method a (�AA) B (GPa) M (lB)
Present PAW 2.834 174 2.21
PAWa 2.83 174 2.20
Experiment 2.86b 168c 2.22c
aRef. [32].b Extrapolated to 0 K, Ref. [33].c Ref. [34].
2. Theoretical method
The first-principles calculations performed are
based on spin-polarized DFT [23,24]. The ViennaAb Initio Simulation Package (VASP) is used to
solve the Kohn-Sham equations with periodic
boundary conditions and a plane-wave basis set
[25,26]. Here we employ Bl€oochl�s projector aug-mented wave (PAW) method [27] as implemented
by Kresse and Joubert [21]. The PAW method is
an all-electron DFT technique (within the frozen
core approximation) with the computational effi-ciency of pseudopotential DFT algorithms. As
mentioned above, its use is necessary for accurate
calculations of certain transition metals, which are
sometimes poorly described by US-PPs. For the
treatment of electron exchange and correlation, it
is well known that the generalized gradient ap-
proximation (GGA) is needed to give an accurate
description of magnetic properties and energeticsof bulk Fe phases [28]. Therefore, all calculations
are done with the GGA functional of Perdew et al.
(PW91) [20], using the one-electron quantities
(partial waves, projectors, etc.) supplied with
VASP that are required to construct the self-con-
sistent PAW potential. (We use the standard ver-
sion of the PAW–GGA potentials for Fe and H.)
While the PW91 GGA functional yields reliableoptimized geometries, PW91 tends to overbind
adsorbates on metal surfaces [22]. We there-
fore also present results employing the RPBE
GGA exchange–correlation functional [22], which
slightly modifies the exchange part of the PBE
functional [29]. RPBE appears to give a better
description of atomization energies of molecules
and adsorption energetics. We therefore use thePW91 functional for all geometry optimizations,
and report the energetics for relaxed structures
from both PW91 and RPBE. The spin interpola-
tion of the correlation energy is accomplished by
using the Vosko–Wilk–Nusair method [30].
We use a kinetic energy cutoff of 400 eV, which
we find is sufficient to converge the total energies
of ferromagnetic (FM) bcc Fe and isolated atomicH to within 2 meV/atom. The Monkhorst-Pack
scheme [31] is used for the k-point sampling. Usinga 15 · 15 · 15 k-mesh, we obtain the equilibriumlattice constant, bulk modulus, and local magnetic
moment for ferromagnetic bcc Fe. The results
agree very well with previous PAW–GGA calcu-
lations and experiment (Table 1). Placing an H2
molecule in a 10 �AA cubic box, we obtain its equi-librium bond length, bond dissociation energy,
and harmonic vibrational frequency (Table 2). The
agreement with previous PAW–GGA calculations
and experiment is also quite reasonable.
In order to obtain a thick enough slab to
represent the Fe(1 1 0) surface, we performed

Table 2
Bond length (re), dissociation energy (De), and vibrational fre-
quency (m) of H2 using PAW–GGA (PW91) DFT
Method re (�AA) De (eV) m (cm�1)
Present PAW 0.752 4.56 4300
PAWa 0.75 4.58 4300
Experimentb 0.741 4.75 4401
aRef. [35].bRef. [36].
88 D.E. Jiang, E.A. Carter / Surface Science 547 (2003) 85–98
convergence tests of the number of slab layers,vacuum thickness, and the k-point sampling forthe bulk-terminated surface. The surface primitive
cell is used, with the energy of the unrelaxed sur-
face used as the criterion for convergence. The
results are shown in Table 3. It can be seen that a
14 · 14 · 1 k-mesh, seven slab layers, and 10 �AAvacuum converges the unrelaxed surface energy to
within 1 mJm�2. We therefore use those parame-ters for the surface primitive cell, while a 7 · 7 · 1k-mesh is used for the (2 · 2) surface cell.The first order Methfessel–Paxton method [37]
is used for the Fermi surface smearing, with a
width of 0.1 eV in order to obtain accurate forces.
A conjugate gradient or quasi-Newton algorithm
is employed to relax the ionic positions to the
ground state geometry. When the maximum forceacting on each atom of the slab drops below 0.01
eV/�AA, the structural relaxation is stopped. Onlythe top three layers of the seven slab layers are
allowed to relax. The bottom four layers are kept
fixed in bulk positions to represent the semi-infi-
Table 3
The unrelaxed surface energy (c) of the Fe(1 1 0) slab as a
function of slab and vacuum thickness and k-point sampling,using PAW–GGA (PW91) DFT
k-mesh Number of
layers in slab
Vacuum (�AA) c (Jm�2)
8· 8 · 1 5 10 2.367
10· 10 · 1 5 10 2.430
12· 12 · 1 5 10 2.442
14· 14 · 1 5 10 2.429
16· 16 · 1 5 10 2.430
12· 12 · 1 7 10 2.437
12· 12 · 1 9 10 2.436
12· 12 · 1 5 8 2.441
12· 12 · 1 5 12 2.442
nite bulk crystal beneath the surface. (Residual
forces on the fourth layer atoms are also <0.01 eV/�AA.) Hydrogen adsorbs on top of the seven Fe
layers and is allowed to relax together with the top
three Fe layers.
The work function is obtained from the differ-ence between the vacuum energy level (given as the
value where the electrostatic potential is constant
in the middle of the vacuum region) and the Fermi
level. Vibrational frequencies of H on the high-
symmetry sites are determined by diagonalizing a
finite difference construction of the Hessian matrix
with displacements of 0.01 �AA (only allowing H to
move). The site-projected and orbital-resolveddensity of states are done using a quick projection
scheme that does not require Wigner-Seitz radius
inputs and works only for PAW potentials, but not
for US-PPs or norm-conserving pseudopotentials
[38].
3. Results
3.1. Clean Fe(1 1 0)
Fe(1 1 0) is the closest-packed surface of bcc Fe.
It has been studied [39] in greater detail very re-
cently with the same plane-wave code using ultra-
soft pseudo-potentials (US-PP) and the GGA for
the exchange–correlation energy. Both experiment[40,41] and recent DFT studies [32,39,42] show
that Fe(1 1 0) is basically bulk-terminated, with
only very small relaxation and no reconstruction.
We compare our results about the relaxation of the
Fe(1 1 0) surface with recent DFT studies and ex-
periment in Table 4. Due to the small magnitude
of the relaxation, the surface energy of Fe(1 1 0) is
basically unchanged after relaxation. Our resultsare nearly identical to the previous PAW results by
Stibor et al. [32] for the interlayer relaxation and
the magnetic moment for the surface Fe atoms,
except for D1;2. This may be due to their use of adifferent kinetic energy cutoff and a smaller k-mesh(8 · 8 · 1). The agreement between our results andprevious US-PP results is generally very good for
interlayer relaxation, with our PAW prediction forthe surface energy closer to the experimental value.
In fact, all the predictions are within experimental

Table 4
Interlayer relaxation (Di;iþ1), magnetic moment of surface Fe atoms (M), and surface energy (c) for Fe(1 1 0) using PAW–GGA (PW91)DFT
Method D1;2 (%)a D2;3 (%) D3;4 (%) MðlBÞ c (Jm�2)
Present PAW )0.36 +0.46 )0.26 2.58 2.43
PAWb )0.08 +0.40 )0.25 2.59 –
US-PPc )0.33 +0.26 )0.06 – 2.27
US-PPd )0.35 +0.44 – 2.74 2.29
Exp. +0.5± 2.0e +0.5± 1.0f – – 2.41g
aDi;iþ1 is defined as the percentage change of interlayer spacing between substrate layer i and iþ 1, compared with the bulk spacingd0. Layer 1 is the topmost substrate layer.
bRef. [32].cRef. [39].dRef. [42].eRef. [40].f Ref. [41].gRef. [43].
D.E. Jiang, E.A. Carter / Surface Science 547 (2003) 85–98 89
error. The good agreement between the PAW data
and experiment for the Fe(1 1 0) surface give usconfidence to go on to study H adsorption with
this method.
3.2. H adsorption on the relaxed Fe(1 1 0) surface
at hH ¼ 1=4 and 1 ML
Table 5 shows the adsorption energy, the H-
surface distance, and the distance from H to itsnearest Fe neighbor at hH ¼ 1=4 and 1 ML afterthe structure of the H/Fe(1 1 0) slab is relaxed. For
all coverages examined, the TF site is found to be
the lowest in energy, in agreement with experi-
ment. Our predictions of the H-surface bond
length and the H–Fe distance for the TF site also
concur with experiment. By calculating the fre-
quency spectrum of the H adatom on a fixed Fesubstrate, we find that only the TF site is a true
minimum at either coverage. The LB and SB sites
are transition states for H diffusion on Fe(1 1 0),
with one imaginary frequency for both coverages.
By contrast, the OT site is actually not a minimum
nor a transition state at either coverage, but is a
rank-2 saddle point with two imaginary frequen-
cies. At 1/4 ML coverage, the LB transition state is0.05 eV higher in energy than the TF site, while the
SB transition state is 0.19 eV higher, suggesting a
very low barrier to diffusion of H atoms on
Fe(1 1 0). The OT higher-order saddle point lies
0.72 eV higher than the TF site minimum. At 1
ML coverage, the energies of the LB, SB, and OT
sites relative to the TF site are 0.14, 0.26, and 0.96
eV, respectively. Thus, the energy differences be-tween the TF site and the other sites increase with
coverage, presumably due to increasing repulsions
(discussed later) between coadsorbed hydrogen.
We see that the OT site is significantly higher in
energy than the other sites at both coverages, while
the TF, LB, and SB sites are all very close in en-
ergy, especially for hH ¼ 1=4 ML.Earlier theoretical predictions are also given in
Table 5. Eder et al.�s periodic DFT-GGA (PW91)
calculations using US-PPs yielded similar results
to ours [19] at hH ¼ 1=4 ML. Ab initio CI em-bedded cluster calculations of Cremaschi et al.
[17], modeling the asymptotic limit of zero cover-
age, predicted that the LB site is most stable, fol-
lowed by the SB, TF, and OT sites. Again, the LB,
SB, and TF sites are all predicted to be very closein energy, with the OT site again being strongly
disfavored. Qualitatively, all theory predicts the
OT to be strongly disfavored at all coverages,
while all other sites lie fairly close in energy. The
slab calculations are just able to resolve the right
ground state (TF), whereas the embedded cluster-
in-cluster model has a slight error.
Experimental H2 adsorption energies and vi-brational frequencies of the H-surface bond on
Fe(1 1 0) are available for comparison. Room
temperature electron energy loss spectroscopy
(EELS) of H2 adsorption on Fe(1 1 0) at a cover-
age �0.25 ML by Baro and Erley [45] shows an H-surface symmetric stretch frequency at 1060 cm�1,

Table 5
H atom adsorption energy (Ead ¼ EH=Fe-slab � EFe-slab � EH) without zero point energy corrections, energy difference between sitesrelative to the TF site (DE), H-surface distance (dH–S), and the distance from H to the nearest Fe (dH–Fe) at hH ¼ 1 and 1/4 ML from
PAW–GGA (PW91) DFT
Site Ead (eV/atom) DE (eV)a dH–S (�AA) dH–Fe (�AA) Site nature
Experiment TF )2.86b – 0.9 ± 0.1c 1.75± 0.05c –
Present work
1/4 ML
TF )3.00 ()2.83) 0 (0) 0.94 1.78 Minimum
LB )2.95 ()2.80) 0.05 (0.03) 0.95 1.74 Transition state
SB )2.81 ()2.66) 0.19 (0.15) 1.14 1.69 Transition state
OT )2.28 ()2.12) 0.72 (0.71) 1.56 1.56 Rank-2 saddle
point
PW91-GGA/
USPP Ref. [19]
1/4 MLa
TF – 0 0.95 – –
LB – 0.06 0.94 – –
SB – 0.18 1.16 – –
OT – 0.75 1.52 – –
CI embedded
cluster Ref. [17]
<0.1 ML
TF )2.71 0 0.87 1.74 –
LB )2.76 )0.05 0.89 1.69 –
SB )2.73 )0.02 1.03 1.61 –
OT )2.33 0.38 1.36 1.36 –
Present work
1 ML
TF )2.91 ()2.76) 0 (0) 0.90 1.72 Minimum
LB )2.77 ()2.62) 0.14 (0.16) 0.92 1.69 Transition state
SB )2.65 ()2.48) 0.26 (0.28) 1.13 1.67 Transition state
OT )1.95 ()1.80) 0.96 (0.96) 1.53 1.53 Rank-2 saddle
point
Values for Ead using the RPBE GGA exchange–correlation functional are shown in parentheses.aAdsorption energy relative to the TF site.bAn experimental heat of adsorption (DHexp) of )1.05± 0.10 eV/H2 for hH ¼ 0:22–0:45 ML [44] and an experimental De of H2 (4.75
eV/H2) [36] are used to obtain this value. The zero point energy contributions to DHexp were removed by using the theoretical vi-
brational frequencies.cRef. [9]. LEED value for hH ¼ 1=2 ML. See Table 6 for our work on hH ¼ 1=2 ML.
90 D.E. Jiang, E.A. Carter / Surface Science 547 (2003) 85–98
in excellent agreement with our calculation of 1063
cm�1 for 1/4 ML coverage. Temperature pro-
grammed desorption of H2 from H/Fe(1 1 0) by
Kurz and Hudson [44] yields a heat of adsorption
(DH , negative values mean exothermic) of)1.05± 0.10 eV/H2 for hH ¼ 0:22–0:45 ML and atemperature range of 200–500 K. After accounting
for zero point energy corrections, we obtain a
(PW91) heat of adsorption of )1.39 eV/H2 for
hH ¼ 1=4 ML for H on the TF site, about 30%
larger than experiment. Eder et al. [19] also ob-
tained too high a DH ()1.38 eV/H2) with PW91 for
hH ¼ 1=4 ML. This overbinding of atoms andsmall molecules to transition metal surfaces is be-
lieved to be a deficiency of the PW91 functional
[22]. Looking back at Table 5, we see that the
RPBE functional reduces the adsorption energies
for hH ¼ 1=4 ML. RPBE gives the same site sta-bility trend as PW91, but it systemically lowers the
binding of H to the surface by �0.16 eV for H
atom adsorption. Converting the H atom adsorp-
tion energy to the heat of adsorption and including
H2 and Had zero point energy corrections, RPBE
GGA yields )1.06 eV/H2 for the heat of adsorp-tion of H2 onto two TF sites, in excellent agree-
ment with experiment.
3.3. hH ¼ 1=2 ML phases
As mentioned earlier, recent low temperature
(35 K) LEED studies by Nichtl-Pecher et al. [10]
and Hammer et al. [11] confirmed that H resides inthe TF site and gave evidence for a new (2 · 2)-2Hsuperstructure with a graphitic arrangement of
adatoms, which reversibly transforms to the well-
known (2 · 1) phase at a critical temperature ofabout 80 K. In both superstructures, hydrogen
induces a weak substrate reconstruction. The top

D.E. Jiang, E.A. Carter / Surface Science 547 (2003) 85–98 91
view of the two structures is shown Fig. 2. Here we
use the names for the two superstructures from
early experimental studies, but we note that the
(2 · 1) structure and the (2 · 2)-2H structure are
named using different primitive surface lattice
vectors of Fe(1 1 0), as shown by the arrows in Fig.2. The (2 · 1) structure can transform to the (2 · 2)-2H structure simply by moving to the left the H
atom (small solid circle in Fig. 2) at the center of
the (2 · 2) supercell (the rhombus in Fig. 2(a)) tothe nearest neighbor TF site.
We compare the energies of these two configu-
rations in Table 6. We find, as in experiments be-
low 80 K, that the (2 · 2)-2H phase is slightly morestable than the (2 · 1) phase, although the energydifference is very small (�0.015 eV/H); smaller
than the likely errors in the theory. This small
energy difference is reflected in the nearly identical
H-surface distances for both phases. Small differ-
ences are predicted for the H–Fe distances in each
phase: H is almost equidistant to the three closest
Fe atoms in the (2 · 2)-2H structure, while in the(2 · 1) structure H is closer to two of the Fe atoms
by 0.02 �AA (toward the LB site). Although the re-
laxation in the Fe substrate is small for both
systems, we find a lower energy is achieved for
(2 · 2)-2H structure by a slightly higher coordina-
tion of Fe atoms around H.
Fig. 2. hH ¼ 0:5 ML adsorption structures of H (solid circles)
on Fe(1 1 0) (open circles): (a) the (2· 1) phase and (b) the(2· 2)-2H phase. The hexagonal (graphitic) unit cell of the
(2· 2)-2H phase is shown in (b).
Table 6
PAW–GGA–DFT (PW91) H atom adsorption energies (Ead ¼ EH=Fe-sla
H to the nearest Fe atoms (dH–Fe) at hH ¼ 1=2 ML for the (2· 2)-2H
Structure Ead (eV/atom) dH–Fe1 (�AA) d
(2· 2)-2H )3.016 ()2.851) 1.774 1
(2· 1) )3.001 ()2.840) 1.770 1
Ead from the RPBE GGA exchange–correlation functional are shown
The LEED study of the (2 · 2)-2H phase indi-
cates that the substrate undergoes a weak recon-
struction and that H atoms move away
significantly from the normal TF site towards the
LB site. We compare the structural details of the
relaxed (2 · 2)-2H phase with experiment in Fig. 3and Table 7. The top and side views of the struc-
ture proposed by the low temperature LEED data
are shown in Fig. 3(a) and (b), respectively. The
two most striking features proposed by Hammer
et al. [11] are: (i) the movement (depicted by the
top arrows in Fig. 3(b)) of H atoms toward the LB
site by 0.18 �AA from the ideal TF site (for H in the
ideal TF site of the experimental model, Hy¼ 1.52�AA) and (ii) the buckling of the substrate layers.From the 0.18 �AA shift to the LB site, the authors
reasoned that only the strongly H-coordinated
Fe atoms (hatched in Fig. 3(a)) are induced to
rearrange. These Fe atoms are pushed toward the
bulk. They also suggested a weaker buckling
among weakly coordinated Fe atoms (unshaded in
Fig. 3(a)) might occur, but they did not check thatpossibility. Moreover, they proposed a buckling in
the second substrate layer.
By contrast with the experimental model of this
(2 · 2)-2H phase, we find that H only moves about
0.01 �AA towards the LB site in our relaxed structure(for H in the ideal TF site of our supercell,
Hy¼ 1.50 �AA). In addition, H is almost equidistant
to the three Fe atoms closely coordinated to it(Table 6), which means all the three Fe atoms
[unshaded atoms and diagonally hatched atoms in
Fig. 3(c)] are strongly coordinated to the hydro-
gen. We do find that these strongly coordinated Fe
atoms are pushed towards the bulk, compared
with those Fe atoms not directly coordinated to H
[horizontally hatched in Fig. 3(c)]. This agress with
Hammer et al.�s observation. However, no buck-ling among those strongly coordinated Fe atoms is
found in the present work.
b � EFe-slab � EH), H-surface distances (dH–S), the distances from
and (2· 1) configurations
H–Fe2 (�AA) dH–Fe3 (�AA) dH–S (�AA)
.773 1.779 0.938
.770 1.799 0.939
in parentheses.

2Hy(a)
d12
dH
d23
dB1
dB2
d12
dH
d23
dB1
dB2
(b) (c)
Fig. 3. Substrate reconstruction of the Fe(1 1 0)-(2· 2)-2H phase: (a) experimental model (top view, 2Hy is the distance between two Hatoms); (b) structural parameters (side view): H-surface height (dH), interlayer spacings (d12 and d23), and intralayer bucklings (dB1 anddB2). The top arrows indicate the direction of the movement of H off ideal threefold positions; (c) theoretical model from this work.
The distinctions between various types of surface Fe atoms are explained in the text. In the experimental model (a), dB1 is the difference
in height between hatched and unshaded Fe atoms, while in our theoretical model (c), dB1 is the difference in height between weakly
coordinated (horizontally shaded) and strongly coordinated (diagonally shaded and unshaded) Fe atoms.
Table 7
Comparison of the predicted [PAW–GGA (PW91)] structure of the structurally relaxed (2· 2)-2H phase with experiment
dH (�AA) dH–Fe (�AA) Hy (�AA) dB1 (�AA) D1;2 (%)a dB2 (�AA) D2;3 (%)
a
This work 0.93 1.77 1.51 0.016 0.15 0 0.89
Exp. [11] 1.11± 0.2 1.84± 0.35 1.70± 0.33 0.04± 0.025 0± 2 0.02± 0.015 1± 3
See Fig. 3 for definitions of distances reported here.aDi;iþ1 is defined as the same in Table 4.
92 D.E. Jiang, E.A. Carter / Surface Science 547 (2003) 85–98
Another significant difference between our re-laxed structure and the one proposed by Hammer
et al. for (2 · 2)-2H is the H-surface distance. In ouropinion, the experimental value of 1.11 �AA is too
large. The (2 · 2)-2H phase transforms reversibly to(2 · 1) phase around 80 K. We expect the height ofH adsorbed on the surface should not change much
between these two phases. Our calculations show
that the difference in height is actually very small(�0.001 �AA) between the (2 · 2)-2H and the (2 · 1)phases (Table 6). However, the H-surface height
from the experiment model of the (2 · 2)-2H phase
is �0.20 �AA larger than that of (2 · 1), which has aH-surface height of 0.90 ± 0.10 �AA [9].In principle, anharmonicity in vibrations can
change the average positions of atoms and may
account for the difference between our zero KelvinDFT predictions and measurements at finite tem-
perature. If the potential energy surface is very flat,
this indeed could be important. However, we find
quite high frequencies for the frustrated transla-
tions of H on Fe(1 1 0): 740 cm�1 for the normal
mode along [�11 1 0] and 954 cm�1 for the normal
mode along [0 0 1] for the (2 · 2)-2H phase, within
the constraint of a fixed Fe substrate. Since these
frequencies are high, the harmonic approximationapplies; we therefore expect the average position of
each H will be close to the equilibrium position at
low temperatures. The LEED experiment for the
(2 · 2)-2H phase to which we are comparing was
performed at 35 K. At this temperature, thermal
effects on the vibrational energies are expected to
be very small. We therefore are justified in com-
paring our DFT results directly with the low-temperature LEED measurements.
Although the structural parameters (Fig. 3(b)
and Table 7) from our calculations are all within
the experimental error bars (except for dB2), we
suggest that our relaxed structure of the (2 · 2)-2Hconfiguration is distinct from what Hammer et al.
proposed. Future experiments may resolve this
discrepancy.
3.4. Coverage dependent properties: adsorption
energy, work function change, and charge distribu-
tion
Table 8 displays how several physical properties
of H in the TF site change with coverage. The
coverage dependence of the adsorption energy is

Table 8
The adsorption energy (Ead), work function change relative to pure Fe(1 1 0) (DU), electron transfer to H (Dn), and surface dipole (l)for different coverages of H in the TF site
hH Structure Ead (eV/H) DU (eV) Dn (e�) l (D)
1 (1· 1) )2.91 0.023 0.09 0
0.5 (2· 1) )3.00 0.027 0.11 0.022
0.5 (2· 2)-2H )3.02 0.077 0.11 0.038
0.25 (2· 2) )3.00 0.022 0.12 0.029
D.E. Jiang, E.A. Carter / Surface Science 547 (2003) 85–98 93
indicative of the nature of the interaction betweenadsorbed H atoms. Examining the adsorption en-
ergies for the (1 · 1), (2 · 1), and (2 · 2) structures,we see that the adsorption energy increases slightly
as the coverage is reduced. We interpret this to
mean a small repulsion exists between H atoms
in the (1 · 1) structure, �0.045 eV per pair of H
atoms, with negligible repulsion for hH ¼ 1=2 and1/4 ML.We obtain a work function of 4.73 eV for the
pure Fe(1 1 0) slab, in agreement with the experi-
mental value of 4.5–4.70 eV for polycrystalline Fe
[46,47]. Single crystal work function measurements
for Fe(1 1 0) are not available for comparison.
After adsorption of H, we find the work function
increases by �0.025 eV for the (1 · 1), (2 · 1), and(2 · 2) structures. The (2 · 2)-2H structure shows asignificantly larger increase of �0.077 eV. The onlyexperimental measurements (in 1977 by Bozso
et al. [5]) suggest instead that the work function
decreases upon H2 adsorption by �0.020–0.085 eVin the coverage range 0.25–1 ML. No other ex-
periments have confirmed this decrease. We also
examined the work function change for the other
adsorption sites (LB, SB, and OT) of H onFe(1 1 0). They all show a positive change, though
the magnitude of the change varies from site to
site. Given the discrepancy between theory and
experiment regarding even the sign of the work
function change, we suggest further measurements
are warranted. It is true that work function values
calculated by periodic DFT may depend strongly
on the vacuum thickness, k-point sampling, andslab thickness [35]; however it is likely that cov-
erage trends utilizing a constant set of parameters
are reliable.
The change in work function after H adsorption
is due to charge rearrangement, which in turn in-
duces a surface dipole moment that affects thework function. We have calculated the charge
density differences
Dq ¼ qH=Fe-slab � qFe-slab � qH;
where qH=Fe-slab, qFe-slab, and qH are the charge
densities for the H/Fe(1 1 0) slab, the cleanFe(1 1 0) slab, and an isolated H layer (in the same
positions as the adsorbed H�s), respectively. Wefind a charge transfer of only 0.09–0.12 electrons
from Fe to H, by integrating Dq around the H
atom with a radius of 0.90 �AA, suggesting rathercovalent metal-H bonding. (Changing this rather
arbitrary radius by ±0.20 �AA causes only �0.02 echanges in the extent of charge transfer.) Theamount of the charge transfer is basically the same
for hH ¼ 0:25 and 0.50 ML.By integrating Dq over planes of constant
height over the surface along the surface normal
(defined as the z-axis here), we obtain the change incharge density upon adsorption as a function of z,the distance into the vacuum from the Fe surface
layer:
DqðzÞ ¼Z
Dqðx; y; zÞdxdy:
For hH ¼ 0:25 and 0.50 ML, the DqðzÞ vs z plotsare almost identical, so Fig. 4 only displays results
for the (1 · 1) and (2 · 2)-2H phases. A small
amount of charge depletion from surface Fe atoms
and accumulation on H adatoms evident. We seethat the charge depletion is slightly less at the
surface plane (z ¼ 0) for hH ¼ 0:50 ML. The
charge depletion on the vacuum side of the H atom
is due to a slight shift in the center of mass of the
charge density on the H adatom towards the sur-
face, again consistent with primarily covalent
bonding.

-5 -4 -3 -2 -1 0 1 2 3 4 5-0.10
-0.05
0.00
0.05
0.10
0.15
0.20HFe (1×1)
(2×2)-2H
∆ρ(z
) (e/
Å)
Z (Å)
Fig. 4. Valence charge density difference integrated for planes
parallel to the surface, as a function of the distance from the
topmost substrate layer (z ¼ 0) for H in the TF site of Fe(1 1 0).
94 D.E. Jiang, E.A. Carter / Surface Science 547 (2003) 85–98
The change in work function is determined by
the induced surface dipole moment l, which is
defined as
l ¼Z
DqðzÞzdz:
Here we find that the contributions to the surface
dipole from charge transfer to H and from deple-
tion in the vacuum region cancel each other, re-sulting in a very small work function change. This
cancellation is almost perfect for hH ¼ 1 ML, while
not so complete for the (2 · 2)-2H structure
(hH ¼ 0:50 ML). The calculated trend for the
surface dipole agrees with that of the work func-
tion change for hH ¼ 0:5 and 0.25 ML. It is likelythat as hH increases, the Fe-H bonding becomes
even more covalent, in order to minimize dipole-dipole repulsions. This may account for the com-
plete lack of a surface dipole for hH ¼ 1 ML. The
shorter H-surface bond length (Table 5) for hH ¼ 1
ML than for hH ¼ 1=4 ML also supports this
point.
4. Discussion
Recent and more accurate experimental struc-
ture determinations [10,11] clearly show that H
prefers the TF site on the Fe(1 1 0) surface. Ourcalculations confirm this assignment. However, it
would be useful to determine why hydrogen, or
any atomic adsorbate for that matter, prefers high
coordination sites on metal surfaces, while many
molecular adsorbates do not [1]. The higher co-
ordination number and the interaction of metal
orbitals with the H 1s orbital have both been in-
voked to explain the preference of hollow sites onthe low-index surfaces of metals [26,48]. The site
preference in bulk Fe also offers a correlation.
Theoretical studies by us [49] and others [50–52]
and experiment [53] all show that H prefers the
tetrahedral site in bulk Fe. When the crystal is cut
to form the (1 1 0) surface, the tetrahedral site in
the bulk becomes the TF site on the surface. In
order to investigate the preference of the TF sitefurther, we compare here the orbital-resolved local
density of states and charge density differences for
the OT site and the TF site. We will argue that the
ease of bonding to interstitial electrons [54–56]
leads to the stability of the TF site.
Fig. 5 shows the orbital-resolved local density
of states (LDOS) for an adsorbed H atom and a
surface Fe atom for the TF site and the OT site athH ¼ 1 ML. We see that the H 1s band of the TF
site is peaked mostly between )5.0 and )6.0 eVbelow EF, while the corresponding band for theOT site is much broader and is centered around
)3.0 eV below EF. When H is placed on the TF
site, the H 1s band has a strong interaction with Fe
sp band, as seen by the significant (multi-eV) shift
of the Fe 4s and 4px LDOS for the TF site com-pared to the bare Fe surface. The OT site shows no
such shifts in the 4s and 4p states. The H 1s band
of the TF site also has some interactions with the
Fe 3d bands that have x components, i.e., 3dxy ,3dx2�y2 and 3dxz. By contrast, the only stabilizing
shift observed when H adsorbs in the OT site is
that of the Fe 3dz2 band, suggesting the OT site
forms a r-bond to the H via the dz2 orbital on Fe.Given the largest shift for H in the TF site involves
the 4sp electrons on Fe, we conclude that the TF
site surface Fe atoms mainly utilize 4sp electrons
to bond to H, with smaller contributions from the
3d electrons. This is consistent with simple bond-
ing picture where hollow site adsorption mainly
utilizes more delocalized interstitial electrons of sp
character [54–57], while on top adsorption, be-cause of its more localized nature, involves the
localized d-orbitals. For r-bonds, such as to H,

Fig. 5. Site-projected and orbital-resolved local density of states (LDOS) for adsorbed H and surface Fe atoms of H/Fe(1 1 0) for
hH ¼ 1 ML: (a, b) H on the three-fold site; (c, d) H on the on-top site. LDOS for pure Fe(1 1 0) surface atoms are shown in dotted
curves. The direction of surface normal is the z-axis, and an Fe(1 1 0) surface primitive cell, the associated x-axis and y-axis, and theposition of the TF site are as shown. Note scales are consistent within each panel, but differ between panels.
D.E. Jiang, E.A. Carter / Surface Science 547 (2003) 85–98 95
this dictates use of a dz2 orbital on Fe in the OTsite.
Fig. 6 shows two charge density slices of pureFe(1 1 0). The OT site has a much larger density

Fig. 6. Valence charge density of pure Fe(1 1 0): (a) side view from [0 0 1]; (b) top view at the surface Fe layer. Charge-density iso-
planes drawn in the range of 0.01 (white) to 8.5 (black) e/�AA3 on a logarithmatic scale. Fe nuclei are at the centers of the darkest regions.
Fig. 7. Three-fold sites on Fe(1 1 0) considered for surface dif-
fusion of H.
96 D.E. Jiang, E.A. Carter / Surface Science 547 (2003) 85–98
gradient compared to the TF site. Now suppose we
adsorb an H atom onto the Fe surface. Given ourdiscussions earlier that suggest a primarily covalent
Fe–H bond, we imagine H will prefer a site able to
provide approximately one electron that can pair
up with the H electron to form this covalent bond.
We investigated the TF and OT sites from this
point of view, by evaluating approximately the
‘‘number of electrons’’ associated with each site.
This is accomplished by centering a sphere at themidpoint between the H and the surface Fe layer,
where the sphere was given a radius of half the H–
Fe bond length. Then we calculate how many
electrons are contained in this sphere for the pure
Fe surface. We obtain 0.63 e for the TF site and
1.87 e for the OT site, where the latter suggests the
Fe 3dz2 orbital is nearly doubly occupied and
therefore less able to effectively participate in co-valent bonding. We conclude that H prefers the TF
site because there is�1 electron associated with theTF site already set up to form a covalent bond to
the unpaired H 1s electron. This idea that adsor-
bates bond to the interstitial electrons was pro-
posed earlier by Goddard and coworkers for
adsorption on surfaces of fcc metals [58].
The present study provides a basic picture of Hadsorption on the Fe(1 1 0) surface, which further
allows us to speculate about thermally activated
paths for H diffusion on the Fe(1 1 0) surface and
into bulk Fe. Recall from Section 3.2 that the SB
and LB sites are transition states for surface dif-
fusion, while the OT site is not. We therefore focus
on diffusion via the bridge sites only. Using
hH ¼ 1=4 ML adsorption energy data for our dis-cussion, we estimate barriers for H diffusion from
TF 1 to TF 2 and TF 3 (Fig. 7) to be 0.05 eV via
the LB site to TF 2 and 0.19 eV via the SB site to
TF 3. The extremely small barrier via the LB site
provides an easily accessible way for H to oscillate
between two nearest-neighbor TF sites. For long-
er-range diffusion, one likely path would be via the
SB site with a barrier of 0.19 eV, following a zig–zag pattern across the surface as it hops from TF
site to TF site via SB sites. H will avoid the OT
site, which, as already noted, is a much-higher
energy rank-2 saddle point.
Quantum diffusion is also possible for H on
Fe(1 1 0). Gomer and coworkers [59,60] stud-
ied atomic H diffusion on W(1 1 0) using a field-
emission-fluctuation method and observed cleartransitions from thermally activated diffusion to a
quantum diffusion regime. They also proposed the
SB site as the transition state and a zig–zag diffu-
sion mechanism. Using scanning tunneling mi-
croscopy (STM), Lauhon and Ho [61] recently
reported the first STM images of isolated hydro-
D.E. Jiang, E.A. Carter / Surface Science 547 (2003) 85–98 97
gen atoms on a metal surface and a similar clas-
sical to quantum diffusion transition for H/
Cu(1 1 0). Classical diffusion barriers were deduced
from the measured thermal diffusion coefficients
in those studies. Analogous experiments for H/
Fe(1 1 0) have not yet been done, but could de-termine the transition temperature from the ther-
mally activated diffusion to the quantum diffusion
regime and could be used to verify our predictions
of the H diffusion barriers.
Fe is one of those metals in which H diffuses
very quickly [62], though its solubility in Fe is very
low. We find that H diffuses in bulk bcc Fe be-
tween tetrahedral sites along the [1 1 0] directionwith a tiny diffusion barrier of only 0.042 eV [49].
A channel of tetrahedral sites along the surface
normal exists just under the TF site. Consequently,
we believe that the first step for H diffusion into
bulk Fe from the (1 1 0) surface will involve H
moving from the TF site directly down to the
nearest tetrahedral site just beneath the surface Fe
layer. Calculations are underway to test this idea.
5. Conclusions
Employing first principles PAW–DFT–GGA
techniques, we have studied atomic H adsorption
on Fe(1 1 0). In agreement with experiment, we
find that the quasi three-fold (TF) site is the onlystable minimum for coverages between 1/4 and 1
ML. By contrast, the long bridge site, short bridge
site, and on-top site are all found to be saddle
points rather than true minima, in contrast to
suggestions by earlier theoretical work. Previous
studies did not evaluate the frequency spectrum
(Hessian matrix) to determine the nature of the
critical points. Our work illustrates the importanceof doing so. The long and short bridge sites are
true transition states for H diffusion on Fe(1 1 0)
(with both barriers < 0.2 eV), while the on-top site
is a high energy rank-2 saddle point. For long-
range diffusion, we propose a zig–zag path over
short-bridge sites as the likely means to diffuse
from TF site to TF site across the surface. In terms
of quantitative results, we find that the RPBEGGA exchange–correlation functional can correct
the 30% (!) overbinding by PW91 of adsorbed H
on Fe(1 1 0), yielding a heat of adsorption of 1.06
eV/H2, in excellent agreement with experiment.
We also confirmed the experimental finding that
the (2 · 2)-2H configuration is (slightly) more sta-
ble than the (2 · 1) configuration and that a
small substrate reconstruction occurs. However,two discrepancies emerge between our predictions
and experiment [11] concerning the structure of the
(2 · 2)-2H phase. We find the H-surface height to
be 0.93 �AA, while the measured value is 1.11 ± 0.20�AA; our work shows that H basically stays at the
ideal threefold site, while the experimental analysis
indicates that H moves toward the long bridge site
by �0.20 �AA.We find that the work function increases slightly
after H adsorbs on Fe(1 1 0) surface, in direct
contradiction to rather old experiments that sug-
gested a slight decrease in work function after H
adsorption. The bonding between H and the Fe
surface is found by several means to be quite co-
valent, involving primarily the Fe 4sp electrons
that localize in the TF sites. Very small lateralrepulsions are found at high coverage. Overall,
structures and relative stabilities agree with ex-
periment, suggesting that follow-up studies of bulk
penetration and diffusion, where less experimental
data are available, can be pursued with some de-
gree of confidence with this level of theory.
Acknowledgements
We thank the Army Research Office and the
Department of Defense Multidisciplinary Univer-sity Research Initiative (DOD-MURI) for funding
this research. We thank the Maui High Perfor-
mance Computing Center and the NAVO Major
Shared Resources Center for providing CPU time.
References
[1] G.A. Somorjai, Introduction to Surface Chemistry and
Catalysis, John Wiley & Sons, New York, 1994.
[2] R.B. Anderson, The Fischer–Tropsch Synthesis, Academic
Press, Orlando, Fla, 1984.
[3] W. Zhong, Y. Cai, D. Tomanek, Nature (London, United
Kingdom) 362 (1993) 435.
[4] J.-S. Wang, Eng. Fract. Mech. 68 (2001) 647.

98 D.E. Jiang, E.A. Carter / Surface Science 547 (2003) 85–98
[5] F. Bozso, G. Ertl, M. Grunze, M. Weiss, Appl. Surf. Sci. 1
(1977) 103.
[6] M.Weiss, G. Ertl, F. Nitschke, Appl. Surf. Sci. 2 (1979) 614.
[7] K. Yoshida, Jpn. J. Appl. Phys. 19 (1980) 1873.
[8] R. Imbihl, R.J. Behm, K. Christmann, G. Ertl, T.
Matsushima, Surf. Sci. 117 (1982) 257.
[9] W. Moritz, R. Imbihl, R.J. Behm, G. Ertl, T. Matsushima,
J. Chem. Phys. 83 (1985) 1959.
[10] W. Nichtl-Pecher, J. Gossmann, L. Hammer, K. Heinz, K.
M€uuller, J. Vac. Sci. Tech. A 10 (1992) 501.
[11] L. Hammer, H. Landskron, W. Nichtl-Pecher, A. Fricke,
K. Heinz, K. M€uuller, Phys. Rev. B 47 (1993) 15969.
[12] K. Binder, W. Kinzel, D.P. Landau, Surf. Sci. 117 (1982)
232.
[13] W. Kinzel, W. Selke, K. Binder, Surf. Sci. 121 (1982) 13.
[14] J.P. Muscat, Surf. Sci. 118 (1982) 321.
[15] R.W. Pasco, P.J. Ficalora, Surf. Sci. 134 (1983) 476.
[16] T.J. Raeker, A.E. DePristo, Surf. Sci. 235 (1990) 84.
[17] P. Cremaschi, H. Yang, J.L. Whitten, Surf. Sci. 330 (1995)
255.
[18] A. Juan, R. Hoffmann, Surf. Sci. 421 (1999) 1.
[19] M. Eder, K. Terakura, J. Hafner, Phys. Rev. B. 6411
(2001) 115426.
[20] J.P. Perdew, J.A. Chevary, S.H. Vosko, K.A. Jackson,
M.R. Pederson, D.J. Singh, C. Fiolhais, Phys. Rev. B 46
(1992) 6671.
[21] G. Kresse, D. Joubert, Phys. Rev. B 59 (1999) 1758.
[22] B. Hammer, L.B. Hansen, J.K. Nørskov, Phys. Rev. B 59
(1999) 7413.
[23] P. Hohenberg, W. Kohn, Phys. Rev. 136 (1964) B864.
[24] W. Kohn, L.J. Sham, Phys. Rev. 140 (1965) A1133.
[25] G. Kresse, J. Hafner, Phys. Rev. B 48 (1993) 13115.
[26] A. Eichler, J. Hafner, G. Kresse, J. Phys.: Condens. Matter
8 (1996) 7659.
[27] P.E. Bl€oochl, Phys. Rev. B 50 (1994) 17953.
[28] D.J. Singh, W.E. Pickett, H. Krakauer, Phys. Rev. B 43
(1991) 11628.
[29] J.P. Perdew, K. Burke, M. Ernzerhof, Phys. Rev. Lett. 77
(1996) 3865.
[30] S.H. Vosko, L. Wilk, M. Nusair, Can. J. Phys. 58 (1980)
1200.
[31] H.J. Monkhorst, J.D. Pack, Phys. Rev. B 13 (1976) 5188.
[32] A. Stibor, G. Kresse, A. Eichler, J. Hafner, Surf. Sci. 507–
510 (2002) 99.
[33] M. Acet, H. Zaehres, E.F. Wassermann, W. Pepperhoff,
Phys. Rev. B. 49 (1994) 6012.
[34] C. Kittel, Introduction to Solid State Physics, 7th ed., John
Wiley & Sons, New York, 1996.
[35] G. Kresse, J. Hafner, Surf. Sci. 459 (2000) 287.
[36] K.P. Huber, G. Herzberg, Molecular Spectra and Molec-
ular Structure 4: Constants of Diatomic Molecules, Van
Norstrand Reinhold Co., New York, 1979.
[37] M. Methfessel, A.T. Paxton, Phys. Rev. B 40 (1989) 3616.
[38] G. Kresse, J. Furthm€uuller, VASP the Guide. Available
from <http://cms.mip.univie.ac.at/VASP/>.
[39] M.J.S. Spencer, A. Hung, I.K. Snook, I. Yarovsky, Surf.
Sci. 513 (2002) 389.
[40] H.D. Shih, F. Jona, U. Bardi, P.M. Marcus, J. Phys. C:
Solid State Phys. 13 (1980) 3801.
[41] C. Xu, D.J. O�Connor, Nucl. Instr. Meth. Phys. Res., Sec.B: Beam Inter. Mater. Atom. B 53 (1991) 315.
[42] A. Arya, E.A. Carter, J. Chem. Phys. 118 (2003) 8982.
[43] W.R. Tyson, W.A. Miller, Surf. Sci. 62 (1977) 267.
[44] E.A. Kurz, J.B. Hudson, Surf. Sci. 195 (1988) 15.
[45] A.M. Baro, W. Erley, Surf. Sci. 112 (1981) L759.
[46] D.E. Eastman, Phys. Rev. B. 2 (1970) 1.
[47] A. Cardell, Phys. Rev. 92 (1953) 554.
[48] M.H. Cohen, M.V. Ganduglia-Pirovano, J. Kudrnovsky,
Phys. Rev. Lett. 72 (1994) 3222.
[49] D.E. Jiang, E.A. Carter, to be submitted.
[50] R. Griessen, Phys. Rev. B 38 (1988) 3690.
[51] C. Minot, C. Demangeat, J. Chem. Phys. 86 (1987) 2161.
[52] P. Nordlander, J.K. Nørskov, F. Besenbacher, J. Phys. F:
Met. Phys. 16 (1986) 1161.
[53] A. Seeger, Phys. Lett. A 58A (1976) 137.
[54] M.H. McAdon, W.A. Goddard III, Phys. Rev. Lett. 55
(1985) 2563.
[55] M.H. McAdon, W.A. Goddard III, J. Phys. Chem. 91
(1987) 2607.
[56] M. Li, W.A. Goddard III, Phys. Rev. B 40 (1989) 12155.
[57] M. Li, W.A. Goddard III, J. Chem. Phys. 98 (1993) 7995.
[58] J. Kua, W.A. Goddard III, J. Phys. Chem. B 102 (1998)
9481.
[59] R. DiFoggio, R. Gomer, Phys. Rev. B 25 (1982) 3490.
[60] S.C. Wang, R. Gomer, J. Chem. Phys. 83 (1985) 4193.
[61] L.J. Lauhon, W. Ho, Phys. Rev. Lett. 85 (2000) 4566.
[62] Y. Hayashi, W.M. Shu, Diff. Defect Data–Solid State
Data, Pt. B: Solid State Phenomena 73–75 (2000) 65.