Embed Size (px)
Citation preview

ADOPTION OF SMALL RUMINANTS’ FATTENING PACKAGE IN AGROPASTORAL AREAS, MEISO WEREDA, EASTERN OROMIA
M.Sc.THESIS
ZELALEM TAMRAT
April 2007
Haramaya

ADOPTION OF SMALL RUMINANTS’ FATTENING PACKAGE IN AGROPASTORAL AREAS, MEISO WEREDA, EASTERN OROMIA
A Thesis Submitted to the Department of
Rural Development and Agricultural Extension
School of Graduate Studies
HARAMAYA UNIVERSITY
In Partial Fulfillment of the Requirements for the Degree of
MASTER OF SCIENCE IN AGRICULTURE
(RURAL DEVELOPMENT AND AGRICULTURAL EXTENSION)
By
ZELALEM TAMRAT
APRIL 2007 Haramaya University

ii
SCHOOL GRADUATE STUDIES
HARAMAYA UNIVERSITY As Thesis Research advisor, I here by certify that I have read and evaluated this thesis prepared, under my guidance, by zelalem Tamrat, entitled: Adoption of Small Ruminants’ Fattening Package in Agropastoral Areas, Meiso Wereda, Eastern Oromia. I (We) Recommend That It Be Submitted As Fulfilling The Thesis Requirement.
Dr. Ranjan S. Karippai _________________ _______________ Major Advisor Signature Date
Dr. Ranjitha Puskur _________________ _______________ Co-advisor Signature Date
As member of the Board of Examiners of the M.Sc Thesis Open Defense Examination, We
certify that we have read, evaluated the Thesis prepared by zelalem Tamrat and examined the
candidate. We recommended that the Thesis be accepted as fulfilling the Thesis requirement
for the Degree of Master of Science in Agriculture (Rural Development and Agricultural
Extension).
______________________ _________________ _______________ Chairperson Signature Date
______________________ _________________ _______________ Internal Examiner Signature Date
______________________ _________________ _______________ External Examiner Signature Date

iii
DEDICATION
I dedicate this thesis to my mother, BIRKE SHIFERAW, who has paid a lot of sacrifications
to get me in the right track, with all her affection, love and dedication to bring me up to this
point of success in my life.
STATEMENT OF AUTHOR
First, I declare that this thesis is my work and that all sources of materials used for this thesis
have been duly acknowledged. This thesis has been submitted in partial fulfillments for
requirements for an M.Sc. degree at the Haramaya University and is deposited at University
Library to be made available to borrowers under rules of the Library. I solemnly declare that
this thesis is not submitted to any other institution for the award of any academic degree,
diploma, or certificate.
Brief quotations from this thesis are allowable without special permission, provided that
accurate acknowledgement of the source is made. Requests for permission for extended
quotation from or reproduction of this manuscript in whole or in part may be granted by the
head of the major department or the Dean of the School of Graduate Studies when in his or
her judgment the proposed use of the material is in the interests of scholarship. In all other
instance, however, permission must be obtained from the author.
Name: Zelalem Tamrat
Signature:__________________
Place: Haramaya University, Haramaya
Date of Submission: June 20, 2007

v
BIOGRAPHY
The author was born in Haramaya Wereda, Eastern Hararghe Zone of Oromia Region at a
place called Bati, in September 1979. He attended his elementary and junior school
education at Bati elementary and junior secondary school, and Haramaya University Model
Elementary School, respectively. Then, he joined Harar senior secondary high school and
completed his secondary education in 1999. In 2000 the author joined the then Alemaya
University and graduated with B.Sc. degree in Agricultural Extension in July 2003.
After his graduation, he was employed in Kombolcha (Eastern Oromia) ATVET College
under the Ministry of Agriculture and Rural Development; as an instructor. Then, he joined
the School of Graduate Studies of the Haramaya University in November 2006.

vi
ACKNOWLEDGEMENTS
First of all, I would like to thank God for his miraculous time to let me accomplish anything I
start and also for His help to go through every event successfully up to this minute.
I convey my deepest thanks to my major advisor Dr. Ranjan S. Karippai for giving me
constructive pieces of advice and guidance starting from the proposal writing to the
completion of the research work. I thank him for his genuine and energetic encouragement,
suggestion; insight, guidance and professional expertise to complete this work.
I am also thankful to my co-advisor Dr. Ranjitha Puskur for her constructive, sharp and
insightful comments, suggestion and guidance at time when the proposal for this study was
developed and for reviewing questionnaire and giving important comments and suggestion
during thesis writing, besides giving me a chance to be her fellow student.
I would like to express my sincere appreciation to ILRI for supporting me as its fellow
graduate student and in sponsoring the research.
I would like to acknowledge Ato Dadi Gelashe, for his helpful comments and cooperation in
every aspect of his professional responsibilities and I too owe him a lot for his sharing with
me my personal problems. Furthermore, my particular thanks go to Ato Adigo whom I feel
easy at work in Meiso because of his cooperation and positive feelings towards me. I would
also like to thank all Meiso WBPRD staffs for their help and cooperative spirit in the
research processes. My special thanks go Ato Derese, Ato Tesfaye, Ato Tesfaye, Ato
Teshome, Ato Mohammed, Ato Mesfin, Ato Dereje and W/t Ayenalem who helped me
during data collection at fieldwork. In addition, I wish to extend my special thanks to the
agropastoralists of Meiso Wereda who provided the necessary information on their small
ruminant production activities.
I am highly indebted to my uncle, Semunigus Mekena, who encouraged me to start a new

vii
life endeavour and supported me in all his capacities without reservations to complete the
research and academic works.
I would like to extend all thanks and appreciation to my beloved friend Hiwot Kefelegn for her love, understanding and sharing with me all life trouble and burden I was going through during my study.
I owe Zelalem Solomon greatly and hence I extend my heartful thanks and deepest respect to my best and life time friend for his genuine brotherly love and support he was giving to me.
I wish to thanks my relatives and village friends particularly Asamentch Bekele, Kuri
Shiferaw, Tseige Degaga, Sisay W/Mariam, Weyenishet Assefa, Mahider Tamrat, Tamrat
G/Yohannes, Abeba Kabte and all others who are the source of special strength towards the
successful completion of this study.
Especial thanks goes to my all RDAE 2006/7 batches for their understanding me, friendship,
love, and cooperation with me and for their being part of my best learning time at Haramaya.

viii
LIST OF ABBREVIATION
ADLI Agricultural Development Led Industrialization
AI Artificial Insemination
As Adopters
CADU Chilalo Agricultural Development Unit
CC Contingency Coefficient
CCPP Contagieuses Caprine Psuedo-Pnuemonia
CPP Complete Package Programme
CSA Central Statistical Authority
DAs Development Agents
E East
E.C. Ethiopian Calendar
EPID Extension Package Input Development
FAO Food and Agricultural Organization
FEEDADOPMAX maximum score for feed practices for all sample
GDP Gross Domestic Product
ha Hectares
HHs Households
HHHs Household Heads
HIV/AIDS Human Immuno Virus/ Anti Immuno Deficiency Sydrome
ILRI International Livestock Research Institute
IPMS Improving productivity and marketing successes
kg Kilogram
Km kilometer
LIMDEP Limeted dependent varaible analiytical soft ware
lts liters
m.a.s.l Meters above sea level
MEDaC Ministry of Economic Development and Cooperation
MGTPADOMAX maximum score for feed practices for all sample
mgtpadoscore the management practice adoption of ith farmer
ix
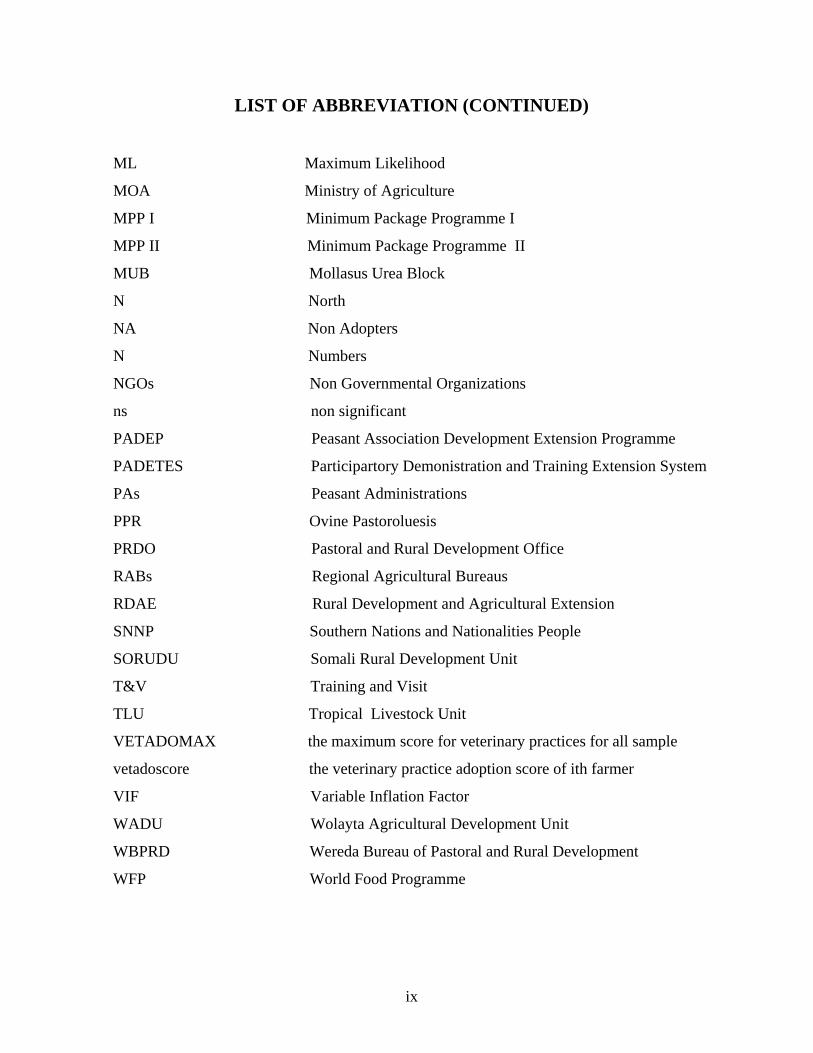
LIST OF ABBREVIATION (CONTINUED)
ML Maximum Likelihood
MOA Ministry of Agriculture
MPP I Minimum Package Programme I
MPP II Minimum Package Programme II
MUB Mollasus Urea Block
N North
NA Non Adopters
N Numbers
NGOs Non Governmental Organizations
ns non significant
PADEP Peasant Association Development Extension Programme
PADETES Participartory Demonistration and Training Extension System
PAs Peasant Administrations
PPR Ovine Pastoroluesis
PRDO Pastoral and Rural Development Office
RABs Regional Agricultural Bureaus
RDAE Rural Development and Agricultural Extension
SNNP Southern Nations and Nationalities People
SORUDU Somali Rural Development Unit
T&V Training and Visit
TLU Tropical Livestock Unit
VETADOMAX the maximum score for veterinary practices for all sample
vetadoscore the veterinary practice adoption score of ith farmer
VIF Variable Inflation Factor
WADU Wolayta Agricultural Development Unit
WBPRD Wereda Bureau of Pastoral and Rural Development
WFP World Food Programme

x
TABLE OF CONTENTS
DEDICATION iii
STATEMENT OF AUTHOR iv
BIOGRAPHY v
ACKNOWLEDGEMENTS vi
LIST OF ABBREVIATION viii
TABLE OF CONTENTS x
LIST OF TABLES xiii
LIST OF FIGURES xv
ABSTRACT i
1. INTRODUCTION 1
1.1. Background 1
1.2. Statement of the problem 3
1.4. Research questions 4
1.3. Objective of the study 5
1.5. Significance of the study 5
1.6. Scope and limitation of the study 6
2. LITERATURE REVIEW 7
2.1. Adoption of Agricultural Innovations and Technologies 7
2.2. Patterns of Adoption and Adoption Behavior 8
2.3. Attitude and Behavior 9
2.4. Empirical Studies on Adoption of Goat and Sheep Husbandry Practices 10
2.5. Livestock extension in Ethiopia 13
2.6. Importance and Role of Goat and Sheep in Pastoral and Agropastoral
Livelihoods 15
TABLE OF CONTENTS (CONTINUED)

xi
2.7. Pastoral and agropastoral indigenous husbandry practice and its limitations17
2.8. Empirical Studies on factors affecting Adoption and Intensity of Adoption 19
2.9. Conceptual Framework 24
3. RESEARCH METHODOLOGY 26
3.1. Description of the Study Area 26
3.2. Sampling design techniques and procedures 28
3.3. Data requirements, sources and methods of data collection 29
3.4. Methods of Data Analysis and Econometric Model Used 30 3.4.1 Descriptive Statistics
30 3.4.2. Perception and Attitude Analysis Method
30
3.4.3. Tobit model 31 3.4.3.1. Data requirements and justification 31 3.4.3.2. Econometric Analysis 32
3.4.4. Definitions of Variables 38
4. RESULTS AND DISCUSSION 47
4.1. Pastoralists and agropastoralists Assessments on Small Ruminants’ 47
Fattening Package Extension Services 47
4.1.1. Agricultural Extension Services 47 4.1.2. Information Sources of Sample Respondents 48 4.1.3. Extension Messages 49 4.1.4. Communication problems and comments of sample respondents 50 4.1.5. Comment on current extension system in the wereda 52 4.1.6. Extension Methods 53 4.1.7. Response on the Kinds of Training Received 56 4.1.8. Perception of Agropastoralists on Small Ruminant 57 Fattening Package and Extension Services 57 4.1.9. Attitude of Agropastoralists towards Fattening Package 59 4.1.10. Sample Respondents Knowledge of fattening package contents 60 4.1.11. Informal information source use and communication 61
4. 2. Determinants of Intensity of Small Ruminant Fattening Package Adoption66 4.2.1. Demographic Characteristics 66 4.2.2. Socioeconomic Factors 70
4.2.3. Small ruminant rearing experience, current production patterns and management practices, 75 4.2.4. Institutional Characteristics 85

xii
TABLE OF CONTENTS (CONTINUED)
4.2.5. Security for Scarce Natural Resources (Grazing Land and Water Points) 98 4.2.6. Social participation 100
4.3. Intensity of adoption of Fattening Package and Its Determinants in the Study Area 102
4.3.1. Results of the Econometric Model 102 4.3.2. Explanation of the Significant Variables Influencing Intensity of 103 adoption of the fattening package 103
4.3.2.1. Determinants of Intensity of small ruminant fattening package 104 4.3.2.2. Effects of Changes in the Significant Explanatory Variables on 107 Extent Adoption of fattening package 107
5. SUMMARY, CONCLUSION AND RECOMMENDATION 109
5.1. Summary and Conclusion of Major Findings 109
5.2. Recommendations 117
6. REFERENCE 121
7. APPENDICES 131
Appendix Table.1. Sample HHHs by sex category 131
Appendix Table.2. Categorization of samples respondents into four adopter groups 131
Appendix Table.3. Conversion factors used to calculate Tropical Livestock Units (TLU) 131
Appendix Table 4. Selection criteria used and PAs that fulfill the criteria 131
Appendix Table 5. Variance inflation factor for continuous variables 132
Appendix Table 6. Contingency Coefficients for Dummy Variables 132
Appendix: Interview schedule 133
xiii
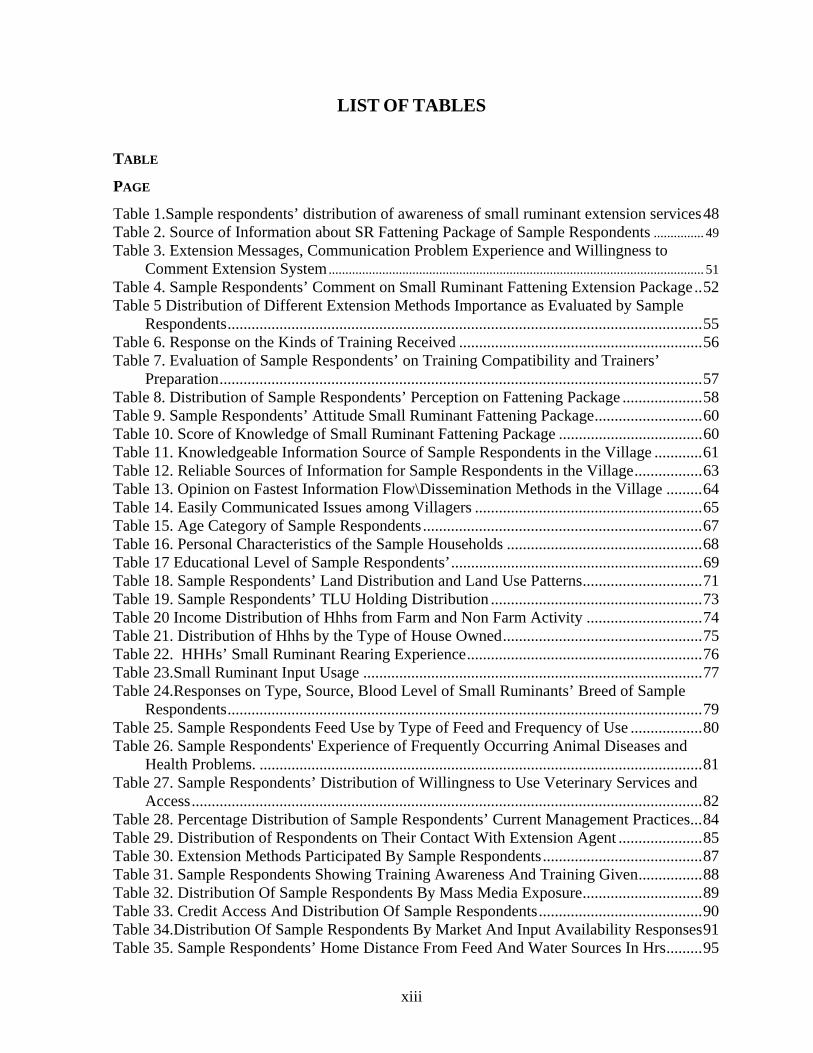
LIST OF TABLES
TABLE
PAGE
Table 1.Sample respondents’ distribution of awareness of small ruminant extension services48 Table 2. Source of Information about SR Fattening Package of Sample Respondents ............... 49 Table 3. Extension Messages, Communication Problem Experience and Willingness to
Comment Extension System................................................................................................................ 51 Table 4. Sample Respondents’ Comment on Small Ruminant Fattening Extension Package..52 Table 5 Distribution of Different Extension Methods Importance as Evaluated by Sample
Respondents.......................................................................................................................55 Table 6. Response on the Kinds of Training Received .............................................................56 Table 7. Evaluation of Sample Respondents’ on Training Compatibility and Trainers’
Preparation.........................................................................................................................57 Table 8. Distribution of Sample Respondents’ Perception on Fattening Package ....................58 Table 9. Sample Respondents’ Attitude Small Ruminant Fattening Package...........................60 Table 10. Score of Knowledge of Small Ruminant Fattening Package ....................................60 Table 11. Knowledgeable Information Source of Sample Respondents in the Village ............61 Table 12. Reliable Sources of Information for Sample Respondents in the Village.................63 Table 13. Opinion on Fastest Information Flow\Dissemination Methods in the Village .........64 Table 14. Easily Communicated Issues among Villagers .........................................................65 Table 15. Age Category of Sample Respondents ......................................................................67 Table 16. Personal Characteristics of the Sample Households .................................................68 Table 17 Educational Level of Sample Respondents’...............................................................69 Table 18. Sample Respondents’ Land Distribution and Land Use Patterns..............................71 Table 19. Sample Respondents’ TLU Holding Distribution .....................................................73 Table 20 Income Distribution of Hhhs from Farm and Non Farm Activity .............................74 Table 21. Distribution of Hhhs by the Type of House Owned..................................................75 Table 22. HHHs’ Small Ruminant Rearing Experience...........................................................76 Table 23.Small Ruminant Input Usage .....................................................................................77 Table 24.Responses on Type, Source, Blood Level of Small Ruminants’ Breed of Sample
Respondents.......................................................................................................................79 Table 25. Sample Respondents Feed Use by Type of Feed and Frequency of Use ..................80 Table 26. Sample Respondents' Experience of Frequently Occurring Animal Diseases and
Health Problems. ...............................................................................................................81 Table 27. Sample Respondents’ Distribution of Willingness to Use Veterinary Services and
Access................................................................................................................................82 Table 28. Percentage Distribution of Sample Respondents’ Current Management Practices...84 Table 29. Distribution of Respondents on Their Contact With Extension Agent .....................85 Table 30. Extension Methods Participated By Sample Respondents........................................87 Table 31. Sample Respondents Showing Training Awareness And Training Given................88 Table 32. Distribution Of Sample Respondents By Mass Media Exposure..............................89 Table 33. Credit Access And Distribution Of Sample Respondents.........................................90 Table 34.Distribution Of Sample Respondents By Market And Input Availability Responses91 Table 35. Sample Respondents’ Home Distance From Feed And Water Sources In Hrs.........95

xiv
LIST OF TABLES (continued)
Table 36. Agropastoralists Risk Orientation ............................................................................97 Table 37. Responses of the Adopters and Non Adopters Group for Presence or Absence of
Insecurity in Their Village.................................................................................................99 Table 38. Reasons for Major Sources of Insecurity ...............................................................100 Table 39. Sample Respondents’ Participation in Social Organizations ..................................101 Table 40.Maximum Estimates of Tobit Model .......................................................................104 Table 41. The Effects of Change in the Significant Explanatory Variables on the Extent of
Fattening Package Adoption............................................................................................107

xv
LIST OF FIGURES
FIGURE PAGE
Figure 1. Diagrammatic presentation of conceptual framework of the study ..........................25 Figure 2. Map of the study area.................................................................................................27

xvi
LIST of TABLES in APPENDIX
APPENDIX TABLE PAGE
Appendix Table.1. Conversion factors used to calculate Tropical Livestock Units (TLU 133
Appendix Table 2 Selection criteria used and PAs that fulfill the criteria 133
Appendix Table 3 Variance inflation factor for continuous variables 134
Appendix Table 4. Contingency Coefficients for Dummy Variables 134
ADOPTION OF SMALL RUMINANTS’ FATTENING PACKAGE IN AGROPASTORAL AREAS, MEISO WEREDA, EASTERN OROMIA
ABSTRACT
Many studies were conducted to identify determinants of adoption of crop base technologies and practices and improved seeds, and while few studies concerned on evaluation of extension services in terms of the clients’ need and interest or adoption of livestock technologies in agropastoral and pastoral context In fact, livestock extension services in general in developing countries are less prioritized and thus livestock based technology services are rarely extended Common livestock technologies which are promoted to livestock raisers are focused on feed, veterinary services, and improved management practices through the extension services of agricultural/pastoral offices and livestock development units. The case hereunder, is about agropastoralists extension services evaluative perception and small ruminant fattening package adoption. Hence, this study investigates agropastoralists’ perception on the extension services, small ruminant fattening package and intensity of adoption small ruminants’ fattening package. The study is undertaken in Meiso Wereda, Oromia Region,Ethiopia. The Wereda has agropastoral and pastoral production system. The data are collected from 151 randomly selected pastoralists and agropastoralists using structured interview schedule. Secondary data were collected from different sources to supplement the data obtained from the survey. In addition to quantitative data qualitative data also gathered. Prior to formal survey an informal survey was also undertaken by using group discussion and interview with key informants. Descriptive statistics such as frequency, percentage mean, standard deviation, Chi-square tests and t-test were employed. The Tobit model was also employed to determine factors influencing intensity of small ruminant fattening package adoption. This study identifies agropoastoralists and pastoralists are poorly addressed and their need and interests are not considered in any extension programmes The Tobit model output showed that, agropastoralists intensity of adoption of small ruminant fattening package is influenced by: perception on the availability of improved breed, perception on resources based conflicts, current management practices, total livestock holding of HHs and credit use and availability for veterinary purposes. Future extension activities and agencies,promoting fattening package in agropastoral and pastoral areas, should focus on targeting agropastoralists with low perception on the availability of better breed, information and demonstration on the improved management practices, revision of credit supply criteria, making awareness and demonstration of the significant importance of small ruminants in the agropastoral and pastoral income and livelihoods contribution is important.

1. INTRODUCTION
1.1. Background
Ethiopia has the largest livestock inventories in Africa, including more than 38 million cattle,
30 million small ruminants, approximately 1 million camels and 4.5 million equines and 40
million chickens (CSA, 2004), with livestock ownership currently contributing to the
livelihoods of an estimated 80 percent of the rural population. The contributions of livestock
include food production, input for crop production and soil fertility management, raw material
for industry, power source, cash income, saving, fuel, social functions and employment. The
contribution of livestock to total GDP and agricultural GDP of Ethiopia ranges from 12-16 %
and from 30-35 %, respectively (MEDaC, 1998). The livestock sector contributes about 8 %
of the total export earnings, and is the fourth major source of foreign currency through export
of live animals, hides and skins. Livestock is an important sector in both highland mixed
smallholder farming and low land agropastoral systems in Ethiopia. The development of both
highland smallholder mixed farming and the lowland agro-pastoral/pastoral systems is
paramount to the development of the economy of the country, contributing to food and
livelihood security of the majority of the population of the country.
According to CSA survey, almost 99 percent of the cattle, sheep and goat population in the
country are indigenous. Of the total livestock, 75 % are in the highland and the rest are in the
lowlands. In the arid and semi-arid extensive grazing areas in the eastern, western and
southern lowlands cattle, sheep, goats, and camels are managed in migratory pastoral
production systems. Ethiopian goats fall into many breeds and types. There are 15 distinct
indigenous goat types in the country. The trend in livestock production at national level, and
the factors associated with or influencing productivity level has proven very difficult to obtain.
Besides, the corresponding national level aggregate data on livestock number and production
(collected from the FAO Year Books and from the Central Statistical Office Ethiopia) that
were to be correlated with factors believed to have influence on livestock productivity were
found to be problematic. Small ruminant production and management in the agropastoral and
pastoral farming system is characterized by a low-output system based on open grazing and

2
the use of crop residues. Goats graze and browse a large area of land that are usually of
marginal and unsuitable for other agricultural use. They roam freely either mixed with sheep
or alone. The main feeds of goats include tree leaves, shrubs, grasses and related plant species.
This system is marked by low productivity compared to many other countries in the world,
due to recurrent drought, lacka of feed and fodder and poor management practices
Institutional support to promote and expand the production and productivity of this sub sector
of agriculture had been and still is not comparable with cereal production extension in
Ethiopia. Livestock development had been one of the major components of agricultural
extension package since 1950s. First Five Year Plan (CADU, WADU etc.), EPID, CPP, MPP
I, MPP II, PADETES all had livestock extension programs but the efforts made to improve
livestock sector are not satisfactory. In fact, a clearly stated national livestock development
strategy has not yet been formulated. Livestock development has generally been considered
under agricultural development plans, and accordingly concerned institutions for agriculture
(be it education, research and extension) are mandated to address livestock development
within the agricultural context. Livestock education, research and extension institutions follow
the traditional top down approach, and the technology transfer model prevails largely
unchanged. The efforts have been towards promoting specialized livestock production systems
such as beef, dairy, poultry, etc. through the introduction of exotic breeds of cattle and forage
species, and to come up with cheaper animal feed combinations (Habtemariam, 2000).
Livestock extension in Ethiopia mainly focused on few aspects like AI (artificial
inseminations for cattle), dairy cows and goats’ distribution, forage and feed species seed
distribution and, trainings and demonstrations in animal health management, feeding, herding,
and general appropriate rearing practices. These are the common livestock extension services
given to farmers all over the country through wereda experts. The recommended package
components in Mieso wereda are improved feed, veterinary and health practices and services,
and improved management practices of small ruminant rearing (feeding management, health
caring, watering, market information and trainings related with these management practices

3
1.2. Statement of the problem Small ruminants have multiple uses and importance in agropastoral and pastoral economy and
social security. The northern, south-eastern and western low lands as well as the Rift Valley
Region of Ethiopia have been dominated by migratory and transhumant pastoralists for whom
livestock constitutes the sole means of livelihood. For pastoralists in other low land areas, the
sale of livestock and livestock products constitutes their major cash income (Coppock, 1990;
Sintayehu, 1993). Goats and sheep are the most widely reared livestock species by HHs living
in Meiso.
Livestock production in Ethiopia is functioning under several constraining factors: diseases,
feed shortage, institutional and policy related constraints (Wibaux, 1986; Tennasie, 1988;
Dejene, 1995 as cited in Habtemriam). It is needless to say, the situation of Meiso wereda is
characterized by many constraints of small ruminants’ fattening practices and even faces
worse production environments- severe feed shortage, chronic animal health problems, poor
input supply and marketing issues, social problems, lack of training, lack of research and
development support, lack of credit services, insufficient veterinary support, marketing
constraints are: middlemen interference, lack of cooperative organizations at the pastoralist
level, poor livestock extension packages promotion strategies and approaches, inappropriate
content of extension packages, conflict hampering pastoralists from using market places like
Bordode (ILRI- IPMS, 2004) and poor management practices. Besides, the resources used as
input (natural pasture/ grazing land and water) and the rearing styles of these communities are
so poor that the fattening activities have low output in terms of live weight gains of goats and
sheep. Less productivity of small ruminant fattening production system make the
agropastoralists to generate lower income from the sale of goats and sheep (WBPRD, 2006).
Efforts are being made by different agencies to improve the livelihood situation of
agropastoralists through increasing small ruminants’ production. WBPRD and NGOs have
been striving to lessen the above fattening production problems for more than a decade.
Forage and fodder species, animal health and vet services, demonstration and trainings on
various livestock rearing practices and/or management techniques provisions were some of the
4
specific efforts made by these agencies, to revert the decrease of small ruminants’ productivity
in the wereda (WBPRD, 2006). As to the evaluation of extension agencies’ efforts made so
far, there was no single systematic study that indicated the success and lessons that could be
drawn. There were also no formal survey and study with regard to agricultural extension and
communication and adoption of livestock packages in terms of agropastoralists’ opinion and
adoption characteristics in the study wereda.
Agropastoralists being exposed to extension and development interventions for more than a
decade have two options. They have to decide either taking up of technologies and
information needed or sticking to their own practices. These decisions of agropastoralists are
determined by a number of factors: level of management skills, degree of current production
problems, needs and interests of individual, attitude and perception of agropastoralists on
extension services being promoted in the wereda on small ruminant fattening package. Since,
these behavioral decision making factors were not studied before in the study area, there is a
need to assess small ruminants’ extension services perception and adoption behaviors of
agropastoralists to fill the existing information gap in the fields of extension communication
and adoption studies. The spread and transfer of technologies of fattening package was not
studied before as well and there is clearly a research gap. Therefore, this study has been
undertaken to initiate bridging the gap in information with regard to agropastoralists’
technology adoption and extension service acceptance in the study wereda.
1.3. Research questions
The research was conducted to answer the following questions about Meiso wereda
agropastoralists.
1. What is the perception of agropastoralists about the currently extended small ruminants
fattening package in the wereda?
2. What is the extent of small ruminant fattening package adoption in the wereda?
3. What are the determinant factors in adopting small ruminant fattening package at HHs
level?

5
1.4. Objective of the study
The general objective of the research is to assess agropastoralists adoption decision behavior
and their perception of the small ruminants’ extension services. The specific objectives of the
study are:
1. to assess extension coverage of fattening package contents for small ruminants in the
wereda as perceived by agropastoralists.
2. to analyze the intensity of adoption of small ruminants fattening package in the Wereda and
its determinants.
1.5. Significance of the study
Socially feasible development efforts need understanding of the social, cultural, institutional,
economical, and environmental elements and their inter-relationship with human behavior.
Thus, the study tries to address some of them by focusing on human and institutional elements
of the system in adoption processes of agricultural innovations. If the aim of a development
project is to raise the living standard of the poorer sections of the community, it is much more
likely to do so if it concentrates on production from small ruminants. Documenting technology
generation and extension efforts, in this development processes, is of paramount importance in
order to learn for future improvement.
The economic role of goats and sheep has previously been described and some economic
analysis of technological innovations and production prospects has been conducted. By
focusing only technical and economic aspects of production, many studies created a gap in
empirical evidences of assessing the adoption behavior of small ruminants’ producers. There
are no well documented and quantified findings that explain the adoption behavior of
agropastoralists in the study area too. So, the information obtained in this regard is of
paramount significance to evaluate the nationally proposed livestock development plan of
extension package for small ruminants in Ethiopia in general and the study area in particular.
This work is also typical in its contribution for academic purposes, as it analyses adoption and
extension services in agropastoral and pastoral farming systems’ context. Moreover it gives

6
site specific adoption characteristics of agropastoralists, who are not well addressed in depth
so far by extension services and research developments in the country.
1.6. Scope and limitation of the study
This study mainly emphasis on socio-cultural, psychological, and institutional, economic and
production factors determining household’s adoption decisions. It did not undertake impact
economic analysis as a result of adoption. This adoption study of animal feed, veterinary
services and practices and improved production techniques in the wereda is the first kind of
study in the wereda and hence agropastoralists were inevitably forced to recall many,
fragmented and long time memories of extension services and animal technologies provision.
This leads the study to focus on general agropastoralists’ evaluation of livestock extension
services. Therefore, this study provides empirical evidence to form the basis for further
analysis of agropastoral and pastoral societies in livestock extension evaluation and adoption
studies in Ethiopia.

7
2. LITERATURE REVIEW
2.1. Adoption of Agricultural Innovations and Technologies
Adoption of innovations refers to the decision to apply an innovation and to continue to use it
(Rogers and Shoemaker, 1971). The decision to adopt an innovation is a behavioral response
arising from a set of alternatives and constraints facing the decision maker. Literature provides
different definitions and explanations about adoption. Getahun et al (2000) defined adoption
as the degree of use of a new technology in a long-term equilibrium when a farmer has all of
the information about the new technology and it’s potential. Arnon (1989) stated that
adoption of a new technology must be preceded by technology diffusion, for example, the act
of making new technology known to the potential adopters, and stated that diffusion is
therefore, the link between research and development and adoption. Different literatures
indicated that the different agricultural technologies are developed and disseminated to the
farming community in different parts of the region; however only small portion of the small-
scale farmers adopt some of the technologies.
Rogers (1983) described the model of diffusion of a new technology within a farming
community, where adopters were categorized with respect to earliness or lateness in adoption.
He classified them innovators, early adopters, early and late majority and laggards. Some
generalizations about innovations and their rate of adoption by Rogers and Shoemaker (1971)
are:
Innovations perceived as most economically rewarding and less risky were adopted most
rapidly
Innovations most compatible with farmers’ values were adopted more rapidly,
Small farmers were slower to adopt new ideas than larger farmers,
Small farmers were quicker to adopt those innovations they perceived as decreasing
discomfort where as large farmers rapidly adopted the new ideas they perceived to be
economically profitable,
It is important to identify the opinion leaders in the villages /farming community,
There is a positive relationship between the relative advantage and rate of adoption of new

8
ideas however relative advantage can be in the form of degree of economic profitability,
low initial cost, lower perceived risk, decrease in discomfort, saving in time and cost,
immediacy of the reward etc
Economic profitability may be less important for peasant farmers in less developed
countries, if they are oriented to subsistence living. Other non economic dimensions of
relative advantage like social prestige, social approval, etc my be more important,
Relative economic advantage of the new idea must be at least 25-30 percent higher than
existing practice for economic factors to affect adoption (some would suggest that to
induce farmers to change, the potential payoff must be high-not by 5-10 percent but 50-
100percent). When an innovation promises only 5-10 percent advantage the peasant farmer
probably cannot even distinguish that it is advantageous,
An innovation should be compatible with farmers’ existing values and beliefs, and needs,
The complexity of an innovation as perceived by members of social system is negatively
related to its rate of adoption. Special care should be taken when the innovation is a
package where the farmer must adopt all practices at once to get the interaction effects of
each.
2.2. Patterns of Adoption and Adoption Behavior
Adoption is not final event of change but rather a decision making process. Individuals pass
through a number learning and experimenting stages from becoming aware of a problem and
its potential solutions to finally adopting or rejecting the innovation under consideration
(Enters, 1996). Adoption patterns from the larger body of empirical evidence have been
identified for the most part farmers choose to adopt inputs sequentially, adopting initially one
component of the package and subsequently adding other components over time, one at a time
in some instances. Farmers may adopt a component and subsequently revert to traditional
practices. Adoption patterns vary by agroecological zones, between farmers facing different
markets and institutions (Leather and Smale, 1991).
A number of researches on adoption behavior pointed out that a host of explanatory factors
influence adoption behavior of farmers. For instance, Hansel (1974) identified individual

9
characteristics like education, access to change agents, size of holding; regional characteristics
of rural change agencies and population densities; innovation characteristics like accordance
with local norms and economic advantage as influencing the adoption of technologies.
Giger et al (1999) stated that if the technology promoted is not profitable from the
agropastoralists’ point of view, it is highly doubtful that the use of direct incentives will lead
to sustained adoption of a technology in the long run. The technology will almost be
abandoned as soon as the project phases out, and no replication beyond the boundaries of the
lifetime of project can be expected. They further explained that rapid economic benefit is a
very important condition for success and it is most probably much more important than the use
of incentives in terms of achieving genuine, durable adoption.
2.3. Attitude and Behavior
Attitude is a subjective or mental state of preparation for action and it may be defined as a
state of mind of the individual toward a value. Social values are created by the attitudes that
are common to many men, and these attitudes in time, depend upon pre-existing social values
(Allport, 1967). Attitude is also defined as an implicit response which is anticipatory and
mediating in reference to patterns of overt responses, which are evoked by a variety of
stimulus patterns as a result of previous learning or of gradients of generalization and
discrimination. It is cue- and drive- producing, and it is socially significant in the individuals’
society (Chein, 1967). According to Tesfaye (2003) the relationship between attitude and
behavior has been one of the crucial focal point in social science research. Attitude is the
disposition to respond favorably or unfavorably to an object, person or institution. He adds
that the characteristics of attribute are its evaluation that reflects a positive or negative
evaluation of the attributed object. Attitude is non-overt and can only be inferred from verbal
or non verbal responses.
In considering the relationship between attitudes and behavior, some other relationships are to
be considered. There is fairly conclusive evidence that an individuals’ attitude towards any
object is a function of his or her beliefs about that object and the evaluative aspects of those

10
beliefs. There is also enough evidence that there is a stable and high correlation between
attitude and behavioral intentions. Attitudes are a fundamental determinant of behavior, but
not the only one. Theory identifies the basic determinants of behavior to be: a) attitudes
toward the behavior; b) normative beliefs, both personal and social; and c) motivation to
comply with the norms. Other variables are said to influence behavior, but they operate
indirectly by influencing any of these three basic determinants. The weights of the three major
determinants may vary with the type of behavior being considered and they may also vary
across individuals. Outside variables may be related to the basic determinants of behavior, but
they may be unrelated to the actual performance of a given behavior. An individuals’ attitude
toward a stimulus is related to his or her behavior with respect to that object. It may also be
expected that an individuals’ attitude toward a given stimulus would influence his motivation
to comply with a given norm. And, finally, variations in the situation may influence one or
more of the primary determinants of behavior (Fishbein, 1967).
Motivation is the basic drive for all of our actions. Motivation refers to the dynamics of our
behavior, which involves our needs, desires, and ambitions in life. Achievement motivation is
based on reaching success and achieving all of our aspirations in life. Achievement goals can
affect the way a person performs a task and represent a desire to show competence
(Harackiewicz, 1997). These basic physiological motivational drives affect our natural
behavior in different environments. Our motives for achievement can range from biological
needs to satisfying creative desires or realizing success in competitive ventures. All of our
behaviors, actions, thoughts, and beliefs are influenced by our inner drive to succeed (Scott,
2006). Two motives are directly involved in the prediction of behavior, implicit and explicit.
These two motives often work together to determine the behavior of the individual in direction
and passion. Explicit and implicit motivations have a compelling impact on behavior. The
primary agent for this type of motivation is perception or perceived ability.
2.4. Empirical Studies on Adoption of Goat and Sheep Husbandry Practices
In the study conducted in Victorian Mallee by Robertson and Wimalasuriya (2004) it was
shown that the difficulty of integrating sheep into current short cropping systems was

11
considered to be the key limitation to the adoption of management practices including using
superior breeds, reducing rams and introducing supplementary feeding. The same study found
that the major factors restricting sheep number were climatic influences on pasture
availability, the area of crop, the relative profitability of sheep when compared with cropping,
and time-labor lifestyle issues. These were found to be the determinants in the sourcing of
labor, making time for sheep husbandry or preference not to work with sheep. Producers’
responses in answering the methods that would increase the profitability of sheep enterprises,
only 55% responded all the required three answers for better methods of management. Better
management included responses of timeliness of operations, weaning lambs, culling ewes,
disease control, fox control and weed control. But goals other than profit may motivate
producers (Fergusson, 1984).
Producers were more positive towards changes such as changing breeds or genetics of sheep,
marketing methods, but climatic conditions are a factor in the reluctance of some producers to
use any type of contract production or marketing system for sheep. Risk contributed to
reluctance to have a later lambing time. Other constraints identified by some producers in the
adoption of some management options include the capital cost of buying stock or upgrading
facilities, the sizes or limited number of paddocks for grazing and traditional attitudes
(Robertson and Wimalasuriya, 2004).
Constraints to adoption of technologies could be broadly divided as either inherent technology
characteristics or as individual decision making behavior which in turn is affected by several
other variables. As Guerin and Guerin (1994) listed, few constraints related with technology
characteristics are: the technology is complex; the outcomes of adoption are not easily
observable; financial cost; producer beliefs about the technology; level of motivation of the
producer; relevance of the technology and producer’s attitude towards risk and change.
The most serious constraint for small ruminant production in Africa in general and Cameroon
in particular is the small size of the average farm. The key to intensification and increase in
output of sheep and goat production is the application of improved production and marketing
technologies (Tambi, 1985). These include significant increases in the use of purchased

12
cereal/protein feeds (concentrates) including crop byproducts (Fomunyam and Meffeja, 1985)
and conserved grasses (Tait, 1973), improvement of existing vegetation by upgrading soil
fertility, improvement of seeding (Newbold, 1974), investments in improved stock breeds and
the application of processing and marketing techniques. These measures of intensification are
difficult to come by because of low income levels, inadequate resources and managerial skills
as well as general socio-economic characteristics which, together, constitute production and
marketing constraints in sheep and goat production. The testing of innovations and monitoring
of sheep and goats on smallholder farms outside the station therefore requires an
understanding of existing constraints relating to available resources, management practices,
and ownership patterns as well as marketing conditions(Tambi, 1985 ). Economic constraints
have a major effect on the extent to which some of the biological factors can be employed. It
is, for example, technically possible to improve the nutrition and health of animals by
concentrate supplementation and other management factors, but the relationships between
input costs and product prices limit their use. Dry season supplementation of sheep and goat
diets for example, offers an effective means of increasing output during periods of scarce
pastures but the high concentrate and labour costs incurred render it uneconomic (ibid).
Land and pasture improvement for sheep and goat production is an expensive operation
particularly in regions where there is dominance of native pastures (Newbold, 1974; Eadie and
Maxwell, 1975). Adoption of recommended husbandry practices according to type of village
and actual use of various recommended practices were assigned as indicators of adoption. It
was found that adoption behaviors of farmers in both types’ of villages were substantially
similar. A low level of adoption (less than one-third) was observed in both types of villages in
relation to provision of shelter, provision of slatted floors, use of feeding concentrates, use of
improved pasture, use of internal and external parasite control, use of vaccinations, use of
mineral supplements and use of goat breeding strategies. About one-half of the farmers in each
type of village used legumes as feed for their goats and practiced goat selection strategies.
About three-quarters of farmers in both types of villages used leaves as feed. Intensive training
for farmers should be conducted to increase use of recommended practices and thereby, the
potential profitability of raising goats (Kriengsak, 1996).
13
The results of study done by Lucila and Simeon (2003) indicated that in addition to the
biological aspects being critical to the adoption of forage species, the socio-economic
characteristics of the farmer and the farm are important factors in the adoption of forages
among adopters of contour hedgerows. It was shown that when a farmer is facing a liquidity or
capital constraint, there is less likelihood that adoption of forages will take place because of
the accompanying costs of adoption. Likewise, the role of education in facilitating the uptake
of technologies cannot be overemphasized, as implied by the results of this study. Education is
not necessarily confined to formal education, but rather could encompass the whole range of
training and extension activities that will promote information and knowledge dissemination
concerning a new technology.
2.5. Livestock extension in Ethiopia
Agricultural extension in Ethiopia has a history of nearly 50 years. It began with assistance
provided by the United States Government under an agreement signed between the two
countries in 1952. The agreement was broad and included the following: training of high level
manpower; promotion of agricultural research; and dissemination of research results and
scientific information through a network of agricultural extension. The initiative taken so far
by Ethiopian government to develop the livestock industry is less than what is to be desired
(Habtemariam, 2000).
During the imperial era; livestock relatively received more emphasis in the extension program.
All the development projects like CADU, WADU, and SORUDU had livestock improvement
programs as their components. In 1970, the Extension and Project Implementation Department
(EPID) was created in the Ministry of Agriculture. The idea was to formulate and implement
minimum packages based on the experiences and lessons from the CADU project. By 1984 or
so, two minimum package projects, namely, Minimum Package I and Minimum Package II
were implemented and then instead of developing Minimum Package III a broader regional
development approach was adopted and programmes known as “Peasant Agricultural
Development Programme (PADEP)”. This programme focused on specific regions of the
country. PADEP used the Training and Visit (T&V) extension system.

14
In the “New” Extension System (PADETES), to complement the ADLI strategy, the
government of Ethiopia has adopted Participatory Demonstration and Training Extension
System (PADETES) as the National Agricultural Extension System since 1994/95. According
to the new agricultural extension system, execution of extension programmes is the sole
responsibility of the Regional Agricultural Bureaus (RABs) while the Federal Ministry of
Agriculture (MoA) has the mandate of formulating agriculture related policies, coordinating
inter-regional development programmes and/or projects, providing technical advice and
training services to increase the technical competence of extension staff members of the
Regional Agricultural Bureaus. This system gives special consideration to the package
approach to agricultural development. On the other hand, the responsibility of the extension
team is mainly the implementation of extension packages that are designed and channeled by
regional authorities.
The term “package” is defined as a group of separate items packed together as a single unit.
Extension package is therefore defined as a package consisting of different elements which,
among others, include technical information (improved technology and agricultural practices)
agricultural production inputs, credit for inputs and suitable extension methods. In addition,
maintaining the relationship between research and extension and conducting practical-oriented
training programs are essential components of the new extension system. Different extension
packages have been developed. The major ones include cereals-based extension packages both
for moisture reliable and moisture stress areas, extension packages for high economic value
crops, livestock development, agro-forestry, soil and water conservation and development as
well as post-harvest technology package. The livestock development extension package
includes dairying for milk production, fattening for meat production, poultry for egg
production and apiculture / bee-keeping for honey production (Dejene et al; 2000). The
livestock development extension was initiated in 1997 and is being implemented since then
with the objective of increasing income of the household and food security thereby
contributing to national development.

15
The livestock extension package is implemented since 1997, in eight regions namely Amhara,
Tigray, SNNP, Dire Dawa, Harari, Oromia, and Somali, except in pastoral areas. The meat
extension packages focuses on the fattening of large and small ruminants. The strategy is to
use farmers’ own cattle, sheep, and goat and purchased animals (3 oxen, 5 sheep/goat) to
fatten them for 90 days. Input component of the fattening package include animals to be
fattened (owned or purchased), animal feed and feeding, animal health, paddock and other
supportive services like selection of animals, fattening period and marketing. Credit is only
provided for the purchase of sheep and goat and not for oxen. The oxen are expected to be
supplied by the farmer himself or herself. One of the fattening extension components is the
selection process of animals. This technology does not appear to be practiced by the farmers in
reality as animals for fattening are not selected based on their body condition and frame, age
and weight.
Shortages of land for grazing and insufficient feed supply are identified as the major
constraints of fattening in the extension program. The other common constraints in the
fattening package extension services Ethiopia were: management and feeding system
practiced, market outlets (access), credit accessibility, and training and marketing of the
finished animal, veterinary services, input supply, lack of focus, problem of designing
extension fattening package, and approach. Technical constraints like breed, feeds and feeding
system and weak follow up, training frequency, visits by DAs, non availability of inputs,
market outlets are indicators for poor participation and follow ups (MoA, 1992 E.C.).
2.6. Importance and Role of Goat and Sheep in Pastoral and Agropastoral
Livelihoods
Goats are kept in a wide range of agro-ecological zones and management systems in Africa
(Peacock, 1996). Livestock production in Sub-Saharan Africa is dominated by pastoralism and
agropastoralism. Pastoralism is practiced in areas not suitable for cultivation and
agropastoralism in areas where the agroclimatic conditions favor crop production. Livestock
are vital to the subsistence and economic development in Africa. They provide year-round
flow of essential products, sustain the employment and income of millions of people and
contribute draught power and manure for crop production. Pastoralists are increasingly

16
realizing that they need to rely on goats more and more. The increasing frequency of droughts,
together with long-term environmental degradation, is causing many pastoralists to shift from
keeping cattle to keeping camels and goats. There is a marked trend towards keeping more
small ruminants as proportion of livestock holdings than large ruminants. There are many
reasons for this; goats are relatively cheap to acquire and reproduce quickly, enabling
pastoralists to use them as a means to acquire cattle or camels (Peacock, 2005).
The social and economic roles goats play in African rural societies are explained in terms of
food security and income generation. Since crop yields plateau and the price of many cash
crops stagnate or fall, the intensification of livestock production is a viable option to increase
household income. They are considered as savings account, especially for women in rural
areas. Small ruminants are much easier and quicker to sell than cattle, when cash is needed to
meet households’ requirements. Now, more specialized systems of goat production are
developing in response to increased market opportunities. The growing demand for goat meat
from city residents presents an opportunity for goat fattening systems, as well as improved
marketing from pastoral flocks. The potential for goat meat export, particularly to Middle East
markets, remains under-exploited. Droughts are common and even floods can devastate lives
as can civil war. Frequently families have to face crises due to accident or illness, increasingly
from HIV/AIDS, without the benefit of a formal welfare system. Goats can play a vital role in
supporting families through all these situations (ibid).
Small ruminants are often slaughtered in honour of a special guest, a visiting friend or relative,
for festivities and religious rituals. More importantly, small ruminants play a key role in stock
association building (building social capital or harmonizing relationships) between non-
household members in rural areas. Because of their small size, sheep and goats provide more
convenient sources of meat than cattle. Small ruminant production in general, and sheep and
goat production in particular, has in recent years gained increasing popularity in most of the
developing countries. Apart from the social and economic functions small ruminants play in
developing societies, they also provide most of the meat supply for human consumption.
Increased demand for goat meat, for example, provides potential economic advantages to
farmers of small ruminants over large ruminants (McDowell and Bove, 1977).

17
2.7. Pastoral and agropastoral indigenous husbandry practice and its limitations
Transformation of small ruminant production systems in arid areas under present demographic
pressures and economic changes lead to an increase in human settlements, sedentarisation,
which is associated with more demand for cultivation land. As the population becomes more
and more sedentary, the amount of agropastoralism increases. The environment is probably
too variable to support an agro-pastoral system. All these factors related to the transformation
of the pastoral systems make the systems heavily dependent on external feed resources and
agricultural byproducts. These transformations concern also feeding and the choice of raised
breeds. During periods of droughts, contributions of range lands might be even lower. Along
by-products (straw, stubble) are offered, which make the system heavily dependent on with
this reduction in the contribution of range lands, other external resources and agricultural
agriculture. However, the environment is probably too variable to support an agro-pastoral
system. The dynamics of the pastoral systems induces also changes in livestock composition,
less goats and more sheep and cattle. Zero grazing system induces problems of pollution (A.
El Aicha and A. Waterhouseb, 1999).
The goat production system as a part of the existing broad crop-livestock mixed farming
system of the selected villages is further described as follows. Indiscriminate breeding is
prevalent in the area. No efforts seem to have made to improve the stock through selective
breeding or by introducing high potential breeds. Male goats are taken better care of than the
female ones as these fetch good price to the owners. Many do not like goat milk; hence, less
priority is attached to milk traits of the goats. Feeding seems to be the most neglected aspect in
goat production in the area under study. Goats were maintained on grazing in harvested fields,
along the roadside and on other uncultivated/ barren lands. Stall-feeding in goats was very
limited. She goats are given kitchen waste and the males are given inferior quality grains and
grams for fattening purposes. Children and old members take goats for grazing in nearby
fields in the morning and also in the afternoon. Those households, which do not have children
or aged members in their families, hardly keep goats. The farmers did not report disease in
goats as problem. Since goat production is only a fringe activity for most of the farmers, the
health problems of goats were hardly paid any attention. However, to find out the types of
health problems in local goats, the information maintained in the register of Indian Veterinary

18
Research Institute run weekly clinic at Rithora was also studied. This revealed that goats
suffered mainly from worm load, mange, mineral deficiency, anorexia, contagious ecythyma,
diarrhea, mastitis etc (H.P.S.Arya and Mahesh Chander, 2003).
Using their own indicators of pasture type and quality, livestock-keepers decide whether or not
they will go (or send their animals) on transhumance or will bring in feed from elsewhere.
Studies of “grassroots” indicators mention of how pastoralists recognise range degradation, in
the day-to-day management of range resources, pastoralists’ monitoring practices are
reportedly much the same as in scientific range management: they monitor vegetation cover
and yield, greenness of plants, vegetation composition, occurrence of wildlife, and indicator
plants for degradation However, pastoralists do not monitor vegetation, water or soil because
they are primarily interested in these resources but rather because they are interested in how
their animals and their families fare from these resources. Therefore, changes in the state of
natural resources are more likely to be monitored through changes in the condition (health,
productivity, well-being) of their animals. For this reason, indicators associated with their
animals (e.g. milk yield, energy levels, sleekness of skin) are likely to be more important to
monitor than, e.g. vegetation (Wolfgang Bayer and Ann Waters-Bayer; 2002).
The incorporation of the pastoral production system into the market economy and the efforts
of so called developmental policies to shift traditional resource tenure to state tenure have
among other things, contributed to land degradation. It also contributed to the erosion of
traditional social structures and the cohesion of nomadic pastoral societies. The widespread
feeling is now that the spirit of cooperation and collective responsibility that was once central
to traditional animal husbandry has been lost and is being replaced by individualism, greed,
mistrust and competition. The mobility of households and herds is a distinctive adaptation to
this risk prone environment. Restrictions on mobility affect livestock production, rangeland
ecology and inter-group relations. Starting with Somalia’s independence in 1960 and the
creation of permanent water points in arid zones such as Haud, grazing patterns and cyclical
migrations have been altered. As water points alleviated one problem, it created an even more
serious one. Areas that previously could be grazed only during the wet season could now be
grazed all year round Migrations became more localized and the range was given little time to

19
regenerate. The availability of water meant that animals could be watered more frequently,
and did not need to move far from the water points. There is a dilemma; namely that more
water points are a necessity for the short term, yet more water points will compound the
problems of declining pasture and declining livestock production. Proper management of new
water sources is therefore essential. One possibility would be to consider ways of restricting
new berkeds to existing centres and thereby to conserve grazing areas (Hussein, 2005).
Herd mobility as crucial strategy: Since the functional distinction between different ecological
zones was no longer valid, the rotational grazing was abandoned. Throughout the Borana
lowlands the adjustment of stocking rates to forage availability necessarily decreased. Borana
pastoralists differentiate breed types for cattle, small ruminants and camel in Qorti and Ayuna.
They identified the scarcity of pasture and the increasing recurrence of droughts as the main
causes for the genetic erosion. In response to ecological degradation and the declining
competitiveness of the Ethiopian Boran cattle, pastoralists have increasingly started to
complement cattle husbandry with that of camels. The pastoralists complained that all
livestock species had reduced their reproductive performance. Indicators for low performance
were said to be the insufficient supply of milk and a delayed conception (Sabine Homann et al
2004).
2.8. Empirical Studies on factors affecting Adoption and Intensity of Adoption
Intensity of adoption refers to the number of technologies practiced by the same farmer. The
intensity of adoption of different technologies is measured by a variable that represents the
breadth of technology use within a particular stage of production (Kenneth et al; 2005/6).
Social scientists investigating farmers’ adoption behaviour have accumulated considerable
evidence showing that demographic variables, technology characteristics, information sources,
knowledge, awareness, attitude, and group influence affect adoption behaviour.
A wide range of economic, social, physical, and technical aspects of farming influences
adoption of agricultural production technology (Oladele, 2005). Different studies conducted
on factors influencing adoption of agricultural technologies have underlined factors, such as
characteristics of household (education, age, and family size), farm characteristics, technology

20
characteristics, wealth (economic status), contact with extension agents, farmers knowledge of
specific technologies, price, access to credit, position of farmer in farmers organization as
important determinants of adoption of new technologies (Legesse, 1992; Teressa, 1997;
Walday, 1999; Mulugeta, 2000).
Farmers’ adoption decision can be influenced by many economic, social, and physical factors,
which vary from area to area, and their effect on adoption decision are often not uniform.
Because of this, the reaction of farmers to new technology is often not necessarily the same
(Chilot et al; 1996).
Demographic characteristics
The roles of age in farmers' decisions to adopt technology have been shown in previous
studies. Berhanu (2002) has shown that years of farming experience has significant effect on
the adoption of crossbred dairy cows. Some studies reported positive relationship between age
and adoption behavior of farmers Haji (2003), Mesfin (2005) and Yenealem (2006) found age
significant in explaining the adoption of new technology. However, a study conducted by
Bulale (2000) on adoption of dairy production technologies in Arsi highlands indicates that
age had no influence on adoption of dairy production technologies but formal education does
have a positive and significant influence.
Farmers with more education should be aware of more sources of information, and be more
efficient in evaluating and interpreting information about innovations than those with less
education. Even though the relationship between education and technological change is
complex, it is also expected that farmers with higher levels of education will be more likely to
use improved technologies. Weir and Knight (2000) and Croppenstedt et al (1999) found that,
in Ethiopia, household-level education determines whether a farmer is an early or late adopter,
but is less important in determining whether or not the farmer ever uses fertilizer.
Another study in Tanzania confirmed that farmers’ adoption of crossbred technology depends
positively on his schooling (Abdulai and Huffman, 2005). Falusi (1974) found that fertiliser

21
adoption was influenced more by institutional and educational considerations than by
economic factors. In Ethiopia, Tekle (1975), Admassie (1995), Mekuria (1995), Asfaw et al
(1997) and Tadesse (2000) have attempted to investigate the factors that affect farmers’
adoption of new technologies, such as improved crop varieties and fertilisers. Mekuria (1995)
and Asfaw et al. (1997) all conclude that education has a positive and significant impact on the
adoption of modern inputs.
Institutional and social participation
There is growing evidence that the major factor explaining low adoption of technology in
Africa is lack of appropriate institutional and policy support (Kedir, 1998). As reported by van
Den Ban and Hawkins (1998), adoption of improved technologies is strongly affected by the
policy environment like input supply, market, credit, price policies and improved supply
system. Poor linkage between research and extension, high cost, low return, inappropriateness
of technologies, lack of credit facilities, the prevalence of animal diseases, absence of
transport and marketing infrastructure are some of problems affecting diffusion of
technologies The decision to adopt any single innovation depends on the availability of
interrelated inputs. Input availability is the most important influencing factor the use of
improved technologies (Chilot et al, 1996). Berhanu (2002) has reported that input availability
had positive and significant influence on adoption decisions of farmers.
Distance from market has significant effect on the adoption of crossbred dairy cows in the area
as indicated by Bulale (2000).and Yenealem (2006) had shown that market distance is
negatively and significantly related to adoption decision.
A study in Tanzania confirmed that farmers’ adoption of crossbred technology depends
positively on his access to credit (Abdulai and Huffman, 2005). The findings of Legesse,
(1992), Teressa, (1997), Sseguya et al, (1999), Walday, (1999), Mulugeta, (2000), Million
and Belay, (2004), Pender et al, (2004), Ibrahim, (2006) and kebede, (2006) show that credit
has positive and significant influence on agricultural technology adoption. However, Bulale
(2000) has found in his studies of adoption of dairy production technologies in Arsi highlands

22
that credit had no influence on adoption dairy production technologies.
A study by Makokha et al (1999) confirmed that farmers’ characteristics with respect to
leadership positions have significant influence on perception and hence adoption decision of
farmers. A study in Tanzania confirmed that farmers’ adoption of crossbred technology
depends positively on the proximity of his farm to other users (Abdulai and Huffman, 2005).
A study by Makokha et al, (1999) confirmed that farmers’ characteristics such as participation
in field days and demonstration, attendance at workshops and seminars and contact with
extension have significant influence on perception and hence adoption decision of farmers.
Communications is the essence of extension, which seeks to provide knowledge and
information for rural people to modify behavior in ways that provide sustainable benefits to
them and society in general (Alex et al, 2002). Indeed, Sim and Hilmi, (1987) considered that
the main purpose of extension systems should be to assist potential participants to place
adoption decision in context. The decision to participate, or to adopt an innovation, is
considered to be an information-seeking-and–processing activity where individuals are
motivated to reduce uncertainty about the advantages and disadvantages associated with a new
practice (Rogers, 1983). The effectiveness of extension service and other communication
media and efforts were most important influencing factors in the use of improved technologies
(Chilot et al, 1996). Berhanu (2002) have shown that extension contact and bull service has
significant effect on the adoption of crossbred dairy cows in his study area and a study in
Tanzania confirmed that farmers’ adoption of crossbred technology depends positively on the
contact with extension agents (Abdulai and Huffman, 2005). Contrary to the above findings,
Bulale (2000) in his study indicates that extension had no influence on adoption of dairy
production technologies.
Socioeconomic factors
Wealth status is expected to affect technology use for a number of reasons, including that
wealthier farmers have greater access to resources and may be more able to assume risk. Risk
and uncertainty have been discussed in previous empirical studies as impeding technology

23
adoption. The degree of risk aversion was the cause of low adoption rates (Yohannes et al;
1990). Makokha et al (1999) found that technological attributes such as supply (availability),
economic and yield benefit, convenience had significant influence on adoption decision. The
risk-averse farmer selectively adopts technology that ensures positive net expected marginal
benefits.
Berhanu (2002) has shown that total livestock holding and off-farm income has significant
effect on the adoption of crossbred dairy cows in his study area. Itana (1985) and Yenealem
(2006) found positive and significant influence of TLU on adoption decision.
Arene (1994) reported a positive and significant relationship between family size and
adoption. On the other hand, Voh (1982) established that household size is not significantly
related to adoption. Techane (2002) has found family labour was positively related with
adoption and intensity of fertilizer use and his result agrees with the findings of Lelissa (1998)
and Green and Ngongola H. (1993).
Findings by Nkonya et al. (1997) hinted that those with large farm are likely to be better
informed, be able to take risk associated to experiment with new practices. Berhanu (2002)
have also indicated that farm size of cropland exerts a positive influence on the adoption of
improved technologies. But, Yenealem (2006) has shown that farm size has no significant
influence on adoption decision of FHH.
Technological attributes and bio-physical factors
Makokha et al. (1999) found that technological attributes such as convenience had significant
influence on adoption decision. Saha et al. (1994) recognized that producers' adoption
intensity is conditional on their knowledge of the new technology and on their decision to
adopt.
Plans that employ a wide range of advanced technologies - adoption intensity - having
mastered a larger skill set are hypothesized to have shorter adoption lags than those using only
24
one or two technologies (Baldwin and Rafiqquzaman, 1998). Berhanu (2002) has shown that
feed shortage and animal health problem have significant effect on the adoption of crossbred
dairy cows.
2.9. Conceptual Framework
This adoption study bases the general livestock extension performance, especially the
fattening package by taking adoption behaviour towards the strategies and technology
promotion processes being undertaken in the wereda .To analyze these processes there is a
need to frame the research into major areas where the researcher has to focus, to address the
research questions:
Institutional-extension service, market, education and training providing agencies,
social/community organizations etc.
Economic-: labor availability, employment opportunities, income, economic status in general
Socio-cultural and socio-psychological: elements that affect the interrelationship and norm,
and social behaviors influencing members of the community to react according to their socio-
cultural and psychological context. Ethnicity, group norms, leadership, social status, local
participation, religious attribute (degree of conservativism in religious norms and ethics of
groups and individuals).
Individual behavior and psychological patterns: response of each individual in even the same
social and cultural setting is largely determined by his/her own attitude and perception to
stimuli at a time. Achievement motivation of individuals, perception of personal achievement
and, incentive patterns directing motivation and perception of individuals are some
characterstics a person in the community is derived by, through which his behavior is
observed.

25
Bio-physical factors: the present and changing conditions of the natural and physical
environments that production of small ruminants require for example feed resources, water
availability, biodiversity of the locality all could affect the adoption decision behaviour of
agropastoralists.
This study assumes that the factors mentioned above have interplay with the agropastoralists’
and pastoralists’ decision on adoption of small ruminants’ fattening package. Based on this
assumption, the conceptual framework of the study is presented below.
Figure 1. Diagrammatic presentation of conceptual framework of the study
Socio-economic characteristics:
Institutional Variables
Biophysical factors: feed and water
ADOPTION OF
FATTENING
PACKAGE Socio-cultural and socio psychological variables
Individual behavior: attitude,
perception, achievement
needs and motivation
Personal/demographic characteristics:

26
3. RESEARCH METHODOLOGY
3.1. Description of the Study Area
Meiso is located 300 km east of Addis Ababa at about 200 km east of the Oromiya regional
state capital of Nazreth. It is located west of Somali region and is one of weredas in Oromia
where there are pastoralist farming system is practiced. Meiso is located east of Doba, north of
Chiro & Guba Koricha, northeast of Anchara weredas; and northwest of Somali and south and
southwest of Afar regions. The wereda has a total number of 37 Peasant Associations and 4
town dwellers associations.
According to the recent wereda population report, 143,228 is the total population of the
wereda. The total number of agricultural households is 22, 012, while the urban households
are 6,785. The town dwellers are scattered in four small towns including the wereda town. Of
the total rural households, 17,495 are male and 4517 (20%) are female households. The total
rural population is 115,568, out of which, 58,612 are male and 56,958 (49%) are female
.Geographically, the wereda is located between 40o9”30.1’ W and 40o56”44’ E; and:
9o19”52’N and 8o48”12 N. Altitudinally, the wereda ranges from 1107 to 3106 m.a.s.l., but
most of the wereda is found at about 1700 m.a.s.l.
The mean annual temperature is around 21oc, while average annual rainfall is between 635 and
945 mm. There are 5 zones in Meiso, which have between 4-11 PAs each. The 29 PAs
belonging to this farming system are scattered in 4 zones. From within these 4 zones, some
PAs are also classified into the other farming system. There are 8 PAs that belong to pastoral
farming system. Twenty nine out of the 37 PAs belong to agropastoral farming system.
Farm households in this farming system are 18,336 (83%) with a total population of about
96,651 people. The total cultivated land (annual and perennial) in this farming system is
estimated at 21,877 ha. The total area under this farming system is about 145,864 ha. The
average land holding (cultivable land) in this farming system is 1.2 ha per household.

27
However, the proportion of average total land to total rural households in this farming system
is, 1.5 ha. Due to population pressure, people are forced to convert natural grazing lands into
crop lands and this is substantially affecting livestock productivity. Livestock products are
generally limited and expensive. During the periods of high feed availability, which is mainly
during crop harvest and crop weeding periods, the livestock body conditions become good and
sale of livestock earns a reasonably good income.
Figure 2. Map of the study area
N
EW
S
Oromiya RegionMiesso Wereda
Legend

28
3.2. Sampling design techniques and procedures
A purposive sampling design was employed in selecting survey sites, to include both
agropastoralists adoption behavior. The agropastoralists were assumed to use more of small
ruminants fattening package than the pastoralists. Sample size was determined to be 160, of
which 100 respondents were adopters and 60 respondents in the non adopters group. Meiso
wereda is broadly divided into agropastoral and pastoral production system. Site selection was
in accordance with the existing production system, four PAs were used in the primary data
collection process. Among the PAs, three agropastoral and one pastoral PA were selected
using relevant criteria. Three of these survey sites are agropastoral while one is pastoral PA so
that samples would represent the whole wereda.
The sampling frame for the study was prepared for adopters and non adopters from WBRDP
and NGOs record list of several years. Adopters were sampled from a list prepared
independently from WBRDP records for five years in various activities specifically related
with small ruminant rearing. A complete list of all kind of extension service participants was
prepared by the researcher to capture the full package components users in the village
(extension services-agricultural education, training, demonstration, farm visit participants list,
fodder and forage plant seed distribution list, supplemental feeds distribution list, veterinary
service records) from the office to proportionately sample the adopters. Non adopters list were
also prepared from the PAs council office through DAs working in each PA. Non adopters
were sampled again proportionately to their PAs household size excluding the adopters in each
PA already sampled from the list. All the samples were taken using simple random sampling
technique proportional to their size.
However, the final sample size was 151. Two out of 100 adopter respondents and seven out of
60 non adopter respondents could not respond due to imprisonment, relocation from the
village and few also had already started to migrate with their flocks in search of feed to
rangelands during the survey period. A replacement for these missing sample respondents was
not done for unavoidable reasons such as insecurity, time shortage, and resource/transportation
and facility constraints.

29
3.3. Data requirements, sources and methods of data collection
Both primary and secondary sources were used to obtain qualitative and quantitative data.
Data that were generated from interview schedule and secondary sources covered households’
demographic characteristics, institutional settings like extension system, market and prices,
participations in informal and formal organizations, trainings delivered by GOs and NGOs,
economic status, socio-psychological aspects like perception, attitude and knowledge of the
respondents, the bio-physical resources such as feeds, range lands and water in connection
with the fattening enterprise.
Qualitative data collection methods were also employed to supplement and elaborate on
marketing and cooperative, gender and small ruminant practices’ management and informal
information source and communication sharing issues. The qualitative methods of data
collection used in the study include focus group discussions among adopters and non adopters,
informal discussions with females and village elders, transect walk and observation in the
village.
Before administering actual interview schedule general observation of the wereda, informal
discussions with the agropastoralists, transect walks in most of the PAs during three weeks of
first survey period and pilot study were undertaken. The pilot study was done in 3 PAs which
were not used for actual survey but these PAs were adjacent and have similar characteristics
with PAs selected for the survey so that comparison of information obtained is reliable and
informative. The number of samples used for pilot study was 20 and was selected randomly.
The purpose of the pilot study was to refine the interview schedule, delete ambiguous
questions and add more relevant items. Cross checking the survey interview schedule with
secondary sources, personal observations and focus group discussion information were made.
Data entry was done using SPSS version12 software, after coding, tabulation and cleaning the
data collected through the survey.
30
3.4. Methods of Data Analysis and Econometric Model Used
The data was analysed using descriptive statistics and application of econometric model, to
answer the research questions.
3.4.1 Descriptive Statistics
Descriptive statistical analysis methods were employed to discuss the result of survey using
central measures and measure of dispersions, frequency, mean, average, variances,
percentages, besides mean comparisons of independent samples and relation of sample
category with variables in questions. The t-test and 2χ -tests help to see the presence of
stastically significant differences or systematic association respectively, between those who
adopt and those who do not in terms of some hypothesized variables. Descriptive statistics in
such a way give some insight about the characteristics of sampled units for the survey study.
3.4.2. Perception and Attitude Analysis Method
Agropastoralists’ liking or disliking of small ruminant fattening package is the result of their
own evaluative perception. Perception was measured using a scale with items developed for
the purpose of this study. Attitude responses of sample respondents on small ruminant
fattening package were collected following five point Likert type attitude scale. Positive
statements were rated 5 to 1 (strongly agree to strongly disagree) and scoring pattern was
reversed for negative statements. Then the total attitude score was worked out for each
respondent. A sum of all responses for a respondent becomes a total score which is suitable for
analysis using t-test and measure of dispersion to characterize the sample respondents.

31
3.4.3. Tobit model
3.4.3.1. Data requirements and justification
The fattening package which has been extended in the wereda constituted three components
for the last five or more years WBPRD (2006). This study focuses on cumulative adoption of
the package contents, viz; feed components (lablab, cajanus cajan, pellete, MUB, cereals bran,
salt) utilization of veterinary services and management practices of small ruminant rearing.
The cumulative score of feed adoption was computed by giving a value of 1-5 for frequency of
using each feed item. Score 1 is if the response is ‘not at all’ and 5 for the response of ‘using
all the feed item regularly’ and similarly 2, 3 and 4 are used to denote ‘rarely’, ‘sometimes’
and ‘regularly some’ respectively. When adoption score is computed using these values for all
observations, a score value of 3 is the lowest and 15 is the highest. Accordingly the score
values were used to determine the adopters and non adopters. A feed adoption score value of 3
indicates a non adopter and respondents with a feed adoption score value of 4 or more are
classified as adopters. Adoption score of vet services and management practices were
calculated employing the same procedure and the results of adoption scores finally used to
compute adoption index for the whole package.
Thus, feed component of the package was used as a distinguishing point for adopter and non
adopter categorization. Vet services utilization and management practices were difficult to use
to clearly distinguish between users and non users, because every respondent used at least one
of the recommended practices. Agropastoralists who necessarily used all the recommended
package components were considered to be adopters and those who necessarily did not use all
components of the package at a time were taken as non-adopters. Therefore, this reality led the
study to base its focus on understanding the differences among the respondents in the intensity
of adoption of fattening package and analyze its determinants.
In order to identify the intensity of adoption of new technology adoption index of individual
agropastoralists was developed with the help of the following formula: modified from Naresh
and Singh (1992) as follows:

32
∑
==⎟⎟⎠
⎞⎜⎜⎝
⎛++=
nm
ij j
ji
j
ji
j
jii MGTPADOMAX
remgtpadoscoVETADOMAX
evetadoscorFEEDADOMAX
refeedadoscoAI
,
1,1 Where:
i =1, 2, 3, …n, and n=total number of agropastoralists,
j=1, 2, 3,…m, and m=total number of major components of the fattening package
feedadoscoreji=the feed adoption score of ith farmer
FEEDADOPMAXj=the maximum score for feed practices for all sample
vetadoscore ji=the veterinary practice adoption score of ith farmer
VETADOMAXj= the maximum score for veterinary practices for all sample
mgtpadoscore ji=the management practice adoption of ith farmer
MGTPADOMAXj= the maximum score for feed practices for all sample
Using the above adoption index formula the following adopters groups were found to score an
adoption index score value from 0.94 – 2.54 and therefore adopters’ group were formed based
on adoption index value (appendix Table 2)
3.4.3.2. Econometric Analysis
In principle, the decisions on whether to adopt and how much to adopt can be made jointly or
separately. The Tobit model was used to analyse under the assumption that the two decisions
are affected by the same set of factors (Greene, 1997).The standard tobit model assumes,
among other things, that the dependent variable is censored at zero. The standard tobit
specification is inappropriate if no censoring has occurred or if censoring has occurred both
not at zero( Greene, 2005).There is a cluster of HHs with an index value below 1.47 adoption
index which can be censored to zero level for tobit model analysis. The tobit model also called
a censored regression model because it is possible to view the problem where observations of
the latent variable at or below zero are censored (Johnston and Dinardo, 1997).
Tobit model was employed to see the intensity of adoption of the package in the village.
According to Gujarati (1995) this model helps to examine the factors affecting adoption and
intensity of use after the practice is adopted simultaneously. The Tobit model, therefore
measures not only the probability that a farmer will adopt the new practice but also the
intensity of use once it is adopted or of the introduced technology. Therefore a direct

33
application of the Tobit estimation sufficiently provides the needed information on the
probability and intensity of adoption of fattening package.
Following Maddalla (1992), the Tobit model can be defined as
Yi =Yi*, if Yi>0, ( Yi*= BiXi+Ui)----------------------------------------------------------- (1)
Yi =0, otherwise i= (1, 2…)
Where: Yi is the observed dependent variable
Yi* is the latent variable which is not observable
Xi is a vector of factor or explanatory variable affecting use of fattening package
Bi= a vector of unknown parameter KXi matrix of the parameter to be examined
Ui, is an independently and normal distribution error term with mean zero and constant
variable.
Note that the threshold value in the above model is zero. This is not a restrictive assumption,
because the threshold value can be set to zero or assumed to be any known or unknown value
(Amemiya, 1985).
The model parameter are estimated by maximizing the tobit likelihood function of the
following Maddalla (1992)
L=⎟⎠⎞
⎜⎝⎛ −Π⎟
⎠⎞
⎜⎝⎛ −
Π≤> δ
βδβ
δii
Y
iii
Y
XF
XYf
Ii 00 **
1
--------------------------------- (2)
Where : f and F are, the density function and cumulative distribution function of Yi*
respectively, 0
*>iY
means the product over those i for which 0
*>iY
, and 0
*≤IY
means the product over those i for which 0*
≤IY
LIMDEP statistical software was employed to run the Tobit model. It may not be sensible to
interpret the coefficients of a Tobit in the same way as one interprets coefficients in an
uncensored linear model (Johnston and Dinardo, 1997) hence one has to compute the
derivatives of the estimated Tobit model to predict the effects of changes in the exogenous

34
variables Maddalla (1992) , Johnston and Dinardo (1997) and Nkonya et al (1997) proposed
the following methods to decompose the effects of explanatory variables into the decision to
use and intensity effects.
Thus a change in X (explanatory variables) has two effects. It affects the conditional mean of
Yi* in the positive part of the distribution, and it affects the probability that the observation
will fall in the part of the distribution similar approach was used in this study. In the Tobit
model, though, there are three different conditional means: those of the latent variable Y*, the
observed dependent variable Y and the uncensored observed dependent variable Y\Y>0.
Accordingly interpretation depends on whether one is concerned with the marginal effects of x
on Y*, Y and Y\Y>0. The three marginal effect expressions are derived using standard results
on moments of truncated /censored normal distributions
1. The Marginal effect of an explanatory variable on the expected value of (mean proportion)
the dependent variable is
( ) ( )
( )i
ii X
YzF
∂Ε∂
=β------------------------------------------------------------(2)
( ) β=∂
Ε∂x
xY *
-----------------------------------------------------------(3)
Where, δβ ii X
is denoted by z, following Maddalla, (1997)
The purpose of Tobit is to analyze, in the context of identifying the factors that explain
variation in the use of technology. As Maddalla (1983) stated if the parameter estimates for
entire population of agropastoralistsare required, it will be necessary to compute adjusted
estimates that effectively scale the Tobit parameters by the probability of observation falling
in the censored sample. The adjusted estimates are the margin effects of explanatory variables
of the expected value of the dependent variable and given by
Ii
i BZFsX
YsE)(
)(=
----------------------------------------------------------------------------------------(4)

35
2. The Tobit specification allows us to analyze level use practice. The total elasticity in eq.4
can be decomposed into two effects
sXizsFYiE
sXiYisEzF
sXiYisE )()()()()( *
*
+⎟⎟⎠
⎞⎜⎜⎝
⎛=
------------------------------------------------------------(5)
Multiplying by )(YiEXin =
and rearranging gives the following elasticity forms of whether or
not the technology is adopted and the conditional level
)()())(
*YinEznf
sXiYisE
n+=
-----------------------------------------------------------------------(6)
The change in the probability of using fattening package as independent variable Xi changes
(the probability of change among non adopters) is:
( )( ) ( )
δβ i
i
zfX
zF=
∂∂
----------------------------------------------------------------------(7)
3. the expected value of adoption intensity use improved fattening package across all
observations was estimated as
/)()()( zafZXBFYE i += ------------------------------------------------------------------------------(8)
Where : aXBZ =
,
Similarly the expected value of intensity of use is estimated by
)()(0
ZFZafXB
YY
Ei
i +=⎟⎟
⎠
⎞⎜⎜⎝
⎛>
-------------------------------------------------------------------------------(9)
Where:
Yi* the latent dependent variable which is not observable.
f(Z) is the cumulative distribution function
f(z)is the value of derivative of the normal curve at a given point

36
z is the Z-score for the area under normal curve
B is a vector of Tobit maximum likelihood estimates and
™, is the standard deviation.
Where as the change in the intensity of use with respect to a unit change in an explanatory
variable among users is could be
( )( )
( )( ) ⎥
⎥⎦
⎤
⎢⎢⎣
⎡⎟⎟⎠
⎞⎜⎜⎝
⎛−−=
∂
⎟⎟⎠
⎞⎜⎜⎝
⎛>Ε∂ 2
10
zFzf
zFzzf
XYY
ii
i
i
β---------------------------------------------(10)
Where:
( )zf = is the value of the derivatives of the normal curve at a given point (unit normal density)
( )zF = is the cumulative normal distribution of z
z= is the z score for the area under the normal curve,
β = is a vector of Tobit maximum likelihood estimates and
δ = is the standard error of the error term
Similarly the expected value of intensity of use is estimated by Variables selected from
literature, and checked for the existence of multicollinearity among the continuous variables
and verify the degree of associations among discrete variables. VIF were computed to detect
multicollinearity for continous explanatory variables and contingency coefficient was also
tested.
Explanatory variables that could significantly fit to the tobit model were selected after
correlations, t-tests, multicollinaerity tests (VIF) for continous explanatory variables and χ 2
and contingency coefficients tests at different level of significance for dummy or categorical
ones tested.
VIF (Xi) = ⎟⎟⎠
⎞⎜⎜⎝
⎛
− 211
iR

37
Ri 2 i is multiple correlation coefficients between Xi and other explanatory variables
Ri 2 is constructed for each case. The larger the Ri
2 the higher the value of VIF (Xi) causing
the higher collinearity in the variable (Xi). If VIF is 10 and above, the variables are said to be
collinear. If Ri 2 is 1, it would result higher VIF and causes perfect multicollinearity between
variables.
Where as for dummy variables, according to Heldy (1984), if the value of contingency
coefficient (CC) greater than 0.75, the variable is said to be collinear
C.C = 2
2
XnX+
Where: C.C is contingency coefficient
n is sample size
χ 2 is the chi-square value of a variable
The ML method is used to examine the parameter of the model and multicollinearity test is
used to separate effect of independent variables on the dependent variable to measure
independent variables the strength of their relationship.Using the stastical and econometric
models described above the research will interpret the results.

38
3.4.4. Definitions of Variables
Dependent Variable
Adoption index of small ruminants fattening package is the dependent variable in this study.
Adoption index as a continuous dependent variable is used to see the proportion or extent of
fattening package adoption.
Independent variables: The observed adoption and extent of use choice of agricultural
technology is hypothesized to be the end result of a complex set of inter-technology references
and comparisons made by agropastoralists. The decision to adopt is derived from better
physical yield, profitability, availability and riskiness of a technology component is a function
of the agro climatic and socio economic and institutional environment. Based on the various
studies of adoption, it is hypothesized that a farmer’s decision to use a given technology is
influenced by the demographic and personal characteristics of the household head, the
household resource endowments and institutional support systems. The following are the
independent variables assumed to determine adoption behavior of agropastoralists in the
wereda.
Demographic characteristics and economic variables;
Age of household head
Age is assumed to relate with socio-cultural roles in the study area besides its relation with
experience of small ruminant rearing. Age in a traditional society is an important indicator of
one’s position in his/her society. Older agropastoralists are deeply accustomed with the
traditional ways of rearing than younger agropastoralists. In this study, age is measured in
number of years and hence is a continuous variable. Age in this study is hypothesized to be
negatively related with the extent of use of small ruminant fattening package.

39
Family size
Small ruminant rearing needs more time and labour for keeping goats and sheep in the grazing
lands and watering points. Most small ruminant management practices are easily done by any
family member irrespective of the assumption of economically active labour availability in a
HH. Small children and oldest family members could equally contribute to household labor
requirement in small ruminant management. The family size is therefore a very important
factor that determines household’s decision in the extent of use of the small ruminant fattening
package. Family size takes a continuous value measured in number of family size in the
households. Thus, it is hypothesized to have positive influence on the extent of use, decision
regardless of the availability of economically active labour force in HHs.
Level of education
Level of education of HHs is assumed to increase the ability to obtain, process, and use
information relevant to the adoption of fattening package. The educational level of the
respondents ranges from zero to more than eighth grade and it is a continuous. Education is
assumed to have direct and positive influence on intensity of adoption of the fattening
package.
Farm size
The HHs total land size was measured in terms of productive land area in hectare (ha) and is
continuous variable. Large land size will encourage growing of feed species given to
agropastoralists and they have more grazing land of their own than the average grazing land
shortly after crop harvest. The larger the farm land holding of the HHs, the more probable the
household will be adopter and intensive user of the fattening packages in the area.

40
Number of livestock units (TLU)
Tropical livestock unit (TLU) takes a continuous value and is calculated as prescribed by
strock et al (1991). Accordingly 1 TLU is equivalent to 1 camel, 1.43 cattle, 10 sheep/goats,
1.25 horse/mules and 2 donkeys. The number and kind of livestock species of HHs in the
village is proxy indicator for their wealth status, and this TLU is an important decision factor
for the HHs to take risk by accepting and continuing to use new innovations. Thus, it is
expected that the higher TLU value of HHs, the more intensive user he will be of the fattening
package extended.
HHs income (off and non farm income and on farm income)
The total income of the household was calculated from the sale value of crop and livestock
produced and also income derived from non and off farm activities during the last production
year, which was taken as a continuous variable measured in Birr. Income is one factor that
make rural HHHs risk takers in extent of adoption decisions. HHHs seek to increase their
income level in situations where demand and market for their produce is high. When a
technology package which require high capital is extended, a higher income level HHHs could
make use of this technology package. Thus, income is hypothesized to influence extent of
adoption. The higher the income level the HHHs, the more probable to use the fattening
package more intensively than HHHs with less income level.
Type of house owned The type of a house owned by the agropastoralists’ is another proxy indicator of the HHs
wealth status. Corrugated iron roof with portioned room house type is a dummy variable and
was measured 1, if the HHs owns it and 0, otherwise. Type of house owned is related with the
housing management practice of small ruminant rearing in that if the HHs own house with
partition, the HHHs may use part or one partition of the house may be used to shelter and keep
the small ruminants separately. The type of house owned also shows the economic status that
agropastoralists’ capacity to invest in separate housing for their small ruminants. Therefore,
the type of house owned is assumed to influence adoption and extent of use decision of the
agropastoralists.

41
Small ruminants rearing experience
This refers to the total number of years the respondent had spent in rearing goats and/or sheep
in the wereda. The longer the goat and sheep rearing experiences s/he has, the more s/he
would understand the efficiency and production problem for a number of years. Small
ruminant rearing experience would then indirectly affect the decision of agropastoralists over
the intensity of package use, and it might be positively related to their decisions. The longer
the agropastoralist and pastoralist have experiences in rearing small ruminants the more they
will be adopters of the fattening package.
Current Management practices score
How far the current small ruminant management practices of agropastoralists are in line with
improved fattening package management practice recommendations need to be known. The
current management practices of agropastoralists are taken into consideration and compared
with recommendable small ruminants’ management practices. The current management
practices score is a continuous variable. Therefore, it is hypothesized that current management
practices influence the decision to use intensively small ruminant fattening package.
Knowledge about the fattening package
Technological progress arises as a result of knowledge sharing and application. However, if a
potential adopter faces uncertainty about the outcome, there is a trend not to adopt because of
direct loss if the innovation fails as well as the loss of the adopter’s network, since everyone
else will continue to use the old technology. Knowledge score is calculated from all aspect of
fattening package. By asking HHHs to name at least few critically important feed, health and
management practices to be evaluated on student type of knowledge assessment, and the score
is continuous variable. The presence of traditional fattening knowledge of the HHHs,
awareness and knowledge of the improved technology with implementation skills would affect
adoption and intensity use decision of the package. Knowledge on the fattening package is
expected to positively affect adoption and use decision.

42
Frequency of radio use
Frequency of use of radio is assumed to help the farmer in getting upto date agricultural
information and technologies, which influences the decision making processes in technology
adoption and its extent of use. The frequency of listening to agricultural radio programs was
measured categorically, 1= never listened, 2=rarely listen, 3=sometimes, 4=most of the time
and 5=always/regularly listen agricultural programs. Frequency of agricultural radio listening
is hypothesized to influence adoption and extent of use decision positively and significantly.
Contact with extension agents
This refers to frequency of contact between the extension agents and the farmer. The more
frequent the contact between extension agent and farmer for dissemination of knowledge, the
more the agropastoralists are exposed to information of fattening package and the more likely
they are to be influenced in using the fattening package. It is an ordinal variable with values: 1
= never, 2 = once in three months time, 3 = once in a month, 4 = once in two weeks and 5 =
once in a week. Frequency of contact with extension agent is assumed to increase the adoption
and extent of use of fattening package positively and directly.
Training
Training is one of the most common extension methods used to transfer information,
knowledge, and skills for improving the management practices of agropastoralists by the
extension services. Training is a dummy variable and takes the value of 1 if the farmer has
taken training and 0, otherwise. It is assumed that the more the training provided by the
extension agent to the agropastoralists, the higher is the probability that agropastoralists adopt
the technologies delivered to them.
Use of micro credit
Access to credit will increase agropastoralists’ capacity to buy inputs and risk taking
decisions. Agropastoralists’ access to small ruminant fattening package credit is hypothesized

43
to influence adoption and use of fattening package decisions. It is a dummy variable having
one if have access and zero, otherwise.
Market information of households
Market information of household heads implies agropastoralists’ access to price information
on both input and fattened goats and sheep in the near and big markets. Market information is
accessible only if the farmer is closer to the market place physically, is capable to go to market
frequently or he has other sources to provide market information. Thus having market
information is hypothesized to influence adoption decision positively. Market information is
measured as dummy variable, 1 if the HHHs have access to market information and 0,
otherwise.
Distance to market
Physical access to market determines the frequency HHHs going to local markets. This
physical access to market is affected by the distance of the market place, infrastructure
available (all weather roads) and access to transportation facilities. Distance of a market place
from the HHHs’ home is measured in hours taken to reach the nearest market place and hence
it is continuous variable. The distance to market of HHHs has negative and significant
influence on adoption decisions. The longer the time taken to reach to local market, the lesser
intensity of the HHHs adopt fattening package in the study area.
Distance to input market
Availability of input for fattening is very important in small ruminants rearing. However,
required inputs may not be available in accessible local markets and therefore agropastoralists
who are really interested in fattening small ruminants have to look for necessary inputs
wherever they might be available. Distance to input market is a continuous variable measured
in number of hours taken to reach input market for the HHHs from their home. The market
accessibility of agropastoralists is determined by availability of all weather roads,
44
transportation access. Nearness and availability of input in the market facilitate the adoption
rates and intensive use of fattening package and hence intensity of adoption decision would be
significantly and positively related with input market.
Distance feed resources
Water and feed resources availability near to one’s surroundings is the most important
biophysical element. Agropastoralists’ perception of their access and availability of resources
needed for fattening small ruminants affect their adoption decision of the fattening package.
The distance of the households from source of the resources is continuous variable measured
in numbers of hours taken to reach the source. The longer the time taken to reach to the
sources, the higher the probability the HHHs decide to let his or her small ruminants to graze
by their own and thus, the lesser the probability the HHHs use stall management practices.
Therefore, distance to feed resources influence extent of fattening package adoption.
Distance to water sources
The distance from the water sources to agropastoralists’ home affect the frequency, and
amount of water fetched to home for consumption and livestock use. Thus, the more the
distance of water source from home, the less the frequency and amount of water used in the
household and therefore, the less probable the HHs use water to small ruminant fattening. The
distance of water source from the home is measured in number of hours taken to reach to these
sources.
Risk orientation
Risk orientation of the household is influenced by the level of wealth and economic goal of the
HHHs. Agropastoralists may have fear associated with either crop or livestock production
technologies choice and the degree of risk aversion or risk taking decision between individual
in choosing crop production or livestock specialization is not the same. Risk orientation of the
HHHs in small ruminant rearing as compared to other livestock species rearing differs from

45
individual to individual. Risk orientation was measured as dummy variable having a value of
one if the respondent is a ready to take a risk related with small ruminant rearing and zero,
otherwise. The more risk avert the household is, the less adopter of the fattening package he
would be and vice versa.
Perception
The perception of agropastoralists on each component of the package was taken to be
continuous and measured in a range, from 1 to 5 scale values. Perception about a technology
directly influences adoption of a technology at HHs level. HHs have different perception on
the same technology and this might affect intensity of use of the small ruminants fattening
package.
Attitude of small ruminant producers towards the fattening package
Attitude measures the degree of liking or disliking of individual towards an object, idea or
practice. The level of attitude towards the fattening package was measured using total attitude
score of the agropastoralists and thus it becomes continuous. The agropastoralists’ attitude
towards newly introduced technologies and improved practices is either positive or negative
and it would have significant role in adoption decision of fattening package. It was
hypothesized that the favourableness of the attitude of the respondents will have positive and
significant influence on adoption decisions.
Perception of Technology attributes
Each innovation /technology has its own attributes about which agropastoralists have their
own perception with regard to advantage, disadvantage, purpose, difficulty, cost and benefit.
Suitability of improved management techniques, feed characteristics, and vet and health
services evaluative perception of agropastoralists affect the intensity use of fattening package.
Therefore, a perception on fattening package suitability to small ruminants’ production by
sample respondents is assumed to be associated with technology attributes influencing
decision about fattening package adoption. Technology specific variables are measured using

46
perception of agropastoralists on each package component based on scale level 1= very much
true, 2= sometimes true, 3= undecided, 4= mostly incorrect and 5= not at all.
Social security Agropastoral and pastoral areas are typical areas where conflicts arise because of competition
for scarce resources. Instability and insecurity among villagers might be commonly
encountered. Villagers could, therefore be influenced by these feelings in intensity of adoption
decision of fattening package. Feeling of security in ones’ surrounding directly influences his
decision to invest on improved goats and sheep rearing practices and technologies. This
insecurity can be captured through perception of individuals on their surrounding security. It is
a dummy variable, if the agropastoralists feel secure is 1 and 0 otherwise. Therefore, it is
hypothesized that feeling security about one’s surrounding might positively or negatively
influence the extent of fattening package adoption.
Social Participation
Social participation refers to the level of involvement of a farmer in the local formal and
informal organizations. Participation in these social organizations could be at different levels
(membership, committee membership and leadership) and frequency of participation in social
organizations’ activities. Social Participation at different levels is a dummy variable as
one=participated or 0 =not participated while the frequency of social participation in these
organizations is measured ordinally and the values are: 1= never, 2= sometimes, 3= participate
when participation is needed. Generally, the more agropastoralists are involved in social
organizations’ meetings and activities, the more they will access new information and the
more s/he will easily develop positive attitude towards the fattening package. As a result
participation is hypothesized to positively affect the extent of adoption.

47
4. RESULTS AND DISCUSSION
The study was conducted in agropastoral and pastoral production system. Adoption behaviour
of sample respondents and their evaluations of institutional support of extension services
discussed in this chapter. Descriptive statistics, frequency, tables, mean comparisons of
adopters and non-adopters for their differences in their characteristic explanatory variables and
significance levels of the difference are discussed. Tobit model was the main econometric
analysis tool employed to see the intensity of adoption among adopters.
4.1. Agropastoralists Assessments on Small Ruminants’ Fattening Package Extension Services
4.1.1. Agricultural Extension Services
Awareness creation is very important in any adoption process. A villager who is merely being
aware of presence of extension services does not necessarily mean s/he uses all information,
knowledge and services from the extension agents. Rather the value given to the extension
services or extension agents’ information and knowledge about a small ruminant fattening
package by the villager might be more important. Therefore, extension agents’ influence
through information about new techniques or innovations will have differential impact on
individual farmer’s adoption and effective use of information about technologies and
extension package. Knowledge and communication are viewed as playing key roles in this
participatory process. The basic premise of the “innovation diffusion model” is that access to
information is the principal factor influencing the decision to participate or not (Rogers and
Shoemaker, 1971). Table below presents agropastoralists awareness for the existence of small
ruminants’ extension services in their wereda.

48
Table 1. Sample respondents’ distribution of awareness of small ruminant extension services
Adopters Non Adopters Responses for awareness of small ruminant extension services N % N %
χ 2
Yes No
60 38
61.2 38.8
12 41
22.64 77.36
4.016**
Source: own survey, 2007 ** Significant at 5 % level
Among the respondents, 61.2 % of adopters and 22.64 % non adopters were aware of the
existence of small ruminant extension package, while 38.8 % of adopters and 77.36% of non
adopters confirmed that they were not aware of extension services. It was also seen in this
study, there existed statically significant differences between adopters and non adopters in
their being aware of small ruminant extension services in the wereda (Table 1) this finding is
in line with (Marsh et al. 2000). During informal group discussion, agropastoralists asked the
extensions services a lot of information related with small ruminants’ production. Awareness
level of small ruminants’ extension services of adopters is better than non adopters. Adopters
have better exposure to extension agents and services and thus, would give higher value and
recognition to the extension services. Therefore adopters are far more ready to seek new
knowledge and information on technologies from the extension services as they are aware of
small ruminant extension services in the wereda.
4.1.2. Information Sources of Sample Respondents
Agropastoralists are expected to seek various sources of information on several matters for
solving production problems and increasing productivity. Nowak (1987) has concluded that
multiple sources of information with “credibility” are more likely to promote participation in
new farming practices. A number of information sources are at agropastoralists’ and
pastoralists’ disposal and choosing one or more of these sources is the farmer’s decision, in
consideration of pros and cons of his/her choice of information source. In this study, it was
found that there was significant association between sources of information sought and
intensity of adoption decision of sample respondents.

49
Table 2. Source of information about SR fattening package of sample respondents
Adopters Non Adopters source of information about SR fattening % N N % χ 2 1. 2. 3. 4. 5.
Extension agent Fellow farmer Researchers More than one source of information Total
21.42 15.31 1.02 62.33 100
60 22 15 1 98
34 20.72 0 45.28 100
17 11 0 24 53
6.29 ( ns)
Source: from own survey, 2007 NS= non significant
Respondent were asked to rank the most frequent information sources they seek and the result
of this study indicates that 62.33 % of adopters and 45.3 % of non adopters sought more than
one information sources (extension agents, fellow farmers, or other sources) about 20.72%
non adopters and 15.31% adopters were seeking their fellow agropastoralists as their
information sources, extension agents are sought as single information source by 21.42 % of
adopters and 34 % of non adopters and only 1.02 % of adopters are found to see researchers as
their information sources. The same result shows there was no statistically significant
difference between adopters and non adopters in seeking information sources. This is may be
because of the suscipicious and/or reliable information seeking behaviour of rural people on
information obtained from outside sources (Table 2).
4.1.3. Extension Messages
The wereda extension services cover many aspects of agricultural messages (Table 3) the
office report. These services are structured under different departments of the bureau and
agropastoralists receive these different types of messages through a single extension agent.
Table 5 shows that adopters are more aware than non adopters about feed, health, home
economics, land use practices, other agricultural technologies extension messages in
percentage terms but it was found that these access to extension messages are not stastically
significant (Table 3). These messages are prepared by experts as part of routine tasks without
the consideration of the need and interest of agropastoralists. Sample respondents’ focus group

50
discussion reveal that, agropastoralists have many recurrent problems especially in feed,
health, and management practices of small ruminants and need to know and adopt improved
management and technologies in small ruminant production . Contrantrary to the need and
interest of sample respondents, messages are prepared by wereda experts to fulfill the quarter
plans which are transferred to extension agents in top down manner. The messages are general
in their contents and most of the time untimely delivery of information results as it is not in
line with the context. Therefore even adopters could not use of these most of these messages
significantly.
4.1.4. Communication problems and comments of sample respondents
The existence of communication problem between the extension agent and agropastoralists in
the wereda was expected due to two main reasons- as it is discussed above messages contents
are not contextual, timely and do not consider the need and interest of agropastoralists thus it
can be said it is not well organized and the other problem is lack of basic extension and
communication skills of development agents and officers at all levels.
About 27.6 % of adopters and 28.3 % of non adopters reported that they were facing problems
(for example, sample respondents’ needs and interests are not considered at all when extension
messages are prepared. water is the most important resources they need but messages and
information on water use is not considered well by the extension agents’ and the same is true
with feed, animal health technologies and services thereby extension communication problems
arise as a result of mismatch between messages by extension agents and needs and interest of
agropastoralists). While 72.4 % of adopters and 71.7 % non adopters said that they did not
have any communication problem. This is may be because of the basic communication
barriers between extension agents and sample respondents are reduced by language similarity
between them and extension agents lives within the village. The differences between adopters
and non adopters in experiencing communication problem with the extension agents were
found to be stastically insignificant (Table 3).
In this study, it was found that 82.7 % of adopters and 66 % of non adopters were willing to

51
give comments on small ruminant extension services and 17.3 % of adopters and 34 % of non
adopters were not ready to give any comment on the extension services (Table 3). The reason
for the non responsiveness of few respondents could be evaluation of governmental agencies
is seen as sensitive. There was significant difference between adopters and non adopters in
commenting small ruminant extension services and this is due to the exposure of adopters to
extension services more than the non adopters.
Table 3. Extension messages, communication problem experience and willingness to comment extension system
Adopters Non adopters χ 2 Types of messages, communication problem experience and willingness to com N % N %
Feeds: Yes No Animal health: Yes No Breeds: Yes No Building shelter and shed: Yes No Home economics: Yes No Technology use in agricultural production: Yes No Land use practices: Yes No Problem in communicating with extension agents: Yes No Willingess to comment on extension: Yes No
74 24 79 19 42 56 45 53 73 25 59 39 53 45 27 71 81 17
75.51 24.49 80.6 19.4 42.86 57.14 45.9 54.1 74.5 25.5 60.2 39.8 54.1 46.9 27.6 72.4 82.7 17.3
44 9 44 9 21 32 22 31 33 20 38 15 28 25 15 38 35 18
83 17 83 17 39.6 60.4 41.5 58.5 62.3 37.7 71.7 29.3 52.8 74.2 28.3 71.7 66 34
1.136 (ns) 0.132 (ns) 0.148 (ns) 0.271 (ns) 2.458 (ns) 1.978 (ns) 0.022 (ns) 0.198 (ns) 5.33**
Source: from own survey, 2007; ** Significant at 5% level, ns= non significant

52
4.1.5. Comment on current extension system in the wereda
It is becoming a more recognized fact that demand for extension services is to be more
diversified than ever before. Alex et al. (2002) and Rivera (2001) were arguing that extension
is being forced to embrace a broadened mandate or reaffirm a broad mandate that has long
existed. Agropastoralists commented on the role of agricultural extension services with regard
small ruminants production as it should be more problem focused and extension services need
to facilitate the input delivery and strengthen linkage role with agribusinesses so that input
deliveries and access of are accessible in each village. In this study, there is significant
association between commenting on currently promoted small ruminant fattening package
extension services and intensity of adoption decision (Table 4).
Table 4. Sample respondents’ comment on small ruminant fattening extension package
Adopters
Non Adopters
Comments
N %
N % χ 2
1. Widely distribute inputs like vet drugs and supplement feed
2. Diverse service is needed such as credit ,increased number of input suppliers business each village
3. They need Improved production techniques 4. Demonstrate and transfer more crop
technologies 5. The extension services is good for fattening
small ruminants
22 37 3 33 3
22.44 37.8 3.06 33.68 3.06
13 10 4 16 10
24.5 18.9 7.5 30.14 18.9
16.874***
Source: from own survey, 2007 *** Significant at 1% level
The distribution Table shows that 22.44 % of adopters and 24.5 % of non adopters need the
extension system to deliver them more vet drugs and supplement feeds, 37.8 % of adopters
and 18.9 % non adopters want the extension system to provide production credits and
strengthen input suppliers in the wereda , 3.06 % of adopters and 7.5 % of non adopters desire
that extension should give more of its efforts to information dissemination on improved

53
production techniques , a good number of both categories need the extension to transfer more
crop technologies and demonstrations (33.68% of adopters and 30.14 % non adopters ) and
only 3.06 % of adopters were satisfied with the small ruminant fattening package extension in
the wereda while 18.9 % of non adopters were saying that it is good for small ruminant
production. The study shows that the existence of statistically significant differences between
adopters and non adopters in terms of commenting the extension services (Table 4).
Box 1. Focus group discussion with five adopters and five non adopters on commenting
extension services
During focus group discussion, non adopters gave explanation for their non adoption of
fattening package. Most of them appreciate the fattening package but due to lack of labor in
the HHs there is a problem- taking small ruminants to vet clinics and providing feed and water
as required, and also lesser land holding forces them to focus on production of only high
yielding cereals which has no good feed value (forage) to their small ruminants and some of
the adopters explained the need to access more services than just small ruminant fattening
packages. They reason out that they are already doing fattening practices; therefore they wish
to know how to improve their production activities.
4.1.6. Extension Methods
Agropastoralists’ opinion on the importance of extension methods were considered for
evaluation. Importance of extension methods in terms of changing attitude, means of
information transfer and improving social interaction being the criteria for evaluating the
methods and approaches of extension services by sample respondents. The percentage
distribution of adopters and non adopters, in Table 5 shows, distribution of different extension
methods considered to be appropriate and important in their opinion.
The significance level associated with each type of extension method shows that the
differences between adopters and non adopters in perceiving the importance of extension

54
methods for different purposes were not much significant, except demonstration methods
which was considered to be important by a number of adopters than non adopters implying
that adopters more strongly believe that demonstration is more important than the other types
of extension methods because demonstration is practical teaching on different package
components and also fits ones’ context . The majority of sample respondents were found to be
non responsive for the questions they were posed to evaluate the importance of different
extension methods they had experienced. This is because the majority of sample respondents
were having few numbers of experiences of participation in the different extension methods.
Therefore, sample respondents can not make comparisons of advantages and disadvantages of
among these different extension methods.

55
Table 5 Distribution of different extension methods importance as evaluated by sample respondents
Opinions No response Changing attitude Social development
Information about fattening package
Improved crop varieties and techniques χ 2
As NAs As NAs As NAs As NAs As NA s
S.No Extension methods N % N % N % N % N % N % N % N % N % N %
1 Importance of training 59 60 36 68 8 8.2 2 4 9 9 9 17 19 19.4 4 7.5 3 3.1 2 3.8 6.300
(ns)
2 Importance of field days 82 84 47 88. 8 2 2 3 6 4 4 2 3.8 8 8.91 1 1.9 0 0 0 0 4.198
(ns)
3 Importance of demonstrations 85 87 49 92.5 2 2 3 6 3 3 0 0 6 6 0 0 0 0 1 1.9 8.129*
4 Importance of visit 84 86 49 92.5 0 0 1 2 3 3 1 1.9 4 4.1 1 1.9 5 5 0 0 7.167
(ns)
5 Importance of public meeting 51 52 20 38 9 9.2 1 2 23 23 5 9.4 8 8.2 6 11.3 4 4 2 3.8 8.806
(ns) Source: from own survey, 2007 *Significant at 10 % level and ns=non significant

56
4.1.7. Response on the Kinds of Training Received
In contrary to findings from report review, sample respondents were found not to be involved
much of in the reported training sessions. About 66.9 % of the total sample reported that they
never participated in any kind of trainings. Crop production related trainings were actually
received by 6.6 %, animal production related trainings were delivered to 19.9 %, natural
resources related trainings received by 0.6 % while 6 %, of the total respondents got trainings
related to social, political and institutional matters. There was no difference between adopters
and non adopters in the kind of trainings they received so far (Table 6)
Table 6. Response on the kinds of training received
None crop Animal Natural resources
Socio-institutional
Adopters category N % N % N % N % N % x2 Adopters Non adopters Total
63 38 101
64.3 71.7 66.9
6 4 10
6 7.5 6.6
24 6 30
24.4 11.3 19.9
1 0 1
1.02 0 0.6
4 5 9
4.04 9.4 6
6.212 (ns)
Source: from own survey, 2007 NS= non significant
More over, trainings were not prepared based on training needs assessments and hence are less
likely to meet the needs and interest of agropastoralists. Sample respondents, who received
trainings, reported that the trainings were not compatible with their needs and production
problems. Table 7 below shows that 75.5 % of adopters and 18.9 % of non adopters responded
that the trainings were compatible with their needs and problems while, the majority of the
respondents, 24.5% of adopters and 68.1% non adopters do confirm that their interest and
needs were not addressed through the trainings delivered by extension services.
Statistical test shows that there were insignificant differences between adopters and non
adopters in their response with regard to training compatibility. Some of the reasons for
training incompatibility with agropastoralists needs and interests were found to revolve around

57
non agricultural training programs and only few sample respondents participate in trainings if
they participate at all, this problem was earlier appreciated by Vanclay and Lawrence (1995 ),
poor methods of training preparation and delivery and lack of trainers’ adequate information
and preparation on the training content (personal observations and reviewed documents).
Table 7. Evaluation of sample respondents’ on training compatibility and trainers’ preparation
Adopters Non Adopters χ 2 S.No Training evaluation N % N %
1 Training compatibility Yes No Total
75 23 98
75.5 24.5 100
10 43 53
18.9 81. 6 100
0.626 (ns)
2 Trainers preparation adequacy Yes No Total
71 27 98
72.4 27.6 100
10 43 53
18.9 81.13 100
4.790*
Source: own survey, 2007 * Significant at 10 % level and ns= non significant
4.1.8. Perception of Agropastoralists on Small Ruminant Fattening Package and Extension Services
Sample respondents were presented with number of issues in the small ruminant fattening
package extension services to be evaluated based on agropastoralists’ and pastoralists’
perception. Some of the perception measurement attributes were: fattening package helps in
increasing the body size if used properly, availability of fattening input, availability of health
and veterinary service, availability of improved forage and fodder plant, perception of
fattening package in terms of demands on dedication and attention, perception of fattening
package in demanding huge investment and finally the availability of improved breed for
fattening purpose.

58
Table 8. Distribution of sample respondents’ perception on fattening package
Responses Never Not true Not sure/decisive Sometimes true Always true χ 2 As
NAs As
NAs As
NAs As
NAs As
NAs
S.No
Attributes N % N % N % N % N % N % N % N % N % N %
. Fattening package increases body weight
2
2
3 5.7 2
2
0 0 9
9.2
7 13.2 15
15.2
14 26.4 70
71.4
29 54.7 6.644 (ns)
2. Lack of input availability 2 2 1 1.9 8 8 5 9.4 13 13.3 6 11.3 47 48 20 37.8 28 28.6 21 40 2.277
(ns) . Shortage of Vet
services availability
24
24.5
11 20.8 12
12.2
6 11.3 11
11.2
6 11.3 18
18.4
6
11.3 33
33.7
24 45.3 2.535 (ns)
4. Fattening package demands attention and dedication
5
5.1
1
1.9 3
3.1
6
11.3 13
13.3
11 20.8 40
40.8
9 17 37
37.8
26
49
0.013 (ns)
5. Lack of availability of improved feed
9
9.2 11 20.8 29
29.6
17 32.1 12
12.24
22 41.5 21
21.4
9 17 17
17.3
7 13.2 4.761 (ns)
6. Fattening package needs capital
5
5.1
4
7.5 8
8.08
3 5.7 14
14.3
8 15.1 42
42.9 18 34 29 29.6 20 2.044 (ns)
7. Difficulty in availability of Improved breed
7
7.1
9
17 17
17.3
19 35.8 32
32.7
12 22.5 26
26.5
10 18.9 16
16.3
3 13.221***
Source: own survey, 2007 Significant at 10 % level and ns= non significant

59
There is no significant difference between adopters and non adopters in perception of all of the
above attributes of fattening package except the perception on availability of improved breed
for fattening purposes. The non significant differences between adopters and non adopters in
the six attributes of the Table 8 are due to the homogeneity of production system and similar
context could influence sample respondents to experience almost similar problem. But the
significant difference between adopters and non adopters in the perception of availability of
improved animal breeds (Box 2) is may be due to interest of adopters who really want to fatten
always look for the sources of better breeds at least locally available better breed.
Box 2. As one sample respondent witnessed during transect walk discussion that when he
want to rear small ruminant particularly goats he goes to a local market as far as 50 kms only
to select locally better breed, based on the body frame and condition. He called the name of
the breed by “menze”. When he plans to engage in fattening small ruminants he usually uses
selection of better breed for fattening purpose from markets in the distant places from his
home village.
4.1.9. Attitude of Agropastoralists towards Fattening Package
Attitude about extension system as well as package or part of the package determine the
intensive use of a technology and innovation in any given social setting. Individual’s attitude
is the determinant factor in the intensity of adoption decision of agricultural technologies and
innovations. The t- test of independent samples shows that there is insignificant difference
between adopters and non adopters in their attitude towards the services delivered to them on
small ruminant production aspects. The highest attitude score of adopters and non adopters are
39 each and the lowest score were 20 for adopters and 16 for non adopters respectively (Table
9).The mean attitude score of adopters and non adopters were 28.56 and 28.91 respectively out
of an obtainable potential score of 40. In this study, the relation between intensity of adoption
and attitude of sample respondents found to be insignificant (Table 9) and this is because of
highly homogenous social setting (ethnicity, production pattern, religion and social
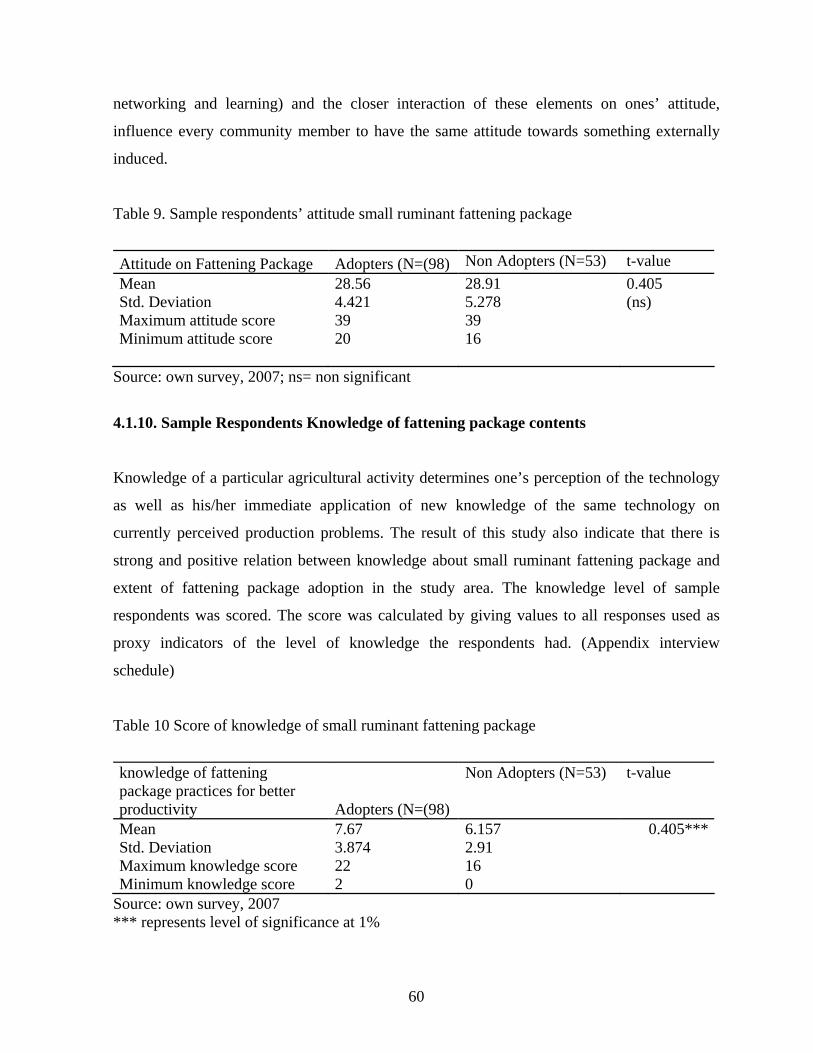
60
networking and learning) and the closer interaction of these elements on ones’ attitude,
influence every community member to have the same attitude towards something externally
induced.
Table 9. Sample respondents’ attitude small ruminant fattening package
Attitude on Fattening Package Adopters (N=(98) Non Adopters (N=53) t-value Mean Std. Deviation Maximum attitude score Minimum attitude score
28.56 4.421 39 20
28.91 5.278 39 16
0.405 (ns)
Source: own survey, 2007; ns= non significant
4.1.10. Sample Respondents Knowledge of fattening package contents
Knowledge of a particular agricultural activity determines one’s perception of the technology
as well as his/her immediate application of new knowledge of the same technology on
currently perceived production problems. The result of this study also indicate that there is
strong and positive relation between knowledge about small ruminant fattening package and
extent of fattening package adoption in the study area. The knowledge level of sample
respondents was scored. The score was calculated by giving values to all responses used as
proxy indicators of the level of knowledge the respondents had. (Appendix interview
schedule)
Table 10 Score of knowledge of small ruminant fattening package
knowledge of fattening package practices for better productivity Adopters (N=(98)
Non Adopters (N=53) t-value
Mean Std. Deviation Maximum knowledge score Minimum knowledge score
7.67 3.874 22 2
6.157 2.91 16 0
0.405***
Source: own survey, 2007 *** represents level of significance at 1%

61
In Table 10, the mean distribution score of adopters and non adopters in their level of
knowledge of small ruminants fattening package was 7.67 and 6.157 out of an obtainable
potential score of 30 with standard deviation of 3.874 and 2.91 respectively. There was
significant difference between adopters and non adopters in their level of knowledge of
fattening package. This implies that adopters in the study area are better than non adopters in
their level of knowledge about improved practices and information on the fattening package
contents in the wereda. Even then, the mean score compared to the potential score indicates
the poor statuses in terms of knowledge for both categories of respondents.
4.1.11. Informal information source use and communication
Rogers (1995) argues that when people have better access to information about a new
technology, the more extensive their social interactions would be and the greater the similarity
amongst them. Knowledgeable sources of information may be defined as when the
information obtained by an individual from his/her community group member is considered as
valuable and has significant knowledge in small ruminant production. Table 11 below presents
sample respondents knowledgeable sources of information.
Table 11. Knowledgeable Information Source of sample respondents in the Village
Adopters Non Adopters Knowledgeable Source of Information N
%
N % χ 2
1. Friends 2. Relatives 3. Elderly community members 4. Religious leaders 5. Tale 6. Youngsters 7. Others Total
7 1 37 7 1 0 0 53
13.21 1.89 69.81 13.21 1.89 0 0 100
16 2 56 18 3 2 1 98
16.67 2.04 57.15 18.37 3.06 2.04 1.02 100
3.4748 (ns)
Source: from own survey, 2007 ns= non significant

62
Knowledgeable source of information is positively associated with intensity of adoption
decision but was not found to be stastically significant in the study (Table 11). The results of
this study show that 16.67% adopters and 13.21% non adopters of the sample respondents
assured that they get knowledgeable source of information from their friends. Few of both
adopters (2.04%) and non adopters (1.89%) are getting their knowledgeable information from
their relatives. Majority of adopters of (57.15%) and non adopters (69.81%) ensured that their
main source of knowledgeable information is elderly community members and religious
leaders were thought to be main sources of knowledgeable information about 18.37% of
adopters and 13.21% of non adopters, few others 3.06% of adopters and 1.89% of non
adopters group agree that their source is orally told information in the village while only
2.04% of adopters and none of the non adopters use the youngsters as their major sources of
knowledgeable information. Finally only 1.02% of the adopters and none of the non adopters
were seeking knowledgeable information from sources other than their communities. It is
shown that there are no significant differences between adopters and non adopters in seeking
information from different sources (Table 11).
Ties (social, religious, political, ethnicity) matters to the diffusion of knowledge. Rogers
(1995) emphasizes that more effective communication occurs when individuals are
homophilous – possessing similar attributes – and that effective communication leads to
greater homophily. In this study reliable information sources are sources considered by an
individual in choosing the most appropriate information among knowledgeable information
sources he considered. It is found that the difference for reliability of information source
between adopters and non adopters is statistically significant (Table 12).

63
Table 12. Reliable Sources of Information for Sample Respondents in the Village
Adopters Non adopters Reliable source of information N
%
N % χ 2
1. Friends 2. Relatives 3. Elderly community members 4. Religious leaders 5. Tale 6. Youngsters 7. Women groups Total
14 6 52 20 3 2 1 98
14.29 6.12 53.06 20.41 3.06 2.04 1. 02 100
0 2 28 20 2 0 1 53
0 3.8 52.83 7.74 3.8 0 1. 89 100
13.158**
Source: from own survey, 2007;** Significant at 5 % level
As the above Table shows that 14.29% of the adopters group and none of the non adopter
category were found to have reliable information from their friends. Relatives seem to have
low reliability by adopters and non adopters 6.12% and 3.8% respectively. When elderly
community members’ reliability is compared 53.06% of adopters and 52.83% of non adopters
are said elderly community members are reliable. Religious leaders were taken as reliable
source of information by 20.41% of adopters and 7.74% of non adopters and almost equal
proportion of adopters and non adopters group 3.8% and 3.06 % respectively preferred to
consider orally told information more reliable. Only 2.04% of adopters said to have reliable
source from youngsters. Women groups were considered to be reliable information source by
1.02 % adopters and 1.89% of non adopters (Table 12). The result shows there was significant
difference in the information reliabilities of the sources for adopters and non adopters groups.
This study implies that adopters seek multiple sources of information even within their
communities than non adopters so that the information they have at their disposal be more
reliable (Table 12).
Innovation ought to occur more quickly and diffuse more broadly within relatively
homophilous networks containing a few individuals whose multiple identities link them
“weakly” to other networks, providing a bridge for information transmission between
networks whose internal social structure – bonds or strong ties – then promotes rapid
transmission of information Rogers (1995).

64
The manner and speed in which information is communicated among villagers can determine
the time lag phenomenon of innovation adoption or diffusion of information about improved
technologies and better management practices in a given social setting. The fastest method of
communication about small ruminant production issue among respondents is positively related
with the intensity of adoption decision of adopters and non adopters but stastically
insignificant.
Table 13 shows the opinion of sample respondents about which kind of social communication
method is fastest in transmitting information. It is found that the difference between adopters
and non adopters was found to be highly significant in perceiving which method is best means
of rapid communication.
Table 13. Opinion on fastest information flow\dissemination methods in the village
Adopters Non Adopters
Fastest Information Flow methods in the Villages
N % N
%
χ 2
1. Discussion in families 2. Informal discussion among villagers 3. Formal discussions among villagers 4. Information told by religious leaders 5. Others Total
15 10 55 18 0 98
15.31 10.2 56.12 18.37 0 100
5 16 27 4 1 53
9.43 30.19 50.94 7.55 1.89 100
13.657***
Source: from own survey, 2007 *** Significant at 1 % level
The sampled respondents have reported that fastest methods of communication among
villagers were through discussion among family members (15.31% of adopters and 9.43% of
non adopters). About 10.2% of adopters and 30.19% of non adopters were in support of the
informal discussion method of village communication as fastest method and almost half of
both groups 56.12% and 50.94% of adopters and non adopters respectively said that formal

65
method of communication among villagers facilitate information flow in the fastest manner.
The other groups (18.37% of adopters and 7.55% of non adopters) were still proposing
information told by religious leaders is fastest method of communication in the village. Only
1.89% of non adopters suggested that other methods of communication are fastest. The study
found that highly significant differences between adopters and non adopters in their choice on
method of communication about new information (Table 13). The result indicates that
communication and information flow methods chosen by adopters and non adopters were
different which means a wide approaches of information communication and information
media selection is important to effectively communicate agricultural information among such
homogenous villagers.
Major discussion topics among the villagers could range from religion, politics, improved
implements and methods of production that were newly introduced in the community to many
other sensitive issues depending on their degree of homogeneity. Networks generate pecuniary
externalities in the forms of club goods (e.g., for information that is non rival but excludable)
and demand-side network effects for many sorts of goods and services. Early adoption and
rapid diffusion are an equilibrium outcome in such networks (Rogers, 1995).
Table 14. Easily Communicated Issues among Villagers
Adopters Non Adopters Most communicated topic among villagers N % N
%
χ 2
1. Religion 23 23.47 13 24.53
2. Politics 5 5.1
6 11.32
3. Agricultural information 53 54.08 30 56.6
4. Modern improved technologies 7 7.14 4 7.55
5. Market information 10 10.2 0 0
Total 98 100 53 100
7.298 (ns)
Source: from own survey, 2007; ns= non significant

66
Table 14 shows that 23.47% and 24.53% adopters and non adopters respectively said that
religion is their major discussion topic most of the time, while 5.1% of adopters and 11.32%
non adopters were saying that politics is the major discussion topic but the majority two
groups (61.22% of the adopters and 64.51% of the non adopters) discuss more about
agricultural information and improved agricultural technologies and techniques and only
10.2% of the adopters devote their time discussing on market and marketing issues. The chi-
square test results show that there is stastically insignificant difference between adopters and
non adopters (Table 14). This insignificant difference may tell about the relative homogeneity
of the villagers and hence similar issues equally impress all members of the community at a
time.
4. 2. Determinants of Intensity of Small Ruminant Fattening Package Adoption
Sample respondents in this study were categorized into four groups based on their level of
adoption index score. The minimum adoption index of the non adopters is less than 0.94. The
low adopters group has adoption score of 1.48- 1.56, medium level adopters having a score o
of adoption index between 1.57- 1.76 while the highest adopter group were having between
1.77-2.54 adoption index value (see appendix Table 2). The adoption extent of small
ruminants fattening technologies feed (fodder and forage plants, feed supplements), veterinary
and health services utilization and improved management practices used by the sample
respondents are seen in relation to their personal characteristics under this section.
4.2.1. Demographic Characteristics
Household characteristics are very important factors that are used in explaining adoption
decision behavior of people in adoption of agricultural technologies and innovations..
Depending on the strength of influence of these HHs characteristics, each variable has its own
contribution in making adoption decision and extent of use the whole package or single
component of the package extended to respondents within the same village or area.
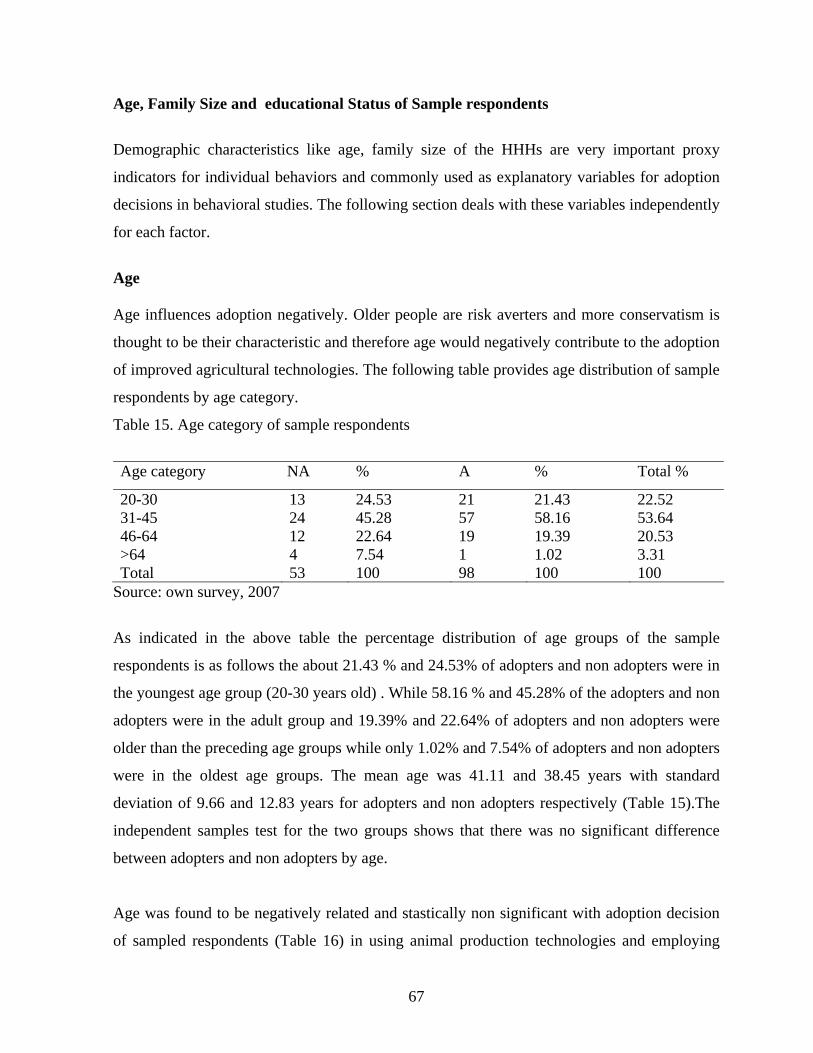
67
Age, Family Size and educational Status of Sample respondents
Demographic characteristics like age, family size of the HHHs are very important proxy
indicators for individual behaviors and commonly used as explanatory variables for adoption
decisions in behavioral studies. The following section deals with these variables independently
for each factor.
Age Age influences adoption negatively. Older people are risk averters and more conservatism is
thought to be their characteristic and therefore age would negatively contribute to the adoption
of improved agricultural technologies. The following table provides age distribution of sample
respondents by age category.
Table 15. Age category of sample respondents
Age category NA % A % Total %
20-30 13 24.53 21 21.43 22.52 31-45 24 45.28 57 58.16 53.64 46-64 12 22.64 19 19.39 20.53 >64 4 7.54 1 1.02 3.31 Total 53 100 98 100 100
Source: own survey, 2007
As indicated in the above table the percentage distribution of age groups of the sample
respondents is as follows the about 21.43 % and 24.53% of adopters and non adopters were in
the youngest age group (20-30 years old) . While 58.16 % and 45.28% of the adopters and non
adopters were in the adult group and 19.39% and 22.64% of adopters and non adopters were
older than the preceding age groups while only 1.02% and 7.54% of adopters and non adopters
were in the oldest age groups. The mean age was 41.11 and 38.45 years with standard
deviation of 9.66 and 12.83 years for adopters and non adopters respectively (Table 15).The
independent samples test for the two groups shows that there was no significant difference
between adopters and non adopters by age.
Age was found to be negatively related and stastically non significant with adoption decision
of sampled respondents (Table 16) in using animal production technologies and employing

68
better production techniques continuously. This is because the majority of sample respondents
were in the same older age categories including both adopters and non adopters.This result
confirms the findings of Haji (2003), Mesfin (2005) and Yenealem (2006) and with respect to
age and adoption of agricultural technologies and innovations.
Table 16. Personal characteristics of the sample households
Adopters(N=98) Non adopters(N=53) Characteristics Mean St.dev Mean St.dev
T- value
Age of HHHs (in years ) Minimum Maximum Family Size (number)
38.45 22 67 6.07
9.66 1.801
41.11 20 77 5.13
12.83 1.787
-1.03 3.068***
Source: survey result, 2007 , *** Significant at 1%level
Family Size
The total number of family members in a household is important for availability of
economically active labour. The mean family sizes of household members were 6.07 % and
5.13 % for adopters and non adopters respectively. It was observed that the relation between
intensity of adoption decision of respondents and their family size is strongly and positively
related. The size of family with respect to the availability of total labor in the households and
the difference between non adopters and adopters is significant (Table 16). The study result
implies that adopters do have more labour availability than non adopters and more family size
will encourage the intensive use decision of fattening package. The reason is that most small
ruminant management practices of do not require more energetic labour which is normally
considered by economically active labour. Still children and older family members can
contribute to the labour requirements of the HH heads equally in the case of small ruminant
rearing activities. This result is consistent with the findings of Arene (1994) and Dereje
(2006).

69
Educational Status of Sample HHs
Education is the major demographic characteristic explanatory variable that differentiates
adopters and non adopters in all adoption studies. Farmers who are more educated are
generally more open to innovative ideas and new technologies that will promote technical
change Weir and Knight (2000), and Abay and Assefa (2004) had cited many adoption studies
that show education as one of explanatory variable and significantly affecting adoption
decision of individuals.
The educational level of sample respondents presented in Table 17 shows that 70.86% are
illiterate while 29.14% of the respondents are literate including those who are only
functionally literate. Mean years of education of adopters and non adopters were 1.73 and 1.4
years with standard deviation of 0.862 and 1.099 years in the survey area. Adopters were
found to be distributed in all educational levels (66.33% illiterate, 3.06 % functionally literate,
22.45 % as 1-4 graders, 7.14 % as 5-8th graders, and only 1.02 % were found to be as more
than 8th graders).
Table 17 Educational level of sample respondents’
Source: from own survey data, 2007; ns= non significant
Among the non adopters group 79.24 % are illiterate, 7.55% are functionally literate and
another 7.55% are 1-4 grade while 5.66% are attended grade 5-8 and none of the NA are
observed to attend more than 8th grade. Several adoption studies show evidences, which all
concluded that education has a positive and significant impact on the adoption of modern
Adopters Non Adopters
Educational level of the HHH N % N %
Total % χ 2
Illiterate functionally literate 1-4 grade 5-8 grade >8 grade Mean year of education Standard deviation of education
65 3 22 7 1 1.73 0.862
66.33 3.06 22.45 7.14 1.02
42 4 4 3 0
79.24 7.55 7.55 5.66 0 1.4 1.099
70.86 4.64 17.22 6.62 0.66
7.394 (ns)
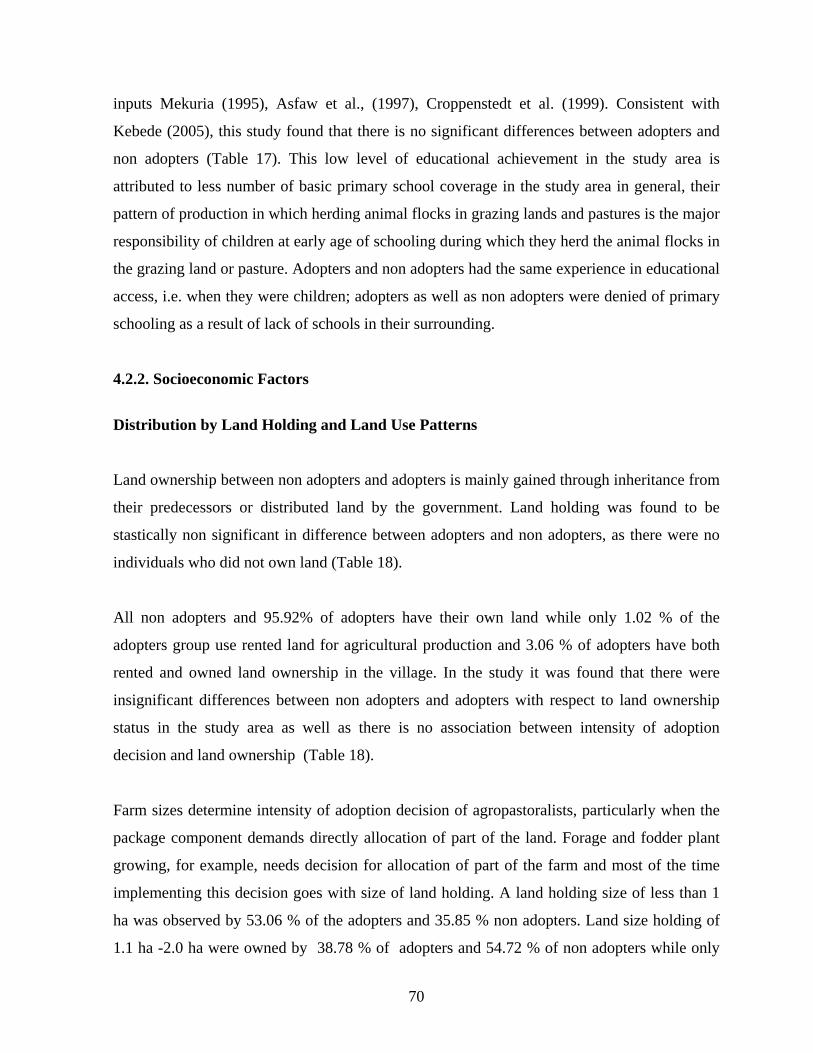
70
inputs Mekuria (1995), Asfaw et al., (1997), Croppenstedt et al. (1999). Consistent with
Kebede (2005), this study found that there is no significant differences between adopters and
non adopters (Table 17). This low level of educational achievement in the study area is
attributed to less number of basic primary school coverage in the study area in general, their
pattern of production in which herding animal flocks in grazing lands and pastures is the major
responsibility of children at early age of schooling during which they herd the animal flocks in
the grazing land or pasture. Adopters and non adopters had the same experience in educational
access, i.e. when they were children; adopters as well as non adopters were denied of primary
schooling as a result of lack of schools in their surrounding.
4.2.2. Socioeconomic Factors
Distribution by Land Holding and Land Use Patterns
Land ownership between non adopters and adopters is mainly gained through inheritance from
their predecessors or distributed land by the government. Land holding was found to be
stastically non significant in difference between adopters and non adopters, as there were no
individuals who did not own land (Table 18).
All non adopters and 95.92% of adopters have their own land while only 1.02 % of the
adopters group use rented land for agricultural production and 3.06 % of adopters have both
rented and owned land ownership in the village. In the study it was found that there were
insignificant differences between non adopters and adopters with respect to land ownership
status in the study area as well as there is no association between intensity of adoption
decision and land ownership (Table 18).
Farm sizes determine intensity of adoption decision of agropastoralists, particularly when the
package component demands directly allocation of part of the land. Forage and fodder plant
growing, for example, needs decision for allocation of part of the farm and most of the time
implementing this decision goes with size of land holding. A land holding size of less than 1
ha was observed by 53.06 % of the adopters and 35.85 % non adopters. Land size holding of
1.1 ha -2.0 ha were owned by 38.78 % of adopters and 54.72 % of non adopters while only
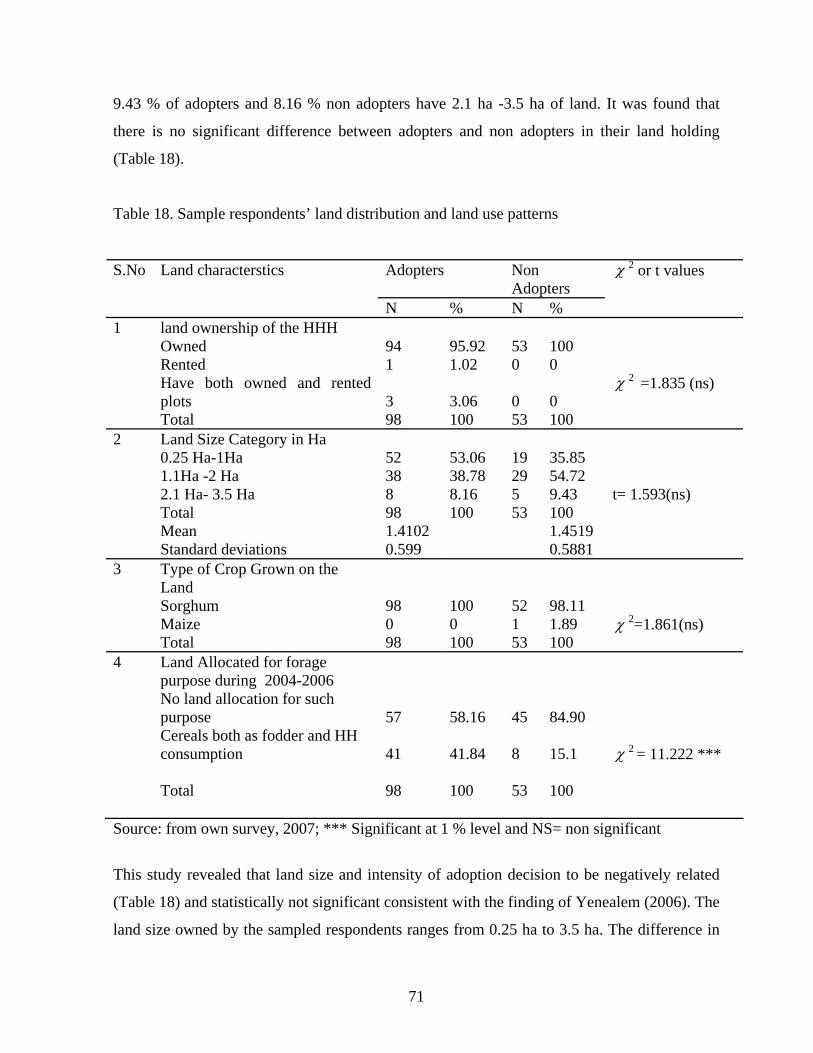
71
9.43 % of adopters and 8.16 % non adopters have 2.1 ha -3.5 ha of land. It was found that
there is no significant difference between adopters and non adopters in their land holding
(Table 18).
Table 18. Sample respondents’ land distribution and land use patterns
Adopters Non Adopters
S.No Land characterstics
N % N %
χ 2 or t values
1 land ownership of the HHH Owned Rented Have both owned and rented plots Total
94 1 3 98
95.92 1.02 3.06 100
53 0 0 53
100 0 0 100
χ 2 =1.835 (ns)
2 Land Size Category in Ha 0.25 Ha-1Ha 1.1Ha -2 Ha 2.1 Ha- 3.5 Ha Total Mean Standard deviations
52 38 8 98 1.4102 0.599
53.06 38.78 8.16 100
19 29 5 53
35.85 54.72 9.43 100 1.4519 0.5881
t= 1.593(ns)
3 Type of Crop Grown on the Land Sorghum Maize Total
98 0 98
100 0 100
52 1 53
98.11 1.89 100
χ 2=1.861(ns)
4 Land Allocated for forage purpose during 2004-2006 No land allocation for such purpose Cereals both as fodder and HH consumption Total
57 41 98
58.16 41.84 100
45 8 53
84.90 15.1 100
χ 2 = 11.222 ***
Source: from own survey, 2007; *** Significant at 1 % level and NS= non significant
This study revealed that land size and intensity of adoption decision to be negatively related
(Table 18) and statistically not significant consistent with the finding of Yenealem (2006). The
land size owned by the sampled respondents ranges from 0.25 ha to 3.5 ha. The difference in

72
the size of land ownership arises from many interrelated factors in the community but the
major ones are the number of potential heirs within ones family when s/he inherit the land,
national land policy, resettlement within wereda and household economic status.
The respondents’ commonly grown crops are maize and sorghum, where sorghum is
dominantly grown almost equally by both adopters and non adopters in the study area.
Sorghum is grown by 100 % of adopters and 98.11 % of non adopters and only 1.89 % of non
adopters grow maize on their land (Table 18). Adopters and non adopters are not different by
the type of crop they grow study area. But farm land crop coverage proportion during a season
allocated with multipurpose crops (cereal and forage) or totally by other economic crop is
different for adopters and non adopters.
Sorghum is a dual purpose crop in the area farming system where animal keeping is given
equal or more emphasis than crop production. Therefore, agropastoralists in this wereda
always prefer to sow a sorghum variety which has dual purpose as fodder and staple food
(cereal). Allocation of land with this purpose thus depends on the agropastoralists’ preference;
it is found that 58.16 % of adopters and 84.90 % of non adopters said that they do not allocate
their farm plot for such purposes. Table 18 shows that 41.84 % of adopters and 15.1% of non
adopters them agreed that they do allocate their land at least with the aim of getting multiple
benefits from sorghum and maize. It was found that there exist significant differences between
adopters and non adopters in their land allocation purpose (Table 18). This implies that
agropastoralist who aim to fatten their goats and sheep prefer more their land is allocated for
dual purpose crop than those who do not.
Livestock Holding of HHs
The TLU holding of a HHH in the village is used as a proxy measure of household wealth
status. The study area is characterized by mainly agropastoal and semi pastoral production
system and hence higher TLU difference may not be significantly observed between adopters
and non adopters. The mean and standard deviation of could explain the difference among and
between adopters and non adopters.

73
The range of TLU holding among the sample respondents is 44.22, the minimum holding is
zero and the maximum is 44.22 TLU. The t–test shows that there is a significant difference
between adopters and non adopters in TLU holdings (Table 19). It was found that there were
positive and stastically significant relationship between TLU holding of the sample
respondents and intensity of adoption decision. This finding is consistent with similar studies
of dairy technology adoption in Ethiopia by Haji (2005) and Ibrahim (2006).
Table 19. Sample respondents’ TLU holding distribution
Adopters Non Adopters Total Livestock Unit Category N % N %
t– value
1. <7 56 57.14 43 81.13 -2.252 **
2. 7.1-14.1 34 34.69 10 18.87 3. 14.2-21.2 6 6.12 0 0 4. 21.3-28.3 1 1.02 0 0 5. >35.4 1 1.02 0 0 Total 98 100 53 100 Mean 7.2663 5.3113 Standard deviation 5.86 3.18 Source: from own survey, 2007 , ** Significant at 5 % level
HHHs’ Total Income Level of the 2006 Production Year
Household income sources in rural areas are as diverse as HHHs activities even within
agricultural sector. HHHs income obtained in this study from all types of income sources
during last year from (non farm and farm employment) sale and consumption value of crop
produced, livestock sale and consumption, petty trading, pension. It was found that HHHs’
total income and intensity of adoption were not related. The non relationship of HHHs’
income and intensity of adoption is may be justified by, the area is food insecure and drought
prone and agropastoralists save and use almost all their earnings for household food
consumption and expenses without saving or leaving money for investments in their
production activities.
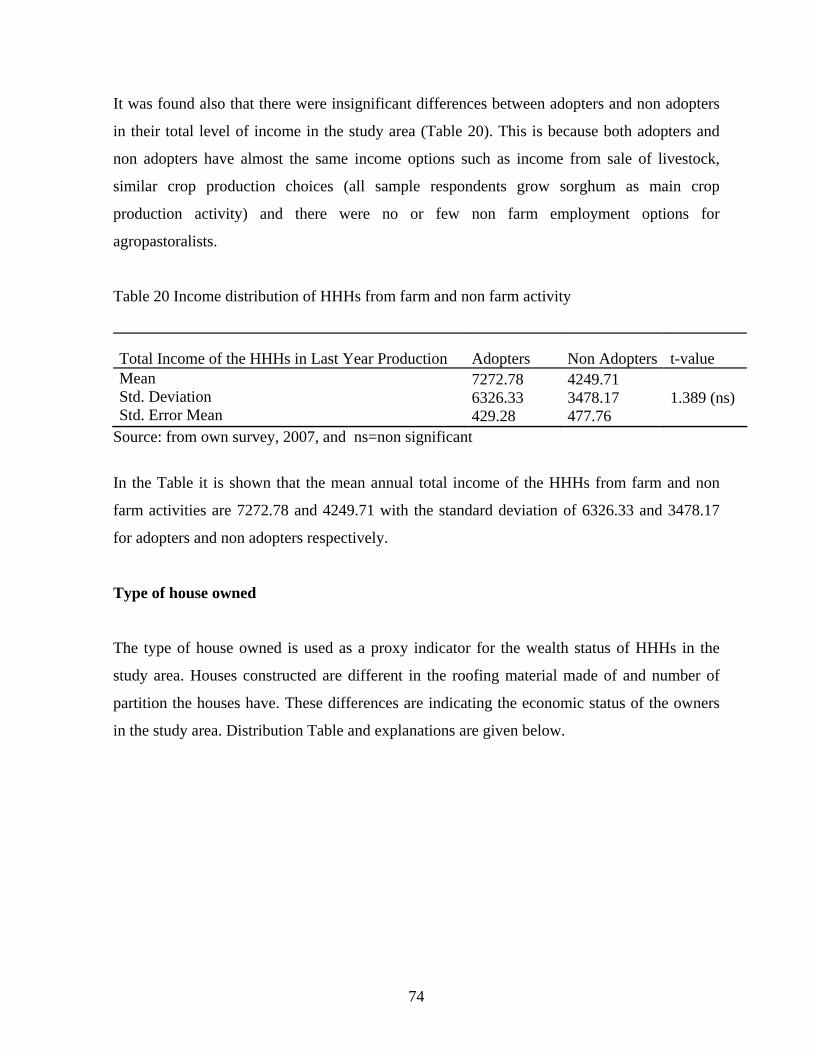
74
It was found also that there were insignificant differences between adopters and non adopters
in their total level of income in the study area (Table 20). This is because both adopters and
non adopters have almost the same income options such as income from sale of livestock,
similar crop production choices (all sample respondents grow sorghum as main crop
production activity) and there were no or few non farm employment options for
agropastoralists.
Table 20 Income distribution of HHHs from farm and non farm activity
Total Income of the HHHs in Last Year Production Adopters Non Adopters t-value Mean Std. Deviation Std. Error Mean
7272.78 6326.33 429.28
4249.71 3478.17 477.76
1.389 (ns)
Source: from own survey, 2007, and ns=non significant
In the Table it is shown that the mean annual total income of the HHHs from farm and non
farm activities are 7272.78 and 4249.71 with the standard deviation of 6326.33 and 3478.17
for adopters and non adopters respectively.
Type of house owned
The type of house owned is used as a proxy indicator for the wealth status of HHHs in the
study area. Houses constructed are different in the roofing material made of and number of
partition the houses have. These differences are indicating the economic status of the owners
in the study area. Distribution Table and explanations are given below.

75
Table 21. Distribution of HHHs by the type of house owned
Type of house owned
Grass roof type
N=98
Adopters%
N=53
Non Adopters % χ 2
Yes No
87 11
88.8 11.3
47 6
88.7 11.2
0.000(ns)
Corrugated iron roof house without partition
Yes No
11 87
11.2 88.8
5 48
9.4 90.6
0.116(ns)
Corregated iron roof house with partition
Yes No
12 86
12.2 87.8
1 52
1.89 98.1
4.690*
Source: own survey, 2007; ns= non significant and * Significant at 10 % level
In the above distribution table, about 12.2 % adopters and 1.89 % non adopters owned houses
of corrugated iron roof with partitions and 87.8 % of adopters and 98.1 % of non adopters did
not owned corrugated iron roof with partition. In Table 21 it has been shown that ownership of
grass roof and corrugated iron roof without partition do not differ significantly between
adopters and non adopters but corrugated iron roof with partition was found to be significantly
different between adopters and non adopters and this difference could be explained in terms of
adopters’ behavior who could be said more implementers of the housing management
practices than the non adopters in the study area.
4.2.3. Small ruminant rearing experience, current production patterns and management practices,
Small Ruminant Rearing Experience of Sample HHHs
Individuals’ experience on economic activities helps and guides the current decision making
abilities in solving problems and increasing their efficiencies in any particular enterprise. The
finding in this study shows that there is strong relation between small ruminants rearing
experience and adoption decision of sampled respondents and this result is stastically highly

76
significant (Table 22). The mean years of small ruminant rearing experience is 12.55 and
17.33 for adopters and non adopters respectively.
Table 22. HHHs’ small ruminant rearing experience
Small ruminant rearing experience (in years ) Adopters Non Adopters t-value Mean Std. Deviation
12.55 10.99
17.33 8.014 3.064***,
Source: own survey, 2007, *** Significant at 1 % level
The negative relationship found between intensity of adoption and small ruminant rearing
experience in this study contrary to prior findings of Molla (2005), Senkondo et al (2004) and
Tesfaye (2006) probably be explained with the reason that larger experience in traditional
ways of animal rearing coupled with the inherent conservatism of older, who constitute the
large majority of the respondents might have prevented them to go for new methods. Those
who have lesser experience in traditional methods of animal rearing might have been more
open to new management practices.
4.1.2.4. Livestock production
Livestock is the major means of livelihoods for agropastoralists in the study area. Livestock
production in general in this wereda is undertaken mainly using traditional management
practice. Agropastoralists differ in the total holding of livestock species where pastoralists
having more of camel than agropastoralists and while agropastoralists are use crop production
aspects besides keeping animals only. The following sub sections are about the different
management practices’ assessment of agropastoralists on their small ruminant production and
other livestock species. Input in this case is particularly referring to vet drugs and improved
feed

77
Input usage in the livestock production
The livestock production of the study area is mainly characterized by traditional animal
production managements and techniques. Hence, very few sample respondents were (10.6% of
N=151) seen to use animal production inputs in general. Besides this, much of this little input
is employed, most of the time within a given household, for bigger or financially rewarding
livestock species than small ruminants.
Table 23.Small ruminant input usage
Adopters Non Adopters
Inputs used for sheep and goat rearing A % NA
% χ 2
Not used any input 84 85.71 51 96.22 Purchased feeds like cowpea, hay, MUB, grain 14 14.29 2 3.78
Total 98 100
53
100
4.086 (ns)
Source: from own survey, 2007; ns= non significant
There is no significant difference using input for goats and sheep between adopters and non
adopters due to diversion of investment priority in rearing financially rewarding cattle and
camel. In the Table 25, it is shown that 84 % of adopters and 96.22%of non adopters are not
using inputs for their sheep and goats while 14.29 % of adopters and 3.78 % of non adopters
reported to use some of these inputs. The chi-square tests show that there is no significant
difference between adopters and non adopters in using inputs for their sheep and goats (Table
23).
Breed Type and Sources of Animal Breed in the Study Area
The kind of animal breed reared in general is mostly of local origin and the agropastoralists
and pastoralist do not have sufficient information on kind, source and blood level of their
livestock. Sample respondents, when asked whether they could identify the type of breed of
their livestock species, about 73.47 % and 92.46 % of adopters and non adopters respectively

78
confirmed that they are rearing totally local breed, and 25.51 % adopters and 7.54% non
adopters do keep cross breed, while only 1.02 % of the adopters said that they have pure
improved breed animal.
The chi-square of tests of the two groups show that there is no significant difference between
adopters and non adopters in rearing/keeping improved breed type of animals. Similarly there
was no significant difference between these groups in differentiating their animals blood level
composition that each animal constitute by percentage of blood level of exotic, local, cross or
pure blood percentage composition in the animals. Only 2.04% of the adopters responded that
they knew the blood composition level of animals they rear while 97.96% of the adopters and
100% of non adopters have no information on the level of blood of their animals (Table24).
The sources of breed for the agropastoralist in the wereda are generally two. Almost all
respondents have their breed source either from market or their own flock. There are few who
use their own flock as the main breeding source. Local market as breed source is used by only
1.02 % of adopters and only 1.02 % of non adopters. None of the adopters use sheep and goats
breed distributed by WBPRD Office and only 1.89 % of the non adopters use this center as
their breed sources. Most sample respondents, 97.96 % of adopters and 98.11 % of non
adopters use both local and surrounding markets and their own flocks alternatively as their
breed source for their goats and sheep. There is no significant difference between adopters and
non adopters in source of breed for goats and sheep (Table 24).

79
Table 24.Responses on type, source, blood level of small ruminants’ breed of sample respondents
Adopters Non Adopters
S.No Breed characteristics
N % N %
χ 2 –value
1 Type of Breed local breed cross breed pure improved breed Total
72 25 1 98
73.5 25.5 1.02 100
49 4 0 53
92.5 7.54 0 100
1 .096 (ns)
2 Percentage of improved breed blood level I do not know High Total
962
98
97.9 2.04 100
53 0 53
100 0 100
0.085(ns)
3 Source of Breed for Sheep and Goats own flock only market only breed distribution centers both own flock and market equally Total
1 1 0 96 98
1.02 1.02 0 97.9 100
0 0 1 52 53
0 1.89 98.11 100
2.931 (ns)
Source: from own survey, 2007; ns= non significant
Feed and Feed Supplements Usage
The livestock owners in this wereda therefore use the potential of their surrounding resources
in feeding their animals. When these pastoralists and agropastoralists seek continuous feed
supply throughout the year, they need drought tolerant fodder and forage species, locally
processed feed supplements from plant by- products and also industrial by-products sold in the
market. There is a difference among adopters and non adopters in using only forage/fodder
plants but there were not significant differences between adopters and non adopters in using
Processed feed supplements and industrial by products (Table25).

80
Table 25. Sample respondents feed use by type of feed and frequency of use
Forage/Fodder Industrial by product Processed feed suppments Adopters Non
adopters Adopters Non
adopters Adopters Non adopters
Frequency
N
%
N
%
N
%
N
%
N
%
N
%
Not at all 78 79.6 52 98.1 79 80.9 52 98.1 80 81.6 50 98.11 Rarely 9 9.2 0 0 9 9.2 1 1.9 7 7.1 1 1.89 Sometimes 6 6.12 1 1.9 1 1.0 0 0 4 4.1 0 0 Regularly some
0 0 0 0 4 4.1 0 0 4 4.1 0 0
Regularly all
5 5.1 0 0 5 5.1 0 0 3 3.06 0 0
χ 2 -value 10.273** 9.388 8.811 Source: from own survey, ** Significant at 5 % level
Adopters use forage and fodder species because they understand the use of improved feed
better than non adopters. The main reason that adopters did not use industrial by products and
processed feed supplements because of unavailability of these feed in their locality
Animal health and veterinary services
Animal disease and animal health problems in the wereda are widely spread phenomenon.
Agropastoralists, regardless of their status of being adopters or otherwise, face the same
problem in animal health and disease problems. Some animal health problems are epidemic
type or beyond the control of single HHs and management skills. The adopters and non
adopters observed to be almost similar in experiencing frequently most problematic animal
diseases. Table 26 below shows the percentage responses of adopters and non adopters for
most problematic animal diseases. The result shows that there is significant difference
between adopters and non adopters in facing dermatitis (dhukuba gogaa) disease problem
while the difference between adopters and non adopters are not stastiscally different in
experiencing both parasitic and PPRR and CCPP type of diseases. This means the later two
disease problems are due to uncontrolled vectors while dermatitis occurrence differs because
most of the time it is caused, due to lack of sanitary and animal health management skills.

81
Thus adopters and non adopters are different in managing this problem, probably due to better
management practices by adoption.
Table 26. Sample respondents' experience of frequently occurring animal diseases and health problems.
PPR and CCPP parasitic Dermatitis (dhukuba gogaa)
Adopters Non adopters
Adopters Non adopters
Adopters Non adopters
Frequency every month
N
%
N
%
N
%
N
%
N
%
N
%
Every month
4 4.08 0 0 18 18.38
24 24.53
0 0 5 9.79
every six month
44 45.9 39 39.62
29 29.59
16 16.98
40 40.82
5 10.2
every year 43 43.9 54 54.72
42 42.86
49 49.05
53 53.06
37 69.81
Never 6 6.12 5 5.66 9 9.18 9 9.04 6 6.12 6 11.32 χ 2 3.335(NS)
3.1055(NS)
7.81**
Source: from own survey, 2007; ** Significant at 5 % and ns=non significant
Therefore, from this experience agropastoralists have to use veterinary services and health
management practices to protect their goats and sheep from most frequently occurring health
problems. It is a wise decision for agropastoralists and pastoralist to look for treatments for
their frequently infected goats and sheep from veterinary services in the surrounding. A chi-
square test shows that there is statistically significant differences between adopters and non
adopters in demanding veterinary services and seeking services for their goats and sheep be
diagnosed in the animal health posts or not. It is shown in the table that 73 % of adopters and
47 % of non adopters are willing to use the available health and veterinary services while 27
% of adopters and 53 % of non adopters could not use the available health and veterinary
services (Table 27).
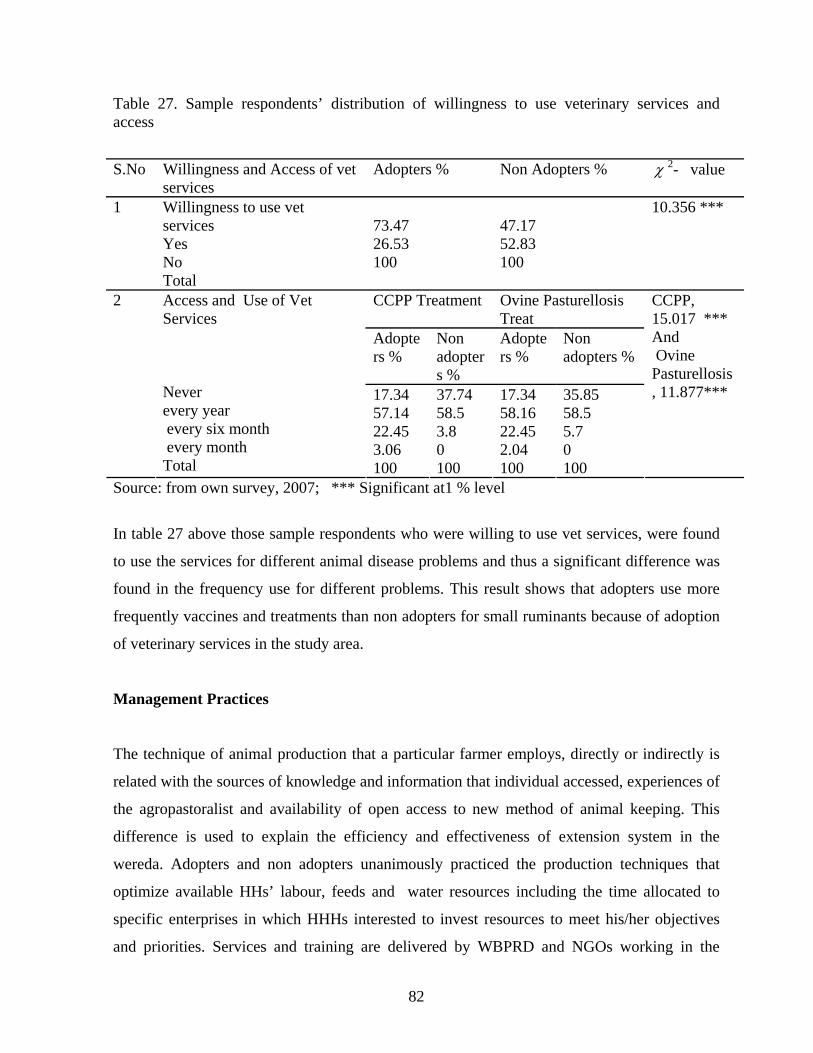
82
Table 27. Sample respondents’ distribution of willingness to use veterinary services and access
S.No Willingness and Access of vet services
Adopters % Non Adopters % χ 2- value
1 Willingness to use vet services Yes No Total
73.47 26.53 100
47.17 52.83 100
10.356 ***
CCPP Treatment Ovine Pasturellosis Treat
Adopters %
Non adopters %
Adopters %
Non adopters %
2 Access and Use of Vet Services Never every year every six month every month Total
17.34 57.14 22.45 3.06 100
37.74 58.5 3.8 0 100
17.34 58.16 22.45 2.04 100
35.85 58.5 5.7 0 100
CCPP, 15.017 *** And Ovine Pasturellosis , 11.877***
Source: from own survey, 2007; *** Significant at1 % level
In table 27 above those sample respondents who were willing to use vet services, were found
to use the services for different animal disease problems and thus a significant difference was
found in the frequency use for different problems. This result shows that adopters use more
frequently vaccines and treatments than non adopters for small ruminants because of adoption
of veterinary services in the study area.
Management Practices
The technique of animal production that a particular farmer employs, directly or indirectly is
related with the sources of knowledge and information that individual accessed, experiences of
the agropastoralist and availability of open access to new method of animal keeping. This
difference is used to explain the efficiency and effectiveness of extension system in the
wereda. Adopters and non adopters unanimously practiced the production techniques that
optimize available HHs’ labour, feeds and water resources including the time allocated to
specific enterprises in which HHHs interested to invest resources to meet his/her objectives
and priorities. Services and training are delivered by WBPRD and NGOs working in the

83
wereda. The management practices / production techniques include all aspects of livestock
development except breed selection and development. Thus success of WBPRD extension
effort is contingent mainly on the practical application of skills and knowledge the
agropastoralists gained through the extension services currently.
Adopters and non adopters were asked whether or not they are practicing all, some, or all
among a number of recommended management practices of small ruminant keeping. In the
study, it was found that, among eight selected management practices, only the amount of
water given to goats and sheep per day is not significantly different between adopters and non
adopters (Table 28). The other seven management practices (methods of sheltering, shed type,
feed amount, frequency feeding, duration of keeping before marketing, animal health and
treatment is done by, frequency of watering) were found to exhibit highly significant
differences between adopters and non adopters in using the recommended management
practices of small ruminants’ production. All the currently practiced management techniques
are significantly related with the intensity of adoption decision as shown in Table 28.The
significance differences in the various management practices of adopters could be accounted
to the extension services demonstration, trainings and education efforts which the adopters
used to change their management practices easily than the non adopters in the study area.

84
Table 28. Percentage distribution of sample respondents’ Current management practices S.No Current management practices Adopters
% NonAdopters %
χ 2 –value
1. Frequency of Stall feeding ) Per Days: Once every two day Once every day Twice every day Three times a day Total
8.16 30.61 21.43 39.8 100
13.21 47.15 22.64 17.0 100
9.126**
2. Feed Amount: Do not know Equal amount to all species According to its weight Total
3979 10.2 50 100
50.94 39.6 9.46 100
31.307***
3. Duration before the animal are taken to market: Five or six months time Four months Three months According to body weight gained Total
33.7 30.61 17.35 18.37 100
62.26 22.64 11.32 3.8 100
13.57***
4. shelter and shed type used: Open type of housing Housing different species together Housing different species in separately Closed type of housing Total
29.59 15.31 11.22 43.9 100
64.15 15.1 5.7 15.1 100
19.434***
5. Animal health and treatment is done: I have no information Individuals with traditional vet knowledge Treatment by trained individuals Taking to clinics for treatment Total
11.22 39.8 21.43 27.6 100
7.55 71.7 13.21 7.55 100
15.292***
6. Method of Keeping and Sheltering: I have no information Always keep with large ruminants Keep goats and sheep in isolation at homestead Total
2.04 3.06 94.9 100
3.8 30.2 66.0 100
23.89***
7. Frequency of watering: Once in a day Two times a day Depends on the intake type of goats and sheep Total
45.67 34.87 19.46 100
73.6 18.87 7.53 100
14.43**
Source: from own survey, 2007 *** ** are significant at 1 %, 5 % level respectively

85
Box 3. An informal group discussion with some females and male respondents revealed that
through out the study area, small ruminants are mostly managed by female household
members and small children. Feeding, watering and marketing are equally done by females.
Inputs availability is the most limiting factor found in management practices of small
ruminants fattening activities by females. The household tasks and management practices done
by females are mostly limited in the household surroundings and when purchased inputs are
there females give it to stall fed goats and sheep as they feel important. When the animals are
taken out for grazing generally male children and their mothers take care of feeding, watering,
and animal health care. They emphasized that females need more focus in training of
improved management practices to change their current management styles.
4.2.4. Institutional Characteristics
Frequency of extension agents’ contact
A certain critical level of cumulative information must be attained before adoption takes place
(Feder and Slade, 1984). Agropastoralists’ awareness about the existence of agricultural
services is an important step to increase the demand for information and advice. Amongst the
significant factors that are involved in knowledge and communication process are, clearly, the
innovation itself, information sources, as well as the change agent and early adopters (Rogers,
1962).
Table 29. Distribution of respondents on their contact with extension agent
Responses Contact With Extension Agent Adopters % Non Adopters % χ 2
Yes 90.82 86.8 0.588 (ns)
No 9.18 13.21 Total 100 100 Source: from own survey, 2007 and ns: non significant

86
Although studies like Adhikari and Patel (1986); Falusi (1974); Hardt (1981) and Lowdermilk
(1972) found that contact with an extension worker as change agents and participation
decisions are positively and significantly correlated, this study however found that there was
only weak and insignificant association between frequency of extension agents’ contact and
intensity of adoption decision of agropastoralists (Table 29). This finding is consistent with the
finding of Ebrahim (2006). In the table, 90.82 % of adopters and 86.8% of non adopters were
found to have frequent contact with extension agents in their village and only less than 10% of
adopters and around 13.21 % of non adopters were having less frequent contact. The
difference between adopters and non adopters was found to be insignificant, this is because the
type of extension contact is not at personal level, which could have more influence on
agropastoralists attitude and decisions making for adoption (Glendinning et al; 2001).
Various extension methods were used by the extension system in the wereda. Trainings,
agropastoralists’ field days, demonstrations, farm visits and public meetings were commonly
used by extension agents as a means of influencing, transferring messages and skills. A study
conducted by Harper et al. (1990) has shown the existence of significant and positive relation
between adoption and different extension methods in their respective studies. However, in this
study only field days and meeting as extension methods were found to be associated with
intensity of adoption decision while training, farm visits and demonstrations were found to be
insignificantly associated (Table30).
The mean number of training, demonstrations and farm visits participation of adopters and non
adopters were 1.12 and 0.91, 0.10 and 0.06 and 0.13 and 0.09 respectively and the standard
deviations of each extension methods were found to be 2.492 and 2.050, 0.366 and 0.233 and
0.370 and 0.405 for adopters and non adopters respectively. The distribution in the above
Table 30 shows that there were not significant differences between adopters and non adopters
in the numbers of participation in training, demonstrations and farm visits of the five extension
methods while the result of the study shows the existence of significant differences between
adopters and non adopters in the numbers of participation in field days and meetings. The
mean number of participation for adopters and non adopters in field days and meetings were
0.24 and 0.08 and 1.65 and 0.87 respectively while the standard deviations of these groups

87
were, 0.575 and 0.267 and 2.130 and 1.532 for number of participation in field days and
extension meetings for adopters and non adopters respectively. Extension institutions’ analysis
provides explanation of internal extension system problems for developing countries, choosing
effective and affordable extension methods were one of many challenges, which the extension
agents fail to implement extension methods appropriately for two main reasons: either not
been taught the methods or that they are not given the resources to use them.
Table 30. Extension Methods participated by sample respondents
Training Field days Demonstrations Farm visits Meetings Statistics As NAs As NAs As NAs As NAs As NAs Mean 1.1
2 0.91 0.24 0.08 0.10 0.06 0.13 0.09 1.6
5 0.87
Standard Deviations
2.492
2.050
0.575
0.267 0.366 0.233 0.370
0.405 2.130
1.532
t-value
-0.542(ns) -2.027** -0.929(ns) -0.572(ns) -2.370**
Source: from own survey, 2007; ** Significant at 5% level, ns= non significant
The wereda office of pastoral and rural development extension section gave a number of
educational and awareness creation programs to its clients (WBPRD Annual Report, 2005).
Reviews of WBPRD Annual Reports shows that much training were delivered for several
years but most of the time these trainings focused only few commodities in number and part of
the aspects of a particular commodity: sorghum production, animal health and improved cattle
production management practices and much of the development agents efforts were non
agricultural trainings. Adopters and non adopters were not found to be significantly different
in their awareness on the existence of training given in the wereda (Table31).

88
Table 31. Sample respondents showing training awareness and training given
Trainaware Traingiven Responses As% NAs% As% NAs%
Yes 24.5 18.9 31.6
32.1
No 75.5 81.1 68.4 67.9 χ 2 0.623 (ns) 0.003 (ns)
Source: own survey, 2007 ; ns= non significant
This study found that there was very weak association between intensity of adoption decision
and training given, this finding supports the above conclusion, based on annual office report
and document reviews. It was also found that there were insignificant differences between
adopters and non adopters in trainings given, it was shown that 31.6% of adopters and 32.1%
of non adopters had taken trainings delivered in the wereda in several aspects and 68.4 % of
adopters and 67.9 % of non adopters did not get the chance to participate in trainings
(Table31).
Frequency of radio use
Mass media exposure is very important agricultural information disseminating means among
rural societies. Agropastoralists’ awareness raised and their attitude is influenced easily when
there is mass media exposure particularly radio, making an entry point for extension agent
contact (Glendinning et al 2001). Radio ownership and public meetings are the most widely
used mass communication means in rural Ethiopia. Radio ownership in the wereda is common
and slightly more than half of total respondents own radio (52 %). This study has found out
that 54.1% of adopters and 45.3 % of non adopters own radio while 45.9 % of adopters and
54.7 % non adopters do not own radio. Ownership of radio between adopters and non adopters
is not significantly different.

89
Table 32. Distribution of sample respondents by mass media exposure
Frequency of radio use Adopters% Non adopters % χ 2 -value
Never 21.4 37.74 15.885 *** Rarely 20.4 13.21 Most of the times 58.2 49.1 Total 100 100 Source: own survey, 2007; *** Significant at 1% level
Though ownership does not vary between adopters and non adopters, different individuals
within sampled respondents are different in their responses for the frequency of radio use and
importance given to radio. Adopters use radio more frequently for agricultural information
than non adopters in the study area, most of the time 58.2% of adopters and 49.1% of non
adopters use radio frequently, while 20.4 % adopters and 13.21 % of non adopters listen
agricultural information through radio rarely, some of the adopters group (21.4 %) and non
adopters (37.74 %) said they had never listened to radio at all (Table 32). This study found
that the existence of significant differences between adopters and non adopters in the
frequency of listening radio for agricultural information purpose. The finding of this study is
consitent with Tesfaye and Alemu (2001), Ibrahim (2006), kebede (2006).
Use of micro Credit
Sources of credit for small ruminant production in the wereda were not available for pastoral
and agropastoralists given by the office of PRDO. Nevertheless, other sources of credit for
sample respondents were NGOs delivering credit every year for some of the respondents to
help them purchase animal drugs and other purposes and hence agropastoralist considered this
source as their major credit sources. These sources use the same credit system procedures like
that of government credit services.
In Table 33 it is shown that 20.4 % of adopters and 9.4 % of non adopters had credit access for
veterinary purposes from NGOs but 79.6 % of adopters and 90.6 % of non adopters did not get
any credit for vet/animal drugs purposes. The results show that there is association between
credit for veterinary purpose and intensity of adoption decision and it is found that there is a

90
significant at 10 % level difference between adopters and non adopters in accessing and using
credit services for veterinary purposes (Table 35). This finding is consistent with the findings
of Sseguya et al; (1999), Million and Belay (2003), Tesfaye (2003), Pender et al., (2004)
Abdulai and Huffman (2005), Ibrahim (2006), kebede (2006).
Table 33. Credit access and distribution of sample respondents
Adopters Non Adopters Access of credit services for veterinary N % N % χ 2 Yes No Total
20 78 100
20.4 79.6 100
5 48 100
9.4 90.6 100
2.999*
Source: from own survey, 2007 ; * Significant at 10 % level
Market Accessibility and Prices
Access to local market of the HHs and availabilities of production input in the market are most
important economic determinant of a household. The choice of production enterprises in
farming decision is related to market incentives. Depending on the direction of incentives
these economic institutions provide, agropastoralists decide either to use part or all of a
package to intensify chosen among many alternatives of enterprises: whether to go for small
ruminant fattening, cattle fattening, cash crop intensification, or vegetable production or a
combination of one or more of any farm enterprises.
Sample respondents access, awareness, and price incentives and availabilities of input for a
particular choice of enterprise are supposed to play a positive role in decision to intensify
small ruminants rearing. This is so, if this enterprise has attractive market price for the
producers and needed inputs are easily available within the reaches of the same. The study
found that 88.78 % of adopters and 74.5 % of non adopters were found to have market access
and 11.32 % of adopters and 25.5 % of non adopters had not access to the local market, the
sample respondents were found to vary significantly in their access to market (Table34).
However, market access, is contingent on HHs economic status, production volume and
distance of local market from home area.
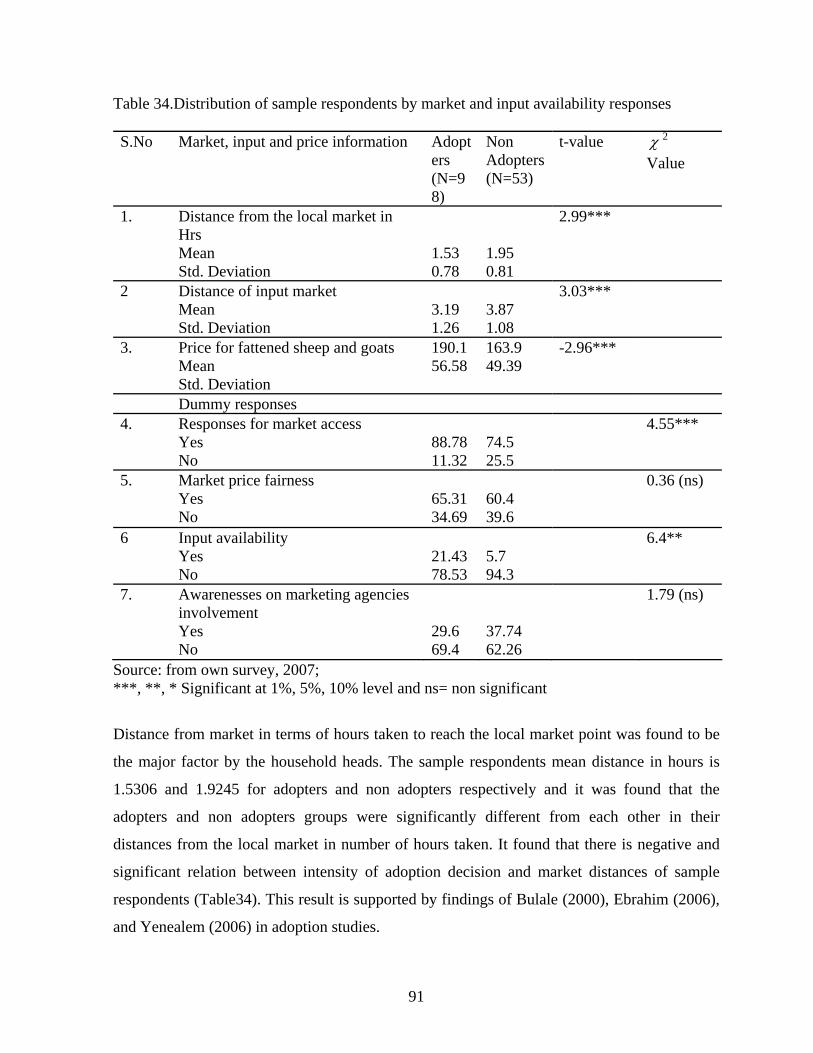
91
Table 34.Distribution of sample respondents by market and input availability responses S.No Market, input and price information
Adopters (N=98)
Non Adopters (N=53)
t-value χ 2
Value
1. Distance from the local market in Hrs Mean Std. Deviation
1.53 0.78
1.95 0.81
2.99***
2 Distance of input market Mean Std. Deviation
3.19 1.26
3.87 1.08
3.03***
3. Price for fattened sheep and goats Mean Std. Deviation
190.1 56.58
163.9 49.39
-2.96***
Dummy responses 4. Responses for market access
Yes No
88.78 11.32
74.5 25.5
4.55***
5. Market price fairness Yes No
65.31 34.69
60.4 39.6
0.36 (ns)
6 Input availability Yes No
21.43 78.53
5.7 94.3
6.4**
7. Awarenesses on marketing agencies involvement Yes No
29.6 69.4
37.74 62.26
1.79 (ns)
Source: from own survey, 2007; ***, **, * Significant at 1%, 5%, 10% level and ns= non significant
Distance from market in terms of hours taken to reach the local market point was found to be
the major factor by the household heads. The sample respondents mean distance in hours is
1.5306 and 1.9245 for adopters and non adopters respectively and it was found that the
adopters and non adopters groups were significantly different from each other in their
distances from the local market in number of hours taken. It found that there is negative and
significant relation between intensity of adoption decision and market distances of sample
respondents (Table34). This result is supported by findings of Bulale (2000), Ebrahim (2006),
and Yenealem (2006) in adoption studies.

92
Input availability is the other dimension in which adopters and non adopters seen to differ in
their degree of agreement for the presences or absences of fattening inputs , 21.43 % of
adopters and 5.7 % of non adopters said that there were fattening input in the market and
78.57 % of adopters and 94.3 % of non adopters were in disagreement with this responses,
from the χ 2 test it was found that the adopters and non adopters groups to differ significantly
(Table 34) this finding is consistent with the findings of Chilot et al (1996), Berhanu (2002) .
The most frequently available input type in the market is known differently by adopters and
non adopters among the sample respondents.55.1% adopters and 71.69 % non adopters said
that there was no fattening input in the local market, 24.49 % adopters and 5.7 % non adopters
agreed that they knew supplement feeds exist in their local market and 20.4 of % adopters and
22.61 % of non adopters had information on the availabilities of animal drugs. Among the
sample respondents there are significant differences in their level of knowledge and awareness
for fattening input availabilities between adopters and non adopters.
It was found that the mean distance in hours of input market for adopters and non adopters are
3.19 and 3.87 hours respectively. The distance of input market for adopters and non adopters
is negatively and significantly related with intensity of adoption decision and adopters and non
adopters are found significantly in their distance to input market (Table 34).
Awareness of the sample respondents for agencies involvement in marketing of goats, sheep
and inputs in the wereda affects, the decision to go to the market or not. Accordiningly 29.6 %
of adopters and 37.74 % of non adopters were found to have awareness while 69.4 % of
adopters and 62.26 % of non adopters were not aware of the existence of business agencies
involved in goats and sheep marketing in the wereda and villages. Adopters and non adopters
were not found to be significantly different in their awareness for the existences of goats and
sheep marketing agencies (Table34).
Frequency of the households going to the market is one of the factors that determine use of
market opportunities: fair price, new information, or new ideas as input in one’s production

93
pattern. Adopters and non adopters were found to go to the market places in different
frequencies, the result found that 46.94 % of adopters and 30.19 % of non adopters go two
days in a week, and 25.51% of adopters and 32.1% of non adopters found to go once in
fortnight, some others still go to market once every month (26.53% of adopters and 28.3 % of
non adopters) where as 1.02 % of adopters and 9.43 % of non adopters do not go to market at
all. The survey result shows that adopters and non adopters are significantly different in the
frequency of going to market (Table 34). Reasons for not going to market at all vary from
individual to individual. Distance of the market place/farness, old age, and low volume of
household produce are some of the reasons for less or no frequent market going (Table 34).
Prices for both the fattened goats and sheep and fattening inputs is another factor that
determine decision for intensive adoption of small ruminant fattening package. The minimum
price for a fattened goat or sheep taken to market is 100 birr while the maximum price given
for good goat or sheep is 350 birr. The mean price reward for fattened goats and sheep for
adopters and non adopters are 190.10 and 56.578 birr. The study it is found that there is
significant differences between adopters and non adopters in the price for fattened goats or
sheep they got (Table 34). Access and nearness a market does not necessarily mean
availability of all inputs and items the sample respondents want and / or it does not ensure the
fairness of prices of inputs and fattened goats or sheep. Agropastoralists in the study area are
confirming to these assumption, and 65.31% of adopters and 60.4 % of non adopters said that
they get fair price for their fattened goats or sheep while 34.69 % of adopters and 39.6 % of
non adopters did not agree in the fairness of the fattened goats and sheep price, and it was
found that there were insignificant differences for market price fairness perception between
adopters and non adopters (Table 34).
Agropastoralists’ perception on price of fattened goats or sheep is one positive factor pulling
the agropastoralists to small ruminant rearing decision. Adopters and non adopters were found
to have different stances in their perception to the price of fattened small ruminants. Only 4.08
% of adopters found to agree with the opinion that fattened goat or sheep price is very low,
and 9.12 % of the adopters and 11.32 % of the non adopters were saying the price is medium,
while 53.14 % of the adopters and 24.54 % of the non adopters were saying the price is high,
94
about 32.7 % of adopters and 64.15 % of non adopters are completely agree with the price is
very high.
The survey found that there is a significant difference between adopters and non adopters in
their perception on fattened goats or sheep prices. This means that adopters perceiving the
current prices of goats and sheep is good in the market they would adopt fattening package
faster and more intensively than non adopters in the wereda. Perception on price of fattened
goats or sheep by agropastoralists thus influence their decision to whether or not to adopt
intensively by adopters, which means prices incentives to small ruminant growers through
direct marketing, forming marketing cooperatives and providing market information thus
paramount in this respect (Table 34).
Box 4. Informal discussion with farmers and pastoralists, and PA leaders revealed that in goats
and sheep trade, the agropastoralists are not getting the good share of the profit obtained from
small ruminant rearing. In Meiso, there are two market days, when two private enterprises are
coming from Modjo and Debreziet to procure a large majority of goats and sheep from the
market. These private interprises are exporters of meat to Middle East countries. The bulk
procurement of goats and sheep is being done by them with the help of middle men, who
purchase the animals from the farmers at a lower rate and sell to the private enterprises at
higher rates based per Kg live weight rate. When they buy from farmers, it is based on their
visual assessment only, making it to the lower side.
Agropastoralists opined that the middle men might get 30-50 Birr per animal in each deal. In
addition to this, the middle men procure animals and sell it to other nearby towns as well. The
farmers have a feeling that if there is some mechanism for a sale of these animals to the
consumers directly, their profit would enhance considerably.
.
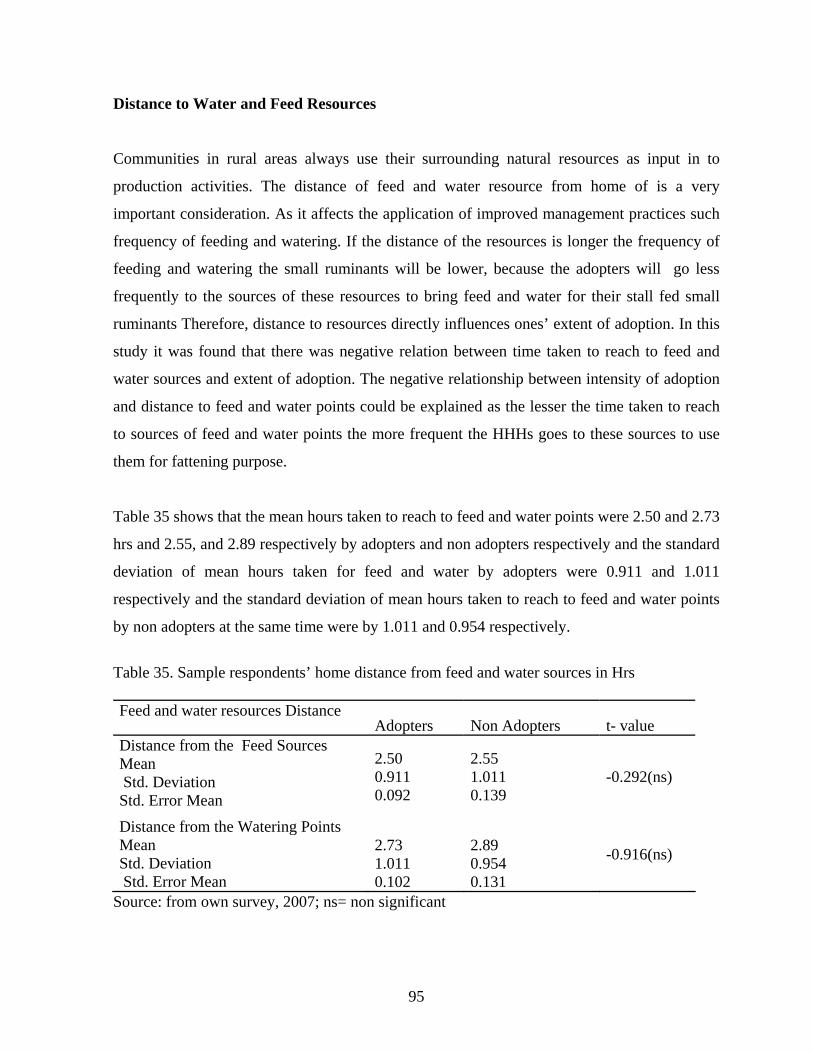
95
Distance to Water and Feed Resources
Communities in rural areas always use their surrounding natural resources as input in to
production activities. The distance of feed and water resource from home of is a very
important consideration. As it affects the application of improved management practices such
frequency of feeding and watering. If the distance of the resources is longer the frequency of
feeding and watering the small ruminants will be lower, because the adopters will go less
frequently to the sources of these resources to bring feed and water for their stall fed small
ruminants Therefore, distance to resources directly influences ones’ extent of adoption. In this
study it was found that there was negative relation between time taken to reach to feed and
water sources and extent of adoption. The negative relationship between intensity of adoption
and distance to feed and water points could be explained as the lesser the time taken to reach
to sources of feed and water points the more frequent the HHHs goes to these sources to use
them for fattening purpose.
Table 35 shows that the mean hours taken to reach to feed and water points were 2.50 and 2.73
hrs and 2.55, and 2.89 respectively by adopters and non adopters respectively and the standard
deviation of mean hours taken for feed and water by adopters were 0.911 and 1.011
respectively and the standard deviation of mean hours taken to reach to feed and water points
by non adopters at the same time were by 1.011 and 0.954 respectively.
Table 35. Sample respondents’ home distance from feed and water sources in Hrs Feed and water resources Distance
Adopters Non Adopters t- value Distance from the Feed Sources Mean Std. Deviation Std. Error Mean
2.50 0.911 0.092
2.55 1.011 0.139
-0.292(ns)
Distance from the Watering Points Mean Std. Deviation Std. Error Mean
2.73 1.011 0.102
2.89 0.954 0.131
-0.916(ns)
Source: from own survey, 2007; ns= non significant
96
Distances to feed and water points measured in number of hours and adopters and non
adopters group were found to differ insignificantly (Table 37). This is because all sample
respondents are dwelling in the same distance from the resources. Rural villages’ houses are
constructed in settlements patterns in almost all parts of Ethiopia. In the study wereda,
villagers construct their house near to each other. Therefore all respondents found to be at
equal distances from these resources.
Risk orientation
Agropastoralists’ risk orientation and capacities to absorb the negative or a side effect of any
adoption of innovation is different. These differences emanate from several characteristics of a
single individual, and hence individuals are different in many ways. Risk orientation and
perception of individuals are some of the individual behaviors in which people significantly
differ even in the same context. The following Table provides information on different aspects
of agropastoralists risk orientation related to small ruminant rearing.

97
Table 36. Agropastoralists risk orientation S.No Risk orientation and perception Adopters% Non
Adopters%
χ 2
1. Risk perception on new agricultural technologies and improved methods of production (perntech)
new crop technologies only new animal technologies only both are equally risky not sure
(N=98)
15.31 31.63 20.41 32.65
(N=53)
17.0 50.94 18.87 13.21
8.477**
2. Risk Perception on rearing small ruminant
(perear)
Yes No
(N=98)
12.25 87.75
(N=53)
1.89 98.11
4.690**
3. Risk taking, if financial incentives is associated ( riskting)
Yes
No
(N=98)
60.2 39.8
(N=53)
47.17 52.83
2.368(ns)
Source: from own survey, 2007; **, * Significant at 1 %, 5 %, 10 % level and ns is non significant
Agropastoralists were asked which improvement they would be in favour, which category of
agricultural activities crop production or animal husbandry improvements or new technologies
would be of less risk, taking fear of failure as the reference points for comparison of
favorableness. The response of interviewed sample respondents shows the existence of
significant difference in risk orientation of this wereda between adopters and non adopters
(Table 36) in favoring crop, animal or both are equally are risky.
General difference in risk orientation between adopters and non adopters is observed in the
wereda. Further differences could still exist among agropastoralists in perceiving whether a
specific enterprise is less risky, financially rewarding but is risky or totally risky activity. Even
if an individual has diversified options for avoiding riskier activity, instead some individuals
may go for doing the risky activity if its financial benefit outweighs the risk. In line with this,
sample respondents are tested whether they perceive small ruminant rearing is risky or not.
98
The chi-square test shows that there is a significant difference between adopters and non
adopters in perceiving small ruminant rearing is risky (Table 36). On the other hands, 60.2 %
of adopters and 47.17% of non adopters confirmed that they will take the risk if the decision
has financial reward while 39.8% adopters and 52.83 % non adopters said they will not take
any kind of risk whatever financial incentives they would loss for deciding against risk taking
(Table 36). In the Table it is shown that there is no significance difference between adopters
and non adopters in taking risk even if it has financial incentives.
Besides the above quantitative information, informal focus group discussion and PRA survey
with the key informants reveal that the major need of agropastoralists’ and pastoralists’ and
problems of the small ruminant fattening activities related to few but very much important
issues namely feed, animal health problems, marketing information and price of fattened goats
and sheep and finally selection and use of improved breed of goats and sheep. The focus group
participant stated that marketing groups formation earlier were tried in some PAs but could not
be sustainable which did not benefit the small ruminant raisers. Some of these groups are
already practicing local breed selection from market sources located as far as 50 kms away
from their village only to get appropriate breed type for meat production.
4.2.5. Security for Scarce Natural Resources (Grazing Land and Water Points)
Lack of scarce resources like common grazing land, demarcated range land, and pool of water
points create social tension and conflicts within or between the same community and/or
different communities. Every individual residing within vicinity these of scarce resources,
raise the issue of equal and equitable demand over access, control and uses. Any thing which
disturbs stable system of utilization of these resources ultimately gives rise to feeling of
insecurity and conflict between and among communities. When it comes to specific feeling of
insecurity due to lack or shortage of the most important input resources for their fattening
enterprises the sample respondents showed clear difference in their perception of security
(Table 37).

99
Table 37. Responses of the Adopters and Non adopters group for presence or absence of insecurity in their village
Adopters Non adopters χ 2 Insecurity due to lack or shortage of resource(grazing land, water and water points)
N
%
N %
Yes No Total
63 35 98
64.29 35.71 100
19 34 53
35.85 64.15 100
11.226**
Source: from own survey, 2007;** Significant at 5% level
About 64.29% of the adopters and 35.85% of the non adopters group responded for the
presence of insecurity use of resources in their village. While 35.71 %of the adopters and
64.15%of the non adopters said that there is no problem of security for the use resources. The
chi-square test shows there is a significant difference between the two groups in feeling of
their security due to lack or shortage of the scarce natural resources (Table 37).
Box 6. During focus group discussion sample respondents said that pasture and water points’
shortage becomes critical during dry season and this creates tension and when tensions
become more serious conflicts emerge. Water points and grazing lands are common goods in
the wereda and face the problem of “the tragedies of the commons”. Especially when other
ethnic groups come to share these common goods ultimately conflicts emerge.
Thus, innovative adopters change their management practices to avoid their small ruminants
being stolen or damaged. Such behavior is characteristic of adopters choosing to practice stall
feeding management, shade and shelter recommended management practices.
Responses on the presence or absence of conflict and insecurity by a category of reasons are
different for adopters and non adopters and between each group. The chi-square test value of
the adopters and non adopters for their difference in responding to different reasons and the
significance level of these responses are presented in (Table 38), where 21.43% of the
adopters and 22.64% of the non adopters group seem to agree that lack of feed resources are

100
major sources of insecurity, some of the sample respondents, about 10.2 % of the adopters and
22.64% of the non adopters group agreed that lack of water and watering points are the major
sources of insecurity, while 1.02 % and 7.14% of the adopters and 1.89% and 16.98% of the
non adopters group think that major sources of insecurity arises due to religious and ethnic
differences respectively. Only 1.02% of the adopters group and none of the non adopters
group think political differences are the major sources of insecurity. Both lack of water and
feed resources equally contribute for villagers’ insecurity as confirmed by 59.18% of the
adopters group and 35.85% of the non adopters. Therefore it is evident that sample
respondents feel insecure for lack of feed and water and hence conflicts are common due to
pasture and water point’s scarcity. Any interventions which enhance these resources like
fodder and forage plant species, water harvesting technologies and locally processed feed
supplements could be accepted readily by adopters more easily than non adopters.
Table 38. Reasons for major sources of insecurity
Adopters Non Adopters Major Source of Insecurity A (%) NA (%) χ 2 1. Lack of feed resource 2. Lack of watering points 3. Religious differences 4. Ethnic differences 5. Political differences 6. Feed and water shortage equally
contribute Total
21 10 1 7 1 58 98
21.43 10.2 1.02 7.14 1.02 59.18 100
12 12 1 9 0 19 53
22.64 22.64 1.89 16.98 0 35.85 100
11.226**
Source: from own survey, 2007; ** Significant at 5 % level
4.2.6. Social participation
The social participation of rural people in local and formal institutions exposes them to
information and better ideas than their practices. Especially, those who are in the leadership
position and committees have more opportunities than ordinary members. But the chi-square
of the test showed that there is no significant difference between adopters and non adopters for
both committee membership and leadership in informal organizations (Table 39). The
difference between adopters and non adopters in participating in the formal organization as

101
committee members and leadership is again not significantly different (Table 39).
Table 39. Sample respondents’ participation in social organizations
Adopters(N=98) Non Adopters(N=53) Yes No Yes No
Types of participation
N % N % N % N %
χ 2
Informal leadership
4 4.08
94 95.92
4 7.5
49 92.5
0.82 (NS)
Informal committee
11 11.22 87 88.78 6 11.3
47 88.7
1.95 (NS)
Formal committee
14 14.28
84 85.72
10 18.9
43 81.1
0.40 (NS)
Formal leadership
2 2.04 96 97.96 2 3.8
51 96.2
1.69 (NS)
Source: from own survey, 2007; NS= non significant
The above observations show insignificant differences between adopters and non adopters by
social participation types in adoption of small ruminant fattening package. Leadership and
committee membership role of respondents in this study was found to be consistent with the
findings of Kebede (2006), Pender et al. (2004), Abera (2003) in their adoption studies where
they stated that there exist positive relationship between adoption and social participation, but
stastically non significant in all types of social participation. These insignificance differences
could be explained by precence of unorganized and weak forms of local organizations like
Afosha and saving or credit organizations. These organizations mainly play sharing social
burden role such as funeral and wedding celebrations (100 % of the sample respondents join
this social organization with main purpose of sharing social burden and not to be excluded
from the society) and these organizations also have no regular meeting and membership fee
contribution to maintain and strengthen their organization, as a result information exchange
and flow through these organization is restricted from both outside as well as within the
members’ group). The other reason could be the very limited number of formal organizations
(schools, health posts and vet clinics, formally supported by traditional legal and judiciary
organizations) which could have involved local people as committee members so that local
people’s capacity is enhanced and at the same time information exchange and communication
about new practice and technologies could have been facilitated through these formal
organizations.
102
4.3. Intensity of adoption of Fattening Package and Its Determinants in the Study Area
4.3.1. Results of the Econometric Model
Prior to running the Tobit model, the hypothesized explanatory variables were checked for the
existence of multi-collinearity and heteroscedasticity. Very often data we use in regression
analysis cannot give decisive answers to the questions we pose. This is because the standard
errors are very high or the t-ratios are very low. This sort of situation occurs when the
explanatory variables display little variation and/or high intercorrelations. The situation where
the explanatory variables are highly intercorrelated is referred to as multicollinearity
(Maddala, 1992).
Before running the model all the hypothesized explanatory variables were checked for the
existence of multi-collinearity problem. There are two measures that are often suggested to
test the existence of mulit-collineality. These are: Variance Inflation Factor (VIF) for
association among the continuous explanatory variables and contingency coefficients for
dummy variables.
According to Maddala (1992), VIF can be defined as: VIF(xi ) = 211
iR−
Where 2
iR is the squared multiple correlation coefficient between Xi and the other explanatory
variables. The statistical package known as SPSS was employed to compute the VIF values.
Once VIF values were obtained the R2 values can be computed using the formula. The VIF
values displayed in appendix Table 5 have shown that all the continuous explanatory variables
have no serious multi-collineartity problem. Similarly, contingency coefficients were
computed for dummy variables. The values of the contingency coefficients were also low
(appendix Table 6). Based on the above test both the hypothesized continuous and dummy
variables were retained in the model.
One of the assumptions in regression analysis is that the errors ui have a common variance
2σ . If the errors do not have a constant variance we say they are heteroscedastic (Maddala,
1992). In the general linear model, OLS estimates are consistent but not efficient when the
103
disturbances are heteroscedastic. In the case of the limited dependent variable models (such as
Tobit), the estimate of the corresponding regression coefficient is upward biased in the
presence of heteroscedasticity. But nothing can be said about the other coefficients and the
direction of the bias. It is more practicable to make some reasonable assumptions about the
nature of heteroscedasticity and estimate the model than just to say that Maximum Likelihood
estimates are inconsistent if heteroscedasticity is ignored (Maddala, 1997).
In this study, heteroscedasticity was tested for some suspected variables by running,
heteroscedatic Tobit using econometric software (Limdep). Market distance, distance from
input market, adoption score of current management fattening practices and knowledge of
fattening package were assumed as the possible sources of heteroscedasticity. It was found
that distance from input market and knowledge of fattening package statistically significant for
heteoroscedasticity, while market distance and adoption score for current management
practices were not significant. For the convenience of computing the marginal effects and
intensity of adoption the Tobit model was estimated by excluding the variables which were
found to be significant for hetroscedasticity (i.e. distance from input market and knowledge of
fattening package).
4.3.2. Explanation of the Significant Variables Influencing Intensity of adoption of the fattening package
Among explanatory variables hypothesized to influence agropastoralists in the intensity of
fattening package adoption, using descriptive statistics, about half of the variables were
found to have significant effects on adoption decision during descriptive analysis. A further
econometric analysis was done to see the degree of influence empirically of explanatory
variables on the independent variable (intensity of adoption). Thus the following section will
present and discuss empirical findings of the result of this study.
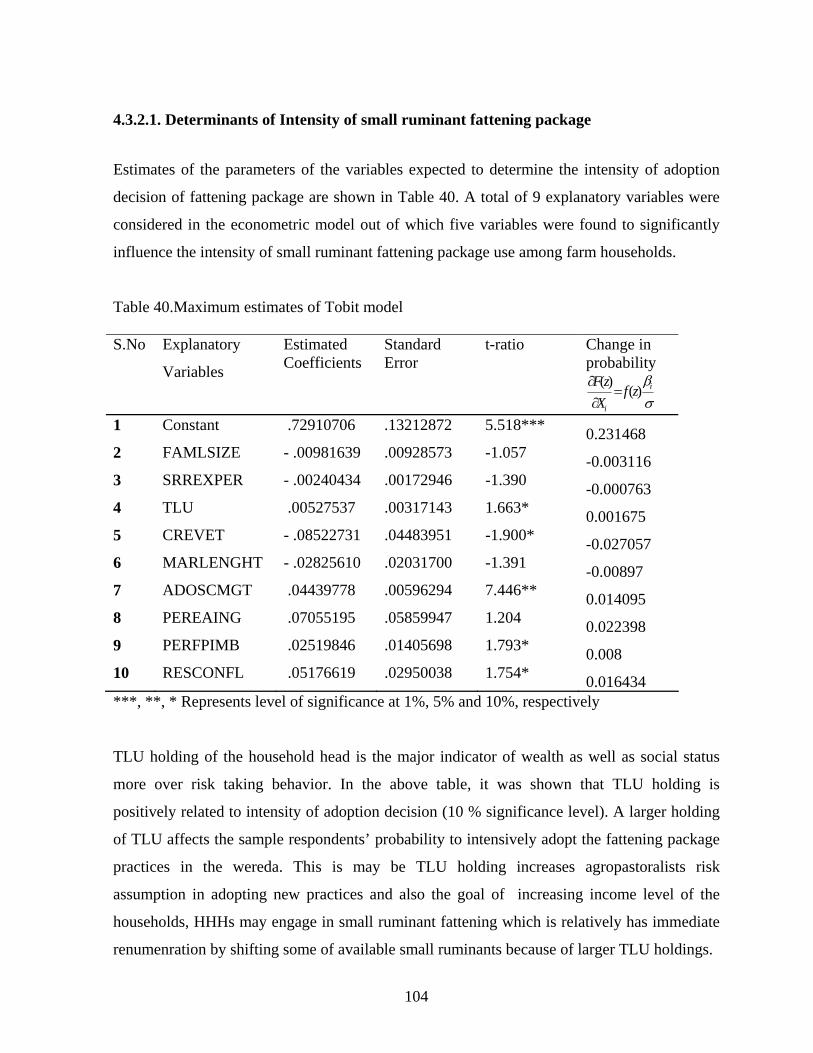
104
4.3.2.1. Determinants of Intensity of small ruminant fattening package
Estimates of the parameters of the variables expected to determine the intensity of adoption
decision of fattening package are shown in Table 40. A total of 9 explanatory variables were
considered in the econometric model out of which five variables were found to significantly
influence the intensity of small ruminant fattening package use among farm households.
Table 40.Maximum estimates of Tobit model S.No Explanatory
Variables
Estimated Coefficients
Standard Error
t-ratio Change in probability
σβi
i
zfXzF
)()(=
∂∂
1 Constant .72910706 .13212872 5.518*** 0.231468 2 FAMLSIZE - .00981639 .00928573 -1.057 -0.003116 3 SRREXPER - .00240434 .00172946 -1.390 -0.000763 4 TLU .00527537 .00317143 1.663* 0.001675 5 CREVET - .08522731 .04483951 -1.900* -0.027057 6 MARLENGHT - .02825610 .02031700 -1.391 -0.00897 7 ADOSCMGT .04439778 .00596294 7.446** 0.014095 8 PEREAING .07055195 .05859947 1.204 0.022398 9 PERFPIMB .02519846 .01405698 1.793* 0.008 10 RESCONFL .05176619 .02950038 1.754* 0.016434 ***, **, * Represents level of significance at 1%, 5% and 10%, respectively
TLU holding of the household head is the major indicator of wealth as well as social status
more over risk taking behavior. In the above table, it was shown that TLU holding is
positively related to intensity of adoption decision (10 % significance level). A larger holding
of TLU affects the sample respondents’ probability to intensively adopt the fattening package
practices in the wereda. This is may be TLU holding increases agropastoralists risk
assumption in adopting new practices and also the goal of increasing income level of the
households, HHHs may engage in small ruminant fattening which is relatively has immediate
renumenration by shifting some of available small ruminants because of larger TLU holdings.
105
Farmers who have access to credit can over come their financial constraints and therefore buy
inputs using the available credit. Farmers without cash and no access to credit will find it very
difficult to attain and adopt new technologies. Access to credit for veterinary purpose
(CREVET) was negatively influencing the probability of intensity of small ruminant fattening
package (significant at 10% level).The change in the amount of access to credit for veterinary
purpose of agropastoralists small to large decreases the probability of the credit used to keep
their small ruminants health. This implies that very small proportion of adopters had access to
veterinary credit and this credit access is also concentrated for only few socially active
villagers (PA councilors and local group leaders). Hence credit given to agropastoralists could
face diversion from its intended purpose, as the majority of credit users are having higher
TLU, which implies that large ruminants are more in proportion than small ruminants.
The current management practices of agropastoralists are one of the most important factors
that were assumed to affect intensity of adoption positively. If improved managements
practices are convenient and fit to ones practices, the individual is likely to use the package
more intensively. The result supports this assumption in that adoption score of management
practices is positively and significantly influences extent of fattening package adoption in the
study area ( significant at 5 % level ). In the results, it is shown that as higher adoption score
of management practices increases the probability of intensity of adoption of the fattening
package. The result confirms that the more the fattening package management practices nearer
to the current management practices of agopastoralists and pastoralists management practices,
the more convenient it would be. Management practices and agricultural technologies are
very closely related factors in any production activity. There is an established theory that
emphasize on technological convenience to farmers’ management practices by shoemaker
(1971) and then after many findings have shown that convenience of technologies and
management practices positively affect adoption decision (Saha et al; 1994).
Perception on availability of a particular technology and improved methods and its
profitability are another economic dimension of agropastoralists’ perception that affects extent
of use decision for specialization, for example, small ruminant fattening can be directly
affected by individuals’ selection of breed and other basic technologies for fattening. As

106
hypothesized in the variable definitions, perception on components of fattening package has
positive and significant influence on intensity of adoption decision.
The empirical result of the study also found out that perception on the availability of improved
breed is positive and significant at 10 % level. The stronger the perception of agropastoralists
on the availability of the improved breed, the more he uses selection of breeds for fattening
and the more extensive adopter of fattening package he would be and vice versa. The extent of
fattening package adoption decision increases by 0.8% as the perception on availability of
improved breeds of agropastoralist and pastoralist increases.
The low magnitude of change in probability of adoption decision may be explained by
perception is the resultant effects of several other factors which determine ones perception
currently on specific technology. Ones’ perception is a cumulative experience, knowledge and
attitude in evaluation of the importance, sources, means, and implementation techniques of
this technology. Perception of farmers on technologies selection and use has been found to
positively and significantly affecting farmer’s decision in the studies of (Guerin and Guerin,
1994).
Lastly, the point which remained to be discussed is that of agropastoralists’ feeling on security
of their locality due to resource competition. Conflicts are common in areas where scarce
resources (water points and grazing or pasture lands) are needed equally by all members of the
community and where these resources are common goods (“tragedy of the commons” theory
of resource economics applies in such cases). Moreover, adoption decisions is not merely
dependent on, usual characteristics like economical, social, demographic or physical
technologies and biological, it has also political and security aspects.
The result of this study found that as it was hypothesized, that security problems due to scarce
resources will influence intensity of adoption decision positively and significantly (10 %
significance level). As the agropastoralists’ feeling towards insecurity increases their decision
on the extent of fattening package particularly feed and watering components increases by 1.6
%. This implies that as insecurity feeling increases, which arises from local conflicts due to

107
scarce resources competition, agropastoralsits and pastoralists decision to feed small ruminant
under stall feeding, supplement and purchased feed would increase and also their management
decisions could changed accordingly. Adoption decision are influenced significantly by
political and insecurity than tenure security
4.3.2.2. Effects of Changes in the Significant Explanatory Variables on
Extent Adoption of fattening package
The results of the Tobit model can be used to identify the effects of changes in the explanatory
variables on the extent of fattening package adoption. Table 41, presents the effect of marginal
changes (derivatives) in explanatory variables on the extent of fattening package adoption
among adopters and among the entire sample households.
Table 41. The Effects of Change in the Significant Explanatory Variables on the extent of fattening package adoption
S.No Explanatory
Variables
Change among adopters
i
ii
XYYE
∂>∂ 0/( *
Change among the whole
i
i
xYE
∂∂ )(
4 TLU 0.00235763 0.002317 5 CREVET -0.03808912 -0.03926 6 ADOSCMGT 0.012628 0.01213 7 PERFIMB 0.1984191 0.019808 8 RESCONFL 0.0112615 0.011184 Log likelihood function = 35.28448 ƒ (z) =0.3752 Sigma )(σ = 0.19154920 F(z)=0.637 Z = 0.35
TLU holding of the household head increases intensity of adoption of fattening package by
0.235 among adopters and by 0.231 among the entire sample. An increase in the current score
management practices by a unit, increases the extent of fattening package adoption status of
the household heads by 0.1984 among adopters and by 0.0198 among the entire sample.

108
Except credit access for veterinary purpose (CREVET) a marginal change in other significant
variables have positive influence on the extent of fattening package adoption. On the average,
change in the credit access of the household head (from have no access to have access)
decreases credit used for veterinary purposes among adopters by 3.81 % by adopters and 3.93
% among the entire sample.
Current management practice of agropasoralists and pastoralists (ADOSCMGT) experience
with recommended management practices increases intensity of adoption of fattening package
adoption by a unit increase of management practice score of adopters by 0.012628 unit and the
whole sample by 0.01213 unit.
Similarly, unit change of the household heads perception on improved breed selection
information may result in intensity of adoption of fattening package decision increases by
0.0231 among adopters and by 0.0228 among entire sample.
Resource conflicts is dummy variable used in the analysis, i.e. (RESCONFL) feeling of
security has a positive influence. A change in the feeling/ perception of the households heads
to security in their village increases intensity of adoption of fattening package by 0.0231
among adopters and by 0.0228 among the entire sample.

109
5. SUMMARY, CONCLUSION AND RECOMMENDATION
5.1. Summary and Conclusion of Major Findings
Livestock in Ethiopia is the major source of income and means of livelihoods for most of the
rural people after crop production. The importance of livestock in general and small ruminants
in particular, has high significance for agropastoral and pastoral communities whose means of
livelihood is partially and totally dependent on livestock production respectively.
Contributions of small ruminants to rural people in economic employment and the value
addition to farm outputs, food security, socio-cultural, and environmental sustainability
through increase use of marginal lands, manure and farm waste are few of the recognized
importance of small ruminants in rural smallholders’ economy in Ethiopia.
Small ruminant production is undertaken among Meiso wereda agropastoralists extensively
after to large ruminants. The average holding of goats and sheep in household are 13.2 and
0.84 respectively. All sample households have more goats than sheep and there are few HH
which do not own sheep. New market has emerged for livestock species especially small
ruminants, cattle and camel both in the country and abroad (Middle East) in the last 10 years.
These new opportunities have motivated impact on agropastoralists’ to rear small ruminants
for market purpose. Thus changing their management practices and ways of their livestock
keeping becomes mandatory to be competent in the existing market. In addition, several
governmental and non governmental organizations working for improvements of these
communities have been making efforts to introduce, transfer and inform technologies and
improved management practices in small ruminant production. This study tried to highlight
agropastoralists evaluation of the extension services effort with respect to methods and
contents of the small ruminant fattening package. Further more, the study focuses on
identifying the factors that determine agropastoralists’ decision on the intensity of adoption of
fattening package in the wereda.

110
The sample sizes in each PAs sample units were determined proportional to the size randomly.
Both primary and secondary sources were used to have qualitative and quantitative data.
Descriptive statistical analysis methods were employed to measure central tendency and
measure of dispersions, frequency, mean, average, variances, and percentages. Besides mean
comparisons of independent samples, associations were analyzed using t-test and chi-square
tests. Descriptive statistics in this way gave some insight about the characteristics of sampled
units for the survey study. Perception was measured using a scale with items developed for the
purpose of the study. Attitude responses of sample respondents were measured using five
point Likert type attitude scales; total attitude score was worked out for each respondent and
tested using t-test and measure of dispersion to characterize the sample respondents.
Finally, explanatory variable found to be significant in the descriptive analysis were screened
to be further tested by Tobit model which is appropriate for analysis of censored and truncated
dependent variables. Intensity of adoption (adoption index) in this case is a continuous limited
dependent variable. Explanatory variables used to explain intensity of fattening package
adoption were tested for multicollinearity and linear association using VIF techniques for
continuous variables and contingency coefficients for dummies variables. More strong tests of
simultaneous effects of variable were done using heteroscedascity among variable suspected
of close associations but could not be screened by either VIF or CC analysis.
Descriptive results of the study show significant differences between adopters and non
adopters and the presence of relation between extent of fattening package adoption decisions
and explanatory variables such as family size, small ruminant rearing experiences, TLU,
market distance, current management practices adoption score, use of credit for veterinary
purpose, access to market information, importance of extension methods, frequency of radio
use, perception of agropastoralists on the availability of improved breeds, feelings of security
by sample respondents’ for the existencnce of conflicts due to scarcity of range lands and
water points, risk orientation, knowledge of fattening package components and distance to
input market.

111
Agropastoralists knowledge and communication are crucial in participation and evaluation
processes of extension services. Awareness of the existence of fattening package extension
services was positively and significantly related with dependent variable. Rural clients seek
information from multiple sources and often want to test the reliability of information before
being applied. Agropastoralists are not exceptional to this behaviour but the findings showed
adopters and non adopters were not significantly different in seeking multiple sources of
information. Despite the expectations of the research, about the relation of extension services
agents and sample respondents, the study found that there was no problem in communicating
agropastoralists with extension agents. This is may be due to the extension agents are living in
the villages also due to similarity of extension agents’ background with the community could
have lessened the degree of communication problem perceived by agropastoralists.
Focus area of extension services’ message were feeds, breeds, building shelter and shed, land
use practices, home economics and animal health services. It was found that there were no
significant differences among adopters and non adopters in receiving this information from
extension agents. Hence, while choosing different extension methods, it is better to give
emphasis to the combinations of demonstration with other extension methods to influence
large number of agropastoralists in the study area so that extent fattening package adoption is
increased.
Agropastoralists, however, did not reserve themselves from commenting the currently
undergoing extension services particularly fattening package extension services. Adopters and
non adopter respondents were found to be significantly different in their need on what the
extension services should do for them. The respondents were found to prioritize their
expectations as extension services is expected to diversify its services and particularly crop
production extension and animal health and veterinary information and services are critically
needed. It also shown in the result of this study that none of extension methods number of
participations were found to be significantly different between adopters and non adopters.
Trainings were delivered in wide areas, in which the majority of the sample, 66.89 % of total
respondents was not included in any of the training sessions of the extension programmes.

112
Perceptions of sample respondents on different attributes of fattening package contents were
not found to be significantly different between adopters and non adopters except the
perception on the availability of breed and breed information. This would imply that adopters
were using breed information and selection of breed for fattening package than non adopters at
least using the locally available better breeds. Attitude of sample respondents on fattening
package was not significantly different between adopters and non adopters. Attitude was
found to be positively related with the dependent variable.
The family size of the household (FAMLSIZE) is significantly different between adopters and
non adopters. Small ruminant rearing requires less labor than large ruminant keeping. Small
ruminant rearing requires herding and taking to water points which are mostly done by
children and /or women in the household. Thus households with large family size tend to
improve their small ruminant holding size and therefore will be more extensive adopters of
fattening package than the non adopters group.
Small ruminant rearing experiences of the sample respondents was significant but negatively
related with intensity of adoption decision, this negative relation may be as a result of large
proportion of non adopters had more experiences than adopters group and at the same time
they might have become rigid against changes influencing intensity of adoption decision
negatively.
TLU is another significant variable that affected decision on extent of fattening package
adoption. It was found in the result that TLU is negatively related with intensity of adoption
decision which implies that importance of small ruminant decreases as the TLU holding of
HHHs increases and this is may be higher TLU means more large ruminants and they get
higher priority than small ruminants.
The result of this study has also shown that, as the distance to market increases
(MARLENGHT) form the HHHs’ home place, the intensity of adoption decision decreases,
which implies negative relation between distance from market and intensity of adoption
decision. Thus, the more the time taken to reach to market the lesser they would become

113
interested to fatten and sell small ruminants, therefore the lesser they are interested in extent of
fattening package adoption.
The current management practices of agropastoralists is one of very important factors that
influence evaluation of HHHs’ on the suitability of the improved management practices with
their own practices (technological attributes evaluation in terms of management practices
convenience). ADOSCMGT, therefore it affects the intensity of adoption decision. The result
of this study, it has shown that current management practices score and intensity of adoption
were significantly and positively related and there were also significant differences between
adopters and non adopters
Access to credit is important for HHHs decision to assume more risks and enhance their
financial capacity to purchase inputs that complements package of technologies. In this study,
however, credit meant for veterinary purpose (CREVET) may found to be significant but
negatively related with extent of small ruminant fattening package adoption. The reason for
this negative relation could be, as it is discussed before, when the TLU holding of HHHs
increases accordingly the priority and interest of HHHs changes from small ruminants to large
ruminants. And hence credit taken to purchase small ruminants’ veterinary medicines will face
problem of fungibility. A diversion of small ruminants’ veterinary purpose credit to other
purposes of the HHHs is a common problem. This implies that credits taken in the name of
small ruminants veterinary purposes has lesser and lesser probability of being used to its
actually intended purposes.
Access to market information (MARACCES) is very important economic factor for the extent
of fattening package adoption. One’s access to information of goats and sheep as well as input
prices is thus determined by his/her access to market. The result of this study showed that
adopters and non adopters are significantly different in their assessment that they had access to
market information and market access of sample respondents is positively related with extent
of fattening package adoption decision. Information access to market price is important in
production decision of HHHs and the presence of attractive prices for their goats and sheep
and less expensive input prices could only be known to agropastoralists who have access to

114
market. This access to market information, in turn, affected by physical distances, HHHs
economic activities, infrastructural facilities and personal characteristics of individual HHHs’
such as eagerness to look for new information and make use of this for his/her economic
decisions.
Radio is the mass communication means in most developing rural societies. It is employed to
create awareness about something new or that is already existed but negatively conceived.
Nevertheless, radio ownership did not found to be significant and also could not explain the
differences among adopters and non adopters. The reason might be the economic status of
HHs in the wereda is nearly similar and /or information seeking behavior of the people is also
similar or because owning a radio is considered to be important equally by all members. The
other dimension of mass media exposure is frequency of radio use for agricultural news or
programmes (FRERADIO) which was used in this study as one of important explanatory
variable, and the result showed that the frequency of radio use is significantly different
between adopters and non adopters. Adopters being interested more in agricultural news and
programmes than non adopters and intensity of adoption decision is significantly and
positively related with the frequency of radio listening of respondents.
Perceived technology attributes of fattening package influences the extent of individuals
decision. Perception on the availability of improved breeds (PERFPIMB) is one among many
attributes of fattening package found to be significantly and positively influencing level of
adoption. Agropastoralists’ perception on the availability of breeds and breeding information
influences their decision significantly and positively to select goats and sheep breeds suitable
for fattening. Adopters therefore perceived information on improved breeds available in the
wereda than non adopters and hence adopters were using this information at least to select
their fattening breed from locally available better breeds.
Agropastoral and pastoral agroecologies are more recently under pressure for resource
degradation caused by world climatic change. Desertification is accelerating in sub Saharan
Africa at a rate of more rapidly than before. Livestock population increase in these
agroecologies aggravates desertification and natural resources degradation. Communities

115
dwelling in such natural setting do face problems in using these scarce resources. Such
problems become harsher when grazing lands or pasture lands and water points are considered
as common reserves and if these resources are shared either geographically or/and ethnically
among different communities will result always problems of “the tragedies of the commons”.
Then conflicts become the day to day experiences of agropastoralists living in this
environment.
The result of the study showed that feelings of respondents’ for the presence of insecurity or
conflicts (RESCONFL) due to scarcity of range lands and water points and intensity of
adoption decision of fattening package found to be statistically and positively related and there
were also found to be clear differences among adopters and non adopters. This result implies
that adopters feel more insecure than non adopters in the villages and thus they keep their
small ruminant animals more frequently under stall feeding or cut and carry system also use
more of other types of feed such as supplements, industrial by-products, clean water supplies
and finally keep sanitation of the small ruminants more than the non adopters do.
Risk taking is proxy indicator of financial and economic strength of HHHs. Risk orientation is
then behavior of HHHs that is explained by the capability of HHHs to assume taking risk and
to withstand failures associated with ones’ decision. Risk orientation of HHHs towards small
ruminant rearing (PEREAING) was shown to be positively and significantly associated with
ones’ extent of fattening package adoption. Moreover, the result showed that there were
significant differences between adopters and non adopters in their orientation to risk by
rearing small rumiants. This finding could be extrapolated, by saying that adopters had
experience in price rewarding fattening businesses and got relatively higher income from
similar production so that it would be easy to decide to rear small ruminants with associated
risks being taken into consideration than non adopters.
Knowledge of fattening practices was used in the study in the sense that awareness and
appropriate information is within HHHs understanding. The study evidence that adopters were
exposed to suitable condition to have more knowledge of feed, animal health and sanitary
keeping and other knowledge of management practices than non adopters. The study also

116
showed the existence of positive and significant relation between knowledge and extent of
fattening package adoption. There were significant differences between adopters and non
adopters in the level of knowledge on fattening package.
Identifying the availability of input in any technology adoption is very important step in
adoption decision processes. Input may not be available in the same market where farm HHs’
outputs are sold. Distance to input market (DISINPU) thus becomes another explanatory
variable used to explain the decision of HHHs extent of decision on fattening package
adoption. It was found in the study that extent of fattening package adoption and distance to
input market were significantly but negatively related. And also there were significant
differences between adopters and non adopters in their nearness to input market. Negative
relation between intensity of adoption and input distance would mean that the far the input
market, the lesser the intensity of adoption of fattening package.
Econometric results showed that among fourteen descriptively significant explanatory
variables, only five have been found to be significantly affecting intensity of adoption of
fattening package. Tobit model output showed that the most powerfully influencing
explanatory variables that positively and significantly determine extent of fattening package
adoption decision were perception on availability of improved breed (PERFIMB), current
management practice score (ADOSCMGT) and total livestock holding (TLU) while access to
credit for veterinary purpose (CREVET) and the distance of market from the households in
terms of hours (RESCONFL) were negatively and significantly determining the extent of
fattening package adoption by adopters in the wereda.

117
5.2. Recommendations
Extent of small ruminants fattening package adoption was shown to be influenced by a
number of explanatory variables that have already been discussed in the previous sections.
Characteristics found to be very important in defining agropastoralists behavioral decision
making factors were thus identified in this research. Among a large number of explanatory
variables hypothesized to have significant and positive or negative relationship and influence
on the extent of fattening package adoption, only five were found to be significantly related
and determining the extent of fattening package adoption. Therefore, the final step in this
research processes is to indicate the identified problems and the way forward that is
alternatively could be managed to increase the effectiveness of the extension system on one
hand and increasing the productivity of agropastoralists by adopting more intensively small
ruminants’ fattening package on the other hand.
Thus following recommendations are made based on empirical findings that were discussed in
the previous sections of the study:
Total livestock holding of HHHs (TLU) is very important for increasing HHs’ food security,
wealth status and income level etc. Small ruminants have proportionate share in the TLU
holding of the HHHs and therefore agropastoralists need to be made aware of the economic,
environmental, social values of small ruminants so that they give equal considerations in
decisions of choosing in investments of adopting livestock technologies so that they prioritize
small ruminants among the different livestock species.
Improved management practices should be considered for its fitness with the currently
practiced management techniques of agropastoralists, before they are demonstrated and
transferred. This implies the extension systems of the wereda need to have well identified and
studied agropastoralists and pastoralist current management practices so that compatibility of
improved management practices and also its fitness to the prevailing conditions and farming
systems’ context is optimized.

118
Agropastoralists’ and pastoralists’ perception on the availability of better breeds need to be
made improved by provisioning of information on breed selection techniques. The first step in
making agropastoralist and pastoralists revise their perception in breed assessments is to start
teaching and training how the locally available breeds could be identified for different
purposes. Making extensive efforts in selection criteria for better breed information
disseminations, breeding techniques demonstration and training are expected from extension
agencies to increase agropastoralists perception on availability of improved breed.
Access to credit intended for small ruminants was observed to be diverted for other purposes
than its intended goal. This credit fungibility could be corrected by taking appropriate
measures such as selection criteria must be revised since, agropastoralists who had access to
credit were those having very high TLU which could imply that large ruminants being favored
more than small ruminants. The other criteria was that only those who were socially active
had access and thus the core aim of improving health and veterinary services for small
ruminant is lost. Therefore selection criteria need to be critically examined before extending
credit services to small ruminants’ holder. Extensive follow ups in the application of credit
money to its intended purpose is another mandatory procedure that credit providers must
undertake to facilitate intensive technology adoption of small ruminant fattening package.
Distance to market is very important determining factor that negatively influencing extent of
fattening package adoption. One way forward to increase market access of rural people is to
improve the physical infrastructure of the institutions to facilitate linkage and frequent visits.
This would be possible by allowing niche markets and small businesses to flourish very close
to or in the villages which ultimately could develop to local market or well developed market
places where agropsatoralists and pastoralists can easily and with lower transaction costs
exchange their outputs and inputs. The other possible way out, but capital intensive decision
would be, to increase the number of dry and all weather roads in each PAs to close average
distance gap and as a result transportation and vehicles could be easily accessible so that rural
people visit to near by local market more frequently.
119
Qualitative information obtained from focus group discussion shows that marketing of small
ruminants and market infrastructures, prices of small ruminants were low for the owners while
the middlemen are making treasure from the agropastoralists’ and pastoralists’ small
ruminants. Thus, any agency concerned in agropastoralists of the wereda and similar system
needs to extend immediate support. Empowering them by organizing producers’ or business
oriented cooperatives is one possibility so that they can have upper hand in dealing the prices
of their small ruminants and / or also in determining profit margins they could get. The other
important insight to improve productivity of small ruminants and hence to increase income
level would be, to encourage input dealers at local levels so that input demand be satisfied
within PAs of the Wereda.
The poor performance in knowledge test on small ruminant fattening package by both
categories of respondents (even adopters) indicates the deficiency of technology information
dissemination among agropastoralists. Adopters show improvements in the small ruminants
rearing by using some of the change messages in their traditional means of rearing This
situation calls for extensive dissemination efforts on small ruminants fattening package to be
designed and implemented by the agencies /institutions working for improving the life of
pastoralists and agropastoralists .this can be through village based trainings to farmers
,trainings for kebele leaders and administrators, and organizing informal groups such attempts
should be dovetailed with local availability of needed inputs.
The qualitative data revealed the important roles played by women in small ruminant rearing
among pastoralists and agropastoralists. Their vital role in managing small ruminants at home
points out to the need of recognizing them also as farmers and giving due attention by the
extension agencies or institutions. Input availabilities, extension methods and approaches,
training themes, small ruminant management practices such as feeding, watering, animal
health caring (which are mainly women’s role) should be critically evaluated for their
adequacy, addressing women as important target, matching with real situation problems of
small ruminant production associated with women management practices in the study area and
similar context in Ethiopia

120
This study had found some hypothesized explanatory variables to be insignificant in study
area. These insignificant explanatory variables were age, small ruminant rearing experience,
family size, educational levels, frequency of extension contact, frequency of radio use, market
information access, house type owned, training, total household income, knowledge, attitude,
and distances to feed and water resources. Therefore the result of this study recommends
more adoption and extension communication studies need to be further detail analysis of
explanatory variables in such different context (agropastoral and pastoral) in fields of
adoption, agricultural extension and communication areas.

121
6. REFERENCE
Abay Asfaw and Assefa Admassie, 1996. The impact of education on allocative and technical
efficiency of farmers the case of Ada Berg. J. Ethiopian Economics Society.
Abdulai, A and W.E. Huffman, 2005. The diffusion of new agricultural technologies: the case of crossbred-cow technology in Tanzania. J. American Agricultural Economics. 87(3): 645-659
Abera Birhanu, 2003. Factors influencing the adoption of soil conservation practices. J. Agricultural Economic Society of Ethiopia. 1: 63-84
Adhikari, S. R. and Patel, A. A., 1986. Socio-psychological correlates of technology utilization by Nepalese farmers. J. S.K.N. College of Agriculture. 11(2):52–54
Aicha El. A., and Waterhouseb, 1999. Small ruminants in environmental conservation Small. J. Ruminant Research. 34: 271-287
Alex G., Willem Zijp and Derek Byerlee, 2002. Rural Extension and Advisory Services: New Directions. World Bank, Washington DC.
Allport, G., 1967 “Attitudes” In: Fishbein (ed.). Readings in Attitude Theory and Measurement. John Willey and Sons Inc., New York.
Amemiya, T., 1985. Advanced Econometrics. T. J. Press Padstaw Ltd., Great Britain.
Anderson, J.R. and Feeder, G., 2002.The Rural Extension Services. WB Agricultural Development Department, Washington D.C.
Arene, C.J., 1994. Discriminant analysis of small holder farmer adoption potential and the
prediction of extension cost in Nigeria: a comparative enterprise perspective. J. Extension
System 10 (1): 46–58.
Arnon, I., 1989. Agricultural Research and Technology Transfer. Elsevier Science Publishers ltd., London and New York.

122
Asfaw Negassa, Kisa Gunjal, Wilfred Mwangi and Beyene Seboka, 1997. Factors affecting
the adoption of maize production technologies in Bako area, Ethiopia. J. Ethiopian
Agricultural Economics 1(2): 52-72
Baldwin, J. and M. Rafiquzzaman, 1998. The determinants of the adoption lag for advanced
manufacturing technologies. In: Louis A. Lefebvre, Robert M. Mason and Tarek Khalil (eds.)
Management of Technology, Sustainable Development and Eco-Efficiency. Elsevier Science
Ltd, UK.
Bekele Shiferaw and S.T. Holden, 1998. Resource degradation and adoption of land and water
conservation decision behavior of subsistence farmers in the eastern highlands of Ethiopia a
case study of the Hunde-Lafto area. J. Ecological Economics 46:437-451
Berhnu Bedassa, 2002. Analysis of factors affecting the adoption of crossbred dairy cows in the central highlands of Ethiopia. An MSc Thesis presented to the School of Graduate Studies of Alemaya University.
Berhanu G., and Swinton S M, 2003. Investment in soil conservation in northern Ethiopia: The role of land tenure security and public programme. J. Agricultural Economics. 29:69-84
Brunstein, J. C., and Maier, G. W., 2005. Implicit and self-attributed motives to achieve: Two separate but interacting needs. J. Personality and Social Psychology. 89: 205-222
Bulale, A.I., 2000. Smallholder dairy production and dairy technology adoption in the mixed farming system in Arsi highlands of Ethiopia. Dissertation. University of Berlin. German.
Burton, M., Rigby, D and Young, T., 1999. Analysis of the determinants of adoption organic horticultural technique in the UK. J. Agricultural Economics 50(1): 47-63
Chein, I., 1967. “Behavior Theory and the Behavior of Attitudes: Some Critical Comments. In: Fishbein (ed.). Readings in Attitude Theory and Measurement. John Willey and Sons Inc., New York.
Chilot Yirga, Shampiro, B.I, and Mulat Demeke, 1996. Factors Influencing doption of new technologies in Wolmera and Addis Alem Areas of Ethiopia. J. Ethiopian Agricultural economics. 1:63-83

123
Coppock, D.L., 1990. The Arid and Semi-arid Lowlands of Ethiopia: Environments, Pastoral Economies and Issues In National Resources Sustainability. Paper Presented at the First Natural Resources Conservation Conference. IAR, 7-8 Feb. Addis Ababa
Croppenstedt, A., Mulat Demeke and Meshi, M., 1999. An empirical analysis of demand for fertilizer in Ethiopia.” J. Ethiopia Agricultural Economics. 3: 1-27
CSA, 2004. Annual report of EFDRE Central Stastical Authority Addis Ababa.
Dejene A., 1995. Agricultural development in Ethiopia (?) In: Dejene A. and Mulat D. 1995(eds.). Ethiopian Agriculture: Problems of Transformation. Proceedings of the Fourth Annual Conference on Ethiopian Economy. pp. 65-86. Addis Ababa, Ethiopia.
Dejene Abesha, ,Aragay Waktola , Jens B. Aune, 2000.Agricultural Extension in the Drylands of Ethiopia. Dry Lands Coordinating Groups. Ethiopia.
Dereje Hamza, 2006. Assessment of farmers’ evaluation criteria and adoption of improved bread wheat varieties. An MSc Thesis presented to the School of Graduate Studies of Alemaya University.
Ebrahim Jemal, 2006. Adoption dairy innovations: its income and gender implications in adami tulu district . An MSc Thesis presented to the School of Graduate Studies of Alemaya University.
Eadie, J. and Maxwell, T.J., 1975. Systems research in hill sheep farming. In: G.E. Dalton
(ed.), Study of agricultural systems. Applied Science Publishers Ltd., London, UK. 441 pp.
Fishbein, M., 1967. A consideration of beliefs, and their role in attitude measurement. In: Fishbein (ed.). Readings in Attitude Theory and Measurement. John Willey and Sons, NewYork.
Feder, G., 1985. The Relationship between Farm Size and Farm Productivity: The Role of Family Labor, Supervision and Credit Constraints. J. Development Economics.18(2-3):297-313.
Feder, G., and Slade R., 1984. The acquisition of information and the adoption of new
technology. J. American Agricultural Economics 66: 312-320

124
Fergusson MF., 1994.The Dynamics of Growth of Sheep Farms:Farm Management Case-
Studies on The Northern Stablelands of New South Wales. University of New England Farm
Management Report, No.17, Armidale.
Fomunyam, R.T. and Meffeja, F., 1986. Maize stover in maintenance diets for sheep and goats
in Cameroon. In: T.R. Preston and M.Y. Nuwanyakpa (eds), Towards optimal feeding of
agricultural by-products to livestock in Africa. Proceedings of a workshop held at the
University of Alexandria, Egypt, October 1985. ILCA, Addis Ababa, Ethiopia. pp. 135-139.
Falusi, A.O., 1974. Multivariate Probit: Analysis of selected factors influencing fertilizer adoption among farmers in West Nigeria. J. Nigerian Economic and Social Study.16: 3–16
Getahun Degu, M. Mwangi, H. Verkuijil and A. Wondimu., 2000. An assessment of the
adoption of seed and fertilizer packages and the role of credit in smallholder maize production
in Sidama and North Omo Zones, Ethiopia. EARO, CIMMYT, November, 2000.
Glendinning Anthony, Ajay Mahapatra, and C. Paul Mitchell, 2001. Modes of communication and effectiveness of agroforestry extension in Eastern India. J. Human Ecology. 29(3)
Green, D. and H. Ngongola, 1993. Factors affecting fertilizer adoption in less developed
countries: an application of multivariate logistic analysis in Malawi. J. Agricultural Economics
44 (2): 99-107
Greene, W., 1997. Econometric Analysis, Third ed. Prentice-Hall, New Jersey.
Greene William, 2005. Censored data and truncated distributions. Retrieved from http://www.stren.nyu.edu/-wgreene on February 2007.
Guerin L.J. and Guerin T.F., 1994. Constraints to the adoption of innovations in agricultural research and environmental management. J. Australian Experimental Agriculture 34:549-571
Gujarati, N. 1995. Basic Econometrics. Third ed. McGraw-Hill,Inc, New york.

125
H.P.S.Arya and Mahesh Chander, 2003. Goat production by landless and small scale farmers
in North Indian plains. retrieved on September 15 2007,
http://conference.ifas.ufl.edu/ifsa/papers/a/a10.doc.
Habtemariam Kassa, 2000. Livestock production, household food security and sustainability in smallholder mixed farms A case study from Kombolcha Wereda of Eastern Ethiopia. Masters Thesis Swedish University of Agricultural Sciences, Department of Rural Development Studies, Uppsala. Sweden.
Haji Biru, 2003. Adoption of crossbred dairy cows in Aris Zone, The case of Tiyo and Lemu Bilbilo Woreds. An MSc Thesis presented to the School of Graduate Studies of Alemaya University.
Harper, J., Rister, M., Mjelde, J., Drees, B., Way, M., 1990. Factors influencing the adoption
of insect management technology. J. American Agricultural Economics 72 :997–1005
Hardt, L. T., 1981. Decision Making Roles in the Rural Household and the Adoption and Diffusion of an Improved Maize Variety in Northern Shaba Province, Zaire. Unpublished PhD Thesis, Iowa State University.
ILRI- IPMS, 2004. Survey Report. ILRI Addis Ababa.
Itana Ayana, 1985. An analysis of factors affecting the adoption and diffusion pattern of
packages of agricultural technologies in subsistence agriculture: a case study in two extension
districts of Ethiopia. An M Sc Thesis Presented to the School of Graduate Studies of Addis
Ababa University. 147p.
Johnston, J. and Dinardo, J., 1997. Econometrics Methods, Fourth Edition. The McGraw-Hill,
New York.
Kebede Manjur, 2006.Farmers’ perception and determinants of land management practices in Ofla wereda, Southern Tigray, Ethiopia . An MSc Thesis presented to the School of Graduate Studies of Alemaya University. Kedir Bati, 1998. The Role of SG2000 Project Credit System in The Adoption of Wheat Technologies By Smalholder Farmers in Ethiopia. The case of Hetosa District. M. Sc. Thesis, Sokoine Agricultural University, Morongono, Tanzania.

126
Kenneth F. G. Masuki , Khamaldin D. Mutabazi, Siza D. Tumbo,Filbert B. Rwehumbiza Amon Z. Mattee and Nuhu Hatibu, .2005..Determinants of Farm-level Adoption of Water Systems Innovations in Dryland Areas: The Case of Makanya Watershed in Pangani River Basin, Tanzania www.swmrg.suanet.ac.tz retrieved on February 2007.
Kriengsak P., 1996. Influences of social structure on the diffusion and adoption of recommended goat husbandry practices. J. Soc. Sci. 17: 196-206
Legesse Dadi, 1992. Analysis of factors influencing adoption and the impact of wheat and maize technologies, In Arsi Negele, Ethiopia. An MSc Thesis presented to the School of Graduate Studies of Alemaya University.
Lelissa Chalchisa, 1998. Determinants of Adoption And Intensity and Prfitabilty of Fertilizer Use. The Case of Ejere District. M. Sc. Thesis Addis Ababa University.
Lowdermilk, M. K., 1972. Diffusion of Dwarf Wheat Production Technology in Pakistan’sPunjab, Unpublished PhD Thesis, Cornell University.
Maddala, G.S., 1992. Introduction to Econometrics, second edition, Macmillan publishing company, New York.
Makokaha, h., H. Odera, I.I.K.Maritim, J.K.Okalebo, D.M.Iruria, 1999. Farmers’ perception and adoption of soil managment technologies in Western Kenya. J. African Crop Science 7(4): 549-558
McDowell, R.E. and Bove, L., 1977. The goat as a producer of meat. Cornell University Press, Ithaca, New York. .
MEDaC (ministry of Economic Development and Cooperation), 1998. Survey of livestock and fisheries development. MEDaC Agricultural Development Department, Livestock Team, Addis Ababa, Ethiopia.
Mesfin Duguma, 2006. Farmers’ perception on soil erosion and decision on land management in assosa wereda, Ethiopia . An MSc Thesis presented to the School of Graduate Studies of Alemaya University.
Mekuria.Mulugeta, 1995.Technology Development and Transfer in Ethiopian Agriculture:An Empirical Evidence. Proceedings of the Inaugural and First Annual Conference of the Agricultural Economics Society of Ethiopia.

127
Million Tadesse and Belay Kassa, 2004. Determinants of Fertilizer use in Gununo area,
Ethiopian Agricultural Research Organization (EARO), Addis Ababa, Ethiopia.
Molla Tafere, 2005. Farmers’ Response and Willingness to Participate in Water Harvesting Practices: a case study in Dejen district/East Gojam zone. An MSc Thesis presented to the School of Graduate Studies of Alemaya University.
Newbold, P., 1974. The improvement of hill sheep for agriculture. J. British Grassland Society 29: 241
NKonya Ephraim, Ted Schroeder and David Norman, 1997. Factors affecting adoption of improved maize seed and fertilizer in Northern Tanzania. J. Agricultural Economics. 48(1):1-12
Nowak, J., 1987. The Adoption of agricultural conservation technologies: economics and diffusion explanations. J. Rural Sociology 52:208-220
Oladele, O.I .2005. Determinants of adoption behaviour of alkali soil reclamation technology: a discriminate function approach”. J. Indian Soil Conservation. 24(2):165-168
Peacock, C., 1996. Improving goats production in the tropics. A manual for development workers. Oxfam Publications, Oxford .England, pp. 387.
Peacock, C., 2005. Goats: unlocking their potential for Africa’s farmers. Paper presented at the 7th conferences for ministers responsible for animal resources 1st October -4th December. Kigali. Rwanda.
Pender, J. and Birhanu Gebremedhin, 2004. Impact of policy and technologies in dry land agriculture: Evidences from Northern Ethiopia. Crop Science Society of America and American Society of Agronomy, 677 S. Segoe Rd., Madison, WI 53711, USA. Challenges and Strategies for Dry land Agriculture. CSSA Special Publication no.32. pp389-416.
Ramasamy, C., Cynthia S. Bantilan, S. Elangovan and M. Asokan, 1999. Perceptions and Adoption Decisions of Farmers in Cultivation of Improved Pearl millet Cultivars: A Study in Tamil Nadu. J. Indian Agricultural Economics. 54(2)
Rivera, W., 2001. Agricultural and Rural Extension Worldwide: Options For Institutional Reform In The Developing Countries. FAO.
128
Robertson and Wimalasuriya, 2004. Limitations to pasture and sheep enterprises and options for improvement in the Victorian Mallee. J.Australian Experimental Agriculture.
Rogers E M., 1962. Diffusion of Innovations. First Edition. New York: Free Press.
Rogers, E. M. and F.F., Shoemaker, 1971. Communication of Innovation: A Cross-cultural Approach. Second Edition. The Free Press, New York. 476p.
Rogers E.M., 1995. Diffusion of Innovation, Forth edition. The Free University Press, New York.
Rogers E.M., 2003. Diffusion of Innovations, Fifth Edition. Free Press, New York.
Sabine Homann, Gemedo Dalle, Barbara Rischkowsky, 2004. Potentials and constraints of indigenous knowledge for sustainable range and water development in pastoral land use systems of Africa a case study in the Borana Lowlands of Southern Ethiopia TOEB. Eschborn. Germany.
Saha, A., Love, H. A. and Schwart, R., 1994. Adoption of emerging technologies under output uncertainty. J. American Agricultural Economics 76:836-846
Sim, D., and Hilmi, H. A., 1987. Forestry extension methods. FAO Forestry Paper 80, FAO.Rome.
Scott T. R., 2006. Effects of Achievement Motivation on Behavior. Rochester Institute of Technology.
Senkondo, E, Y. Mdoe, N. Hatibu, H. Mahoo, J. Gowing, 2004. Factors affecting the adoption of rainwater harvesting technologies in Western Pare Lowlands of Tanzania. J. Tanzania Agricultural Science 1 (1)
Weir, S., Knight, J., 2000. Adoption and diffusion of agricultural innovations in Ethiopia: the role of education. Centre for the Study of African Economies Working Paper Series 2000-5, Institute of Economics and Statistics, University of Oxford, UK.
Sintayehu G. M., 1993. Livestock Marketing in the Pastoral Areas of Ethiopia. A Paper Prepared for a Workshop on Pastoralism in Ethiopia, Organised by MoA and NGOs. Addis Ababa.
129
Sseguya, H., A.R. Semana, M.A. Bekunda, 1999. Soil fertility management in the banana
based agriculture of central Uganda: Farmers constraints and options. J. African Crop Sci. 7 (4):559-567
Storck, H., Bezabih Emana, Birhanu Adnew, A. Borowiecki and Shimeles W/Hawariat, 1991. Farming Systems and Farm Management Practices of Small Holders in the Hararghe Highlands: Farming systems and resources economics in the tropics. Wssenshaftsver lag vauk, Kiel, Germany. 11: 41-48
Tait, R.M., 1973. The utilization of dried grass by early weaned lambs. J. British Grassland Society 27 (4): 217-220
Tambi, E.N., 1985. Income risk in livestock and poultry production: The case of dairy and egg production in the North West Province of Cameroon. J. Science and Technology 1 (4): 31-38
Techane Adugna Wakjira, 2002. Determinants of fertilizer adoption in Ethiopia: The case of major cereal production areas. An MSc Thesis presented to the School of Graduate Studies of Alemaya University.
Tennasie Nicola, 1985 Agricultural Research and Extension in Ethiopia: The state of the art, Institute of Development Research (IDR), Research Report No 22, Addis Ababa University, Addis Ababa.
Teressa Adugna, 1997. Factors influencing adoption and intensity of use of fertilizer: the Case of Lume District, Central Ethiopia. J. International Agriculture 36:173-187
Tesfay Beshah, 2003. Understanding Farmers: explaining soil and water conservation in Konso, Wolayta, and Wello, Ethiopia, PhD Dissertation Wagenningen University and Research Centere.
Tesfaye worku, 2006. Analysing factors affecting adoption of rainwater harvesting technology in Dugda Bora wereda, East Shewa, Ethiopia. An MSc Thesis presented to the School of Graduate Studies of Alemaya University.
Tesfaye Zegeye and Alemu Haileye, 2001. Adoption of Improved Maize Technologies and Inorganic Fertilizer in Northern Ethiopia: Research report no. 40. EARO, Addis Ababa, Ethiopia.
Vaclay, F. and G. Lawrence, 1994. Farmer rationality and the adoption of environmentally sound practices; a critique of the assumptions of traditional agricultural Extension. J. European Agricultural Education and Extension. 1(1):58-83

130
Van de Ban and A.W. Hawkins, 1998. Agricultural Extension, Second Edition. Blackwell Science, the Netherlands. 249p.
Voh, J. P., 1982. A study of factors associated with the adoption of recommended farm practices in a Nigeria village. J. Agricultural Administration. 9:17-27
WBPRD, 2005. Meiso office of Pastoralists and Rural development Annual Report. Meiso Wereda.
WBPRD, 2006. Meiso office of Pastoralists and Rural development Annual Report. Meiso Wereda
Wibaux, H., 1986. Agriculture in the highlands of hararghe, Kombolcha Area. Study of Six Farms Alemaya University of Agriculture. Department of Agricultural Economics/French Technical Cooperation. Dire Dawa Ethiopia.
Wolday Amha, 1999. Improve seed marketing and adoption in Ethiopia. J. Ethiopian Agricultural Economics. 3:41-80
Wolfgang Bayer and Ann Waters-Bayer, 2002. Participatory monitoring and evaluation (PM&E) with pastoralists: a review of experiences and annotated bibliography. GTZ.Eschborn, Germany.
Yenealem Kassa, 2006. Gender disparities in adoption of improved maize varieties between male headed and female headed households in Kuni Wereda, Western Hararghe Zone, Ethiopia. An MSc Thesis presented to the School of Graduate Studies of Alemaya University.
Yassin Hussein, .2005. Sustainable pastoral production system under pressure: a case study of Somaliland’s pastoral production system Bachelor’s course .Lund University.
Yohannes Kebede, Gongal, K and coffin, G., 1990. Adoption of new technologies in Ethiopia the case of Tegulat Bulga District, showa province. J. Ethiopian Agricultural economics. 4:22-31

131
7. APPENDICES
Appendix Table.1. Sample HHHs by sex category
adopters non adopters Total HHHs sex N % N % N %
Male Female
91 7
92.90%7.10%
46 7
86.80% 13.20% 14 9.27
Source: own survey, 2007 Appendix Table.42. Categorization of samples respondents into four adopter groups
Adopters group Adoption index
Non Adopters Low Adopters Medium Adopters
High Adopters N
Total %
0.94-1.47 51 0 0 0 51 33.771.48-1.56 0 27 0 0 27 17.881.57-1.76 0 0 37 0 37 24.5 1.77-2.54 0 0 0 36 36 23.84
Source: own survey, 2007 Appendix Table.3. Conversion factors used to calculate Tropical Livestock Units (TLU)
Animals
TLU-equivalent
Calf 0.25 Heifer & Bull 0.75 Cows & Oxen 1.00 Horse 1.10 Donkey 0.70 Ship & Goat 0.13Chicken/poultry 0.013 Source: Strock et al., (1991)
Appendix Table 4. Selection criteria used and PAs that fulfill the criteria
criteria Peasant associations
1.Peace and security Chachole, Deineba hunde missoma,Oda kenini, Harmaro mete deima
2.Proximity and accessibility for main road and market
Chachole, Deineba hunde missoma,Oda kenini, Harmaro mete deima
3.Orientation to small Chachole, Deineba hunde missoma,Oda kenini, Harmaro
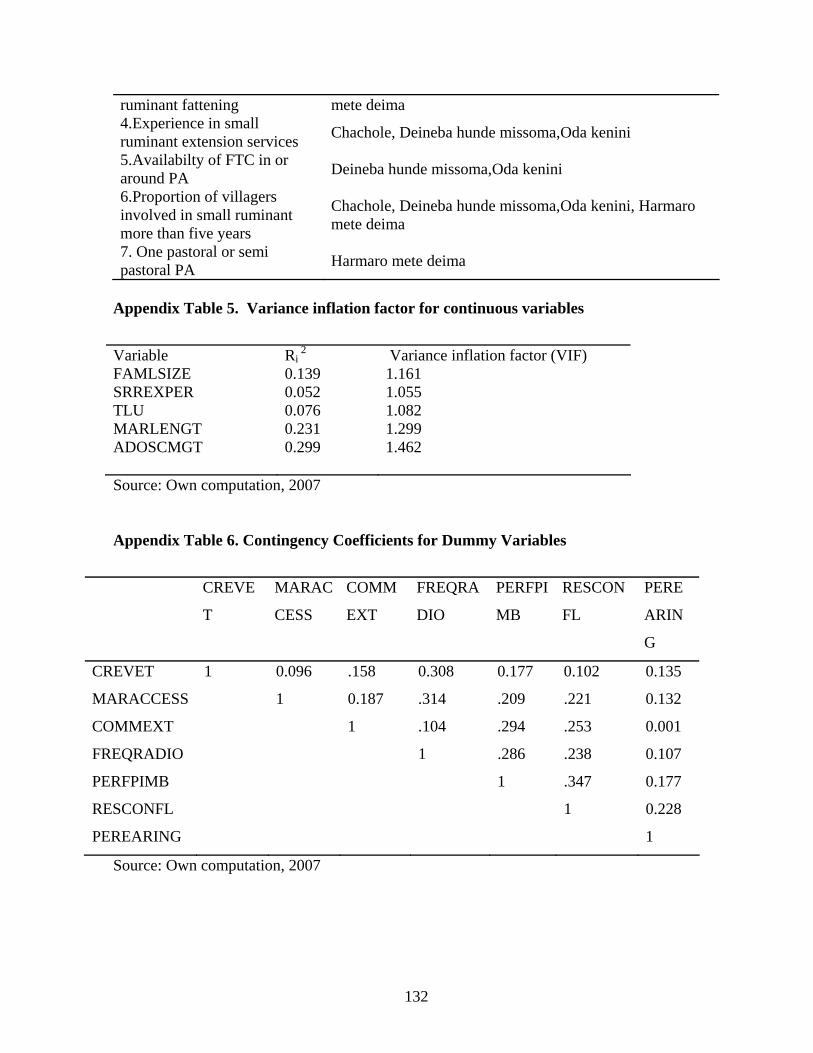
132
ruminant fattening mete deima 4.Experience in small ruminant extension services Chachole, Deineba hunde missoma,Oda kenini
5.Availabilty of FTC in or around PA Deineba hunde missoma,Oda kenini
6.Proportion of villagers involved in small ruminant more than five years
Chachole, Deineba hunde missoma,Oda kenini, Harmaro mete deima
7. One pastoral or semi pastoral PA Harmaro mete deima
Appendix Table 5. Variance inflation factor for continuous variables
Variable FAMLSIZE SRREXPER TLU MARLENGT ADOSCMGT
Ri 2
0.139 0.052 0.076 0.231 0.299
Variance inflation factor (VIF) 1.161 1.055 1.082 1.299 1.462
Source: Own computation, 2007
Appendix Table 6. Contingency Coefficients for Dummy Variables
CREVE
T
MARAC
CESS
COMM
EXT
FREQRA
DIO
PERFPI
MB
RESCON
FL
PERE
ARIN
G
CREVET 1 0.096 .158 0.308 0.177 0.102 0.135
MARACCESS 1 0.187 .314 .209 .221 0.132
COMMEXT 1 .104 .294 .253 0.001
FREQRADIO 1 .286 .238 0.107
PERFPIMB 1 .347 0.177
RESCONFL 1 0.228
PEREARING 1
Source: Own computation, 2007

133
Appendix: Interview schedule .Interview schedule for the research title “Adoption of Small Ruminants’ Fattening Package in Agropastoral Areas, Meiso Wereda, Eastern Oromia ” in Meiso Wereda, Ethiopia
1. Household Characteristics Name___________________________________ 1. Age (Number of years) ________ 2. Educational level ( ) Illiterate ( ) functionally literate ( ) 1-4 grade ( ) 5-8 grade ( ) >8 grade 3. Sex Male ( ) Female ( ) 4. Marital status Single ( ) Widow ( ) Married ( ) Widower ( ) Divorced ( ) 5. Religion of the farmer: ( ) Orthodox ( ) Protestant ( ) Catholic ( ) Muslim ( ) Others (specify) 6. Ethnicity ( ) Afar ( ) Oromo ( ) Somali ( ) Others 2. Household farming and small ruminants rearing status of households 2.1. Family size/labor supply No Name of family
member Relation to household head (circle one) W, S, D, R
Sex Age Education Level (years in school)
7 8 9 10 11 12 W=wife, S=son, D=daughter, R=relative 2.2. Labor availability and use 13. Did you experience labor shortage in small ruminants rearing/keeping? ( ) Yes ( ) No 14. If yes, for which rearing practice? List down the lists of each practice ------------------------------------------------------------------------------------------------------------------------------ 15.What are the busiest times of year for you and your family in rearing small ruminants? Period/Month Activity ------------------------------------- ------------------------------------------------------------ 16. Which season is the most relaxed period in the year and what activities take place then? Period/Month Activity ---------------------------------- ---------------------------------------------------------- 17. Is hired labor readily available when you need it? ( ) Yes ( ) No 18. If yes, how much do you pay hired labourers per month? ----------------------------------------------------------------------------------------------------

134
2.3. Labor division in the HHs Who performs the following operation in the production of small ruminants? (Tick/fill, Appropriate).
Who performs
Barn cleaning
Feeding
Treating
Watering
Disinfecting
Milking
Marketing
Decision for HHs consumption or selling
19.Mostly men
20.Mostly women
21.Men, women & children
22.Other (hired labor)
2.4. Gender and division of labour Who is responsible for the management of goat and sheep? Fill the following table No Activities Who performs it
(1=husband, 2=wife, 3=boys, 4=girls)
Distance from home in hours
Frequency/week
Time taken to do the activities
23 Feeding (cut and carry system)
24 Watering 25 Herding 26 Taking to clinic 27 Caring for sick goats& sheep 28 Cleaning barn 29 Barn/ house building or repair 30 Milking goats 31 Churning 32 Selling of goats’ milk 33 Selling of goats 34 Selling of kids 35 Selling of sheep 36 Selling goat/sheep meat
37. How much pay women labourer get for doing the same type of jobs done by fellow men labourer? Less pay ( ) Same pay ( ) Higher pay ( ) 38. Small ruminants rearing experience (Number of years) ______________________________________________________________________
Activities

135
39. Resource Endowment and access 3.1. Land ownership and tenure status Plot number
Size in Ha
Tenure type (own, rented)
Crop grown Fertilizer/ chemical use
40.P1 41.P2
3.1.1. For fodder/grazing land 2005/6 (1997/8 E.C) indicate size of each plot.
Years Parcel NO./crop
Size Ha
Owned
Rented
Forage varieties (sorghum/stock and leaves as feed, cowpea, pigeon pea, sasbania, lucenia etc)
2005 2006
42. 43.
* Method of acquiring: 1. Bought, 2. Inherited, 3. others (specify) ** Land tenure: 1. Owned by self 2.Share cropping 3. Family owned 4. Rent 5. other (specify) 3.2. Livestock ownership Livestock type Breed type if
any (local) Number Inputs used in keeping this animals
Purchased Feed Vet service Labour 44.Milking cow
45.Dry cow 46.Oxen 47.Bulls 48.Heifers 49.Calves 50.Donkeys 51.Goats (milking)
52.Goats (meat)
53.Sheep 54.Camel 55.Poultry 3.3. What are the sources of water you mainly depend on? Source type Season Purpose Time taken to fetch
water from the source
Responsible family member
56. 57.

136
3.4. Housing, Implements and Machineries ownership No House / implement type Yes No Number 58 Grass roof 59 Corrugated Iron roof without
partition
60 Corrugated iron roof with partition 61 Radio 62 Tape Recorder 63 Donkey Cart 64 Water pump 65 Others(specify)
3.5. The Farmers Total Income.
Total harvest (Quintals) Inputs used 3.5.1. Income from Crop production last year (1998 E.C) Crop grown
Consumed
Volume Sold Fert.(Kg)
Improved seed Kg)
Pesticides (liters)
66. Sorghum 67. Maize 68.cow pea 69.Haricot bean 70.Vegetables (if any)
3.5.2.Income from Livestock Production (1998 E.C)
Harvest per week or season /year (#/litters/cup/jog) Animal products Consumed Sold 71.Milk 72.Butter sale 73.Cheese 74.Calves born 75.Goats 76.Poultry 77.Egg 78.Cows 79.Oxen 80.Donkey
81. Off - farm activities and non-farm income e.g. employment, business (specify): ----------------------------------------------------------------------------------------------------------------------------------------------------------------------------------------------------------------------------

137
4. Institutional 4.1. Social participation. In which of the following organization are you member and leader?
Frequency of participation Organization
Member
Committee member
Leader Purpose of joining social groups W/ever
conducted Sometimes
Never
82.Idir/Afosha
83.Iqub 84.Religious club
85.Irrigation association
86.Marketing cooperative
87.Union 88.PA council
89.District council
90.School council
91.Women group
92.Frequency of involvement in meeting
93.Others 4.2. Access to credit. Credit Items Sourc
e Duration in months
Amount in Birr
Rate of interest
Time taken in Hrs
Problems
94.Feed
95.Vet drugs

138
96.Housing con for sheep and goats
97.Other purpose
Perception about the importance of and access to credit 98. What is your perception about the importance of credit in small ruminant rearing? 1 2 3 4 5 1= least important, 2= less important, 3=important, 4=more important,=highly important 4.3. Market and Marketing Issues 99. Do you have access to local market for shoat? Yes (1) No (2) 100. How long does it take you to reach to the nearest market in walking hours? ------------------------------------------------------------------------------------------------------ 101. What price do you get for fattened shoat? --------------------------------------------------------------------------------------------------------- 102. Do you think it is fair? Yes (1) No (2) 103. Do you have fattening inputs available in the market? (Inputs: feed supplements, hay, forages, fodder plants) Yes (1) No (2) 104. If yes which input type is most frequently available? ---------------------------------------------------------------------------------------------------------- 105. Can you really bargain over the price of fattened shoats with (put in rank order 1st, 2nd)? (a) Shoat collecting enterprises (b) Local merchants (c) Intermediate merchants (suppliers) (d) Town dwellers (e) Butchery owners 106. Who is more influential in determining the price of fattened shoats? 107. What about for inputs /Inputs: feed supplements, hay, forages, fodder plants/ (Similar to question 106 and 107 above) 108. Did you see any agency involved in the fattened market activities? Yes ( ) No ( ) 4.4. Extension approaches and Extension methods 109. Are you aware of any extension service particularly in relation to SR fattening technologies? Yes ( ) No ( )

139
4.3.2. Participation in small ruminants’ extension events over the two years. No Extension
Events Frequency of participation
Usefulness /importance
Why is it very important
110
Training
111
Field days
112
Demonstration
113
Visits
114
Meetings
4.5. Contact with extension agents 115. Did you have one- to– one extension contact in the last one year? ( ) Yes No ( ) 116. If yes, what is the frequency of contact? ( ) Once in a week ( ) Once in two weeks ( ) Once a month ( ) Once in three months 117. If no, why? ----------------------------------------------------------------------------------------------------------------------------------------------------------------------------------------------- 118. Sex of the extension agent making usual visits: ( ) Male ( ) Female 119. Type of visit usually used by the extension agent ( ) Individual ( ) Group ( ) Both 120. Preference of farmer on the sex of extension agents making usual visits: Male (Why):------------------------------------------------------------------------------------------- Female (Why):---------------------------------------------------------------------------------------- No preference (Why):-------------------------------------------------------------------------------- 121. Do you have any communication problem with the extension agent? ( ) Yes ( ) No 122. If yes, what is the reason? -------------------------------------------------------------------- ---------------------------------------------------------------------------------------------------------- 123. The sources of information about small ruminant fattening you get: ( ) Through the extension agent ( ) Through your contact farmer ( ) Through researchers ( ) Through brochures news letters, etc, ( ) Through mass media (radio, television) ( ) Others (specify):--------------------------------------------------------------------------------------------------------------------------------- 4.5. Types of extension message given by the agents: 124. Feed use ( ) Yes ( ) No 125. Maintaining health of animal ( ) Yes ( ) No 126. Improved breed(s) use ( ) Yes ( ) No 127. Shed and shelter building ( ) Yes ( ) No
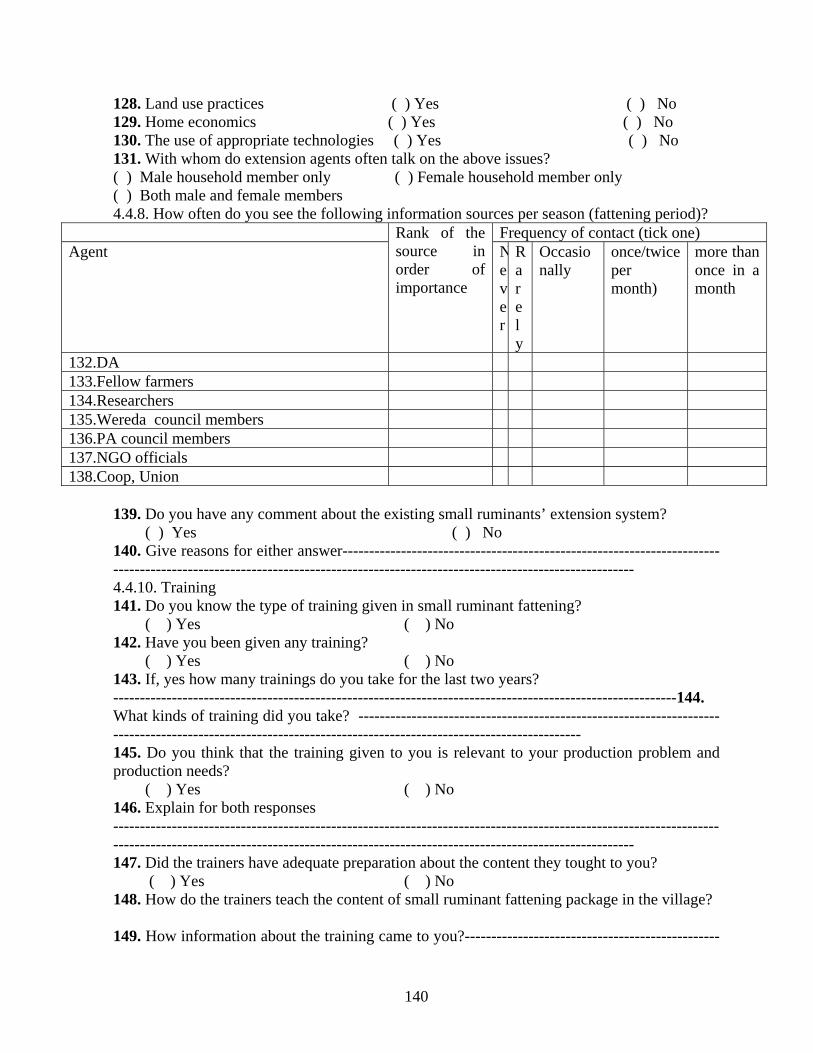
140
128. Land use practices ( ) Yes ( ) No 129. Home economics ( ) Yes ( ) No 130. The use of appropriate technologies ( ) Yes ( ) No 131. With whom do extension agents often talk on the above issues? ( ) Male household member only ( ) Female household member only ( ) Both male and female members 4.4.8. How often do you see the following information sources per season (fattening period)?
Frequency of contact (tick one) Agent
Rank of the source in order of importance
Never
Rarely
Occasionally
once/twice per month)
more than once in a month
132.DA 133.Fellow farmers 134.Researchers 135.Wereda council members 136.PA council members 137.NGO officials 138.Coop, Union
139. Do you have any comment about the existing small ruminants’ extension system? ( ) Yes ( ) No 140. Give reasons for either answer------------------------------------------------------------------------------------------------------------------------------------------------------------------------- 4.4.10. Training 141. Do you know the type of training given in small ruminant fattening? ( ) Yes ( ) No 142. Have you been given any training? ( ) Yes ( ) No 143. If, yes how many trainings do you take for the last two years? ----------------------------------------------------------------------------------------------------------144. What kinds of training did you take? ------------------------------------------------------------------------------------------------------------------------------------------------------------ 145. Do you think that the training given to you is relevant to your production problem and production needs? ( ) Yes ( ) No 146. Explain for both responses -------------------------------------------------------------------------------------------------------------------------------------------------------------------------------------------------------------------- 147. Did the trainers have adequate preparation about the content they tought to you? ( ) Yes ( ) No 148. How do the trainers teach the content of small ruminant fattening package in the village? 149. How information about the training came to you?------------------------------------------------

141
------------------------------------------------------------------------------------------------------------------------------------------------------------------------------------------------------------- 4.5. Media access 4.5.1 How often do you make use of the following media facilities?
154. To which radio program you listen most? Lists of programs Rank Agricultural news (1) 1st News (2) 2nd Drama (3) 3rd Music (4) 4th General Knowledge (5) 5th 155. If not agricultural program, why not? 4.6. Input availability 4.6.1. Perception of farmers on input availability 156. What do you think is the price of fattening inputs? 5 4 3 2 1 Very high High medium low very low
4.6.2. Distance to input market, 157. How far is the nearest in put market from your homestead? 158. How frequent do you go to market? ( ) every two days in a week ( ) once in fortnight ( ) once every month ( ) not at all 159. If the answer for the above question is not at all, specify the reason? 5. Adoption of fattening package 5.1. Adoption of breeds 160. Which animal breed do you normally rear? Not applicable ( ) why------------------------------------------------------------------------------ Local breed ( ) which one? ---------------------------------------------------------------------- Crossbred ( ) which one? ---------------------------------------------------------------------- Pure improved breed ( ) which one? ------------------------------------------------------- 161. Do you know the blood level of shoats? Yes ( ) No ( ) 162. If your answer is yes to 161. What is the blood level of your goat/sheep (% exotic blood
Frequency of listening/reading/attending Mass media
Rank of the source in order of importance
Never Rarely
Occasionally
Once or twice a month
Once or twice a week
Daily
150.Radio 151.Television 152.Print media 153.Public meeting, market place, religious place

142
level?) >75% very high (5) 62.5-75 high (4) 50-62.5% Medium (3) 40<50% low (2) <40% Very low (1) 163. What is your source of breeding for shoat? ------------------------------------------------------------------------------------------------------------------------------------------------------ 5. 2. Adoption of feeds and feed supplement Which feed do you normally feed your sheep and goats as supplement? Feed items N
ot at all
Rarely
Sometimes
Regularly some
Regularly all
164.Industrial by products (nuge cake, wheat bran, linseed cake)
165.Feed processing plant products(balanced feed MUB,Pellete)
166.Foragelegume(sesbania spp,Lucenia spp,cowpea,pigeon pea)
Total Adoption score (to be calculated) 5.3. Adoption of vet practices 5.3.1. Frequency of occurrence animal health problems (diseases, pests, parasites etc)
Frequency Health problems Diseases
Quite often (Every month)
Sometimes(up to 6 month)
Rare(once in a year)
Never
167.Gurgursaa, PPR, CCPP 168.Skin diseases 169.Worms and parasites 5.3.2. Use of Vet services
Frequency Vaccination and drugs Quite often (Every month
Sometimes(up to 6 month)
Rare(once in a year)
Never
170.CCPP 171.Ovine pasturellosis 172. Treatment for different health problems (bacterial, endo and ecto parasites….) specify-------------------------------------------------------------------------------------------------------------------------------------------------------------------------------------------------------------- 5.4. Adoption of management practices 173. Which feeding practice you normally use when fattening sheep and goats ( ) cut and carry system for whole fattening period ( ) grazing in range land and on farm remnants ( ) grazing plus feeding supplements like MUB

143
( ) feeding fodder and forge spp by cut and carry feeding method 174. How much feed composition you feed to sheep and goat you fatten ( ) Donot know ( ) use their body weight as reference to limit the amount of feed ( ) every sheep and goat is provided equal amount without age consideration 175. How many times sheep and goats you fatten feed the available feed if they are under cut and carry system ( ) once per day ( ) twice per day ( ) trice per day ( ) once every two day 176. How long sheep and goats is fed during fattening ( ) two month ( ) three month ( ) four month ( ) five or six month 177. How much water should be given to fattened sheep and goat? ( ) one liter per day ( ) two liters per day ( ) I usually give water in relation to what they feed on. 178. Shelter and shedding to fattened sheep and goat should be ( ) ( ) ( ) ( ) 179. Fattened sheep and goats are always checked against diseases and parasites ( ) traditionally knowledgeable people ( ) by para vets only ( ) diagnosis in vet clincs ( ) 180. Fattened sheep and goats always kept under ( ) isolated from other herds ( ) with big livestock ruminants ( ) kept in and around homestead in the day times ( ) I donot have any information 6. Attitude, perception and Knowledge 6.1. Attitude towards package
Ratings S.No Statements SA A N D SD
181 Fattening package is very expensive and not rewarding as per the costs
182 Fattening package helps to increase the income of farmers
183 It is easy to use the fattening package by the farmers 184 Using the fattening package to make the animals grow
quickly is not good.
185 If I use the fattening package, my animals will have good market demand.
186 Fattening package will spoil the health of animals. 187 To use fattening package, it demand more labor and
effort and hence difficult.
188 Fattening package is promoted to protect the interest of input sellers and not for farmers.
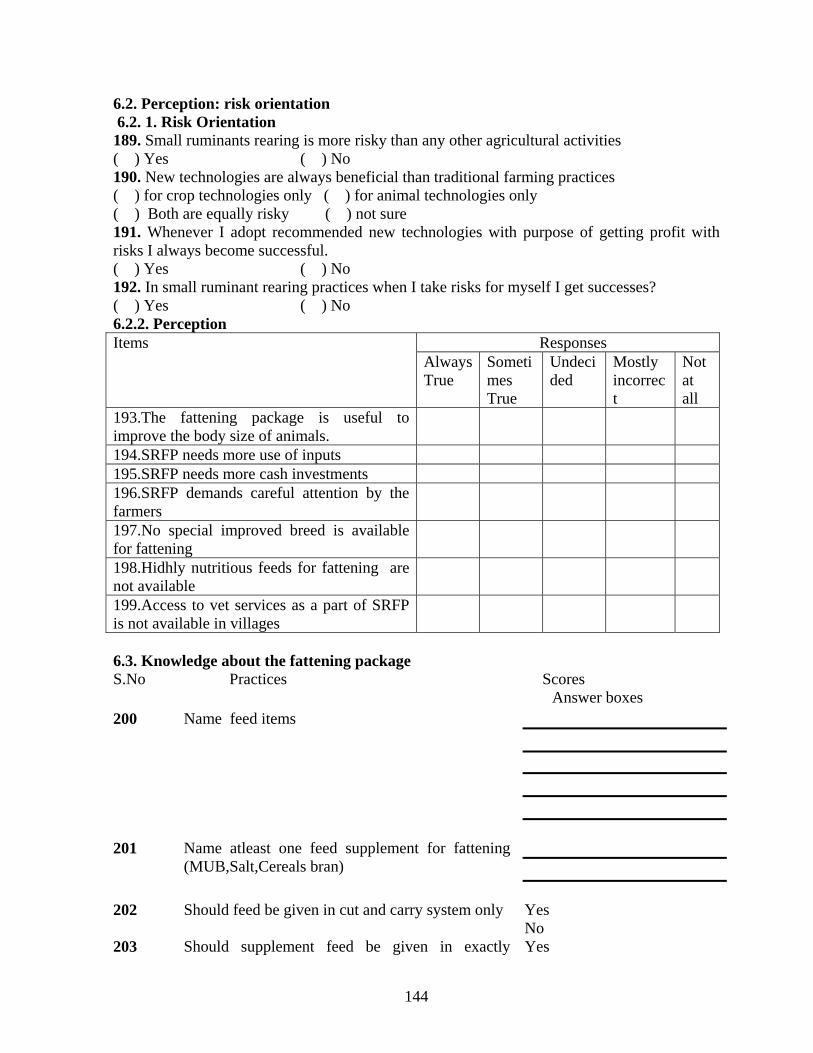
144
6.2. Perception: risk orientation 6.2. 1. Risk Orientation 189. Small ruminants rearing is more risky than any other agricultural activities ( ) Yes ( ) No 190. New technologies are always beneficial than traditional farming practices ( ) for crop technologies only ( ) for animal technologies only ( ) Both are equally risky ( ) not sure 191. Whenever I adopt recommended new technologies with purpose of getting profit with risks I always become successful. ( ) Yes ( ) No 192. In small ruminant rearing practices when I take risks for myself I get successes? ( ) Yes ( ) No 6.2.2. Perception
Responses Items Always True
Sometimes True
Undecided
Mostly incorrect
Not at all
193.The fattening package is useful to improve the body size of animals.
194.SRFP needs more use of inputs 195.SRFP needs more cash investments 196.SRFP demands careful attention by the farmers
197.No special improved breed is available for fattening
198.Hidhly nutritious feeds for fattening are not available
199.Access to vet services as a part of SRFP is not available in villages
6.3. Knowledge about the fattening package S.No Practices Scores Answer boxes 200 Name feed items
201 Name atleast one feed supplement for fattening (MUB,Salt,Cereals bran)
202 Should feed be given in cut and carry system only Yes No
203 Should supplement feed be given in exactly Yes

145
measured weight No 204 Name the frequently available vaccine type in
your village
205 What is recommended for ectoparasites 206 What is recommended for endoparasites 207 Name maximum amount of water provided per
day
7. Socio-psychological and socio-cultural 7.1. Social security and peace: 208. Do you see conflicts among villagers for resources such as grazing land, water ponds? ( ) Yes ( ) No 209. What is your stand in regard to the stability of this village security? ( ) not secured ( ) some times insecured ( ) indifferent ( ) some times free ( ) always secured ( ) no response 210. What is the major source of insecurity in your opinion in the village? () lack of feed resources () lack of watering points () religious difference () ethnic difference () political difference () others 7.2. Social network/learning: 211. Which source of information do you think knowledgeable? ( ) friends ( ) relatives ( ) elder community members ( ) religious leaders ( ) tale ( ) youngsters ( ) women groups ( ) others 212. From which source do you take the information more reliable? ( ) friends ( ) relatives ( ) elder community members ( ) religious leaders ( ) tale ( ) youngsters ( ) women groups ( ) others 213. Whom do you think is more influential in your life? ( ) friends ( ) relatives ( ) elder community members ( ) religious leaders ( ) tale ( ) youngsters ( ) women groups ( ) others 214. How do you think that information flow in your village is fastest? ( ) Discussion in families ( ) Informal discussions among villagers ( ) Formal discussions among villagers ( ) Information told by religious Leaders ( ) others 7.3. Communication: 215. Villagers are easily communicate with each other about ( ) religion ( ) politics ( ) agricultural information ( ) modern technologies ( ) market information ( ) others