Embed Size (px)
Citation preview


TECHNIQUES OF TAPE READING

Other Books in the Irwin Trader’s Edge Series
Quantitative Trading Strategies by Lars Kestner
Trading Systems and Money Management by Thomas Stridsman
Understanding Hedged Scale Trading by Thomas McCafferty
Traders Systems That Work by Thomas Stridsman
The Encyclopedia of Trading Strategies by Jeffrey Owen Katz andDonna L. McCormick
Technical Analysis for the Trading Professional by ConstanceBrown
Agricultural Futures and Options by Richard Duncan
The Options Edge by William Gallacher
The Art of the Trade by R. E. McMaster

TECHNIQUES OF TAPE READING
VADYM GRAIFER
CHRISTOPHER SCHUMACHER
McGraw-HillNew York Chicago San FranciscoLisbon London Madrid Mexico CityMilan New Delhi San Juan SeoulSingapore Sydney Toronto
Copyright © 2004 by GST Captial Group, LLC. All rights reserved. Manufactured in the United States of America. Except as permitted under the United States Copyright Act of 1976, no part of this publication may be reproduced or distributed in any form or by any means, or stored in a database or retrieval system, without the prior written permission of the publisher. 0-07-143614-6 The material in this eBook also appears in the print version of this title: 0-07-141490-8 All trademarks are trademarks of their respective owners. Rather than put a trademark symbol after every occurrence of a trademarked name, we use names in an editorial fashion only, and to the benefit of the trademark owner, with no intention of infringement of the trademark. Where such designations appear in this book, they have been printed with initial caps. McGraw-Hill eBooks are available at special quantity discounts to use as premiums and sales promotions, or for use in corporate training programs. For more information, please contact George Hoare, Special Sales, at [email protected] or (212) 904-4069. TERMS OF USE This is a copyrighted work and The McGraw-Hill Companies, Inc. (“McGraw-Hill”) and its licensors reserve all rights in and to the work. Use of this work is subject to these terms. Except as permitted under the Copyright Act of 1976 and the right to store and retrieve one copy of the work, you may not decompile, disassemble, reverse engineer, reproduce, modify, create derivative works based upon, transmit, distribute, disseminate, sell, publish or sublicense the work or any part of it without McGraw-Hill’s prior consent. You may use the work for your own noncommercial and personal use; any other use of the work is strictly prohibited. Your right to use the work may be terminated if you fail to comply with these terms. THE WORK IS PROVIDED “AS IS.” McGRAW-HILL AND ITS LICENSORS MAKE NO GUARANTEES OR WARRANTIES AS TO THE ACCURACY, ADEQUACY OR COMPLETENESS OF OR RESULTS TO BE OBTAINED FROM USING THE WORK, INCLUDING ANY INFORMATION THAT CAN BE ACCESSED THROUGH THE WORK VIA HYPERLINK OR OTHERWISE, AND EXPRESSLY DISCLAIM ANY WARRANTY, EXPRESS OR IMPLIED, INCLUDING BUT NOT LIMITED TO IMPLIED WARRANTIES OF MERCHANTABILITY OR FITNESS FOR A PARTICULAR PURPOSE. McGraw-Hill and its licensors do not warrant or guarantee that the functions contained in the work will meet your requirements or that its operation will be uninterrupted or error free. Neither McGraw-Hill nor its licensors shall be liable to you or anyone else for any inaccuracy, error or omission, regardless of cause, in the work or for any damages resulting therefrom. McGraw-Hill has no responsibility for the content of any information accessed through the work. Under no circumstances shall McGraw-Hill and/or its licensors be liable for any indirect, incidental, special, punitive, consequential or similar damages that result from the use of or inability to use the work, even if any of them has been advised of the possibility of such damages. This limitation of liability shall apply to any claim or cause whatsoever whether such claim or cause arises in contract, tort or otherwise. DOI: 10.1036/0071436146

������������
Want to learn more?We hope you enjoy this McGraw-Hill eBook! If
you’d like more information about this book, its author, or related books and websites, please click here.
C O N T E N T S
ACKNOWLEDGMENTS ixINTRODUCTION xi
PART ONE
A TRADER’S JOURNEY 1
Chapter 1
The Beginner: Everyone Starts at the Beginning 3
Learning to Walk All Over Again 4A Positive Outcome Can Reinforce a Bad Habit 5Risk Management—Don’t Leave Home without It 8Don’t Blame the Guy behind the Curtain—You Chose This Job 9The Famous Bre-X Scandal 11Listen to the Tape; It Is Never Wrong 12
Chapter 2
Turnaround: Small and Safe 15
Opening a Third Eye 16Confidence Grows from Experience 20The Territory and the Map 24Coming around the Mountain 27
Chapter 3
The First Profitable Year: Charting Success 29
Using a Trading Journal 30Using Your Chart of Your Account 33Imaginary Friends Are Important People Too 36
v
For more information about this title, click here.

Chapter 4
Learning to Trade for a Living 37
Learn or You Are Bankrupt 38Keying In on Those around Me 39Not Everyone Gets an A for Effort 40You Decide Your Fate; the Market Doesn’t 42Additional Important Beliefs 43Trading Is Not a Need-to-Know Business 44Making the Odds Even 45Making the Probabilities Work for You 46Taking Stock of It All 47
Chapter 5
The Trader’s Circle: Bridging the Gap between Art and Science 49
Strengthen the Mind as Well as the System 51Finding Out More about Myself 52Getting through the Stages 53The Final Stage 53Completing the Circle 55Discovering the Satisfaction of Teaching 57Reveling in the Triumph of Another Trader 59Rediscovering the Circle 60
Chapter 6
A Trader’s Edge 63
Pros Assess Risk; Amateurs Assess Potential 64You Don’t Have to Be in the Middle of Every Battle 65The Dichotomy of the Guilty 67Finding the Elusive Edge 72
Chapter 7
A Trader’s Intuition: The Real Art of Trading 75
What Is Intuition? 75Be Careful of Intuitive Traps 76Trading Mantras 77
Chapter 8
Rules for and the Mindset of a Mature Trader: The Dos and Don’ts ofTrading 83
vi Contents
PART TWO
TRADING SYSTEM 87
Chapter 9
Tape Reading: Revitalization of a Lost Art 89
One Size Doesn’t Fit All 89Discovering What Tape Reading Really Is 91Are You the Majority or the Minority? 93Market Irony 94The Accumulation/Distribution Relationship 95
Chapter 10
The Role of Setups 107
Different Methods of Entry 109
Chapter 11
Stop-Loss Placement and Trailing 115
Revisiting Risk Management 116Confidence Levels 121
Chapter 12
Trading Setups 123
Jump-Base–Explosion (JBE) Setup 124Drop-Base–Implosion (DBI) Setup 124Open-High– and Open-Low–Break Setups 130Cup-and-Handle Setup 130Capitulation 130Trader’s Action 135
Chapter 13
Trading Market Ranges and Miscellaneous Points 137
Trading Ranges 137Miscellaneous Points 142
Contents vii

PART THREE
PRACTICAL EXAMPLES 145
Example 1: Accumulation and Distribution 146Example 2: Entry on Pullback 151Example 3: Jump-Base–Explosion (JBE) Setup 154Example 4: Capitulation 158Example 5: Capitulation 162Example 6: Drop-Base–Implosion (DBI) Setup 167Example 7: Capitulation and Euphoria 171Example 8: Finding Entries in a Strong Trend 176Example 9: Open-Break Setup 180Example 10: Open-Break Setup 183Example 11: Open-Low–Break Setup 186Example 12: Trading within the Range 189Example 13: Drop-Base–Implosion (DBI) Setup 193Example 14: Stop Loss 196Example 15: Drop-Base–Implosion (DBI) Setup 198Example 16: Jump-Base–Explosion (JBE) Setup 201Example 17: Jump-Base–Explosion (JBE) Setup 204Example 18: Drop-Base–Implosion (DBI) Setup 206Example 19: Trend Continuation 209Example 20: Open-Low Break and Reversal 211Example 21: Drop-Base–Implosion (DBI) Setup 214Example 22: Trailing Stops and Confidence Levels 217Example 23: Jump-Base–Explosion (JBE) Setup 221Example 24: Cup-and-Handle Breakout 223Example 25: Capitulation 226Example 26: Open-Low–Break Setup 229Example 27: Fading Breakout 232Example 28: Short of the Range Resistance 234Example 29: Open-Low–Break Setup 237Example 30: Open-Low–Break Setup 239Example 31: Drop-Base–Implosion (DBI) Setup 241Example 32: Cup-and-Handle Setup 244Example 33: Cup-and-Handle Setup 246
GLOSSARY 249
INDEX 251
viii Contents

A C K N O W L E D G M E N T S
First and foremost we would like to thank the past and present membersof RealityTrader.com. Without their sincere interest and desire to take thejourney through myth and disinformation to trading the reality of the mar-ket, this book would not have been possible.
To Steve Demarest, Ross Ditlove, and the entire team of profession-als at MBTrading.com, thank-you for providing the best trading servicesthat the industry has to offer. The Navigator is one of the best executiontools available today.
We would also like to thank those at TheStreet.com who have pro-vided us with a forum to interact with not only other professionals in ourfield but also with those subscribers who offer their personal insight andviews on a daily basis. Specifically, we would like to thank JamesCramer for his ambition to start such a venture and Dr. Richard MeCallfor his constant encouragement and uncanny insight into today’s chang-ing market.
We also owe the greatest debt of gratitude to the many professionalsin the trading industry:
Alan Farley, who has the amazing ability to see through the curtains of themarket’s uncertainty. Discussion with you is always a challenge. We con-tinue to appreciate your friendship and conversation.
Tony Oz, it’s a real pleasure to continue to see your successes as a trueleader in this industry.
Chris Wheeler for your continued friendship and faith in our objectivesand goals for the education of traders.
ix
Copyright © 2004 by GST Captial Group, LLC. Click here for terms of use.

Jim Sugarman and Tim Bourquin from the Online TradingExpo.com forhaving the drive and initiative to create a dynamic forum for traders tolearn and exchange educational ideas.
Mike Diplock for spending tremendous hours developing and fine-tuningour principles and setups into the RealityTrader Intelliscan MarketScanner.
Kenneth Reid for working with us to define the problems and the solu-tions that plague traders and in the creation of our interactive TradingPsychology CD Series.
And finally to the entire staff at RealityTrader.com who burned themidnight oil to make RealityTrader.com what it is today. Thanks to BoYoder and Allen Zuckerman for becoming part of our trading services andhelping us to grow not only as a company but as traders as well; Russ VanDer Biessen for his continued efforts; and Nestor Suarez for his endlessand tireless work ethic. To Jeff Tappan, whose unique marketing insightenabled us to grow our company to what it is today. And to Vic Jung, whois simply the best IT professional and Webmaster on the planet—withoutyou, we would still be dreaming this on paper. Last but not least, a specialthanks to Larisa Bondarenko for everything you have done forRealityTrader to make it a better service. Your wisdom and guidancemade this all possible. You are a true friend.
Vadym GraiferChristopher Schumacher
x Acknowledgments

I N T R O D U C T I O N
This book describes the story of Vadym Graifer, a former Soviet citizenwho was forced to flee developments in Ukraine which jeopardized hiscompany, his life, and his family’s life. The story is a so-called Americansuccess story that has been told time and again about immigrants fleeingreligious, economic, and racial strife in search of a better life for them-selves and those around them. Although Vadym is currently a Canadianresident, it’s a story that most everyone can relate to. The personal strug-gles, journey of self-discovery, and eventual success he attained willreveal many lessons you may have already learned, and, more important,lessons you have yet to realize.
Part One of this story deals with these events and the principles thatVadym has come to use every day in his trading. This part also delves intoone of the most important aspects of a trader’s development—the mind-set of a successful trader. The principles discussed in these pages willshow you how a totally inexperienced trader went from market illusionsto market reality, from the point of near financial destruction to the free-dom of everyday trading life. These principles are ultimately linked to theunderstanding of tape reading described in Part Two of the book. In thissense, tape reading will not be described to you in a manner that themajority of people think this lost art is. It will not be described to you asa verb, in the sense that you are “tape reading.” Rather, after reading PartTwo, you will understand the deeper concepts of how tape reading allowsyou to see and distinguish between the actions of smart money and thepublic mentality. Realizing how accumulation and distribution actionstaken by market participants through movements of price and volume willgive you a strong understanding of an entry and exit strategy for any sys-
xi
Copyright © 2004 by GST Captial Group, LLC. Click here for terms of use.

tem or methodology that you currently use. It’s this reality at the root ofprice action that will ultimately lead you to knowing why and how Vadymand those who trade with him use the motto “Trade what you see, not whatyou think.”
Part Three presents trading setups and examples taken from tradingexperiences over the past 2 years. Some are presented in fraction form,while others are in decimal form. These setups and examples will ulti-mately lead you to understand that, while methodologies and systems maycome and go, tape-reading principles will stand the test of time. They havebeen around since the beginning of speculation some 400 years ago andhave been improved over the past 100 years. The principles, therefore, canbe applied to any system currently being used and to any system that maybe invented in the next millennium of speculation.
Upon completion of this story, you will fully appreciate the journeyof Vadym Graifer as a trader who was participating in a market aboutwhich he initially knew nothing, in an economy that was different fromthat of his native country, and in an environment that was difficult to func-tion in. It wasn’t his great understanding of company reports, of valuatingnews events, or of how GDP figures govern market movement that madehim successful. It was his rediscovery of the true meaning of tape-readingprinciples that go far beyond what most current presentations offer. It washis movement to an unemotional state of reality and the ultimate truth ofstock movement, the language of price and volume, that turned his trad-ing, his account, and eventually his life into something to be proud of.This is the story of a true reality trader.
xii Introduction

P A R T O N E
A Trader’s Journey
Copyright © 2004 by GST Captial Group, LLC. Click here for terms of use.

This page intentionally left blank.

C H A P T E R 1
The Beginner
Everyone Starts at the Beginning
In the late 1980s—early 1990s in the Soviet Union—the birth of a new,rapidly changing economy emerged, a free economy. It started with sim-ple co-ops but quickly expanded to encompass more complex venturessuch as private banks, financial companies, and merchandise exchanges.Although welcomed with open arms by the active part of a society thathad spent 70 years under oppressive rule, it also opened the door to therise of the Russian Mafia. I was a well-educated engineer, and I started myown business in 1987 and developed it into a successful enterprise withover 100 employees.
Slowly the dark side of the transition to a free market economysoaked into every facet of business life. As time progressed, the situationbecame less and less stable. Economic links were disappearing, and infla-tion was climbing at a gallop. Citizens became the target of criminalattacks on a scale that citizens of a civilized country could not imagine.Kidnapping and assassination became the methods of choice to handleeveryday business disputes. The economy and society as a whole began tounravel at an alarming rate.
Fearing for the safety of my family, I emigrated to Canada in 1996.This new life had its own set of challenges. Imagine moving to a newcountry and learning a new profession without speaking the language ofthe country. I learned English by watching popular television sitcoms likeMarried with Children. Al Bundy became my excuse for awkward,language-related situations for years to come. At the same time, I set my
3
Copyright © 2004 by GST Captial Group, LLC. Click here for terms of use.

sights on finding and mastering a new profession, day trading. Tradingover the Internet was a logical choice for me, as it allowed me to move atmy own pace unlike other professions that would require well-developedlanguage and communication skills.
Although day trading was not yet a buzzword in 1996, it was themajor direction of my quest. The reason I focused on such a short timeframe as intraday trading was because I realized that I lacked knowledgeabout the U.S. economy and couldn’t make much out of company reports.Therefore, I instinctively wanted to exploit the movements that were lessaffected by those factors.
As I searched the Internet, I tried to uncover everything that couldhelp me find direction. There weren’t as many Web sites devoted to trad-ing then as we have now, so my education was incredibly superficial.Here’s why.
LEARNING TO WALK ALL OVER AGAIN
After a couple of months, I had an online broker and was armed withquotes and with the Wall Street Journal as my news source. It lookedpretty simple to me. I would find positive information on a stock, buyit, watch it go up, and sell it when it stopped rising. I couldn’t see why itwouldn’t work.
Do stocks go up on good news? The answer seemed obvious. Yes.It was supported by comments I read like, “ABCD gained 21/4 points todayon news that the company was granted big new order,” or “XYZ soared 4points after the company announced positive study results in mice.”
Did I ask myself some obvious questions like, “If it’s that simple,then what are all those trading books about,” or “Why isn’t everybodydoing it?” Yes, I did. But I also managed to come up with some answersthat supported my confidence. Maybe those books are for professionalswho need to manage millions of dollars and not for small-time traders likeme with a desire to make just a few hundred dollars a day. After muchresearch and preparation, everything was in place, and finally I startedtrading.
It was a typical start for someone who commenced trading in a bullmarket. I made money. I always found this to be a fascinating and inter-esting phenomenon—a novice making money right from the start is acommon occurrence. Maybe, to a degree, it was just beginner’s luck. Butthere are two important factors to consider. First, people are more likelyto start trading during the bull phase of the market’s cycle. Media excite-ment and the obvious rising of prices attract new traders. This kind of
4 PART ONE A Trader’s Journey
market is very forgiving. Selecting a stock is fairly easy, as many stocksgo up with the tide, and, therefore, mistakes might go unpunished. Also,in a bull market, bad timing and missed stops don’t kill as surely as theydo in a bear or a flat market. So it’s just a matter of statistics.
The second important factor is that the novice often has no fear. Insome paradoxical way, the state of the mind of the beginner may be veryclose to that of a great professional trader. Of course there is a huge dif-ference in that beginners have no fear because they are unaware of howharsh the outcome of their recklessness can be. The professionals’ lack offear is based on their experience and self-control. New traders have theirhard hits ahead of them, while professionals have left them behind. Laterwe will see how this difference is reflected in different motives for ini-tiating a trade: Professionals take the trade when they are comfortablewith the risk, while amateurs do it when they like the potential profit.Regardless of motives, the state of the mind of amateurs and profession-als may be fairly similar. This results in correct action despite the ama-teurs’ lack of experience and knowledge. However, as we will discoverlater, success without the knowledge of why or how it is achieved onlydelays learning some hard realities and making mistakes, and perhapsexperiencing even total failure.
A POSITIVE OUTCOME CAN REINFORCE A BAD HABIT
I was not making a killing. But my first experiments confirmed my initialassumption that it was possible to make a living exploiting intraday move-ments. It was not too hard to get an order filled at that time, even with anonline broker. Competition was not nearly as tough as it was later whentraders discovered more online tools or when crowds started chasing andrunning stocks.
During that first period of my trading, I learned one extremelyimportant thing: I saw people arguing about the value of news and aboutthe impact the news had on a stock price. I realized that news has noabsolute value. It became clear to me that people’s perception of the newsis what affects the stock price. This made me uncomfortable, since I hadno tool for reading perception. For a while I was able to calm myself downby thinking that I could foresee how the majority of people would per-ceive the news. But I soon learned that this was not the case. Stocks werereacting negatively on good earnings because street expectations werehigher. Stocks were reacting negatively even after beating street expecta-tions because whisper numbers were even higher. And stocks would justdrop on good news without the slightest reason that I could see.
CHAPTER 1 The Beginner 5

I saw no consistency to my train of thought, and it shouldn’t havebeen a surprise. At that time my thoughts revolved around the news—get-ting the best news source, evaluating the news, predicting the newsimpact, and—the killer of killers for a trader—forming opinions based onthe news. Despite my newfound understanding of the relative value ofnews, I continued to make the same assumptions: “Up on good news,down on bad news.” It was a dead end, but I didn’t realize it at the time.I needed a push from the outside to make me overcome this barrier, and,of course, I got one.
The market sends us plenty of hints. It’s always talking to us in itsspecific language, sending us messages about what we do right or wrong.We don’t always hear these messages or understand them. And, if wedon’t, the market sends more. Eventually, they become louder. If we stilldon’t hear the message, we don’t change our ways of acting, therebyexposing ourselves to the same danger again and again. Then some of themessages finally come in as thunder, changing our entire lives as traders.
For me such a message came in March 1997. The stock was ESOL,Employee Solution. It came down hard from above $30 to under $15.Following the standard beginner’s idea, “If you loved it at $30, then $15must be real value,” I bought 2000 shares overnight. I was totally confi-dent that nothing awful could happen to me based on the “value” of thestock and the fact that the market was definitely bullish at that time.
The next morning I saw ESOL open at around $8. What a shock!When I was losing $100 or $200 here and there, I was okay with it. Losingis a necessary part of the game; I already knew that. However, I could nothave imagined taking such a hit on a single trade.
My reactions were typical for this situation. The first thing I did wasto ask the opinion of other traders about the stock. This was the wrongthing to do. Sure enough, everyone who got caught in this mess with mesaid something like, “It’s going to be back in no time,” “This is a bearraid,” “Shorts are having their hoopla day, but they will get burned,” andother “useful” things. It all sounded comforting, but the stock was notrebounding as sellers were pounding it even further, both from the distri-bution side and from the short side. Clearly, value by itself is not a timingmechanism for intraday trading, as value is intrinsic to individuals and isthe basis for speculation, not for timing trades.
This was the time to make an important decision. I could stay in apsychologically comfortable zone of denial and do nothing, or I couldadmit the mistake and bite the bullet. The pain of watching each tickbecame unbearable in a few days. I sold the stock as it lost $5, effectivelycutting my trading capital base by over 50 percent. ESOL never
6 PART ONE A Trader’s Journey

rebounded and only got lower. It eventually got delisted and is tradingnow on the Bulletin Board at $0.004. Following is an illustration of thisdisastrous trade. (See Figure 1.1.)
At this point I was in the first stage of a trader’s development. Myfirst steps were quite typical of a beginner who hadn’t found the rightteachers. First of all, it’s very common for a newcomer to experience akind of euphoria. Everything seems to be too easy, as if money is justwaiting to be picked up. Every new trader who starts by winning experi-ences this feeling. Eventually, the market punishes such careless attitudesand awakens the trader to the rude reality.
In a strange way, this euphoric state of mind is combined with ner-vousness. Each trade is perceived as the most important one, as a battlethat a trader cannot afford to lose. Therefore, the more significance that isplaced on each separate trade, the more difficult it is to admit defeat.Thisleads to exiting positions at worse price levels than originally intended,which is referred to as a “blown stop” (assuming we are familiar with thevery concept of cutting losses). I perceive my trading today as a whole, as
CHAPTER 1 The Beginner 7
F I G U R E 1 . 1
Graphic illustration of the disastrous ESOL trade. (Used with permission of CBS MarketWatch.)

a never-ending process in which each separate trade is just a separatetrade, and I measure my success by the favorable ratio of wins to lossesin combination with the reward-to-risk scenarios. This is the correctapproach and eliminates the exaggerated significance of each separatetrade, thus making it natural to take the stop if the trade goes wrong. Nosingle trade is so important that it would be worth tying all my thoughts,time, and money to.
Newer traders also tend to view the trade outcome as a reflection ofthe people they are. A loss makes them feel foolish. They feel wrongwhen they take a loss. People don’t like to be wrong. Our desire to be rightcan be stronger than our desire to make money. In trading, this feeling isevidenced by traders who hold a losing position in order to prove that theyare right. Our ego takes over and keeps us from admitting that we made amistake. I see many comments like, “Sellers are wrong. They are beingfooled. They got it wrong.” That is ego talking. Today, I never relate theoutcome of a single trade to who I am. I do not feel foolish when I take apredetermined loss. This trade is not who I am. What is it we really want?To be right or to be profitable?
RISK MANAGEMENT—DON’T LEAVE HOME WITHOUT IT
There is one more important point to cover about the first stage of mytrading career. As a beginner, I didn’t have the slightest idea about riskcontrol and money management. It was not uncommon for me to buy2000 shares of a stock when the total number of daily shares traded forthat stock was only 20,000. I did not understand what liquidity meant,how it impacts risk, and how to measure it. Being from a differentcountry, and never before having dealt with market information, I hada few unexpected blows coming to me. But I never lost the confidencethat I could learn. I was always able to create more options for myselfand was always certain to have them available before I needed to usethem.
I had to experience the negative aspects of money management andrisk management in order to create and maintain the right attitude towardprofitability. For example, the number of shares I was going for waslinked to my trading capital. I did not realize that the number of sharesplayed should be linked to acceptable risk. Today I always have my riskdefined, and I trade according to it. If, for instance, risk is defined as a$250 loss per trade and based on the way the stock trade shows that youcan keep a 50 cent stop with confidence, then my share size on this stockis 500 shares. How and where the stop loss should be placed is another
8 PART ONE A Trader’s Journey

matter, which I will discuss later by using a few examples I learned laterin my career.
DON’T BLAME THE GUY BEHIND THE CURTAIN—YOU CHOSE THIS JOB
There is another important trait of beginner traders that they should rec-ognize in order to get rid of it. This is that the traders feel that trading is afight. Every day is a battle. Every trade is a battle. Every morning they goto war. If this is a war, then there should be an enemy. The next naturalstep is that traders define their enemies. A list of the traders’ foes willmost likely be familiar to the reader: market makers, specialists, analysts,short sellers, CNBC commentators, and so on. I often see something like:“Market makers run the stock down to shake the traders out and to buystock cheap,” “Darn short sellers killed the move,” and so on.
This mindset creates a powerful and extremely harmful concept ofthe so-called them—some unreachable, mighty force that manages all themarket movements and ruins the traders’ brilliant plays. This concept sat-isfies the traders’ ego while excusing them of responsibility for their ownactions. Unfortunately many self-proclaimed gurus support this approach.It allows them to place the responsibility for their recommendations thatgo badly on some of those traditional enemies. They reinforce this wrongway of thinking in their followers, thus significantly lessening theirchances to learn the game. When your teacher, or the one you trust, sayssomething like, “Their manipulation ruined our play,” it’s time to look foranother teacher.
Let’s Compare Two Approaches
The first approach is that my trading decision was great. I figured it all out.I was right all the way. My trade outcome was a loss because they ruinedit. They knew traders bought the stock, and they brought it down (or keptit from running). When frustrated traders sold, they bought from themcheap and ran the stock back up. There was nothing I could do. They haddeeper pockets, and it was impossible to fight them. They robbed me onthis trade.
The second approach is rather than blaming the ubiquitous them, Ican assume that if the trade went against me, then the trade wasn’t right.With this mindset I could assume that I timed my entry incorrectly, or Ihad a wrong trading idea. I had to cut off my loss to prevent it from get-ting bigger. The market proved me wrong on this trade. It’s over. I wasthen able to move on with my search for the next trading opportunity. My
CHAPTER 1 The Beginner 9

trading system assumes losses. Each trade can turn out to be a loser. It’snormal because of the uncertain nature of the market—it works on prob-abilities, not on certainties. My trading system provides a high enoughpercentage of wins, and no single loss can shake my confidence in thesystem.
We can see how mature and effective the second approach is com-pared to the first one. However, notice that the first way of thinking is psy-chologically comfortable. It places us in a comfort zone where there is nopersonal responsibility. It makes us feel warm and fuzzy. Of course thereis frustration caused by monetary loss, but we feel comforted by beingwith the majority and by losses not being our fault.
Remember what my first impulse was when I found myself in thelosing ESOL trade. I looked for comrades in disaster to ask their opin-ion. Was it their opinion that I was looking for? Was it a desire to makesure that I was not alone in this? And what was it that I felt after talkingto them? Relief (there are plenty of traders that got caught with me);anger (darn bears that arranged this trap); secret hope (it’s going to beback; if they orchestrated this drop then they should have some purpose;in this case, they apparently want to buy cheap shares and run the stockback).
Yes, this approach has always been a killer for a trader’s account,but does this always outweigh our desire for psychological comfort?Apparently it does not. The second approach is the one that mature suc-cessful traders have adopted. However, we can feel how less comfortableit is. Undivided personal responsibility with no one to rely on but our-selves does not make us feel good. We try to avoid this cold unpleasantspot. And, if we avoid it, we effectively stop learning.
If some unmanageable higher power controls the trade we take, whylearn? It’s easier (and makes more sense since you can’t control anything)to put on the trade and wait for them to decide what to do with it, hopingwe get lucky this time. That’s where gambling entirely replaces trad-ing. Control is lost (or was never there in the first place). And what is it atrader needs to control? We know we cannot control the market. All weneed to control is ourselves, our own behavior. And this self-control iswhat enables us to win in the market. It’s just uncomfortable. It requiresdiscipline; unclouded, unbiased thinking; and the willingness to admitmistakes without ego intervention. Discomfort and profit go hand inhand.
Does all that mean that a trader is always uncomfortable and thatmonetary winnings come at the price of constant stress or depression? No,
10 PART ONE A Trader’s Journey

it does not. The joy of self-control, of getting the best out of oneself, ofbeing able to pull through is a huge reward. With time, this approach stopsbeing uncomfortable and becomes the only approach that feels right.
THE FAMOUS BRE-X SCANDAL
After a few weeks an interesting thing happened in the stock market fromwhich I learned a lot. I am talking about the Bre-X story. Bre-X was asmall Canadian mining company. A huge gold mine was “discovered” inIndonesia. Soon thereafter the chief geologist committed suicide by jump-ing out of a helicopter. Then an independent analysis of samples was con-ducted and revealed them to be fakes. The incident was dubbed the “fraudof the century.” Figure 1.2 shows the huge drop in price followed by thestock being delisted.
I got interested in the developing story because of its huge exposure.It was hard to believe that stockholders could be misled on such a huge
CHAPTER 1 The Beginner 11
F I G U R E 1 . 2
The story of the Bre-X stock once the fraud was revealed. (Used with permission of CBS MarketWatch.)

scale. When the ultimate results of an analysis were pronounced, I learnedanother big lesson (at no cost this time). Anything can happen in the mar-kets. No matter how reliable and truthful information appears, we cannever know all the details surrounding the story, and we cannot figure outthe outcome. I read with great interest of all those investors who were fullof hope only to become desperate as they realized that they had lost a vastamount of money by investing in what they believed was the truth.
A thought struck me as I followed that story. Investors started dis-cussing Indonesian maps, comparing them to other known gold minemaps. They talked about methods of taking and analyzing samples, readgeological reports, and tried to find some hidden clues in company state-ments, CEO correspondence, and the like. They suddenly became spe-cialists in geology and mining. Some of the investors appeared to be wellinformed and knowledgeable. Yet, the outcome was the opposite of whatthey expected. I recently saw a story that was very similar. When somesmall company announced the results of a medical study, many peopleinvested their money in the stock because of the news about the study. Ichecked out the stock and spent a couple of hours reading about it withthose who were interested in it. Conversation ran along these lines: “Italked to a friend who is an M.D. He said it’s huge.” “This technology isthe future.” And so on. The stock price declined, but people continued totalk, convincing others and themselves that there were some evil inten-tions behind the decline or differents kind of manipulations, like “holdingthe price from running in order to buy cheaper” or just “shorting to hurtthose who bought the stock.” After all, the days of Jay Gould and JamesFisk (gold and railroad stock manipulators of the nineteenth century) andother “manipulators” are widely known.
The irony was that all those discussions about product, technologies,and research had little to do with the stock price. Traders were trying todiscuss things they didn’t know much about. Even more important, thosethings had little (if any) impact on the price movement. That was proba-bly the first realization of what I coined as my motto—“Trade what yousee, not what you think”—the motto that governs my entire tradingapproach.
LISTEN TO THE TAPE; IT IS NEVER WRONG
The stock price was telling traders “Get out. You are wrong.” Yet theyheld their position and rationalized their decision. There was somethingclearly wrong with this approach. It led to tied up money and to indefi-
12 PART ONE A Trader’s Journey

nitely long holding periods of a position that was supposed to be a short-term trade. This extended time frame was another indication that some-thing was wrong.
I can’t say these lessons led me to the right approach right away. Infact, the opposite is true. I repeated my mistakes several times during thenext year of my trading career. Nonetheless, that was the first time that Ifelt I had touched a very powerful truth. I believe that the first seeds of mycurrent approach were planted at that time.
CHAPTER 1 The Beginner 13

This page intentionally left blank.

C H A P T E R 22
Turnaround
Small and Safe
The next several months of my trading were devoted to pure scalping.After the ESOL fiasco, I was afraid to stay in a trade for too long. I wastaking my profits quickly. Considering that with a reduced account size Ihad to trade small, cheap stocks with unsustainable price movements, itwas not too bad a thing. Besides, I was just as fast when I had to cut theloss, which forced me to be more disciplined. This was the case when thefear of new losses worked for me; it made me cut my losses really quickly.Yet, it was not a profitable period overall. I was making insignificantamounts of money and then giving them back. In October 1997, I decidedthat I couldn’t continue to do this kind of trading with an online broker. Itwas taking too long to fill out the form, send in the order, and then get theconfirmation of the fill. I already had some idea of direct access and Level2, and I was using the combination of a quote feed with Level 2 and anonline broker for order execution.
In a short while I found decent brokerage. Its routing software madea big difference to me. My scalping became better, and for a while Ithought I finally had gotten a handle on this game. My discipline becamemuch stricter. It became obvious to me that I was taking too big a riskplaying the bigger lots, so I stopped playing 2000 to 3000 shares. I wastrading mostly 1000 shares. And, again, in a few months I had to admitthat I did not have real consistency in my trading.
I was able to get in and out very fast; in many instances I could feelthe direction of a stock’s movement for the next few ticks by just watch-ing it on Level 2. And yet it was not enough for consistency. The majorreason for this was (as I realize now) that I had no system. I was still trad-ing small stocks that were getting activity on fresh news; I was effectively
15
Copyright © 2004 by GST Captial Group, LLC. Click here for terms of use.

trying to beat other traders by getting in and out faster than the majoritydid. If I was right about stock direction, this game worked for me. At thosetimes not as many traders used direct-access brokers as do now.
And most of those who did use them didn’t have great routing skills.This allowed me to win “fast-trigger contests,” but there was much moreto trading than that. Scalping is a style of trading that requires traders tobe right on a very high percentage of their entries. That’s where I failed.The lack of a solid approach and impulsive trading of everything thatmoved were what undermined my trading at that stage. I tried applyingdifferent technical indicators but without encouraging results. I had noreal understanding of their mechanics, and I attempted to use them super-ficially. Trading with no solid system was like trying to build a housewithout a foundation.
This was a challenging moment. The problem was that I did not feelcomfortable with any of the traditional technical indicators or combina-tions of them. When I tried to apply them, I felt that I lost direct connec-tion with the essence of what was happening; my reading was getting tooformal. It was like having a conversation via an interpreter. You under-stand what is said, but you have trouble feeling the mood of your speaker,understanding the details of the meaning he or she puts in words. At thesame time the only approach that allowed me to get this immediate feelwas pure scalping. I felt trapped in a cycle I needed to break out of. Ineeded a system that would put a solid foundation under my entries andexits, and I didn’t want this system to be as formal as most of the techni-cal studies were. I realized that there was nothing wrong with technicalanalysis; it just wasn’t my way of visualizing things.
As usually happens, the right door opened when it was needed. Evenmore than that, this door had always been there. But I saw it only whenthe right moment came. I read my favorite trading book, Reminiscences ofa Stock Operator by Edwin Lefèvre, for a third or fourth time. Unlike theprevious readings, this time I saw much more in it about the actual methodof reading market movement. The words tape reading appealed to me—something in me resonated. Still, the method itself was not described indetail in the book. I could just sense the general principles of it. I neededa more detailed description of this approach.
OPENING A THIRD EYE
I searched the Internet for the words tape reading, and I soon stumbledacross a book published in 1931. It was Tape Reading & Market Tacticsby Humphrey B Neill. I read it twice and reread some pages of
16 PART ONE A Trader’s Journey

Reminiscences of a Stock Operator. Once again, I got this amazing feel-ing that I was facing a very powerful truth. The major idea that I got fromthis research was that smart money acts differently from the public andthat there are footprints of smart money’s action. It is possible to readthose footprints and take the right side, positioning oneself on the win-ning side. This realization was mostly theoretical then. I had no real rulesor formulas as a basis for this idea. But I did feel that I was gettingsomewhere.
Meanwhile scalping was actually all I did in my everyday trading.For years to come I became known as a pure scalper, an image thathaunted me long after my trading became much deeper than that. There ismuch more to my trading now than just scalping, but while we are on thesubject, let’s take a look at scalping as a trading style, with all its advan-tages and shortcomings.
Scalping
Scalping is often defined as trading for fairly small gains, like 5–10 cents.I don’t agree with this definition. For me a scalp is a trade in which I donot allow the stock to go against me, no matter at what point of the tradethe stock weakens. For example, suppose I bought stock at $20.05 and itwent to $21 with no downtick, then paused at $21 where the ask gotstronger and the bid weakened because sellers started to nail the bid. Atthis point I am out, and this is a scalp. If the same happened at $20.50 or$20.25, I am out and this is a scalp. I gave no regard for what profit Imade—$0.95 in the first case, $0.45 in the second, and $0.20 in the third.If I bought at $20.05 and the stock never went higher and I bid $20 andgot a hit, I am out with –$0.05. In order to get out and not allow the stockto move against my confidence level, I often had to sell into strength (sell-ing when you can, not when you have to). If the stock broke my confi-dence level, I was less inclined to believe in its ability to give me a moreprofitable position.
Impact of Decimalization. This kind of scalping, selling at the first signof waning momentum, was possible in its pure form while the marketstraded in fractions—1/16, 1/8, etc. When Nasdaq trading was decimalized, itbecame much harder to count on an uninterrupted move big enough forsubstantial profit. Instead of moving in 1/8–1/4s which equaled 12–25 cents,stocks started moving in cents with greatly reduced volatility. Still, I con-sider a trade a scalp if setbacks remain small, within 5–10 cents, whichroughly match 1/16–1/8 in fractions.
CHAPTER 2 Turnaround 17

What Are Scalp Setups? For me, scalp setups are any of the pivotal pointsor usual entries on a valid setup for intraday trading, for example, theintraday low on stock that dumps on bad news and pauses and the intra-day high on an uptrending stock that shows signs of a breakout or a bot-tom of a pullback on an uptrending stock (for shorters, all of this can beapplied in reverse). To initiate a long scalp trade, I want to see signs ofmomentum such as a strong bid, thinning ask, and prints at and/or abovethe ask. Of course, this is not a hard-and-fast rule. Sometimes scalperswill bid the stock while the buying side is still very weak, but their expe-rience tells them that selling is exhausted so they will try to get theirshares from last-minute panicking sellers.
Tools and Method of Reading. Level 2 is a must. So is Times & Sales(T&S). I seldom use charts to define the exit point on a scalp. Most oftenit’s Level 2 and Times & Sales. I also don’t normally use any technicalindicators for this style (again, it’s just my personal preference—there aretraders who use stochastic or other indicators when looking for reversal).I’ve found that a chart can be useful for getting an idea about a type ofplay or a certain setup. Then Level 2 and T&S should time the exact entryand exit.
Some Psychological Implications. In trading, the reasons for movementare usually irrelevant (“the chart knows better”). In scalping, the reasonsare as irrelevant as it gets. News, hype, short covering, bottom hunting,value buying, technical analysis (TA) setup; any of these reasons are validfor initiating a scalp trade. One day in 1998, I bought a stock on very goodnews. The catch was that while the headline sounded really great, readingfurther would reveal that it was news about a company with the samename but that was not publicly traded. I believed that traders were likelyto identify the company by name and not read the whole article rightaway. The stock went up about 50 cents, and I hit the sell button as soonas someone shouted, “It’s not the right company!”
I’m not justifying this method of trading. I use it to illustrate theirrelevance of knowing the reason for stock movement. Scalping is agame of blinking numbers. A scalper knows the pattern of the blinkingand goes with this pattern, ignoring such things as company reputation,value, and so on. They just don’t figure in this ultrashort time frame.People’s behavior at pivotal points is all that matters. A scalper should beextremely cold-blooded, pretty fast on the trigger, have lightning-fastresponses, and have good execution techniques.
The stock does what we bought it for, or we are out with no second-
18 PART ONE A Trader’s Journey

guessing, rationalizing for staying in it, or changing our plan as the situa-tion changes. Each trade is “self-contained.” It doesn’t matter where theprice of a new entry is in comparison to the previous one. We buy wherethe setup has occurred. A scalper has to be prepared to see a stock goingmuch higher from our sell point, not giving us a setup for new entry.That’s one of the biggest downsides of this style of trading.
How Risky Is This Style? There is no simple answer to this question.Scalping is one of the toughest styles to learn, and the risk is fairly big ifyou try to start with it. At the same time, if you have mastered it, scalpingis one of the safest ways to trade since your control over the trade is asclose to absolute as possible.
Some Miscellaneous Points about Scalping. A scalper usually buys withbuyers and sells with buyers. If we buy with sellers, our timing has to beimpeccable. If we have to sell with sellers, our timing on the sell side ismost likely off. We need to be extremely precise in our trade picking andentry timing. Our average reward-to-risk ratio is not as favorable as it isfor a good trader operating in a longer time frame, so our percentage ofwinning trades should be higher. It’s one more downside to scalping.
It’s important for a scalper to recognize a familiar situation in theblink of an eye. Intuition plays a big role in successful scalping. By nomeans should a beginner try to follow this style. Scalping is something weshould come to only if our personal temperament leads us there. To makescalping worthwhile, one has to play on average 1000 shares at a mini-mum. So it’s essential to make sure that liquidity is there. Thin issues canbe scalped successfully on small lots like 200 shares, but be aware of exe-cution capabilities. Even a stock with thick levels can be dangerous if ittrades at a very fast pace and with huge volume.
A scalper usually generates more in commissions compared to otherstyles of traders. If this is of concern for you, do not scalp. If you do, for-get commissions. Scalping is about consistent gains, not about big gains.A scalper has no chance to get rich overnight.
Most of the other traders jeer at me about these downsides. Whilesome of them are great friends and traders, the others, who don’t agreewith scalping, consider me some sort of sour taste in their mouth, only tobe scoffed at. This is fine. I don’t trade to prove anything to anyone. Butwhen you come right down to it, my portfolio speaks to my knowledgeand my experience.
Of course, there are upsides as well. Good scalpers are very consis-tent, and their exposure to the market (and that means risk) is very small.
CHAPTER 2 Turnaround 19

They are in control all the time. Consistent gains are great for confidence,for support, and for a constant good feeling about oneself. One moreimportant thing to remember is that no matter what the market does(unless it’s just dead), scalps are almost always there. It’s a universal styleof trading, from a market conditions standpoint. It’s also a defensive styleof trading suited well to choppy and uncertain markets.
CONFIDENCE GROWS FROM EXPERIENCE
Despite all the confidence I gained from experience, I was still notimmune to the downfalls that the market can create. Two big lessons werewaiting for me down the road. In trading, lessons are usually losses. Thecorrect perception of the losses is extremely important for a trader. If weview a loss as a valuable lesson, then we get some value for our money.This value is knowledge, new experience, and new skill. If we don’t learnfrom our loss, it’s money wasted, and we are doomed to repeat the samemistakes.
Both lessons I refer to were of the same kind. Those were my lastbig losses. I never repeated that kind of mistake and never let any loss getout of hand since then. Let’s look at what I did. This kind of mistake isfairly typical.
Trans Texas Gas (TTG)
The first trade involved Trans Texas Gas (TTG). This company an-nounced that it had discovered the biggest gas well of the twentieth cen-tury. The stock went up 6 points in a matter of minutes. I bought myshares within 1 point of the top, at around $19. The stock went up a bit,topped out, and started downticking. I didn’t take my profit.
Why should I? It was a huge gas well! Why shouldn’t I sit out thepullback and wait for the stock to skyrocket? I was expecting furthermove because the news sounded so encouraging. Is this just a stupid kindof mistake that not many traders make? By no means. Time and timeagain, I see traders basing their trading decisions on their evaluation of thenews. A small company announces that its drug got approval to be sold inChina, and traders pile up on the stock because “China is such a hugemarket.”
While this might be a reason to play the stock, is it the only reasonto hold the stock? Absolutely not, but that was exactly what I did, and itstill is what many people do. Let’s assume that we buy the stock becausewe like the product announced in the news release. The stock goes up 50
20 PART ONE A Trader’s Journey

cents, and we celebrate the profit we made because of our “carefulresearch.” But what if the stock goes against us? We hold our sharesbecause it’s such a great product! It very well could be, but does this reallyhave much to do with short-term price movement? Do we know howmany shares are waiting to be distributed to buyers and for what reason?Can we evaluate the potential ratio of supply and demand? And if it’s pos-sible to a certain degree, does news itself answer these questions? Ofcourse it does not.
Needless to say, TTG never reached its former high again. The stockprice slid down slowly. I kept my shares for several days, waiting for thegreat news to be “recognized by the market.” When the stock reachedimportant support, which was indicated by the chart, and broke it, I soldmy shares. The stock proceeded lower, and eventually the companyannounced bankruptcy. It was not easy to take this hit, but the concept ofstop loss was already ingrained in me.
It was a big lesson. Nonetheless, it took one more of this kind for meto realize what I was doing wrong. In the spring of 1998, the first sign ofwhat was later called the “Internet craze” surfaced. Although in hindsight,it really had started with the 1995 Netscape IPO (initial public offering).
K-Tel (KTEL)
K-Tel (KTEL) shares went from $4–$5 to over $20 on news that the com-pany had started selling its product on the Internet. This run caused hotdebate. The reason for such movement looked weak, and the company’sfundamentals were a subject of mockery by many. I shorted 1000 sharesat $21 before the market opened. In a few hours the stock reached $24 andpaused for a long time. I added 1000 shares short above $23. It had to godown. Weak news, weak fundamentals. Why would the stock go up?
Sure enough, KTEL went even higher, and I covered both lots at $29and over $31. The stock closed at around $32. My broker phoned me thatday and said that I had to cover my shares immediately because they hadbeen called in. When I told him I already did, he said I was lucky. He wasright. A gigantic short squeeze took KTEL shares as high as $80. (SeeFigure 2.1.)
I lost over 50 percent on this single trade. It was very painful, ofcourse. But, at the same time, I felt that I finally understood somethingvital for my trading. I had the very strong feeling that it would be my lastbig loss. This feeling was correct. Never again did I take such a hit on asingle trade, and the understanding I bought with my loss on the TTG andKTEL trades has served me well ever since.
CHAPTER 2 Turnaround 21

Learning from Experience
I realized that all those things I was looking at and using as reasons formy trading decisions were completely irrelevant. News didn’t governprice movement; fundamentals did not either. KTEL was going up and upbecause the majority of people trading did not believe it would. Themajority were taking short positions, and the market acted in a way thatwould hurt the majority. The public was thinking, rationalizing, and ana-lyzing, and the public was wrong. But wait. Was it really wrong?
The KTEL price depreciated greatly after the short squeeze wasover, and eventually KTEL shares were delisted from the Nasdaq. (SeeFigure 2.2.) So, was the public right? Actually, yes, it was. Did being righthelp the public make money? No, it lost!
Here is the answer. People were looking at something irrelevant tostock-price movement in this particular time frame. It did not matterwhether or not they were right because it was about something otherthan price direction. Even if they were right, it was not what impacted
22 PART ONE A Trader’s Journey
F I G U R E 2 . 1
KTEL stock adjusted for a 2:1 split. (Used with permission of CBS MarketWatch.)

the stock price. Supply and demand did. People were trying to judgesupply and demand from their evaluation of news and fundamentals. Butthe real ratio of buyers to sellers was governed by different factors, andthose factors had to do with the smart money playing against the crowd.The stock market apparently worked in a way that would allow the minor-ity to take the money from the majority. It’s not a conspiracy; it’s notmanipulation—it’s just the way the stock market works. I need to dothings differently from what the crowd does because crowds are not suc-cessful in any kind of business. Those who reach the top are those whohave unique vision and the ability to realize that vision. So when you seethe crowd going for something, you want to view the situation from a con-trarian’s perspective.
After this realization, the pieces of the puzzle were coming togetherfor me, and my motto “Trade what you see, not what you think” was againvalidated. We can think anything we choose of the news, of a company,of fundamentals, or of financials. But the price action is the ultimate truth.For traders to make money, they have to read price action, not all those
CHAPTER 2 Turnaround 23
F I G U R E 2 . 2
What ultimately happened to KTEL stock. (Used with permission of CBS MarketWatch.)

things that surround market movements. By being around other traders ofvarious experience levels, you can see endless variations of those things.Traders all of a sudden become experts in drilling results, medicalresearch, software details, surgical tools, drugs, electronic devices, andbusiness models. You name it, and they discuss it and argue points. Theytry to take something from the information that will help them predictprice movement. But look at stocks, going from $10 to over $100 andback down, during 1999–2000. Did the fundamentals of the companies,business models, or their shares in the market change that drastically inboth directions during 1 year? In some cases, maybe. But I doubt it wasthe real reason for all those movements of such magnitude.
Here is another example how our thoughts can take us to a dead end:If the Food & Drug Administration (FDA) approves some new drug pre-sented by a company, stock price rises by let’s say 2 points. Then the priceretreats 1 point. Did the FDA withdraw its decision thereby making thestock drop? Of course not. It was the balance of supply and demand thatimpacted the movement and changed the price levels, while the initialpress release served only as the trigger for traders’ interest. Hence, inorder to trade these movements correctly, you need to read this balance ofsupply and demand.
Remember the Bre-X story. Traders were mistaken in their evalua-tion, and they lost. In the case of KTEL, traders were right, and yet theylost again. Isn’t this proof that traders were basing their decisions ontotally irrelevant things? They were creating some other reality than thereality of stock movement.
THE TERRITORY AND THE MAP
John Magee made the following analogy in Technical Analysis of StockTrends. There is a territory, and there is a map. Are they ever exactly thesame? Not really. They might be close if the map is good. But they arenever identical.
Think of territory as stock movement. The map is what we think ofthe stock movement and what we make of it. If all the reasons that tradersdiscuss have nothing to do with stock movement, then what does? Theanswer is the stock movement itself! This is the only reality of the market.That’s why the market is never wrong. The market just is what it is. It doeswhat it does. As a Zen philosopher would put it, the market is.
Let’s return to my trading situation after the two big losses. There Iwas, armed with good discipline, with a new understanding of how the
24 PART ONE A Trader’s Journey

market worked, with great execution technique, and with leftovers of mytrading account—just over $10,000.
I was now under huge psychological pressure. I could not afford anymore losses. This situation is known as “scared money.” It’s commonlyacknowledged that scared money can’t win. Traders refuse to take stopsbecause they can’t afford losses. Not being able to win all the time, traderslet the next loss get out of hand. This is a vicious cycle. I already under-stood all this. I realized that I had already survived long enough to workout a solid methodology and correct mindset. Now I had to make it allwork with a ridiculously small line. I knew I had to have extremely strictdiscipline and keep my stops religiously. I decided to work out a wholephilosophy about stops, and I wrote a letter to myself about stops and theirmeaning for me. It was a letter written by a teacher I created in my imag-ination to me, the student. Here it is, with minor edits.
What Is Stop Loss and How Does One Keep It?
Let’s start with the very definition of loss. When we pay tuition for college,is it a loss? It isn’t if we get a good job based on the education we paid for.It is a loss if we never apply the knowledge we paid for. What if we pay muchmore for education than a new job can compensate us for? It’s still not a loss,but we paid too much for our education. This is exactly what happens in trad-ing. If we bought a stock based on certain criteria, the trade went against us,and we took our stop, is it a loss? It isn’t a loss if we revise the criteria andavoid the same mistake the next time. It is a loss if we repeat the mistake overand over again. If we fail to keep a proper stop and wind up with a much big-ger stop than we should, then we paid too much for the lesson.
However, unlike the example with college, we are given the opportu-nity to assign the price to the education, and we have deliberately chosen topay the higher price! Was it a smart decision?
This is the first element of our self-tuning:
Do not pay more than we can afford!
The market is an eternal educator, but it’s kind enough to let us payas much as we choose to. Education is on sale when the stock hits our pre-determined stop level. It won’t be on sale in a minute, so why should wewait?
The second element of our self-tuning is not thinking of money whenwe’re in a trade. We shouldn’t count what we lose or gain with each tick.The market doesn’t care if we lose or how much we lose. Focusing onmoney just takes us farther from emotional balance while clouding ourjudgment. Monitor what the market does, not how our account is affected.
CHAPTER 2 Turnaround 25

The subject of our job is market movement.
We have to respond to market movement. The third element of ourself-tuning is our perception of ourself when we take the loss. If we come tothe market with the notion that, in order to win, we have to know what themarket does every minute or hour, then how will we perceive ourself when themarket does the opposite of what we expect? As a fool? As a loser?
Nobody wants to be a fool or a loser. That’s where our ego takes overimmediately. It tries to save us from this unpleasant feeling. The next stepnaturally will be to think, “I am not a loser. Those sellers are the losers. Thestock will reverse in a minute, and they will be crying. I will be celebrating.”
See how the ego takes us farther from the territory, making us believeour map is correct? There is a way to avoid this. We need to change theoriginal belief with which we approach the market. Let’s look at our think-ing process if we come to the market with the idea that, “I don’t have toknow what the market does next.” What I do have to know is “What will Ido in any scenario that the market offers?”
By thinking like this:
1. We have already accepted and assumed the stop-loss possibility. It nolonger comes as an unpleasant surprise for us.
2. We have admitted from the very beginning that the market is bigger thanwe are and cannot be controlled or predicted by us. With this under- standing, our ego will be quiet because nothing triggers it.
3. We don’t feel like a fool when the market goes against us. Why would we feel like that if we never thought we were able to outsmart the mar-ket in the first place?
4. We don’t feel like a loser when the market goes against us. Why should we feel like that if we never thought that a winner has to be right every time?
We can see how changing our original belief reverses the way we feeland act. Realize and accept the fact that the market is an ocean. Swim withit; use its current, its ebb, and its flow. But don’t think that we can changethe direction of the current or that we can know all the currents that exist.When we find that the current is taking us in an undesirable direction, weswim out of it and look for another current, instead of waiting for it toreverse.
The next very important element in our self-tuning is our perceptionof our trading as a whole. At the end of the day many great active traderscan’t list the stocks they played, whereas newbies remember each detail ofeach trade for weeks and months to come. Newer traders perceive eachtrade as unique and outstanding. If the trade fails, it feels like a disaster. Ifthe trade works out, it feels like a huge victory.
26 PART ONE A Trader’s Journey

A stop loss limits the pullbacks!
When such significance is assigned to each trade, it becomes hard forthe trader to accept the stop. Accept that our account cannot go up witheach trade taken, just as no stock goes straight up. All have their retreats.The trend is what matters. If our account is on an uptrend, what else do weneed? We need one more thing. We need our pullbacks, or drawdowns, tobe as shallow as possible. But that’s exactly what a stop loss does.
If we can look at our trading as a whole instead of looking at eachtrade separately, then we will feel compelled to apply a stop loss in orderto limit the retreat.
Compare the following two patterns:
�0.50, �0.65, −0.25, �0.35, −0.10, �1.25, −0.15. This is an uptrend withthree shallow pullbacks stopped early.
�0.50, �0.60, −1, �0.30, −1.50, �1.10, −1. This is not an uptrend. It’s anerratic, supervolatile, jumping-around centerline. We don’t want to playany stock that moves this way, and we don’t want our account to look likethis.
We need deep, tight self-control that will allow us to apply stop losseswith no hesitation. There are certain tricks we can use in order to correctour behavior. In an interview with a great trader, I read a confession of awoman who had incredible discipline in applying the stop. When askedhow she managed to achieve it, she said, “I am a very religious person. Ibelieve God doesn’t want me to lose money. I might upset Him if I do. Iapply a tight stop loss and I am in accordance with what I believe in.”
Define the major asset to protect by stop loss and protect this asset religiously.
Find the motivation, the trigger, the valuable asset that can’t be jeop-ardized. It might be something different for each of us. For example, somemay find it helpful to think of our family for whom we want to prosper. Astop loss is our way to protect the prosperity of our family. It could be thecar of our dreams. A stop loss takes us closer to the amount of money weneed in order to buy it. It could be our mortgage, or any number of things.
Be creative with this mindset and find all the tricks that are possibleto make it a loss-cutting machine. The market will reward us immensely.
COMING AROUND THE MOUNTAIN
This was a turning point for me. I learned plenty of lessons the hard way,and I had the distinct feeling that I was turning the corner in my trading.
CHAPTER 2 Turnaround 27

During the summer of 1998, my account made two trips from $10,000 to$17,000 and right back down. It looked like I almost had it right. Thensomething important got away from me again.
Both times, the movements up and down were slow, with no bigwins or losses. I knew I could make it. I just needed to stop thosedrawbacks.
When my account reached $17,000 for the third time, a point thatwas a ceiling for me twice, I stopped trading for a week. I needed to breakthe pattern, to get rid of the feeling that I faced some monetary barrier. AllI did during that week was observe and rest. It was an attempt to forgetthat amount that I couldn’t get past. I needed to stop thinking of moneyand just concentrate on trading itself. It worked. The next week I brokethis barrier and made another thousand.
This was an exciting and encouraging moment. I began to feel thatall my hard work and all the realizations about both the market and myselffinally started paying off. I did everything I could to not let the excitementtake over and make my trading careless. In a few weeks of careful trad-ing, small stops and slow advancing, I finally saw my trading accountreaching over $20,000. At the moment when it broke over $21,000, I didwhat I dreamed of doing for months. I withdrew some money from thetrading account, leaving $20,000 in it. From then on, I allowed my trad-ing account to grow slowly while rewarding myself with some money ona regular basis.
28 PART ONE A Trader’s Journey

C H A P T E R 3
The First Profitable Year
Charting Success
I decided to draw a chart of my trading account movement. The purposewas to create a certain psychological environment for myself. I realizedthat when I failed to break $17,000 twice, I perceived this number as abarrier. I have no idea why $17,000 was this barrier. I realized that on achart of my account movement it looked like a resistance that needed tobe broken. I wanted this chart to look like uptrending stock in which forany setback the price bounces to the upside off a lower support. In orderto create this feeling of the upside from where I was and to limit the draw-backs, I started to withdraw the money from my trading account as soonas it would hit the upper envelope of the ascending channel. This trickallowed me to maintain the feeling of an uptrend. It might seem esotericand artificial, but it worked, and I was happy with anything that did. Sincetrading is a mental game to a great degree, it becomes necessary to usemental tricks. It has been said often that in trading we are our own worstenemies. So it seems only logical to me that, in order to win, we need tofind the way to defeat this internal foe. I don’t believe it could be done bysimply commanding oneself to do the right thing and to stop doing thewrong thing. If it was that simple, nobody would have any troubles win-ning in the markets.
If I hit the lower support and went lower by just $100, I wouldimmediately take a day off and regroup. If, on the opposite side, I wasbreaking a higher envelope, then I was pressing harder and trading moreaggressively. That was the right way to manage the risk: slowing downand decreasing activity when I was experiencing a setback and pushingharder when I was hot. This helped me to keep setbacks very shallow. I
29
Copyright © 2004 by GST Captial Group, LLC. Click here for terms of use.

kept share size to 1000 or less, and stops mostly around $0.25 during thisphase of my trading.
USING A TRADING JOURNAL
Charting my account movement was not the only tool I used to monitormy trading. I also started tracking my trading results in a journal, whichhelped me spot and prevent problems in the early stages. This journalserved me as a kind of mirror in which I could see where my tradingmindset deviated from the right direction. I often hear people advisingothers to keep a trading journal. Over the years, I have seen many ver-sions of them. One aspect of many of them, which I’ve found quitequestionable, is recommendations to write down the trader’s feelingsand thoughts at the moment of trade initiation and during its develop-ment. I don’t think this is a good idea. Here is why. A trading journal fillstwo major purposes. The first is to help the trader develop a collection ofstatistics. This is the obvious purpose of a journal since these statisticshelp traders see which setups work consistently and where the systemfails.
The other purpose is to determine by analyzing these trading statis-tics what is happening in a trader’s mind. However, most mental changesand developments occur subconsciously. It’s hardly something we realizeand recognize while we’re trading. Any attempt to write this kind of thingdown will most likely lock us into the mindset of “what we think wethink.” For example, if problems with our mindset lie below the consciouslevel, then how would writing down these things help us determine wherewe go wrong? We would most likely write down not what really happenedin our mind but merely repeat that same erroneous thinking process thattook us nowhere during the trade. Instead, my approach led to an objec-tive take on my reactions and allowed me to analyze my weaknesses. Thisjournal served as a window into the inner world of a trader’s mind.
I tracked:
� Number of trades per day� Number of winners� Number of losers� Winners/losers ratio� Average winning trade size in terms of points� Average losing trade size in terms of points� Number of points per day
30 PART ONE A Trader’s Journey

CHAPTER 3 The First Profitable Year
Number of Trades per Day
Keeping track of the number of trades per day may seem simple and not tooinformative. But look at it from this point of view. How many trades do youdo in a winning day? In a losing day? The rule says to act more aggressivelywhen you’re on a winning streak and to decrease activity when you’re on alosing streak. Many traders do exactly the opposite. When losing, they try toget it back, to take revenge. And the result is usually not good. In this situa-tion our trades may depend on our wishes rather than on real opportunities.
Winners/Losers Ratio
If a trader sees the winners/losers ratio below 50 percent, something iswrong, assuming that the reward-to-risk scenario doesn’t allow for trad-ing under 50 percent. My system won’t allow the ratio to be under 50 per-cent. It tells me that I am probably overtrading, trying to squeezesomething out of a juiceless trade. Also, my understanding of marketdynamics and patterns is not quite right, and it’s time to go back to papertrading. A ratio of 50 percent or higher seems fine, as long as winners arebigger than losers.
Average Winner and Average Loser
The average winner and the average loser show us whether we have fol-lowed the basic rule of cut our losers quickly and let our profits run. Eachtrader has a level of comfort, with respect to stops, depending on his orher risk tolerance, the kind of stocks played, expectations, and so on.When we look at our average loser for a month, we can see whether wemanaged to keep our stops as small as we wanted. If an average winner istoo small, it tells us that we do many scalps or have problems staying in awinning trade. Different combinations of these statistics give us differentangles. For example, a big number of trades combined with a low winners/losers ratio means that many low-percentage trades were picked.
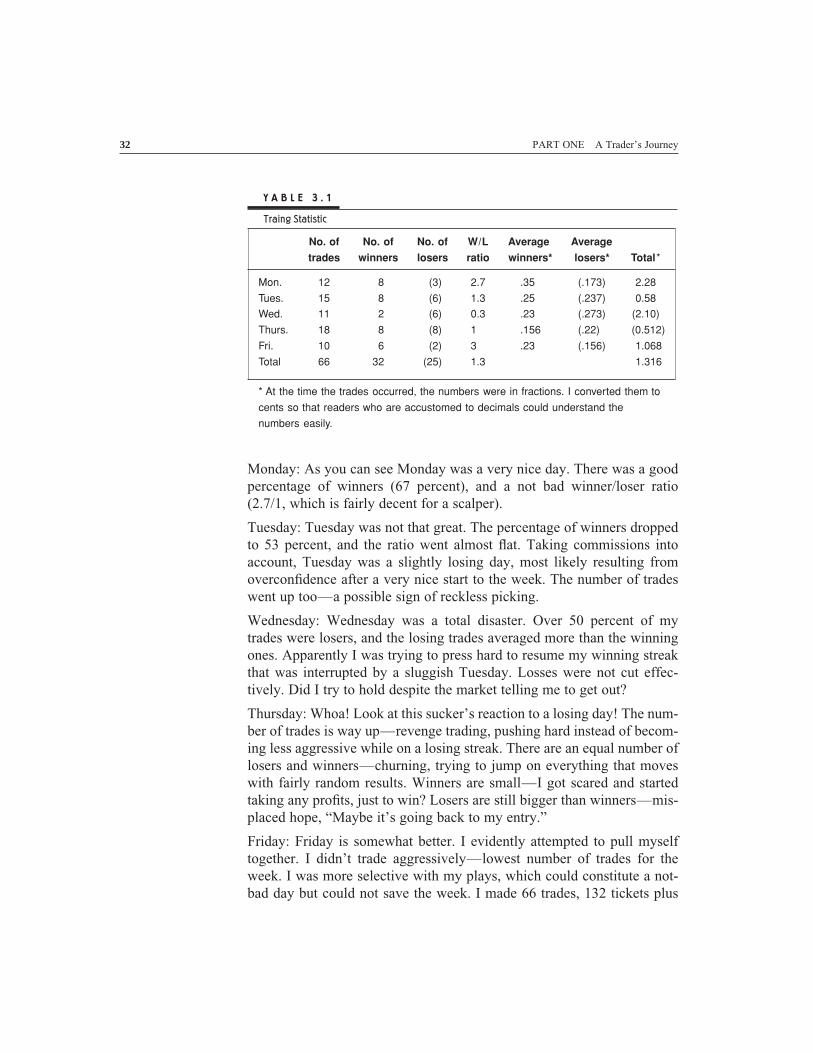
Table 3.1 illustrates an example of such a journal with analysis. It istaken from a real week of trading. I selected a volatile, losing week(before commissions), to show how I acted to spot the problem using thenumbers shown.
“Trades” in this table refers to round-trips (trades bought and sold).Flat trades are excluded. I purposely ignored the impact of commissions;I wanted to see what was going on in my mind, not just calculate my mon-etary achievements.
31
PART ONE A Trader’s Journey
Monday: As you can see Monday was a very nice day. There was a goodpercentage of winners (67 percent), and a not bad winner/loser ratio(2.7/1, which is fairly decent for a scalper).
Tuesday: Tuesday was not that great. The percentage of winners droppedto 53 percent, and the ratio went almost flat. Taking commissions intoaccount, Tuesday was a slightly losing day, most likely resulting fromoverconfidence after a very nice start to the week. The number of tradeswent up too—a possible sign of reckless picking.
Wednesday: Wednesday was a total disaster. Over 50 percent of mytrades were losers, and the losing trades averaged more than the winningones. Apparently I was trying to press hard to resume my winning streakthat was interrupted by a sluggish Tuesday. Losses were not cut effec-tively. Did I try to hold despite the market telling me to get out?
Thursday: Whoa! Look at this sucker’s reaction to a losing day! The num-ber of trades is way up—revenge trading, pushing hard instead of becom-ing less aggressive while on a losing streak. There are an equal number oflosers and winners—churning, trying to jump on everything that moveswith fairly random results. Winners are small—I got scared and startedtaking any profits, just to win? Losers are still bigger than winners—mis-placed hope, “Maybe it’s going back to my entry.”
Friday: Friday is somewhat better. I evidently attempted to pull myselftogether. I didn’t trade aggressively—lowest number of trades for theweek. I was more selective with my plays, which could constitute a not-bad day but could not save the week. I made 66 trades, 132 tickets plus
32
No. of No. of No. of W/L Average Average
trades winners losers ratio winners* losers* Total*
Mon. 12 8 (3) 2.7 .35 (.173) 2.28
Tues. 15 8 (6) 1.3 .25 (.237) 0.58
Wed. 11 2 (6) 0.3 .23 (.273) (2.10)
Thurs. 18 8 (8) 1 .156 (.22) (0.512)
Fri. 10 6 (2) 3 .23 (.156) 1.068
Total 66 32 (25) 1.3 1.316
* At the time the trades occurred, the numbers were in fractions. I converted them to
cents so that readers who are accustomed to decimals could understand the
numbers easily.
Y A B L E 3 . 1
Traing Statistic

some unavoidable partial fills, $20 per ticket (usual commissions at thattime), down almost $1500 for the week.
As this kind of analysis built up, I was able to see the problem as itjust appeared. Familiar patterns of my behavior became visible to me atearly stages thanks to the tables I created. For instance, I already knewthat I tended to overtrade after a losing day. I had to keep myself fromdoing that by effectively improving my reactions. I could track my reac-tions when I was on a winning streak and spot the moment when I wasgetting too reckless. All this monitoring gave me a good look withinmyself. As a result, I became constantly aware of my inner state and coulddiagnose a problem just in time to prevent it from getting worse.
USING YOUR CHART OF YOUR ACCOUNT
Let’s take a deeper look at how to use the chart of your account. I usemine in many different ways. First I match the chart of my portfolio equityto the Nasdaq chart. If I see them going together, it may possibly meanthat the bull market works for me, and that my thoughts are not relevantto my success. There is a good chance that a bear market will take myportfolio down. You can see such a situation in Figure 3.1.
As I viewed this situation, I decided to stay put and sharply decreasemy activity during a down market to reduce my drawbacks. I would alsoanalyze to determine whether I was fighting the market. For example, am
CHAPTER 3 The First Profitable Year 33
F I G U R E 3 . 1
The comparison of market and account movements.
0
500
1000
1500
2000
2500
1 2 3 4 5 6 7 8 9 10 11 12 13 14 15 16 17 18 19 20
COMPX
Account

I trying to go long no matter what, buying false breakouts while the trendis down? This could be the case if my account was drifting down at thesame time as the market drifted down. Therefore, I would need to adjustmy strategy and listen to the market more carefully.
If I saw my account steadily moving up, I would become moreaggressive since I would realize that I was in tune with the market. But ifI saw sharp upward movement, an almost vertical line, I would start back-ing away to avoid or smooth out a setback that usually follows a sharpspike. My experience shows that this kind of spike rarely continues formore than 3 days in a row. (See Figure 3.2.)
Another situation I faced frequently was that my portfolio equitywould reach a certain number and then inevitably drop, like a stock thatcannot penetrate the resistance level. This situation is illustrated in Figure3.3. It’s most likely some kind of psychological barrier. How do I dealwith it? A variety of ways are described in some of the books devoted totraders’ psychology. A solution might turn out to be simple (for instance,taking some amount of money out of the trading account when it reachesthat upper level again). This would allow me to trick my mind into think-ing that my account was at a low envelope (800–850 in Figure 3.3)instead of an upper line (1200 in Figure 3.3), which presented resistance.
This kind of analysis can give great insight into what’s happeningwithin us and serve as a troubleshooting of sorts. We will get back to thetroubleshooting theme later.
My quest for a trading system resulted in a much more solidapproach than simply pure scalping. Even my scalps were not based ononly Level 2 strength, as in strong bids and thin offers. I started to get a
34 PART ONE A Trader’s Journey
F I G U R E 3 . 2
A sharp spike usually precedes a setback.
1 2 3 4 5 6 7 8 9 10 11 12 13 14 15 16 17 18 19 200
500
1000
2000
2500
3500
3000
4000
1500 Steady Growth
Sharp Spike, Time to Get Cautious
Setback

good feel for what Jesse Livermore meant when he talked about smartmoney playing against the public and how to differentiate their footprints.Rereading old books devoted to this topic and careful market observationsled to a trading system that was becoming more and more clear for me. Iwas adding new principles to it, learning to read the volume hints. Theway prices changed and the pace of those changes were no longer a greatmystery. There were apparent clues on the tape.
In many instances I was able to see stages of stock movement, suchas slow accumulation followed by an increased volume and a faster priceadvance. Then I saw when the public discovered the stock, and themovement was becoming almost hysterical. That was the moment whenall the shares that had been accumulated during the first stages weredumped into a volume and price explosion. I learned to take the positionduring the first stages when I could spot it and wait for the crowd to comein and take the shares off my hands. That was incredibly exciting. Insteadof blind wandering, I was now trading on the right side. I was not part ofthe crowd anymore, but I was using the crowd’s emotions.
At the same time, scars from my big losses constantly reminded meabout the risk involved. I was avoiding overnight positions, and my riskwas strictly limited. I realized that such strict limitations were holding meback, but I could not afford any losses. Slow, steady growth was what Iwanted.
In a few months, my trading account reached $25,000, and I was tak-ing money out of it on a regular basis. By adding the amount I took out tothe amount I kept in, I was able to see that I had recouped my losses.
CHAPTER 3 The First Profitable Year 35
F I G U R E 3 . 3
Account resistance caused by a psychological barrier.
1 2 3 4 5 6 7 8 9 10 11 12 13 14 15 16 17 18 19 20 210
200
400
600
800
1000
1200
1400

IMAGINARY FRIENDS ARE IMPORTANT PEOPLE TOO
In early 1999, I incorporated one more trick into my mental tune-up. InChapter 2, I talked about how I taught myself to keep stops. I wrote theletter to myself as a teacher to student. I went farther now. I created amodel trader in my mind. I thought through all his traits as a trader. Hewas the master that I wanted to become. I was not the one who was trad-ing; he was doing the trading. I was merely an observer, an admirer. Ican’t tell you what a huge help this trick was. It allowed me to staydetached emotionally because I was just an observer. In some cases Iwould give him final approval for a trade, after making sure that his tradematched my system criteria and wasn’t prompted by emotions.
My model trader was cold-blooded, calm, and humorous in a cool,dry way. He was absolutely disciplined, and totally focused and relaxed atthe same time. So was I; it’s easy to relax when you are watching some-one else trade. My tension went away completely once I started doing this.Trading became fun! There was no ego involved anymore. If the modelmade some stupid mistake, I just laughed at him. He knew he was beingwatched, and this made him cut his losses very quickly. I cannot tell youhow much this trick has helped me. It resolved plenty of problems I hadpreviously experienced with emotional control. Instead of attempting toget rid of my emotions (as if that were possible!), I found my way aroundthem: I detached myself from my emotions enough to not act under theirinfluence.
Does this all sound crazy? Sure it does, but trading is a crazy busi-ness! It requires an unusual state of mind, so that unusual tricks arejustified.
In October 1999 I finished the third year of my trading. My resultswere spectacular. I took $10,000 up to $70,000, keeping just $25,000 inmy account and withdrawing everything above that. That was a 700 per-cent annual return. At that time my immigration case was finalized, and Ibecame a Canadian resident. I felt more confident than ever. I knew thatmy success was not just luck. It was a careful approach and a valid trad-ing system. And, most important of all, it was the correct trading mindset.The next year confirmed that as I took my account to over $200,000, stillkeeping the same amount of money for trading. Trading what I saw, notwhat I thought, was what I managed to do in my actual trading.
36 PART ONE A Trader’s Journey

C H A P T E R 4
Learning to Trade for a Living
Let’s take an in-depth look at learning to trade. This topic is the subject ofa completely separate chapter for two reasons. First, somehow many begin-ners feel that they can just jump in and start making money. Some thinkthey can learn trading in 2–3 months. Can you imagine any serious profes-sion that could be learned in such amount of time? Trading is certainly notthe easiest of professions. In fact, it is the opposite: I have heard many peo-ple say that this is the toughest endeavor they have ever undertaken.
The second reason is that before you start learning, you must knowwhat you must learn. Far too many traders think that in order to trade suc-cessfully, they need to learn about indicators. They believe that they onlyhave to find the “one that works” or some magic combination of them.Then they think they have the key to the bank. This is a big mistake. Thisapproach leads beginning traders to believe that there are secrets knownto the top traders, and, if they only could get ahold of those secrets, theycould make money easily. I am confident there are no magic bullets, nogreat secrets hidden from the trading masses. So in this chapter I discussdifferent aspects of the process of learning.
I always find it interesting when some traders talk about their hugegains or profits, but never much about their losses. On the other hand,some traders like to tell horror stories. After all, what doesn’t kill youmakes you stronger! This is an interesting dichotomy, as trading is aboutprofits and losses, not just profits. It is easy to spot the worst traders in anycrowd; they are the ones who talk only about their profits. Successfultraders don’t have to prove anything to anyone and they are 100 percentresponsible for their own trading. They know that the successful tradeis the one that worked as planned, which means the knowledge needed
37
Copyright © 2004 by GST Captial Group, LLC. Click here for terms of use.

for the trade was actually acquired already. It is the losing trade that car-ries the lesson to be learned. No matter which method you follow forlearning, the market will always be your main teacher—and its lessons areserved in the form of losses.
LEARN OR YOU ARE BANKRUPT
I have met quite a few traders who have never even tried to learn. Theythought they could use stock-picking services or newsletters, and tradetheir picks without deep understanding. I don’t know any of them whocould make money consistently. Pure followers of stock pickers willnever be around long. Traders have to be their own leaders in order to sur-vive. Furthermore, stock pickers rarely tell you how they pick stocks;they’d rather you just pay for their insight. Let’s face it, followers don’ttrade for a living. Followers exist for a while as they continue in theirlearning phase. But they have to emerge as leaders for themselves if theyare to be traders that are worth their salt. The only kind of stock-pickingservice I would recognize as valid would be the one where the leaderexplains the reasoning for the play so that the traders can follow it, checkif they are comfortable with it, make sure the risk is acceptable, and so on.In this case it’s not about following anymore. It’s a normal process oflearning in which a teacher shares knowledge and experience.
Among the traders I have communicated with are a few who wentthrough the process of learning along with me. Problems they encounteredare quite typical and instructive. For example, one particular trader, awoman from Russia, was easily one of the most intelligent people I’veever come across. As intelligent as she was, she still experienced many ofthe same problems as I did when I was learning to trade. She took a bit ofa different route, however. She started with a trading outfit that taughttraders. She spent many months with this outfit to no avail. Much of heraccount was depleted, the same as mine was. For all I know, the systemoffered could be sound, but the method of teaching was missing much ofwhat trading is really about. No system offers profits to everyone. Somesystems don’t offer profits to anyone. This is another interesting aspect ofselling in America: “If I can’t make money using it, I can make moneyselling it.” Fortunately, I learned to trade without having to pay for some-thing from someone that wasn’t proven reliable. I paid the market for myeducation instead, and what a great teacher it was! Relentless too.
After a few months and a lot of capital spent, the woman began tolisten a bit more to what I was saying. After I began to take my profits togreat heights, I wanted to share with her some of the principles that had
38 PART ONE A Trader’s Journey

CHAPTER 4 Learning to Trade for a Living 39
brought me my success. Some traders listened; some didn’t. Some evenwent so far as to dismiss me and my ideas. But, as a trader, I didn’t care.My account profits spoke for themselves. I don’t have to prove anythingto anyone who doesn’t care to accept what I say. I don’t need to fight withpeople to make them see my point.
The woman’s intelligence helped bring her closer to trading reality.She and I would trade together almost every day from this point on. Shetold me of her trades and listened to my opinions of them. I wouldn’t somuch offer her a trading strategy as a deeper look into why the stockswere moving the way they did. I didn’t realize it at the time, but this waswhen I began to really refine my principles of trading. I began to applysome structure what it was that was working for me. Previously, theseprinciples were simply ideas that were distributed in an illogical mannerthroughout my head. Now, they began to take shape. So while she waslearning from me, I was progressing as well. It worked for both of us.Even more important, we often talked about the state of mind of a trader,and I tried to put into words everything I learned about tradingpsychology.
Her trading account stopped taking wild rides up and down. Instead,her account grew steadily and slowly. She put her own spin on mymethod, and it worked well for her. I have seen this many times: The mostsuccessful students are those who find their own slant on the approachthey are being taught. They apply their personality to the system theystudy and produce their own version of the system. That’s their edge anda comfort zone for them.
Eventually, we began talking openly about other traders. From thesesmall trade reviews, I began to see interesting parallels between me andthem. They were all going through the stages of learning curve that I hadjust gone through. They asked the same questions and experienced the samesituations. I saw many of these traders taking the same journey I had taken.
KEYING IN ON THOSE AROUND ME
As I observed other traders, I saw that they went through different stagesof trading. Their beliefs about the market all seemed to stem from a mis-understanding of it. They heard certain remarks from commercials, bro-kers, and the financial media. But they had a hard time adjusting theirbeliefs to market reality. I realized that any successful learning processmust start with correcting those beliefs. Teachers who instill the rightmindset in their students do more good for the students than does theteacher who only teaches a trading system.

PART ONE A Trader’s Journey
First, let me define a belief from my perspective. A belief is a feel-ing or concept, within any individual, about some future outcome, basedon past experiences or memory. We all have past experiences from earlychildhood all the way up to 5 minutes ago, and these experiences shapeour beliefs about the future.
In general we all hold certain beliefs about life. For instance, theharder we work and the more effort we put in, the more money we willmake. The less we work, the less money we will make. The person whoworks three jobs will make more than the couch potato. But the problemis that this belief does not hold true in trading. It takes virtually no effortto trade stocks. Anyone can buy and sell stocks and have winners andlosers with no effort at all. I remember telling my daughter, who was thir-teen at the time, a bit about what I was doing at the office. She noticed thegreen and red numbers and figured that when she saw green, she wouldbuy. When she saw red, she would sell. It sounded so logical to me that Ijust had to smile. Once a simple observation is learned, with no effort, aperson would buy and sell stocks with no reason or thought. Some ofthose trades would make money and some would not.
When new traders come to the marketplace, ready to trade stocks,they buy here and sell there based on opinions or systems they don’t reallyunderstand. This is a good reason why many do not stick around for toolong. They make trades, winning and losing, with no effort at all. If theywin more in the beginning, they believe that trading is easy, a piece ofcake. How hard could it be? You just buy here and sell there. It’s not untila string of losses, or one great loss, comes along that they begin to rede-fine their thought process. If traders lose and lose, their belief is that trad-ing is impossible, no one can do it. Once they encounter a string ofwinners, or a big win, then their belief begins to change to thinking thatmaybe it is possible. They had an initial belief, based on some criteria, orstring of memories. Once a different criterion was placed in the experi-ence pool, the belief became somehow distorted or was changed.
I started trading, making and losing money with no effort. I contin-ued, lost money with no effort (it doesn’t take any effort to not press thesell button). I continued, learning all I could about the market and myself(considerable effort). I am here now, trading again with basically minimal“effort.”
NOT EVERYONE GETS AN A FOR EFFORT
What is the difference between my beginnings, when I traded with noeffort, and where I am now, trading with minimal effort? I traded with no
40

effort from the beginning because I did not feel fear. There was nothingto tell me that there was something to be afraid of. You learned of a fewof my horror stories and they certainly instilled fear in me. I learned riskand management principles, and I geared my inner self to trading. Now Ihave nothing to fear again. I don’t believe that the market can take morefrom me than I’m willing to give it. It’s interesting how a beginner and anexperienced trader can have the same belief yet a different understandingof the market.
The biggest difference at the beginning stage was the lack of respon-sibility—the beginners’ belief that trading is based on “the market mak-ing and taking their money.” Experienced traders know that it is they whoare accountable for their trading and the money they risk and make oneach individual trade. Beginners will never become professionals withoutbeing accountable for their own actions. Trading has nothing to do withwhat the market “does to you.”
Another aspect of this belief adjustment relates to my Russianfriend. She tried to learn a certain system from a trading service. Systemsare not “one size fits all” entities. There are numerous systems and numer-ous books about systems. And I’m sure there are many more to come. “IfI can just find the right system, trading will be a piece of cake.” We knowthis to be false, since no system provides consistent winners from indi-vidual to individual. If a system existed that provided winners to all whoused it, there would be far more traders making a very good living. Butthe fact is that 90 percent of traders lose money. Within a group of tradersapplying the same system, one trader makes more money than another,and some don’t make money at all. The system is the same, so why are theprofits different? Trading again is about us and is just a reflection of whowe are at any given moment. Let me illustrate. You are in the stock, andit makes a couple ticks in your favor. Are you confident and calm? If youare, then you will let it run, allowing the profit to develop. Are you a cow-ard, or do you feel unsure? If either is true, you will take your profits pre-maturely. Your position is moving against you—are you a cold-bloodedtrader willing to accept the risk even before you put on the trade? Or doyou feel like you just can’t accept monetary loss? If this is the case, thenyou are going to take your stop loss in the first case, and you will be sub-jected to a horrible emotional spiral in the second.
We see simple market movement every day. The market moves upand down, as aggregate shifts of demand and supply lean to one side orthe other. This happens at all price levels. The basis for movement is whatwe as traders try to define and profit from. Some see it on a tape-readingplatform, some by technical analysis, and some don’t use anything (they
CHAPTER 4 Learning to Trade for a Living 41
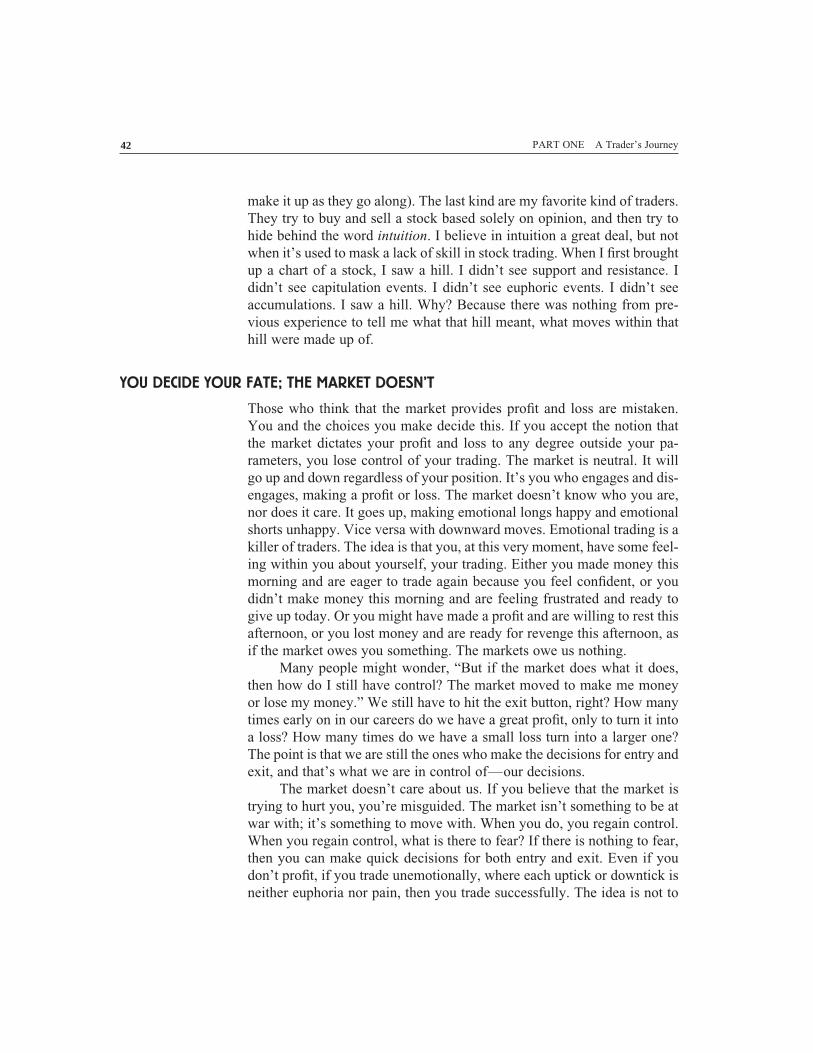
make it up as they go along). The last kind are my favorite kind of traders.They try to buy and sell a stock based solely on opinion, and then try tohide behind the word intuition. I believe in intuition a great deal, but notwhen it’s used to mask a lack of skill in stock trading. When I first broughtup a chart of a stock, I saw a hill. I didn’t see support and resistance. Ididn’t see capitulation events. I didn’t see euphoric events. I didn’t seeaccumulations. I saw a hill. Why? Because there was nothing from pre-vious experience to tell me what that hill meant, what moves within thathill were made up of.
YOU DECIDE YOUR FATE; THE MARKET DOESN’T
Those who think that the market provides profit and loss are mistaken.You and the choices you make decide this. If you accept the notion thatthe market dictates your profit and loss to any degree outside your pa-rameters, you lose control of your trading. The market is neutral. It willgo up and down regardless of your position. It’s you who engages and dis-engages, making a profit or loss. The market doesn’t know who you are,nor does it care. It goes up, making emotional longs happy and emotionalshorts unhappy. Vice versa with downward moves. Emotional trading is akiller of traders. The idea is that you, at this very moment, have some feel-ing within you about yourself, your trading. Either you made money thismorning and are eager to trade again because you feel confident, or youdidn’t make money this morning and are feeling frustrated and ready togive up today. Or you might have made a profit and are willing to rest thisafternoon, or you lost money and are ready for revenge this afternoon, asif the market owes you something. The markets owe us nothing.
Many people might wonder, “But if the market does what it does,then how do I still have control? The market moved to make me moneyor lose my money.” We still have to hit the exit button, right? How manytimes early on in our careers do we have a great profit, only to turn it intoa loss? How many times do we have a small loss turn into a larger one?The point is that we are still the ones who make the decisions for entry andexit, and that’s what we are in control of—our decisions.
The market doesn’t care about us. If you believe that the market istrying to hurt you, you’re misguided. The market isn’t something to be atwar with; it’s something to move with. When you do, you regain control.When you regain control, what is there to fear? If there is nothing to fear,then you can make quick decisions for both entry and exit. Even if youdon’t profit, if you trade unemotionally, where each uptick or downtick isneither euphoria nor pain, then you trade successfully. The idea is not to
42 PART ONE A Trader’s Journey

get rid of all your emotions. I don’t think it’s even possible. The idea is todistance your trading decisions from your emotions. Understand that mosttraders experience the same set of emotions, and most of them lose.Doesn’t this tell you that you need to learn to stop your emotions fromgoverning your trades? Even more than that—you can use your emotionsas a mirror to reveal what the majority thinks and feels, thus effectivelyallowing you to exploit the fear and greed of others. And, again, in orderto be able to do it, you have to be emotionally detached; you need to bean objective observer of everything, including your own emotions.
ADDITIONAL IMPORTANT BELIEFS
One of the worst problems I had in the earlier stages of my career was lis-tening to the opinions of others about my position. For example, when Iwent long in a stock and then heard someone mention that the marketshould sell now, I became anxious and eager to get out of my position.
If the market cannot hurt us, then other traders’ opinions of stockmovement can’t either. We enter a trade based on our own experience andperception. We don’t enter a stock and then immediately exit becausesomeone suggests it’s a bad idea. This is like cheating off the paper ofanother student, changing your answer from the right one to the wrongone because you think the other student knows more than you. If we makea choice in entering a trade, knowing that the market cannot hurt us out-side of our predefined risks, then we shouldn’t let an outside opinionchange our minds so fast.
The biggest problem I see with traders’ application of their systemsis that the systems tend to create the illusion of certainty and predictabil-ity. Systems do not tell the future. They simply provide us with signals forentry and exit. Systems offer a probability of success, not a certainty.
Once all the traders see an obvious pattern, there cannot be a prof-itable outcome. The majority can’t win in the market over time. The mar-ket can’t exist this way. When traders’ beliefs aren’t close to marketreality, they will continue to allow us to feed off their misguided notions.Fortunately these beliefs will never change, because the market neverchanges.
One of the most common beliefs is that the more we learn about aparticular stock or company, the better we can read the price movement.Many times throughout the early learning stage of my trading, I fell preyto the notion that I “had” to know what the market was going to do or whatan individual stock was going to do. For example, the market maker,PUNK, was selling an amazing number of shares at $20. What did it
CHAPTER 4 Learning to Trade for a Living 43

mean, and what happens next? NDX is under 1900; what does it do next?Eventually my answer came to be, “I don’t know. You can’t possiblyknow. No one knows. And you know what? I can trade successfully with-out knowing!”
TRADING IS NOT A NEED-TO-KNOW BUSINESS
As I talk with other traders throughout their training process, I am oftenasked, “I need to know. Otherwise how can I trade?” This is the majorquestion traders have to answer. The answer can be found in the generalapproach to the market and in the understanding of its mechanics.
Let’s take a simple situation and determine whether it is possibleto know all the factors that will impact future action. If it is, would thisknowledge really help us to foresee what the market will do? Let’s goback to the market maker example. PUNK is selling a healthy numberof shares at $20. The buyers hit him with continuous orders, and theorders get filled, yet PUNK is still there. The trader then thinks, “OK,how do I figure out how much is for sale because I can’t trade notknowing it.”
Is it really possible to know how many shares PUNK has to dump?It’s virtually impossible. Let’s assume that he has an order from a bigclient and sells for the client. Sometimes even the market maker does notknow the size of an entire order! Many times a client will not give thewhole order to the same market maker. The client will split the order upto see who can get the best price, and possibly route remaining shares tothe better of the market makers. Or the client might be trying to avoid let-ting the word out about a huge position change. There are a whole slew ofthings a client can do with an order.
For argument’s sake, let’s assume that in some mysterious way thetrader actually has information about what the client is doing. Now thetrader knows for sure that PUNK has 3 million shares to dump. Does thisknowledge help the trader see what happens next? No, because the tradercannot know how many shares buyers are willing to buy. If they want 10million shares, the stock will most likely go up after PUNK is done. Ifthey want 500,000 shares, the stock price will most likely drop when thebuyers are done.
Let’s make the next step in our unrealistic assumptions and pretendthat our trader knows that buyers want 5 million shares. This still won’thelp the trader because the market is not static; it’s changing all the time.When PUNK is done, how can we know that other market makers won’tmove to the same price with their liquidity, because they just got a call
44 PART ONE A Trader’s Journey

from their client? Or, how can we know that buyers won’t change theirmind after they bought 2 million shares and decide to wait out a bit to getshares at lower prices or maybe limit their exposure for now?
MAKING THE ODDS EVEN
Now let’s pretend that we are conspiracy-theory idiots and that we reallythink everything in the market can be known or figured out. We knoweverything I’ve already discussed. It still won’t help! As the stock pricesmove, the balance of power changes, and new forces become interested intaking or liquidating positions. I know that people in their right mindswould never suggest that anyone could ever possibly know all the currentintentions of all market participants, and I also know how the intentionswill change as prices change.
As you can see, the very nature of the market is uncertainty. Thereis no such thing as “know.” The market works in probabilities, not cer-tainties. This is what makes trading so challenging, and it is what makestrading different from many other careers. Engineers calculate and applylearned methods and know how a construction is going to act under cer-tain circumstances. They don’t have to deal with wondering whether abridge will hold if a certain amount of pressure is applied. They had bet-ter know it will hold. Our entire system of education is built on thisapproach. We gather information, analyze it, make conclusions based onfacts, make a decision based on knowledge, and finally act on this deci-sion, getting the result we determined in advance.
What happens to people who try to trade using this kind ofapproach? Naturally, they attempt to gather as much information aboutthe markets as possible. Then the information is analyzed. The tradersnow feel armed. They act on this information according to the analysis.Then they observe that despite their preparation, results are random.Sometimes the market acts as they thought it would, and sometimes itdoesn’t. Naturally, traders next decide that their information is not enoughor that their method of analysis is not perfect. They delve further, apply-ing new systems and new indicators, thereby making their analysis moreand more complicated. All this activity convinces the traders that they areon the verge of finally figuring it all out.
We all, I am fairly sure, went through this vicious cycle in whicheach new piece of information seemed to be the missing piece of the puz-zle. If a trader takes this journey, frustration is unavoidable. What happenshere is that traders are trying to apply a method that has nothing to do withthe way the market works. This methodology of collecting, analyzing, and
CHAPTER 4 Learning to Trade for a Living 45

concluding works in the environment of certainties, and the market is notsuch an environment.
Our next question naturally is, “How am I supposed to trade withconfidence if I can’t know anything about what happens next?”
MAKING THE PROBABILITIES WORK FOR YOU
We are supposed to go with the odds of probabilities. Every time we puton a trade, we accept that this trade and any other can be a loser no mat-ter how good it looks. That’s how we get rid of frustration caused by thefact that our brilliant analysis took us nowhere. If the loss is assumed andaccepted in advance, it comes as no surprise. It’s just one of the scenarioswe can foresee. This is the key. Instead of thinking that the market is def-initely going to do this or that, think in terms of if the market does this,then I will do that. You need several scenarios in if-then terms. Now youare protected from frustration because you never tried to predict anything.No prediction—no surprise—no frustration.
It’s unusual for human beings to think like this, which is exactly whyfew traders succeed. The minority learns to think like this. The majorityeither never does or never even realizes that a different way of thinking isnecessary. The majority seeks certainty to no avail, trying to find it inmythical inside knowledge or in trading systems. When I make a suc-cessful trade, does it mean that I knew it going to happen? No. I did notguess, either. I saw familiar price and volume action with a recognizablesetup. I knew all the possible outcomes of this setup. If the stock movedthrough $20, then it was most likely to go higher. If $20 was never bro-ken, then the trigger for the entry was never given, so I would do nothing.If it moved through $20 but then lost to $19.75 on pullback, then it’sweaker than I thought, and this would be a stop loss. I have a set of sce-narios based on the range, on the trend, and on the support and resistancelevels. As soon as the stock shows a break out of the range, violating theresistance in the direction of the overall trend, a buy is triggered.
Do I know what the stock is going to do after that? Of course not.No one does. I react to a scenario I have prepared in advance and that istriggered by market action. The market gives me a signal, and I go withit, letting the market do its thing and reacting on what it does. For me thisis the only way to approach trading. Don’t ask why and don’t try to pre-dict, meaning don’t try to figure out why this or that movement occurs. Itdoesn’t matter. You need to spot the movement, to categorize it, and toexploit it if it fits into a set of familiar scenarios. That’s all there is to trad-ing, aside from mental preparation. If you feel the urge to know why
46 PART ONE A Trader’s Journey

something happens, then you should understand that you want to be ananalyst, not a trader. By the way, many brilliant analysts make very poortraders.
TAKING STOCK OF IT ALL
To sum up, the market is merely a by-product of the actions and intentionsof all its participants. As prices move and events happen, those intentionschange all the time. Thus, it is impossible by definition to know what themarket will do next. Trading is not about knowing, figuring things out,and so forth. Trading is about acting in familiar situations on familiarsignals.
Learning to trade requires two things. The first is that set of familiarsituations and signals, which is not too hard to learn or to teach. In thisregard trading is not rocket science. The second is adopting the unusualmindset that allows us to act in an uncertain and highly liquid environ-ment. This is obviously harder since trading is a somewhat esoteric field.It’s not easy to learn the mindset, the mental state, the discipline. You canexplain these things, but can you teach someone how to achieve them? Inmy opinion, yes. For example, samurai fighting techniques and martialarts are based on a specific mindset. And there are teachers and students.Such skills require a different kind of teaching, not the one we find inschool. It’s not enough to just tell the student what to do. The teachersmust be able to demonstrate what must be done. At the very least theyhave to have once been successful at what they are teaching. Without thefirst-hand knowledge and experience, the teachers will have nothing to telltheir students about the hardest to learn and most vital element—correctmindset.
People who teach trading must demonstrate the correct approach.And at the same time, this process of learning requires strong dedicationand sincere desire from the student. I don’t believe the people who say,“You can’t teach trading; one either learns it or not.” However, as withanything, you can show and explain, but you can’t make anyone do theright things. We need to accept the fact that not everyone can be taught todo this. After all, we all have different psychological profiles, and tradingrequires such an unusual attitude toward risk and an unconventional stateof mind. There must be a certain percentage of people who are just not cutout for it.
There is one more aspect to learning this profession. No matter howintensive your educational process may be, you still need a lot of personalexperience. Many good trading habits come to a trader only through the
CHAPTER 4 Learning to Trade for a Living 47

process of actual trading. You hear many times that you need to hold yourstops, and you do realize the importance of this. Yet knowing this doesn’tmean that you are going to take the right action when you face a losingtrade. Going through certain experiences is an irreplaceable part of a trad-ing education. The beginning stages of trading are hard because they arealmost inevitably sprinkled with losses. It’s imperative to keep them assmall as possible, because so many traders run out of capital before theyget a real chance to learn. You have to grind it out, survive this period ofthe learning curve. And it could be really long, often a year or two, possi-bly longer, and very seldom less than a year. I don’t mean to suggest thatafter you have gone through this stage, you know everything there is toknow. The market will always offer new challenges, and you will alwaysfind something new to deal with. But this provides an opportunity for youto refine your skill.
48 PART ONE A Trader’s Journey
C H A P T E R 5
The Trader’s Circle
Bridging the Gap between Art and Science
Most people refer to the journey a trader takes as a learning curve. Letme step away from the “curve” portion of this phrase and focus on trad-ing as a progression into one’s self. As we discuss earlier, trading isn’t alogical 1 � 1 � 2 or a mechanical “all you have to do is see this systemand you win.” Traders need to think in a different paradigm, one thatincludes mechanical information with mental strengthening.
Mechanical information is easy. Anyone can read a few books,observe a few trading sites, and learn a trading system. Every pro-fessional trader knows what a cup-and-handle formation is, whatBollinger Bands are, what Fibonacci lines are, and so on. Professionalsmay not use all these things (there are only so many indicators that onecan use), but they have a general understanding of their purpose andtheir relevancy. Furthermore, professionals do not negate mechanicalideas. Rather they accept them as complementary and assume that theyare based on reality, and not illusions created by passing fads and cor-rections, where in a few months, the mechanics no longer work. I haveseen numerous examples of where a bull market strategy no longerworks in 2000–2002 and might very well not work for the next coupleof years.
Mental strengthening is not easy. It’s especially difficult for thosewho think that trading is purely mechanical and nonartistic. Traders suchas these continue to try to prove that if you find the right system, youwill be successful. These traders often contradict themselves as they talkof emotional control, egoless trading, trading what you see, and crowd
49
Copyright © 2004 by GST Captial Group, LLC. Click here for terms of use.

psychology. However, if everything were purely mechanical, then therewould be no need to discuss any of these issues. Furthermore, if every-thing were purely mechanical, then everyone using the system would per-ceive the market in the same way. If there are 1000 traders using a system,why can’t all of them actually make money?
Clearly, trading does have artistic aspects. Well-known physicistYakov Zeldovich said it best, “Science has one answer where art hasmany.” To illustrate, imagine a stone, a simple stone. When an engineeror a math professor or a carpenter look at it, what is it they see? Just ashapeless stone, right? But when a sculptor looks at it, he or she sees abeautiful masterpiece. Let’s have two sculptors look at the same stone.Will they see the same thing? Of course not. Each will have his or her ownidea of what shape the stone will take. Similarly, two traders don’t see thesame trade in the same market action. It is how artists apply themselvesthat defines what comes out of a shapeless stone. And it’s how tradersapply their personality that defines what kind of trades they make. Wecan’t shape the market in the same way a sculptor shapes the stone, but inboth cases we have something that we need to apply our vision to andextract what we want from it. The subject of our artistic work is ourtrade—this is what we shape in a way that is governed by our skill, ourperception, and our vision. Later we provide examples of how traders seedifferent ways to play the same setup. All those ways can be valid, as arevalid different works of art seen by the sculptors in the same originalshapeless stone.
There is a fine line between flexibility and the tendency to changeyour approach as soon as your system produces a loss. After all, we arewired in a way that makes it hard to repeat doing the same thing when weknow it doesn’t work. But that is exactly what a good system assumes usto do. You have to endure a string of losses sometimes in order to allowprobabilities to work in your favor, because you can’t know which tradeis going to end your losing streak. At the same time, when you see themarket changing its tune in a way that requires significant adjustment, youneed to make the adjustment, or you are destined to stay with a losingstrategy indefinitely. This is one more side to trading where art plays a bigrole.
My partner and I both use tape-reading principles to define themajority of our exit and entry plans. We both are very close to marketreality and have emotional control in our trading. We complement eachother. Yet, we can look at the same stock and have two totally differentideas on where that stock is moving. This proves that mechanical setups
50 PART ONE A Trader’s Journey

by themselves offer only the raw material for something deeper and moreimportant.
STRENGTHEN THE MIND AS WELL AS THE SYSTEM
Traders must condition their mental processes to enable them to createsynergy between mechanical strategies and the mental capacity to followthrough on the signals of exit and entry.
If we think of trading as a circle, then the beginning stage is one spoton the circle. The circle represents something tangible because traders canmove around on the circle to different phases of trading regardless ofwhether they are professionals or beginners. Some new traders have char-acteristics that are more developed than those of professional traders.Conversely, some characteristics in professionals seem more related tobeginners. This is further evidence that mechanical trading leaves outmuch of what is important. Ego, emotion, anger, and revenge can befound in a trader of any level if the trader allows it.
The goal of newer traders should be to get as close to reality as theycan, but not too close lest they feel that they have everything all workedout. When they feel they have it all figured out, traits of new traders comeback to haunt them and create drawdown periods. The goal of the traderis to develop an unemotional, egoless, and clear perception of stock mar-ket reality. Getting from the first part of the circle to the last part and stay-ing there is an extremely difficult process, which is the reason whytraders’ success ratios are low. As I’ve noted before, only the minority issuccessful.
For example, in sports, we have little league baseball in whicheveryone can participate. High school teams have tryouts, and only thebetter players are selected. College takes the cream of that crop, and even-tually professional sports takes the best of the best. The minority suc-ceeds. There are numerous examples of how the minority succeeds. Oneof the things that contributes to the success of members of the minority isthat they don’t think like the majority.
This is how, in tape-reading principles and trading, what you see,not what you think, allows you to become the minority. There are fourstages—newer trader, developing trader, striving trader, and realitytrader—that take you from majority thought to minority success. Thesewere the stages I went through and that I see others go through all the time.
As a newer trader, I traded on what I thought. My opinion ruled myworld. I had no real understanding of how tape principles (accumula-
CHAPTER 5 The Trader’s Circle 51

tion/distribution) governed the market’s behavior. I did not seek out anytype of system that provides structure to the chaos of price movement. Iused phrases like, “Day traders ran that stock past our stop.” “When youthink a stock is too high, then it’s time to short.” “Market makers are aconspiracy group existing to take a stand against my position.” “If youwant to make money, just do the opposite of what I do.” (This last one ismy favorite since it proves minority versus majority thinking in an indi-rect manner.)
I usually had mixed results, much about which you have alreadyread. There was a string of losses or wins, but I did not make a profit con-sistently over time. The market was a constant struggle. Jealousy, anger,frustration, and fear of failure were what I experienced as this type oftrader. Even more interesting is the fact that all these emotions were cre-ating distortions in my perception of the market without my being awareof it. I had no idea that mental change was necessary in order to get mecloser to the last phase of the trading circle.
FINDING OUT MORE ABOUT MYSELF
When I moved from a newer trader to a developing trader, I began to real-ize that there are ways to bring structure to chaos through systems andprinciples. I started to relax a bit more. Feelings of frustration and angerbegan to give way to little bits of hope and “trading eurekas” in my head.I started seeing market realities. My initial thoughts about how the marketworks began to break down as the walls of illusion crumbled. I started toquestion things I had often heard. For instance, market makers weren’treally a conspiracy. Now trading the market became less of a struggle. Ibegan to see how market discounting worked. And I understood whyAristotle couldn’t have succeeded in the market (everything is a fuzzyprobability, not a logical certainty).
At that time, I also started playing a little psychological game withmyself. I would either get down on myself or be happy with myself aseach trade closed. I was having trouble disassociating my trading from myself-worth. So I came up with the trick I mentioned. When I came to thecomputer to trade every day, I viewed myself as someone other than meat the computer trading. I would act as this other person’s mentor, watch-ing what he was doing, reviewing his trading, and helping him to be a bet-ter trader. When he was trading well, I was just his admirer. I separatedmyself from this trader. Therefore, any trade he made, he made. It hadnothing to do with me. I was there only to watch what he was doing.Eventually, I became that detached observer, and that detachment is
52 PART ONE A Trader’s Journey
essential to a trader’s state of mind. Since then, emotion and ego haveceased to be part of my trading plan.
However, my trading results didn’t really get me to the point whereI could make a living. I was still in a fear of failure, since I wasn’t sure Icould support my family as well as meet all of Canada’s requirements forcitizenship. It was a heavy burden to know that at any moment I mighthave to leave the country. While most people could simply quit tradingand go find a job, any job, I didn’t have this luxury. Therefore, whentraders do finally quit and go out whining that they have to go find a job,I have sympathy for them, of course, but I can’t help thinking, “Try quit-ting your job and leaving your country!”
GETTING THROUGH THE STAGES
When I finally got to the stage of striving trader, I had told myself that Ihad to make this work. I had no alternative. I was always used to havingbackup plans, and, for the first time in my life, I didn’t feel as if I reallyhad one. I had to make trading work. I started to work on my understand-ing of true market reality. I was no longer a slave to common thought. Iwas beginning to understand and work on thinking the way the minoritythinks. I now understood how to use common thought for my benefit, thatis, to profit off the majority and to position myself on the side of smartmoney.
For example, market makers were no longer a group of conspiracyplayers. They exist to provide liquidity to stocks and often fight each othermore than they try to hurt us. We are last on their list for trading inten-tions. This is just one example of my adjustment in thought. I wasn’t atwar with the market makers. I was happy they were there to sell me sharesand buy my shares when I felt it necessary for them to do so. I started todevelop a stable portfolio (a plateau, if you will), which eventually took aslow uptrend. I used tape reading and other market principles such as fun-damental analysis or technical analysis effectively and in a complemen-tary way. Books, friends’ ideas, research of ideas, and so on were allbecoming a part of my arsenal. I was using them to get closer to the truereality of the market.
THE FINAL STAGE
When I finally got to the stage I call a reality trader, I found myself in theultimate state of trading, which allowed me to take my $10,000 to over$200,000 in just 20 months. I accomplished this with consistency—no
CHAPTER 5 The Trader’s Circle 53

huge wins or major drawdowns. My unemotional and egoless self allowedme a true and clear perception of market events and created the edgeneeded to trade profitably.
I believe that the first two stages of the circle were the hardest. I cansee this same struggle in other traders. The market is a struggle, stockaction is unclear, opinions are formed, executions are impossible, and soon. If there was a problem, this was the stage in which we’d find it. I askedmyself why all these traders who were posting gains were entering hereand there, exiting here and there. I had no understanding of what theywere doing. I remember almost being angry with financial TV personali-ties because all they had to do was report the news. And they got paidhandsomely for it, while I was having to trade to make a living. Yet Ichose to trade for a living. It was just another example of how far fromreality many new traders are.
Now that I’m at the last stage, a reality trader, I realize that the hard-est phase is actually the third phase, that of a striving trader. It is easy tobe new traders. They allow ego and common thought to dictate their trad-ing. They feel that it is okay to be far from market reality.
As a new trader, I was being fed information for the benefit of oth-ers, not my own. I was told that a certain stock was a strong buy; it wastargeted to go another 50 points higher. I was told to hold on; it wouldalways come back. “Don’t stop out. A loss is a loss only if you take it.”Look at the price of New World Restaurant Group (Nasdaq: NWCI) inFigure 5.1.
My friend bought this stock because he was told it was going to bethe next Starbucks, and he believed it. He jokes to me that he still owns itas a memento of his stupidity.
I never understood how traders could lose money and not seem to bebothered by it because they were in good company. It appeared that los-ing money was fine as they belonged to the club. The traders’ job is toread stock action correctly so that financial rewards allow them to be thepersons they want to be, not because they want to feel comfortable infinancial destruction. Yet, I see this all the time as newer traders struggleto get through the learning phase.
If you are trading like a newer trader and have this mindset, youmight as well buy and sell stock arbitrarily. If you lose, it’s the mar-ket’s fault. If you win, then your confidence creates a false sense ofsecurity. Worse, you allow random successes to reinforce habits thataren’t conducive to long-term success. Averaging down, justifications,and turning intraday trading strategies into long-term investing strate-gies are just another way to rationalize a losing position: “Oh well, it
54 PART ONE A Trader’s Journey

goes into my retirement account.” I want my retirement account to befilled with more winners rather than a bunch of losers. I’ve never beena big fan of mixing trading strategies from intraday to long-terminvestments.
Consistency isn’t found in these stages because traders are not see-ing reality. There is no accountability and little pressure. They trade whatthey think. They focus on money. It was not until I got to be a strivingtrader that I realized that price and volume are what matter. Tradersshould read price action, not guess or predict market value. Money comesas a reward for a trade well read. Our risk is reading it wrong. We still takeaccountability for that trade.
COMPLETING THE CIRCLE
Traders in the newer trader phase need to build on a foundation of incor-rect assumptions and false thought processes. Then later, when they seethe reality, they are able to tell the difference. It is the same idea as com-peting against the best to make you better. Once you improve, you can see
CHAPTER 5 The Trader’s Circle 55
F I G U R E 5 . 1
New World Restaurant Group (NWCI) stock. (Used with permission of CBS MarketWatch.)

your earlier faults and therefore be less inclined to repeat your mistakes.As I progress from year to year I laugh at my inadequacies from the yearbefore. If I ever evaluate my trading and don’t see problems from the pre-vious year, I will quit trading for a while because it means that my ego hasgotten the better of me.
Unfortunately, I see traders I’ve known for years trading the sameway today as they did years ago. Their accounts bleed, but they continueunchanged. They let their blindness to market reality feed their ego. Themarket eventually finds a way to separate the mule from its nourishment.
Developing traders break out of this mold in a positive way. Theybegin to see some tools such as charts or “trading systems” that they seeothers using profitably. This gives them a little hope that they can do thisas well. They see the trade setups, the postings of traders, the participa-tion, the records, and so forth. This creates a little confidence. But thesefactors don’t break down the walls that most traders have. There is stillplenty of emotion, ego, overthinking, and wrong perceptions of stockmarket reality. Traders still think that mechanical trading is all they need.They don’t understand yet that when traders are successful, the reason isusually mental. They have limited ideas about risk evaluation and moneymanagement.
During this phase, traders usually come to the point that they eitherdecide to give up or take the next step. If they make it past the newer stageof trading, this next stage is the one where the market does its second cutfrom the team. Traders understand that while some structure begins tocome into trading, there is still plenty that is not working right.
My friend who bought NWCI, interestingly enough, made the tran-sition from a developing trader to a striving trader without consciouslydoing so. I told him to read the trading classic, Reminiscences of a StockOperator, which completely changed his perceptions of the market
He told me that as he was reading this book while flying back fromCalifornia. His reading led him to understand that he had more to learn. Ifeel that in every successful trader’s life, there is an event or a progressionof key events that turns one’s mind around from common thinking tominority or “out of the box” thinking. It wasn’t until he read the book thathe really began to make the transition into the next part of the tradingcircle.
He was a trader for one of the trading services I was using as ameans of finding trading ideas. He was a young man, in his mid-twenties,sharp, but with a bit of an ego that always kept him at arm’s length fromme. However, he drew my attention by an interesting contradictionbetween his apparent abilities on one hand and his misguided approach to
56 PART ONE A Trader’s Journey

the market on the other. He was obviously very bright and capable oflearning quickly. I saw him trading for this or that reason, winning andlosing. When he lost, he would change his trading plans again and againwith each new breakthrough of understanding. He was able to see whatworked and didn’t work for him. Although he learned trading basics veryquickly, his coworkers and work environment were pushing him in thewrong direction.
He used the formal approach of attempting to apply simple logic tomarket movements—the same old “good news, bad news, too low thentime to buy, too high then time to short.” It was interesting to observe himoutgrow this approach. At one point, to my amusement, he tried applyinga system called “momentum” trading. I could never understand how trad-ing tops and bottoms, in effect, reversals, could be construed as mo-mentum trading. He had a breakthrough to reality when he figured outfor himself that momentum should refer to trading in the direction ofthe trend. This realization allowed him to see a whole new world ofopportunities.
I could see his thoughts and trades begin to change ever so slightly,moving away from the strategy that he was struggling to find peace with.The service he worked for wouldn’t allow methodology that contradictedits foundation to be traded, much less taught. He could see he was in adead end. He didn’t want to limit his trading progress, and I could see hewas conflicted when he discussed trades with others in class or after class.This is when I noticed a change. His class discussions migrated to realism.He talked about basic mindset issues that he was using as he approachedthe day. It was these subtle changes that drew my interest. I was not in aposition to try to reorient him since he was working for a company thatdemanded strict adherence to guidelines.
At one point, he decided that his traditional brokerage firm wasn’tappropriate for day trading. He switched to a direct-access brokerage,placing some of his trading funds with an outfit that I was using at the timeto test out its reliability and usefulness.
DISCOVERING THE SATISFACTION OF TEACHING
It was at this point in his trading that our personal discussion began toexpand. At first, he asked me about the functionality of the software andits features. After he became a bit more familiar with the software, hemoved his attention to the execution functionality. I was a recognizedexpert in the field of order routing. He knew this and came to me for someadvice on one function or another, such as routing rules like the ISLD
CHAPTER 5 The Trader’s Circle 57

crossing/locking quotes problem that seems to plague many traders andthe SOES 5-minute rule. There were a ton of them, and our conversationwas mainly about getting him up to speed on them. Furthermore, the func-tions were always changing. And because the service leader wasn’t daytrading, he didn’t keep up with the changing execution environmentenough to help. Therefore, almost by default, I was the logical choice forhelp on execution technique.
Our brief discussions here and there did not lead anywhere for awhile because superficial exchanges were not enough to get a dialoguegoing. Most of his questions about functionality required a minimalresponse, and he did not yet want information about my specific tradingstyle. Then, as fate would have it, he was about to hit a major blowup, asmost traders do, that would push him in the direction in which he neededto go. He was playing his usual top/bottom, false momentum strategy,and, this time, it almost killed him.
He had bought a stock, one of the major players, and saw it move inhis general direction for a bit off the low of what he considered to be asupport area. At this point, he began to see the profit dwindle and eventu-ally turn it into a small loss. Then the stock got away from him, the mar-ket began to tank, and he was looking at a margin call. This error didn’thave so much to do with his trading methodology as it did with his trad-ing mindset. However, if his stock was experiencing a true momentum,instead of going long off that low, then the base made near that low, whenfailed, would have given him a beautiful short setup that could have led toa profit. So his general approach to the market, being against trends, in hisown words to me later, caused this snafu.
However, it was this snafu that led to a much better dialoguebetween us. His problem, at this point, was how to regain his confidence,not his money. This is where we really began to make the connectionbetween his appetite for knowledge and my desire to offer all that I hadlearned from my own experiences.
He knew that he had to look for alternative strategies in order toavoid going through the same problem that he had just faced. At thispoint, he asked me how I kept my risk minimal and my consistency highenough to enable me to make a living doing what I was doing. This wasduring a period in which I was averaging 12–25 trades a day, with nolosing weeks or months. My desire to explain was equal to his desire tolearn.
We began to talk about trading with the trend, about effective rout-ing avenues, and eventually about more interesting issues such as trading
58 PART ONE A Trader’s Journey

intuition. I could see that his interest in the “voodoo” of the market piquedhis ambition to learn more. As I mentioned before, I suggested that heread a couple of books such as Reminiscences of a Stock Operator byLefèvre and The Intuitive Trader by Koppel. He read them and couldn’tbelieve how they brought him to the world of reality. This was the timewhen we started discussing my method of tape reading. It didn’t take himlong to see that my approach was connected to market reality, and itallowed him to break the barrier he had encountered in his trading. Hestudied my method with real enthusiasm, and his hard work broughtresults quickly. His personal trading improved greatly in just a fewmonths. He felt much more confident now. He was able to read the real-ity now.
REVELING IN THE TRIUMPH OF ANOTHER TRADER
One of my proudest moments came in May 2000. The market was reelingfrom the March 2000 highs and was taking a huge hit. I awoke to find ane-mail from my friend. He started by expressing his appreciation for thetime I spent with him. And he told me that his progression was due inlarge part to our numerous conversations. He told me that he and his wifehad discussed all the people that had helped him throughout his life.During their conversation, he noted to his wife that he felt he owed mesomething for my time and my guidance.
He had put a check in the mail to me for 10 percent of his tradingprofits from the month of April as a sign of his appreciation. Mind you,this was a month that had wiped many out. Yet, because of the time wespent online, he had experienced one of his best months ever.
In the beginning of my friend’s striving trader stage, Jesse Liver-more, in a way, became his mentor through Reminiscences of a StockOperator, pretty much as Livermore was for me earlier. Livermore’sideas, his understanding, didn’t really teach a system. Rather, it taughtreality and how to think like a real trader. This was Livermore’s effort toremove all he thought he knew that came from ego, false perceptions,and the like. My friend began to read a lot about trading. He was in con-stant talks with those he trusted and was trading with everything he couldgather. He took in all the information he could from those who werewilling to give it to him. It’s because of this aggressiveness that he pro-gressed through this striving trader stage very quickly. My friend didn’trealize just how quickly until I showed him these stages. There are peoplewho have minds you can unlock and inspire. My friend was one of those
CHAPTER 5 The Trader’s Circle 59

people. You could see his enjoyment in his progression, and I’m sure hecould see the same in me as I watched him grow.
REDISCOVERING THE CIRCLE
Let’s review the stages in the circle. New and developing traders find iteasy to trade with no effort, with random wins and losses. Striving tradersread all they can, ask all they can, develop all they can with their system,and so on. They spend a lot of time on developing the winning and cor-rect trading attitude. I’m not talking about work as in endless research ofstock charts and trading journals, spending an inordinate amount of timeon trade reviews, tracking, and so forth.
I’m talking about seeing reality and becoming a realistic trader. I’mtalking about working on getting rid of ego, emotion, and thoughts basedon illusion or an incorrect understanding of tape-reading principles. Allthe research you do by reading books, reviewing charts, and so on needsto be taken to deeper levels within you, thereby enabling you to under-stand why the market works the way it does. Self-control has to be learnedfor profit and for loss.
There is an amazing amount of progress needed in this stage, and it’sup to the traders as to how fast they get through it. As we move throughthe stages of the newer trader to the reality trader, we can see why thethird stage is really the hardest, because it takes the most effort.
As noted earlier, newer traders trade without much effort, buy andsell with basically no fear. Reality traders also trade without much effort,buy and sell with basically no fear. But the difference is that reality tradersunderstand that trading is more than just “buy and sell.” They under-stand that there are principles of tape reading that are complementary totechnical analysis and fundamental analysis, how these principles leadus to the footprints of the minority, and how they show us the crowdpsychology of the majority. They understand how to trade unemotion-ally, to trade what they see, not what they think. They understand thateveryone has a different perception of the market and that it’s this differ-ence, when there is a shift in the aggregate of supply and demand, that dic-tates stock movement. They understand why the demands of tradingrequire a greater understanding of our mental capacity. They understandthat the market works randomly, that the best setup can fail, and that theworst can produce profit. They understand that a system is based on prob-abilities, which in turn inherits losses—nothing is right 100 percent of thetime.
60 PART ONE A Trader’s Journey

Reality traders understand that risk evaluations and money manage-ment enable them to trade the next trade. When their probability systemproduces a loss, they keep the loss small. They know not to average down,not to justify a loss, not to chase the market, not to. . . Basically, theyunderstand what not to do, and they don’t do it. Let me use once again anart analogy. There is a well-known saying by a famous sculptor thatexplains how he created his masterpieces. He said that he was just cuttingoff all that wasn’t needed and that what remained was the beautiful sculp-ture. In exactly the same way, traders get rid of everything that gets in theway, of everything that is not needed in terms of their system. Whatremains is a state-of-the-art trading system, and each successful tradebecomes a masterpiece.
On a deeper level, a reality trader knows his rules, and he knowswhen to break his rules. He knows that he doesn’t answer to anyone. Hedoesn’t have to prove anything to anyone. Trading is his. Trading is hispassion, his life, and his reason for getting up in the morning. The bellrings for him. The market exists to provide him with funds to feed hisfamily, go to soccer games, play golf, take trips, and provide freedom. Hetrades against the best traders in the world and beats them. No one can rat-tle his cage, and no one can tell him about his business. He does every-thing he does, in trading and in life, based on the situations before him.And no one can knock him off his pedestal. He is the king of his own cas-tle, and it’s a castle built on reality. This is the environment in which Iexist.
One more thing about the trading circle. This circle should never beclosed. There is a point in many traders’ development when we feel wehave it all figured out and that we can close the circle. If we do this, thenwe are right back at the new trader stage. This often leads to drawdownperiods as our ego becomes more pronounced and our reality becomesdistorted again. We begin to integrate thought processes with the newtrader, and this leads to a string of losses or “dumb trades.” This happensto me every so often as I am trading. For example, during a range market,I was trying to trade trend setups. It cost me thousands of dollars. I wasfighting reality in this case and allowing something within me to want atrend rather than to play the range. This is proof that mechanical tradingisn’t the key. You have to be able to clearly identify what kind of day youare in, and you can do so only with clear mental strength based on truemarket reality.
The longer we trade, the more will happen to us. If we ever close thecircle, we go right back to ego, misperceptions, and mistakes that new
CHAPTER 5 The Trader’s Circle 61

traders make. It is impossible to close this circle. For if we close it, ego,emotion, and trading what we think happens again.
The market is our teacher. It teaches us new lessons each day. Itteaches me that I don’t have things all figured out. It teaches me that Ineed to stay a reality trader if I’m to make it, to keep my account in asteady uptrend. It teaches me that I am an eternal student and that, if I everclose the circle, I can expect the market to separate me from my moneyfaster than I can say “sucker.”
62 PART ONE A Trader’s Journey

C H A P T E R 6
A Trader’s Edge
I’m often asked about my risk tolerance. This became especially impor-tant during the bear market of 2000–2002. It’s not an accident that trad-ing has a fairly low rate of success, and market conditions often don’t helpat all. The ability to adjust to new markets is the strength in any trader. Inthe bear market that began in 2000, it became necessary to find a way tosurvive in this profession.
First, traders have to form realistic expectations about their gains.The problem is that trading offers unlimited opportunities. And when youlook at market movements after the fact, it seems easy to make anyamount of money. When newcomers expect to make a couple of thousanddollars a day, they take enormous risks in order to achieve that goal.
Established traders know that their primary purpose is to preservetheir trading capital. In order to do so, they have to limit risk. However,limiting risk also limits profit potential. One day I was watching a fewilliquid issues with a few of my friends. What I mean by illiquid is thatthere really aren’t many participants in this stock. There were about fourmarket makers, and a couple of ECNs (Electronic CommunicationsNetworks) would show up from time to time. The spread was wide, andthe depth of the stock was very thin. One of these issues caught my atten-tion because it moved from just under $11 to over $15 in a matter of min-utes. It was Qiao Xing Universal Telephone (Nasdaq: XING) (see Figure6.1). I watched this stock and its behavior and knew it wasn’t to betouched by professionals because of slippage concerns. If I was wrongwith my entry, risk was way outside of my parameters at the time.
One really anxious trader who can never stay on the sidelines asked mewhy I wasn’t trading it. He was long 2000 shares and was happy to see that
63
Copyright © 2004 by GST Captial Group, LLC. Click here for terms of use.

the stock had climbed from his entry at near $12 to just over $14. He said tome, “Why didn’t you take position on it? You were in front of the computerthe entire day. You could see it.” While he was saying this to me, the stockwent from $14 back down to just under $11 again. But he refused to sell it.He ended up taking a considerable loss for the size of his portfolio. He madetwo mistakes. The first was not seeing the risk of this stock. The second wasnot taking the profit on such an extremely risky stock while he had it.
All stocks move. But you don’t have to trade them all, especiallyones that trade in dollars a minute. It is hard to imagine anything morerisky than this monster with a huge spread and almost no volume. Ofcourse there was opportunity to profit, but this is what amateurs go after.As a trader, I know to manage my risk first, and there was no way to do iton that stock at that time.
PROS ASSESS RISK; AMATEURS ASSESS POTENTIAL
For professionals, risk evaluation always comes first. If you are uncom-fortable with the risk on any particular stock or trade, just stay away from
64 PART ONE A Trader’s Journey
F I G U R E 6 . 1
Example of short-term volatility. (Used with permission of CBS MarketWatch.)

it. The skill of staying away is one of the most important one could learn.Unfortunately, for many traders, this never sunk in. The market might notpresent any opportunities on a particular day. In such a situation, any tradewould be an attempt to squeeze blood from a stone. Furthermore, if themarket presents movements that are not readable by the system we use,any trade would be just gambling.
The market might present readable opportunities without favorablereward/risk ratios, and any trade would be too great a risk from the per-spective of risk management. In all cases such as these, the trader has tostay away. An urge to trade just for trading’s sake can lead to big lossesin the worst case or to slow bleeding with many stops in the best case.During 1998–2002 we went through all the markets one can imagine. Arunning market with incredibly strong uptrends, crashes, dull phases, slowsliding, and so on. And I went through each one unscathed, while manyof my colleagues were forced to stop trading altogether.
The first market stage (a huge run-up) brought many people into themarket who thought it was easy. Their goal was to buy anything in sightand hold for double, triple, or even more profits. I don’t envy those whostarted their learning at that time. It was easy to believe that buying andholding are really all there is to it. Those were the salad days, to be sure,but not for everyone. I saw plenty of people trying to short the market allthe way up. One self-proclaimed great trader who admitted to not tradingany longer, kept calling the QQQ short, losing hundreds of points for thetraders who followed him. We only heard of him calling a great marketbottom. This is a sucker’s game. This is plenty of evidence that followingsomeone blindly will not make you a great trader.
Traders were losing on the long side as well, because no stock goesin just one direction. Upward movement was interrupted by pullbacks.When traders tried to hold through those pullbacks, they sometimes gotburned badly. It happened in situations when volatility was too big forthem to handle and the risk taken was too big. This leads us to the nextimportant concept that needs to be understood for market survival.
YOU DON’T HAVE TO BE IN THE MIDDLE OF EVERY BATTLE
It’s not necessary for traders to trade everything. In fact, stocks that grabthe most attention are often the most dangerous. I remember in 2000 whenJDS Uniphase got dumped badly. It was the most dangerous stock in themarket that day, and many people lost big by trying to go with the hotaction. The same happened with Emulex in 2001 when a false pressrelease sent it down 60–80 points. Many feel that they have to take part
CHAPTER 6 A Trader’s Edge 65

in the action that the entire market is focused on. They go home, talk tofriends, and are asked, “Hey, there were such huge swings on ABCDtoday! Did you take advantage of them?” Answering “no” would makeone feel like a coward. But remember, as a trader, I don’t have to proveanything to anyone.
Many people who look at the action after they get home from workask, “OK, we can’t get access to a computer. But you can. You see it allhappening. How come you don’t play?” Do not be tempted to look likepart of some elite class of traders. The hottest market action is where thebiggest risk is. Don’t trade for action; trade for profit. But keep in mindthat profit always goes with the possibility of loss. Evaluate the loss youmight take if things turn nasty and decide whether you can afford the riskand whether you want this risk and/or reward.
Traders spend much more time in the ambush than they do in thebattle. They limit their risk by limiting their market exposure. The biggestproblem for traders is risking being thrown out of the game. I know atrader who lost his entire trading capital on a single trade. Whatever wedo and however strongly we feel about a trade, we must never risk ourentire capital on one trade. This doesn’t mean that we should ignore anyopportunity in which the risk is too big, even if the reward/risk ratio isgreat. We do have the ability to decrease the risk by decreasing our sharesize.
Imagine a stock with a great upside of $20. We see that it moves insuch a way that if our entry is wrong, it would cost a $2 stop. Many can-not afford a loss of $2000. However, the 10/1 ratio is really tempting. Wecan still go for it if we take shares that put us in a position of affordablerisk. By decreasing our share size, we limit our profit potential. That’s theprice of risk control. Limiting risk and capital preservation go first. I neverfeel that I have to trade. I don’t feel bad if the market action happens with-out me, and I don’t go for profits if the risk is greater than I can afford. Bylearning this kind of restraint, we preserve our capital.
During the late 1990s, it was astonishing to see how many tradersmistakenly thought they were experts in the medical field, in reading geo-logical mining maps, or in some other profession that requires more studythan a simple company 10-Q quarterly report. Speculators are not aboutdetermining the future value of a company’s net worth. They are detachedobservers of the psychology of the market. Too often we see opinionsbased on the illusions of people who pretend to be something they are not.As I mentioned before, early stage speculators are born of the need forsome certainty. They want reliable patterns, proven and provided on abasis from which they can trade. Eventually they realize that simply fol-
66 PART ONE A Trader’s Journey

lowing systems and patterns does not provide the desired results. Sadly,more often than not, this leads to frustration rather than to a continuedquest for reality.
THE DICHOTOMY OF THE GUILTY
The belief that people fear what they are guilty of holds true for the mar-ket. An early speculator most likely is not a great trader and so believesthat no one is. This early stage is part of the learning process.Furthermore, these early speculators form opinions about subjects they donot understand. Their opinions may certainly sound reasonable, but thereality is that they may well be off base. For example, I have no idea aboutphysics, but I’m sure I could write a paper on gravity just from simpleobservation. I might even get a B grade on the paper, but would you trustme with the design of a plane?
Forming opinions is the greatest threat to early speculators. The mar-ket has curtains. Unless we pull back that curtain, we will never see thereality. For example, let’s assume a trader is screaming about a company’snew product. This is not happening because he is excited that the productwill be great for humanity. He is excited because he wants to attract inter-est so that he can sell his shares at a better price. The trader wants to leadme down the path of excitement so that I would buy into the stock for hisbenefit, not mine.
Taking this in the broader sense, the market wants to show me onething and hammer me with the opposite. The early speculators fall prey tothese instances. They are not properly trading a system because they haveno sense of reality and no sense of how their own personality traits areaffecting their trading. Their trading is akin to gambling. Henry Emery, alate-nineteenth-century American economist, suggested that, in gambling,one must win and one must lose. In speculation however, this is not so. Agambler creates risks in the marketplace with wrong assumptions and byfollowing opinions. A speculator assumes risks and responds accordingly.Unless they progress from the early stage of accepting ideas at face value,early speculators will cease to exist.
Bernard Baruch, a noted economic adviser to American presidentsfor more than 40 years, said about speculation, “It is a dangerously addic-tive habit which involves an appeal for fortune, and is often accompaniedby delusional behavior, and is dependent for success on the control ofemotions.”
As early speculators begin to pull back the curtains of obviousnessand take a deeper look at the market, they begin to see the world of market
CHAPTER 6 A Trader’s Edge 67

psychology. They realize that traders are not experts in every field, and,even if they were, it has no bearing on the stock price. They realize that astock moves when supply outstrips demand and vice versa. Therefore,they read the psychology behind the move and not necessarily the reasonfor the move. To these people, the stock market is no longer a carnival offools, with playful intentions and obvious deceptions. At least they are nolonger a part of this crowd even if it still does exist.
They understand that what were once thought of as simple manip-ulations and cons are in fact just normal parts of the game. Experiencedtraders do their job, while the early speculators fall for traps. Whatmany fail to realize is that what seems really obvious usually is a trap.If you see a road with no obstacles, it most likely doesn’t lead to any-where. It works for reading stock movement. It works for many of thegeneral principles that market moves are based on. There are manycommon phrases on Wall Street, and all the pundits have heard them.But there are different views on things that seem to be absolutelynonarguable. It’s often the case that one’s edge is found exactly in theniches where few go. Let’s go over some of those common phrases andsee how true they are.
“Do Not Overtrade”
A trading leader tried to argue with me about my many trades per day,maintaining that I was doing something wrong. He argued that we onlyhave to find that one great trade per day to make us profitable. I must haveleft my crystal ball back in Russia, because I can’t seem to distinguishhow, in a market that is based on probabilities, one will always knowwhich trade will be the best one every time.
Many people say that we should pick the best of the best trades andnot jump on every one of them, trying to go for as few trades as you canthat suggest the highest potential. This is not true for all traders or for allstyles. I practice my system, which puts a high probability on my side,and I would be better off trading as much as I can. A trader should enterany opportunity that his or her system has generated. After all, that’sexactly what casinos do. They do as many “trades” as possible becausethe probabilities are in their favor and the more bets that are made, thehigher their profit. This leads us to conclude that the principle “do notovertrade” is style-dependent. If your approach is trading a low percent-age of winners, small losses, and big runs, then, yes, don’t overtrade. Itwill lower your overall profits.
But if your style is trading a high percentage of winners, relatively
68 PART ONE A Trader’s Journey

small profits, and even tighter stops (as is the case with scalping), then itsounds strange to not overtrade. Overtrading will work in your favor.Instead of assigning the right number of trades per day, I would ratherdefine what overtrading really is. To me, overtrading is taking the tradesthat don’t match your setups. If you get three setups a day, then the fourthtrade is overtrading. If you get 30 valid setups a day, then 30 trades do notconstitute overtrading.
“Do Not Trade Illiquid Stocks”
I mentioned earlier my decision to stay away from Qiao Xing UniversalTelephone because of its lack of liquidity. This doesn’t mean that allilliquid issues should not be traded. I have seen many great traderstrade stocks with low liquidity. It’s their edge. They have to know howthose stocks move—the “jumpiness” of those issues they use to theiradvantage. One reason for this phenomenon is that on stocks with hugeliquidity and a wide following, too many conflicting interests interact,which often makes the stocks hard to read. For instance, when I watchmonsters that are traded by everyone, like Microsoft, Intel, and so on,I know that they almost never go straight up or down. They’re alwaysstruggling.
In addition, trading houses know very well that there are plenty oftraders who try to squeeze the juice out of these stocks, and they have thebest of their best traders assigned to these monsters. I see plenty of onlinetraders and institutional traders with their cloudy intentions in thesestocks. You have the best traders in the world trying to fool everyone,including their neighbors (by neighbors, I mean the Goldman Sachstrader wants his or her intentions to be hidden from the Merrill Lynchtrader). I rarely want to be in the middle of such a battle. Meanwhile, onstocks with lower liquidity where there are fewer players and fewer con-tradicting interests, I may find a much higher level of readability. Itdoesn’t mean of course that the stock with 10,000 shares in volume issafe to trade. There should be a balance in everything. But it shows how“obvious” things become less obvious when we think to look below thesurface.
“Buy Low, Sell High”
The next so-called road to success is “buy low, sell high.” This idea aloneis probably responsible for more trading failures than any other. It is adangerous idea because the trend is extremely important in trading. If you
CHAPTER 6 A Trader’s Edge 69

know the trend, you are trading safely and with a high probability of suc-cess. If you buy low, you are not trading with the trend. In fact, if you tryto pick the bottom on a falling stock, you are going against the trend. Itdoesn’t mean you have to avoid buying low completely. But at the veryleast you have to know what you’re doing and understand that until thetrend has reversed, you are on dangerous ground buying the bottoms. I amsure you have seen plenty of cases in which traders have been hurt badlyby attempting to pick the bottom (known as “catching a falling knife”).There are other ways to play that enable you to follow the trend. Forexample, “buy high, sell higher” and “sell low, buy back lower” is a stylethat matches trading to the trend. An uptrend is a series of higher highsand higher lows. As long as the trend is intact, you are safe buying everyhigh, and you will be wrong only once at the very top. Even when you buythe pullback bottom on an uptrending stock, it’s not really buying thelow—it’s just a particular detail of your timing, your microstrategy ofentry.
“You Can’t Go Broke Taking Profits”
The next adage I want to discuss, and negate, is, “You can’t go broke tak-ing profits.” We’ve heard it a zillion times. Well, it’s wrong! Of courseyou can go broke if you take losses that are bigger than profits. There isno trading without losses. They are a natural part of trading. If you allowyour losses to be bigger than your profits, you certainly can go broke tak-ing your profits. Considering that this adage is usually used to justify“selling too soon,” I do consider it to be wrong.
“A Loss Is Not a Loss Until You Sell”
“A loss is not a loss until you sell.” This saying is very dangerous. Iftraders keep their losing trades, they lose more than just money on oneparticular trade. They lose focus and the ability to pick other trades. Insuch situations, traders are nervous and often angry. The losing tradesucks all the energy out of them. Not all gaps are filled (one more wrongassumption). Any particular trade is not guaranteed to be the one that willcome back sooner or later. For instance, my three hardest losses (I mean,really hard) would have taken me out of the game if I had held them. Iowned ESOL at $15 and sold it around $5. Try to find it on a Nasdaq maptoday. I owned TTG at $20 and sold at $12. Where is TTG today? It wentbankrupt. I was short KTEL at $22 and covered at around $29. It went to
70 PART ONE A Trader’s Journey

$80. So much for the theory that one should hold a losing trade until thegap is filled.
“Short Sales Take Stocks Lower”
One more idea that can be heard frequently among traders is that shortingmakes stocks go down; it’s shorters that kill our excellent picks. This isnot true. If a stock is really strong and has more demand than it has sup-ply, it will overcome the selling pressure, and shorts will only add fuel tothe run-up as traders try to cover. If a stock is not strong enough and shortsare right, traders will provide support for the stock on the way down whilethey buy to cover in order to realize their profits. In my strong opinion,shorting is an absolutely necessary part of the game because it providesliquidity, somewhat limits volatility, and provides a cushion as stocksreverse.
“Selling Attracts Buying, Buying Attracts Selling”
The last saying I want to discuss, and probably the toughest to negate, isthat selling attracts buyers by creating “value” and that buying attractssellers by creating the incentive to take profits. It seems so obvious thatit has always bothered me, even in the early stages of my trading whenI didn’t really have arguments against it. Let’s think of it this way. If“selling attracts buying, buying attracts selling” were the case, would wesee anything but the same trading range on all stocks? A stock dropsfrom $20 to $15, and happy buyers nail it. It goes back to $20, and sellershit it. We see every day that stocks continue to go up or drop, makingnew lows. In other words, it’s just one particular case of a more generallaw. There are several cases, and those are: (1) Buying attracts morebuyers, (2) selling attracts more sellers (or, if you wish, scares more trad-ers into selling), and (3) the case we started with.
The first two are called the trend. If the third case were the only one,we would never see any trends. The third case calls the range, and it worksonly for stocks that trade in a range. The problem is that failing to realizethis leads to all those disasters in which traders try to short every top or buyevery bottom. I can tell you that during the huge market run-up in the fallof 1999, there were plenty of killed traders who could not believe that themarket still had the courage to go up. They were shorting and shorting.Some got burned holding their shorts, and some were covering and short-ing again, mistakenly thinking that it was a normal trading process.
CHAPTER 6 A Trader’s Edge 71

Traders try every next top to short or every next bottom to buy. Indoing so, they try to identify the point of a trend reversal. There is onlyone of these reversal points. By doing this, traders try to find that onereversal point that is going against the prevailing trend. It just doesn’tmake sense. It’s quite clear when you think of it in these terms. You arebetter off going with the trend at each interim point. You find yourselfwrong once at the reversal point, and then you can reverse the direction ofyour trades to be in accordance with the new trend.
FINDING THE ELUSIVE EDGE
As you can see, many things that seem to be obvious in reality aren’t. Allthis leads to the topic of edge. When you read trading forums and messageboards, you will see questions like, “What is your edge? How can I getit?” Do these questions make sense? Yes and no. Yes, traders need anedge in order to be successful. And, no, you cannot ask someone, “Whatis your edge? Tell me, and I will use it.” You can’t simply get someoneelse’s edge.
By observing traders in action, you can see a group of traders thatapparently has an edge, whatever it is. They are confident in their actionalthough they don’t necessarily sound confident in their comments. Theyare consistent, they are in a good mood most of the time, and they don’tget frustrated or overexcited. Their plays are easy to distinguish; theyhave a very distinctive style. The trades they make are apparently “their”plays. They often have their own spin on traditional setups. You can seeother traders asking them what they do and how do they do it. They oftenshare their “secrets” with no hesitation. Yet, rarely can someone do thesame thing. It may be easy to understand what they do, but it is not thateasy to do it. How did they get where they are? And why is it so individ-ual that their style is so difficult to copy?
That’s exactly their edge. Their is the operative word here. There isno edge that could be found, shared, and used by others. Edge is yoursonly.
For a long time I viewed the market as a big jigsaw puzzle. I was fig-uring out this piece and that piece, putting them together one at a time.Things would look clear for a short while, and then I would realize thatthere were more pieces that I didn’t even suspect existed. So, I would tryto find them and fit them into the puzzle. At the same time, however frus-trating and never-ending this process seemed, one other thing was hap-pening: I was not only adding new pieces, but I was also getting rid ofpieces that did not fit, that were not mine. They weren’t necessarily
72 PART ONE A Trader’s Journey

wrong, but I wasn’t comfortable with them. Step by step, only things thatwere “mine” remained in my arsenal. When I looked at a certain stock, atits chart or Level 2, I could tell whether it was “mine” or not. My playsbecame distinguishable. Traders I communicated with began markingsome plays as “my style.” That was a sign that my edge was emerging. Iwas comfortable with those plays, I had a feel for them, and I could tellwhat the signs were of them working or failing.
Did I try to find out what other traders’ edges were? Sure I did, asany trader would. Did someone else’s edge work for me? Never. Did othertraders try to copy my edge? Sure. My results were posted, and traderscould see my calls in real time so they tried to do what I did. Did it workfor them? No, it did not work for those who tried to buy when I bought.But, yes, it did work for those who tried to learn and apply the principlesI was following.
But it worked only for those who found their own spin to myedge! See the point? It’s not necessarily about right or wrong. It’s aboutwhat you and only you can read. It’s about what you and only you can geta feel for.
Look at setups on any system. They might be clear enough and easyto understand, but can you apply them with no differentiations and expectconsistent profits? No, you cannot.
By observing traders in action, you can see that each plays the samesetup differently. Some use setups directly, some skip the trigger itself andwait for a setback, and some don’t even look for setups that work and pre-fer hunting for those that fail in order to fade them. The same happenswith exits. Some traders scalp and keep their sure easy money, while oth-ers scale out, letting profits run.
Which way is better? Yours! The way you feel best with, most com-fortable with. So how do you find what is yours? There is one and onlyone way to find your edge: experience.
Trade after trade, day after day, you must apply tight risk control inorder to survive while you are learning; and you must still be around whenthings start clicking. Accept the fact that consistency will come only afteryou find your edge. You may read many books, take courses, and partic-ipate in discussions. The purpose of all this is to find the edge that’s yours.
How do you recognize it? Don’t worry. You won’t miss it. You willget this amazing, absolutely wonderful feeling of control, of knowingwhat you are doing, of feeling that there is a segment of the market actionwhere you are on top. Your edge may be something not many othertraders do, like trading at lunchtime or trading thin, illiquid stocks or trad-ing right at the open or . . . Or you may have a different angle from what
CHAPTER 6 A Trader’s Edge 73
many others do, like fading a breakout that everyone else buys. When youfind your edge, the rest of the market ceases to exist. You ignore every-thing that is not your edge. You wait for your play to come around. Whensomeone asks you, “What? You haven’t played QCOM today? It wentfrom $400 to $600.” You just shrug and respond, “Really? Never evenlooked.” That’s because you found your edge, and QCOM doesn’t fit.
Do all traders see the same thing when looking at the same setup,such as, “Cup and handle ABCD, trigger $20.50, stop $20.25”? No. Oneof them may see, “Buy ABCD when $20.50 is getting hit.” Another onemay see, “Wait for ABCD to clear $20.50 and go up, pull back, and thenbuy it if it holds new support at $20.50.” Yet another may see, “If ABCDclears $20.50, no play for me. But if it loses $20.25 first, I’ll short it.” Doyou see the resemblance to the art analogy and Zeldovich quote we dis-cussed in Chapter 5? This is how your personality, your vision, shapesthings for you, and this is where your edge emerges. In Chapter 12 wedemonstrate how traders can play the same setup in many different waysdepending on their edge.
Trade and observe. Listen to yourself and wait until things becomeclear, easy, and yours.
74 PART ONE A Trader’s Journey

C H A P T E R 7
A Trader’s Intuition
The Real Art of Trading
Throughout this book I discuss how my trading mindset graduallyformed. I talk about the tricks I invented and successfully applied. All thisled me to a new state of mind. It is the highest possible level a trader canreach—intuitive trading. There are many discussions among traders aboutintuition. Some deny its existence, and some swear by it. I was luckyenough to experience this amazing state of mind and profit from it.
In my opinion, most of the disagreement surrounding intuition’s rolein trading arises from misunderstanding. Many think of intuition as ofsome kind of sudden revelation about the future. They expect intuition tobe some kind of tip-giver. This isn’t true. Newer traders don’t get trueintuitive impulses. For them, it’s going to be hope or wishful thinking thatthey will mistakenly take for intuition.
WHAT IS INTUITION?
As we gain experience, we reach some critical mass that results in auto-matic reactions. This is similar to the way we learn to drive; at first it takesconscious thought. The more we drive and the more road situations weface, the less we think and the more we respond. At some point we findourselves driving from one place to another without noticing intersectionsor other cars. Does this mean that we didn’t see them? Of course not. Wecertainly did. But we didn’t have to think about them. Unless weencounter an extreme situation, we are able to drive on autopilot. Ourbrain establishes a series of links between the situations we face and ourresponses.
75
Copyright © 2004 by GST Captial Group, LLC. Click here for terms of use.

Similarly, a master of martial arts responds to an opponent’s actionwithout thinking. To an observer, it might seem like an experiencedfighter knows in advance each move the opponent will make before he orshe makes it. Such automatic and correct responses are possible throughhighly developed intuition, which comes with a great deal of experience.
In exactly the same way, the more we trade, the more we establishcertain links in our brain. Certain situations start looking familiar enoughfor us to respond to them without thinking. The number of familiar situa-tions grows. The fewer the number of situations that look totally new andunfamiliar to us, the more confident we feel. The market ceases to be agreat mystery. It becomes a set of situations—most of them familiar—and we know how to respond to them. Some situations are not recogniz-able, so we don’t trade; we observe and learn.
As you can see, on the surface intuitive impulses work like driv-ing—getting there without knowing consciously how you got there. Yougo from A to E without taking notice that you went through B, C, and D.But B, C, and D are still there, and the process of going through them isstill there. It’s just that this process ceases to be conscious. Thanks to yourexperience, you know how to get to E once you recognize A. In Chapter4 we say that, in learning to trade, you have to go through many situationsand experiences yourself . This is the process that establishes those linksin our brain, collecting the “bank of familiar situations.”
BE CAREFUL OF INTUITIVE TRAPS
Is it possible to develop trading intuition? It is, and there are excellentbooks on the subject that helped me greatly. But there are also traps on thepath to intuitive trading. For example, you cannot push too hard; you can-not try to make the intuitive impulse come to you. As soon as you attemptto do that, you won’t be able to tell a true intuitive impulse from wishfulthinking. The intuitive impulse comes to you as a reward for having thecorrect state of mind—clear, nonopinionated, open, calm, relaxed, andfocused. This is that unclouded state of mind that comes with great confi-dence and a lot of experience that enables us to hear the subtle voice ofintuition. When it comes, you just act, without second-guessing or hesita-tion. It feels as though your finger pushes the button by itself, and youobserve what’s happening. There appears to be a direct link between youreyes and fingers, with no brain interruption.
In Chapter 6 we discuss having an edge and that in order to obtainone, we have to trade for a long period of time and go through differentmarket situations, sorting them out from the point of view of what we feel
76 PART ONE A Trader’s Journey

comfortable with. While traders develop their edge, something else isgoing on. By establishing the correct state of mind, intuitive tradingbecomes accessible. Eventually traders come to the point where bothprocesses merge, and this point constitutes a new level of their tradingcareer—a level where traders make consistent profits without feelingstressed. Trading becomes effortless, easy, fun. Everything becomes clearand simple. The way to this simplicity takes you through many complica-tions, but when they are behind you, they become nothing more thanthings to laugh about. This stage is any trader’s dream.
A close friend and coworker of mine developed great intuitive visionof price movement. He started his trading journey as a part-time trader.His regular job was as a New York cab driver. His great interest and devo-tion to the markets kept him near the screen during market hours everyday for years. By reading the news and observing stock reaction, helearned to feel which stock was going to move and which wasn’t.Eventually, he moved from news plays to tape reading. We discussedprice patterns during the day and observed stocks together. Sometimes hewould make a remark about where a particular stock was going, assigningit a price target that seemed to come from nowhere. The percentage ofcases when he was right was amazingly high. He still amazes me with hisintuitive impulses. Sometimes he gives this kind of reading for a stockthat has just been sitting without any movement, then it really explodesa short time later. We named this “the feeling of hidden tension.” To anoutside observer it appears that he just knows in advance what is goingto happen. At the same time, it is very easy for him to admit when heis wrong. This is that great stage when a trader acts effortlessly andnaturally.
TRADING MANTRAS
But wait! Should we assume that, when you get to this stage, trading is nolonger a problem? If only it were that simple.
Shortly after I started trading intuitively, I faced another obstacle,which I learned was not unique to me from numerous discussions withother traders. The problem was that this beautiful state of total claritytended to disappear for a while. It came and went without warning. Somesubtle changes in me were making this clarity go away. I felt that I had nocontrol over this. My understanding of the market processes was stillthere, of course, and I continued to trade within my system parameters.But the disappearance of this inner clarity lowered my percentage of win-ning plays.
CHAPTER 7 A Trader’s Intuition 77

As I continued trading, I managed to make those periods of black-outs shorter and shorter. I accepted that they would happen, without frus-tration or panic. When they occurred, I cut back on my activity and triedto minimize my losses while waiting for my clear state of mind to return.Step by step I developed some new ideas for returning to the correct mind-set more quickly. I wrote several mantras that I would read and repeat, ina sense meditating on the subject. After a while I wrote mantras for spe-cific trading problems. Regular repetition of them helped me reduce thenumber of those undesirable periods and make the ones I did experiencemuch shorter. I regained control over myself once again. The mantrasfollow.
1. General State of Mind
Responsibility for Your Own Trading. No one has control over me. I amcontrolling myself. Any changes in my account are caused by me. I amlooking into my actions to find the reason for any changes that occur. Ihave the power to make positive changes in my account. No one can hurtme, since I am protected by my rules and discipline. The market is not ahostile environment; it’s just a sea of opportunities. I am giving myselfmoney or taking it from myself. I am not hiding in the comfort of blam-ing someone else. I want the result—profit or loss—to come from mychoices.
Opinionless State of Mind. The market has no firm link between reasonand outcome. I don’t have to figure out the future. I don’t need the weightof opinion on my shoulders. I am free to react to what happens by relyingon my reading of stock action. I keep a flexible state of mind. Nothing pre-vents me from changing my tactic if the market doesn’t act as I expect it to.
Confidence. I don’t know what the market will do next. I don’t have toknow. I know how I will react to anything the market does. I am confidentin my ability to react correctly. I have a strategy that works and the disci-pline to carry it out. I am independent-minded. I don’t trade to please oth-ers. I am self-reliant. I question any trade I take, but I don’t question myability to make the right decisions. I trade effortlessly and automatically.I manage risk and assume losses. I trust myself.
Living in Reality. I do not convince myself that I am right. I just watchstock movement and make my conclusions. When market behavior
78 PART ONE A Trader’s Journey
changes, so does my strategy. Market movement is the ultimate truth. I amnot trying to outsmart or outguess it. I live in the here and now. My mindis open to possibilities.
Emotionlessness. I am objective and calm. I am a detached observer. Idon’t get angry about stocks not doing what I expected. I know they dowhat they do and that the market is what it is. I don’t get frustrated withstop losses; they are part of the game. I don’t get overexcited with win-ning trades; they are just one more confirmation of my correct approach.I feel good about my trading and about myself. My performance as atrader doesn’t reflect on my self-worth.
2. Morning Tune-up after a Winning Day
I am relaxed and confident. I have an optimistic, winning attitude fromyesterday. I remember the feeling of doing the right things, and I am goingto repeat those things today. I am focused. I can see everything that hap-pens. I evaluate events quickly and precisely. I see myself in control.
3. Morning Tune-up after a Losing Day
Today is a separate day, which has nothing in common with yesterday.Today’s performance is fresh. It is I who have the power to do the rightthings. The stock market has no power over me. It’s not after me. It hasno memory of yesterday, and neither do I. I remember how I feel when Iwin. I am going to remember this feeling of victory. I can identify andexecute winning trades.
4. Recovery after a Losing Streak or a Heavy Loss
I am starting fresh. I know what to do to win. I am doing the right thingsright now, and not trying to get back my money. I am not takingrevenge—there is no one to fight with. I am taking it slowly until I get agood feeling. I am not complaining about my loss. I paid money for thelesson. Now I am applying my new knowledge to my trading. I am takingonly trades that match my set of rules. There is no memory of moneylost—my trading account is not money. It’s a tool for making money. Iam rebuilding my confidence with many small wins. They let me feel thetaste of winning. I don’t let events control me. I am in control of myself.I am going to remember the feeling of every win.
CHAPTER 7 A Trader’s Intuition 79

5. Stop Loss
Stopping out prevents losses. It’s not losing; it’s preventing a loss. I amnot trying to control the market. I admit to its independence. I am willingto act in tune with it. If I find myself in the wrong place at the wrong time,it’s in my power to get out. I have the responsibility to keep my tradingaccount in good shape, and stop loss is my way to achieve this. There isnothing wrong in being stopped out. A stop does not make me a loser. Itmakes me a winner, serving as the line of defense for my account. This ismy way to control events. This is my salvation. I want to be in control andbe happy. A stop is not a loss. A stop prevents a loss from growing. Themarket is in endless motion. No trade is so significant that it’s worthholding onto if it doesn’t work. The next opportunity comes right away.I switch easily from the trade that doesn’t work to another that will. Ienter any trade accepting in advance that it can stop me out. If the tradedoesn’t work out, it won’t come as a surprise to me. My trading strategyhas the inevitability of losses built into it, but no single loss can get out ofhand.
6. Fear of Trading, Hesitating to Pull the Trigger
Trading is a game of probabilities. I don’t have to be right every time. Ijust have to follow my rules. I know my system works. Every trade iseither a profit or a stop. Any given trade is not of significance. The resultsover a certain time period are what matter. Trading within my provensystem puts the odds on my side. I have to play to allow opportunities tomaterialize. I know I can trade by my rules. All I do is react to signals—a signal to enter and a signal to exit—that are generated by my system.They take me in and out with no hesitation. I can observe the market andemotionally detach from it. Any stock movement is simply numbers thatchange following certain patterns. I know how to read those patterns. Iam totally focused on what the market is telling me. I can hear it andreact to it.
7. Letting Winners Run
I don’t have to be right all the time. I don’t have to take a profit as soonas my position shows one. I have to sell when my system generates a sell-ing signal, not when I have a profit. My goal is to play within a set ofrules, not to make money. Things once set in motion tend to remain inmotion. I want to ride them while they move. I just trail my stop until the
80 PART ONE A Trader’s Journey

stock proves that it has reversed or until a sell signal is generated. My sys-tem is profit-oriented. I am going to let it generate profits.
8. Overtrading
I have only one reason to put on a trade. This reason is a valid setup interms of my system. There are no external influences that can make metrade. Boredom is not a reason to trade. Being down for the day is not areason to trade. The market doesn’t care about my being up or down. Itgenerates profitable opportunities regardless of what I want. I wait for themarket to create a situation I can recognize. I am not eager to find thetrade. I will know when it comes along. I don’t have to be in the marketall the time. I sit and wait for the right opportunity. My money workswhen it’s in a trade that exploits a profitable opportunity. My moneyworks when it’s sitting on the sidelines being ready for the right moment.
You can use these mantras or design your own for your specificproblems. Their repetition really helps instill good habits and tune up yourmindset. In early chapters we discuss a trading journal as a way to pin-point a specific mindset problem. A combination of such diagnoses withmantras creates a powerful way of troubleshooting your trading.
CHAPTER 7 A Trader’s Intuition 81

This page intentionally left blank.

C H A P T E R 8
Rules for and the Mindset of a Mature Trader
The Dos and Don’ts of Trading
There are times when I think I could write a manual on trading that wouldtake just a few paragraphs. In fact, after I went through all the hassles oflearning to arrive at such simplicity, it is difficult to remember anddescribe all the hassles. A very brief explanation wouldn’t be too helpfulto newer traders, since they need to be informed about the process oflearning. I’ve discussed my trading history, my experiences, my tradingeducation, my tricks of the trade, and my horror stories. Now I’d like topull it all together.
Trading should be natural and easy. Don’t force anything, and don’tfight the market or yourself. Perfect trading is like breathing. You inhaleand exhale, enter and exit. Be calm and relaxed. Look for recognizableopportunities. Be focused and alert. Detach yourself from the heat ofaction. Be an observer and wait for opportunities to find you. Don’t tradewhat you can’t read. Don’t think you have to trade everything. There arejust so many opportunities that fit your personality, your ability to read.Take those, and ignore the others. Don’t try to be a universal trader whocan trade any type of market on any given day.
Don’t fight. Trading is not war. The market is not after you. It has noidea you exist. In fact, it has no ideas at all. Stock doesn’t know youbought it. It does its thing—just go along with it. The market is your boss.Obey it and get paid, or rebel and get fired. You don’t fight the ocean; youswim in it. If you find yourself in a current that takes you in an undesir-able direction, you don’t try to change its direction. Look for anothercurrent.
Don’t guess. Don’t personalize the market. Don’t expect the marketto care. It doesn’t care. It’s not hostile. It’s not friendly. It exists. That’s
83
Copyright © 2004 by GST Captial Group, LLC. Click here for terms of use.

it. You are free to engage or not. Trading is ultimate freedom. You are freeto decide when to go in and when to go out. The market is an endless flowof opportunities for profit and loss. It’s for you to choose. The market pre-sents opportunities to you. Be open to perceive them. Be open-minded asthe market talks to you in its language. There is just one language of themarket. It’s the language of price, volume, and pace. Any tool you use toread the market is derivative of that original language. All the junk sur-rounding this direct conversation between you and market, like rumors,tips, analysts’ opinions, other traders’ opinions, can only distract you fromthe reality of price, volume, and pace.
Forget that your money is at stake. Money in a trading account is justa tool for making money. Preserve your tool. You need it in order to makemoney. By taking stops, you preserve your tool from grave damage. Themarket is not certain; it works in probabilities. Hence, stops are unavoid-able. Take them with no hesitation when the market says you are wrong,and your tool will survive to serve you another day. Admit when you arewrong. Now and then, a stock will shake you out and reverse. Don’t let itforce you into ignoring stops. You can always reenter a position, but youcan never get back your loss. Each loss carries a lesson, and it’s up to youto assign the price to that lesson. Do not pay more than you have to. Thinkof your trading as a whole, as a never-ending process. Don’t put too muchsignificance on any one trade; it’s just one of many. Allow yourself tolose, and move on.
Do not take a trade out of revenge or because you need money. Themarket has no memory or knowledge of you. It’s just a giant pool ofactions of other traders. It’s not going to reward you just because you needto be rewarded. You are the one who is in charge. You have the power totake the money out of the market or to lose it to market participants.
When traders engage in market activity, they put their money in abig pot. From the moment they start a trade, this money is faceless andnobody’s. Anyone is free to take it if his or her skill allows. By puttingmoney in the pot, each player assumes the risk of losing it. This risk is bal-anced against the opportunity to take the money from the pot. You assumethis risk; you put your stake on the table, like everyone else. Never feelguilty about taking money from the pot.
Understand that risk is inherent and a natural part of trading. Youaccept the risk when you move from a less volatile commodity (money)to a more volatile one (stocks or whatever market vehicle you choose totrade). You do that because this volatility is what you need in order tomake money. With opportunity comes risk. You can’t get one without theother.
84 PART ONE A Trader’s Journey

Trading can and often should be boring. It’s normal. You are not init for excitement. It’s okay to spend hours sitting in front of your screendoing nothing. This is not a job where you get paid by the hour. You getpaid for doing the right thing. The right thing to do is often to stay awayfrom the action. If you want excitement, look for it somewhere else. Learnto find the joy in self-control. Accept the boredom that is a part of goodtrading.
Never think, “I know what the market is going to do.” You don’t.Nobody does. Think, “I know what I am going to do in any scenario themarket presents.” Determine your action for any possible scenario. This isyour ultimate freedom and protection. The market can do nothing to yououtside of your set of if-then scenarios. In every one of those, “if ” is formarket action and “then” is for your response. You cannot control whatthe market does, but you can control and should adjust your response.
Decide what it is you are going to trade. If it’s a trend, follow itsdirection. If it’s a range, fade it. Buy high and sell higher in an uptrend.Sell low and cover lower in a downtrend. Buy low, sell high in a range. Ifyou play a trend reversal, don’t do it on price alone. You need a more solidreason to buy than, “It’s cheap enough,” and a more solid reason to shortthan, “It’s too expensive.”
Define your signals. A signal generated by your system is the onlyvalid reason you have for making a trade. The rest is emotions. Don’t letemotions dictate your business decisions. When your trading system gen-erates an entry signal, take the trade with no hesitations. When your trad-ing system generates a sell signal, close the trade. If you question yourtrading system, test it on paper. Don’t trade if you’re testing.
Establish your level of aggressiveness. Know your trade-offs. Ahighly aggressive approach maximizes your profit in cases when you areright but reduces the number of cases when you are right. A conservativeapproach allows you to be right more often but diminishes your profitpotential in each case.
Stay flexible. Modify your trading system to correspond to marketchanges. Adjust your level of aggressiveness and the setups you choose tothe kind of market you are dealing with. Constantly check whether whatyou are doing matches market conditions.
Define what a sucker is. Suckers think they are smarter than the mar-ket. Suckers think they can figure it out. Suckers think there are secret sys-tems and indicators. Suckers think they can avoid losses. Suckers don’tapply stops because they know they are going to be right. Write down allthe traits of a sucker and read them often to see if you spot any such traitsin yourself. Don’t be a sucker.
CHAPTER 8 Rules for and the Mindset of a Mature Trader 85

Define how a winning trader thinks. Write down all the traits of agood trader and read it often to see if you are there yet. Use this compar-ison to see where your weaknesses are and what you need to work on. Bebrutally honest with yourself. Everything you don’t tell yourself, you willhear from the market, and it won’t be pleasant talk.
Whatever happens to you in the market, it’s never the market’s fault.It’s not the market maker or specialist’s fault. It’s not the mysteriousmanipulator or evil short seller. It’s always you. You make the decision.You implement it. You engage and disengage. Accept full, undivided,absolute responsibility. Be your own person. Don’t complain and don’texplain. With responsibility comes control. Gain total control of yourself.Trading is the ultimate exercise in self-control. This is a cold and uncom-fortable feeling at first—the feeling of being alone in your castle. The joyof having your edge and being the best at it will come and compensate youfor that discomfort. The feeling of great self-control, of total power overyour own actions, will be a great reward for all your efforts. Be the mas-ter of your universe.
Learn self-irony. Don’t take yourself too seriously. You don’t haveto prove anything to others. Be the first to laugh about your mistakes.Unburden yourself of the pressure of trying to be perfect. Excellent isgood enough.
86 PART ONE A Trader’s Journey

P A R T T W O
Trading System
Copyright © 2004 by GST Captial Group, LLC. Click here for terms of use.

This page intentionally left blank.

C H A P T E R 9
Tape Reading
Revitalization of a Lost Art
Part One of the book describes Vadym’s journey as a trader—fromnewer trader to reality trader. This part of the book describes our tradingsystem. We talk about criteria we use for entries and exits, and about ourmethod of reading price movement. We go over the major principles oftape reading and show how they help to identify the forces behind thescenes. We also show how we build the setups—the logic that lies underthis process. This part will not only help you understand our setups, but itwill also help you build your own. We describe our setups and explainhow they should be played. We go over the concept of stop-loss placementand trailing. In this part, you will see examples and real schematic charts.When there is no symbol of the stock in a chart, it means that the chart isan example, created manually to illustrate the idea in the text.
Finally, we present numerous examples of real trades with detaileddescriptions of trade development. We want this part to be somewhat of a“pulling it all together,” so we describe not only particular trades but alsothe logic, philosophy, and psychology of every move.
ONE SIZE DOESN’T FIT ALL
You need to keep several things in mind. First of all, by no means do weconsider our system to be “the one and only.” There are many of them outthere. Some work today and will frustrate their users tomorrow. Some suityour personality and risk tolerance; some don’t. You already know fromour discussion of the edge that eventually the only system that is going towork for you will be the one you create for yourself, either from scratch
89
Copyright © 2004 by GST Captial Group, LLC. Click here for terms of use.
or by applying your own spin on something that already exists. What wedescribe is ours. We have taught many traders this system. They use oursystem either in its pure form or in their own variations of it. You will seeour system and you will also see how it’s built. As a result, even if yourultimate approach is totally different, you will still be able to use ourmajor ideas. In addition, the principles of tape reading will be helpful foryou no matter what system you use. What we describe is not a system thatworks for a year or two and then fades away. The major principles of thisapproach stem from the things that never change, since human reactionsto market events have not changed in hundreds of years.
Second, what you will see is fairly simple. We are not fans of over-complicated systems that rely on dozens of indicators. When we sayuptrend, we mean a series of higher lows and highs. When we say down-trend, we mean a series of lower lows and highs. You do not necessarilyneed a formal indicator to see whether there is a trend; a simple look at thechart is usually enough. You don’t necessarily need any calculations orindicators to see the strength of a trend; the steeper an angle, the strongerthe trend. A working system isn’t necessarily cumbersome, oversophisti-cated, and incomprehensible for anyone but those with a Ph.D. in math,chemistry, philosophy, and economics. It should be transparent for you, oryou will trade on “black box” tips. At the same time, don’t be fooled bythe system’s simplicity. This is the kind of simplicity you arrive at aftermany complications.
You will also notice that this system is more the reading of certainvisual formations than of certain numbers and their relationships. Weoften hear that a “real” trading system should be quantifiable. This is notnecessarily the case. Attempting to tie your action to quantified indi-cations can easily lead you to a search for the Holy Grail. As we discussin Part One, art is as important an element in trading as is science. Andthere is no place for the word always in trading. Chart readers use visualformations to make their decisions. Everyone knows about flags, pen-nants, and the like; those are visible formations. Similarly, our setups arecreated when a certain formation takes shape on the chart, not when onenumber exceeds another. This can be complemented by some indicators.
Third, this is an intraday trading system. Principles of reading arepretty much the same for any time frame. You need to apply them to theone you trade in. But we are intraday traders, so each of the examples youwill see is happening within a single day. Also keep in mind that it’slargely a trend-following system. It performs well in a trending environ-ment and leads to a diminished percentage of winners and lower returnsin ranging markets. This doesn’t mean that you need a strong trend
90 PART TWO Trading System

throughout the day to use this system. The market often produces severaltrends within 1 day. From the point of view of a trader operating in longertime frames, each trend is just a noise, but an intraday trader switches eas-ily from long plays to shorting or from longer holding times to 20–30 centscalps. Don’t forget also that no system works in every market environ-ment. Narrow ranges and choppy movement are conditions a traderavoids.
Fourth, while tape-reading principles are the same for any market,there are many fine distinctions in each market’s mechanics. Our personalexperience is limited to the Nasdaq, and the fine details concerning timeconsiderations, price ranges, and other pieces of mosaic could and will bedifferent for other markets. You will see references to the NDX as a gen-eral directional indicator, but Nasdaq futures may be used as well. Also,if you trade a stock that moves in conjunction with a particular sector, youcan use this sector index to gauge broad strength. All this does not meanthat this system will not work with different markets. You just need toknow the specifics of your trading vehicle.
Fifth, this is mainly a trend-following system. It’s based on thepremise that the trend continues until it reverses. Until you see clear signsof the reversal, you need to play in the trend direction. There are tworeversal setups that we tend to use as reasons for an exit strategy ratherthan an entry strategy. In these cases, we identify that the trend has alower probability of continuing from these points.
We will mention confidence levels. A confidence level is simply alevel between the current price and the stop price that allows us to gaugewhether the trend of the stock is still intact given our time frame. If thestock breaks this confidence level on any kind of retracement, then wenormally look to exit the trade on the movement in the direction of thedominant trend to get a better exit price than what a stop price would giveus. (See Chapter 11 for details.)
Finally, no matter what system you use, ours or someone else’s oryour own or a combination of these, always remember that no systemworks by itself. It’s you who makes it work. It’s you who follows the rulesor breaks them. It’s you who patiently waits for the valid signal or reactsimpulsively on everything that moves. It’s always the trader!
DISCOVERING WHAT TAPE READING REALLY IS
The principles of tape reading date back nearly 400 years to the beginningof commodity speculation. Whenever there is disagreement on the per-ceived or intrinsic value of a product, there is cause for speculation about
CHAPTER 9 Tape Reading 91

where that price will move. Principles of tape reading take you right to theheart of this speculative arena. They match price movement to crowdbehavior in the form of a rate of volume.
Tape readers see price movement in relation to the rate of volumeand can determine when the footprints of stock action are made. Tapereading allows one to understand the actions of the minority and eventu-ally the majority when it climbs in. These principles are applied to anindividual security’s behavior and to the broader market trend’s behavior.Why a stock is moving is not an issue. The evaluation is concentrated onwhere it is moving and how far it can move in that direction. Trading tipsoften don’t pan out, and news creates countertrends to what is deemedlogical. This is where tape reading saves us from our ego and ourselves.The truth of stock movement lies in the tape, not in our ego.
Over the past years, we have watched thousands of traders bring newmethodology to the marketplace. There is literally a system for everyspeculative tool available. A few of these systems are quite good, and oth-ers are just plain ridiculous. However, with the advent of the great bullmarket of the 1990s and Internet mania, even the mediocre system couldproduce fairly good results assuming it didn’t dictate going short on anynew high. This is where the beginners’ understanding of market reality,which was far from true reality, lead them to great losses. This is whathappened during the bear market of Nasdaq in 2000–2002. What workedeven 1 year ago doesn’t necessarily work today in the majority of thesesystems. However, it is clear that one system has stood the test of time.More interesting, no one had been teaching it.
Tape-reading principles, having been around for 400 years, haveseen every possible market there is, and they continue to produce consis-tent results in bear and bull markets. As you can see, Jesse Livermore’sprinciples and understanding of market behavior need to be taught to thetrading community, but not in a way that we have ever seen before.
With something so universal that has stood the test of time, it’snecessary to revive an in-depth understanding of how tape-reading prin-ciples can take us to the root of price and rate of volume. They show usthe footprints of the minority and how to capitalize on the irrationalityof the crowd when it finally figures out what the minority alreadyknows.
The next section may be somewhat too basic for an advanced reader.However, we would like to take you through the entire logical chain toshow you how tape-reading principles give us the correct approach to themarket.
92 PART TWO Trading System
ARE YOU THE MAJORITY OR THE MINORITY?Tape-reading principles suggest that the majority is usually wrong. Theidea of tape reading is based on the obvious fact that, in the markets, onlya handful of players take the money—from the majority. The market usu-ally moves in a way that hurts as many players as possible. The path ofleast resistance is opposite to what the majority expects. To define thedirection that the crowd does not want or expect means to define the waythe market is going to move. The mechanics of this phenomenon are quiteobvious when you think of this in the following terms.
Imagine a situation in which everyone has bought a certain stock.There are no more buyers. What happens when people decide to liquidatetheir positions? Obviously, they won’t be able to find another buyer untilthey offer the stock at a price that is far lower than the price the last tradeoccurred at. This creates a snowball effect in which players decide tounload their holdings, some because their targets are reached and othersbecause their stops are hit.
The direction changes to the opposite—opposite of what? Not onlythe opposite of the previous trend but also the opposite of what all theplayers that bought the stock expected. They were buying the stockbecause they expected a further advance. In this hypothetical situationwhere everyone has already bought this stock, you will see overwhelm-ingly positive and optimistic opinions about the stock. It’s very importantto understand since this is what makes stocks reverse to the downsidewhen the situation looks the brightest and to the upside when everythinglooks totally dark.
Indeed, this example is extreme. In real life it’s impossible for 100percent of the participants to have bought a certain issue. Still, it illustratesthe idea that at some point the correlation between those who want to takea position and those who have already taken it creates an imbalance tosuch a degree that potential sellers outweigh potential buyers at any givenprice. That’s where expectations of the buyers are no longer valid andtrend reversal occurs.
Add to this the fact that every buyer who has already taken the posi-tion becomes a potential seller. Now the picture becomes crystal clear.The chain of events is simple. There are not many players who have anestablished position at the first stage of the move. Thus, there are notmany potential sellers who are waiting for the price to rise. The path ofleast resistance is up, so the minority starts accumulating shares. Then theprice movement attracts attention and more players get in. The crowd dis-covers the gem, and aggressive buying hits the stock. As the majority hits
CHAPTER 9 Tape Reading 93

the stock, too many players are in and too many potential sellers are lurk-ing. Distribution by the early buyers starts, while the lack of new buyersleaves the stock with no support. Ultimately, late buyers are left holdingthe bag.
MARKET IRONY
What we have just described is a major law of all market-related events.The same mechanics work with setups that become too popular. Theycease to work when they are followed too widely. Any inefficiency orwindow of opportunity created by the market exists until it’s discov-ered by the majority. SOES (Small Order Execution System) banditsused a new direct-access SOES to exploit inefficiencies by market mak-ers that were not used to being this open to added liability due to theirrequirement of having to maintain an orderly two-sided market. TheseSOES bandits enjoyed their window of opportunity until the crowdsdiscovered their strategy. So-called ECN arbitrages were taken out ofthe game even faster. When a CNBC commentator said that it wasprobably time for the masses to learn how to short stocks, the marketstaged a staggering 500-point bounce the very next day, July 24, 2002,after months of steady decline! This example will be a classic for yearsto come.
Let’s get back to price movement. Evidence of accumulation anddistribution in the market at levels where the minority (smart money) isparticipating to a greater degree is often masked to the public until thetime is right. Then positions are unloaded as the majority catches on. Thiscan be seen in numerous examples in any given week or month. The mar-ket is a discounting mechanism by which the majority usually enters andexits at the wrong time. The major idea is that the public is the last to par-ticipate, so when the public comes to buy, there is no one left to buy fromthem. Thus, majority participation creates the final stage of the movement,which is followed by a reversal. The same happens when the majoritysells in aggregate. There is no one left but buyers. Note that when we say“masked,” we don’t mean anything conspiratorial. It’s simply recognitionof the fact that smart money tries to act in a certain way and tries to con-trol the impression its action makes. On the other hand, the public acts inan unorganized way, driven by chaotic emotions.
We see examples of this during times of capitulation, where themajority creates selling pressure that is so strong that it exhausts selling.The majority participates in this aggregate selling phase as a crowd.Meanwhile, the minority (smart money) finds the point where the major-
94 PART TWO Trading System

ity sells. When selling becomes exhausted, the smart money reverses andgoes long. The same thing can be seen on the long side, where the major-ity feels as if it has missed out on a major market or stock move and can’tstand to see it rise more without it. This brings in majority buying andeuphoria, until buying becomes exhausted. The minority then begins todistribute shares to the crowd buyers from positions it has accumulated atlower levels.
The best example of this can be seen in the 1998–2000 move fromNasdaq 1500 to 5100 and then back down to 1600 and back up to 2300.Euphoria took the market to 5100, and capitulatory events, not to thedegree we saw in 1998 but still strong, took the market to 1600. Then, asthe market consolidated during the accumulation phase near 1600 as themajority was still selling, the market began to move upward, discountingthat the worst of the economic and business cycle was over. The minoritythen began to distribute shares as Nasdaq neared the 2200 level, as themajority began to feel as if it was missing out on the resurgence of the bullmove.
THE ACCUMULATION/DISTRIBUTION RELATIONSHIP
This cycle of accumulation and distribution favors the minority who canread the tape of the market and participate at levels that feed off the usualignorance of the majority. It may not be fair, but it’s how the game isplayed. Tape-reading principles allow you to watch how the minority isparticipating and then how to profit from when the majority creates theherd movement, which signals a short-term stop to the current trend.
As we defined the role of the smart money and the public in the pricemovement, we must now learn to distinguish their action. The major dif-ference that allows us to distinguish the action of smart money from thatof the public is the character of price movement and volume changes. Asa rule, smart money action can be seen as a slow, gradual price movementwith steady or slowly increasing volume. The public’s action is charac-terized by hysterical and parabolic price spikes, almost vertical movementwith a sharp volume increase.
Let’s pause here and define the way we progress from this point tobuild a sound trading system. We know how to distinguish the smartmoney action from that of the public, and we want to position ourselveson the smart money’s side. In order to realize this in practical trading, wemust establish principles that allow us to see different combinations of theprice and volume changes and their meaning. The next element we needis timing so as to allow us to find particular entries. This part is solved by
CHAPTER 9 Tape Reading 95

setups that govern our points of entry and the direction we take. Setupsalso provide us with the structure that shows us where the stop should beplaced because this structure will show also the signs of the trade failure.And, finally, after our position is established, we read the tape to find themoment when the movement becomes exhausted, in order to liquidate theposition. We will take you through the system, building in this order.Careful readers will find that, by using this methodology, they will be ableto create their own setups, trading systems, or modifications of an exist-ing system. The value of this skill is hard to overestimate as the marketchanges make us adjust while we are constantly tweaking different ele-ments of our strategy.
There are six principles that will allow you progress in your tape-reading skills. They are discussed in the following pages.
Major Principle
1. Euphoria/Capitulation. An acceleration in the price advance, almostvertical movement accompanied by a volume surge, is usually not sus-tained and indicates the end of this stage of the move (euphoria stage).(See Figure 9.1.) This is a perfect example of how the majority is usuallywrong as it lets greed overtake fear. This is often the last stage of themove, as the majority finally sees what everyone was trying to hide andjumps on the bandwagon. Distribution takes place by smart money. Sinceour understanding of the tape principles dictates that the majority is usu-ally wrong, it is time to unload positions or at the very least, not get caughtup in the buying frenzy that usually signals the top of the move. Ask your-self how many times you bought the top. We prefer not to count them (onboth hands and feet), as we move through our learning phase regardingtrue market reality. This is a feeling of unbearable pain from missing thetrain, from standing on the sidelines while “the entire world is makingmoney” that causes those late entries on a parabolic stage of the move—and those entries are being punished severely.
An acceleration in the price drop, almost vertical movement accom-panied by volume surge, is usually not sustained and indicates the end ofthis stage of the move (capitulation stage). (See Figure 9.2.) Once again,tape-reading principles save us from our ego and misunderstanding ofmarket behavior. The capitulation scenario is the opposite of euphoria.The majority is selling in aggregate during the phase where fear overtakesgreed. In this case it’s still the same unbearable pain; this time it is thepain of holding the plummeting stock that causes this screaming reaction,“Just get me out!” Traders or investors just don’t care anymore. They
96 PART TWO Trading System
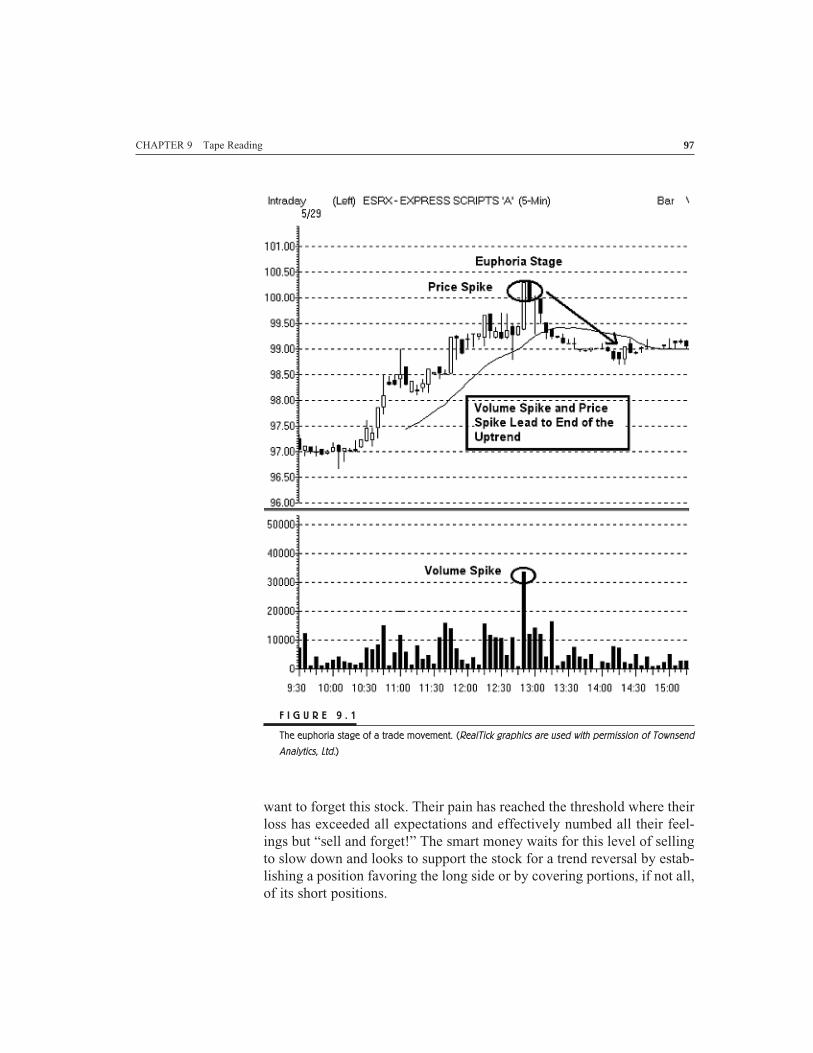
want to forget this stock. Their pain has reached the threshold where theirloss has exceeded all expectations and effectively numbed all their feel-ings but “sell and forget!” The smart money waits for this level of sellingto slow down and looks to support the stock for a trend reversal by estab-lishing a position favoring the long side or by covering portions, if not all,of its short positions.
CHAPTER 9 Tape Reading 97
F I G U R E 9 . 1
The euphoria stage of a trade movement. (RealTick graphics are used with permission of Townsend
Analytics, Ltd.)

In our practical, intraday trading this principle serves two purposes.First, we use vertical spikes with a volume surge to liquidate our posi-tions, selling our shares into a buying frenzy or covering our shorts into asharp sell-off. This effectively puts us on the side of the smart money aswe ride the trend while it’s slow and get out when the crowd comes in.You can see how this corresponds to the ideas we discuss at the beginningof this chapter and how those ideas tie into practical reading of the mar-ket movement. By using this price/volume correlation, you can positionyourself on the right side, trading against the majority instead of being apart of the losing crowd.
Many traders we taught over years have told us that this approach ofliquidating their positions into price/volume spikes entirely changed theway they traded and made their trading orderly and more profitable. Ithelped them cure the problem of selling too soon, since they stopped tak-ing little profits just because they had some measly 10-cent movement intheir favor. This also helped them solve the problem of holding too long,which allowed profits to evaporate. Instead they started selling or par-tialling out into those spikes, which brought nice structure to their trading.
98 PART TWO Trading System
F I G U R E 9 . 2
The capitulation stage of a trade movement. (RealTick graphics are used with permission of
Townsend Analytics, Ltd.)

Second, we start hunting for a trend reversal when we see hystericalmovement. We talk more about this in Chapter 10. For now, let’s say thatthis kind of play is based on the same idea: When the movement becomesparabolic and the volume surges, it is an indication of majority action.Since the crowd is last to act, we can assume that the trend is about toreverse.
Supporting Principles
2. Trend Beginning (Aggressive Accumulation). Slow, steady movementupward with consistent volume indicates so-called good buying andmeans the start of upward momentum. (See Figure 9.3.) Those who areaccumulating need to be very careful in such situations. They are buyingenough shares to support the stock’s direction, but they aren’t buying so
CHAPTER 9 Tape Reading 99
F I G U R E 9 . 3
The beginning of a trend. (RealTick graphics are used with permission of Townsend Analytics, Ltd.)

much that it attracts the majority. This is often a tough game to playbecause any hint that the footprints are being seen by the majority will ini-tiate a price and volume spike, thereby ruining the intention of the smartmoney to establish a position at better prices. This is why we often laughabout upgrades and downgrades or stock picks. If the company reallywanted the best prices, it certainly wouldn’t tell the world to buy it, thusmaking it harder to buy the stock at a low price. This leads us to the con-clusion that the company has already established its position and thenalerts the public to buy it, so it can begin to unload shares. Unethical orunfair doesn’t matter to us as traders. Our job is to understand how theminority works in order to feed off the usual ignorance of the majority.
The movement of stock being quietly accumulated is slow and oftenaccompanied by nasty pullbacks. Those pullbacks are caused by smartmoney desire to keep the upward movement in check. Buyers who try toestablish a large position don’t want the stock to rocket out of sight ontheir own buying. If they need to buy 1 million shares, they most likelyare going to buy 1.5 million and sell 0.5 million, switching from the buyside to the sell side now and then, jockeying around, and keeping the lidon the movement when it becomes too fast. Level 2 players in the recentpast could see this phenomenon when the market maker who sat on thebid, chasing stock up for hours, all of a sudden appeared on the offer withsize, thus causing panic among those who had decided they figured themarket maker out. That is a visual example of masking intentions.Switching the sides, using ECNs (Electronic Communications Networks)to hide the buyers’ identity, showing sizes that are intended to scaretraders into taking certain action rather than getting that size filled, andmany other tricks were and still are being used to mask real intentions.That’s why we are always skeptical of attempts to trade on a pure Level 2reading. Attempts to beat professionals in this game are not likely to beconsistently successful considering the professionals’ experience, bigarsenal of tricks, and access to big money. Instead, traders are better offfocusing on the bigger picture, on reading the movement with methodsthat allow them to separate what is shown to the public from what is reallyhappening behind the scene.
3. Trend Confirmation (Aggressive Accumulation). The trend confirma-tion principle describes a slow price advance with steady increasing vol-ume that indicates continuing upward momentum. (See Figure 9.4.) Thesame can be reversed for the short side. During this stage of the move, theposition may be held as the majority has yet to catch onto the trend. Whenyou see the majority begin to participate, the rate of volume will increase
100 PART TWO Trading System

coupled with a steeper angle of the price movement. This is the point atwhich it is time to observe carefully as price movement can easily accel-erate, switching to the euphoria mode. This stage comes naturally after thetrend beginning and serves as a preliminary phase before euphoria. If wewere to describe the principles in their logical order as subsequent stagesof move development, we would put euphoria after trend confirmation.However, we prefer putting euphoria/capitulation first to emphasize itsimportance as a trend reversal sign. Later we show the logical conse-quence in typical scenarios and practical examples.
4. Shallow Retracement Trend Continuation. This principle entails a rel-atively big volume increase on the price advance with shallow volume onthe pullback, indicating a continuing uptrend. (See Figure 9.5.) Thisshows that there is reasonable support for the stock and no real willing-ness to sell at the current price by either smart money or the majority.There are often one or two identifiable market participants who show solidsupport for the stock as they absorb any meaningful wave of selling. Inthis case, we look for a break of the previous high to provide confirmationthat the trend is still intact.
CHAPTER 9 Tape Reading 101
F I G U R E 9 . 4
The continuation of a trend. (RealTick graphics are used with permission of Townsend Analytics, Ltd.)

This situation can be seen in both the trend beginning and trend con-firmation stages. It is natural pullback caused either by some profit-takingor by desire of those who accumulate the shares to limit the movementuntil the right time. Other factors can be part of the mix as well, such as alow level of confidence during the uncertainty of the first phases of themove or stubborn attempts by the opposite side to resist the move. In anycase, if the pullback is not deep and is accompanied by decreasing vol-ume, it’s usually a sign of trend continuation. Throughout the remainderof the book we provide many setups and examples of how we use volumechanges as indications of what we are going to do.
5. Decreasing Volume Reversal. This is a slowing pace of buying withdecreasing volume which indicates that the top of this stage of movement
102 PART TWO Trading System
F I G U R E 9 . 5
Shallow retracement trend continuation. (RealTick graphics are used with permission of Townsend
Analytics, Ltd.)

is near. (See Figure 9.6.) Most traders refer to this as “Buying is dryingup.” As the price advances to this area, it fails to attract attention and itslowly slides lower off that high.
Here, again, volume indications help us determine our actions. Theidea is simple. As the price rises, buyers do not consider this area attrac-tive; they want to accumulate their shares at lower levels. They evaluatethe upside as minimal from here, or they are not confident that buyingpressure is going to be strong enough to overcome resistance. At the sametime they are not yet motivated enough to start liquidating their positions.This creates a temporary standoff where neither side is aggressive enoughto move the price. The volume decreases significantly, and most often thissituation leads to a price retreat.
6. Passive Accumulation/Distribution. Big buying volume without theprice changing indicates distribution and means there is a resistance level
CHAPTER 9 Tape Reading 103
F I G U R E 9 . 6
Decreasing volume reversal. (RealTick graphics are used with permission of Townsend Analytics, Ltd.)

(passive distribution). (See Figure 9.7.) This is often the case when astock moves into resistance defined by technical indicators such as a chartor moving average resistance. Early buyers distribute shares they accu-mulated at lower levels. They feel that the current level is the easiest levelin which to unload their intended positions. Many often wonder why theydon’t raise their offer and fill the rest at a higher price. The answer is sim-ply that, at higher prices, they will have to compete to sell their shares ifbuying dries up. They basically choose a level that has little competitionso that they can distribute their shares to the buyers; thus they are able tocomplete their intended sales without much effort. This creates a tempo-rary standoff in which both sides are fairly aggressive. Unlike the previ-ous case, volume is big at this level.
This resistance level doesn’t necessarily mean that a short should beentered here. As we will see in the following chapters, this kind of situa-tion often leads to consolidation followed by breakout.
Big selling volume without price changing indicates accumulationand suggests a support level (passive accumulation). (See Figure 9.8.)This is the exact opposite of distribution. Buyers are supporting the stockat levels in which the sellers unload their positions. The buyers’ intention
104 PART TWO Trading System
F I G U R E 9 . 7
Passive distribution. (RealTick graphics are used with permission of Townsend Analytics, Ltd.)

is to give strong support to the stock, which eventually leads to the dryingup of the selling pressure, thus leaving the sellers frustrated as the solidsupport holds and leads to a reversal. Should this support level break, alllong positions should be closed. Again, as with distribution, this supportdoesn’t necessarily mean that the stock is going to reverse. Consolidationnear the low often leads to a breakdown and a further downtrend.
As we can see, this principle describes the situation of a congestionarea where one side is betting on the continuation of the trend while theother side places its hope in reversal.
Distribution and accumulation by themselves do not suggest whataction we should take. They simply mark certain levels that can be usedto form setups. We discuss this in the following chapter as we show howsetups are built and played. Notice also that we call this passive accumu-lation/distribution. It’s important to distinguish these two principles fromaggressive action. Passive accumulation is bidding, buying only fromactive sellers. Often it’s accompanied by a willingness to drop the biddingprice if sellers become too strong. Passive accumulation by itself does notlead to a price advance. Rather, it lays the foundation for a future priceincrease if and when the sellers get exhausted. Aggressive accumulation
CHAPTER 9 Tape Reading 105
F I G U R E 9 . 8
Passive accumulation. (RealTick graphics are used with permission of Townsend Analytics, Ltd.)

is characterized by buying at the offered price, chasing the price, and bid-ding the stock up. Aggressive accumulation does move the price up asdescribed in principles 2 and 3.
The importance of tape reading is its ability to save us from making mar-ket predictions and arbitrary egotistical assumptions about the value of astock. Your opinion about that stock’s price is not important. What isimportant is where the shift of supply and demand for a particular issue inany time frame moves a stock. The principles described above can be usedas a stand-alone system, because they represent what the minority does inorder to feed off the majority’s reactions to what it thinks should happen.Furthermore, tape-reading principles as we’ve revived them can be com-plemented by other studies of trading, including, but not limited to, tech-nical or fundamental analysis.
It’s often asked how tape reading relates to technical analysis. Theyare not mutually exclusive. Tape reading is the root, whereas technicalstudies and indicators are derivatives. They play the role of interpreters.The market talks to us in its original language of price, volume, and pace.You can read this language on your own, or you can use the help of inter-preters to one extent or another. In examples in Part Three we show howwe use some simple technical analysis to support and detail the reading ofthe movement. We don’t like to overcomplicate this process. Manytraders overwhelm themselves with vast numbers of studies that cloudtheir perception. This makes their approach too formal and detached fromthe reality of the market.
With the use of reading the crowd mentality and the footsteps of theminority, we are able to put the probabilities of success on our side. Weare not concerned with creating certainties in the market because the mar-ket is too random to achieve any kind of certainty. We are concerned withputting the probabilities on our side. An understanding of true marketreality increases our chances for success. Remember that there is no HolyGrail of trading. But there is a window of truth into the market, and ourtape-reading principles can allow this window to be wide open for yourdomination of the trading arena.
106 PART TWO Trading System

C H A P T E R 1 0
The Role of Setups
There is a question often asked in many different forums: Does technicalanalysis (TA) work? The answer depends on what you expect TA to dofor you. If you want TA to tell you what the future will bring, then no, itdoes not. If you want TA to help in your trading, then sure, it does.
To us, TA has no predicting value. By this we mean that one oranother setup or pattern does not tell us in advance which way the pricewill go. The value of TA is different. It imposes a structure on what oth-erwise seems like chaos—price movements.
Following is an illustration: Suppose you see a car on the road, andyou try to figure out which way it’s headed. Much like we do when we arelooking at stock action and trying to determine which direction it will gofrom the current price. There is a crossroads ahead. Until the car actuallyreaches it, you don’t know which way it will go. This is just like lookingat a stock chart for the first time. When you see the car’s right-turn signalflashing, you can assume that the car is going to make a right turn. Is itabsolutely certain that it will? No, it isn’t. The stock may head up or down,but is it certain the direction will continue? The driver of the car can havea change of mind, but the probability of the right turn is high enough.When the car makes the right turn, you can assume with even higher con-fidence that it will go to the right. Can it stop and back up? Sure, it can.Just as a stock can go up for only a few ticks and then reverse. But if youbet on the car going right after making the right turn, you have the oddsin your favor. At the same time, you recognize the signals that tell youyour initial assumption is wrong—the car reaches a crossroads, turns rightafter signaling a right turn, but then the car backs up and turns left. Thisis the same as seeing the signals that a stock should go higher, watchingit go higher for a few ticks, and then seeing it reverse and go much lower.
107
Copyright © 2004 by GST Captial Group, LLC. Click here for terms of use.

This is how trading setups work. They give you signals. When youhave signals, you know what to look for to determine which direction hasa higher probability of being taken. For example, a stock is moving in arange between $19.75 and $20. You want to play a break of this range inthe direction of the break, assuming that, if the stock breaks to the upside,it’s a sign of strength, and vice versa for the break to the downside. (SeeFigure 10.1.)
Your setup is for a long side trade on the breakout over $20 withsupport at $19.75. There are two signals. The break of $20 indicatesupward movement, and the break of $19.75 indicates downward move-ment. These signals provide you with your set of if-then scenarios. Youalso have your safety net. If the price moves through $20 and drops to$19.75 and breaks it, oh well, the driver was drunk.
As you can see, Figure 10.1 doesn’t tell you whether or in whichdirection the breakout is going to happen. It gives you an idea of what youshould do if and when it happens. That’s what we mean when we say thatTA doesn’t offer predicting value. TA doesn’t tell you which side is goingto be broken. But it does provide structure and favorable odds. It providesindications of the most probable direction of the trend. This is one moreway in which “Trade what you see, not what you think” works.
Technical analyses work, as long as you read them to your advan-tage and do not expect them to tell you what to do. They are your tools.Tools do not work by themselves. It’s how you master them that deter-mines your success or failure. Traders who expect TA to do their tradingare similar to musicians who expect their pianos to play music.
Let’s build a set of if-then scenarios, from the simplest one to more
108 PART TWO Trading System
F I G U R E 1 0 . 1
Trading the range break.

complicated ones, and adding new factors that will bring us from puretheory to reality. At this point we will discuss only entry and initial stopplacement. Taking profit and stop trailing are discussed next. The exam-ple that follows is devoted to a particular setup, “Break out of the narrowrange.” Later we go over other setups and apply the same methodology ofscenario building.
1. If the stock price breaks over $20, then we buy.
2. If the price drops to $19.75 after our buy, then we get stopped out.
3. If the price breaks below $19.75, then we sell short.
4. If the price hits $20 after our short sell, then we get stopped out.
Now that we have our first signals and our trading idea defined, it’stime for more factors to come into play. The first of them is overall mar-ket condition. This is a breakout setup, but is the market really favorablefor breakouts at this moment? If it is, we can go for a breakout in a broadmarket direction with confidence and act aggressively. A strongly trend-ing market will act like busy traffic that will not allow our car from theexample above to back up and change direction. If we have a narrowranging market with no follow-through on breakouts, we should choose aconservative approach. Let’s analyze what a conservative approach iscompared to an aggressive one.
First realize that there is a trade-off on the price you get, the ease offilling your order on the one side, and confidence in the trade outcome onanother. You can get the best price by buying the bottom of the range, butthere is not the slightest sign of a future breakout. Your confidence is low-est at this point. You can wait for the entire move to be done, and yourconfidence in it will be 100 percent (what could be more certain than theresults of an event that has already happened?). But the price that you getat the top of the move is the worst possible and leaves you no room forprofit. Trading is about finding a balance. It’s the fine line between whereyour confidence is at an acceptable level and where the point of entry isaffordable.
DIFFERENT METHODS OF ENTRY
Let’s look at a case with a long play in a positive market. If you have areally strong trending market moving in the direction of your breakout,you have reason to be aggressive. In this case it would mean entering thestock before the actual breakout. If you see buying pressure building andthe price approaching the breakout limit, you can buy at let’s say $19.90.
CHAPTER 10 The Role of Setups 109

(See Figure 10.2.) It gives you a better price, an easier fill of your order(which might be very hard on an actual breakout, which tends to occurvery quickly), and a tighter stop. However, the trade-off is that thisinspires less confidence in the breakout itself. The market strength favor-ing the direction of your trade is what increases your odds for a success-ful trade and allows you to enter before the actual confirmation of thebreakout. Notice that the more aggressively you intend to act, the lowerthe price of your entry would be. For the purpose of further discussionlet’s call this the aggressive method of entry.
If you are not sure of the follow-through because of the weakertrend, you should wait for the actual breakout to occur, thereby giving yougreater confidence in your trade. Again, the trade-off would be the worseprice and a wider stop because you buy farther from the support level.This kind of entry would be moderately aggressive. (See Figure 10.3.)Let’s call it the regular method of entry.
If there is no trend and your confidence in the breakout trade is low,you should adjust your level of aggressiveness accordingly. Before youtake this trade, you will want to see as much confirmation as possible. Inthis case you apply a conservative approach, which means that you skipthe breakout level itself and wait for the stock to pull back. If it tests new
110 PART TWO Trading System
F I G U R E 1 0 . 2
Method of aggressive entry.

support (the former resistance level) and keeps above it with confidence,then you’ve got your confirmation of the strength and you can buy thestock anticipating further movement. (See Figure 10.4.) The trade-off hereis going to be the risk of missing the trade altogether if the stock runs onyou with no pullback.
Figure 10.4 shows entry just above a new support level. Dependingon how much confirmation you want to see, you can wait for a break overthe new high of $20.25, thus effectively deepening the trade-off of moreconfidence for a worse price.
Notice that the breakdown of different ways to trade the same setupcan be applied to any setup. When we describe setups in the followingchapters and Part Three, we talk mostly about the regular way of enter-ing a trade, which means “Enter at the trigger level.” But this distinctionas to the method of entry is always possible and is left to the trader’sdiscretion.
There are endless variations on the way you can play the setup, andwhat you choose becomes part of your edge. Following are a few moresetups to give you more ideas to choose from.
You can let the trigger go and wait for the stock to bounce back intoyour range. At this point you try to enter as close to the stop level as pos-sible. You will need to find the entry at the moment when the stock stalls
CHAPTER 10 The Role of Setups 111
F I G U R E 1 0 . 3
Method of regular entry.

and is getting ready to reverse. This way, you can make your stop as tightas possible and your profit potential bigger compared to your entry on thetrigger. You also have more confidence as compared to an aggressiveentry since your trigger was hit once, thus shaking the confidence of thosewho believed that the level would hold. Drawbacks are the risk of miss-ing the play altogether if the stock goes in the direction of the setup andnever looks back. This play requires perfect timing.
You can enter half of your position at any of the above-mentionedpoints (at the trigger, near the stop level, before or after the actual trigger)and add another half as the stock hits another indicative point. Forinstance, if you enter the first half near the stop level, you can add the sec-ond half as the stock hits the trigger. Or you can enter the first half at thetrigger level, adding the other half if a bounce takes the stock within therange and the action weakens. There are other variations of adding to yourposition as the stock goes in your favor. Obvious drawbacks are a possi-ble increase in commissions and the possibility of being left with just halfof your planned shares if the stock doesn’t give you an additional oppor-tunity to enter.
As you can see, setups provide you with structure that you canexploit in any way that matches your risk tolerance, your temperament,and your personal objectives.
112 PART TWO Trading System
F I G U R E 1 0 . 4
Method of conservative entry.

There is one more important element to add to your observations:volume. As we know from tape-reading principles, we want volume toincrease when the price moves in the direction of our trade. In this casewe want volume to rise as price rises and dry up as price pulls back.Figures 10.1, 10.2, and 10.3 include volume to show that we need it to beshaped to increase our confidence in our breakout success.
Now our set of scenarios becomes more complicated. It includes notonly the setup structure but also market conditions and our confidence ina successful break. It also includes volume as an element of a generalreading of the movement. At the same time there are no more scenarioswith the short side since we defined that market as favoring long plays.
The new look of it would be:
1. If the market is very strong, then we look to buy at the first sign ofstrength and don’t wait for the actual break.
a. If (1) the stock trades over $19.90 and (2) the volume increases onthe buying, then we enter.
b. If $19.75 is hit, then we get stopped.
2. If the market is trending but not overly strong, then we look to buy theactual breakout.
a. If (1) the stock trades at $20 and (2) the volume increases, then weenter.
b. If the price drops to $19.75, then we get stopped.
3. If the market is uncertain, then we look to buy only after the break anda successful retest of new support.
a. If (1) the stock breaks over $20 and (2) we retest it on pullback, and(3) we see volume increase on upward movement and dry up on pull-back, then we buy it on the first sign of strength over $20.
b. If the stock loses $20, then we get stopped at $19.90.
By building scenarios, you can determine your action for any mar-ket situation. This is the way in which you discipline yourself and protectyourself from the uncertainty of the market. Instead of trying to guesswhat the market is going to do next, you determine what you are going todo in response to any development. This is the biggest role that setupsplay in your trading. They solve the conflict between the necessity of cer-tain action and an uncertain environment.
CHAPTER 10 The Role of Setups 113

This page intentionally left blank.

C H A P T E R 1 1
Stop-Loss Placement and Trailing
We have already discussed the role of stops in trading and the psycho-logical implications of this part of the trader’s job. Now we need to seehow stops should be placed so that they can do what they are supposed todo, which is to prevent losses from growing on one side and protect usfrom being taken out of the trade until it’s proven no longer valid on theother side.
Let’s start with the factors that determine where we put our stop.There are two major factors that influence our decision. The first is mar-ket indications of trade failure. We don’t want to exit the trade on the firsttick that happens not to be in our favor. The market has too much noise,and such an approach would lead to our being shaken out too often. As wediscuss in Chapter 10, there are signals that indicate the rising odds of atrade not working. So our stop should be placed under the level that indi-cates a trade failure if this level is broken. Usually such a level is a levelof support for a long side trade (resistance for a short side). The idea is,that if support is broken, we don’t want to be long. And, if resistance isbroken, we don’t want to be short.
Support is often established by the level that a stock has tested sev-eral times and bounced off of. It also can be a former resistance that hasbroken to the upside. After such a break this level acts as support. (This isa commonplace occurrence, so we will refrain from providing explana-tions of how and why it happens.) Other examples of support are the trendline, the moving average, Fibonacci numbers, and so on. There are differ-ent levels of support within different time frames. When supports fromseveral time frames coincide at the same price level, it makes the supportmore important.
115
Copyright © 2004 by GST Captial Group, LLC. Click here for terms of use.

REVISITING RISK MANAGEMENT
The second factor that determines where we put our stop is our risk toler-ance. Now and then we face situations in which the price differencebetween levels indicating trade trigger and trade failure is bigger thanwhat we are willing to tolerate. Should we move our stop closer to theentry price in such cases? No, because it would increase the odds of ourbeing shaken out. This is a mistake we see many newer traders make. Riskmanagement in this kind of situation should determine position size. If ourrisk is $250 on each given trade, then we go for 1000 shares on the tradewith the difference between the trigger and the stop levels being 25 cents.If this difference is 50 cents, we decrease our share size to 500, keepingwithin our risk parameters and still following market logic.
We need to add two more distinctions here. The first is slippage. Ifthe theoretical price difference between the trigger and the failure level is25 cents, it doesn’t mean that we can get this price automatically in reallife. We have to evaluate the risk of slippage, and our major tool for thisis Level 2, which allows us to judge the depth of the market for each givenstock. As a rule of thumb, signs of a risky stock with the possibility of bigslippage are a wide or often-changing spread, a big gap between price lev-els, small sizes shown by market participants, and few players at eachprice level. It takes little practice to learn to tell a jumpy, dangerous stockfrom one that usually trades in an orderly fashion.
The second distinction to risk management is stop padding. This isa more sophisticated technique that factors in attempts by market partici-pants to move the price to the level where most stops are located. This isknown as “running the stops.” Many traders mistakenly assume that themarket makers can see the stops entered in the system. This is not so, butexperienced players understand how most traders think, and this under-standing allows them to guess where the popular stop levels will be witha high degree of accuracy. Padding means simply moving our stop a littlefarther, to place it a bit aside from the popular levels so that we won’t beeasily shaken out. As you can see, the theoretical 25-cent stop can in real-ity easily turn out to be a 30–35-cent stop. We need to factor this in whenwe consider our share size.
For simplicity’s sake, we discuss long trades. It’s easy to apply thesame principles to short entries.
Initial Stop Placement
To define the level of an initial stop placement, we need to identify thereason for the trade. Then we can determine the sign of trade failure.
116 PART TWO Trading System

1. Breakout Trade. A breakout trade is taken on the assumption that, ifthe stock is trading above a higher limit of the range, then it’s going to gohigher. The stop should be placed below the support level. Support in thiscase is defined as the lower limit of the range the stock moved in beforebreaking out. (See Figure 11.1.)
2. Range Trade. The reason for entry in a range trade is a bounce fromsupport, assuming that a stock remains within the range. If the lower limitof the range is getting broken, the reason is no longer valid because theassumption hasn’t proved correct. The stop should be placed below thelower limit of the range. (See Figure 11.2.)
3. Capitulation Sell-Off. The entry for a capitulation sell-off is taken onthe assumption that panic selling has washed the sellers out and a V-bottom is forming. (See our capitulation setup in Chapter 13.) A V-bottomis a visual representation in which the left side of the V represents sharpselling, the bottom of the V represents the reversal, or pivot, point, and theright side of the V represents sharp buying. The stock is usually trading inuncharted territory for the day, so there are no support levels defined bythis day’s trading. Considering a higher risk for a larger than expectedstop loss due to thin liquidity, this kind of trade’s stop loss should be
CHAPTER 11 Stop Loss Placement and Trailing 117
F I G U R E 1 1 . 1
A breakout trade.

placed just below the low a stock made on the last decline, within our risktolerance. In other words, any new low should be considered trade failure.(See Figure 11.3.)
Stop Trailing
As a stock moves in our favor, we want to protect our profits. Usually wecombine stop trailing with partialling, or scaling, out, which means theselling of portions of our shares. Most often it’s half and half. Sometimes,when the market shows a very strong trend, we can go for half, quarter,and quarter. For example, if we enter with 1000 shares, we can sell 500and 500 or 500, 250, and 250.
There are some comments that need to be made about this method-ology. From the pure statistics point of view, partialling in is a better wayto trade than is partialling out. Do not confuse partialling in with averag-ing down. Averaging down is adding to your losing position, which wedon’t do. Adding to your position as it moves in your favor (so-calledpyramiding) goes along the lines of “letting your profit run.” By par-tialling out, you limit your profit potential. Also keep in mind that yourentry point is usually the point of lowest confidence. As the trade devel-ops, your confidence level rises with new confirmations that your initial
118 PART TWO Trading System
F I G U R E 1 1 . 2
A range trade.

idea is right. It makes perfect sense to enter just part of your position whileyou have no confirmation and add to it as the market tells you that you areright. If the trade doesn’t work, you get stopped with just part of yourposition. In a real day trader’s life, however, other factors come into play.Fast intraday trades do not always allow for multiple entries along withtrend, because trends come and go much more quickly than they do forlonger time-frame players.
Furthermore, from a purely psychological standpoint it’s much eas-ier to keep your position when part of your profit is secured. Of course,psychological comfort is not something that we should let govern ouraction, as we discuss in Part One. Still, most of us have to maintain men-tal balance in order not to get burned out from everyday tension. Partiallingout serves this purpose well. Is some ways partialling out functions likeinsurance. In most cases insurance is a waste of money because nothinghappens. But in those rare cases when something does happen, insurancesaves you from a hard hit. What is it that you insure against when youscale out? It’s a trade turning around halfway and hitting your stop. Byscaling out, you decrease the size of your win and increase the number ofyour winners, while still maintaining part of your position in case a stockcontinues moving in your favor. Insurance also buys you piece of mind,which could be as important as monetary issues. When you trade every
CHAPTER 11 Stop Loss Placement and Trailing 119
F I G U R E 1 1 . 3
A capitulation sell-off.

day, you need to make sure that you don’t get burned out. Again, as withall trading choices it’s a matter of personal preference. If you feel you canplay the market by scaling in, this is a great accomplishment.
There are several methods to help you determine a new stop place-ment. They depend on the type of stock movement.
1. Consequent Range Breaks. Consequent range breaks resemble laddersteps. The stock consolidates under each new resistance level, breaks it,and repeats the cycle. As a resistance level is broken, it becomes a newsupport. This serves us as an idea for a new stop placement. As usual, wedon’t want to stay long in a stock that loses support, so we place the newstop under this level, as shown in Figure 11.4.
2. Trend Movement in the Channel. Trend movement in the channel ispresented by a series of breaks and pullbacks without the consolidationstage. Price movement can be chambered in the channel, which consistsof two trend lines. The price hits the lower envelope of this channel beforebouncing back, and then makes a new high while remaining within thesame channel. As it happens, we trail the stop so that it’s placed rightunder the lower envelope on each pullback. In this case, this lower linepresents the support, and we want to be out if this line is broken. If the
120 PART TWO Trading System
F I G U R E 1 1 . 4
Consequent range breaks.

price breaks the upper envelope and moves vertically up, we face theeuphoria stage of the movement, and the stop should be moved under theupper line. (See Figure 11.5.)
CONFIDENCE LEVELS
The concept of confidence levels helps us resolve a contradiction that weoften have to face. Here is the contradiction: Let’s say that your positionin a stock goes in your favor to a price level that allows you to trail thestop. Then it retraces from there without hitting your stop. If it’s showingstrong signs of reversal, what are you to do? You have your disciplinedemanding that you stick to your plan, while you have a strong feelingthat the plan should be altered. This is the eternal conflict between the sys-tem and discretionary trading. We feel strongly that any system for intra-day trading should allow for a certain amount of discretion. Confidencelevels work, in fact, as an indication that it’s time to alter the plan. Hereis the idea of their placement and use.
Let’s say you bought a stock at $20, partialled out at $20.50, and arenow trying to let the profit run on the second portion. As the stock breaksthe next resistance at $20.75, you trail your stop to $20.45, in accordancewith the principles discussed above. Now, $20.75 is getting taken out onthe upside, and the stock stalls at $20.95, which gives you a strong feel-ing that $21 will not be taken out. You don’t feel that a trailing stop to
CHAPTER 11 Stop Loss Placement and Trailing 121
F I G U R E 1 1 . 5
Trend movement in the channel.

$20.70 is a good idea, because this level doesn’t show good support. Itcannot serve as a reliable indication of weakness if this level is broken.Essentially, it all comes to the dilemma of, “Do I let the stock hit the trail-ing stop and give up a significant portion of the current paper profit? Ordo I take the profit now and kill the chance for a bigger move?”
That’s where we use a confidence level, placing it at $20.75. If thislevel is broken on the downside, we change our original plan. While ourtrailing stop is still in place, our exit strategy is now to sell our shares onthe first worthy bounce. If the confidence level is broken, we don’t expectthe stock to go to new highs anymore, and any bounce between the pricerange $20.90–$21 is to be used to exit our remaining shares.
122 PART TWO Trading System

C H A P T E R 1 2
Trading Setups
In this chapter, we discuss setups that we apply in our everyday trading.They will look familiar to an experienced trader although there is a cer-tain spin on classic setups. For instance, the well-known cup-and-handleformation is tweaked somewhat for intraday trading. Also, such a com-monly known setup as the ascending (descending) triangle has a certaintwist that we describe.
Most of our setups with the exception of capitulation and euphoriaare trend-continuation formations. Capitulation and euphoria are the onlytrend-reversal setups in our arsenal. But, as you know from the previousdiscussion, there are many ways to trade the same setup. If a trade fails asa trend continuation, it could be faded for a trend reversal. This approachis in keeping with what we discuss about the role of setups. Although theydo not predict the direction itself, they show the signs of direction, and ifthe signs tell us that upward movement has failed, then a short could bejustified. Breaking of the stop level indicates failure. Breaking of the stoplevel before the setup is triggered invalidates the setup. This way we candefine a stop level as a level for fading the setup. This is also known astrading of pattern failure and can be one’s trading style.
Also, as you know from early chapters, every setup can be playedwith a different degree of aggressiveness. So, as you see the descriptionof the setup with a recommendation to buy on the breakout (regularentry), you can apply to this all the possibilities we discuss earlier: buy-ing before confirmation or buying after the breakout and test of newsupport.
123
Copyright © 2004 by GST Captial Group, LLC. Click here for terms of use.

JUMP-BASE–EXPLOSION (JBE) SETUP
The jump-base–explosion setup can be described as consolidation nearthe high after initial upward movement. The idea of this setup is that aninitial upward movement (the J phase) shows the direction of major inter-est. Then a stock meets resistance and consolidates under this level (the Bphase). If the stock is strong enough to stay close to the resistance levelwithout sharp retracement, it means that the path of least resistance is stillupward and that the stock is likely to continue in the same direction assoon as it digests the distribution. We prefer the range of the consolida-tion to be narrow, usually not more than 25 cents. The first stage of thesetup (Jump) should be not less than 1.5 times, but preferably 2 times, thesize of the range (Base). With a range of 25 cents we get ideally 50 centsor more of the initial movement.
This setup has several variations. They differ by the formationwithin the consolidation range.
1. Flatline at the High. Entry should be taken as the flatline makes a newhigh. The stop is placed under the nearest support, or, if the initial run-uphas no pullbacks to indicate where support is, the stop is defined by risktolerance. (See Figure 12.1.)
2. Consolidation after a Shallow Pullback. Volume should decrease onthe consolidation phase. The buy signal is a break of the upper limit of therange (U). The stop is placed under the lower limit of the range (L). (SeeFigure 12.2.)
3. Narrow Range Near the High. Volume should dry up on pullbacks andincrease on upward pushes. Buy and stop triggers are similar to setup 2.(See Figure 12.3.)
4. Ascending Triangle. The ascending triangle is similar to setups 2 and 3,with a somewhat stronger indication of successful breakout. This setup is sim-ilar to the classic ascending triangle, with the only distinction being that wewant this formation to occur within the consolidation range. (See Figure 12.4.)
DROP-BASE–IMPLOSION (DBI) SETUP
The drop-base–implosion setup mirrors the JBE on the downside for a short play.Everything that was valid for the JBE setup is valid for the DBI as well. It hasthe same formations and the same rules for entry and stop placement. An ascend-ing triangle is going to reverse to a descending one, of course. (See Figure 12.5.)
124 PART TWO Trading System

125
FIG
UR
E
12
.1
Fla
tlin
e a
t th
e h
igh.

126
FIG
UR
E
12
.2
Conso
lidation a
fter a s
hallo
w p
ullb
ack
.

127
FIG
UR
E
12
.3
Narr
ow
range n
ear th
e h
igh.

128
FIG
UR
E
12
.4
Asc
endin
g triangle
.
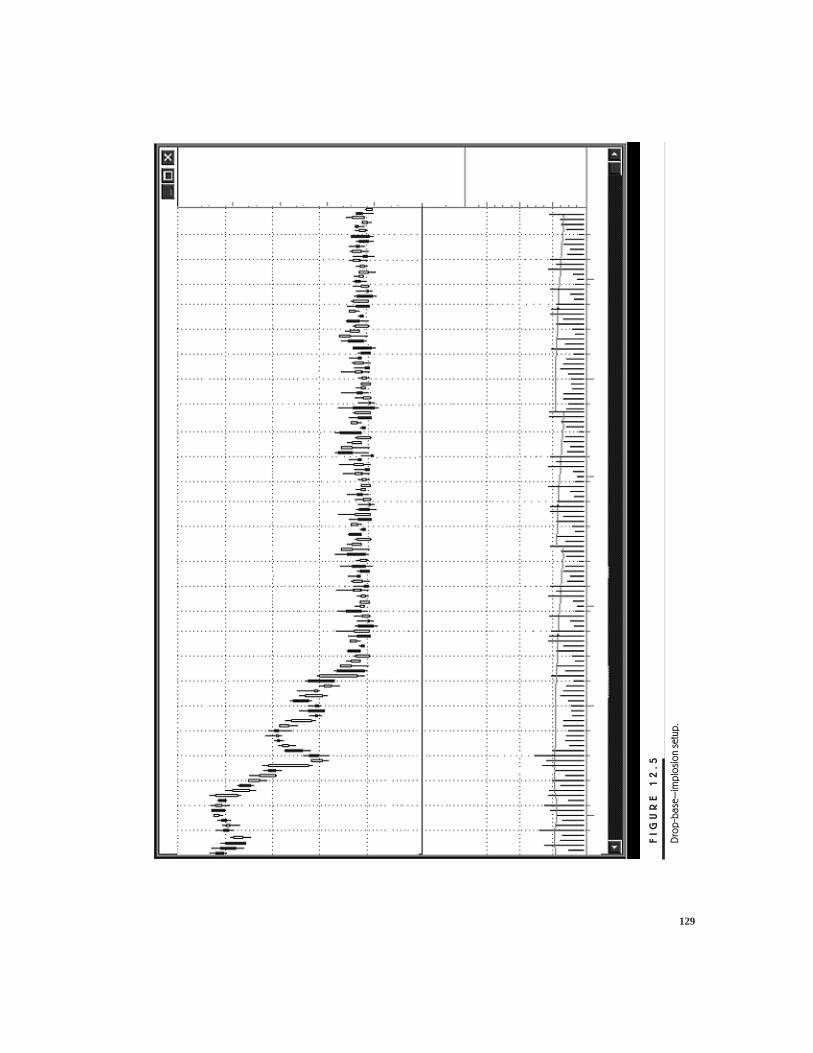
129
FIG
UR
E
12
.5
Dro
p-b
ase
–im
plo
sion s
etu
p.

OPEN-HIGH– AND OPEN-LOW–BREAK SETUPS
Open-high– and open-low–break setups are breaks of the range that areplayed similarly to JBE and DBI setups. The only difference is that theseare setups for the beginning of the trading day, so they usually don’t haveinitial movement. The idea is to define the most likely direction of theprice movement by the direction of the break of the opening range.
For these setups we want the stock to move within the range, notmore than 25 cents. These are setups for the first 15–20 minutes of thetrading day.
If the stock breaks the high of the range, we go long with the stop atthe low of the range. If the stock breaks the low of the range, we go shortwith a stop at the high of the range. Since the opening is often quitevolatile, this setup is frequently used for scalps unless the market shows astrong trend. Scalpers look for a 1:1 or 2:1 ratio of reward to risk. Holdersscale out into a 2:1 reward/risk ratio and look for a trend. (See Figures12.6 and 12.7.)
CUP-AND-HANDLE SETUP
The cup and handle is also a breakout setup and is very common forlonger time frames. It works best on a day’s high, although it can beapplied in the middle of the daily range as well.
In Figure 12.8, points 1 and 3 are the cup edges at the day’s high.Point 2 is the cup bottom. The volume should dry up close to point 2 andpick up close to points 1 and 3. The cup should continue for a minimumof 30 minutes. But more than 30 minutes is desirable. In our experience,the optimal time for a cup forming is 1 hour or more.
Point 4 is the bottom of the handle, and volume should dry up here.The handle should not have retracement deeper than 50 percent of cupdepth. The volume should pick up at point 5. The handle should continueno longer than 30 percent of the time of cup formation, 25 percent is desir-able. The stop is placed below the handle bottom. The entry point can betaken aggressively or conservatively as described earlier.
CAPITULATION
Capitulation is a reversal setup. It’s that fast, sharp decline with verticalmovement and volume-pace pickup that are necessary componentsbecause they suggest panic.
Capitulation is one of the riskiest setups. It requires fast reactionsand well-developed scalping skills because it sometimes provides just a
130 PART TWO Trading System
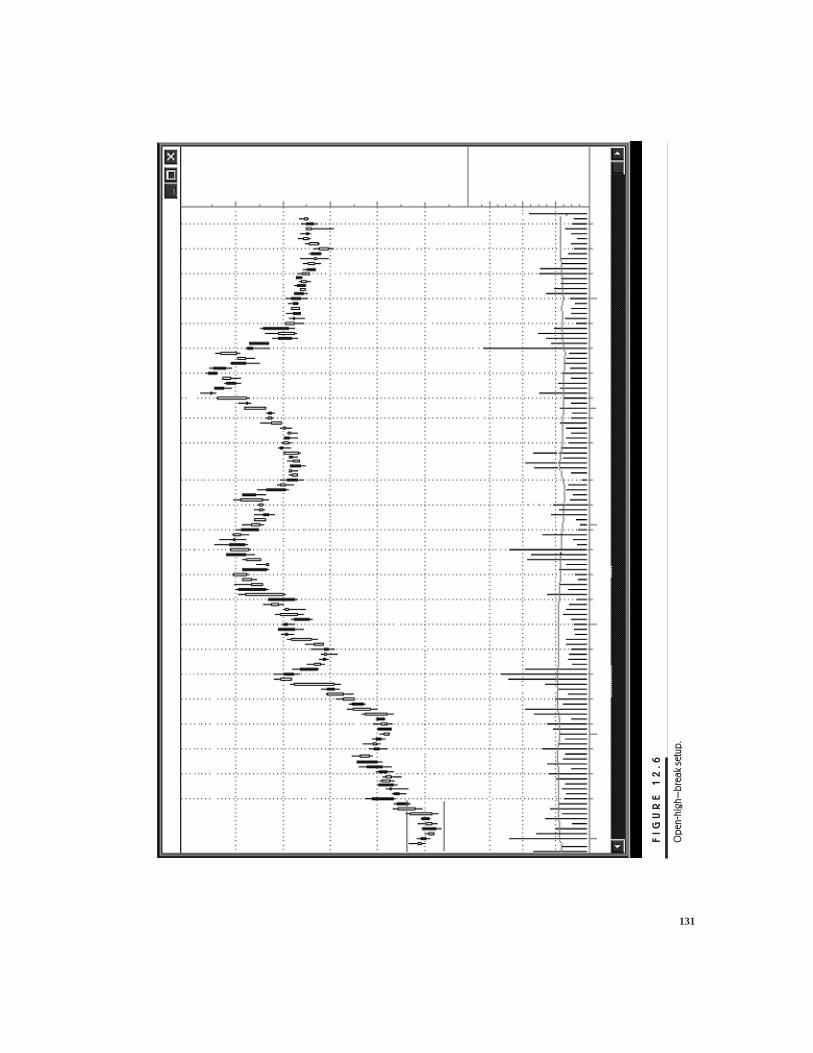
131
FIG
UR
E
12
.6
Open-h
igh–
bre
ak
setu
p.
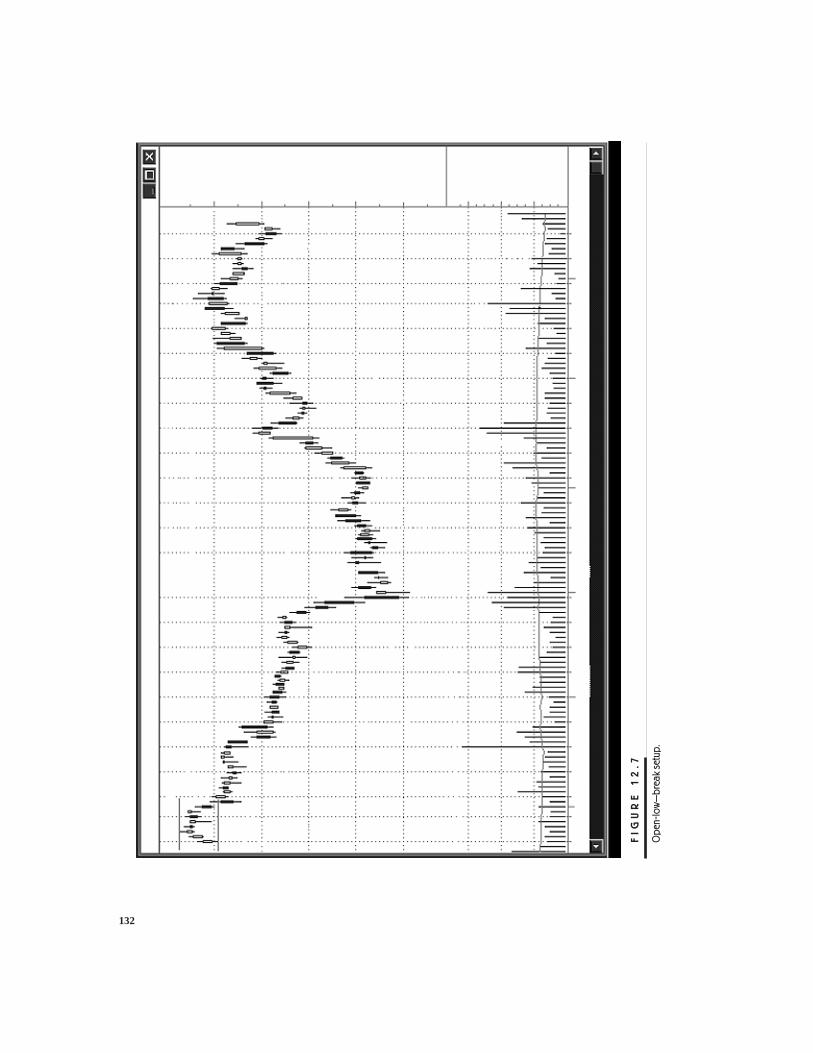
132
FIG
UR
E
12
.7
Open-low
–bre
ak
setu
p.

133
FIG
UR
E
12
.8
Cup-a
nd-h
andle
setu
p.

134
FIG
UR
E
12
.9
Capitula
tion.

small, quick bounce. It could be treated as a scalp or as a hold for therecovery, depending on market conditions. A stop is placed under thelevel that the stock has bounced from as discussed in previous chapters.
Keep in mind that this setup is more conceptual than others. Itdoesn’t have an exact indication of how big the vertical drop should be toprovide the best chances for a profitable entry. In practical examples citedin Part Three, you will see that this setup contains a much bigger “art” ele-ment compared to others. (See Figure 12.9.)
We do not describe euphoria as a separate setup here. It’s an exactmirror of capitulation. The main reason for not including it in our list ofsetups is that we avoid shorting strong stocks altogether until we see clearreversal. Shorting strong stocks can be even more dangerous than buyingcapitulation. In Chapter 13 and in practical examples, we discuss the signsof trend reversal that we use for shorting the upward move exhaustion.
TRADER’S ACTION
Following is an algorithm of the action traders should take when a signalis generated:
1. Define the setup by comparing a stock chart to the charts of setups.
2. Evaluate the risk by volume and the look of Level 2. If you see low vol-ume, a big spread, thin levels, small sizes shown by market participants,and/or a wide gap between levels, you know this is a high-risk stock.Skip the trade altogether or lower your share size. Be prepared to limityour expectations to scalp.
3. Define the trigger point and stop level as the setup suggests.
4. Evaluate the stop from the perspective of your risk tolerance. If the stopexceeds the size of the loss dictated by your risk management, loweryour share size or skip the trade altogether.
5. Define the conditions that work in favor of the setup and the conditionsthat invalidate it.
� If the stock breaks the stop level before triggering, then the setupis invalidated.
� If the stock moves in sync with the Nasdaq-100 (NDX), you needthe NDX directional support for the setup to achieve a higherprobability of working.
� If the stock moves with no relation to the NDX, you need the NDXto be in favor or neutral to the direction of the setup. Do not takethe trade if the NDX moves sharply against your setup direction.
CHAPTER 12 Trading Setups 135

6. Define the conditions of fading the setup. If the stock breaks the stop level before triggering and you get the NDX working against the setup, then fading is a reasonable trade.
7. Define your approach to the trade in terms of aggressiveness depend-ing on market mood. Be aggressive in a trending market and conser-vative in a choppy market. Pick your method of entry as the setups suggest.
8. As your entry is triggered, initiate the trade without hesitation.
9. Monitor your trade as it develops. Don’t let the movements within therange confuse or rattle you. Your trade is stopped out only when the stop is hit. The stop was placed there for a reason. Don’t change your mind in the middle of action—most likely it’s your emotions talking.
10. As the stock moves in your favor, wait for a clear exit signal to closethe trade in full, or partial it out. According to tape-reading principles, slow movement with steady volume indicates a stage where you con-tinue to hold your position. Vertical spikes with sharp volumeincreases indicate an area and time interval to exit, either fully or par-tially. Be willing to exit in full in a choppy market by taking the scalp. Ride your position in a trending market, protecting the profit by par-tialling out and trailing the stop.
136 PART TWO Trading System

C H A P T E R 1 3
Trading Market Ranges and Miscellaneous Points
In this chapter we review some points and cases that “surround” our trad-ing system, so to speak. By this we refer to situations that are not centralto our system but that occur too often to be ignored. Also, we discussthose situations that present a particular danger.
As you have seen from the previous discussion, our trading systemis trend-oriented. However, the market is not always trending. Despite thefact that trends are relatively easy to find in the small time frames in whichwe trade, now and then we run into a ranging market. You need recipesfor this market condition.
TRADING RANGES
There are three types of ranges we would like to discuss. Those are regu-lar, narrow, and expanding. Each requires a different approach and pre-sents a different challenge. We have to add that as for trend traders, aranging market is very tough for us, and we tend to decrease our tradingactivity when we run into range days.
Regular Range
A regular range is wide enough to allow traders to profit from the movementwithin the range. Unlike a trending environment, this range requires thattraders buy low and sell high. The major challenge is to tell the range fromthe trend early enough. If traders fail to identify the ranging market, they aredestined to lose on false breakout attempts. Usually, if we see the markettest the low and high twice and hold, we go into range-trading mode.
137
Copyright © 2004 by GST Captial Group, LLC. Click here for terms of use.

When you are trading the range, you need to buy at the first sign ofstrength as the market bounces from the low, or short at the first sign ofweakness as the high is holding. Stop placement is self-explanatory, justoutside of range bounds (see Figure 13.1). The exit point in this case isjust below the upper limit of the range.
If you see the volume rising on upward movement and decreasing inthe downward stage, you might want to try to let your profits run. In orderto give your profits room if the market breaks the range, you can scale outof your position by selling half your shares at this point. A trailing stopfor another half should be placed just below midrange. In Figure 13.2, astop would be placed at $19.40–$19.45.
The idea behind this is based on the assumption that if a stock isgoing to break out of the range, it should bounce off $19.50 in most cases.If it’s going under the midrange, then most likely the stock will remainrange-bound. If a stock is breaking out of the range, then your new stoplevel should be $19.80–$19.90, just under new support, which forms at$20—former resistance, as discussed in Chapter 12. In this scenario a newset of rules comes into play. Now it would be a trend trade, and the exitshould be made as discussed in Chapter 12.
138 PART TWO Trading System
F I G U R E 1 3 . 1
Regular range.

CHAPTER 13 Trading Market Ranges and Miscellaneous Points 139
Narrow Range
Trading in a narrow-range market is very difficult. Unless you are justscalping small movements, all you can do is to wait for the breakout of therange. The time in which a market is locked in narrow limits can andshould be used for preparing for the break, which means identifying can-didates you will consider trading when the break finally occurs.
The problem with a narrow range is that you can’t trade within itbecause as soon as the stock (index) bounces from the low, it’s alreadyalmost near the high limit of the range, and you have no room for a prof-itable entry and exit. Attempting to buy at the bottom of the range or shortthe top is too risky since you have no clear indication that range is not get-ting broken, and, even if your entry is correct, the reward is too small anddoesn’t justify the risk.
So, the only thing we are left with is the attempt to play the break outof the range. In order to place odds in our favor, we need to select the stockthat will break with high enough probability, or, at least, one that won’t goall the way back to the opposite end of the range if the break fails.
F I G U R E 1 3 . 2
Trading within the range.

We need to play the stock that is stronger than the broad market fora long trade or weaker than the market for a short trade. The idea of thissearch is quite simple, yet many traders make many losing trades duringnarrow market conditions because they try to bet on a break without prop-erly selecting the candidates.
For a long trade, the stock needs to hang near the high while the mar-ket pulls back to the lower limit of the range. If we get such a stock, thenwe have a very good chance for it to break its upper limit as the marketmerely bounces from its lower limit. This situation is shown in Figure13.3, in which the stock chart is combined with the NDX chart.
As our long candidate breaks the upper limit, we enter it long, mak-ing sure that the market is holding the lower limit of the range and bounc-ing off it. Now, if the market goes to the upper limit of its range, our stockis likely to go with it and often may be even stronger because it’s beingidentified by many traders as a strong one worth trading in an unsure mar-ket. If the bounce fails and the market breaks down, our risk on this stockis minimal, because its relative strength won’t allow it in most cases to godown as fast as the broader market, and our stop will be as usual. If we
140 PART TWO Trading System
F I G U R E 1 3 . 3
Trading a breakout from a narrow range.

were to buy the stock that goes up and down in the range with the market,we would practically bet on market direction. In the first case we use themarket as an indicator. This is a major difference. The first case is gam-bling; the second is going with the odds using the relative strength of aparticular stock as an indication of its being a likely candidate.
Also keep in mind that this approach is useful as a backup plan intrending markets. As the market is going up, you are playing breakoutsand effectively are going with trend. But you need to have a couple of can-didates on the back burner for short play in case the market reverses. In-stead of guessing which strong stocks will reverse with the broader market,you are shorting those that were weak before and didn’t break downbecause of the overall market strength. As soon as the market weakens, thissupport disappears and the breakdown comes. A similar approach can beused for finding candidates for a long play during a downtrending market,where you would buy the breakout on market reversal from the lows.
Expanding Range
The expanding range is the worst market we’ve ever encountered. It isalways costing us stop after stop. This is the market that makes new highs,just above the upper limit of the range, then drops all the way back to thelow, breaks it, and, instead of continuing to the downside, it bounces allthe way back up, repeating the cycle. See Figure 13.4 for an example.
CHAPTER 13 Trading Market Ranges and Miscellaneous Points 141
F I G U R E 1 3 . 4
Expanding range.

A widening range with no continuation on any side makes it veryhard to read the movement. Here is what happens when a trader tries toplay this kind of market. As level A is getting broken, trend traders goshort. Instead of a continuation, the market bounces, stopping them out.At the same time, the breakdown doesn’t allow going long for a rangetrade. As level B is touched, traders don’t go short because of the break-out, but attempting to go long won’t work either. A spike over the break-out level is too small to allow any room for profit, and the market dropsback effectively, stopping the traders out. This vicious cycle repeats atlevels C, E, and D. This kind of action is very hard to recognize in time.In theory, you can reverse your position as the market bounces and breaksyour stop level. In reality, this is much easier said than done. You can’trecognize this kind of action on a first or second failed break, and youdon’t know which of the failures is going to be the last one.
MISCELLANEOUS POINTS
We would now like to go over some miscellaneous points—those fine dis-tinctions that allow us to correct our action, those factors that should betaken into consideration in a particular situation. These points serve as ameans of finessing our system and allow us to adapt. When your systemtells you, “If you see A, then do B,” these fine distinctions tell you,“Unless you see C.” With experience traders can collect plenty of thesepoints that help them hone their systems, and make them more adjustable,more flexible, and more “personal.”
� In setups with consolidation, the time factor is important. Too short aconsolidation usually leads to a fast, short-lived vertical spike whichoften signals reversal. At the same time, too long a consolidation has agreater chance to fail. It’s hard to define the optimal time of consolida-tion, since it is different for active and dull markets. A careful observercan develop an intuitive feeling of “too short” and “too long.”
� When a stock makes several consecutive consolidations and breakouts,each next step of the ladder should be shorter than the previous one.Ideally the length of each next step is between 50 percent and 75 per-cent of the length of the previous step. If this ratio is less than 50 per-cent, the trend is accelerating and is likely to approach its end. If it’sbigger than 75 percent, the breakout is more likely to fail.
� As a rule we consider the second attempt of a break (test of resistanceor support) to be more likely to fail, and the third attempt to be morelikely to succeed.
142 PART TWO Trading System

� In a double-top scenario we look to enter a short position when theprice drops below the bottom located between two tops. The stop isplaced above the top. We do not short the second top itself.
� In a double-bottom scenario we look to enter a long position when theprice rises above the top located between two lows. The stop is placedbelow the low. We do not buy the second bottom itself.
� When a stock goes through consolidation and you intend to play thebreak of the consolidation range, avoid entry of the trigger if a stockspikes sharply right into the trigger level. This scenario tends to pro-duce traps rather than valid breakouts. The ideal case is to go slowlyapproaching the trigger level and orderly break.
� When you select your candidate for a breakout by the narrow-rangemethod discussed earlier in this chapter, make sure it’s not a stock thatby its nature moves in the opposite direction of the market. Sometimescertain sectors act like this; gold stock in the fall of 2002 is an exam-ple. If you fail to take this into consideration, you would most likelybuy for such a stock breakout when the market is bouncing, althoughthis is the time for this stock to retreat.
� When you are looking for an uptrend reversal after a strong move, youwant to see a stock losing the latest support it has formed on its way up.Avoid shorting euphoria itself since it can easily turn out to be a shal-low pullback or new consolidation. Rather you want to see a stockpulling back to the support level, bouncing on the decreasing volumewithout making a new high, retreating back to the support, and break-ing it. This break is a trigger for a short entry.
� A similar approach can be used for the reversal of a downtrend.� When you are trading a stock that follows NDX movements, superim-
pose its chart onto that of the NDX to find out how much in sync theyare. The best trading candidates are those that move with a slight lagbecause this allows using the NDX as the leading indicator.
� The process of finding the leading indicator can consist of two steps,including the sector index. It makes the selection of trading candidatesand timing of entries and exits more fine-tuned, although somewhatmore cumbersome. Some of the most popular are the Semiconductorindex (SOX) and the Biotechnology index (BTK).
CHAPTER 13 Trading Market Ranges and Miscellaneous Points 143

This page intentionally left blank.

P A R T T H R E E
Practical Examples
In Part Three, we provide a number of practical examples, which aretrades taken from the actual experiences of both authors and dissected toillustrate the decision-making process.
In those cases in which the trade was explained to and traded by ourstudents, you will see comments such as “I would” rather than “I did.”
The trades that are presented here were made over a number ofyears, so you will see fractions on some of them and decimals on others.We decided to leave each trade as it was so as not to distort perception.This demonstrates that no matter what changes are being made in tech-nology, the core of the market remains the same, and the principles basedon human reactions remain intact. Different time frames are used in thecharts, from 1 minute and higher, to show that traders within any timeframe can apply the principles.
You will see that many of the trades were based not only on pure tapereading but also in combination with simple technical analysis. We do notintend to go into depth in those studies. There are plenty of great bookswritten on the subject. Rather our task is to show how you can add tapereading to your favorite indicators in order to deepen your understanding.
In the description of the trades, you will see many references to thepsychological issues discussed in Part One. Also, there are some repeti-tions in applying different tape-reading principles. The authors did thisdeliberately because we want this part to be a way of “putting it alltogether” for both the technical and the psychological side of trading. Wewant each trade to be as finished and as self-contained a review as possi-ble, to show the entire process of a trader’s thinking as events develop inreal time. The repetition of major points that shape up each trade isintended to reinforce the correct approach to any trading situation.
145
Copyright © 2004 by GST Captial Group, LLC. Click here for terms of use.

E X A M P L E 1
Accumulation and Distribution
We have already discussed distribution/accumulation principles, whichare important because these two principles are often applied by the smartmoney long before the public catches onto this kind of movement. Forexample, on this day, Portal Software (PRSF) had news concerning a con-tract with AOL. (See Figure EX1.) Forgive me for not rememberingexactly what the news was. I’m a trader, not an investor, so I’m unawareof exactly what it was. The week prior to this day, PRSF was strong—solid uptrends, no really nasty pullbacks, and so forth. These are normallysigns of accumulation from some defined level. Whether this accumula-tion occurs in anticipation of something or whether it derives from insideknowledge or whatever doesn’t really matter. It is how the accumulationbehaves that we traders watch for. Buying is slow, stable, not many sharp
146 PART THREE Practical Examples
F I G U R E E X 1
Accumulation and distribution. (RealTick graphics are used with permission of Townsend Analytics, Ltd.)

PART THREE Practical Examples 147
price increases. Pullbacks are shallow and supported. As far as I remem-ber, PRSF didn’t have any news catalyst from the Friday before, so it wastrading maybe in anticipation of the AOL news that was leaked some-where. Who knows? It could have easily been a major fund or funds want-ing to buy it at current levels. The point is that we had a bit of a run, forwhatever reason, into Monday.
The AOL news brought outside attention to the stock, meaning thosewho weren’t watching it from Friday’s action now had a reason to watchit. The public was alerted. When stocks are being accumulated, for sometype of event, the next phase is distribution. The principle, “The public isalways the last to know” or “Buy the rumor, sell the news” usually leadsto distribution at some higher level on the day any public attention isdrawn to the stock. Therefore, for PRSF on this day, I was looking for agood, defined range and to have a short setup with expectations that thisday would have a reasonable distribution at high levels. There were morn-ing impressions of the stock showing the strong gap up on the AOL news.Note that I didn’t want to short the gap just because it was up too high orshort it. The stock already made its run; it wouldn’t hold. This is usuallyhow an amateur thinks and often gets killed because of it.
I wanted to see a reasonable range defined and to trade from the con-tinuation of either direction, with expectations that I would see the sell-off. By defining the ranges, instead of just gambling on some arbitraryfigure, I can bring structure to the trade and review my entries and exits,using reality, not thoughts of “I thought it would. . . .” So with my initialimpression developed, based on the principles of accumulation/distribu-tion, let’s look at the three areas that were tradable.
The first area was a long entry based on the open-break trade. Hereis the setup. The stock made an open high of $135/8 and made smalldownticks to $135/16 to $133/8 showing. At this level the support was stillstrong, and nearly $131/2 to $135/8 was showing as some reasonable resis-tance in the premarket. Had we tested $135/8 and failed, the short setup weplanned to take was a break of $133/8, with a stop at $135/8. I then lookedfor distribution principles to take my stock lower at the open. It didn’tbreak lower because support was strong, the volume was increasing as weapproached the open high of $135/8, and I felt it was a reasonable andfairly safe entry. In Figure EX1, circle 1 represents the buy area on thechart. Line A is the open high-resistance level showing the confirmationof the open-high break. With the risk moderate and the stock still strong,we now needed to define our exit strategies.
Exit strategies are different for everyone. You can be a scalper, aholder, or a swing type of trader. Define who you are and follow our com-

ments as we discuss each setup or trade. Remember, sometimes who youare differs from day to day because the day is trending or the range isbound or maybe something within you feels great or not so great.
If PRSF was to set up on the long side, it would have to break$135/8 as a confirmation trigger. The stop would be $135/16 support. For areasonable reward/risk ratio, the stock would have to clear $14. Thosewho like to scalp the stock would look for a move into $137/8 to scale out.
Our first exit strategy is for scalpers and those who wish to takequick profits in the early going. Usually, this is where we see areas of vol-ume/price increases with the first resistance for longs/support for shorts.This occurred right under $14. An ISLD offer at $1313/16 to $137/8 wouldhave been for scalpers. Holders continued with the same plan—stop at thelow of the day, $135/16 in this case.
For holders, our plan was now to look for the over $14 area in orderfor our reward/risk ratio to always be at least 1:1. This means that if youhave a 1/4-point stop, you need at least a 1/4-point gain to serve it. As thestock began to climb to $14 and over to nearly $141/8, we saw another vol-ume increase telling us this was where we wanted at least half our sharesto be exited. Remember, volume and/or price spikes are areas wherestocks need to be exited with current positions held. It’s a function of ourtape-reading principles. As we climbed to serve 1:1 reward/risk ratio, wethen began to trail stops on the remaining shares to breakeven levels. Aswe began to show some resistance and volume decrease near the $141/2 to$143/4 level, we wanted to lock in profits on another portion at least(assuming we had enough shares to make it worthwhile). At this point wetrailed our stop again. This is where we begin to use Fibonacci retrace-ment levels to aid us. The lines F1, F2, and F3 in Figure EX1 going acrossthe chart illustrate this. The first being 38 percent; the second, 50 percent;and the last, 62 percent.
In cases such as this, traders have two options. They can trail thestop tighter to the $141/4 area where the first retracement level is or trail itto the last retracement level, which would be $137/8. On the fast-paceincrease from $14 to $133/4, the scenario is set for the scalp reversal play-ers. Just as fast spikes/volume spikes are areas for covering shorts or exit-ing longs, we can also use them as reversal pivots for entry, sometimesjust for scalping. It depends on the trade. In this case, at $133/4, supportwas strong, and $1313/16 was slowly melting. This made for a reasonablescalp entry for traders with the worst-case stop being $135/8, which shouldhave been easy to keep, certainly no worse than $139/16 if we really had toget out. On the move back to $14, scalpers exit, and holders of the stockfrom $135/8 can take profits on the support bounce from $133/4. From this
148 PART THREE Practical Examples

point, we have no more clear setups, so we let the stock decide what itwants to do.
Our morning impressions were to look for distribution, but not togamble on it. The breakout of the open-high and pullback scalp tradeswere valid. Tape-reading principles for entry and exit and chart analysisfor trailing stops defined our exit strategy. Now, we had one more play onit. The bounce from $133/4 went to $141/8 and stalled. I had an inkling thatdistribution was still an impression, so I wanted to look for a short setup.In this case the range was $133/4 to $141/8. The play from point B (onFigure EX1) on the scalp reversal leads us to the range defined.
This is shown by lines R1 and R2. Now traders have two options.They can short the high of the range, or they can wait for confirmation ofthe break of the low and try the short. As we’ve said before, trading theconfirmation is tougher, because the uptick rule doesn’t always allowentry into the short. When I find reasonable chart resistance and the high-range resistance is solid, I have no problem taking a short entry at the highof the minirange. In reviewing the trade, I set the stop a bit wider than ithad to be: $141/2 seemed to be 1/4 point higher than where I would haveliked to have it, but hindsight is 20/20. I used $141/2 mainly because it waswhere the stock began to slow on the tape on the run-up. Fibonacci analy-sis says that $141/4 would be plenty. Either would be fine, depending onwhich you choose to follow.
As we failed to break $141/8 a few times, I began to get an intuitivefeeling that it would drop below the support we’d defined, so we wentwith shorting before the confirmation of the breakdown. This was at$1313/16 to $137/8 depending on where we could get in. I think we saw mostat $1313/16, which was fine. Now that we had entry, we looked for an exitstrategy. Once again, we were using support principles as well as tape-reading principles to define the strategy. The break of the $133/4 supportlevel and then the $135/8 level (as resistance at the open became supporton the pullback) confirmed that our downtrend was intact.
Once we got confirmation, we looked for fast selling/volumespike/price spike to cover at least half the shares. When the stock broke$135/8, selling began to pick up. When it broke $131/2, it became very fastand erratic, offering a great place for scalpers to exit and for holders toexit at least half. I would have liked it to break $133/8 for a move to near$13, but when the volume increase on the tape showed us a signal, wetook it. From this point, we still had our stop at $141/8 on the remainingshares unless we trailed it tighter to breakeven, which was reasonable. Forthose holding, we still had a tight range, one from which we had no ideawhat it would do from that point. With half our shares remaining, as long
PART THREE Practical Examples 149

as the risk stayed low, we had no problem holding with the stop plan setand looking for a possible breakdown.
I often find it interesting how our position can dictate what we wantto see. Don’t let your position dictate what you “want” to see; see what isin front of you. What is in front of us is a stock stuck in a tight range,almost evenly matched. But the short position seems to dictate the short-side bias. In this range, there is nothing more you can determine from thecurrent action other than “it’s stuck.” Let it do what it wants to do fromhere and take a stop or more profit. Or, if boredom outweighs greed, thenyou have the option of exiting with a small loss or gain.
In summary, our initial impressions were based on accumula-tion/distribution principles. Reality allowed us to go long for a nice playand to scalp for little profits. The short setup offered us entry on a rangedefined. In each exit, tape-reading principles were defined, shown, andprofitable.
150 PART THREE Practical Examples
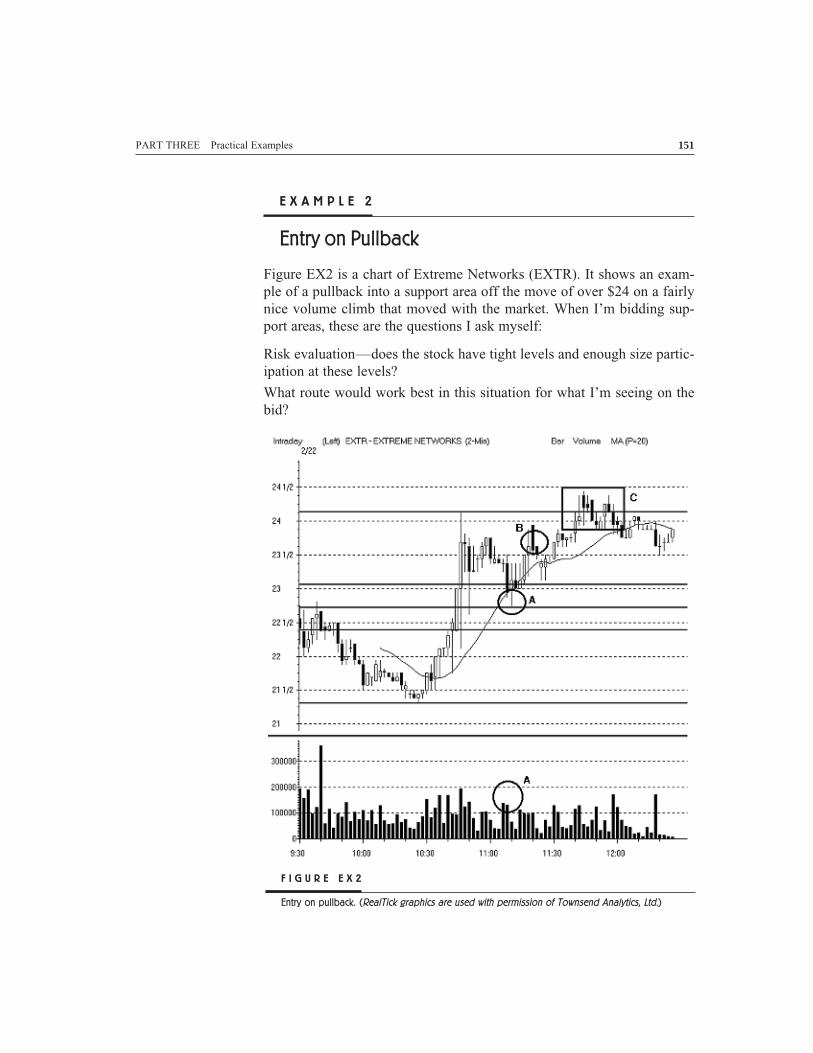
E X A M P L E 2
Entry on Pullback
Figure EX2 is a chart of Extreme Networks (EXTR). It shows an exam-ple of a pullback into a support area off the move of over $24 on a fairlynice volume climb that moved with the market. When I’m bidding sup-port areas, these are the questions I ask myself:
Risk evaluation—does the stock have tight levels and enough size partic-ipation at these levels?
What route would work best in this situation for what I’m seeing on thebid?
PART THREE Practical Examples 151
F I G U R E E X 2
Entry on pullback. (RealTick graphics are used with permission of Townsend Analytics, Ltd.)

What is my stop price?
Where is my first resistance area if this pivot works?
Where is my last resistance area if this pivot works?
What is the share size based on risk evaluation?
EXTR was a stock that could get ugly at times, and fast selling oftendecreased size participation causing at least one-eighth in slippage, if notcloser to one-quarter. Therefore I decided that 500 shares was my risk tol-erance, not a full 1000 lot by any means. I entered a bid at $223/4 with anISLD order, since I didn’t see much ISLD size ahead of me at this level.The reason I chose $223/4 was that the market was making a fairly rea-sonable pullback off its wave of buying and I didn’t feel that firstFibonacci level was the best price on relatively slow selling.
I wanted some faster-paced selling to take me to the 50 percent or 62percent level instead. I used the 50 percent level at $223/4 as the area whereI saw the increase in selling (see circle A on volume chart) which broughtthe stock to $223/4. The bid was thick at $223/4, so I felt safe enough that,if I was wrong, I wouldn’t get hammered on my stop with a 500 order. Iplaced it on ISLD. I was second in line hoping for a panicky seller to hitme. As it turned out, I wasn’t filled and didn’t have time to reverse and hitthe offer when it did hold at $223/4 and bounced. I wasn’t willing to buyhigher than $2213/16 and the best available was $227/8. I got filled with my500 shares, so then it was time to go with a stop-price strategy. I was usingthe last Fibonacci level at $227/16 for this purpose, figuring that if it lostthat price, I would not be confident in the uptrend. So I risked about 3/8 onthe trade.
The first resistance area was $231/4, which, if filled, would havegiven me my 1:1 reward/risk ratio if I had to take it. The last resistancewas just over $231/2, and you can see how $233/4 was showing fairly goodresistance (see circle B on Figure EX2). So my downside risk was $227/16,and my upside target areas were $231/4 to $233/4. Using tape-reading prin-ciples, buy when other traders are scared (fast selling, capitulation) andsell when they are hungry (fast buying, euphoria), offer out into strengthin areas you feel comfortable with, should it provide a profit potential. Thebreak back over $23 to $231/4 ran into resistance but held $23 well enoughthat it had a chance to get closer to the upper target range near $231/2. Forthe scalpers, exiting into strength under $231/4 was fine. Holders werelooking for a move back to upper resistance and a possible breakout.
Holders had two choices. First, they could exit half their shares intofirst or last resistance areas and raise the stop on the remaining shares,looking for a break of the high. Second, they could hold the full lot with
152 PART THREE Practical Examples

a tighter trailing stop and failed break of high, and exit into a trailing stop.If the stock broke to a new high, they could offer out into new highs asthey feel most comfortable, raising a stop along the way. In this case, wehad a break of the first resistance near $231/4, with $23 holding, so weexited half into that buying, bringing the stop to just under $23 on theremaining shares. After it failed to break $233/4, I chose to bring the stopto $231/4 to lock in profits since it wasn’t clear whether a new high wouldbe reached. This was a decision I had to make in the moment, althoughhindsight tells me I should have kept it under $23. This is not important.You trade how you decide, not how you should have decided. For holderswith no trailed stop, the break of the high eventually occurred taking theprice to near $243/8 (area C on Figure EX2) or so before going loweragain. The holders had the option to trail their stop again or exit into thatbreak of the high strength. On a day like this, where the market is desper-ately trying to hold and strength is uncertain at best, I have no problemexiting into an onrush of new buyers. If you like the trade, you can alwaysreenter again into another support area.
To summarize: We found support areas defined by Fibonacci lines,used tape-reading principles of faster selling into a support area to findwhere to bid. If fast selling didn’t occur till the last Fibonacci, fine, bid itthere. If selling never picked up, I was less inclined to play congestionbottoms. Then we exited into strength, scalpers near first resistances,holders, at least half anywhere from first to last resistance, hold theremaining shares with a trailing stop and look for break of high. If wewere so inclined, we could have held the full lot with a trailed stop tighterto lock in profits. Finally, we could have trailed our stop on what wedeemed necessary and what we were willing to risk should the stop get hit.Don’t second-guess yourself. It just erodes your confidence and trust inyourself. When you lose these, you lose an important edge. Once the tradeis complete, review it for a bit, keep it in your notes, and move on to thenext.
PART THREE Practical Examples 153

E X A M P L E 3
Jump-Base–Explosion (JBE) Setup
The trade illustrated in Figure EX3 was taken during a period when ourprevious 2 days had shown a nice uptrend, slow and relatively calm, indi-cating to us that we are seeing a fair market accumulation on many issues.We had two negative events from Cisco Systems (CSCO) the day beforethe trade and in Yahoo! (YHOO) the day of the trade. Both were absorbednicely by the broader trend. The day before the trade CSCO interruptedthe uptrend at midday, but the market regained its trend after the negativeevents from CSCO and YHOO were absorbed. On this day, we had a gapdown that was met with the same continuation of the uptrend we were see-ing. During phases such as these we look for pullbacks and breakouts toenable us to participate in the trend. At such times we frequently buy highand sell higher, which may sometimes be a tough thing for many peopleto do. In this case, buying pullback to support levels and waiting for newhighs is reasonable.
As we noted, the market was showing a nice steady uptrend.Commerce One (CMRC) was one issue that was participating, as you cansee in Figure EX3. Therefore, we had to identify areas for entry. The cir-cle A illustrates the beginning of the most recent uptrend and an area thatwe happened to miss for entry. The steady volume is shown by the barbrackets in the volume section. This suggests that interest continued onthe slow uptrend climb. After missing the move from the $201/4 area, wesaw a nice base in the stock near $21. The two lines R show our range of$21 to $211/4. Here we have determined the range for our trading. Therewere a few prints to $2015/16 during this time period, but very few sellsoccurred at these prices. If this trade was not going to work out, we hadtwo choices on the stop. The first choice was selling at $2015/16 and notwaiting for confirmation. The second choice was to wait for all of the$2015/16 to be eaten and then take a stop loss at $207/8.
The first thing traders should do is evaluate the risk. If $2015/16 goes,would we be able to get out at $207/8 safely? If yes, then we have to wait for$2015/16 to get eaten, possibly hitting a market maker with size or an ECNwith size. In the worst case, our exit would be $207/8. If no, then we don’twait for too much selling at $2015/16 to trigger our stop. In this case, if$2015/16 looks unattainable immediately, find someone at $207/8 to hit, anECN or a market maker with size. So, now we had our stop loss defined. Asyou progress in your trading, you can figure all this out in a matter of sec-onds. You bring up a stock, see levels, and know if a stock is risky or not.
154 PART THREE Practical Examples

Over the years, the most common question we get is how to knowwhether to buy or wait on volume spikes on breakouts. The answer is that,if a stock shows strong volume into resistance and the volume spikes atthe resistance, I’m not inclined to buy this break.
At this point, the buying is usually exhausted and does not have thestrength to carry the stock over the break. Or the break is weak, and weare better off trading pullbacks. If the stock shows a nice steady climb ora nice base and we see a volume spike as resistance is being eaten, I’minclined to buy this break. The difference is that interest on the break rep-
PART THREE Practical Examples 155
F I G U R E E X 3
Jump-base–explosion (JBE) setup. (RealTick graphics are used with permission of Townsend
Analytics, Ltd.)

resented by the volume comes from reasonable support, not a strong movein which buying may have already been exhausted in getting to the resis-tance level. In this case with CMRC, the latter applies. We had a steadyvolume with a reasonable base near $21. The risk was relatively low sincesizes were good and the levels were tight. So a break of the high was areasonable trade. The entry as represented by the circle B in Figure EX3shows the entry. Circle S1 on the volume bar shows the volume spike.This indicates interest and that breakout was likely to occur.
It is important to remember one of the trading mantras: Tape read-ing creates higher probabilities, not certainties.
Now that we had our stop loss defined and a plan ready, we enteredthe trade. We enter either before the break with conviction for the breakor try to enter at the break price. If you miss the break price or better, it’sup to you to decide how far above the breakout price you would want togo. Normally, I wouldn’t chase a breakout play higher than 3–5 cents,depending on the risk. However, in some cases, I’m willing, but onlyrarely, to go higher—closer to 5–10 cents.
During this movement, I would have liked CMRC to hold above $21for the remaining shares. We had an entry and we had a stop plan. Nextwe needed an exit strategy. Tape-reading principles tell us to watch priceand volume spikes. Scalpers exit full lots into these price/volume spikes,where the first signs of resistance occur. Holders have two options. Theycan sell half their shares into the first spike and, in some cases, raise thestop to breakeven or keep a full lot with the original plan. In the CMRCcase, we opted to take half our shares above $211/2, with $219/16 probablybeing the best possible exit area. See point C on Figure EX3.
Taking half positions assumes that you have enough shares to makeit worthwhile. For example, trading 200 shares would not be worth thetrouble. Trading 500 shares is more reasonable. And trading 1000 sharesis an excellent move. At this point the scalpers were out of the trade, andthe holders were out possibly half their shares. The next thing we did waswatch for pullback support. Notice that the price move and the volumespike (as described earlier) usually lead to the end of the oscillation. Thisis why we exit into these areas. We also have an exit strategy on theremaining shares.
Now we wanted to have our remaining shares with a stop at the lowof our minirange which was defined before. This could easily have failedand cost us a stop on the remaining shares. However, we saw good bidsupport at $21 and not much selling to jeopardize the stop. This is a try-ing period for many. Do you exit or hold? The answer depends on you andyour tolerance for executions. I felt the size of the bid and the lack of sell-
156 PART THREE Practical Examples
ing as it got to $21 made it reasonable to hold. At that point, we had tolook for retest of the high and a break over that for the remaining shares.We were looking for the volume spike once again.
We wanted to sell the remaining shares into the next spike becauseit was nearing the end of the day ( just about 10 minutes left) and I didn’twant to hold the stock overnight. The stock made a move near the previ-ous high and broke on reasonable volume with the greatest price spikerepresented near $22, at which point we’d most certainly be out with theremaining shares (see area D and circle S2 on Figure EX3). This is a goodillustration of volume spikes offering us clues to exit. CMRC behavednicely. During this phase of the break of $215/8, traders had the choice ofexiting the remaining shares into the first volume spike test near $213/4. Orwatching for support on the pullback and waiting for another break of$213/4. Action was such at $213/4 that selling continued to be absorbednicely and eventually broke the $213/4 level, offering us a chance on thevolume increase to exit our shares anywhere we wanted between $213/4
and $22. This example demonstrates the application of tape-reading prin-ciples to enter and exit on the breakout play.
PART THREE Practical Examples 157

E X A M P L E 4
Capitulation
Capitulation indicates public participation on the sell side. Traders tend towant to exit at any price they can get, as they sell in panic mode, givingup on their positions. You can see this in any time frame. The two com-ponents we want to see are:
Faster selling on a surge of volume and pace
Vertical price drop
Faster selling suggests that the majority is now selling in aggregate,thereby exhausting the selling. Plus, following the assumption that themajority is usually wrong, when members of the majority participatetogether, it’s time to act as a contrarian, in this case, on the long side. Thevertical price drop shows that there is no one willing to bid into that sell-ing pressure. Market makers show enough to mark their liability or theirneed to make a two-sided market, but they don’t stick around for long.Eventually, as the selling becomes exhaustive, we see the phase of passiveaccumulation. You know that this is happening because it is often difficultto establish a large position in a snapback reversal.
In aggressive accumulation, one or more MPIDs (market participationidentifications) are looking to support a stock in a slow uptrend, while tryingnot to alert the public to their intentions. They absorb a lot of selling pressure,and pullbacks can be shallow as these aggressive accumulators are looking tobuild a bigger position, ready to unload to the public when it hits it on the buyside. So with capitulation, the smart money causes passive accumulation tohappen, and we try to participate. As with any setup, these are based on prob-abilities. We present here two figures that show three separate occasions forcapitulation with only two offering the chance for profitability. Don’t thinkthat one set of circumstances will always yield a profit. There are always out-side events that can skew any setup. In capitulation, maybe there is an aggres-sive distributor who is not letting a stock rise. All we can do is see the event,adjust for our risk, and see if we get good profit potential.
The first stock is Alpha Industries (AHAA) (See Figure EX4a). Youcan see a fast-selling phase from $28.25 to just below $25.50. This marksthe left side of what we refer to in capitulation as the V bottom. The twocircles on this chart mark both things we need:
Faster volume selling; you can see the volume spike.
A more vertical price drop from just over $26 to just under $25.50.
158 PART THREE Practical Examples

At this point, it was up to us to find our entry. This is often the mostdifficult case because this is a conceptual setup. There is no situation incapitulation that says that if you see so many bars at a base, then it’s timeto go long. The snapback doesn’t allow for this. You have to use a littleart in this entry, and it’s often difficult for many people to buy into suchuncertainty. Until you get comfortable with a setup where there is no “settrigger entry,” use small share sizes or try to paper-trade it a bit. Getused to the idea of buying into contraction. There’s no reason to pushit. On AHAA, the entry price and entry size had to be based on risk fac-tors. AHAA tended to have wide levels, and size wasn’t always big. Iwould play no more than 500 shares in order to stay within my risk toler-ance. And I’d exit half and half or in full depending on how the stockreacted.
So, how did I find my exit targets? The first area of exit is usuallywhere the more vertical price movement begins. This is somewhat alongthe same lines as our trend-continuation setups: Suppose a stock makes a
PART THREE Practical Examples 159
F I G U R E E X 4 a
Trading capitulation. (RealTick graphics are used with permission of Townsend Analytics, Ltd.)

base and then falls. Once that support is broken, that usually becomes ourresistance. This is the same case in which the vertical price movementbecomes evident. You can see on AHAA that we had a small base near$26, so if there was any sharp movement back into $26, we’d exit at leasthalf and quite possibly in full because this kind of stock tends to be erratic,and sure profits are a bad idea. We were patient and held, then we lookedback higher and saw another same type of base at just above $26.50. Thisis where the stock made a stronger top before making a shallow pullback.This is the next area where I would have sold the remaining shares. Ofcourse, it’s easy to say what we “should” do. But Figure EX4a provides abit of structure to the trade, so that you aren’t seeing a bunch of confusingnumbers and wondering why or where to exit.
Now let’s look at the Peregrine Systems (PRGN) trade (see FigureEX4b). The highest circle on this chart represents the idea discussedabove: With faster selling from $17 to just under $16.50, we see a hugevolume spike. Entry would be under $16.50, and we needed to look for a
160 PART THREE Practical Examples
F I G U R E E X 4 b
Trading capitulation. (RealTick graphics are used with permission of Townsend Analytics, Ltd.)

retest of the high. As you can see on this chart, the setup didn’t yield aprofit. It might provide a scalp, but most likely it would provide a stop.Once again, we’re dealing in probabilities, not certainties. The price wentvertical, the volume spiked, and an entry signal was seen. But it failed. Sothe cycle repeated, but this time it got closer to $15.50. The two linesshowing the V indicate more vertical price movement from about $16.25down to $15.50. So as the stock bounced off $15.50, we had two smallresistance areas. One just below $16, where we could partial out, and theother right near $16.25, where we could have taken the remaining profits.The fact that the stock got back to $17 was quite amazing, and I definitelyshould not have taken full profits on it. I like to scale out into first and sec-ond resistances on these kinds of stocks because they offer the better prob-abilities to get full profits.
The AHAA and PRGN situations don’t prove this exit methodology.However, the same ideas apply: With faster selling volume, the price wentvertical. This is the time to look for a long-side entry. Determine wherethe vertical price movement begins and scale out into that. If you haveenough patience, use that last resistance as a confidence level. If it breaksit, you can trail your stop or use the next round of buying to exit into. If itcontinues to break resistance levels, the way PRGN did, you can use thatlast resistance as a new confidence level. This is really a personal choice:Where do you scale out? However, if you follow technical analysis andtape-reading principles, you can manage to find the optimal points forboth entry and exit. Optimal points in this case are those that work mostoften and are not necessarily the best for each given trade. It’s in this thatwe can be more confident in the probabilities of our trade.
Notice also that we aren’t believers in, “Loved it at $28; shouldreally love it at $25; value being created; a certain percentage down.”Such statements are opinions about the worth of the stock. Not once haveI mentioned the worth of a stock in this whole discussion. The worth of astock in intraday trading is the expression of an opinion; we could careless about it. Our job is to view the relationship between price and vol-ume, and capitulation alerts do a great job of this, showing how the major-ity panics all at one time, and the smart money looks to profit off thatmajority participation.
PART THREE Practical Examples 161

E X A M P L E 5
Capitulation
As noted earlier, capitulation is one of the foundation principles of tapereading. It simply means that selling becomes exhausted as the publicstruggles to “get out at any price.” The public capitulates; it gives up.Keeping with the idea that the public is usually wrong, the minority looksfor a long-side reversal. Two things present the entry signal:
Price decline in a sharp, almost vertical manner
Volume increase in a sharp spike, showing that the sell-side volume isapproaching or has reached its peak
Let’s apply this principle to Netiq Corporation (NTIQ). (See FigureEX5.) The range, labeled A, is about $27.50 to $28. You can see signs ofcapitulation as the stock drops into this range. We have a spike on the vol-ume chart to the sell side in combination with vertical price movement tothe downside.
This would be a reasonable area for entry in the capitulation phaseexcept for one thing. A trader’s first consideration must always be risk.Risk evaluation is top priority. Remember our saying that amateurs eval-uate profit potential, and pros evaluate risk? On NTIQ, liquidity at thislevel was really thin, meaning that sizes at each level were small and thedepth of the stock had gaps between each level that were too wide. As thisstock was falling, it was even thinner than it was at the real bottom. It wasone that I wouldn’t trade even 500 shares because it was just too thin froma liquidity viewpoint.
However, had I gone in on the capitulation phase at point A, then mytrade would have been a stop loss. Chances for a fill were not easy becausesizes from the $27.70 area were very small and stock action was erratic atbest. Had we gotten filled by bidding into contraction, the most we wouldhave gotten was about $28, certainly not worth the risk. And we’d haveheld the position looking for a move over $28.25 or so. This didn’t hap-pen and we saw new lows.
As the stock continued lower, we wanted to be looking for thatfaster-selling capitulative phase movement:
Price gets more vertical on the downside.
Volume increase on the sell side is apparent.
We wanted stronger sell-side volume than we saw in the $28 area.As the stock approached this next low on faster selling, we would enter
162 PART THREE Practical Examples

163
FIG
UR
E
EX
5
Capitula
tion. (
RealT
ick
gra
phic
s are
use
d w
ith the p
erm
issi
on o
f Tow
nse
nd A
naly
tics
, Ltd
.)

again with only 500 shares, because liquidity was still relatively thin. InFigure EX5 the bottom print ended up at about $24.30, so if that broke, Iwould have been looking to exit with a stop just below that support level.Remember that we always have stops in place because the market isn’tabout certainties. Faster selling doesn’t always lead to a reversal. Nothingin the market works 100 percent of the time, so stop losses are part of thetrade for the times that a setup doesn’t yield a profit.
You can’t know if the bottom is the bottom until 5 minutes later, sodon’t try to be a psychic—be a trader. If you can learn to live with dis-comfort, you will do what the majority can’t. The phrase that profit anddiscomfort go hand in hand is not one that the majority knows or uses.This holds especially true in capitulation setups.
At the B range, we had signs of capitulation and reversal. We couldsee how the first move off this $24.30 area went into about $25 and thencame back down. This is often the most difficult time for a trader. Do youtake the profit or let it ride? In this situation I usually ask the trader a seriesof questions:
Where are you right now in trading?
Are you in drawdown, and do you need a few winners?
Are you in a win cluster and feeling good and clear-minded?
Are you a new trader who needs to make some money while in the learn-ing phase?
There are many elements that answer the “Should I sell now?” ques-tion. You must understand what mindset you are in and use it to youradvantage. Selling at $25 and seeing it later at $28 doesn’t matter. Youneed to exist in now, and you need to respond now. You can give yourselfonly as much profit as your inner reality will allow. The market is the bestreflection of you.
Now I had entry, and I had a resistance level in the $25 to $25.25area. At this point I was looking for a resistance level, and volume intothat level that would yield a higher reward-to-risk ratio, since the capitu-lation phase should mark a very good low and lead to filling some of thegaps in areas where the selling begins to get faster. The $25.25 wasn’tsuch an area, but closer to $26.50 was. We saw volume into about $26.30,indicated by the C circle in Figure EX5, and there also was a bit more ver-tical price movement into this area. This meant that the public was partic-ipating in aggregate on the buy side. This is the tape-reading principleeuphoria.
I wanted to put out my order at this level. As the stock moved into
164 PART THREE Practical Examples

this area, liquidity was not good enough for a fill and the stock then fellfaster into the D range, where we saw a base and consolidation. At the Dlevel, I saw support, but also a series of lower highs within this range. Thismade me want to take the first half of the trade within it. So I offered out300 shares of my 500. It was taken, and I was ready to trail the stop higheron the remaining shares.
Why didn’t I take the full 500? I was willing to risk the remaining200 to see if a gap filled closer to $28, as seen in the E range. This gaveme a target closer to $27.50 to $28, and you can see why from the twolong lines forming the E range. This was the same range that had givenme a consolidation earlier in the A range. Since this was support and itwas broken, I then thought that what had been support would now serveas resistance.
As we got into this $27.50 to $28 area on the first test, we wanted tobe scaling out into any kind of increased volume move or at least trailingthe stop higher. In this case, I trailed the stop to the low of the D range onthe first test of that area. (This first test is indicated by the F circle inFigure EX5). The stop on the D range was $26.30 or so. The pullback into$27 after the first F oval test of resistance held fairly well. As the next testinto the resistance (if there would be one) I would watch for signs of vol-ume/price relationships. The point of the G circle showed declining vol-ume, and while the price rose at that high, we had signs of distributioncontinuing, as well as declining volume. The NDX began to back off atthis point, and we were nearing the lunch period when things tend tobecome less apparent and readable because of the overall lighter volume.Now, it would have been reasonable for us to take the remaining shares asclose to $27.50 as possible, rather than waiting for the new confidencelevel of $27 to fail.
Let’s review some of the major points on this trade. First, capitula-tion reversals require that you adhere to your risk/money managementprinciples. In fact, every trade should, but this is especially so for capitu-lation alerts because they tend to be less liquid as market participants dropbids fairly easily during their passive accumulation of a new low. Ridyourself of old theories that make sense to the public, but not to those whoare using real price action to dictate thin areas of entry and exit. Technicalanalysis principles let us define ranges and supports and resistance.
Tape-reading principles let us know how volume and price worktogether to enable us to scale out of positions that go in our favor. Theseare repeatable and strong guidelines. Understand what mindset you are inas you try to exit the trade. If you are feeling confident but exit the tradejust because you have profit, then something is wrong. If you are feeling
PART THREE Practical Examples 165

out of the flow but are trying to let profits run (almost like revenge trad-ing), you are pushing it too hard and need to get your equilibrium back.Throughout my trading career, I’ve been amazed at how many things wehave to think about. Consider this: The chicken asked the millipede,“How, with 1000 legs, do you know which one to move when?” The mil-lipede replied, “If I thought about it, then I wouldn’t be able to do it.” Idon’t trade with all these step-by-step issues going through my head atonce. They come to me naturally, as part of a progression resulting fromyears of trading experience. Eventually, as a trader, this is where you needto be.
166 PART THREE Practical Examples

E X A M P L E 6
Drop-Base–Implosion (DBI) Setup
There are two technical indicators on Figure EX6a that I use to help mein my entry/exit strategy. Without going into the mechanics of each, letme say that many people use them, and I find them helpful. They are the20-period moving average (20MA) line and the Fibonacci levels (lines F).I used these two elements during this trade to give me more self-confidence, while relating them to the ideas of tape reading, which is ourfoundation for trading. As you can see, the stock was on a clear downtrendfrom mid $22s to the $21 level. Traders have two options on a downtrend.They can either go with the trend and look for short entries, or they can
PART THREE Practical Examples 167
F I G U R E E X 6 a
Drop-base–implosion (DBI) setup: entry strategy. (RealTick graphics are used with permission of Townsend Analytics, Ltd.)

wait for capitulatory selling and look for a reversal, and then go long offsupport. I became interested in this stock at point A. I missed the movefrom the mid $22s to the $21 area while I was watching other stocks. Ididn’t think that point A was the only area for a setup, but it just happenedto be the first one that I saw on this issue for the day.
As RF Micro Devices (RFMD) began to move to the $21 level, welooked for two things: the long black bar in circle A, which indicatesstrong selling, and the volume increase shown on the volume chart.Normally we look for a reversal in this case and go long. However, myfeeling was that we still had a good chance for a downtrend continuation.This wasn’t based on any chart or tape. It was more a perception or anintuition that develops from years of trading experience.
In this case, I was correct. If I had been wrong, I have money/riskmanagement in place to keep the loss small. So I created the perceptionfor short entry on this trade, and then I looked for the proper entry setupon it. Downtrend trading has a caveat. You can’t short on the downtick.Therefore, we had to let the stock break and try to get filled on the offeror on some small bounce, or we’d identify the top of the range and shortinto it on buying. The first choice has a lower percentage for a fill thandoes the second. So in this trade, we did three things. The first, as always,was risk evaluation. If we were wrong, would this stock cost us a hugestop loss? The levels on RFMD were relatively safe, certainly no morethan an eighth of a point of slippage. Then we defined the range. In thiscase, you can see the top and bottom Fibonacci (Fib) lines identified therange for us.
RFMD had a range of $21 to $213/8. The top of the range was wherewe wanted to short into on buying, using a stop no worse than a levelhigher than top of the range, which would be $217/16, and no worse than$211/2 if there was really strong buying. At this point it was important tostay calm and let the stock make its move. It was rather torturous; you cansee the extremely long base it made within the range. However, this wasfine, as the stock remained safe for us. If the spreads had changed or thepace gotten really fast, then it would have been less exciting for me tohold it on a long base. Usually the longer the base, the less likely it is thatthe stock will make a break of the range which signals a trendcontinuation.
We wanted buying to take us to $211/4 and to use the stop at no worsethan $211/2, giving us a 1/4-point risk. The break of the low would offer us2 to 1 or more in our reward/risk ratio since the stock was safe, levels werethick, the pace was not too dangerous, and so on. I considered this to be anice setup. Then I saw two things that made me think that I would stop out
168 PART THREE Practical Examples

of the trade if the stock showed above the 20MA serving as support. Also,the market was making an uptrend into this time period. I felt that if Ibroke $213/8, I would need to get the stop executed at no worse than $211/2
because support was holding and the market was uptrending. This mayhave followed the buying. As you can see, it never got above $215/16, andour short trade remained open. So we had reasoned our entry, our setup,our range, and our desire for the trade.
Now let’s review the exit strategy. Point C in Figure EX6b is wherethe best confirmation of the downtrend appeared. You can see that in theminutes prior to point C the stock broke below $21, suggesting that thedowntrend was still intact. Traders could choose to short the stock here at$21 with a stop no worse than the $213/8 to $211/2 area, depending on risktolerance. I’d have used $213/8 in this case simply because it couldn’tbreak that price previously when the support on the MA held and the mar-ket began an uptrend. So you see, if you wait for trend confirmation, you do
PART THREE Practical Examples 169
F I G U R E E X 6 b
Drop-base–implosion (DBI) setup: exit strategy. (RealTick graphics are used with permission of Townsend Analytics, Ltd.)

have as much cushion in the trade as you would if you had not waited.Some people like confirmation; some prefer to trade before the confirma-tion. This is up to you. Just understand that, in downtrend trading, waitingfor a break of the low makes it harder to get fills. Now that point C showedus confirmation of the downtrend, we looked for an exit strategy. Thereward/risk ratio was served at just below $21, so we had room to let thisstock breathe a bit. Scalpers could exit at any time. Next, we simplywaited for volume and price spikes to exit into.
RFMD behaved beautifully by offering both confirmations to exit atleast half our shares. As you can see on the chart, there is a long black can-dle down at point D and a volume spike represented by D1. This is wherewe began to bid at least a portion of our shares. Exit into strong buyingwhen long, and cover into strong selling when short (at least a portion, ifnot all). It’s a principle we’ve discussed many times. Here you could havegotten a fill possibly at $215/16, certainly at $213/8, giving you almost a fullpoint in profit. If we took only half our profits off the table, then we wouldhave to develop a plan for the remaining shares.
We then needed to trail a stop. Looking back on this trade, I havetwo thoughts regarding the trailing stop. First, I trailed it too tightly.Second, I didn’t care because it was getting late and who knew how thingswould end up. I didn’t want to hold it overnight, and scalping profits onthe remaining shares was reasonable. Let’s talk about the first stop priceof $211/16. I chose it because I didn’t want former support, now serving asresistance, to be broken. If it was going to be broken, I would take the stopat $211/16. As we can see, $21 wasn’t jeopardized in this case. The 50 per-cent retracement Fib at $207/8 (circle E) was the next line I used, and the20MA actually cut the Fib at the $203/4 level. Once the $203/4 level wasbroken, I wanted scalps at the $2013/16 level. In hindsight, I should havekept a stop at $21. As it turned out, the stock made another little spikedown into the close, offering a chance for another cover near $201/4, but Ihad no problem taking the scalp near $2013/16.
In summary, the stock was in a downtrend, and I wanted a shortsetup. I defined the range and evaluated the risk. The stock confirmed thatthe downtrend was still intact on the break of the low. The exit strategyusing principles of tape reading for a volume/price spike was used tocover at least half my shares. I used Fibonacci lines and the 20MA to iden-tify a trailing stop.
170 PART THREE Practical Examples

E X A M P L E 7
Capitulation and Euphoria
Euphoria and capitulation are two of the major elements of tape-readingprinciples. They represent the most extreme cases of how the minority dif-fers from the majority. Let’s first look at capitulation in relation to theminority/majority. Capitulation is the phase of selling that shows a sharprate of increase in the drop of the price of the stock and an increase in thepace/volume. It indicates that the majority is now trying to sell its stock atany price it can get. In essence, the majority has given up on its long posi-tion. Despair, fear overcoming greed—however you want to describe it.In this phase, selling becomes exhausted. When the majority exhausts theselling, the minority passively begins to support the stock at a level it feelsis solid for a reversal to the long side. (We discussed this before.)
The minority is passive because it knows that the majority is nowalerted to the stock and it can’t get the best prices or develop a large posi-tion in a stock that has the attention of the world. Stock scanners, filters,chat rooms, news bulletins, and so on all contribute to the attention a stockgets when it makes a “sudden movement” one way or the other. So firmsare not aggressive in accumulation when working a position in which themajority is participating.
Let’s explore one example of capitulation. (See Figure EX7a.) Youcan see on this stock the rate of change increase in the price drop. Itbecomes vertical. At this point, you see the same increase in pace/volumeon the volume chart on the sell side eventually hitting the peak. This iswhere the majority exhausts its selling, and the minority begins to pas-sively accumulate. For our purposes as day traders, this is where we lookto bid the contraction. We can, if we wish, wait to see some higher levelbroken to confirm the reversal, but, if we wait too long, we will be tryingto buy with the majority (more difficult as liquidity dries up).
We now have a price drop and a volume spike leading to the setup.The minority looks long with a stop at the low. If we get a solid reversal,we will make higher lows and higher highs much the way Research inMotion (RIMM) does. Where do we look to exit?
I look for the last downward price thrust to find a rebound. In thiscase, you can see how the last major selling occurs from $36 to $34.50. Arebound to $36 is quite possible. Anything higher than that seems moreuncertain. The first rise you see is almost right into that $36 area, just a bitover it. Anything beyond that $36 is for those who scale out looking for a
PART THREE Practical Examples 171
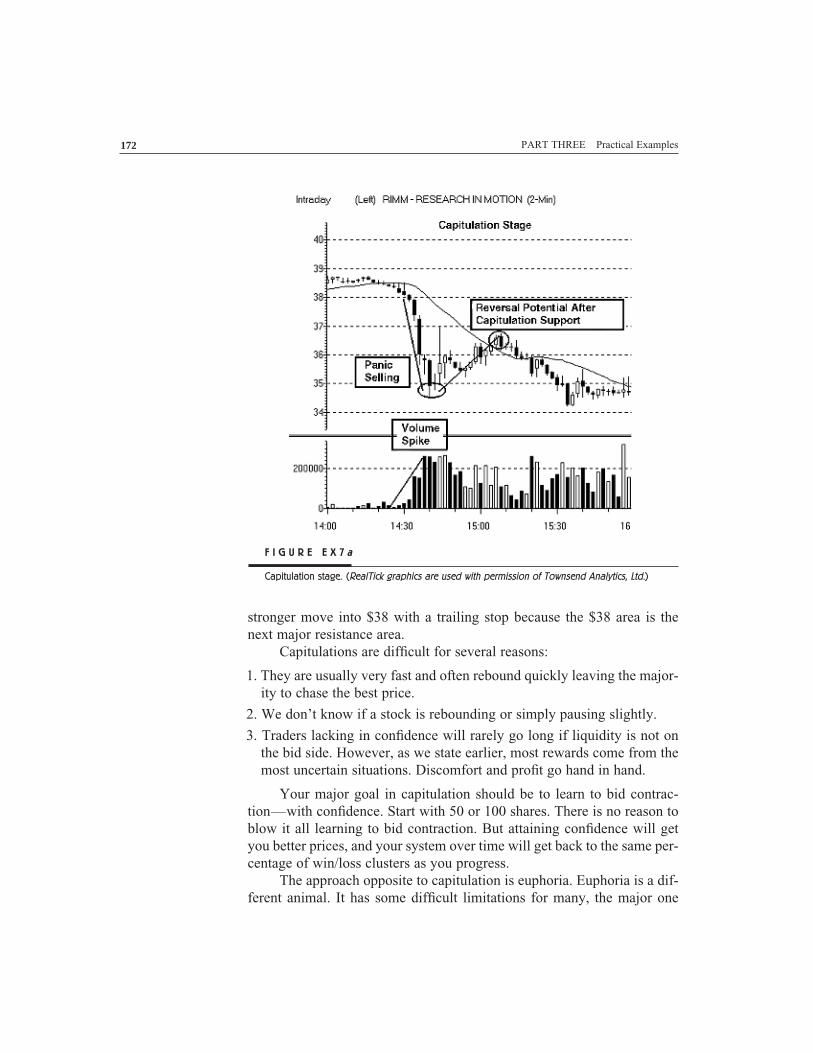
stronger move into $38 with a trailing stop because the $38 area is thenext major resistance area.
Capitulations are difficult for several reasons:
1. They are usually very fast and often rebound quickly leaving the major-ity to chase the best price.
2. We don’t know if a stock is rebounding or simply pausing slightly.
3. Traders lacking in confidence will rarely go long if liquidity is not onthe bid side. However, as we state earlier, most rewards come from themost uncertain situations. Discomfort and profit go hand in hand.
Your major goal in capitulation should be to learn to bid contrac-tion—with confidence. Start with 50 or 100 shares. There is no reason toblow it all learning to bid contraction. But attaining confidence will getyou better prices, and your system over time will get back to the same per-centage of win/loss clusters as you progress.
The approach opposite to capitulation is euphoria. Euphoria is a dif-ferent animal. It has some difficult limitations for many, the major one
172 PART THREE Practical Examples
F I G U R E E X 7 a
Capitulation stage. (RealTick graphics are used with permission of Townsend Analytics, Ltd.)

being the uptick rule. In capitulation, you can buy on downticks andupticks. It doesn’t matter. In euphoria, you have to fool with the uptickrule. Funny how the market tries to protect us from the downside but notthe upside. That and a 25,000 margin rule are some of the greatest ideasI’ve ever seen.
Euphoria in simplest terms is exhausted buying. It is associated witha rate of increase in price with vertical movement to the upside and thevolume/pace spike as well. Figure EX7b illustrates this.
PART THREE Practical Examples 173
F I G U R E E X 7 b
Trading euphoria. (RealTick graphics are used with permission of Townsend Analytics, Ltd.)

As you can see, this stock makes a vertical movement into about$100.25, signaling the end of the upside move. Buying becomesexhausted (referred to as panic buying), and the minority now begins thedistribution phase. If buying is exhausted, then there are no more buyersto take the stock higher. Therefore, the minority begins to distribute whenfrantic buying happens, and this frantic buying is seen by the volume andprice spikes.
Now that we are able to recognize euphoria, let’s discuss some waysto trade it. If you look at the Express Scripts (ESRX) chart, can you seethe trend? It’s up, and, since we are not “buy bottoms, short tops” traders,when stocks are in a trend, we have three choices when ESRX showseuphoria:
1. Short the stock for fast profit expectations only.
2. Wait for a double-top scenario and see if the trend is indeed broken andshows downside movement.
3. If you are going with the trend, you let the stock spike, make a retrace-ment, and see if that retracement level holds.
If it holds and breaks the previous high, you have a trend-continuationsignal, and you go long if the entry price is within your risk tolerance.ESRX shows a great setup for a euphoria short play, but many stronglytrending stocks we’ve seen prove that trying to short euphoria would haveresulted in huge losses or only small gains.
The idea is, that when euphoria occurs, if the stock is in an uptrend:
1. Take faster profits from the short side.
2. Wait for a double top if you like it short.
3. If you like it long, watch for retracement support to hold.
However, don’t get into the habit of trying to short a strong stock.Sure, there are plenty of times when a strong stock finally breaks downand you have a nice cushion by trying to short the first pop into resistance.However, you must understand that, over time, trying to short tops andbuy bottoms simply because they are, in your opinion, due for a bounceor breakdown is not going to serve you well.
There are specific times only that we should employ this strategy:
1. Capitulation—exhausted selling
2. Double bottom—support is holding
3. Euphoria—exhausted buying
4. Double top—resistance is not broken
174 PART THREE Practical Examples

Early in my trading career I was trying to call tops and bottoms andI continued to fail and fail and fail. I finally changed my tune. Sure youcan catch a couple of good plays this way, but, over time, you will usuallyrun into problems unless your reward/risk ratio is high enough to coveryour stops.
If you look at it from a mental aspect, which is more difficult totrade:
Stop, stop, stop, profit
Profit, profit, profit, stop
The former is buy low, sell high. The latter is trading with the trendand is more profitable more often and also better from a trading mindset.There are specific areas in which you should buy low, sell high, and wehave outlined them based on tape-reading principles—capitulation andeuphoria. All others are based on a value judgment or some other reasonsthat have nothing to do with reality, with price and volume. We as intra-day traders are concerned only with the correlation of price and volume,not an opinion-based methodology. The market doesn’t care about youropinion. It has its own way of revealing what is too high or too low. Moreoften than not, a stock can be too high or low longer than you stay solvent.
PART THREE Practical Examples 175

E X A M P L E 8
Finding Entries in a Strong Trend
Early in my career, I couldn’t tell you how many times I got angry at see-ing the market rising strongly, while I hadn’t made one trade or ownedanything on the long side. It was truly frustrating. I see this in manytraders whom I talk with. The question always seems to be: When thestock is rising, where should I get in?
Let me go back several years and give you an answer that I wasgiven by a self-proclaimed stock guru. If the stock is rising, just buy it andwatch it go higher. You can guess how many times I bought the top. I’dneed about the fingers and toes of 10 readers of this book to help mecount, maybe even more. This is clearly not the right answer. We need aspecific reason for entry. Many times, when stocks are trending all bythemselves, against the better movement of a market indicator that isstuck, it’s often difficult to have confidence in such plays.
And it’s difficult to identify areas for entry because we are not con-fident when the overall market is narrow. This stems from the idea that weplay probabilities, and, over time, our probabilities tell us that trying toplay this or that setup, hoping we get the one or two that do actually move,is usually a losing proposition. Let’s take two stocks that were moving onthe same day, despite NDX inactivity: Inrange Technologies (INRG) andManugistics Group (MANU). I will go over exactly what it is that pre-vents us from entry as well as where there are higher probability areas forentry should a trend continue.
As you can see, in Figure EX8a we have an open range, indicated bytwo lines labeled 1 and 2, that fits well into our risk parameters for open-break plays. However, because of the previous day’s fades and a very nar-row day, we wanted to back off open plays.
There were 4000 stocks that opened, but how many open-breakplays did well? Not many, and with aggression levels relatively low onthis particular morning, I wasn’t looking for things like INRG or MANUto occur. On INRG, we saw how the circle A signaled the entry for thelong setup with a stop at the low end of the range. What we saw next iswhat I was alluding to earlier, the hardest part of the move. If we missedour entry near $7.65, we would be looking for another entry, but where?Anywhere, and hope the stock continued higher? Obviously not. You cansee from the ascending line from about $8 to $8.90 that there is nothing inthis whole move to justify an entry. Rather, we needed some type of
176 PART THREE Practical Examples

move, pause, or base, and then we would push higher. This is what we hadin area C. This gave us more confidence for two reasons.
First, if the base is shallow, then the selling pressure is not strongand/or someone is supporting this stock. Second, a break of the high afterthis base says that there are still enough willing buyers around to indicatethat the long side is still the right side, a higher probability. In this case,we had two options. We could buy the low of the base or the break of thehigh assuming it was within our risk ratio parameters. Did I want to shortit? Only if I saw that base broken or if I had seen a possible double-topscenario.
This is why it’s not a good idea to short the first spikes on stocks,trying to nail the first top. Trending stocks like INRG or MANU can killyou if you try to fade the move. Rather, on uptrending issues, you need abase broken or a double-top type of movement to confirm that a short-sidetrade is a better probability. Do stocks come off the first tops? Sure, but
PART THREE Practical Examples 177
F I G U R E E X 8 a
Trading trend confirmation. (RealTick graphics are used with permission of Townsend Analytics, Ltd.)

the probabilities don’t support this over the longer term. You will end upfinding yourself doing that “loss, loss, loss, profit” thing by trying to nailthe first top each time. In the case of INRG, we had a base to work with.It was a bit wider than we’d like for a full lot, but we now had a reason tobuy other than, “Buy it, it’s rising.” We had a low and a high. If we heldthe low and broke the high, we had structure built in. Now as we movedinto the area marked D, things became “choppy.” We saw a spike over $9,a small retracement, a move into a new high, and then selling back underthe area where the price spike occurred. No real support or resistance wasclear in this box area. It was not a good base, as we had in range B. If webought the break at $8.90, we’d have scaled out or taken a full lot to pro-tect profits, as shown in box D.
Where INRG went from that point was much less of a probability,so it was better to lock in a profit. The main point on this is that rather thanget frustrated because the stock goes without you, you need to understandthat all stocks move; all stocks have potential. But not all stocks providesetups that are familiar to you or your system. This is the differencebetween a pro and an amateur. A pro can let a stock move from $20 to $30without an entry because nothing is familiar. An amateur will see themove from $20 to $30 and wonder, “Why didn’t I buy it?”
The MANU chart shows the same thing (See Fig. EX8b). We hadthe open-break play, which we didn’t play because of the low aggressionlevel. Circle A shows the setup for this and the two lines on the bottomestablish the range. As we moved up to $12.30 or so, we finally got a lit-tle pullback and a base. This is the range marked B. Traders could buy thelow of that range as a cushion and look for a break of the high, or theycould buy the breakout of that high base. The next movement from $12.30to $13.20 offered incredible potential, but not a familiar setup. We hadbasically a vertical price movement with few characteristics of a base withwhich to enter. So, while the amateur sees MANU go from $12.30 to$13.20 and feels frustrated, the pro sits patiently, looking for another baseto trade from. Being that the stock was still in an uptrend, we looked fora long setup.
We saw a base from $13 to $13.20 and looked for a break of thisrange in order to be more confident in a long setup continuation. MANUjust sat. Was this base building a certainty? No, it was a higher probabil-ity. Could we break down from this base? Sure, and those who were short-oriented could look for a break of the low of this base with a stop just overthe high. But imagine being the one who tried to short it on the initialspikes discussed in INRG. You’d have stopped out at $12.50. Then again
178 PART THREE Practical Examples

at $12.70. Maybe again at $13. Finally, again, you are short at $13.20, andyou see 20 cents in potential.
So you go, stop, stop, maybe stop again, and finally you see poten-tial. Unless you have emotional control here, you will short the stockagain, looking at a fourth stop on the same stock, hoping that the poten-tial will outweigh the last three spikes. Meanwhile the stock sits in thisrange, creating frustration that a potential 20 cents on the short won’tcover the stops you’ve already taken. Moving on a win/loss percentagethat, in this case, could very well be 25 percent with your profit not com-ing near your loss. To me, this isn’t the best use of your trading capital andcan certainly ruin your trading mindset. This again is the differencebetween trading at any level for whatever reason versus imposing struc-ture, ranges, and the like into your trading so as to identify similar setupsthat have higher probabilities to work over time.
PART THREE Practical Examples 179
F I G U R E E X 8 b
Trading trend confirmation. (RealTick graphics are used with permission of Townsend Analytics, Ltd.)

E X A M P L E 9
Open-Break Setup
An open-break setup requires much confidence and fast, if not automatic,decision making. I don’t normally recommend such plays to inexperi-enced traders because they require skills that most newer traders don’tpossess. First, let’s go over what exactly this setup is.
1. Risk must be defined by a range of 25 cents or less (at times you canstretch this to 30 cents depending on the action, but this is rare).
2. Watch for the range to be broken either on the high side or on the lowside.
3. If the stock breaks high, go long with a stop at bottom of the range.
4. If the stock breaks low, look for a short with a stop at the high end ofthe range.
5. Look to partial out at a 2:1 or less reward/risk ratio.
6. Scalpers look for 1:1 reward/risk ratio.
Peoplesoft (PSFT) shows a good example of the open-break setup(see Fig. EX9). You can see on this chart the support and resistance lev-els from the previous day into the close. Many times I use this kind of sit-uation to help me if the stock is staying within this range in the premarketactivity for open candidates. PSFT was staying in the $30.40 to $30.60range and looked stable on the sell side. From the previous day’s sell-off,we had a fairly slow and stable uptrend into the close, so I wanted toremain with this trend for the open play. This is why I chose the long-sidebias, rather than the short side. As the day opened, our resistance at $30.60held, and we lost $30.40, hitting $30.35 before the stock made its move.The prints below $30.40 were minimal, and, therefore, to me, sellingwasn’t really that strong.
In this trade, with a stop right under $30.35, the support level wouldbe the entry. This kept me in the long-side bias, which is where I wantedto be, and it provided me with a reward/risk ratio of under 25 cents. If theaction broke, I’d be looking to scale out somewhere in a 2:1 or lowerreward area. In this case, I got a break, which was confirmation that anuptrend move at the open was higher. Those who wait for confirmationtend to get more confidence but worse prices. That’s the trade-off.Position yourself on the side of the break with higher probability beforeconfirmation, and you get better prices and less confidence. Position your-
180 PART THREE Practical Examples

181
FIG
UR
E
EX
9
Open-b
reak
setu
p. (
RealT
ick
gra
phic
s are
use
d w
ith p
erm
issi
on o
f Tow
nse
nd A
naly
tics
, Ltd
.)

self with the bigger crowd after the break, and you get more confidence,but worse prices.
This is why, when I feel confident about a trade, I frequently try toget ahead of the setup rather than waiting for confirmation. My win/lossratio usually doesn’t improve by doing so (unless I’m in a win cluster), butmy profit per trade improves for the trades that are successful. This is oneside of the trade-off. When I have entry and receive confirmation, I lookfor an exit strategy. For this, I use my 2-day charts.
As you can see from the previous day’s action, there was on PSFTstrong selling from $31.25, marking eventual capitulation into under $30.Therefore, on the principle that what was support would now be resis-tance, this $31.25 would serve as resistance. Traders stuck with thesehigher prices in the sell-off would be looking to exit near $31.25, tryingto recoup some paper losses. This added to the distribution pressure.
You can see on the chart the vertical price movement into just over$31, showing some resistance, as expected. A target was $31.25, butremember that it’s price action that determines how near the target wewant to take profits. If it’s slow into $31.25, it should be easier to getnearer $31.25 for an exit. If we see faster buying which indicates major-ity participation, then we would want to sell into that buying under$31.25, where we can find liquidity. Offering this out is usually the bestpolicy because price improvement can happen when buying is erratic onthe strong side.
My confidence level was wrong for a proper scaling out. I placed ittoo tight at $31.10 on the pullback from $31.45. A better confidence levelwould have been where the line is marked accordingly. There is a basehere, and it’s above our entry trigger of $30.60. You can see a baseformed, then a break of that base leading to our second resistance level at$31.70. Even though I didn’t participate in this move, we see the sameaction. It shows faster buying into resistance indicated by vertical pricemovement. This is again where we would want to scale or take in fullshares (assuming we held shares).
So, in review, my entry was fine and based on a solid setup. My firstexit was solid, based on tape-reading principles combined with technicalanalysis. My second exit was not stellar because my confidence level wasbrought in too tight and missed 50 cents or so in potential. Let’s focus onthe lesson learned. Don’t trail confidence levels too tightly just becauseyou are eager to book profit (I’m often guilty of this). Rather, let stockaction dictate where you begin to issue confidence levels and trailingstops. You can always find fault with yourself. You can’t ever find faultwith the stock action. It’s the ultimate truth in intraday trading.
182 PART THREE Practical Examples

E X A M P L E 1 0
Open-Break Setup
First let’s talk about premarket information. In the morning from 8 a.m. to9 a.m. I’m fairly quiet, just gathering active stocks, which are dictatedeither from an up or down gap or from news that might bring some inter-est to a stock. At around 9 a.m. I focus on premarket support and resis-tance levels. At 9:20 a.m. or so, risk evaluations become easier, and Imake my final list the last 10 minutes before the market opens. This isfairly basic preparation. I don’t make predictions about where the marketwill go. My job as an intraday trader isn’t to predict. Rather it’s to defineranges and trade from them.
When I watched Finisar Corporation (FNSR), I saw a premarkethigh of about $17.10 and support at $16.85. (See Figure EX10.) For openplays, I like the ranges to be narrow, within 25 cents, before I go one wayor the other. FNSR opened at under $17, and I saw market strength andwanted to look for open-high–break plays. With FNSR under $17, resis-tance at $17.10, and support at $16.85, I felt this was safe enough. Anentry at $17 or better with a stop at $16.85 was a 15-cent risk. If the priceslipped by 5 cents, I’d still be within my 25-cent risk tolerance ratio.
The bottom line represents our open low of $16.95, and entry wasgiven at $17 or better. In this case, the line labeled “confirmation” was thearea that, if broken, had the best chance to see a trend continue based onpremarket resistance. As you can see, the stock spiked right over it, butnot yet benefiting me much for my risk. I wanted to see it closer to $17.40to $17.45 for scalpers. Holders should take half their position off the table.The next spike took the price into $17.40, and, at this point, the riskbecame higher.
Spreads were widening, sizes at bids were smaller, and levels werenot thick. More often than not, when this happens, I want to take half,even if the target is not met. In this case, I’m reducing risk. When bids dis-appear and prices fall too fast against me, I don’t want to have to get ridof a full lot. Fortunately, the stock resumed in my favor after my first half.(See the second circle (A) in the chart.) The volume increased and the rateof price change was nearly vertical, so I applied the tape-reading princi-ple that suggests in this situation to exit another portion or all my remain-ing shares. The stocks moved to just over $17.80; see the spike in pricefollowed by a decrease in volume. This is where I wanted to take anotherquarter of the position if not the full lot. In this case, $17.65 was a hightarget, leaving me to miss out on about 15 cents more in potential. But,
PART THREE Practical Examples 183

184
FIG
UR
E
EX
10
Open-b
reak
setu
p. (
RealT
ick
gra
phic
s are
use
d w
ith p
erm
issi
on o
f Tow
nse
nd A
naly
tics
, Ltd
.)

when volume picks up like that, it’s best to offer out into the strength at areasonable level and not try to get the highest tick. The most expensivedecisions are usually made within the last 10 to 20 cents of stock move-ment. Don’t get caught being greedy and trying to get the highest tick.
I am occasionally close to the top ticks, but certainly not everytime—not enough of the time to be greedy. For those who hold a quarterof their original position, they must use a stop-loss strategy. In this case,I identify “confidence levels,” which are areas to which the stock pullsback after making a new continuation signal in the trend’s direction. If thestock breaks the confidence level, I feel the ability of the stock to continuein the desired direction has a much lower probability. For example, afterthe stock broke $17.40, my first exit, I wanted to use any move back tounder $17.50, and closer to 35 cents as a confidence level. This is illus-trated by the line “New Confidence Level” on the chart. If a stock breaksthis line, you have two options. You can use the next buying wave to exitthe remaining shares over that confidence level. Otherwise, keep the orig-inal stop and look for the trend to reverse. If the stock goes below the con-fidence level, look for the next wave of buying to exit into. I wanted$17.50 or higher to justify the risk of taking 30 cents more in losses bykeeping a stop at the $17 breakeven level.
Unfortunately, there was a big seller holding it at $17.40, and so Inever had the opportunity. The remaining quarter of my shares wasstopped out at no worse than $16.95 to $17 (see the circle on the supportline). This is another good illustration of applying technical analysis prin-ciples of support and resistance to complement tape-reading principles forexit strategies. Notice that I didn’t use arbitrary amounts like 25, 50, and75 cents and whole numbers to dictate decisions. I allowed the stockaction, through the form of support and resistance levels, as it dictated, tocreate my confidence levels. This way I brought structure to what mightseem like chaotic movement.
PART THREE Practical Examples 185

E X A M P L E 1 1
Open-Low–Break Setup
On open-break plays, as you know, we try to identify a tight range of 25cents or less, with moderate risk. We also like to watch the premarketaction that occurs 10 minutes before the open to assess support or resis-tance as we move to the open within a range.
PMC-Sierra (PMCS) was a stock in a situation that fit these param-eters. (See Figure EX11.) I was short biased that morning, and I watchedmostly for open breakdown plays as the strength into the close from theprevious day hadn’t followed through much in the morning. So I lookedfor open-low–break plays (short setups) rather than open-high–breakplays (long setups).
PMCS in the premarket was having trouble breaking $17.50 and wasstuck in a tight 10-cent range of $17.40 to $17.50. This satisfied my rangeparameters. Liquidity was deep enough for me to get a solid fill if thestock set up. This satisfied my risk parameters, because, if PMCS failed,slippage would be minimal.
The next thing I looked for was the signal: The break of $17.40 wasthe setup trigger. Traders have two options:
1. Wait for the break to occur, hope to get an uptick closest to the setupprice, and then let the uptick buying take you out.
2. Enter prior to the signal, which is more aggressive and takes a consid-erable amount of experience and a feel for the stock.
The caveat for the first option is that you might not get an uptickclose enough to the setup price, which would adhere to your money man-agement principles. The upside is that the stock tipped its hand, and, bybreaking support, had a higher probability of a continuing downtrend, soyou know that the short is the way to go.
The caveat for the second option is that there is a greater chance thatthe stock will never break support and you will have to stop out becausethe signal for the continuation of the downtrend isn’t given. The upsideis that you get better prices if the signal indeed does present itself afteryour entry. In this case, you enter while things are calm and quiet, mak-ing it easier to get your shares. Compare this to the first option in whichyou enter when everyone else is also trying to enter. So your trade-off isconfirmation and fight for shares or no confirmation and easy-to-getshares.
186 PART THREE Practical Examples

Two lines on the chart show the open-break range. The circle showsthe entry area. Our entry after a $17.40 break with a stop at a break of$17.50 gives us about 15 to 20 cents in risk, depending on the exact fill.
To get a 2:1 reward/risk ratio, we had to be near 40 cents, at least onthe first partial. To add tape-reading principles to this, we looked for fasterselling and a volume increase (spike). This allowed us to cover all that wewanted because we could buy into that strong selling, effectively cover-ing our short at least in partial. You can see this happen on the drop under$17.20 into $16.80, leaving an exit at $16.80 to $17 as the area for the firstpartial for holders and for a full lot for scalpers.
We now had half of our shares remaining. After a small base at$16.60, the price spiked up as shown by the white candle and droppedback into support. The stock looked somewhat nervous, so I wanted toexit another quarter of my shares. I had pretty good cushion now, so Iwanted to try to ride this trend a bit more.
PART THREE Practical Examples 187
F I G U R E E X 1 1
Open-low–break setup. (RealTick graphics are used with permission of Townsend Analytics, Ltd.)

I had more than a quarter of my shares left and a fairly solid cush-ion, combined with the NDX not able to break above the resistance;PMCS had support at 16 from the previous day, so, from here, I estab-lished a confidence level. In this case, it was the high of the range fromthe first $16.20 bottom. The line marked accordingly shows it at justabove $16.40. A confidence level says: If a stock goes over this, then I’mless convinced that the stock will see new lows.
As the NDX continued higher, PMCS began to base a bit higher nearthis confidence level. I wanted to use the next selling back into $16.20 toexit the remaining shares. If PMCS went over $16.45, I would be less con-vinced that I would see new lows, so I would liquidate my remainingshares there.
As you can see, the $16.20 area held pretty well as the NDX contin-ued higher. Eventually PMCS reversed slowly back to the upside.
This movement illustrates how structure is imposed upon what canseem like random numbers. We see real support and resistance levelsmade by the stock itself, not by some arbitrary thought process of “wherethings should bottom or top” because of nonquantifiable reasons likeprofit-taking pressure or walls of worry.
188 PART THREE Practical Examples
E X A M P L E 1 2
Trading within the Range
Take note of lines H and L on Figure EX12. They outline the daily highsand lows; the high was $2211/16, and the low was $213/8. Also we haveFibonacci lines (Fib), which outline a minirange within the larger range.This is based on action throughout the morning session. All pivots beforecircle 1 were missed as entries because we were watching other stocks wewere playing during the morning session, not because they were invalidsetups. Let’s go to our first setup shown at point 1. This circle representsthe area of a short setup.
I defined the low and the high of the range using the low of theretracement from $221/2 and the 62 percent Fib retracement level fromthat. Also, notice the thin line (20MA) moving across $221/2. This addedconfidence that the short setup would be profitable. So we had a setup, butwe still needed to do a few things first. We needed to evaluate risk.Remember that when you are trading within the range, you need to bewareof bid and offer levels/sizes. If the levels are wide, meaning more than 10to 20 cents between the offer and next level, you need to back off becausethey are too wide. If the levels are tight but the sizes at the offer/bid aretoo small, you need to evaluate your share size. If the levels are small,then trading smaller share sizes than your normal full lot is better. Iwatched Corvis Corporation (CORV) during this setup, and I evaluatedthe $217/8 bid. There was plenty of size that, if we identified CORV assupport here, I had no problem buying the low of the range.
The same applied on the short area on this play. The offer at $223/16
was okay, but the offers at $221/4 and $225/16 had plenty of participation,so that if the play failed, we had no problem taking a close stop. Risk wasmoderate at worst. Now we had entry setup and risk evaluation. Next wedefined an exit strategy. We had two options. The first was to trade withinthe range (for scalpers) or hold for break of the support level, in this case$217/8 or $213/4. (I notice this chart has a bar to $213/4 prior to the definedsupport level at circle 2, but it is a mistake on the part of the data feed.)As the stock broke support (circle 2), the pace never picked up, meaningthat we weren’t as confident that the downtrend was going to be strongand we were possibly in just a range trade. Therefore, we could scalp herefor a range trade at $217/8 or lower. Or we could hold half the position, andexit half the position with the break at the $217/8 level, thus confirmingthat a downtrend was a better possibility for the remaining shares.
The technical analysis portion of this confirms that the downtrend is
PART THREE Practical Examples 189

intact. The tape-reading portion made me less confident in the break of$217/8, which offered a strong downtrend on that break. Volume wasn’tstrong in this case. For holders of the stock, we had options to trail thestop or keep it at no worse than breakeven levels since we provided our-selves with the cushion of shorting the top of the range. Circle 3 representsthe area in which we exited the remaining shares flat at no worse than 1/16
because levels were safe enough that exit at $225/16 was fairly easy. So wehad our short within the range finished, with scalpers taking about 3/8,holders taking 3/8 on one portion, and flat to –1/16 on the remaining shares.
190 PART THREE Practical Examples
F I G U R E E X 1 2
Trading within the range. (RealTick graphics are used with permission of Townsend Analytics, Ltd.)
The next play was the breakout. I liked it long on the breakout(which costs a stop loss in the end). We had a continued retest and failureof that $221/2 level. The trend began to go slowly higher, futures began tolook a bit stronger, and I felt a break of $221/2, with a tight stop, was a rea-sonable play. In hindsight, the chart shows us that range trading was stillmore profitable. This is the “buy low, sell high, short high, sell low” strat-egy, using defined ranges. So we took the setup on the breakout trade withan increase in volume at the high and the test and retest failing and finallybreaking. We identified the market maker FBCO as our seller at $221/2. Acouple of blocks went off as the market maker lifted, and the marketimproved a bit. There were plenty of buyers, support was stable near$221/4, and the majority of the signs for a safe breakout play were there.Plus, I had a good feeling at the time that we’d see a move over $23 onthe break. As we had a $221/2 break, the setup was confirmed, and entrywas taken on the confirmation or before for those more confident of thetrade than I was. The risk evaluation remained moderate as levels werestill tight and sizes were good enough that 1/16, no more than 1/8, wouldhave to be given up on the stop if you were a bit slower than most.
Next I defined my exit strategy. Since this stock didn’t provide mewith at least a 1:1 reward/risk ratio, I was forced to plan my stop loss. Iused $223/16, the last Fib level on the retracement from the $221/2 level. Ihad less conviction that the stock would continue up if it got below thatlevel. Circle 4 represents breakout confirmation. Circle 5 represents stopconfirmation. During stop loss, traders often wonder, “Do I hold it andwait for stop-loss confirmation? Or do I exit before it goes through thatlevel? If I wait for confirmation, what if I can’t get out at 1/16 to 1/8 belowthe stop price?” Fear of a greater loss begins to take their focus away fromwhat the stock is doing. They become so focused on how much moneythey are going to lose that they lose sight of the stock action.
All this adds to the noise in your head about whether or not you exitbefore the stop is hit. Two options are available in this case. Mechanicallyspeaking, the stop price is simply a price that says if the stock starts sell-ing (assuming long) at this price, the trade has less of a chance to continuein the direction that would make your position profitable. A break of thisprice confirms that you need to be out of the trade. That’s mechanical. Theprice you exit at is personal; it’s mental and needs to be decided calmlyand without hesitation or regret. This is a function of your execution abil-ities. If you are just learning executions, you don’t have experience in howto get out of stocks that are below stop prices or in certain types of fasteror erratic selling. This adds to the fear of greater loss and greater noise inyour head because you don’t know whether or not you exit at x price. The
PART THREE Practical Examples 191

way to get over this is to trade smaller shares so that an extra 1/4 pointdoesn’t kill you, and it allows you to exit the trade, relieve a bit of stress,and then watch the stock’s action. Then, in the next trade, you panic less,and you have less fear that the stock will move 1 point against you.Eventually, you lose this fear as you accept that you will not always getthe best exit or always stop at the best stop price. Sometimes, slippageoccurs. It’s part of the nature of trading.
To review trading within the range, as shown by CORV example,there are a few steps to remember. First, define the range you want. Eitheruse the smaller range or the daily high or low. The range is dependentupon your time frames. Second, do your risk evaluation. Make sure thebid (long trade) or ask (short trade) is safe enough that a break won’t killyou on executions. Third, try to use the low or high of the range for entry.If you can’t, feel free to hit a price a few cents away. Fourth, once in,define your exit strategy. Fifth, define a profit strategy if applicable. Scalpwithin range, a half lot at confirmation, hold a half, and so on. Sixth, ifyour trade is to be a stop loss, do not panic or feel that you blew a stop ifyou have to give up an extra few cents on confirmation. Do not let the stoploss (the “How do I get out?” fear) distort your reading of the trade. Onetrade should never make or break you. Over the course of a month or year,it’s the average gain or loss that matters. A few cents here or there on atrade exit will not matter. Just don’t take huge hits that force you intobankruptcy. Once you make the decision to exit, exit at a price that is eas-iest to get, even if you give up a little to do so. Use the stop-loss price asa guide. Last, learn to trust your thoughts on when to enter and exit. If youcan’t trust yourself in trading, you fail to understand yourself and provideyourself the opportunity to succeed.
192 PART THREE Practical Examples

E X A M P L E 1 3
Drop-Base–Implosion (DBI) Setup
The first thing we see in Figure EX13 is a nice downtrend from $633/4 to$62. I was not watching this stock to play either the downtrend or thereversal from $62. But it provides a good lesson on capitulatory sellingthat leads to a reversal. You can see the corresponding volume bars risingat the point of reversal.
From this we see a reversal point at the $627/8 area. So we had aminirange defined at $62 to $627/8 (R1 and R2). The second test of the lowheld. If we were looking to trade within the range, we could enter the tradeat $621/8 with the stop under the $62 low. As you can see in this graph, thevolume was a bit erratic. We earlier described a situation in which a lowervolume on a price rise creates a scenario in which the downtrend is stillintact. Volume in this case did not pick up tremendously at the $621/4 area,and there was a little shelf of three bars at $621/2 that was serving as resis-tance off the second test of $62. At this point (area 1), I entered the short$621/4 with a stop at $621/2, assuming a risk of 1/4 point—5/16 point atworst. As you can see, this trade stopped me out (circle 2) because theretest and break of $62, which would have kept the trade valid, did notoccur.
I was forced to take a 5/16 loss on the trade as the $621/2 price levelwas eaten too quickly for a fill. As the stock moved higher to the mini-range high again, I had a reasonable and fair play to short the second retestof the high. However, in this case, one of the two things needed wasn’tpresent for the short: Buying was slowing, and this supported a decisionto short the minirange high. However, the offer was thin, and, if anypickup in pace occurred, the stock would be a higher execution risk, muchlike it was at the $621/2 level.
This is the difference in trading just off a Level 1 or a chart only andseeing depth off a Level 2. In this case, I did not see depth, so maybe Iwould enter and look good. However, all too often, not being able to seedepth is a detriment to short-term trading. And the few stocks that jumpon you will outweigh the converse side of the issue.
Next we started to see the slide off the $627/8 area picking up paceagain. Any retest of the low would be the third test, and, with paceincreasing, I felt it was reasonable to look for another short entry. We sawa test of $62 and a small bounce that allowed me an entry. At this point,the same setup occurred, an entry near $621/4 with a stop at $621/2 (area 3).
PART THREE Practical Examples 193

This time, the price broke on increasing volume. If it didn’t break, I wouldhave taken a stop at $621/2 or $629/16.
The break of $62 confirmed that the downtrend was still intact, so Istarted to plan my exit strategy for the position. Scalpers normally want toexit short positions at the first signs of strength, which, in this case, weredefined in the area where the horizontal line 4 is. The $615/8 to $6111/16 areawas fine for scalpers taking 1/2 point or so depending on the executionlevel. I chose to bid half my shares near the $611/2 level, since the stockwas showing a bit of a support level in the $611/2 to $613/8 area. Taking 1/2
194 PART THREE Practical Examples
F I G U R E E X 1 3
Drop-base–implosion (DBI) setup. (RealTick graphics are used with permission of Townsend Analytics, Ltd.)

to 3/4 point on half of the position was reasonable for the risk assumed,which was 1/4 to 5/16 point.
After I took a profit on half my position, I lowered my stop to thebreakeven level on the remaining shares. With any buying at $62 to $621/4,I would exit the rest of the position with a small profit or a flat trade. Asthe trade continued moving in my favor, I looked for capitulation sellingto close my position. From about 2:50 to 3:10 (14:50 to 15:10) EST, I sawincreasing volume with the stock dropping faster. This is where I had thechoice to take full shares on the trade or to lower the stop to about $611/4.Notice that the $611/4 area is the area that broke, sending the stock to under$61 (circle 5). I elected to take the rest of my profits near $603/4.
PART THREE Practical Examples 195

E X A M P L E 1 4
Stop Loss
Let’s now look at the Yahoo! (YHOO) trade on which I took a stop loss.(See Figure EX14.) This is an interesting trade because it ended up doingwhat I needed it to do after I took my exit. The interesting thing here isthat it did this on action that didn’t support the same setup and reasoningthat I had on my previous entry. In other words, it gave a valid entry fora set of reasons. I was stopped out. Then it reversed to profitability, butthose reasons weren’t there this time.
We opened the day with specific NDX targets for support and resis-tance. We had 1500 as support from the previous day and then smallupside resistance at 1515 and 1555 as more major resistance in the shortterm.
196 PART THREE Practical Examples
F I G U R E E X 1 4
Stop loss. (RealTick graphics are used with permission of Townsend Analytics, Ltd.)

As we approached NDX 1500, we backed off short ideas and play-ing within a range. So instead of breakdowns, I was looking for reversals.You can see some stronger selling on YHOO into $18.05 and a bit of avolume spike indicated by the circle in the volume section of the chart.This tape-reading principle, tied to the bias of the reversal in the NDX,made me go with a long-side position and look for a reversal signal. Ientered long at $18.10.
As the stock moved back into that $18.30 resistance represented bythe resistance-level line, it failed, as noted by the circle. This started methinking that the trade would not work because, also at this point, theNDX was trying to stage an uptrend reversal.
Next we saw faster selling to new lows, just under $18, while theNDX uptrend was still intact. This gave me no confidence in YHOO toreverse at this point. If it can’t reverse with the rest of the market, to me,it’s on its own merits—trading without regard for the general marketdirection—and I have no confidence in trying to play it in the direction ofthe broader market.
So this cost me a stop loss because it didn’t act the way I needed itto. You can see in this chart at the bottom near $18 that the stock finallydid what I needed it to. You can see a series of higher highs and higherlows as represented by the numbers 1 to 5.
Why didn’t I buy it at $18? Because, if it couldn’t rise over $18.30when the NDX was moving higher, why would I expect it to rebound touptrend reversal signals now? At this point in the trade, $18 or $17.90 orwhatever gave me no confidence to reverse, because it couldn’t reverseearlier. So I missed it.
What happened from $18 to $18.60 was what I wanted to have hap-pened from the $18.10 entry. It just didn’t happen, so I took my stop lossbut held my approach intact. I can’t second-guess my reasoning. I canimprove it. But I can’t second-guess it. This is a great lesson that showsthat sound reasoning does not always lead to profit. It also shows that thesame reasoning in one situation can often make us miss out on opportuni-ties in others.
It’s a game of probabilities that over time will make it possible notto care about one YHOO trade. Stick to your discipline, your system thatyou know works for you. View the trades that don’t work out as simplelosses, nothing else. They don’t make you a bad trader, a bad reader, or aloser. They simply are losses inherent to the system—to any system.
PART THREE Practical Examples 197

E X A M P L E 1 5
Drop-Base–Implosion (DBI) Setup
The trade illustrated in Figure EX15 was a short setup at $38.75. Scalperswere looking around $38.30 to exit in full and holders to partial. For hold-ers, the next target for profit would beat $37.70 for the remaining part ofthe position.
As you can see, a series of lower highs formed which led to a breakof support, as shown by the two lines forming the descending triangle.Once the support broke, by going with the trend, we looked for a shortentry marked by the circle with a stop, in this case no worse than $39.05,which was the last range high before the support broke.
This range was a bit wider than I liked for our normal trading andthe stock was a bit too volatile, so I elected to use a half lot to stay withinmy money management principles. We see that the trigger setup wasgiven, entry was taken with a half lot, and we started looking for an exitstrategy. In this case, I looked for supports/resistance areas from the pre-vious day because the intraday chart doesn’t allow me to see anythingbelow the current intraday range support. This is similar to individualswho use large time frames for the overall trend and then small time framesto look for entry, like in a swing or position type of trade. Since I look forfaster profits in my trades, I find a 2-day time frame to be fine.
In this chart, we see that some support from the previous day wasnear $38.30 and then again near $37.70. These are labeled by two linesfrom the previous day. When we got near these areas, I looked for simplevolume indications. If we had slow selling into it, I had a greater proba-bility of seeing it continue lower because not all sellers are washed out. Ifwe saw faster selling into it, we had a higher probability for a base to bemade, and quite possibly a reversal.
The long vertical price bar (circle A) on the chart suggests that it wastime to exit for scalpers, and for holders to take half. I did the latter. Fromthis point on, instead of keeping the stop at $39.05, we could institute atrailing stop or a confidence level.
I normally establish trading stops and confidence levels by using thelast range high before the next low is reached. In this case, we had $38.80as the new confidence level. In essence this says that if the stock goes overthis level, I have less confidence that I will see new lows and so I will usethe next selling activity to exit into. The confidence level on the chart isin the $38.80 area. There was a tick over, which told me to exit.
The stock didn’t make new lows from that point, suggesting that cre-
198 PART THREE Practical Examples

199
FIG
UR
E
EX
15
Dro
p-b
ase
–im
plo
sion (
DB
I) s
etu
p. (
RealT
ick
gra
phic
s are
use
d w
ith p
erm
issi
on o
f Tow
nse
nd A
naly
tics
, Ltd
.)

ating structure among stop, confidence level, and current price allows usto not give back any profits, thereby overcoming the problem that manyof us have of turning a profit into a loss. I don’t mind seeing profit or partof a profit go flat. But I mind very much seeing a profit become a loss. Ifwe break the confidence level, we should exit no worse than flat.Hopefully we will get a little countermove to enable us to exit at a betterprice, just as Veritas Software (VRTS) shows us we can because it soldback down near $38.50, which is much better than $38.80 and much bet-ter than taking a stop at $39.05 on the remaining shares.
So you can see why entry was taken, how to use the 2-day 5-minutechart to see supports when the intraday support is broken, how to deter-mine an exit strategy using these supports, and finally volume indicationsnear those levels. Confidence levels add more structure to the trade, alle-viating the problem of turning a profit into a loss.
200 PART THREE Practical Examples
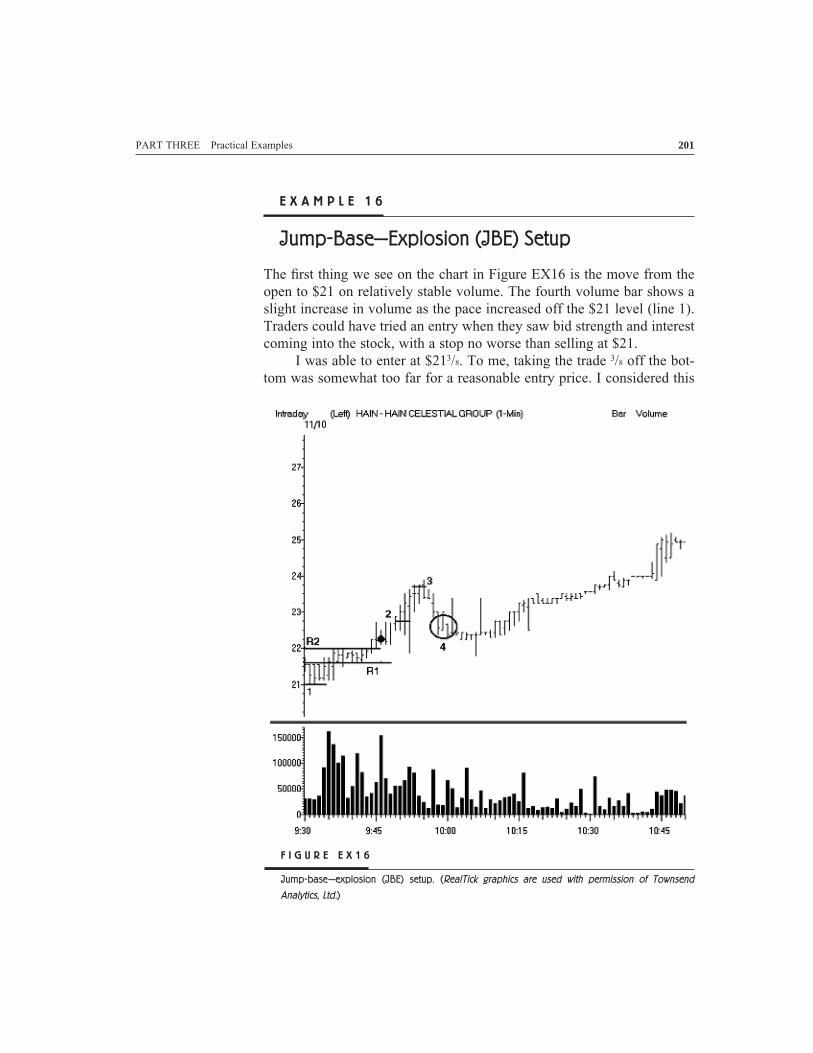
E X A M P L E 1 6
Jump-Base–Explosion (JBE) Setup
The first thing we see on the chart in Figure EX16 is the move from theopen to $21 on relatively stable volume. The fourth volume bar shows aslight increase in volume as the pace increased off the $21 level (line 1).Traders could have tried an entry when they saw bid strength and interestcoming into the stock, with a stop no worse than selling at $21.
I was able to enter at $213/8. To me, taking the trade 3/8 off the bot-tom was somewhat too far for a reasonable entry price. I considered this
PART THREE Practical Examples 201
F I G U R E E X 1 6
Jump-base–explosion (JBE) setup. (RealTick graphics are used with permission of Townsend
Analytics, Ltd.)

to be chasing, as my risk tolerance was $250. But I felt strongly about thistrade and decided to stretch my risk tolerance a little. The optimal entryfor me would have been $211/4 or better in order not to consider it chas-ing, but entry at that price was nearly impossible.
The next few volume bars show a volume spike while at the sametime the stock move to $22. According to tape-reading principles, accel-eration in the price advancing, an almost vertical movement, is usually notsustained and indicates the end of this stage of the move (euphoria stage).A rise in price in conjunction with a volume spike is where the majorityof traders who entered off the $21 level would be exiting. I liquidated myshares into this buying at $217/8.
Further, this $22 level, as you can see on the chart, serves as newresistance for the next 10 minutes or so. The pullback from the $22 areacame to a level of $215/8. This pullback from $22 to $215/8 serves as ourminirange (lines R1 and R2). There are two options when this happens:
1. Buy the low of the pullback of the minirange, in this case, no higherthan $2111/16 with a stop at $211/2. Then you have the choice of eitherscalping within the range of $215/8 to $22 or holding for a breakout ofthe high.
2. Watch for the test of the high and the look of the break, and buy thebreakout at $22.
By the “look of the break” I am referring to the strength in the bid;the ask gets smaller as the pace increases. You can see on the volumechart that the pace was increasing into the break.
Since the stock showed all the signs of breakout, I reentered at $22.We see that the next volume bar at 9:47 a.m. is another volume spike. Onbreakout plays for scalpers, those who take faster profits on larger shares,volume spikes should be considered a good reason to exit. The solid blackcircle on this chart at $223/8 represents the price strength combined withthe volume spike. I sold my position on this spike.
For those who wished to hold for a continued uptrend, this would bea good area for selling half their shares at the scalpers’ target and trailingthe stop to breakeven.
As stock pulled back from the scalpers’ exit area, it held the $22 sup-port. This situation is a tough spot for traders. For example, traders whobought the breakout of $22 now had a few things running through theirheads. “The trade was 3/8 to 1/2 point positive and is now testing my buyprice. Do I hold it with a stop at $215/8 or exit, selling at $22? If I exit at$22 and it holds, I’ll be frustrated for not holding. If I exit at $215/8 by not
202 PART THREE Practical Examples

trailing my stop, I’ll be frustrated for turning a 3/8- to 1/2-point gain into a3/8-point loss.”
Traders must rid themselves of such thoughts. Instead, as the stockis climbing they should be planning their exit strategy, “Okay, the stockis positive. I’m either going to keep the stop at $215/8 or trail it tobreakeven. I don’t want to take a 3/8 loss on a failed breakout. I’d rathertake the flat trade. Maybe I’ll use $2115/16 so that, if $22 fails, I take a smallloss but my break of the $22 stop is confirmed.”
The idea is that traders have to have the exit strategy. This lets themfocus on the stock activity as the stock moves. Cluttering their minds withthoughts of profit and loss does not allow for clear thinking and the appli-cation of tape-reading principles. The less they are focused on the actionitself, the more their emotions control the trade. Successful traders mustmaintain self-control at all times. They must define their strategy and exe-cute it when the time comes.
Fortunately, in this case, the $22 held. At this point, the former resis-tance of $22 now has changed to support. For me, if there were any signsof selling at $22, and I would have exited the trade. With $22 as our stop,we wanted a move to over $221/2 to occur.
In the chart, we again see a volume increase as well as the break of$221/2. At that moment, holders of the stock began to consider exiting atleast half their shares above the $221/2 level into strength. $223/4 is a goodlevel to sell into strength on the price and volume increases (line 2).
Holders would trail the stop to $221/2 as we broke over $23. The nextfew volume bars from the point at which we took half our shares began tofade. The slowing pace of buying with decreasing volume indicated thatthe top of this stage of movement was near. We now wanted to look for aprice to exit our remaining shares. As the stock moved over the $231/2
level, buying dried up considerably (line 3). We saw a drop in the bid to$231/2 and then $233/8 within minutes. If you waited and didn’t exit intostrength, you would have to go as low as $233/8 (circle 4).
The lesson here is that exiting after confirmation of the top is moredifficult. Those who wished to hold the trade longer were stopped out laterat $221/2 on the trailed stop represented by the circle.
PART THREE Practical Examples 203

E X A M P L E 1 7
Jump-Base–Explosion (JBE) Setup
In Figure EX17, let’s first look at the time period just before 10:30 wherethe stock moved from $291/2 to $30 on a relatively good volume spike.Unfortunately, I missed the pickup in pace at the $291/2 level. What wesaw next was a tight range. The shallow pullback and the absorption ofselling suggested a possible continuation of the uptrend. I allowed thestock to define its range from $30 to $293/4.
204 PART THREE Practical Examples
F I G U R E E X 1 7
Jump-base–explosion (JBE) setup. (RealTick graphics are used with permission of Townsend
Analytics, Ltd.)

I wanted to play it for breakout, so I made a choice to buy the bot-tom of the minirange at $2913/16 with a stop at $2911/16. The range was toonarrow to scalp in, so I planned to hold the stock for the breakout of thehigh.
Bidding the low of a minirange assumes bid strengthening. If the bidappears to be weak and a break of the low is imminent, then we need tounderstand the strong possibility that the stock will not hold the low of theminirange, and we need to pull our bid. In this case support was prettystrong as the stock neared the low of the range. As you can see on thechart, the price spiked to the $301/4 to $305/16 area and then got stuck there.At this point in the trade, when it looked as if the breakout was going tofail, I started to feel nervous about continuing. At the same time I had afairly good cushion thanks to my entry at the low limit of the range, so Iheld it with my original stop in place. The pullback after topping in the$301/4 area came to $297/8, and I put my finger on the mouse and got readyto exit. Support held and the stock upticked off this level. As the stockwent over $301/4, I decided to raise my stop to $30, not allowing my profitto disappear.
The ascending line in the bar chart shows a moderate price spike.The circle shows the area $301/2 to $305/8 where I exited half my shares.
The stock had another shallow pullback after my exit. Selling wasagain being absorbed. I tested the $305/8 level again and broke it. Noticethe ascending line in the volume chart indicating a large spike. I wantedto look to exit the remaining shares on this larger volume. I chose the areaof $303/4 to $31 as a reasonable exit area. On the break of $303/4, the stockhit a high of $31 but there were plenty of sellers on the ask at $31. I exitedat $307/8, taking fairly good profit on the second half of my shares.
We can see on the chart that during the next 15 minutes or so thestock climbed to $311/2. So by exiting into the volume spike, I left abouta 1/2 point on the table. However, on breakout trades, we never know howfar they will go. By trading within these ranges, trailing stops, and fol-lowing tape-reading principles, we can bring order into our trading and letthe rest of the profits go to those who see things differently.
PART THREE Practical Examples 205

E X A M P L E 1 8
Drop-Base–Implosion (DBI) Setup
ADC Telecommunications (ADCT) (see Figure EX18) closed right below$19 on the previous day. It opened with a slight gap up. Approximately20 minutes after the open it hit $19 again. That was a short signal forADCT.
At that moment someone asked me if it was a good time to buyADCT. Apparently, “buy low, sell high” was deeply ingrained in his trad-ing. I told him that I had just sold it short, and I explained that the “buylow, sell high” principle was in direct contradiction with another: “Trendis your friend.”
If you go with the trend, why would you want to buy low or shortthe high? If a stock is trending down, wouldn’t buying the low be fightingthe trend? Every new low confirms the continuation of the trend andshould be shorted, not bought. The same goes for shorting of strongstocks. I am sure that you have seen plenty of examples of traders gettingkilled trying to pick the bottoms or tops. Trading is not about picking topsand bottoms; trading is about determining the trend. Actual buying andselling points within the trend need careful consideration as you try toeither pick up the shares at the bottom of a pullback or at breakout levelor go with some kind of hybrid, buying half of your position on the bot-tom and adding to it on breakout.
Is there a situation in which you buy low and sell high? Yes, thereis. You can do this when you have determined that the stock is tradingwithin the range, not trending. But, as soon as the range is broken, youhave to switch to another kind of trading: Buy high and sell higher or sellshort low and buy back lower.
This is why traders who go with “buy low, sell high” do poorly in atrending market. I have seen (and I am sure you have, too) plenty of themgetting killed during the huge market run-up of 1999 through early 2000as they tried to short the tops. The same happened to those who tried tobuy bottoms during the market decline in 2000–2001.
Let’s return to the ADCT chart. I shorted ADCT when it broke $19to the downside (trade 1 on the chart). I placed a stop at $191/4 because thestock unsuccessfully tried to penetrate this level during a weak attempt tobounce, so $191/4 became the natural resistance.
ADCT broke down pretty quickly. At around $18 it showed somesupport, and I had covered the short in full. I watched it going down more,and, later on, ADCT found more support at $171/2. It made several weak
206 PART THREE Practical Examples

attempts to bounce from this level, and then the volume dried up.Unsuccessful attempts to bounce led me to the conclusion that the down-trend was still intact, and another short signal was generated (trade 2). Ittook traders of ADCT about 20 minutes to realize that the stock was des-tined to go down. I covered it just below $161/2.
Note the volume spike as ADCT went down to $16. That was capit-ulation: fast selling on sharply increased volume which usually indicatesthe end of selling and offers a reasonable expectation of a reverse. This is
PART THREE Practical Examples 207
F I G U R E E X 1 8
Drop-base–implosion (DBI) setup. (RealTick graphics are used with permission of Townsend Analytics, Ltd.)

what makes me reverse from “sell low, buy back lower to buy low, sellhigh.”
It was at that point that I started to look for a bottom buy because itreally looked like the trend was about to reverse. I made two attempts: Thefirst led me to a flat trade at $161/2 (trade 3). The stock sold down onceagain on exhausted selling, which I believed was the last gasp of selling.
I took my next buy attempt at $161/8 with a stop at $157/8 (trade 4entry). Placing a stop in this case was easy—any new low, and we had toadmit that the downtrend was still there. The closing of the trade was easyas well. As a scalper I got my 3/8 point (Trade 4 exit).
I didn’t touch ADCT again that day, despite its nice climb after adouble bottom was formed. It was certainly worth another long play, butI lost my feel for its movement and could not read it as clearly as I couldbefore. The pace became pretty flat; volume stopped giving any usefulindications, which made the stock tough to read.
208 PART THREE Practical Examples

E X A M P L E 1 9
Trend Continuation
In Figure EX19 the circle marked 1 is a long entry after capitulation sell-ing. This is illustrated by the declining line in the price section and the cir-cle in the volume section. A steep price decline on sharply increasedvolume indicated capitulation and led to a long entry called at $753/8. Thestock spiked at over $76, where I made my exit.
Let’s take a look at what has happened. The price stalled at around$76, and the volume dried up. You can see the two lines marked as bearflags, one in the price section and the other in the volume section. A rela-tively big volume increase on the price advance with shallow volume onthe reaction indicates a continuing uptrend. Here we have reversal of thisprinciple for a downtrend: volume drying up on a short-lived rally indi-cates a continuing downtrend.
I interpreted this as an indication of potential further decline and pre-pared to short JDS Uniphase Corporation (JDSU) at a new low, as itwould penetrate $75 to the downside. We didn’t want to short it at around$76. Although this is a valid play, in this particular case we refrained fromdoing it because the stock was moving extremely fast, which can be dan-gerous, and we needed more confirmation of direction. It was easy to shortit at around $76 only to see it making a double bottom 1/2 point lower andthen jumping higher. That’s why I made the short entry at under $75 asthe stock made a new low. My actual entry was $743/4, which was all thatwas possible considering the speed of JDSU.
The next stage of the movement was accelerated selling, which ismarked as capitulation on the chart. When selling became furious at under$74, it was the time to cover and/or go long. As you can see, the cover andreverse would have happened at around $731/2 to $735/8.
The next event is quite remarkable. It’s an exact repetition of whathappened on the first rally. The stock spiked to $75, and again, as in thefirst case, the price stalled and the volume has dried up. The same princi-ple was applied, and this is indicated by the bear flag, which suggests thatthe downtrend is likely to continue. The price broke down fast once againand reached the previous low. The line marked “previous low broken”shows the level of that low. And, once again, the entire cycle repeateditself. The new short entry was $73, just below the previous low, and thenew capitulation took the stock to new lows on increasing volume. Youcan see a sharp volume spike drop to under $71. This spike alerted me tothe bottom being close, and the stock rocketed from here. The next stage
PART THREE Practical Examples 209

was again the bear flag, and the stock met resistance at the level where itbounced the previous time—at around $73.
Former support became new resistance. After the stock had droppedfrom this level, it became much less readable mainly because the pricemovement and pace became plainer, which usually makes readability low.
210 PART THREE Practical Examples
F I G U R E E X 1 9
Trend continuation. (RealTick graphics are used with permission of Townsend Analytics, Ltd.)

E X A M P L E 2 0
Open-Low Break and Reversal
Network Appliance (NTAP) (see Figure EX20) was lower right from theopening, and it had a nice open-break trade possibility. Its early range was$25.20 to $25.40. When it broke $25.20, I took this to be a signal to takeit on the short side, with a stop just over the high of the narrow range. Iwasn’t aggressive on my open plays that morning, so I missed it becauseof my lack of aggression.
The downside movement is shown in the area with two lines and thecircle A. This movement was resistance from the previous day. I lookedhere for some possible support in order to form a range that would leadme to trend continuation or reversal. During this period of movement, Istayed with the trend and went with a short bias, looking for a breakdownof support.
PART THREE Practical Examples 211
F I G U R E E X 2 0
Open-low break and reversal. (RealTick graphics are used with permission of Townsend Analytics, Ltd.)

Entry was taken just before confirmation, but liquidity at this pointwas thin, giving me only half my shares of the original order, before mov-ing lower. When I get less than my original order, around 500 to 600shares, I look to scale out half and half, rather than half, quarter, quarter. Inthis case, as entry was taken on the breakdown of this range near $24.50, Ilooked for an exit strategy that would yield a near 2:1 reward/risk ratio.Selling was faster into the $24 area, and I looked to scale out into that fasterselling. In this case, the faster selling took the stock lower to about $23.60,leaving me with around 35 cents in missed potential because I scaled outnearer $24, but what could I do? I saw what I needed, I had no idea howfar the stock would drop, and I could scale only as I saw fit.
I then had half my shares left, so I used the next rebound as a confi-dence level, in this case just under $24, near $23.80. If I were to go backover $23.80 from here, I’d be less convinced that I’d see new lows on themovement. Fortunately, it didn’t happen, and the stock moved lower fortrend continuation.
At this point, there was another fast selling phase with vertical pricedrop movement into about $23.20. I took my exit just under $23.50 as thefaster selling hit again on the remaining shares. This is shown by circle C.This gave me about 2:1 in my reward/risk ratio for the first lot. I scaledout of the second lot and achieved a 4:1 reward/risk ratio.
We saw capitulation movement a few times on this stock. Butinstead of trying to trade the reversal at $24 and $23.50, I looked at some-thing nearer $23 because the 2-day chart showed the previous day’s sup-port there. When I got a few signals working together, my confidence inthe trade became a bit stronger.
We now had:
1. Faster selling (capitulation showing exhaustion and leading to a high probability of reversal)
2. Support from the previous day that I thought would hold on the day ofthe trade
Faster selling into a support is a good reason to bid the issue,because you have selling exhaustion and clear support. If they hold, itshould be a nice reversal. If they fail, you have a clear stop exit strategy.
I took entry at $23.27, and looked for a movement back into resis-tance levels to scale out or exit in full depending on the action. I took mystop as the stock broke back below the low, which did not get me to a rea-sonable reward/risk ratio (circle D). This stop loss was defined by the lackof buying into a resistance level, and then the failure of the former low tohold. I didn’t reenter the stock because I lost confidence in its ability torecover. Further action proved me to be wrong.
212 PART THREE Practical Examples

Let’s see how a trader should have acted if this entry was taken.Circle E represents the real low. Let’s assume that we caught it. Manytraders often have a tough time distinguishing where to exit reversals. Inthese cases, I try to establish two things:
1. Areas where the downside movement begins to become more vertical.This is along the lines of “what was support, should now be resistance.”The level where support breaks, and the point at which the pricebecomes vertical, should now be an area of resistance.
2. In areas where there are ranges, use the high of a range to establish aresistance level that the stock needs to eat through if the upside rever-sal is to continue.
This situation is represented by the three lines tied into the black cir-cle labeled F.
Let’s assume we took entry near $23. We kept an eye on that $23.40area. You can see the resistance it made between circles D and C. If we brokethat, we could have used $23.80 as a next one. But if we broke $23.40, wewould have some cushion to work with so that I wouldn’t care as much aboutcloser resistance. I could have scaled into this area if I had wanted to.
The next movement resistance was back again at the $23.80 area—the former confidence level. The price moved to this level at 9:50 a.m. andthen dropped sharply to $23.30—an area of resistance again. If the buy-ing had been any faster, I’d have looked to exit another portion of myshares. By doing so, I would have given up a little more movement to justover $24.10. Remember, we are defining areas in which things are likelyto happen, not creating certainties where things will happen. So let’sassume that I still held a half or a quarter of my position. The most likelyresistance would be where my original entry was made. You can see onthe chart how the price moved right back to $24.50 and failed to continue,as this former support, once broken, then served as the ultimate resistance.
If we broke $24.50 with stability, I have trailed the stop, moved theconfidence level up to just under $24 (you can see support there on theshallow pullback), looked for final resistance at $25.20 or so, and exited infull to close the daily trade. Rarely do we get that lucky. But the lesson is:
1. Don’t guess on where to exit (or enter for that matter).
2. Find the areas of support and resistance.
3. Use the correlations of price and volume to find areas for entry and exit.
4. Use areas in items 2 and 3 as guides for stock movement on retracements.
5. Scale out as the stock moves in your direction.
6. Keep your stop if items 1 through 5 fail to be profitable.
PART THREE Practical Examples 213

E X A M P L E 2 1
Drop-Base–Implosion (DBI) Setup
In Figure EX21 we see a fairly sharp sell-off at the open—an almost ver-tical downside price movement associated with a volume spike. As thestock bounced from $16.25 to $16.60, we got stuck in the range. Thisrange trade didn’t allow much for conviction on direction bias until wesaw some clues. Examples of such clues are:
1. Are highs and lows higher or lower than those made on a previous movewithin this range?
2. Is the volume increasing or decreasing on advances and retreats?
In this case, the high of $16.60 gave us a retest of the $16.25 low andthen a lower high at $16.50. This is where I went with a short-side biasrather than looking for reversal. As we finally broke $16.25 support, Ientered short. Short setups are inherently more difficult than others. Theuptick rule negates ease of entry if the stock drops too fast. Fortunately,Comverse Technology (CMVT) fell and then came back to $16.25 for theentry.
In this kind of situation a common question is: If stock falls beforeentry, how far do you let it go before you refuse to chase? Usually, if thetrade doesn’t serve at least a 1:1 reward/risk ratio on the first break andthen come back to that best short price, I’ll go with it. If I see it serving1:1 right away, I’m less confident in it and am less likely to enter if itcomes back to that price.
The support line on the chart shows the support. When the supportbroke, we went with the trend and found the short entry. The initial stop(shown on the chart) was placed at the previous high made within risk tol-erance after the setup formed, in this case, just above $16.50.
With risk of about 25 cents, scalpers would exit near $16 for 1:1reward/risk ratio. I wanted to hold for a better exit because the bouncelooked weak.
From the $15.95 support level, we had a move back to about $16.15.This was now our new confidence level after we retested the lows. Thismeant that if CMVT were to go higher, back over $16.15, I would be lessconfident that we would see new lows. If CMVT were to go over $16.15,my option would be to set the breakeven stop on the remaining shares oruse the next round of selling back into support to cover.
As you can see, the stock did not get near this level again. Rather itmoved into “congestion.” Two horizontal lines denote the congestion in
214 PART THREE Practical Examples

PART THREE Practical Examples 215
F I G U R E E X 2 1
Drop-base–implosion (DBI) setup. (RealTick graphics are used with permission of Townsend
Analytics, Ltd.)
this area, one just above $16 and one just below.Congestion occurs when the number of buyers is equal to the num-
ber of sellers in a narrow range. In this case, it was very difficult to dis-cern direction. I had two choices:
1. I could hold a full position until the low of the range broke, keeping mystop-loss level intact.
2. I could hold a partial position. I could cover half the position into sup-port, and thereby lock my profits.
If the stock broke the high of the congestion, I could use the samestrategy I used with the confidence level, letting it hit a stop at no worsethan breakeven, or I could use the next round of selling into support to exitmy remainder. If the stock broke the low after I had covered the first half,I could then add the half back again, because the continuation signal wasgiven. Or I could not add that half back and just let the remaining half thatI had ride as the continuation signal was given.

There is no single right way to trade it; these are just options. Choosewhat best fits your style. I went with the first option, held my full positionand waited for $15.95 to break down. It did, and I covered my short into$15.75. This level served a 2:1 reward/risk ratio, and there was faster sell-ing with increasing volume.
If traders had covered half their shares at this level, they wouldlower their stop to $16.15, our former confidence level. Their new confi-dence level would be $15.95, on the principle that what was supportshould now be resistance. If it broke over $15.95, I would have been lessconfident that I would see it under $15.60, so either it would hit the trail-ing stop at $16.15, or the next round of selling would take it back into the$15.60 to $15.75 area, which is where the exit should be taken.
216 PART THREE Practical Examples

E X A M P L E 2 2
Trailing Stops and Confidence Levels
Two days previous to the trade shown in Figure EX22, we had very goodaction and were aggressive. On October 28, however things became dull,and it seemed that the resistance levels were getting sold into, rather thanbeing broken out of. Trading became rather narrow and lifeless, leadingus to October 29. The open-break plays were not worth much on the longside, and we had backed off, looking for short setups as the NDX movedlower throughout the opening. Siebel Systems (SEBL) was my focus fromthe short side as the NDX was failing to overcome resistance. Resistanceat $18.55 looked like the top, as NDX lost its low.
The two diagonal lines are descending and show lower highs andlower lows, which creates the look of a downtrend. With the NDX failinglows and SEBL already in a downtrend that started near 3 p.m. on the pre-vious day, I wanted to go with a short setup bias.
The range from $18.05 to $18.55 was too wide for me to enter witha DBI setup, meaning to short the low. This setup is used to short intoresistance on a downtrending issue. I had the trend with me in the stockas well as the NDX cooperating, since it broke the lows. This simplyadded to the probabilities that I would get what I needed when I took theentry.
The two lines, one at open resistance of $18.55 and the other beinglow support at $18.05, gave me my range (labeled A). The entry wasshorting into that resistance, with a stop just above it at $18.65–$18.70.Circle B illustrates this setup.
As the stock pulled into the range of C, we had congestion—a stockmaking a smaller range, then buying equals selling. This happened atabout $18.20. At this point, the NDX began to sit in a narrower range.There simply was no way to know what would happen during the con-gestion phase. Guessing which side would win wasn’t our goal in this sit-uation. Our goal was to let the buyers or sellers tip their hands and go withthat side of the trade.
Since we were already short and downtrend-biased, we positionedourselves for a downtrend movement scenario. Scalpers would take a fulllot off the table at a 1:1 reward/risk ratio. There wasn’t any reason to riska scalp in congestion. Holders needed a better reward for their risk, but, incongestion, on a narrow day, they needed to think of capital preservation,rather than aggressive scaling. Since we couldn’t break the support near$18.20, I took half my shares off the table.
PART THREE Practical Examples 217

218
FIG
UR
E
EX
22
Tra
iling s
tops
and c
onfidence
leve
ls. (
RealT
ick
gra
phic
s are
use
d w
ith p
erm
issi
on o
f Tow
nse
nd A
naly
tics
, Ltd
.)

Then I moved my stop to a breakeven level and waited for a break-down of the congestion range. I had already locked in profits on the firsthalf of my shares. As you can see, we got the breakdown and the trend-continuation signal. We got faster selling into $18 on this phase, and,when you get faster selling into a level, you want to partial out again. Soon this round of selling, marked by circle D, I covered a quarter more ofmy shares.
An important tape-reading principle states that faster selling showsexhaustion and that the trend becomes less certain from that point.Starting at 18, another range started building, from $18.15 to $18. Whenit broke again, I still owned a quarter of my shares, and I had a choice:take the remaining quarter of my shares or trail the stop. You can see howthe volume spiked again at 11:45 a.m. on a more vertical price drop to$17.70. This would be the signal to exit your remaining shares if you wishto, and it’s perfectly valid to do so. That was what I did.
Another possibility would be to see how much of a downtrend wecould ride with the remaining shares. In this case, I used confidence lev-els and trailing stops. Confidence levels simply say to me: If the stockbreaks this level, I’m less confident that the trend will continue. The trail-ing stop says: If the stock hits this, I’ll take the remaining shares off thetable no matter what.
As we moved into breaking support of $18, we needed to establishthe confidence level. This is marked by the line E. It is simply the lastrange high before the stock finally fails support. So if SEBL broke $18.15,I would be less confident that we would see new lows.
The above situation would warrant our trading in the following man-ner. The stock breaks $18.15, so we will either let it hit our stop price oruse the next round of selling to cover the remaining shares. Your risk isthat you lose the profit if it hits the stop. Your gain is that you will get bet-ter price cover if you use the next selling round to go back under the con-fidence level. If you aren’t comfortable with the confidence level,meaning you don’t want to let it hit the stop, then trail the stop tighter tothis $18.15 area. It’s simply a matter of where your aggression lies. If youwant to see if you can ride a trend, then your confidence level is fine. Ifyou would rather take the full profits, then trail the stop tighter and lockin the gains.
What is your mindset? Are you in a win cluster? Do you ride gainswhile you read the market correctly? Are you in a drawdown or slow-bleeding phase? Don’t try as hard to ride gains because it will get youcloser to revenge trading, trying to make it all back in a short period oftime. Maybe you should trail stops tighter in this period so that you get the
PART THREE Practical Examples 219

sense that you are seeing things well and profiting from them—creatingthat winning attitude. There are more reasons to trail the stop or to useconfidence levels than just, “It’s going in my direction.” The market is areflection of you, and you are willing to give yourself only what you thinkyou are worth at a particular moment. If you are feeling well, maybe scal-ing out is better for you because the stock is moving in your direction andyou want to stay with your confidence. If you are feeling confused or in adown period, taking full profits to get used to the feeling of profits is bet-ter. Eventually you can go back to scaling out if the market allows you todo so.
This trade helps to identify three important things we use every day,even if we don’t naturally or consciously understand why:
1. Technical analysis helps to define the structure.
2. Tape-reading principles help to define the entry and exit points(price/volume relationships).
3. Exit strategies help to pull us through flat or negative periods and movebetter during positive periods.
220 PART THREE Practical Examples

E X A M P L E 2 3
Jump-Base–Explosion (JBE) Setup
The first thing we see on the chart in Figure EX23 is a move from the $73to the $74 area on relatively stable volume. There was a small price spikeright at $74 where traders in from lower levels would be exiting. As thestock began to pull back, we noticed a shallow pullback to $735/8. So, weestablished the range from $735/8 to $74. The broader trend continued toshow strength during this time period, and QUALCOMM (QCOM) is astock that may follow a broader trend a bit better than others.
PART THREE Practical Examples 221
F I G U R E E X 2 3
Jump-base–explosion (JBE) setup. (RealTick graphics are used with permission of Townsend Analytics, Ltd.)

Traders have two options in this case. The first is to buy the lowminirange, in this case, at $735/8. The other is take the offer at $7311/16 ifyou feel that $735/8 isn’t attainable. In either case, with selling at $735/8,you need to get ready for the stop exit. If traders wished to bid QCOM,they could scalp within the range or wait for the break. Here, the stockmade a break of the high, offering the setup for a long trade. Buying for abreakout required a stop at $735/8.
We saw the initial break as being weak; the stock price came backdown to $7311/16 and held. At this point, if I saw any selling at $7311/16, Iwould be ready to hit the bid fast for an exit. Many times, a failed breakoutmakes a great short. We wouldn’t want to get caught in stronger selling.
With the hold of the low minirange and a move back to new highs,we looked for a reasonable exit strategy. The price spike that put us tonear $743/4 was the area for this. We can see a price spike associated witha volume spike in this area. This is where traders would exit at least halfof their positions and raise a stop to near breakeven if not absolutebreakeven on the rest. I used $737/8 as a stop because I wanted to use $74,the previous resistance, to now serve as support.
From this point we saw basing for about 20 minutes. We wanted toraise the stop to the $741/2 level, which was serving as the bottom of theminirange during this period. Any break of that and we would take the restof our shares at $743/8.
Fortunately the $751/2 level held, and the stock broke the $75 level.Notice that on the pullback to $741/2 there was an inclining volume riseleading to a volume spike at about 2:05 p.m., or 14:05 on the chart. Thisis the next point at which traders looked to exit their remaining shares.The $741/2 level wasn’t jeopardized, so anyone holding for the break of the$75 level would be looking to exit into this spike.
Taking profits within the $741/2 to $75 range was reasonable. Forthose who held, this is the action that they would be looking for to exit.
As the stock moved to the $76 area, we noticed that the volumedropped considerably and that the market participants were jumping onand off levels, making the trade hard to read. At the point at which thestock became hard to read, we’d certainly be looking to exit, if we hadn’talready, into the price/volume spike. From this exit, you can see thevolatility on the issue as the day wore on.
There were a few other possibilities, but the action was jumpy,erratic, and hard to read, so it was best to back off.
This is an example of a breakout trade from an established mini-range, using price/volume spikes to define the exit strategy as weapproach it from a tape-reading point of view.
222 PART THREE Practical Examples

E X A M P L E 2 4
Cup-and-Handle Breakout
The day the trade took place (See Figure EX24) there was a nice uptrend,with the majority of the potential taken from breakout trades and pull-backs. Stocks such as TUTS, CRDS, ATHM, and NEON were makingnew highs, and those issues that had been beaten up over the previous yearwere showing signs of reversals from their lows.
Adtran Inc. (ADTN), however, was a stock that was down on thatday after guiding estimates lower for the quarter. So we had a negative
PART THREE Practical Examples 223
F I G U R E E X 2 4
Cup-and-handle breakout. (RealTick graphics are used with permission of Townsend Analytics, Ltd.)

gap on negative news in a market that was showing pretty good strengthoverall. Whether or not the broader trend mood gave some excitement tothe ADTN uptrend from its lows is uncertain, but the idea of playingbreakout trades was reasonable.
Tape-reading principles are usually the same in any market, for anykind of stocks, with or without news surrounding them. The stock tells uswhat to do at any given moment. In this sense, the setup occurs, and thetape tells us whether to enter or not. We move from there to the exitstrategy.
We can see on the ADTN chart a move from the $21 area. One ofthe principles of tape reading is illustrated on this move. We had steadyvolume with an increase in price. This is so-called good buying. The endof the move is shown as a top near $23 with the volume spike. This isnormally when “everyone wants in on the stock,” and the smart moneybegins to sell shares it accumulated at lower levels. If you go over chartafter chart after chart on any given stock during the day, you can pick outvolume spikes and price spikes that normally lead to the end of a move. Itis a simple accumulation/distribution principle based on the public beingthe last to figure out what is happening. When it does figure it out andwants in, it’s time to look for your exit. Volume spikes are indications offast buying or of the public’s fear of holding a losing position, which leadsto capitulation selling.
So we next saw a pullback on declining volume. Again the principleof tape reading is that you can see that pullback on declining volume, sowe look for an uptrend to continue. What we saw next was a situation inwhich the stock tried to break out again and failed.
The circle (Test but No Break) on the horizontal resistance linedemonstrates this failure. At this point, the range defined from the touchedand the failed break was $23–$223/4. If traders entered below $23 beforethe confirmation, they would have had to use the low of the minirange asa stop level.
As always, there is a choice when trading breakouts: Buy before thebreakout occurs and trade your convictions or wait for the breakout con-firmation and have your order ready to send in. By using money and risk-management principles, you will decide how far you are willing to chasethe breakout. This depends on your stop price and your entry price. Thesetup in this case was a 1/4-point stop. But if you couldn’t enter until$231/8, the stop would now be $233/8.
On the third attempt, the break finally occurs. The chart illustratesthe cup and handle. You can see this drawn on the chart with the first hor-izontal line, the cup, and the two diagonal lines, which show the area
224 PART THREE Practical Examples

where the handle will formed. Notice how the volume repeated this for-mation, confirming the validity of the cup-and-handle setup. Normally thebreakout occurs on the third attempt of the high. In this case, the cup hadan unusually short time to form, but the setup still worked well.
Now, our stop was set at $223/4. Therefore, our risk was assumed(gamblers create risk; traders assume risk) and it was no worse than the$2211/16 to $223/4 level. We now needed to follow the principles of tapereading for our exit. When the stock broke $23, scalpers exited into a pricespike, which you can see in the first upside price bar, and you can see themovement leveling off after the price spike. Volume increased, offering areasonable chance to exit into strength. For those who were willing tohold the trade, we needed a break of the resistance area near $231/2 to$235/8. So the first square used (exit point 1) offered a chance to sell atleast half of our shares and for scalpers to exit this full lot.
Next we had a familiar principle again: shallow pullback on decreas-ing volume. This suggests that it is still reasonable to expect a continua-tion of the uptrend. In this situation, traders raised their stop to breakevenafter selling a portion of their shares.
Resistance broke, and we looked for a price spike/volume spike toexit into. We were able to hold the trade near the $241/2 level, where thesecond square on the chart (exit point 2) shows the area of exit.
Notice what happened at the $241/2 level again. It had a shallow pull-back, and volume decreased a bit. Then the stock price formed a littleshelf and then broke higher once again. By exiting, I missed out onanother 11/2 points, but the trade was traded based on principles that tellme when to exit. Those who are better holders of a stock than I am couldfollow the same principles and exit on the next spike between $251/2 to$26. Eventually the trade got too long for my time. My intuition does notlast long for each trade, and it’s tough for me personally to hold a stockall day when the stock action and the principles of tape reading are tellingme to exit.
PART THREE Practical Examples 225

E X A M P L E 2 5
Capitulation
Figure EX25 is a 2-day, 5-minute chart. Capitulatory selling is repre-sented by the first two vertical price bars at the open on February 14. Whydidn’t I try to go long near $32.75? After all, there was fast selling, somesupport in that area, and so on. In fact, this was just one of those intuitiveresponses. I didn’t believe that this was the area that would give a solidreversal for quick profits. And I was proved correct. I looked for some-thing closer to $32. You can see some congestion and support from theprevious day in this area. If we got faster selling into this level, then Iwould be far more confident of the stock’s probability to reverse. As youcan see, the reversal occurred right at $32 and gave an entry signal on buy-ing into contraction.
As the stock broke $32.20 (the small range high from $31.95), I feltit had a better chance to get some profit potential. So the entry was either:
1. Wait for contraction of fast selling into support (normally only aggres-sive traders do this).
2. Wait for $32.20 to break and go long (get confirmation, but fight forshares).
I chose the second option. Now that I had entry, I needed an exitstrategy. You can see again from the previous day that there was resis-tance at just above $33, and this should provide resistance on the day ofthe trade. Also, on that first round of faster selling into $32.75, we gotsome support and then failure. On the principle that what was supportshould become resistance, we wanted to exit from this area with at leastpartial profits.
You can see that when the stock broke above $32.50, some verticalprice movement began into $32.75, where it was smart to exit at least aportion. I did just that. Scalpers might be out in full.
As we pulled back from that resistance just under $33, we held$32.45 pretty well. We then wanted to trail our stop to at least breakevenand use a confidence level on the remaining shares. As we moved backinto $33 and failed one more time, this was where I wanted to exit anotherquarter of my shares.
Exiting in full is reasonable as well because your profit is locked inand you have no worries from there. In this case resistance at $33 provedto be too strong, and my trailed stop at $32.35 was hit and taken.
226 PART THREE Practical Examples

227
FIG
UR
E
EX
25
Capitula
tion. (
RealT
ick
gra
phic
s are
use
d w
ith p
erm
issi
on o
f Tow
nse
nd A
naly
tics
, Ltd
.)

Lessons from this example include the following:
1. Faster selling into support from the previous day and intraday is a goodarea to look for a reversal.
2. Look at resistance levels from the previous day and intraday to deter-mine some upside targets.
3. Look for price/volume action into these areas to begin to exit in full orscale out.
4. If you scale out, bring a trailing stop to establish a confidence level.
5. Scale out more at the next resistance level, if you have enough remain-ing shares.
6. Let the rest ride and see where it can go with a stop no worse thanbreakeven, and hopefully somewhere higher.
7. Eventually you will hit a resistance level, at which point the NDXdoesn’t help your position confidence, so you can exit in full there.
228 PART THREE Practical Examples

E X A M P L E 2 6
Open-Low–Break Setup
For the situation illustrated in Figure EX26, we had a range of $43.15 orso to $43, and liquidity was good. The break of $43 gave confirmation ofa downtrend signal. The stop was placed above the open high at $43.25.If there was to be a higher-probability downtrend trade, then the stockshouldn’t go over.
There were two possibilities for entry:
Before the breakdown, ensuring an easy fill, but with no confirmation.
After the breakdown, with confirmation, but with a more difficult fill.
I chose the first simply on aggression in the downtrending market.The NDX 1500 area was holding as support, but there was no major sell-ing. Our tape-reading principles suggest that slower selling into supportgive us less chance of a rebound; rather we would hit congestion and seenew lows. The quick premarket gap higher faded into the open, meaningthat sellers put pressure on the buying and moved the market lower. So Iwas on a more short focus for open-break trades.
Broadcom Corporation (BRCM) had a good open range shown bytwo lines on the chart. I went in aggressively with a short at above $43before the trigger, which was based on all the above. Had it hit $43.25, I’dhave taken my stop with no regret because my aggression would havebeen justified and my reasoning was sound.
Let’s now move to the exit strategy.You can see the three circles on the chart of where I partialled out. I
used tape-reading principles of faster selling to cover, which made it eas-ier to get a favorable fill. This action doesn’t necessarily get you the bestprices, but you can be assured of an easier fill. In this case, as we movedinto $42.60 on the longer black bar, I took half my shares off to lock inprofits.
I’m not usually looking for more than a 2:1 reward/risk ratio on opentrades, so this trade offered a bit more than my normal profit targets. Also,with half my shares locked in on profit, I wanted something nearer the $42area. This was not based on “guessing,” but rather from the previous day’ssupport. I saw faster selling into this area, so I partialled out another quar-ter of my position, keeping a fair cushion from my entry to see if I couldride the other quarter a bit longer.
This was a purely aggressive judgment call. Taking all the remain-
PART THREE Practical Examples 229

230
FIG
UR
E
EX
26
Open-low
–bre
ak
setu
p. (
RealT
ick
gra
phic
s are
use
d w
ith p
erm
issi
on o
f Tow
nse
nd A
naly
tics
, Ltd
.)

ing shares into that round of selling was perfectly valid, too. I felt that Ihad the overall trend with me, that I had BRCM action with me, and thatit was worth holding on another quarter of my shares for movement under$42.
I then had a quarter of my shares left. It was now time to make a con-fidence level. This is different from a trailing stop, which means that ifyou hit the stop-loss level that the trade is exited at, take the stop. A con-fidence level means that if you hit the confidence level, you’re less confi-dent in seeing better prices in the prevailing trend.
I judged the confidence level based on retracements. You can seehow BRCM held at above $42 and went to $42.60 before backing offagain. If we were to go over $42.60, we would show a higher high, andI’d be less convinced that we would see a lower low. So instead of takinga stop here, I used the next round of selling under $42.60, and my stop wasat breakeven. Then I tried to get a better fill somewhere under $42.40 forthe remaining shares.
The risk is that you get a breakeven stop. The reward is that you geta better price under the confidence level for more profit. This is yourdecision.
You can see how this level held well enough to give us a move atunder $42, which is what I wanted for the remaining quarter of myposition.
The tape-reading principle of faster selling is shown on the chart atthe circle—the one with the vertical price bar that is labeled 3. On the vol-ume chart, you can see the volume spike to the sell side. These two thingscombine to say to “cover it all.”
My target profits were met. I had confirmation according to tape-reading principles, so I took my profits and moved on. And, by doing so,I missed out on nearly 1 point more in potential.
Do I care? I don’t. I played the trade as well as I could within mysystem. So I’m happy with my assessment, my aggressiveness, my scal-ing out to lock in profits, and my final exit on my remaining shares.Everything was in sync for this trade, so I have no reason to regret missedprofits.
PART THREE Practical Examples 231

E X A M P L E 2 7
Fading Breakout
This example on Adobe Sytems (ADBE) describes how to fade the break-out setup. Again, to fade a setup is to initiate a position contrary to whatthe setup should bring in profitability. You will see how volume indica-tions on this setup offer a higher probability for a short setup than a longsetup on the break of resistance from the open. Thus fading the long setupmeans initiating a short position after the failed breakout of the resistance.(See Figure EX27.)
In the chart, the resistance is clearly marked from the open high atthe $37.50 level, which leads to a move into support near $36.70. Fromthis support, a reversal forms and moves the stock back up to the $37.50level. Quite often, 30-minute highs will form a significant level thattraders key in on for watching for some kind of reaction from the market.
232 PART THREE Practical Examples
F I G U R E E X 2 7
Fading breakout. (RealTick graphics are used with permission of Townsend Analytics, Ltd.)

In this case, the stock trapped the buy-side players and rewarded the short-side players.
As the stock moved higher into the $37.50 level, you can see volumeindications that showed a steady buy-side slant. Near the 10:30 a.m.period, however, volume began to increase, and eventually the volumespike corresponded with a price spike. Tape-reading principles suggestthat minority action is slow and stable and that majority action is erraticand unstable. Given the increase on the buy side in relation to the volumeas well as the price increase being more vertical into resistance, there ishigher probability for the breakout to fail on that retest. Traders want slowand steady buy-side volume into resistance because it shows good sup-port. A volume increase and a price spike into resistance show that theprobability is higher for the buying to have been exhausted and that therewon’t be enough buying on the break of resistance to keep the stock mov-ing higher for profitability.
This leads traders to fade the breakout in the hope of seeing thebreak of resistance trap more buyers with unsustainable upside movementresulting from exhaustion buying. Traders initiate a short position on thebreak of the resistance and look for the trade to move back below theresistance point for better confidence. Traders then look for a break of themost recent support to confirm that the downtrend is intact from that fadedbreak. This support level in the ADBE example would be around $37.30.
This is regarded as support from the level that paused briefly beforereaching back over the 30-minute highs. Scalpers who wish to initiate a1:1 reward/risk ratio for this trade would look for a cover into this supportwith a stop at the high of the level from which the trade would be fadedor shorted into. Those traders who wish to scale out of the position wouldthen exit a portion of their position into this support level and trail the stopto breakeven levels. If the position were to break this $37.30 level, traderscould then begin to pick out their next support target based on the previ-ous price action and to look for an exit on the remaining position. In thiscase, we would see support at the $37 level. Unfortunately, the stocknever got that low and moved back into resistance, where the remainingportion of the trade would be exited at breakeven levels.
PART THREE Practical Examples 233

E X A M P L E 2 8
Short of the Range Resistance
This example of Brocade Communications (BRCD) illustrates tradingwithin a range. Tape-reading principles within the range show why takinga short position into the resistance level at the early range was a higher-probability setup rather than initiating a long position looking for abreakout.
On the day of the trade (See Figure EX28) the stock was in an after-noon downtrend on good volume consistency, showing that the near-termprice action was suggesting more downside ahead. Given that the stockgapped up the next morning into the previous day’s resistance level com-bined with the previous day’s afternoon price action, we would be look-ing for a short setup from the open. Having missed the early entry on theopen-break play at $26, we were forced to wait for a range to form in
234 PART THREE Practical Examples
F I G U R E E X 2 8
Short of the range resistance. (RealTick graphics are used with permission of Townsend Analytics, Ltd.)

order to assess the action within the base to determine if shorting the tradewas still a good possibility.
As we watched the range forming from $25.75 to $26, we saw thatany move back into resistance would be associated with higher volume.The tape-reading principle of large buy-side volume associated with noincrease in price suggests distribution and a resistance level. In this case,traders want to initiate a short position within the range at or near theresistance level with a stop right over that range or at the most recent high,depending on their risk tolerance. Regardless of the risk tolerance, anybreak over resistance from this point would make it less likely for us toexpect a break of the low. Therefore, our exit strategy for a stop loss mustbe more focused.
Once entry was taken on the short side at the nearest point to $26,our exit strategy for profitability became important. We had our stop-lossstrategy in place, so our profit exit strategy was our focus. In order to gainan idea of where we could exit in full or scale out, we needed to look atthe most recent support levels. The first idea that we had for exit wasderived from the principle that gaps tend to be filled. If this was the case,then being able to scale out along the way down to the previous day’sclosing price at $25.30 would be our target. If we were looking to be moreconservative in our profit objectives, then the previous day’s most recentsupport area near the $25.45 level would be our target. This was againbased on the principle that what was resistance would now serve as sup-port. The previous day showed a move into the $25.45 level at about 2:45p.m., or 14:45 on the chart. This level should get support on the openretracement.
Now that we had our targets selected, it was important to use ourtape-reading principles to aid us in determining just exactly when it wastime to exit. Again, as the stock moved, as long as it was stable and steadyin volume indications associated with a gradual descent in price move-ment, we were confident that we could hold for better profits. As soon asthe trade became more erratic, where the price dropped fast or the volumerose precipitously, then it was time to exit in full or scale out of the posi-tion. In this case, our profit objective wasn’t met because the faster sell-ing phase of the breakdown occurred almost immediately into $25.60.However, by utilizing an entry into resistance near $26, we provided our-selves with a profit cushion that we wouldn’t have had if we had waitedand entered on the setup trigger. This goes back to an entry strategy thatis based on your own aggressiveness and risk tolerance. By entering intoresistance, we assured ourselves of a good entry with a full position, butwe gave up the downtrend confirmation, thereby making us less confident
PART THREE Practical Examples 235

about the trade. If we had waited for actual confirmation, we would havegiven up our profit cushion, but we would have been sure that the down-trend signal was valid.
As it turned out, the trade never got to the desired level, and thosewho were looking for a 1:1 reward/risk ratio type of profit were happyenough to exit into the $25.60 level. Those who were looking to scale outhad to take at least a breakeven exit on any remaining shares. However,the example does a good job of illustrating volume indications during therange-formation process to dictate an entry and then to show us the exitpoint based on the faster selling associated with the price drop the $25.60level.
236 PART THREE Practical Examples

E X A M P L E 2 9
Open-Low–Break Setup
This example (See Figure EX29) illustrates an open-low–breaksetup in which we initiated a short-side entry on the break of both the openlows and the previous day’s support area. The reasoning behind the short-sided entry was based on the previous day’s action into the close as wellas the NDX indicator moving into a larger resistance area overall. We sawa series of lower lows into the close after a nice uptrend throughout theday. A possible pullback was in the cards, which, while profitable, wasn’ta huge reward/risk type of trade and would be one for traders who makelarger-sized trades and look for smaller profits. Those looking to scale outof this type of trade would most likely be stopped out at breakeven on theremaining profit.
PART THREE Practical Examples 237
F I G U R E E X 2 9
Open-low–break setup. (RealTick graphics are used with permission of Townsend Analytics, Ltd.)

The entry was taken on this trade after an open range consisted ofthe support from the previous day at $19.90 and the day of the trade’s highof $20. Once we were unable to break over $20 on the open and thenbroke the previous day’s support as well as open support, the short sideshould have been taken for a position with a stop at the break of the openhigh. Once the entry on the short side was filled, we needed to look for aprofit strategy based on the previous day’s support levels. In this case, wehad a support level near $19.50. If the trade had begun to move into thisarea, we wanted to be looking to exit in full for smaller profits on a largershare size.
In this example, we wanted to be aware of the majority action behav-ior. In this case, we saw faster selling into $19.60. This was illustrated bythe more vertical price movement to the downside associated with the vol-ume increase on the sell side. Given that we were seeing exhaustion on thesell side, it was time to cover into that faster round of selling for a quick2:1 reward/risk ratio or less. In this example, the $19.50 support levelgave us an area in which to look for erratic behavior, indicating majoritybehavior. Once we saw this type of action moving the stock into the$19.60 area, it was time to enter the cover order and look for a fill to exitthe position in full.
We see on this chart that after the open faster selling, the stockrecovered and moved back to the entry level, showing that any remainingshares had a lower probability for profitability and would have been exitedat no worse than the breakeven level.
238 PART THREE Practical Examples

E X A M P L E 3 0
Open-Low–Break Setup
This is an example of an open-low–break short setup on F5Networks, Inc. (FFIV). It leads to a good reward/risk ratio, but it alsoshows a degree of missed potential because of traders taking faster prof-its at higher levels. (See Figure EX30.) The open range was from $20.30to $20.55 (shown by two lines). Once the stock began to lose the $20.30level, a short position was initiated with a stop at the high of the range,$20.55.
Given that we had our stop-loss strategy in place, we needed to belooking for areas of exit based on our risk tolerance. If we wanted to takefaster profits for a 2:1 reward/risk ratio or lower, we would have looked
PART THREE Practical Examples 239
F I G U R E E X 3 0
Open-low–break setup. (RealTick graphics are used with permission of Townsend Analytics, Ltd.)

for faster selling into the $19.75 level. The stock shows erratic behavioron the sell side, and thus a good area to exit the trade. At 9:45 a.m. we sawan increase in sell-side volume and a more vertical movement to the$19.60 level, offering the opportunity for covering into that level withnear the 2:1 reward/risk ratio.
Traders who were looking for something more substantial out of thetrade would be looking for faster selling under that $19.60 support.Should this $19.60 level have been broken to the downside, we wouldhave brought our stop to breakeven levels once we began to scale out ofthe trade. In this case, we had some faster selling into the $19.30 area; thiswas associated with the little volume spike just before 10:15 a.m. As weheld this level, what we should have done and what we did were two dif-ferent things.
By rights, traders should have brought their confidence level to theretracement highs at $19.75 and looked for a break of the support near$19.30 for a downtrend continuation signal. Instead, at the second test ofthe $19.30 level that held, the exit in full was taken.
What happened next was that the trade made a lower high, broke thesupport level near $19.30, and then hit a capitulatory movement, taking itto the $18 level, which made the exit near $19.30 seem somewhat foolish.
Hindsight can be quite a killer sometimes. However, don’t let it deteryou from trading on your discipline. I firmly believe that for every missedprofit like this one, there are 10 other trades where you are happy enoughto have taken the profit when you did and actually increased your accountover time rather than waiting for trades with bigger profits. Essentially,take the home runs when you can, but don’t beat yourself up about miss-ing a few. One trade should never make or break your account. Trading isa sequence of events that slowly builds your account up over time.Missing big profits here and there won’t or shouldn’t affect you much.
240 PART THREE Practical Examples

E X A M P L E 3 1
Drop-Base–Implosion (DBI) Setup
This example illustrates a solid downtrending stock on Medimmune(MEDI) after the 30-minute lows were broken. (See Figure EX31.) Thissituation is described as the DBI setup in earlier chapters and examples.Because we have discussed this setup many times, we left all the levelsand points of reference on the chart unmarked. So it is up to the reader toidentify them.
We essentially had a tight base near the $26.30 support level, which,when broken, offered the short setup trigger. The base formed was thesupport at $26.30, and resistance was just above $26.40. In this case, withbarely a 10-cent stop-loss range and the stock being liquid enough, traderscould utilize a larger position size because the stop level was smaller com-pared to other trade setups that normally show a 25- to 30-cent range.
PART THREE Practical Examples 241
F I G U R E E X 3 1
Drop-base–implosion (DBI) setup. (RealTick graphics are used with permission of Townsend Analytics, Ltd.)

Once the trade setup was triggered on the break of support, with astop loss in place, we needed to look for a profitable exit strategy. In thiscase, with a 10- to 15-cent stop-loss risk level, a simple move into $26.10to $26.15 would yield a scalper’s exit with a 1:1 reward/risk ratio.According to tape-reading principles, majority action tends to be moreerratic than minority action, so we looked for faster selling into this level.You can see on this chart that we got faster selling to $26.10 and then areverse back into resistance.
The important aspect of this behavior is that, on the retracementback into the highs, volume stayed relatively light and the trade wasunable to break back over the $26.30 level with any conviction. The prin-ciple that what was support should now act as resistance held true, as the$26.30 support level was behaving as a resistance level, and the down-trend was still intact. Those traders who were unable to get a profitableexit on the first move into $26.10 now had a second chance as we saw thetrade move lower to $26.
Movement to $26 showed a sharper price drop, which offered plentyof opportunity to exit for those looking for smaller profits on a full exit ofthe position and who were unable to exit earlier. Next we saw anothertight base at the $26 level that tried to retrace and moved back to $26.10,which was former support that was then serving as resistance. This againshowed that the downtrend was still intact and those traders who wereholding for higher reward/risk ratios were safe to hold while looking fora move under $26 to scale out. What we saw next was a more verticalprice drop with a volume increase to $25.75. This was where traders wereable to scale out at least half their original position. Once this profit wastaken, it was important to begin a trailing-stop and confidence-level strat-egy. In this case, we had a $26.10 resistance, which was the level thatserved as a distribution point off the $26 support. This would be our trail-ing stop. Then we had our $26 support area that was broken and whichoffered a move to $25.75 where traders could begin scaling out. If thetrade were to retrace back over $26, then we would be less confident thatthe trade could continue lower. So we would use the next round of sellingunder $26 to exit the remaining shares.
The next part of this trade shows how a plan well made is often notwell executed. It happens to the best of us. In this case, we saw a littlebreak of $26.10, in effect, taking our trailing stop. After the trailing stopon the rest of the position was taken, we could see that the support at$25.75 was taken out, and faster selling to $25.60 was offered for greaterprofitability. However, as our trailing-stop discipline took us out of thetrade, we were unable to grab that extra profit.
242 PART THREE Practical Examples

One important point on this is that you shouldn’t let the outcome ofone trade alter your trading discipline. One trade does not make a system,and, while this trailing stop didn’t allow for greater profits, over time,sticking to your discipline will save you from disasters. It’s the aggregateresults that matter, not one trade.
PART THREE Practical Examples 243

E X A M P L E 3 2
Cup-and-Handle Setup
The situation shown in Figure EX32 is another good example of a cup-and-handle setup, this one on KLA-Tencor (KLAC). We saw the stockbasing nicely through the lunch period. Then at around 2 p.m. it began toform the start of the cup. During the retracement of the cup, we saw thevolume begin to pick up a little. Normally, we would want the activity todie down when it forms the bottom of the cup. But this is art, not pure sci-ence. Learn to look at imperfect setups as opportunities.
Once we got our cup formation, we moved right back into the resis-tance at just above $43. From this resistance, we saw a small, narrow baseformed at above $43. This was the handle that eventually led to the long-side trigger entry. In this case, the entry was taken at no higher than$43.25 with a stop at $43, the bottom of the handle range. Again, volumeindications suggested that our uptrend was intact as it increased as thestock increased. When we began to see euphoria as defined in our tape-reading principles, we had to begin to partial out. In this case, we saw alittle spike just before 3 p.m., the 15:00 time period, into $44. This waswhen we needed to take at least half our position in profit.
Then we saw the volume spike at about 3:10 p.m. coincide withresistance at $45. This was when we needed to decide whether to take aquarter of our position or exit in full. The decision to exit in full was, inhindsight, not the best exit. However, deciding while things are happen-ing and reviewing a chart are two different things. The trade still gave agood $1.75 per share on that last half of the position.
Those who held the quarter of the shares left, needed to trail theirconfidence and stop levels. In this case, with the pullback from $45 into$44, we would then place a stop at breakeven and a confidence level at$44. If the stock broke $44 again, then we would have to use the nextround of buying to exit the remaining shares. If we couldn’t get this buy-ing, then we would exit somewhere between $43.25 and $44, dependingon the action. In this case, we made a base at the close, so that we couldexit under $46 or decide to hold the remaining portion overnight to see ifthere would be a gap up the next day to sell into at a price higher than $46.These are each valid decisions that need to be made as we see these vol-ume/price correlations throughout the trade.
244 PART THREE Practical Examples

245
FIG
UR
E
EX
32
Cup-a
nd-h
andle
setu
p. (
RealT
ick
gra
phic
s are
use
d w
ith p
erm
issi
on o
f Tow
nse
nd A
naly
tics
, Ltd
.)

E X A M P L E 3 3
Cup-and-Handle Setup
This example of Intersil (ISIL) is a cup-and-handle setup. (See FigureEX33.) As we watched this trade from the opening, we saw stable sellingto about $17, and then what we call a rinse effect happened on the breakat $17. A rinse effect is when a stock barely moves out of the risk para-meters, which takes traders out of their positions, and then the stockresumes the desired movement, after the traders take their stop loss. Wesaw sharp movement, which could be characterized as a minicapitulation.After this occurred, the stock regained its foundation and then movednicely back to the $17.45 resistance area. The action from $17.45 to$16.80 and back to $17.45 formed the cup of this trade. The handle, rep-resented by the two diagonal lines, showed a base forming near the $17.45resistance.
246 PART THREE Practical Examples
F I G U R E E X 3 3
Cup-and-handle setup. (RealTick graphics are used with permission of Townsend Analytics, Ltd.)

What was happening was a blow-off event followed by a well-sup-ported reversal. Aggressive accumulation was happening in this case, asthere were hardly any pullbacks on the way back into resistance. Once wereached resistance, the bullish resolve was about to be tested. We knewthis because a base from about $17.35 to $17.45 was formed. The bullswere still in charge. A break of $17.45 would confirm the handle part ofthis formation as a good breakout trigger. We saw the breakout at $17.45,and this moved the stock to $17.85 or so. Upon seeing this breakout,traders would have entered prior to the trade setup trigger with a stop at$17.30 or on the break of $17.45 and hoped to get filled on their full sharesize.
As the trade began to get euphoric, meaning that there was a panicon the buy side as shown in the vertical price movement associated withthe volume increase, we would look to exit into this at least partially. Inthis case, an exit above $17.75 would be the most likely on at least halfthe position. A confidence level would then be placed at just under $17.45on the principle that what was resistance should now be support. If thisfailed to hold, then the rest of the trade would be exited at no worse thana breakeven level if we saw enough buying back at over $17.45. If thetrade fell deeper, then it would be exited at $17.35 on the remainingshares, cutting into the profits we made on the first half of the position.You can see that the latter case occurred, and we were forced to exit theremaining shares below $17.45 as the stock hit our stop price of $17.35 at11:45 a.m.
You can also see that it was wise to take the stop as this stock con-tinued lower into the close and would have wiped out all our gains had wenot stuck to our stop-loss management.
PART THREE Practical Examples 247

This page intentionally left blank.

G L O S S A R Y
ARCA (Archipelago) Very popular so-called active ECN. It not onlyposts trader bids and offers but also actively works orders by tryingto match them with those of other ECNs and market makers.
Black Box A nondiscretionary system that allows an individual to tradeentry and exit signals without understanding why those signals aregiven.
BTK Biotechnology index.Decimalization Switch of the increments of price from fractions to deci-
mals. It limited volatility to a certain degree. It had a big impact onscalping strategies. Before decimalization, stocks were trading in1/16–1/8 increments, which equaled 6 and 12 cents, approximately.
ECN (Electronic Communication Network) ECNs allow traders to posttheir own bids and offers to a central order book to provide liquidity.Instinet was the first of them. During the market boom of the late1990s, many new ECNs appeared.
ISLD (Island) One of the biggest and most popular day trader ECNs. Itprovides great liquidity and lightning speed.
Level 2 Presentation of Nasdaq data in the form of a box containing color-coded bids and offers posted by market makers and ECNs. For awhile, Level 2 was described as a tool offering retail traders oppor-tunities equal to those of market makers. It became less significantwith the introduction of decimalization in the spring of 2001.
NDX Nasdaq-100 index.SelectNet Order-routing system which allows traders to negotiate their
orders with market makers electronically. With the introduction ofSuperSOES in 2001, it has lost its role with retail traders.
SOES (Small Order Execution System) For a while this system was amajor weapon of day traders, allowing them to execute their ordersagainst market makers with lightning speed. After some rule changesit lost its significance. It was replaced by SuperSOES in the summerof 2001.
SOX Semiconductors index.Times & Sales (T&S) Presentation of Nasdaq data in the form of
scrolling; trades are usually color-coded. Shows size, price, and timeof each trade.
249
Copyright © 2004 by GST Captial Group, LLC. Click here for terms of use.

This page intentionally left blank.

251
I N D E X
Accumulation/distribution relationship,95–106
decreasing volume reversal and, 102–103euphoria/capitulation and, 96–99passive accumulation/distribution and,
103–106practical example of, 146–150shallow retracement trend confirmation
and, 101–102trend beginning and, 99–100trend confirmation and, 100–101
Adages, negation of, 67–72ADC Telecommunications, 206–208Adobe Systems, 232–233Adtran Inc., 223–225Aggressive method of entry, 110Alpha Industries, 158–161AOL, 146–150Applied Micro Circuits, 193–195Average winner/loser, in trading journal,
31–33
Baruch, Bernard, 67Blown stops, 7Breakout trades, 117
cup-and-handle, 130, 133, 223–225,244–247
fading, practical example of, 232–233Bre-X, 11–12Broadcom Corporation, 229–231, 237–238Brocade Communications, 234–236Buy low, sell high idea, dangers of, 69–70
Capital, trading, amount to risk, 66Capitulation, practical examples of,
158–166, 171–172, 174–175,226–228
Capitulation sell-offs, 117–118Capitulation setups, 130, 134, 135Capitulatory stage of trade movement, 96Charting, of trading account, 29–30
trading journal and, 30–33uses for, 33–35
Cisco Systems, 154–157Confidence, developing through experi-
ence, 20–24Confidence levels, 91
practical example of, 217–220stop losses and, 121–122
Conservative method of entry, 110–111Consolidations:
multiple, 142time factor and, 142
Converse Technology, 214–216Corvis Corporation, 189–192Cup-and-handle breakout setups, 130, 133
practical examples of, 223–225, 244–247
Decimalization, 17Detachment, need for, 52–53Developing traders, 52–53, 56, 60Direct-access brokers, 15–16, 57–58Distribution, accumulation and (see
Accumulation/distributionrelationship)
Double-bottom scenarios, 143Double-top scenarios, 143Drop-base–implosion (DBI) setups, 124, 129
practical examples of, 167–170,193–195, 198–200, 206–208,214–216, 241–243
Early speculators, 67–68ECN arbitrages, 94Edge, finding, 72–74Electronic Communications Networks
(ECNs), 100Emery, Henry, 67Employee Solution, 6–7Emulex, 65Entries:
finding in strong trends, practical exam-ple of, 176–179
methods for, 109–113on pullback, practical example of, 151–153
Copyright © 2004 by GST Captial Group, LLC. Click here for terms of use.

252 Index
Euphoria, practical examples of, 172–175
Euphoria stage of trade movement, 96Expanding trading range, 141–142Experience:
for finding edge, 73learning through, 20–24need for, 47–48
Extreme Networks, 151–153
Fading breakout setups, practical exampleof, 232–233
F5 Networks, Inc., 239–240Fibonacci levels, 167Finisar Corporation, 183–185
Hain-Hain Celestial Group, 201–205
Inrange Technologies, 176–179Intersil, 246–247Intuition, 75–81
definition of, 75–76disappearance of, mantras for, 77–81traps associated with, 76–77
The Intuitive Trader (Koppel), 59
JDS Uniphase Corporation, 65, 209–210Journals, trading, 30–33Jump-base–explosion (JBE) setups, 124,
125–128practical examples of, 154–157,
201–205, 221–222
KLA Tencor, 244–245K-Tel, 21–22, 23, 24
Learning to trade:requirements for, 47–48stages in, 51–57, 60–62
Lefèvre, Edwin, 16, 59Liquidity, low, stocks with, 69Livermore, Jesse, 59, 92Losses:
bigger than profits, 70holding losing trades and, 70–71recovery following, 79
Magee, John, 24Majority, minority and, 93–95Manipulators, 11–12, 67Manugistics Group, 176–179Market, fallacy of trader’s need to know
and, 44–46Market action, risk associated with, 65–67Market makers, 53Mature traders, rules for and mindset of,
83–85Medimmune, 241–243Mental strengthening, 49–50, 51–52Mindset, 9–10, 47
of mature trader, 83–85Minority, majority and, 93–95Model trader, creating in one’s mind, 36MPIDs (market participation identifica-
tions), 158Myths, debunking, 67–72
Narrow trading range, 139–141Nasdaq:
decimalization of, 17matching chart of portfolio equity to,
33–34Neill, Humphrey B., 16–17Netiq Corporation, 162–166Network Appliance, 211–213News, perception of, stock prices and, 5New traders, 51–52, 54, 55–56, 60New World Restaurant Group, 54, 55
Open-high–break setups, 130, 131, 132Open-low–break setups, 130, 131, 132
practical examples of, 186–188,211–213, 229–231, 237–238,239–240
Overtrading, 68–69, 81Overture Services Inc., 226–228
Partialling, 118–119Peoplesoft, 180–182Perceptions:
of news, stock prices and, 5of one’s own trading, 26–27trusting one’s own, 43
Personality, traders’ application of, 50–51PMC-Sierra, 186–188Portal Software, 146–150

Index 253
Price, correlation with volume, 98Profits, losses bigger than, 70Pullbacks, 100
entry on, practical example of, 151–153
Qiao Xing Universal Telephone, 63–64QUALCOMM, 221–222
Range breaks, stop placement and, 120Range trades, 117
practical example of, 189–192Rate of volume, 92Reality traders, 53–54, 60–61Regular method of entry, 110Regular trading range, 137–138, 139, 140Reminiscences of a Stock Operator
(Lefèvre), 16, 56, 59Research in Motion, 171–175Resistance level, taking short position into,
234–236Responsibility, accepting:
intuitive trading and, 78trading for a living and, 41, 42–43
Reversal, practical example of, 211–213RF Micro Devices, 168–170Risk:
evaluation of, 64–65market action and, 65–67in scalping, 19
Risk management:importance of, 8–9profit limitation and, 63–64
Risk tolerance, 63stop placement and, 116
Rumors, 11–12
Scaling, 118–119Scalping, 16, 17–20
psychological implications of, 18–19risk involved in, 19scalp setups and, 18tools and methods of reading and, 18
Scared money, 25Scenarios, using to improve trading, 46–47Setups, 107–113, 123–136
capitulation, 130, 134, 135with consolidation, time factor and, 142cup-and-handle, 130, 133, 223–225,
244–247
Setups (Cont.):drop-base–implosion, 124, 129,
167–170, 193–195, 198–200,206–208, 214–216, 241–243
entry methods and, 109–113fading, 232–233jump-base–explosion, 124, 125–128,
154–157, 201–205, 221–222open-break, 130, 131, 132, 180–182,
183–185, 229–231, 237–240trader’s action when signals are gener-
ated and, 135–136Shares, number to trade, 8–9Short of the range resistance, practical
example of, 234–236Shorts, 71Siebel Systems, 217–220Smart money, 17SOES (Small Order Execution System), 94State of mind, intuitive trading and, 78–79Stocks:
gathering information about, 43–44with low liquidity, 69movement of, 24
Stop losses, 25–27, 80, 115–122blown, 7confidence levels and, 121–122factors determining placement of, 115initial placement of, 116–118practical example of, 196–197risk tolerance and, 116stop trailing and, 118–121trailing, 118–121, 217–220
Striving traders, 53Strong trends, finding entries in, practical
example of, 176–179Systems, limitations of, 41, 43
(See also Tape reading trading system)
Tape-Reading & Market Tactics (Neill),16–17
Tape-reading trading system, 89–106accumulation/distribution relationship
and, 95–106limitations of, 89–90majority versus minority and, 93–95overview of, 90–91tape-reading principles and, 91–92
Teaching, satisfaction of, 57–59Technical analysis (TA), 107–108Technical Analysis of Stock Trends (Magee), 24

254 Index
Trade movement:capitulatory stage of, 96euphoria stage of, 96
Trades:losing, holding, 70–71number to make, 68–69outcome of, as reflection of trader, 8recording number in trading journal, 31significance place on single trades and, 7–8
Trading, seeing as a fight, 9Trading capital, amount to risk, 66Trading for a living, 37–48
accepting responsibility for one sactions and, 41, 42–43
need to learn and, 38–39systems and, 41
Trading journals, 30–33Trading ranges, 137–142Trading within the range, practical example
of, 189–192Trailing stops, 118–121
practical example of, 217–220Trans Texas Gas, 20–21Trends:
continuation of, practical example of,209–210
Trends (Cont.):movement in the channel, stop place-
ment and, 120–121strong, finding entries in, practical
example of, 176–179(See also Accumulation/distribution
relationship) 20-period moving average (20MA), 167
Uncertainty, 45–46
Veritas Software, 198–200Volume, correlation with price, 98
Winners, allowing to run, 80–81Winners/losers ratio, in trading journal, 31
Yahoo!, 154–157, 196–197
Zeldovich, Yakov, 50

A B O U T T H E A U T H O R S
Vadym Graifer emigrated from the former USSR during the transitionto a capitalist economy when increased, unwanted Mafia involvement inbusiness affairs made day-to-day living more difficult. After fleeing theformer USSR, he settled in Canada and chose stock market trading as aprofession in his new society. He lost 75 percent of his trading capitalbefore discovering the principles of tape reading, which allowed him tobecome a successful trader, providing a better life for his family in a muchsafer environment.
Graifer has expanded his professional career and has become a full-time professsional trader, mentor, and author of the online book Job-Daytrader. He is also the founder of RealityTrader.com, a privatementoring service that includes online education and communication of thetape-reading principles, methods, and techniques that he uses every day.
Christopher Schumacher is the CEO of GST Capital Group, LLC.He is a professional trader, and as a private trading mentor forRealityTrader.com, he trains traders from all over the world. He writes adaily column for TheStreet.com’s RealMoney financial Web site and is afeatured trading expo seminar speaker. He is a published author and hasgiven guest lectures at The Ohio State University’s Fisher College ofBusiness as well as offered his knowledge and market views in otherfinancial media, such as Yahoo! FinanceVision, E*Trade financial pro-gram “The Edge,” AOL MarketTalk, Multex, TraderInterviews,Chartpoint magazine, and Innerworth.
Schumacher resides in Columbus, Ohio, and in addition to his pro-fessional career, he enjoys volunteering his time teaching soccer to 4- to6-year-olds, running in charity events, and being involved in the lives ofhis two step-daughters, Maggie and Katie.
255
Copyright © 2004 by GST Captial Group, LLC. Click here for terms of use.