Embed Size (px)
Citation preview

Adhesion and Microleakage of CAD/CAM Crowns
Using Self-adhesive Resin Cements
by
Mohamed Mahmoud Mohamed Mahmoud Kandil
A thesis submitted in conformity with the requirements
for the degree of Doctor of Philosophy in Dentistry
Graduate Department of Dentistry
University of Toronto
© Copyright by Mohamed Mahmoud Mohamed Mahmoud Kandil (2015)
ii
Adhesion and Microleakage of CAD/CAM Crowns Using
Self-Adhesive Resin Cements
Mohamed Mahmoud Mohamed Mahmoud Kandil
Doctor of Philosophy in Dentistry
Graduate Department of Dentistry
University of Toronto
2015
Abstract
Ceramic and composite resin CAD/CAM restorations were introduced as indirect
restorative materials that combine high esthetics and superior mechanical properties.
However, an important requirement for successful function of these restorations is
adequate adhesion between the restoration and tooth substrate. Several factors affect the
adhesion of these restorations to the underlying substrate. The aims of this in-vitro project
were to analyze some of the factors that can influence adhesion of lithium disilicate
ceramic and composite resin CAD/CAM materials to different substrates and to develop
more reliable adhesion testing methodologies.
This project consisted of four parts. The first part aimed to develop new
microtensile bond strength testing methodology and to evaluate the effect of the resin
cement, crown material and bonding substrate on the microtensile bond strength between
CAD/CAM crown materials and different substrates. Results indicated that all three
variables significantly affected mean microtensile bond strength.
The second part aimed to modify the current microshear testing methodology and
to evaluate the effect of the resin cement, crown material and bonding substrate on the

iii
microshear bond strength between CAD/CAM materials and different substrates. Results
indicated that the type of resin cement and substrate significantly affected the mean
microshear bond strength. Crown materials had no significant effect.
The third part aimed to develop a methodology to measure the retention strength
of CAD/CAM crowns to the underlying substrate and to evaluate the effects of the resin
cement, crown material and bonding substrate on the retention strength. Results indicated
that all three variables significantly affected mean retention strength.
The fourth part aimed to test microleakage at the interface between CAD/CAM
crown materials and tooth substrate and evaluate the effects of the resin cement and
crown material on the sealability of the bonding interface. Results indicated that only the
cement had a significant effect on microleakage.
In conclusion, etch-and-rinse adhesive resin cement provided better bond strength
and retention strength and adhesive-interface sealability when used with lithium disilicate
and composite resin CAD/CAM crown materials. Furthermore, the bonding substrate had
an effect on adhesion;unrestored teeth provided better retention than teeth restored with
composite resin and amalgam.

iv
Table of contents Chapter 1 Introduction and Literature Review ........................................................................... 1 1. Introduction ...................................................................................................................................... 2 2. CAD/CAM Technology .................................................................................................................. 4
2.1 Brief history............................................................................................................................... 4 2.2 Advantages of CAD/CAM technology .............................................................................. 8 2.3 Limitations of the CAD/CAM technology ....................................................................... 9 2.4 CAD/CAM materials ............................................................................................................... 9
3. Bonding of Non-metallic CAD/CAM materials ................................................................. 12 3.1 Adhesive systems ................................................................................................................. 13 3.2 Resin Cements ....................................................................................................................... 17 3.3 Surface treatments and adhesion .................................................................................. 23
4. Adhesion testing .......................................................................................................................... 26 4.1 Microtensile test ................................................................................................................... 26 4.2 Microshear test ..................................................................................................................... 28 4.3 Retention Testing ................................................................................................................. 29
5. Microleakage ................................................................................................................................. 32 Chapter 2 Rationale and objectives .............................................................................................. 34 1. Statement of the problem ......................................................................................................... 35 2. Objectives ....................................................................................................................................... 36 Chapter 3 Microtensile bond strength of self-adhesive resin cements to non-metallic crown CAD/CAM materials, composite and dentin ................................................................ 38 1. Abstract ........................................................................................................................................... 39 2. Introduction ................................................................................................................................... 40 3. Materials and Methods .............................................................................................................. 43
3.1 Materials .................................................................................................................................. 43 3.2 Methods: .................................................................................................................................. 43
4. Results.............................................................................................................................................. 64 4.1 Comparison between resin cements ............................................................................ 64 4.2 Comparison between Substrates: .................................................................................. 73 4.3 Comparison between CAD/CAM materials ................................................................ 83 4.4 Modes of failure .................................................................................................................... 89
5. Discussion ....................................................................................................................................... 94 6. Limitations of the study .......................................................................................................... 102 7. Conclusions .................................................................................................................................. 102 Chapter 4 Microshear bond strength of self-adhesive resin cements to non-metallic crown CAD/CAM materials, composite and dentin .............................................................. 104 1. Abstract ......................................................................................................................................... 105 2. Introduction ................................................................................................................................. 106 3. Materials and Methods ............................................................................................................ 108
3.1 Materials ................................................................................................................................ 108 3.2 Methods: ................................................................................................................................ 108

v
4. Results............................................................................................................................................ 126 4.1 Comparison between resin cements .......................................................................... 127 4.2 Comparison between Substrates: ................................................................................ 130 4.3 Comparison between CAD/CAM materials .............................................................. 132 4.4 Modes of failure .................................................................................................................. 134
5. Discussion ..................................................................................................................................... 136 6. Limitations of the study .......................................................................................................... 140 7. Conclusions .................................................................................................................................. 141 Chapter 5 Retention Of CAD/CAM Crowns Using Self-adhesive Resin Cement ........ 142 1. Abstract ......................................................................................................................................... 143 2. Introduction ................................................................................................................................. 144 3. Materials and Methods ............................................................................................................ 146
3.1 Materials ................................................................................................................................ 146 3.2 Methods: ................................................................................................................................ 146
4. Results............................................................................................................................................ 169 4.1 Comparison between resin cements .......................................................................... 170 4.2 Comparison between Substrates: ................................................................................ 176 4.3 Comparison between CAD/CAM materials .............................................................. 181 4.4 Modes of failure .................................................................................................................. 186
5. Discussion ..................................................................................................................................... 190 6. Limitations of the study .......................................................................................................... 195 7. Conclusions .................................................................................................................................. 195 Chapter 6 Microleakage Of CAD-CAM Crowns Using Self-adhesive Resin Cement .. 196 1. Abstract ......................................................................................................................................... 197 2. Introduction ................................................................................................................................. 198 3. Materials and Methods ............................................................................................................ 199
3.1 Materials ................................................................................................................................ 199 3.2 Methods: ................................................................................................................................ 199
4. Results............................................................................................................................................ 215 4.1 Comparison between resin cements .......................................................................... 215 4.2 Comparison between CAD/CAM materials .............................................................. 220
5. Discussion ..................................................................................................................................... 227 6. Limitations of the study .......................................................................................................... 229 7. Conclusions: ................................................................................................................................. 229 Chapter 7 Summary and conclusions ......................................................................................... 231

vi
List of Tables
Table 1: Materials and their composition (as reported by manufacturers) ................. 44 Table 2: Crystallization program for the IPS e.max CAD. ..................................................... 53 Table 3: Materials and sequence followed for cement application. ................................. 59 Table 4: Factorial ANOVA (Dependent variable: Bond strength; Independent
variables: CAD/CAM material, type of cement and type of the substrate) .......... 64 Table 5: One way ANOVA (Dependent variable: Bond strength; Independent
variable: type of cement) ......................................................................................................... 65 Table 6: Descriptive showing mean and standard deviation and the pairwise
comparison of the type of cements ..................................................................................... 66 Table 7: Independent Samples Test (Dependent variable: Bond strength;
Independent variable: type of the substrate) .................................................................. 74 Table 8: One way ANOVA (Dependent variable: Bond strength; Independent
variable: CAD/CAM material) ................................................................................................ 84 Table 9: Materials and their composition (as reported by manufacturers). .............. 109 Table 10:Factorial ANOVA (Dependent variable: Bond strength; Independent
variables: CAD/CAM material, type of cement and type of the substrate) ........ 126 Table 11: One way ANOVA (Dependent variable: Bond strength; Independent
variable: type of cement) ....................................................................................................... 127 Table 12:Descriptive showing mean and standard deviation and the pairwise
comparison of the type of cements ................................................................................... 127 Table 13:Means for Cement groups in homogeneous subsets are displayed according
toTukey HSD ............................................................................................................................... 128 Table 14:Descriptive analysis showing mean and standard deviation and the
pairwise comparison of the type of cements ................................................................. 130 Table 15:Independent Samples Test (Dependent variable: Bond strength;
Independent variable: type of the substrate) ................................................................ 130 Table 16: One way ANOVA (Dependent variable: Bond strength; Independent
variable: CAD/CAM material) .............................................................................................. 132 Table 17:Descriptive showing mean and standard deviation and the pairwise
comparison of the type of cements ................................................................................... 132 Table 18:Means for Cement groups in homogeneous subsets are displayed according
toTukey HSD ............................................................................................................................... 133 Table 19: Material used in the study and their composition as reported by the
manufacturer. ............................................................................................................................ 148 Table 20: Materials and sequence for their respective application (according to the
manufacturer)............................................................................................................................ 162 Table 21:Factorial ANOVA (Dependent variable: Bond strength; Independent
variables: CAD/CAM material, type of cement and type of the substrate) ........ 169 Table 22: indepent sample t-test (Dependent variable: Bond strength, Independent
variable: type of cement) ....................................................................................................... 170 Table 23: Descriptive showing mean and standard deviation and the pairwise
comparison of the type of cements ................................................................................... 171

vii
Table 24: One way ANOVA (Dependent variable: Retention strength; Independent variable: type of cement) ....................................................................................................... 176
Table 25: Independent sample t-test (Dependent variable: Retention strength, Independent variable: CAD/CAM material) ................................................................... 181
Table 26: Material used in the Microleakage Study and their composition (according to the manufacturer) ............................................................................................................... 200
Table 27: Independent Samples Test (Dependent variable: Retention strength; Independent variable: type of cement) ........................................................................... 215
Table 28: Results of the Mann-Whitney U test ....................................................................... 215 Table 29: Independent Samples Test (Dependent variable: Retention strength;
Independent variable: type of cement) ........................................................................... 220 Table 30: Results of the Mann-Whitney U test ....................................................................... 220

viii
List of figures
Figure 1: Study groups, the total number of specimens are 240 specimens (10 per group x 24 group) ...................................................................................................................... 49
Figure 2: Crown materials, IPS e.max CAD (left), Paradigm MZ100 (right).................. 50 Figure 3: Conventional microtensile technique aims at bonding the specimen first
then cutting it. The new techniqueproposed in this study aims at cutting specimens first then bonding them to avoid premature failures. ........................... 51
Figure 4:Isomet diamond cutting saw (left), Microbars(right): 1: IPS e.max CAD, 2: Paradigm MZ100, 3: Dentin, 4: Composite Z100 restorative .................................... 52
Figure 5: Surface treatment materials,Aluminum oxide 50 micron powder (left), IPS Ceramic etching gel (right) ..................................................................................................... 54
Figure 6: The Grit-etching procedure; a) The microetcher and dust collector cabinet, b) microbars embedded in plastic rubbery base ready for grit-etching, c) Grit-etching the microbar .................................................................................................. 54
Figure 7: Composite Z100 Restorative ........................................................................................ 56 Figure 8:Bonding microbars;a) Attachment Device, b) microbars pressed against
each other, c) Bonded microbars ......................................................................................... 58 Figure 9: Testing jig placed in the microtensile-testing machine. .................................... 61 Figure 10:Bonded microbars glued using cyanoacrylate glue to the free sliding parts
of a testing jig, and loaded in tension till failure at cross head speed 0.5 mm/min. ........................................................................................................................................ 62
Figure 11: Bar chart of the mean values of µTBS for different cements with IPS e.max CAD grit-etched. The error bars represent standard deviation. For every level of comparison, groups with different letters show a statistically significant difference according to Tukey’s test results. ................................................................... 67
Figure 12: Bar chart of the mean values of µTBS for different cements with IPS e.max CAD HF. The error bars represent standard deviation. For every level of comparison, groups with different letters are statistically significant different according to Tukey’s test results. ......................................................................................... 69
Figure 13: Bar chart of the mean values of µTBS for different cements with Paradigm MZ100. The error bars represent standard deviation. For every level of comparison, groups with different letters are statistically significant different according to Tukey’s test results. ......................................................................................... 71
Figure 14: Bar chart of the mean values of µTBS for different substrates with Rely X Unicem cement. The error bars represent standard deviation. For every level of comparison, groups with different letters show a statistically significant difference according to Tukey’s test results. ................................................................... 75
Figure 15: Bar chart of the mean values of µTBS for different substrates with Clearfil SA cement. The error bars represent standard deviation. For every level of comparison, groups with different letters show a statistically significant difference according to Tukey’s test results. ................................................................... 77
Figure 16: Bar chart of the mean values of µTBS for different substrates with Multilink cement. The error bars represent standard deviation. For every level

ix
of comparison, groups with different letters show a statistically significant difference according to Tukey’s test results. ................................................................... 79
Figure 17: Bar chart of the mean values of µTBS for different substrates with Rely X Arc cement. The error bars represent standard deviation. For every level of comparison, groups with different letters show a statistically significant difference according to Tukey’s test results. ................................................................... 81
Figure 18: Bar chart of the mean values of µTBS for different CAD/CAM materialswith Dentin. The error bars represent standard deviation For every level of comparison, groups with different letters show a statistically significant difference according to Tukey’s test results. .................................................................. 85
Figure 19: Bar chart of the mean values of µTBS for different CAD/CAM materials with Dentin. The error bars represent standard deviation For every level of comparison, groups with different letters show a statistically significant difference according to Tukey’s test results. ................................................................... 88
Figure 20: Pie chart showing distribution of the modes of failure in µTBS specimens. ........................................................................................................................................................... 90
Figure 21: Summary Bar chart of the mean values of µTBS for different types of cements. The error bars represent standard deviation. For every level of comparison, groups with different letters show a statistically significant difference according to Tukey’s test results. ................................................................... 91
Figure 22: Summary Bar chart of the mean values of µTBS for different Substrates. The error bars represent standard deviation. For every level of comparison, groups with different letters show a statistically significant difference according to Tukey’s test results. ......................................................................................... 92
Figure 23: Summary Bar chart of the mean values of µTBS for different CAD/CAM materials. The error bars represent standard deviation. For every level of comparison, groups with different letters show a statistically significant difference according to Tukey’s test results. ................................................................... 93
Figure 24: Study groups, the total number of specimens are 240 specimens (10 per group x 24 group) .................................................................................................................... 114
Figure 25: Crown materials, IPS e.max CAD (left), Paradigm MZ100 (right). ............ 115 Figure 26: Sectioning Paradigm MZ100 crown material in a diamond cutting saw
(Isomet-top), Microbars(bottom): 1: IPS e.max CAD, 2: Paradigm MZ100. ...... 116 Figure 27: Surface treatment materials,Aluminum oxide 50 micron powder (left),
IPS Ceramic etching gel (right) ........................................................................................... 117 Figure 28: The microetcher and dust collector cabinet. ..................................................... 118 Figure 29: Attachment device (top), specimen pressed over the substrate (middle),
bonded specimen (bottom) .................................................................................................. 121 Figure 30: Microshear bond strength testing; specimen fitted in the clamp of the
microshear testing machine (top), specimen loaded in shear till failure (bottom) ....................................................................................................................................... 123
Figure 31: Bar chart of the mean values of microshear bond strength (µSBS) for different types of cements. The error bars represent standard deviation. Groups with different letters show a statistically significant difference according to Tukey’s test results. ....................................................................................... 129

x
Figure 32:Bar chart of the mean values of µSBS for different Substrates. The error bars represent standard deviation. Groups with different letters show a statistically significant difference according to Tukey’s test results.................... 131
Figure 33:Bar chart of the mean values of microshear bond strength (µSBS) for different CAD/CAM materials. The error bars represent standard deviation. Groups with different letters shows a statistically significant difference according to Tukey’s test results. ....................................................................................... 134
Figure 34:Pie chart showing distribution of the modes of failure in the microshear bond strength (µSBS) specimens. ...................................................................................... 135
Figure 35: Study groups, the total number of specimens is 96 (8 per group x 12 group) ........................................................................................................................................... 152
Figure 36: Molar tooth inserted in acrylic resin inside the threaded metal base. .... 154 Figure 37: a) Parallelometer used to prepare teeth, b) Prepared natural molar tooth,
C) Prepared natural tooth with composite restoration, D) Prepared natural tooth with amalgam restoration. ........................................................................................ 156
Figure 38: Top: 3D scanner, Bottom: scanned tooth for surface area determination. ......................................................................................................................................................... 157
Figure 39: Prepared tooth sprayed with the IPS contrast medium to be ready for optical impression. ................................................................................................................... 158
Figure 40: Angle verification on the optical impression..................................................... 158 Figure 41: a) Milling machine, b) IPS e.max CAD Block in the milling machine, C)
Cerec 3 Machine. ....................................................................................................................... 159 Figure 42: IPS e.max Cad crowns in the EB600 Combi furnace. ...................................... 160 Figure 43: Left: IPS e.max CAD crowns before crystallization, right: IPS e.max CAD
crowns after crystallization. ................................................................................................. 160 Figure 44: Crowns were placed under static load of 22N for 5 minutes. ..................... 163 Figure 45: Crowns being aged in the chewing simulator. .................................................. 164 Figure 46: a) Protecting the restoration tooth interface with wax, b) building acrylic
over the crown, c) adding the threaded metal base with acrylic over the crown, d) the attachment device; 1) the threaded metal base for crown, 2) the threaded metal base for tooth................................................................................................................. 165
Figure 47: Top: Pulling the crowns out using Instron universal testing machine, Bottom: crown dislodged from its abutment. ............................................................... 166
Figure 48: Bar chart of the mean values of retention strength (RS) for different cements with IPS e.max CAD. The error bars represent standard deviation. For every level of comparison, groups with different letters shows a statistically significant difference according to Tukey’s test results. ........................................... 173
Figure 49: Bar chart of the mean values of retention strength (RS) for different cements with Lava Ultimate. The error bars represent standard deviation. For every level of comparison, groups with different letters shows a statistically significant difference according to Tukey’s test results. ........................................... 175
Figure 50: Bar chart of the mean values of retention strength (RS) for different substrates with IPS e.max CAD. The error bars represent standard deviation. For every level of comparison, groups with different letters shows a statistically significant difference according to Tukey’s test results. ........................................... 178

xi
Figure 51: Bar chart of the mean values of retention strength (RS) for different cements with Lava Ultimate. The error bars represent standard deviation. For every level of comparison, groups with different letters shows a statistically significant difference according to Tukey’s test results. ........................................... 180
Figure 52: Bar chart of the mean values of retention strength (RS) for different CAD/CAM materials with RelyX Ultimate. The error bars represent standard deviation. For every level of comparison, groups with different letters shows a statistically significant difference according to Tukey’s test results.................... 183
Figure 53: Bar chart of the mean values of retention strength (RS) for different CAD/CAM materials with RelyX Unicem. The error bars represent standard deviation. For every level of comparison, groups with different letters shows a statistically significant difference according to Tukey’s test results.................... 185
Figure 54:Pie chart showing distribution of the modes of failure in the retention strength (RS) Test. ................................................................................................................... 186
Figure 55: Summary Bar chart of the mean values of Retention strength (RS) for different types of cements. The error bars represent standard deviation. For every level of comparison, groups with different letters shows a statistically significant difference according to Tukey’s test results. ........................................... 187
Figure 56: Summary Bar chart of the mean values of Retention strength (RS) for different Substrates. The error bars represent standard deviation. For every level of comparison, groups with different letters shows a statistically significant difference according to Tukey’s test results. ........................................... 188
Figure 57: Summary Bar chart of the mean values of Retention strength (RS) for different CAD/CAM materials. The error bars represent standard deviation. For every level of comparison, groups with different letters shows a statistically significant difference according to Tukey’s test results. ........................................... 189
Figure 58: Study groups, the total number of specimens are 32 specimens (8 per group x 4 group) ....................................................................................................................... 204
Figure 59: Left: parallelometer adjusted for 6° axial wall convergence, Right: Tooth embedded in acrylic resin ready for crown preparation. ......................................... 206
Figure 60: Cerec 3D software was used to design crowns ................................................ 207 Figure 61: Angle verification on the optical impression..................................................... 207 Figure 62: Cerec 3D milling unit. ................................................................................................. 208 Figure 63: Inside the milling chamber, burs ready to mill IPS e.max CAD. ................. 208 Figure 64: Milled IPS e.max CAD crown. ................................................................................... 209 Figure 65: IPS e.max Cad crowns in the EB600 Combi furnace. ...................................... 209 Figure 66: Crowns were placed under static load of 22N for 5 minutes. ..................... 211 Figure 67: Crowns being aged in the chewing simulator. .................................................. 212 Figure 68:Root surfaces and acrylic base sealed with nail polish................................... 214 Figure 69: Procion Dye. ................................................................................................................... 214 Figure 70: low-speed saw with a diamond blade (Isomet 1000, Buehler Ltd., Lake
Bluff, IL) used for sectioning specimens mesiodistally. ............................................ 214 Figure 71: Modes of microleakage scores for cements used to bond IPS e.max CAD
crowns .......................................................................................................................................... 216 Figure 72: Microleakage scores distribution for cements used to bond IPS e.max CAD
crowns. ......................................................................................................................................... 217

xii
Figure 73: Groups Modes of microleakage scores for cements used to bond Lava Ultimate crowns. ....................................................................................................................... 218
Figure 74: Microleakage scores distribution for cements used to bond Lava Ultimate crowns. ......................................................................................................................................... 219
Figure 75: Groups Modes of microleakage scores for CAD/CAM materials that was bonded with RelyX Ultimate cement ................................................................................ 221
Figure 76: Microleakage scores distribution for CAD/CAM materials that was bonded with RelyX Ultimate cement ................................................................................ 222
Figure 77: Groups Modes of microleakage scores for CAD/CAM materials that were bonded with RelyX Unicem 2 cement. .............................................................................. 223
Figure 78: Microleakage scores distribution for CAD/CAM materials that were bonded with RelyX Unicem 2cement ................................................................................ 224
Figure 79: Microleakage in IPS e.max CAD & RelyX ultimate showing scores of zero on mesial and distal sides. .................................................................................................... 225
Figure 80: Microleakage in IPS e.max CAD & RelyX Unicem 2 showing scores of one on mesial and distal sides. .................................................................................................... 225
Figure 81: Microleakage in Lava Ultimate& RelyX ultimate showing scores of zero on mesial and one on distal side. .............................................................................................. 226
Figure 82: Microleakage in Lava Ultimate& RelyX Unicem showing scores of one on mesial and two on distal side. .............................................................................................. 226

1
Chapter 1 Introduction and Literature Review

2
1. Introduction The increased demand for esthetic and biocompatible restorations has led to
development of new materials and restorative systems. 1,2
Among these available restorative
systems is the CEREC computer–aided-design/ computer-aided-manufacturing (CAD/CAM)
system which enabled dentists to provide the patient with an indirect ceramic or composite resin
restoration in a single appointment with simpler procedures compared to conventional
restorative systems and without the need for dental laboratory support.1,2
Ceramic and Composite resin materials are available for the CAD/CAM restorations in
the form of blocks ready to be milled for restoration fabrication. These blocks are characterized
by their uniform high mechanical properties that give them advantage over materials of similar
composition used for laboratory fabricated restorations following traditional techniques.
However, adequate adhesion between these restorations and tooth substrate is a prerequisite for
proper function and longevity of the restorations. 3
Resin cements are utilized to gain adhesion between indirect esthetic restorations and
the tooth substrate. Self-adhesive resin cements simplify the clinical procedures and are less
technique sensitive compared to adhesive-based resin cements.4,5
The inner surface of the ceramic CAD/CAM restorations is roughened by acid etching
and/or grit-etching to achieve micro-mechanical interlocking. Also, silane-coupling agents can
be utilized to attain chemical bonding between ceramic restorations and resin cements. 4
For
composite resin CAD/CAM restorations, although CAD/CAM milled surfaces may be
sufficiently rough for routine bonding, they are further roughened by grit-etching for better
micro-mechanical interlocking. 6-8
Also, silane-coupling agents can be used to enhance the
chemical bond between these restorations and resin cements. 6-8
Hydroflouric acid etching of

3
composite restorations can damage the resin matrix and decrease both the mechanical properties
and the bonding performance of the restoration.9-12
Several factors influence the bond strength between the CAD/CAM restoration and the
underlying bonding substrate, such as the type of the substrate whether it is an intact tooth
structure or a tooth with composite resin or amalgam restorations, the type of surface treatment
in the indirect restoration, the type of the resin cement, and the method of adhesion testing.
4,13,14 Several tests can be used to evaluate adhesion including bond strength tests, retention tests
and microleakage tests. To evaluate bond strength, the most common in-vitro adhesion tests are
shear,tensile, microshear and microtensile bond strength tests. 15
The microtensile bond strength
test has several advantages as opposed to the shear and tensile bond strength tests such as
cutting multiple specimens from one large specimen and stress concentration at the adhesive
interface during loading. 16
This results in higher bond strength values with less cohesive
fractures.17-19
Also, the microshear bond strength test was used in some studies aiming to generate
multiple specimens from a single tooth. 20,21
In some studies, microshear bond strength test was
more accurate in bond strength evaluation than the microtensile bond strength test, as the latter
showed high standard deviations and failed to differentiate between different adhesives
regarding the bonding performance. 21,22
Also, the microshear bond strength test appeared to be
more capable of concentrating the stresses at the interface as it was mainly associated with
adhesive failures at the interface compared to microtensile bond strength which showed a high
percentage of cohesive failure of the bonded substrate.21
Retention tests, as opposed to bond strength tests, were developed to consider the
complex geometry of the abutment preparation where the bonding interface consists of several

4
surfaces. The configuration factor (C-factor) is the ratio of the bonded to the unbonded surfaces,
23 is much higher in cemented crowns compared to cemented cylinders and can affect adhesion.
15,23,24
Microleakage and adhesive performance are strongly connected. Microleakage could
lead to failure of adhesion, and weak adhesion could lead to microleakage. Microleakage tests
the ability of cement to seal the adhesive interface and could lead to secondary caries and even
pulpal pathology if left untreated. 25,26
2. CAD/CAM Technology
2.1 Brief history Fabrication of conventional metallic restorations starts by taking an impression of the
prepared tooth, then pouring the impression with a gypsum material for model fabrication, then
waxing up on the created die, and finally casting using the lost wax technique. In contrast,
CAD/CAM technology uses digital impressions of the prepared teeth that are directly recorded
intraorally instead of taking conventional impressions. The created virtual impression is
manipulated using computer aided design software to design the restorations on a computer
monitor as a digital wax-up. Finally, a computer-aided processing machine mills the restoration
from a prefabricated ceramic, composite or metal block. This computer-aided manufacturing
technology has been applied in different industrial fields since the 1970s, however, major
developments of dental CAD/CAM technology occurred in the 1980s.27
Three pioneers have contributed to the development of the dental CAD/CAM systems.
The first was Dr. Francisco Duret of France. In 1971, he started to fabricate crowns with
functionally shaped occlusal surfaces using a series of systems that started with scanning the
prepared tooth intraorally using an intraoral camera. 28
The created virtual impression was then

5
reconstructed on a monitor as a three-dimensional graphic and the optimal shape of the crown
was ‗virtually designed‘ on the monitor. 28
The crown was then fabricated by milling a block
using a numerically controlled milling machine. Dr. Duret developed the commercial Sopha®
System, which had an impact on the later development of dental CAD/CAM systems in the
world. 28
However, this system was not widely used due to some technical limitations such as
the lack of digitizing accuracy, limitations of computer technology and materials not fully-
developed to apply this system in dentistry.28
The second pioneer was Dr. Werner Moermann of Switzerland, the developer of the
CEREC® system. CEREC is an abbreviation for (computer-assisted CERamic
REConstruction). 29
Early in the 1980s, posterior composite restorations had inherent problems
such as polymerization shrinkage, marginal gap formation, and inferior mechanical properties.
Therefore, Dr. Moermann decided to apply new technology in the dental office to fabricate
indirect esthetic restorations and overcome the drawbacks of conventional composite
restorations. 29
The basic concept hardware was first produced by Moermann and his colleagues
in 1980, and was developed later to the CEREC 1 system in 1985, which was capable of
capturing digital images of powdered teeth with a compact intraoral camera, designing and
milling the inlay from a ceramic block using a chair side machine.29,30
The development of this system allowed the fabrication of same-day ceramic
restorations. However, the application was limited to inlays, since the occlusal morphology was
not initially accurately reproduced. When this system was introduced, the technical term of
CAD/CAM became popular to the dental profession.30
In 1988, Moermann and his colleagues improved the CEREC 1 system to be capable of
fabricating chair-side inlays, onlays and veneers. In 1994, Siemens developed the CEREC 2

6
system, which was capable of fabricating inlays, onlays, veneers, partial and full coverage
crowns. In 2000, Sirona developed the CEREC 3 & inlab system, which was capable of
fabricating three-unit bridge frames in addition to other restorations fabricated by CEREC 2.
All these CEREC systems were using two-dimensional software.29
In 2003, Sirona developed the CEREC 3D system capable of producing four-unit bridge
frames with three-dimensional software. In 2005, Sirona improved the CEREC 3D which was
capable of automatic virtual occlusal adjustment. 29
In 2009, Sirona developed the CEREC AC (acquisition center). This system enables the
fabrication of restorations both at chairside and at the laboratory by sending digital impressions
to the laboratory, it is characterized by a very high degree of accuracy and unprecedented speed.
31 The intraoral digital impression is taken as multiple digital images of powdered prepared
teeth using Bluecam. The technique is very fast and captures multiple images. 32
This is
convenient as it removes the necessity of a pedal or button. More recently, the Omnicam was
introduced which allows powder-free scanning and precise 3D images.33
Two companies developed CAD/CAM systems that are currently available for in-office
chair-side use. Sirona Dental Systems developed the CEREC® 3D and CEREC® AC, while
E4D Technologies developed the E4D Dentist. They are capable of capturing digital
impressions and chair-side milling of restorations.31,34
The E4D Dentist (D4D Technologies, Richardson, Texas) was introduced in 2008 as
powder-free chair-side CAD/CAM system capable of capturing digital impression, designing
and fabricating non-metallic inlays, onlays, crowns and veneers.35

7
CEREC AC and E4D systems allow capturing the digital impressions and data
transmitted to the laboratory for the design (CAD) and milling process using CEREC Connect
and E4D LabWorks respectively. 36-38
Other CAD/CAM systems that are used for crown and fixed partial denture (FPD)
restorations require production of a stone model for the abutment teeth using conventional
impression methods, which acts as the starting point. A digital impression of the stone model is
recorded to design restorations using computer software and then various processing machines
can be used to fabricate the restorations. These systems can be used as a laboratory tool by
dental technicians. 27
Also, there are systems that require completing the wax up, as in the
conventional method, and then digital images are captured for wax patterns followed by
restoration milling. 27
The third pioneer is Dr. Matts Andersson of Sweden, who developed the Procera®
system. In the early 1980s, nickel-chromium alloys substituted gold alloys in dental
applications due to the very high expense of gold. However, nickel allergies appeared as a
problem and non-allergic biocompatible titanium was proposed as a substitute. However,
casting of the titanium was difficult and technique sensitive. So, Dr. Andersson used spark
erosion to produce titanium copings using CAD/CAM technology and this system was known
as the Procera system.39,40
Later on, a processing center was introduced and connected to satellite digitizers around
the world through the Internet to fabricate all ceramic frameworks. Single or multiple unit
ceramic frameworks were made from high strength industrial sintered polycrystalline alumina
or zirconia ceramic materials that were not used in conventional dental laboratories. A digital
impression of the prepared tooth die was recorded at the satellite laboratory office and the data

8
was transferred to processing centers based in Sweden and the USA, 41,42
where copings were
fabricated and delivered back to the laboratory office for layering porcelain. CAD/CAM
technology played a part within the total restoration-fabrication process. 39,41
Also, customized
titanium and ceramic implant abutments could be manufactured using the CAD/CAM software
program for this system. 39,41
2.2 Advantages of CAD/CAM technology The advantages of using CAD/CAM technology in fabricating non-metallic restorations
can be summarized as:
CAD/CAM technology allows the use of high-strength newly-developed materials in the
fabrication of dental restorations, which cannot be processed using conventional
laboratory methods. This in turn allows the dentist to avoid the potential for errors that
occur during laboratory processing.27,29
The application of CAD/CAM technology saves time and effort by eliminating the need
for lengthy conventional clinical and laboratory procedures.27,42
The cost is reduced by eliminating the need for some materials that were used in
conventional clinical and laboratory procedures. Also, the cost is reduced due to mass-
production of the prefabricated ceramic or composite resin blocks.42,43
The CAD/CAM technology decreases the number of visits to the dental office and
allows the fabrication of chair-side indirect all-ceramic restoration.42,44
The use of CAD/CAM technology enables quality control of dental non-metallic
restorations through reproducible processing. The quality of the ceramic and composite
resin blocks, from which restorations are milled, is confirmed by the manufacturer to be

9
free from internal defects, whereas internal porosity is usually present in restorations
processed by conventional lab procedures.27,42
2.3 Limitations of the CAD/CAM technology
Although several dentists may share a centrally located CAD/CAM machine, the
equipment is very expensive 35,45
It is difficult to digitize subgingival margins in severely broken teeth. Conventional
gingival retraction procedures are required in these cases.34,45
The use of monochromatic blocks makes the color of the restoration unnatural looking,
however, some polychromatic blocks are now available and are specially layered to
simulate the natural appearance of the enamel and dentine.45,46
More time is needed to adjust and polish the CEREC restorations compared to that
required for conventional laboratory fabricated restorations. However, recent software
developments and experience allows dentists to adjust and polish the restorations faster
and more efficiently.45,47
2.4 CAD/CAM materials The reliability of the CAD/CAM materials is related to the reproducibility of the
manufacturing process. The CAD/CAM blocks are manufactured in an identical manner to
produce dense and void-free material. 42
All CAD/CAM material blocks are characterized by
fine-particle microstructure that results in reduced machining damage, improved polishability,
decreased abrasion coefficient and improved mechanical properties.46
Several materials can be used with chair-side CEREC system and dental laboratory-
based CEREC inlab system. These materials include:

10
IPS e.max CAD (Ivoclar Vivadent, Schaan, Liechtenstein): a lithium disilicate glass-
ceramic processed while still in the partially crystallized (soft state). In the soft state,
IPS e.max CAD shows its characteristic bluish color. Manual adjustments and sprue cut
back can be easily performed and the fitting accuracy of the restoration can be checked.
Crystallization process (approx. 20 min) is then performed in a ceramic furnace to
increase the flexural strength of the material to 360 MPa and to achieve the desired
esthetic tooth shade and translucency. This material can be used for the fabrication of
veneers, inlays, onlays, partial coverage and full coverage crowns as well as
frameworks. 46,48,49
Paradigm MZ100 (3M ESPE, Minnesota, United states): a highly filled (85-90 percent
by weight) resin-based composite with micrometer and sub-micrometer zirconia-silica
fillers. It has higher mechanical properties compared to conventional Z100 Restorative
direct resin-based composite and other direct resin-based composites. The material was
developed as an alternative to porcelain, and it has the advantages of being dense,
uniform, free of polymerization shrinkage, with a low abrasion coefficient which gives
it enamel-like wear characteristics, easy to finish and polish and can be easily repaired
intraorally. The flexural strength of this material is150 MPa and can be used for the
fabrication of veneers, inlays, onlays, partial coverage and full coverage crowns.46,48
Lava Ultimate (3M ESPE, Minnesota, United states): a highly filled (80 percent by
weight) resin-based composite with silica and zirconia nanomer and zirconia-silica
nanocluster fillers. Similar to paradigm MZ 100, it is dense, uniform, and free of
polymerization shrinkage, which makes it superior to other direct resin-based
composites. The flexural strength of this material is 200 MPa. The material has a low

11
abrasion coefficient and can be easily repaired intraorally. This material can be used for
the fabrication of veneers, inlays, onlays, partial coverage and full coverage crowns.50
Paradigm C (3M ESPE, Minnesota, United states): a leucite-reinforced glass ceramic
material that contains 30 percent by weight leucite. Paradigm C blocks are the newest
addition to the Paradigm line of blocks named Paradigm C where ―C‖ identifies it as a
ceramic. It is characterized by its well-balanced translucency and fluorescence, by
providing a chameleon effect for good shade matching and by its ease to polish. This
material can be used for the fabrication of veneers, inlays, onlays, partial coverage and
full coverage crowns.48,51
Vitablocs Mark II (Vita Zahnfabrik, Bad Sackingen, Germany): fabricated using fine-
grained feldspathic porcelain powder particles that produce a nearly pore-free ceramic
with fine crystals. 46,52
This material is characterized by improved polishability,
increased strength and a relatively low abrasion coefficient which results in decreased
wear of opposing enamel. 52,53
The flexural strength of this material is 130 MPa and can
increase to 160 MPa when glazed, which is twice the strength of conventional
feldspathic porcelains. 46,54
This material can be used for the fabrication of veneers,
inlays, onlays, partial coverage and full coverage crowns. 46,48,52,55
CEREC Blocs (Sirona Dental Systems, Chiswick, United Kingdom): a feldspathic
porcelain, similar to Vitablocs Mark II but with a different shading nomenclature. This
material is characterized by its ease of polishability and high degree of translucency and
provides a chameleon effect to blend perfectly with the adjacent teeth. The
polychromatic version of the CEREC Blocs is specially layered in order to resemble the

12
enamel, dentine and neck of a natural tooth. This material can be used for the fabrication
of veneers, inlays, onlays, partial coverage and full coverage crowns.48,56
CELTRA Duo (Dentsply, York, U.S.A): zirconia reinforced lithium silicate glass
ceramic. This material is characterized by its high flexural strength (370 MPa) similar to
that of the IPS e.max CAD, however, it doesn‘t require a crystallization step. This
material can be used for the fabrication of veneers, inlays, onlays, partial coverage and
full coverage crowns.57
VITA ENAMIC (Vita Zahnfabrik, bad Sackingen, Germany): a hybrid ceramic with a
polymeric network that interpenetrates the ceramic network providing reinforcement
and adding resilience. This material is characterized by a flexural strength of 160 MPa.
This material can be used for the fabrication of veneers, inlays, onlays, partial coverage
and full coverage crowns.58
3. Bonding of Non-metallic CAD/CAM materials Proper function and serviceability of CAD/CAM restorations depends on their good
adhesion to the underlying substrate3,59
. Proper bonding to tooth structure can be achieved when
an appropriate cement is selected, proper surface treatment of the internal surface of the
restoration is performed and the recommendations of the manufacturer are followed. 60,61
Laboratory bond strength testing can be performed to predict the clinical performance of these
materials.20
Resin cements are used clinically to bond non-metallic restorations to the tooth structure
due to their esthetics, good mechanical properties and high bonding performance. 62,63
Resin
cements can bond to tooth structure either through one of the adhesive systems currently
available (adhesive-based resin cements) or by direct application to the tooth structure without

13
the need of an adhesive system (self-adhesive resin cements).They can also bond to the non-
metallic restoration following proper surface treatment of these restorations.60,61,64,65
3.1 Adhesive systems Throughout the last two decades, new adhesive systems have been introduced for
bonding to tooth structure. Adhesive materials can interact with tooth structure either
mechanically, chemically, or both.66
The adhesive systems currently used for bonding to tooth tissue can be summarized as
follows:
3.1.1 Total Etch Systems (Etch-and-Rinse Adhesives)
Total Etch is a multi-step approach that includes a separate etch-and-rinse phase. An
acid (usually 30-40% phosphoric acid) is applied for 15 seconds on dentin and then rinsed off.
This demineralizes dentin up to a depth of a few micrometers resulting in the exposure of a
hydroxyapatite-deprived collagen mesh. Etching is followed either by priming then the
application of the adhesive resin (three-step procedure), or by applying a combined primer and
adhesive resin (two-step procedure).66,67
The total etch technique is the most effective approach to achieve bonding to enamel.
Etching results in dissolution of the hydroxyapatite crystals creating micro-porosities that are
infiltrated by fluid resin, which polymerizes and forms resin tags. Two types of resin tags are
formed: macro-tags that fill the space surrounding the enamel prisms, and micro-tags that fill
the micro-porosities within the etched enamel prisms and contribute greatly to the retention in
enamel. 20,66

14
Etching dentin dissolves and removes the smear layer leaving a rinsed collagen layer,
which, when resin is applied, produces a resin–collagen hybrid layer, that is susceptible to
degradation upon water sorption and enzymatic degradation process.68-70
Chemical bonding between resin and the organic component of dentin that remains after
the acid etch procedure contributes to a better bonding performance. However, this chemical
bonding is lacking due to hydrophilicity of the resins and hydrolytic reactions taking place at
the adhesive interface. Chemical bonding can be regarded as the major shortcoming of today‘s
etch-and-rinse adhesives. 71,72
The priming step is very critical in the total etch approach. The highly technique-
sensitive ―wet-bonding‖ technique should be used when using an acetone-based adhesive. 73
The
less technique-sensitive ―dry-bonding‖ technique,by applying a gentle stream of air-drying
following the rinsing step of the acid, should be employed when a water/ethanol-based adhesive
is used,.74,75
3.1.2 Self-etch Systems (Etch-and-Dry Adhesives)
These adhesives use monomers that were grafted with one or more carboxylic or
phosphate acid groups, to be able to simultaneously condition and prime dentin. 76
This
approach eliminates the rinsing step, resulting in shortening of the clinical application time and
reducing the technique-sensitivity of the adhesive system application. 77
Also, the infiltration of
monomers occur simultaneously with the self-etch process eliminating the possibility of
discrepancies between both processes and reducing the presence of unprotected collagen fibrils,
which in turn reduces nanoleakage.66,78

15
All self–etch adhesives incorporate water as a solvent in their composition in order to
allow the ionization of the incorporated acidic monomers to be capable of etching the tooth
structure. 79
Self-etching adhesives, only dissolve the smear layer without removal of the
dissolved calcium phosphates since the rinsing step is eliminated. 77,78,80
They can be classified
according to their acidity and etching power into: strong (pH ≤ 1), intermediate strong (pH≈1.5)
and mild (pH≥2). 66
Strong self-etch adhesives dissolve more hydroxyapatite crystals that become embeded
within the interfacial zone. At the enamel level, the etching pattern is similar to that of
phosphoric acid treatment used in the total etch approach. 81
At the dentin level, the collagen
network is exposed and nearly all the hydroxyapatite crystals are dissolved to a depth of 3 μm
similar to what happens in the total etch approach, and the transition of the exposed collagen
network to the underlying unaffected dentin is quite abrupt. 66
Strong self-etch adhesives are associated with low laboratory and clinical dentinal
bonding performance, especially at the dentin substrate. 82-84
This may be due to the soluble
calcium phosphates that are embedded in the interfacial zone.20
Also, the high concentrations of
acidic resin monomers make these adhesives behave like hydrophilic permeable membranes
and allow water movement from dentin to the restoration-adhesive interface. 76,85
In addition, the
residual solvent that remains within the adhesive interface can weaken the bond.66
Mild self-etch adhesives (pH≈2) dissolve fewer calcium phosphates. At the enamel
level, the etching pattern is very weak and results in weak micromechanical bonding. At the
dentin level, the surface is only partially demineralized to a depth of 1 μm, creating micro-
porosities sufficient for micro-mechanical interlocking, with a substantial amount of
hydroxyapatite crystals remaining undissolved and protecting the collagen fibrils and adhesive

16
interface from early hydrolytic reactions. 86,87
These hydroxyapatite crystals also serve as
receptors for additional chemical bonding.
Functional monomers with specific phosphate groups, such as phenyl-P (2-methacryl-
oxyethyl phenyl hydrogen phosphate), and 10-MDP (10-methacryloxydecyl dihydrogen
phosphate) or carboxylic groups such as 4-META (4- methacryloxyethyl trimellitic acid), are
capable of chemical bonding with calcium of the residual hydroxyapatite crystals through
primary ionic binding. 88,89
10- MDP results in more effective and hydrolytically stable
chemical bonds as opposed to other functional monomers such as 4-META and phenyl- P (2-
methacryloyloxyethyl phenyl phosphoric acid). 88
Intermediately strong adhesives have a pH value about 1.5 and cannot be classified as
mild or strong self-etching adhesives. This results in better micromechanical interlocking than
mild self-etching adhesives, at enamel and dentin levels. The resulting demineralized layer is
2.5 μm in thickness that has its surface totally demineralized whereas the base contains residual
hydroxyapatite crystals that allow for chemical interactions, and thus the transition of the
exposed collagen network to the underlying unaffected dentin is more gradual.66
The interaction between self-etch adhesives and collagen is better than that occurring
between etch-and-rinse adhesives and collagen, which increases the chances for chemical
bonding between residual hydroxyapatite crystals and monomeric groups to enhance bonding. 80
The resultant two-fold micro-mechanical and chemical bonding mechanism is believed
to be advantageous in terms of restoration durability. The micro-mechanical bonding
component provides resistance to abrupt de-bonding stress while the chemical bonding provides
resistance to hydrolytic breakdown.67,90

17
Two-step self-etch adhesive systems involve the use of hydrophilic self-etch primer
followed by the application of a more hydrophobic adhesive resin. This results in a more
hydrophobic interface and allows better bond durability. 91
One-step self-etch adhesives are
simpler and fast to use but they show lower bonding efficiency compared to two-step self-etch
adhesives. 92
This may be related to their inferior mechanical properties, lower degree of
conversion and increased water sorption by osmosis from dentin.82,92
3.2 Resin Cements Clinically, resin cements are becoming very popular due to their ability to strongly bond
to the tooth structure and the indirect restorations. They have high mechanical properties and
the lowest solubility compared to the other available cements.64,93
Resin cements were initially based on the chemistry of acrylic resins that improved
with time due to further developments in composite resins and adhesive systems. There are two
main categories of resin cements: those requiring the use of an adhesive system (adhesive-based
resin cements), and those that don‘t require the use of any adhesive system (self-adhesive resin
cements).63,94
3.2.1 Adhesive-based resin cements
These are composite resin cements that require the application of an adhesive system
prior to the application of the cement. They can be classified according to the method used to
activate polymerization: light-cured, self-cured and dual cured. They can also be classified
according to the adhesive system used: total etch and self-etch resin cement systems.63,64
Since the 1970s, adhesive-based resin cements have been available as a two-paste
system. Once the adhesive system has been applied to tooth structure, the resin cement is mixed
according to the manufacturer instructions and applied to the intaglio surface of the treated

18
indirect restoration. 61,64,65
Their composition is usually a mixture of dimethacrylate oligomers,
inorganic fillers and polymerization initiator. These components are adjusted to maintain low
film thickness and appropriate working and setting time.61
Self-cured adhesive-based resin cements are mainly indicated for cementation of
metallic restorations, metal-ceramic restorations and posts. 95
Their use in dentistry is very
limited as they have several disadvantages such as their limited working time, their color
instablity as their aromatic amines accelerator oxidizes with time and changes the cement color
to a more yellow shade, and their difficulty in mixing uniformly resulting in non uniform curing
of the cement and thus lower mechanical properties.96
Light-cured adhesive-based resin cements provide extended working time but their use
is limited to cementation of laminate veneers or shallow inlays, where curing light can pass
through the restoration and initiate polymerization of the cement.97,98
Dual-cured adhesive-based resin cements can be used in situations where the restoration
might block the curing light from reaching deeply. 99
Usually supplied as two-paste systems,
where one of the pastes contains the photo-initiator and the chemical activator (reducing
amine), while the other paste contains the chemical initator, which is usually benzoyl
peroxide.61,100
An interesting feature of these dual-cured cements is that polymerization is accelerated
after the placement of the restoration when the surrounding environment is deprived from the
ambient oxygen supply. This ambient oxygen feature provides extended working and setting
times before placement of the restoration. 101
Immediate light curing of the dual cure cements
may negatively limit the self-cure mechanism which may adversely affect the mechanical
properties of the cement, which is why it is recommended in these cements to allow time for the

19
self-curing mechanism to occur, followed by the light cure mechanism that augments the whole
polymerization process to reach the best mechanical properties. 62
The ideal time frame between
mixing and the light-activation has not yet been determined, but some studies have shown that
light-curing 5 to 10 minutes after mixing does not seem to interfere with final properties, at
least for most of the cements evaluated.61
Without the light curing step, the dual cure cements will act similar to exclusively self-
cure cements and will require more time to cure, which might allow for the transudation of
water from dentin to occur and adverse hydrolytic reactions to take place.61,102
3.2.2 Self-adhesive Resin Cements
Self-adhesive resin cements were introduced to the dental market in 2002 with aims
provide an alternative to adhesive-based resin cements.103
These cements are composite resins
that can adhere to tooth structure without the need for adhesive or etching process. 103,104
They
combine features of restorative composites, self-etching adhesives and dental cements. They
were introduced to dentistry as a subgroup of resin cements and have gained popularity. 105
Rely X Unicem from 3M ESPE represents the first of this new class of materials. Now
several self-adhesive resin cements are available in the dental market. They differ in terms of
composition, working/setting time, number of shades available and the delivery system.94,106
All the current self-adhesive resin cements consist of two pastes that require hand-
mixing, auto-mixing or capsule trituration. Once the cement is mixed, it can be applied in a
single clinical step.63,107
The major benefit of these materials is their simplicity of application. According to the
manufacturer‘s information no post-operative sensitivity is expected as the smear layer is not
removed. These cements are claimed to be moisture tolerant and some are capable of releasing

20
fluoride ions in a manner comparable to glass ionomer cement. 63,104
Also, they offer good
esthetics, adequate mechanical properties and dimensional stability similar to other categories
of resin cements.63,104
Available self-adhesive resin cements are dual-curing radiopaque materials that are
indicated for adhesive cementation of any indirect restoration whether it is ceramic, composite
or metal. 103,105
Clinicians generally prefer adhesive-based light-curing materials as opposed to
self-adhesive for luting veneers, due to the need for the longer working time offered by the
light-curing procedure, which allows them to position and adjust several veneers
simultaneously, prior to initiation of the cement polymerization. 103,105
Self-adhesive resin cements utilize monomers with functional acidic groups to
demineralize the tooth structure. These monomers are mainly methacrylate monomers with
either carboxylic acid groups, as with PMGDM (pyromellitic glycerol dimethacrylate) and 4-
META, or phosphoric acid groups, as with 10 -MDP (10-methacryloxydecyl dihydrogen
phosphate), Phenyl-P (2-methacryloxyethyl phenyl hydrogen phosphate), Penta- P
(dipentaerythritol pentaacrylate monophosphate) and BMP (Bis 2-methacryloxyethyl acid
phosphate). 103,106
The concentration of these acidic monomers in self-adhesive resin cements is balanced
to be low enough to avoid excessive hydrophilicity in the resulting polymer and high enough to
have a proper degree of self-etching property. 106
Once the self-adhesive resin cement is mixed,
it shows high initial hydrophilicity, which facilitates their wetting and adaptation to the tooth
structure. The acidic groups react with the calcium of the tooth structure and the metal oxides
released from the ion-leachable fillers.106
The material becomes more hydrophobic as the acidic
groups are consumed throughout the reaction. The adhesion obtained is due to micromechanical

21
interlocking with tooth structure and chemical bonding between the acidic monomers and
hydroxyapatite. 106
3.2.3 Self-adhesive resin cements versus adhesive-based resin cements
Several studies have been performed to determine the bonding efficiency of self-
adhesive resin cements and to determine if they are a possible replacement for current
conventional adhesive-based resin cement systems. 63
The current adhesive-based resin cement
systems can be classified into two categories: those utilizing etch-and-rinse adhesives and those
utilizing self-etch adhesives.
In some bond strength studies that were conducted using shear, tensile and microtensile
bond strength tests, self-adhesive resin cements performed comparably to conventional
adhesive-based resin cement systems when bonding to coronal dentin. However, in other
studies, self-adhesive resin cements show significantly lower microtensile bond strength
compared to adhesive-based resin cement systems. 108-113
Another study evaluated the tensile bond strength of self-adhesive resin cements to
indirect composites. The indirect composite resin restorations luted with the self-adhesive resin
cements showed better results in comparison with those luted with etch-and-rinse and self-etch
adhesive-based resin cements. 114
In another study, the self-etch adhesive resin cement systems
and self-adhesive resin cements showed higher bond strength results compared to conventional
etch-and-rinse adhesive-based resin cements, and the luting agents had a stronger influence on
bond strength between restorative materials and dentin than the type of the restorative material.
115 It was also shown that when correct application procedures are followed, the etch-and-rinse
and self-etch adhesive-based resin cements as well as self-adhesive cements are equally
effective in bonding to enamel and dentin 112
. Other studies have shown that self-adhesive resin

22
cements are satisfactory and comparable to other multi-step adhesive-based resin cements
regarding bonding to dentin, while adhesion to enamel appears to be weak. Assessment of long-
term clinical performance of self-adhesive resin cements is needed for better evaluation of these
materials.105
The effect of cementation of feldspathic ceramic CAD/CAM molar crowns with etch-
and-rinse adhesive-based resin cement or self-adhesive resin cement on their fracture resistance
has also been investigated. Crowns cemented with self-adhesive resin cement showed higher
fracture resistance when compared to those cemented with multistep etch-and-rinse adhesive-
based resin cement. 59
However in another study, the fracture resistance of ceramic crowns
cemented to dentin using self-adhesive resin cement was not different from those cemented
with conventional etch-and-rinse adhesive-based resin cement.116
Comparing the nanoleakage of CAD/CAM ceramic blocks bonded to dentin with self-
adhesive and those bonded using etch-and-rinse adhesive-based resin cement, one self-adhesive
resin cement (Rely X Unicem) demonstrated similar sealing ability when compared to
conventional etch-and-rinse adhesive-based resin cement system with and without
thermocycling (500 cycles) 117
.
Self-adhesive resin cement also shows better marginal sealing compared to self-etching
adhesive-based resin cements, when used to cement feldspathic ceramic CAD/CAM molar
partial crowns. 118
However, in another study, self-etching adhesive-based resin cements
resulted in significantly lower microleakage scores (better marginal sealing) compared to self-
adhesive resin cements, irrespective of crown material being composite or feldspathic
porcelain.119

23
3.3 Surface treatment and adhesion The clinical success of indirect esthetic restorations depends on the quality of bonding
achieved with the underlying tooth structure. 120,121
Surface treatment of the ceramic or indirect
composite resin restorations has an impact on the bonding performance to the tooth structure.
Surface treatment depends on the composition of the restorative material and can be classified
into mechanical or chemical. 122,123
3.3.1 Mechanical surface treatment
Resin cements are characterized by their low solubility and good adhesion to the tooth
structure. 124,125
These cements acts as the main link between the indirect esthetic restoration
and the tooth structure. To achieve good bonding to the resin cement, micromechanical means
of retention should be created on the intaglio surface of indirect restorations. 120,122,126,127
Hydrofluoric acid etching and grit-etching are well-known procedures for mechanical surface
treatment. 128
Hydrofluoric acid etching is a procedure that creates micro-roughness on the intaglio
surface of ceramic restorations and improves cement bond. 128,129
The chemical etching of
feldspathic ceramics with hydrofluoric acid results in honeycomb-like topography of the
ceramic surface, which is ideal for micromechanical adhesion. 129,130
This surface topography is
a result of the chemical reaction between hydrofluoric acid and the silica phase of feldspathic
ceramics forming a hexafluorosilicate salt that is easily removed by water rinsing. 130-132
A study performed on the effect of etching time on the bonding procedures evaluating
five different etching times (5, 30, 60, 120 and 180 s) showed that resin cement did not bond to
unetched ceramic while bonding was successfully achieved with the etched ceramic, and the
120 s etch resulted in the highest bond strength. 131
This was further confirmed by Bona et al.

24
who stated that the bond strength of resin cements increases with increasing ceramic surface
roughness induced by acid etching. 133
According to Bona et al. lithium disilicate ceramics have shown higher flexure
resistance and bond strength values when etched with 9.5% hydrofluoric acid as opposed to 4%
acidulated phosphate fluoride. 134
Borges and colleagues reported that etching dental ceramics
with 9.5% hydrofluoric acid for 20 seconds creates an adhesion-favorable surface.122
However, hydrofluoric acid etching results in shallow surface roughness that is
unfavorable for micromechanical interlocking in alumina-reinforced ceramic restorations like
In-Ceram alumina system, and zirconia-reinforced restorations like In-Ceram zirconia system
(Vita Zahnfabrik, Seefeld, Germany) due to their low silica content. 120,122,135,136
Sen et al.
reported that hydrofluoric acid etching was not enough to achieve strong bonding between resin
cements and zirconia ceramics compared to grit-etching which creates a micromechanical
adhesion-favorable surface and can be considered a good alternative to hydrofluoric acid
etching. 137
This study also defined several important parameters to be followed to maximize the
results of surface grit-etching such as particle type, size, shape, incidence angle, and wet versus
dry particles.
Grit-etching alone provides insufficient bond strengths for felspathic ceramics and may
induce chipping and loss of ceramic material and is therefore not recommended for treatment of
silica-based all-ceramic restorations. 138-140
Kato et al. compared grit-etching to different acid-
etching agents on feldspathic porcelain and found that hydrofluoric acid and sulphuric acid
provided the highest bond strengths.130
Lithium disilicate ceramics are capable of achieving good bonding with resin cements
when sandblasted or acid-etched by hydrofluoric acid. It has been shown that lithium disilicate

25
ceramics attained similarly high bond strength values with aluminum oxide grit-etching for 10
seconds and also with hydrofluoric acid etching for 20 seconds.128
Etching indirect composite resin restorations with hydrofluoric acid results in
microstructural alteration of the composite due to the dissolution of the inorganic particles
present in composite resins, and thus the resin organic matrix becomes the dominant component
of the surface which makes the restoration-cement adhesive interface less resistant to
debonding. 123
However, grit-etching indirect composite restorations with aluminum oxide
particles is the best alternative to increase the restoration surface energy. 10,123
Grit-etching
promotes non-selective degradation of the composite and results in better adhesion to the resin
cement.10,123,141,142
3.3.2 Chemical treatment
Silane coupling can be used to enhance the bond between the indirect restoration and the
resin cement. Although it cannot substitute the mechanical surface treatment, it is used as an
additional step to strengthen the bonding by chemical means.128
A silane molecule has ethoxy groups to bond to the inorganic particles of ceramics and
an organofunctional group, typically a methacrylate, to react with the organic matrix of
composite resins forming covalent bonds. 143,144
The chemical structure of the silane is R′—
Si(OR)3, where R′ is the organofunctional group and (OR) is the ethoxy group where R refers
to the alkyl group. The ethoxy group is hydrolyzed to result in a silanol (SiOH) that reacts with
the silicon inorganic particles in the ceramic creating a siloxane covalent bond (Si—O—Si). 145-
148
A silane-coupling agent is applied to the ceramic surface to chemically bond the
inorganic phase in the ceramic and the organic phase of the composite cement. 143,149
Bona et al.
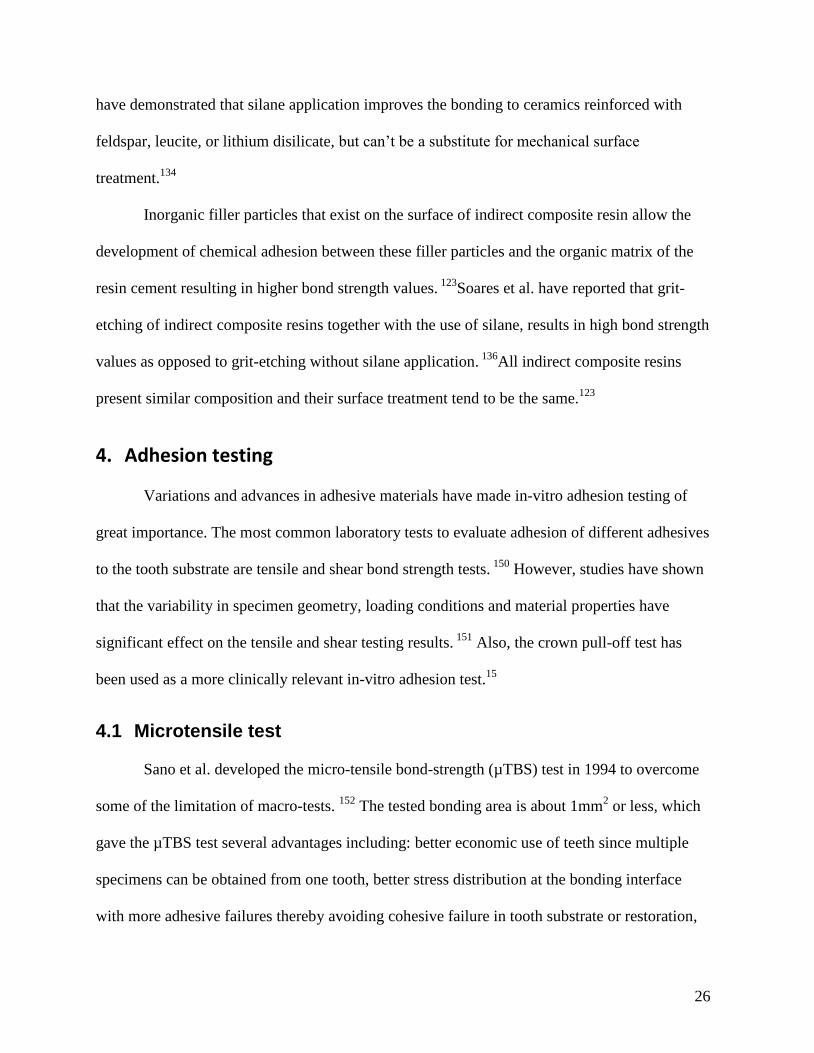
26
have demonstrated that silane application improves the bonding to ceramics reinforced with
feldspar, leucite, or lithium disilicate, but can‘t be a substitute for mechanical surface
treatment.134
Inorganic filler particles that exist on the surface of indirect composite resin allow the
development of chemical adhesion between these filler particles and the organic matrix of the
resin cement resulting in higher bond strength values. 123
Soares et al. have reported that grit-
etching of indirect composite resins together with the use of silane, results in high bond strength
values as opposed to grit-etching without silane application. 136
All indirect composite resins
present similar composition and their surface treatment tend to be the same.123
4. Adhesion testing Variations and advances in adhesive materials have made in-vitro adhesion testing of
great importance. The most common laboratory tests to evaluate adhesion of different adhesives
to the tooth substrate are tensile and shear bond strength tests. 150
However, studies have shown
that the variability in specimen geometry, loading conditions and material properties have
significant effect on the tensile and shear testing results. 151
Also, the crown pull-off test has
been used as a more clinically relevant in-vitro adhesion test.15
4.1 Microtensile test Sano et al. developed the micro-tensile bond-strength (µTBS) test in 1994 to overcome
some of the limitation of macro-tests. 152
The tested bonding area is about 1mm2 or less, which
gave the µTBS test several advantages including: better economic use of teeth since multiple
specimens can be obtained from one tooth, better stress distribution at the bonding interface
with more adhesive failures thereby avoiding cohesive failure in tooth substrate or restoration,

27
and the ability to compare a variety of substrates and areas within the same tooth (e.g.
peripheral versus central dentin). 152-155
However, several protocols are being used in specimen preparation for microtensile
testing, and are classified into trimming and non-trimming protocols. The trimming protocol is
more technique-sensitive than the non-trimming one. Each protocol has its own advantages and
drawbacks. 156,157
Non-trimmed microspecimens are easier and faster in preparation, where the bonded
specimens are sectioned into rectangular bars 0.5–1.5 mm in thickness. Microspecimens
trimmed to a dumbbell or hourglass shape show better stress concentration at the adhesive
interface. Moreover, trimming has to be carefully performed, otherwise interfacial defects may
occur and act as stress concentrators facilitating crack-propagation when the specimen is loaded
in tension, causing premature failure at the interface with a lower recorded bond strength.158
Trimming the interfaces free-hand using a dental handpiece is a very difficult and
technique-sensitive procedure that is dependent on the operator skill. 16,156,157
Semi-automatic
trimming of micro-specimens can be achieved using the so-called microspecimens former
(University of Iowa, Iowa City, IA, USA) to trim rectangular specimens in a standardized well-
controlled manner, into dumbbell shaped specimens or specimens with a circular cross-section.
159,160
Also, more factors need to be standardized within the test settings such as attachment of
specimen to the jig, alignment of specimens and loading speed. 16
Otherwise, these factors will
influence the final outcome of the testing procedure by changing the direction and the severity
of the loading applied.16,161,162

28
The number of recorded pre-testing failures is a major point of debate in the current
literature regarding the µTBS testing. 163
Three main approaches have been applied to manage
the pre-testing failures: one is to ignore pre-testing failures from statistical analysis, which
results in overestimated bond strength results. Another assigns a zero MPa bond strength value
to every pre-testing failure record. However, this is non-realistic as there is a certain initial bond
strength, which in turn penalizes the tested product severely. The third approach is a
modification of the previous one by assigning a certain pre-determined value to every pre-
testing failure. This value can be the lowest µTBS testing value measured within the respective
group. 164-166
These approaches have obvious effects on the mean µTBS value and the
subsequent statistical analysis.
Certainly, micro-specimen processing should be performed as carefully as possible and
special measures should be utilized to avoid pre-testing failures. The measures include the use
of materials such as alginate or gypsum to fill up the spaces between the slabs, which result in
better support for the slabs during the second cutting stage. 20
Several studies have shown that
µTBS testing appears to be able to discriminate between adhesives regarding their bonding
performance in a better way than the traditional shear and tensile bond strength tests. This is
likely why up to 60% of current scientific papers reporting on bond strengths have employed
the µTBS approach.20
4.2 Microshear test In 2002, the microshear bond strength test (µSBS) was introduced as an alternative to
the microtensile test. 167-169
In the microshear test, load is applied to the adhesive interface
usinga blade attached to a universal testing machine to induce shearing forces. 169,170
Shimida et
al. modified the microshear test settings by using a looped orthodontic wire instead of using a

29
blade. 171
In a study by Foong et al. on bond strength to enamel, using the orthodontic wire to
apply shearing forces was easier and more reliable in comparison to using a blade.170
In the microshear test, it is possible to test several specimens per tooth and the bonding
area can be controlled using microbore (tygon) tubes. 170,172
However, when testing microshear
bond strength of composite resins to tooth structure, considerable bending and non-uniform
stress distribution within specimens can occur as a result of the relatively thick adhesive layer
compared to the composite resin cylinder 0.7-1.0 mm in diameter. 170,172
This non-uniform stress
distribution is more pronounced than conventional shear test. 172
Furthermore, it is impossible to
confine the adhesive resin to the bonding area. 173
As a consequence of these shortcomings, the
µSBS test has been used in only 7% of the recent bond strength studies.20
In a recent study comparing microshear and microtensile tests, the microshear bond
strength values were about 1/3 of the micro-tensile values, and there was no difference in the
mode of failures. 174
Another study has shown that microshear test is more accurate in
evaluation of the bond strength compared to the microtensile test since the former was
associated with more adhesive failures.20,21
4.3 Retention Testing Retention tests were developed in the 1970ꞌs to simulate the clinical condition in a better
way than bond strength tests. In retention tests, whole crowns are made and cemented to the
underlying tooth substrate and then subjected to pull-away forces to detach from the underlying
substrate.15
The main advantage of the retention tests over the bond strength tests is that it takes into
account the complex configuration of the substrate to which the crown is cemented, not like the
bond strength tests that consider the substrate as a one-surface flat area. 15
Studies that compare

30
both the retention of the crowns and the bond strength results of dental cements are lacking in
the dental literature.
The configuration factor (C-factor) is the ratio between bonded surfaces and non-
bonded surfaces. The higher the value of the configuration factor, the greater are the stresses
induced at the bonded interfaces as a result of polymerization shrinkage. 23
This configuration
factor is much higher in crowns cemented to their underlying tooth abutments as in the
retention tests assembly, than of composite or ceramic cylinders cemented onto flat substrate
surfaces as in conventional bond strength tests assembly. 15
Several studies have shown the
significant effect of the configuration factor on adhesion, which might explain the low values
obtained from retention testing in the range of 1–10 MPa compared to those obtained from
bond strength testing in the range of 20–40 MPa.24
Since the development of retention tests, most of the tested crowns were metal crowns
modified with a ring or hook through which the crown could be pulled away from the
underlying tooth substrate. 175-179
Recently with the developments in the CAD/CAM technology
and with further developments in ceramic industry, all-ceramic crowns became popular and
several trials were undertaken in attempts to pull them away from the underlying substrate.
15,180-182 However, pulling away the ceramic crowns from the underlying substrate without
causing fracture of the crown remained problematic.
Some studies have increased the thickness of the occlusal portion and formed a hole in
the occlusal surface through which a hook could be attached to pull-off the crown. However,
failure rates up to 65 % of the specimens were recorded due to specimens fracturing before
being detached from the underlying substrate. 183
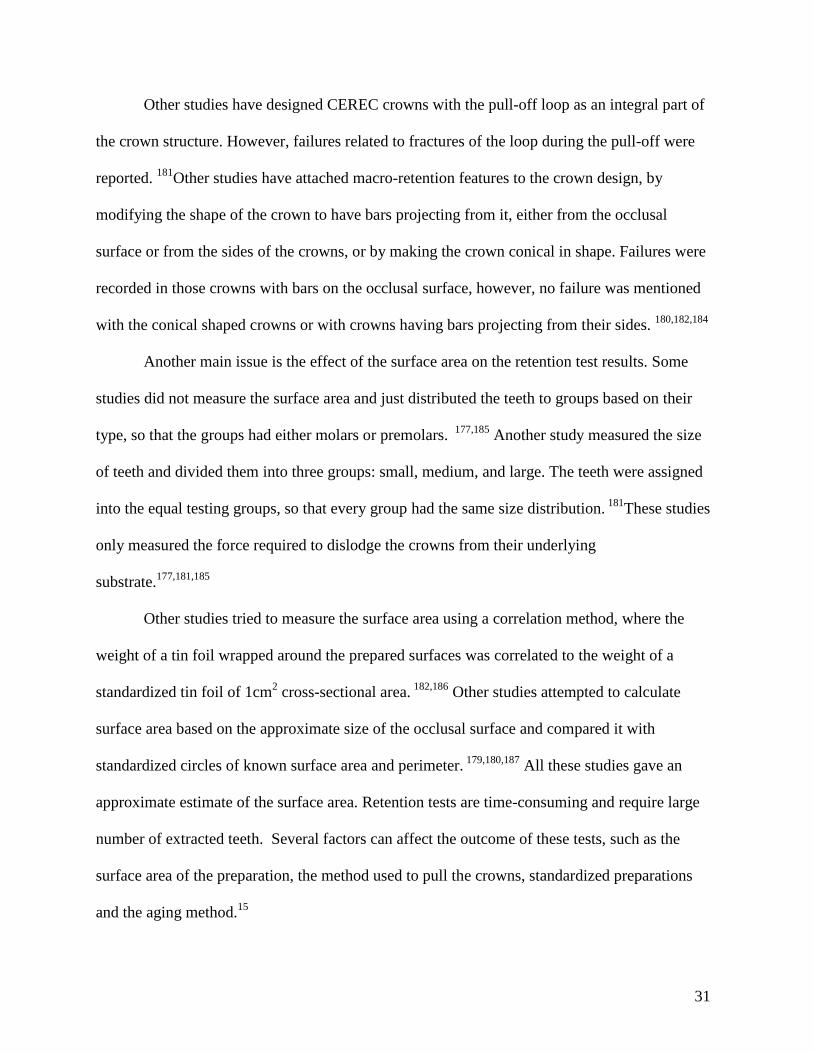
31
Other studies have designed CEREC crowns with the pull-off loop as an integral part of
the crown structure. However, failures related to fractures of the loop during the pull-off were
reported. 181
Other studies have attached macro-retention features to the crown design, by
modifying the shape of the crown to have bars projecting from it, either from the occlusal
surface or from the sides of the crowns, or by making the crown conical in shape. Failures were
recorded in those crowns with bars on the occlusal surface, however, no failure was mentioned
with the conical shaped crowns or with crowns having bars projecting from their sides. 180,182,184
Another main issue is the effect of the surface area on the retention test results. Some
studies did not measure the surface area and just distributed the teeth to groups based on their
type, so that the groups had either molars or premolars. 177,185
Another study measured the size
of teeth and divided them into three groups: small, medium, and large. The teeth were assigned
into the equal testing groups, so that every group had the same size distribution. 181
These studies
only measured the force required to dislodge the crowns from their underlying
substrate.177,181,185
Other studies tried to measure the surface area using a correlation method, where the
weight of a tin foil wrapped around the prepared surfaces was correlated to the weight of a
standardized tin foil of 1cm2 cross-sectional area.
182,186 Other studies attempted to calculate
surface area based on the approximate size of the occlusal surface and compared it with
standardized circles of known surface area and perimeter. 179,180,187
All these studies gave an
approximate estimate of the surface area. Retention tests are time-consuming and require large
number of extracted teeth. Several factors can affect the outcome of these tests, such as the
surface area of the preparation, the method used to pull the crowns, standardized preparations
and the aging method.15

32
5. Microleakage Microleakage is the movement of fluids and bacteria at the interface between the
restoration and tooth tissue. 188,189
Microleakage leads to staining of the margins of the
restoration, hydrolytic breakdown of the adhesive interfaces, and recurrent caries at the tooth-
restoration interface, which if left untreated can result in pulpal pathology. 190,191
Polymerization shrinkage is considered one of the main factors that can result in
microgaps at the tooth restoration interface. 192
These microgaps facilitate fluids and bacterial
ingress at the tooth-restoration interface. 192
Also, clinically, if the adhesive interface or the
adhesion process is compromised, this results in microleakage, which in turn could result in
further adhesive failure. 193
Masticatory chewing cycles and thermal fluctuations in the oral
cavity can induce crack propagation at the adhesive interface, which in turn can cause
microleakage.25
Several methods have been used to evaluate microleakage either in-vivo or in-vitro. In-
vitro microleakage testing is commonly accepted to evaluate the sealability at the adhesive
interface and can help in understanding the mechanisms of microleakage and developing
measures to minimize or even eliminate microleakage. 25
Most of the in-vitro microleakage tests
use tracers like dyes or chemical tracers to evaluate the extent of microleakage. 119,193,194
Some
studies useradioactive isotopes or bacteria as tracers. Other studies use air pressure, neutron
activation analysis, electrical conductivity, or scanning electron microscopy to evaluate
microleakage.25
In-vivo microleakage tests typically involve the use of human teeth that have
previously been selected for orthodontic extraction. These teeth are restored and later extracted

33
after a certain period of time, and microleakage is tested using dye tracers. The teeth are
sectioned and examined under stereomicroscope to assess the degree of dye penetration.195,196

34
Chapter 2 Rationale and objectives

35
1. Statement of the problem The use of CAD/CAM restorations is steadily increasing. However, proper function and
longevity of these restorations depends on their good adhesion to the underlying substrate.3
Self-adhesive resin cements simplify the clinical procedures and are less technique
sensitive compared to adhesive-based resin cements. The use of self-adhesive resin cement
with lithium disilicate CAD/CAM material has not as yet been explored. Also, little information
exists on the use of self-adhesive resin cements with composite resin CAD/CAM material.
To evaluate the interaction between self-adhesive cements and CAD/CAM materials,
microtensile and microshear bond strength tests offer several advantages compared to the
conventional shear and tensile bond strength tests, such as more uniform stress distribution
during loading and the capacity to obtain multiple specimens from one tooth. However, the
cutting procedures induce stresses that lead to several pre-test failures and affect the measured
bond strength results. 17-20
The bonding of the specimens after their cutting to avoid these
stresses and then performing the tests have not as yet been explored. Also, little information
exists regarding comparing microtensile and microshear bond strength tests.
Retention testing is another alternative method to evaluate bonding performance of resin
cements. It takes into consideration the complex configuration of the abutment tooth. Retention
of lithium disilicate glass ceramic and composite resin crowns has not as yet been explored.
Also, the retention test methodology needs modification in order to be applicable to ceramic
and composite crowns and the abutment surface area needs to be measured to express the
results of the retention tests in terms of stress values, which is more accurate than just
evaluating the retention force.
36
Microleakage testing indicates the sealability of the adhesive interface between the
restoration and the underlying tooth. Microleakage is an important factor that can affect
adhesion as well as it can be affected by adhesion. Microleakage of lithium disilicate glass
ceramic and composite resin crowns has not as yet been investigated.
Therefore, this study was conducted to evaluate the adhesion and microleakage of
lithium disilicate ceramic CAD/CAM material and composite CAD/CAM material to the
underlying substrate using self-adhesive resin cements. Microtensile and microshear bond
strength tests were applied to evaluate the bond strengths. Retention testing was performed to
measure the retention strength. Dye penetration was used to evaluate microleakage.
2. Objectives
To evaluate the effect of resin cements, crown materials and bonding substrates on
microtensile bond strength between CAD/CAM materials and different substrates using
two self-adhesive resin cements and two adhesive-based resin cements, employing a
modified technique for specimen preparation.
To evaluate the effect of resin cements, crown materials and bonding substrates on
microshear bond strength between CAD/CAM materials and different substrates using
two self-adhesive resin cements and two adhesive-based resin cements, employing a
modified technique for specimen preparation.
To evaluate the effect of resin cements, crown materials and bonding substrates on
retention strength between CAD/CAM materials and different substrates using a self-
adhesive resin cement and an adhesive-based resin cement, employing a modified
technique for specimen preparation.

37
To compare a self-adhesive resin cement and an adhesive-based resin cement with
respect to microleakage between CAD/CAM materials and natural tooth substrate.

38
Chapter 3 Microtensile bond strength of self-adhesive resin cements to non-metallic crown CAD/CAM materials, composite
and dentin

39
1. Abstract Objectives: To evaluate microtensile bond strength (μTBS) between two CAD/CAM crown
materials and dentin or composite-resin substrate using two self-adhesive, an etch-and-rinse and
a self-etch resin system; and to compare the effect of two surface treatments of the ceramic
crown material on μTBS. Methods: Lithium disilicate ceramic (IPS e.max CAD, Ivoclar-
Vivadent/EMX), composite-resin (Paradigm MZ-100, 3M-ESPE/PZ) blocks, and custom-made
composite-resin (Z100 restorative, 3M-ESPE) blocks were cross-sectioned into microbars
approximately 1×1×5 mm3. Similar dentin specimens were obtained from the coronal portion of
freshly extracted molars. EMX microbars were either sandblasted (50μm Al2O3) or etched with
HF acid and silanated. PZ microbars were only sandblasted and silanated. EMX and PZ
specimens were then bonded to either dentin or composite resin microbars using two self-
adhesive cements (RelyX Unicem, 3M-ESPE; Clearfil SA, Kuraray) and two adhesive-based
cements (Multilink Automix, Ivoclar-Vivadent;RelyX-ARC, 3M-ESPE) using a custom-made
device (n=10). A static load of 146 g was maintained until initial setting of the cement.
Specimens were stored in water (37°C) for 24 h, thermocycled (500 cycles, 5- 55°C), then
subjected to μTBS test. Means and standard deviations were calculated and data statistically
analyzed by factorial ANOVA test (α=0.05). Results: ANOVA revealed significant differences
among the groups (P<0.05). For composite substrate, highest mean μTBS (32.7±2 MPa) was
obtained when RelyX-ARC was used with PZ, while lowest mean μTBS (11.6±1.3 MPa) when
Rely-X Unicem was used with EMX. For dentin, highest mean μTBS (28.8±2.3 MPa) was
obtained when RelyX-ARC was used with PZ, while lowest mean μTBS (8.61±1.3 MPa) was
obtained when Clearfil-SA was used with EMX. Conclusions: Overall adhesive-based cements
resulted in higher mean μTBS irrespective of the substrate material. Whereas, self-adhesive

40
resin cements resulted in lower mean μTBS irrespective of the substrate. For EMX, HF-
treatment resulted in higher mean μTBS as compared to grit-etched surface.
2. Introduction Computer-aided-design/computer-aided-manufacture (CAD/CAM) systems are
becoming more popular since this technique is less time-consuming for the dentist and the
patient by providing esthetic restorations in a single appointment without the need for dental
laboratory support. These restorations are made of high quality ceramic or composite resin
materials. 1,2
However, adequate adhesion between these restorations and tooth substrate is a
prerequisite for proper function and longevity of these restorations. 3
Tooth structure needs special treatment with certain adhesive systems in order to
achieve adequate micromechanical bonding with the overlying esthetic restoration. However,
self-adhesive resin cements simplify the clinical procedures and can be applied directly to the
tooth structure without the application of any adhesive system.4,5
Esthetic restorations also require special treatment to achieve adequate bonding with the
underlying substrate. Ceramic CAD/CAM restorations are roughened by acid etching and/or
grit-etching to achieve micro-mechanical interlocking. 4
Some studies showed that hydrofluoric
acid etching and grit-etching of ceramic restorations result in similar bonding performance
between the restorations and resin cements, 197
while other studies have shown that hydroflouric
acid etching is more advantageous than grit-etching with regard to the bonding performance. 130
On the other hand, composite CAD/CAM restorations can be roughened by grit-etching only
for micro-mechanical interlocking, since hydrofluoric acid etching of composite resins causes
total dissolution of the inorganic fillers and partial degradation of the resin matrix which
negatively affects the adhesion to these restorations. 6,7,198
After mechanical surface treatment, it
41
is better to establish a chemical link between the restoration and the resin cement. Silane
coupling agents are used to coat the treated ceramic and composite restorations in order to
achieve the desired chemical bonding with the resin cement. 4,6-8
Whereas, hydrofluoric acid
etching of composite restorations can damage the resin matrix and decrease both the
mechanical properties and the bonding performance of the restoration.9-12
Several factors influence the bonding of CAD/CAM restoration to the underlying
substrate, such as the type of the resin cement, the type of the restoration and even the type of
underlying substrate. 4,13,14
These factors are commonly investigated using in-vitro adhesion
tests such as tensile, shear, microtensile and microshear bond strength tests. 15
The micro-
tensile bond strength test offers several advantages compared to the conventional shear and
tensile bond strength tests since multiple specimens can be cut from one large sample and the
stress distribution produced during loading is more uniform. 16,19
This leads to higher bond
strengths with fewer cohesive fractures.17-19
In the conventional microtensile testing technique: the dentin surface is exposed within
the tooth (bonding substrate) and the crown material is cemented to the dentin substrate, which
is followed by cutting the whole specimens in two perpendicular directions to obtain microbars.
16,172 However, large amount of specimens have shown pre-test failure and even those
microbars that survived the cutting procedures have been exposed to the cutting stresses that
may make the results doubtful. 199
Also, the pre-test failures create problems in statistical
analysis, where three approaches exist to deal with these pre-test failures, either by excluding
specimens that show pre-test failure so that they will not contribute to the result, or by assigning
them half of the lowest value or by assigning them zero value. 16,199
Every statistical approach
results in a different outcome even within the same study.16,199

42
Thermocycling is considered to be a clinically relevant aging technique. In our study,
thermocycling was used to stress the adhesive interface by temperature fluctuations for 500
cycles between 5 °C and 55 °C, causing volumetric expansions and contractions in aqueous
conditions. The stresses induced during these cycles are due to differences in the coefficient of
thermal expansion and contraction in the materials constituting the adhesive interface. Versluis
et al.(1996) stated that temperature fluctuations could cause fatigue of the adhesive joint.
200Also, Hashimoto et al., 2000 mentioned that a hot water bath (55 °C) may accelerate the
hydrolytic reactions at the adhesive interface facilitating leaching out of residual oligomers and
collagen breakdown products. 201
Our study aimed to modify the microtensile testing methodology to avoid the pre-test
failures and to investigate the bond strength of self-adhesive resin cements versus adhesive-
based resin cements when they are used to bond lithium disilicate glass ceramic material and
composite resin material to the underlying dentin and composite resin substrates. Also, it was
our aim to compare the effect of two surface treatments on lithium disilicate glass ceramic.

43
3. Materials and Methods
3.1 Materials All the materials used in the study and their composition (as reported by the manufacturers) are
listed in Table1.
3.2 Methods: 3.2.1 Pilot study:
The current study was preceded by an external pilot study to detect any problems with the
proposed methods of testing, where 2 samples per group were used in the pilot study. Following
the completion of the pilot study, 240 specimens were used in the main study.
3.2.2 Main study
Twenty-four groups were formed (n=10)(Figure 1).The number of specimens per group
was calculated using web-based softwarefor sample size analysis at α=0.05 and 80% power
and effect size equal to 0.32 which yields a sample size of 7 samples per group. We increased
sample size to 10 per group to enhance power. The effect size (f) was calculated by using the
following formula, developed by Cohen (1999):
𝑓=𝑑 ×1
2
𝑘+1
3 𝑘−1
Where k is the number of groups and d is the difference in means(x1-x2) divided by common
standard deviation (σ).Based on values obtained from the pilot study, x1=18.23, x2=15.76, σ=
2.32, the d value was calculated (d= 1.064), and 𝑓 was calculated (0.32).
Power Analysis For ANOVA Designs http://www.math.yorku.ca/SCS/Online/power/

44
Table 1: Materials and their composition (as reported by manufacturers)
Material Classification Brand /
Manufacturer
Composition Lot #
CA
D/C
AM
Mat
eria
ls
Lithium
disilicate
ceramic
IPS e.max
CAD/
Ivoclar
Vivadent,
Liechtenstein
SiO2 (57 – 80 wt.%),
Li2O (11 – 19 wt.%)
K2O (0 – 13 wt.%),
P2O5 (0 – 11 wt.%),
ZrO2 (0 – 8 wt.%),
ZnO (0 – 8 wt.%),
Other and coloring oxides (0-12 wt.%)
P63946
Indirect
Composite
resin
Paradigm™
MZ100/
3M ESPE, St
Paul, MN,
USA
85 wt.% ultrafine zirconia-silica
ceramic particles that reinforce a highly
cross-linked polymeric matrix.
The polymer matrix consists of
BisGMA and TEGDMA, and employs
a ternary initiator system.
N250997
Res
in C
emen
ts
Sel
f-ad
hes
ive
resi
n c
emen
tsyst
em
Sel
f-ad
hes
ive
cem
ent
RelyX™
Unicem/
3M ESPE, St
Paul, MN,
USA
It consists of two pastes:
Base paste: methacrylate monomers
containing phosphoric acid groups,
methacrylate monomers, silanated
fillers, initiator components, and
stabilizers.
Catalyst paste: methacrylate monomers,
alkaline (basic) fillers, silanated fillers,
initiator components, stabilizers, and
pigments.
(Filler=50% vol., 72 wt.%; avg. < 12.5
μm)
427554
Sil
ane
coupli
ng
agen
t
RelyX
Ceramic
primer /
3M ESPE, St
Paul, MN,
USA
Stable solution of a prehydrolyzed
silane-coupling agent, alcohol and
water.
N234072

45
Material Classification Brand /
Manufacturer
Composition Lot #
Res
in C
emen
ts
Sel
f-ad
hes
ive
resi
n c
emen
tsyst
em
Sel
f-ad
hes
ive
cem
ent
Clearfil SA/
Kuraray
Medical Inc.,
Sakazu,
Kurashiki,
Okayama,
Japan
It consists of two pastes:
Paste A: 10-MDP, Bis-GMA,
TEGDMA, Hydrophobic aromatic
dimethacrylate, dl-Camphorquinone,
BPO Initiator, Silanated barium glass
filler and Silanated colloidal silica.
Paste B: Bis-GMA, Hydrophobic
aromatic dimethacrylate, Hydrophobic
aliphatic dimethacrylate, Accelerators,
Pigments, and Surface treated sodium
fluoride, Silanated barium glass filler
and Silanated colloidal silica.
(Filler= 45 % vol., 66 wt.%; avg. 2.5
μm)
011AAA
Sil
ane
coupli
ng a
gen
t
Clearfil
Ceramic
primer/
Kuraray
Medical Inc.,
Sakazu,
Kurashiki,
Okayama,
Japan
Mixture of 3-trimethoxysilylpropyl
methacrylate (<5 wt.%), ethanol (>80
wt. %) and 10-Methacryloyloxydecyl
dihydrogen phosphate
00019D

46
Material Classification Brand /
Manufacturer
Composition Lot #
Res
in C
emen
ts
Adhes
ive-
bas
ed r
esin
cem
ents
yst
em
Sel
f-et
chin
g b
ondin
g
agen
t
Multilink
Primer A/B
/Ivoclar
Vivadent,
Liechtenstein
Two Bottle self-etching adhesive.
Multilink Primer A: water (85.7 wt.%)
and initiators (14.3 wt.%)
Multilink Primer B: Phosphonic acid
acrylate (48.1 wt.%), HEMA (48.1
wt.%), Methacrylate mod. polyacrylic
acid (3.8 wt.%) and Stabilizers (<0.02
wt.%)
Multilink
Primer
A:
P63825
Multilink
Primer B:
P65434
Adhes
ive-
bas
ed r
esin
cem
ent
Multilink
Automix/
Ivoclar
Vivadent,
Liechtenstein
It consists of two pastes:
Base paste:
Dimethacrylate and HEMA (30.5
wt.%), Barium glass filler and Silica
filler (45.5 wt.%), Ytterbiumtrifluoride
(23 wt.%), Catalysts and Stabilizers (1
wt.%), Pigments (<0.01 wt.%)
Catalyst paste:
Dimethacrylate and HEMA (30.2
wt.%), Barium glass filler and Silica
filler (45.5 wt.%), Ytterbiumtrifluoride
(23 wt.%),Catalysts and Stabilizers (1.3
wt.%)
(Filler=45.5 wt.%; avg. = 0.9 μm)
Multilink
Cement:
P67924
Sil
ane
coupli
ng a
gen
t
Monobond
Plus primer
/Ivoclar
Vivadent,
Liechtenstein
Solution of adhesive monomers (4
wt.%) and ethanol (96 wt.%), the
adhesive monomers combine three
different functional groups – silane
methacrylate, phosphoric acid
methacrylate and sulfide methacrylate.
Primer:
P59584

47
Material Classification Brand /
Manufacturer
Composition Lot #
Res
in C
emen
t
Adhes
ive-
bas
ed r
esin
cem
ents
yst
em
Aci
d e
tch
Scotchbond™
Phosphoric
Etchant /
3M ESPE, St
Paul, MN,
USA
The etchant is 35% phosphoric acid by
weight. It has a pH of approximately
0.6
N252067
Bondin
g a
gen
t
Adper™
Single Bond
Plus /
3M ESPE, St
Paul, MN,
USA
One-bottle adhesive containing ethanol,
2- HEMA, BisGMA, other
dimethacrylate resins, methacrylate-
modified polycarboxylic acid
copolymer, silica nanofiller, a small
amount of water and a photoinitiator
system.
N241285
Adhes
ive-
bas
ed r
esin
cem
ent
RelyX™ ARC/
3M ESPE, St
Paul, MN,
USA
It is composed of BisGMA and
TEGDMA polymer, it consists of two
pastes:
Paste A: zirconia/silica filler(68 wt.%),
pigments, amine and photo initiator
system.
Paste B:zirconia/silica filler (67 wt.%),
BPO activator
(Filler=67.5 wt.%; avg. = 1.5 μm)
N247407
Sil
ane
coupli
ng a
gen
t
RelyX
Ceramic
primer /
3M ESPE, St
Paul, MN,
USA
Stable solution of a prehydrolyzed
silane-coupling agent, alcohol and
water.
N234072

48
Abbreviations: BIS-GMA (bisphenol a diglycidyl ether dimethacrylate), BPO (benzoyl
peroxide), HEMA (hydroxyethyl methacrylate), MDP (methacryloyloxydecyl dihydrogen
phosphate), and TEGDMA (tetraethyleneglycol dimethacrylate).
Material Classification Brand /
Manufacturer
Composition Lot #
Mec
han
ical
Surf
ace
trea
tmen
t
mat
eria
l
Grit-etching
Aluminum
Oxide-50
Micron/
Danville
Engineering
Inc., California
50 microns aluminum oxide powder.
25671
Acid etching
IPS Ceramic
Etching Gel
/Ivoclar
Vivadent,
Liechtenstein
The etchant is <5% hydrofluoric acid. It
has a pH of approximately 2
P72319
Com
posi
te f
illi
ng
mat
eria
l
Composite
resin
Z100™
Restorative
/3M ESPE, St
Paul, MN,
USA
The matrix of this composite consists of
BisGMA and TEGDMA polymer. The
filler is zirconia/silica. The inorganic
filler loading is 66% by volume with a
particle size range of 3.5 to 0.01
micron.
N225470

49
Figure 1: Study groups, the total number of specimens are 240 specimens (10 per group x 24 group)
Lithium disilicate glass ceramic
(IPS e.max CAD )
(HF etched and silanated)
The Same
Indirect composite resin
(Paradigm MZ100)
(Grit-etched and silanated)
The Same
Lithium disilicate glass ceramic
(IPS e.max CAD )
(Grit-etched and silanated)
Composite resin
(Composite Z100 Restorative)The same
Dentin
Self-adhesive
(Relx X Unicem)
Self-adhesive
(Clearfil SA)
Self-etch adhesive-based
(Multilink Automix)
Etch-and-rinse adhesive-based
(Rely X ARC)

50
3.2.2.1 Specimen Preparation: Preparing IPS e.max CAD and Paradigm™ MZ100 specimens:
IPS e.max CAD Blocks (Ivoclar Vivadent, Liechtenstein) and Paradigm™ MZ100
Blocks (Ivoclar Vivadent, Liechtenstein)(Figure 2) were prepared according to a new technique
presented in Figure 3. The blocks were cut perpendicular to the long axis with a low speed
diamond saw (Isomet, Buehler, Lake Bluff, IL) under copious water to expose flat freshly-cut
material surface. Each block was then cut perpendicular to the flat surface into slabs of 1mm
thickness using the same saw. The block of slabs was then rotated 90º and again cut
perpendicular to the surface. IPS e.max CAD and Paradigm™ MZ100 microbars of cross
sectional area 1± 0.1 mm2 (Figure 4), were separated to be utilized for microtensile bond
strength test according to the ―non-trimming‖ method of the μTBS test. The IPS e.max CAD
microbars were crystallized in a ceramic furnace (EP 600 Combi, Ivoclar Vivadent,
Liechtenstein) according to the manufacturer instructions presented in Table 2.
Figure 2: Crown materials, IPS e.max CAD (left), Paradigm MZ100 (right).

51
Figure 3: Conventional microtensile technique aims at bonding the specimen first then cutting it. The new
techniqueproposed in this study aims at cutting specimens first then bonding them to avoid premature failures.

52
Figure 4:Isomet diamond cutting saw (left), Microbars(right): 1: IPS e.max CAD, 2:
Paradigm MZ100, 3: Dentin, 4: Composite Z100 restorative
The IPS e.max CAD and Paradigm™ MZ100 microbars were embedded in a plastic
rubbery base to expose the surface only for the surface treatment procedure.50 µm aluminum
oxide particles (Figure 5) were used for grit-etching the microbars using an air abrasion device
(Microetcher ERC, Danville Engineering Inc., California)from a distance of approximately 10
mm for 15 seconds under 2 bar pressure at the nozzle(Figure 6). The microbars were then
cleaned with compressed air for 30 seconds and then placed in distilled water in an ultrasonic
cleaner (FS5 Fisher Scientific, Sheboygan, Wisconsin, United States) for 5 minutes and air-
dried. Another group of IPS e.max CAD microbars was treated with 5 % hydrofluoric acid (IPS
Ceramic EtchingGel, Ivoclar Vivadent, Liechtenstein)(Figure 5) for 20 seconds, and then
washed thoroughly for 1 min under tap water and air-dried. Then, the grit-etched lithium
disilicate ceramic (IPS. e.max CAD GE), the hydrofluoric acid etched lithium disilicate ceramic
(IPS e.max CAD HF) and the grit-etched composite resin (Paradigm MZ100) were chemically
treated with silane coupling agent (Table 1) according to manufacturer instructions (Table
3).The surface that was utilized in adhesion and exposed to surface treatment is the surface that
was cut by the low speed saw.
1
2
3
4

53
Table 2: Crystallization program for the IPS e.max CAD.
Material Stand-by temperature
(°C)
Closing time
(min.)
Heating rate
(°C/min)
Firing temperature
T1 (°C)
Holding time
(min.)
Heating rate
(°C/min)
Final firing temperature
T2 (°C)
Holding time
(min.)
Vacuum 1
(°C)
Vacuum 2
(°C)
Long term
cooling (°C)
IPS e.max CAD
403
6:00 60 770 0:10 30 850 10:00 550 770 700

54
Figure 5: Surface treatment materials,Aluminum oxide 50 micron powder (left), IPS
Ceramic etching gel (right)
Figure 6: The Grit-etching procedure; a) The microetcher and dust collector cabinet,
b) microbars embedded in plastic rubbery base ready for grit-etching, c) Grit-etching the microbar
a
b
c
55
Dentin microbars:
Intact caries-free human molars were collected and sterilized with gamma radiation
(Gamma cell 220, Atomic Energy Ltd, Mississauga, Canada) at the Department of Chemical
Engineering and Applied Chemistry, University of Toronto. Teeth were placed in a glass jar
that was placed in a cobalt chamber 5.5x8 inches, and exposed for 4 hours. The radiation dose
rate was 0.3 KGy/h. This method of sterilization has been proved to not alter the tooth tissue
structure and mechanical or physical properties.202,203
Teeth were kept, whenever possible, in distilled water in a refrigerator during and
between all experimental procedures, in order to preserve their optimum mechanical and
physical properties. Roots were then embedded in chemically-cured acrylic resin bases (Ivolen,
Ivoclar Vivadent, Liechtenstein, Germany) to facilitate handling during cutting procedures.
The crown was cut perpendicularly to the long axis at approximately 4 mm from the
cemento-enamel junction with a low-speed diamond saw (Isomet, Buehler, Lake Bluff, IL)
under copious water to expose a flat dentin surface. If needed, the surface was further ground
with the same saw until complete removal of enamel was achieved. Each tooth was cut
perpendicular to the flat dentin surface into slabs of 1 mm thickness using the low speed cutting
saw under copious water. The block of slabs was then rotated 90º and cut perpendicular to the
surface. Dentin rods1±0.1 mm2 in cross-sectional area were separated (Figure 4) to be utilized
for microtensile bond strength test according to the ―non-trimming‖ method of the μTBS test.
The coronal surface of dentin to be utilized in adhesion was adjusted with a wheel diamond bur
(#2909 314 040, Brassler, Komet, USA) similar to the one used in crown preparation listed
above to induce clinically relevant standardized surface roughness.

56
Composite Z100™ Restorativemicrobars:
Z100™ Restorative Composite (3M ESPE, St Paul, MN, USA) (Figure 7) was used to
make a composite block in 2 mm increments. A Demi LED (light-emitting-diode) light
polymerization unit (Kerr Corporation, Middleton, WI, USA, 1100-1200 mW/cm2) was used
for light-curing each increment for 40 seconds. The surface layer of the block was cut using the
low-speed cutting saw under copious water to produce a flat composite surface. The block was
cut perpendicular to the flat composite surface into slabs of 1 mm thickness using a low speed
cutting saw (Isomet, Buehler, Lake Bluff, IL) under copious water. The block of slabs was then
rotated 90º and again cut perpendicular to the surface. Composite microbars 1± 0.1 mm2 in
cross-sectional area were separated, to be utilized for μTBS test according to the ―non-
trimming‖ method. The surface to be utilized in adhesion was adjusted with a wheel diamond
bur (#2909 314 040, Brassler, Komet, USA) to induce clinically relevant standardized surface
roughness.
Figure 7: Composite Z100 Restorative
3.2.2.2 Bonding procedure: Dimensions of microbars to be bonded were measured using a digital caliper
(Mastercraft, Toronto, Canada) and the surface area was calculated. The microbars were

57
randomly distributed among the groups. CAD/CAM microbars (IPS e.max CAD GE, IPS e.max
CAD HF and Paradigm MZ100) were bonded to either dentin or composite resin (composite
Z100 restorative) microbars. The microbars to be bonded to each other were placed in the
attachment device (Figure 8) for trial positioning, a 3x magnifying loupes were used to make
sure that the microbars were well adapted to each other. Once the position of the rods was
satisfactory, the bonding procedures were started. For groups to be bonded using RelyX ARC
cement, the surface was etched by phosphoric acid for 15 seconds and bonding agent was
applied according to the manufacturer instructions (Table 3). For groups to be bonded using
Multilink cement, the surface was treated by self-etching Multilink primer according to the
manufacturer instructions(table 3).
Four cements were used for the cementation procedures: two adhesive-based cements
(RelyX-ARC, 3M-ESPE and Multilink Automix, Ivoclar-Vivadent) and two self-adhesive resin
cements (RelyX-Unicem, 3M-ESPE; Clearfil SA, Kuraray), each cement was mixed according
to the manufacturer instructions (Table 3) and applied to the microbar specimens using
microbrushes. The microbars were pressed against each other using a fixed pressure (146 gram)
applied on the attachment device to reach a minimal film thickness. Excess resin was removed
from around the microbars with microbrushes. Luting resins were polymerized in 20 seconds
stages in two opposite sides of the specimens using a Demi LED (light-emitting-diode) light
polymerization unit (Kerr Corporation, Middleton, WI, USA, 1100-1200 mW/cm2). The
microbar specimens were inspected under stereomicroscope at 10x magnification for the
interface integrity (i.e. no voids or bubbles at the interface).

58
Figure 8:Bonding microbars;a) Attachment Device, b) microbars pressed against
each other, c) Bonded microbars
3.2.2.3 Thermocycling:
Bonded specimens were stored in distilled water at 37°C for 24 hours. They were then
subjected to artificial thermal ageing (Thermocycling procedure) according to the ISO (The
International Organization for Standardization, ISO TR 11450 standard, 1994)
recommendations. Thermocycles were performed using a dwell time of 30 seconds in each bath
and a transfer time of 15 seconds between baths for 500 cycles between 5°C and 55°C. Then
specimens underwent the bond testing procedures immediately after thermocycling.
a b
c

59
Table 3: Materials and sequence followed for cement application.
Classification Materials
(Manufacturers)
Etchant primer Adhesive Silane coupling
agent
(ceramic primer)
Luting Resin
Cement
Sel
f-ad
hes
ive
resi
n c
emen
ts
RelyX Unicem (3M ESPE, St
Paul, USA)
------- ------ ------ Apply 3M™
RelyX™ ceramic
primer to the
roughned crown
material and allow
to dry for 5
seconds.
Dispense the cement
onto a mixing pad
and mix for 10
seconds, then apply
the cement in a thin
layer on the bonding
surfaces with micro
brush, remove
excess , light-cure
(20s).
Clearfil SA
(Kuraray Medical
Inc, Okayama,
Japan)
------- ------ ------ Apply Clearfil
ceramic primer to
the roughened
crown material and
dry gently with oil-
free air .
Dispense and mix
the cement using the
automixtips, then
apply the cement in
a thin layer on the
bonding surfaces
with micro brush,
remove excess,
light-cure (20s).

60
Classification Materials
(Manufacturers)
Etchant primer Adhesive Silane coupling
agent
(ceramic primer)
Luting Resin
Cement
Adhes
ive-
bas
ed r
esin
cem
ents
Multilink
Automix
(Ivoclar Vivadent,
Liechtenstein)
------- Mix Multilink
Primer liquids
A and B in a
1:1 mixing
ratio, apply
with a micro-
brush on the
bonding
substrate
surface, allow
15 seconds
reaction time,
then gently dry
with air. The
primer is self-
curing.
------- Apply Monobond
Plus primer to the
roughened crown
material, let to
react for 60 sec,
then dry gently
with water- and oil-
free air.
Dispense and mix the
cement using the
automixtips, then
apply the cement in
a thin layer on the
bonding surfaces
with micro brush,
remove excess,
light-cure (20s).
RelyX™ ARC
(3M ESPE, St
Paul, USA)
Apply
Scotchbond
™ Etchant
for 15
seconds,
water rinse
for 10
seconds. Blot
excess water
with a moist
cotton pellet .
------ Apply 2 coats of
3M™ Single
Bond Adhesive
to the bonding
substrate using
microbrushes,
let to dry for 5
seconds. Then
light-cured for
10 seconds.
Apply 3M™
RelyX™ ceramic
primer to the
roughened crown
material and allow
to dry for 5
seconds.
Dispense the cement
onto a mixing pad
and mix for 10
seconds, then apply
the cement in a thin
layer on the bonding
surfaces with micro
brush, remove
excess, light-cure
(20s).

61
3.2.2.4 Microtensile bond strength testing (µTBS): Cyanoacrylate glue (Krazy glue, Columbus, OH, USA) was used to attach the
microtensile specimens to the opposing free-sliding halves of a testing jig. The testing jig was
specially designed to transfer tensile forces to the specimen purely without any torque and to fit
the microtensile testing machine (BISCO Microtensile Tester, BISCO Inc., Figure 9). The
specimens were loaded in tension to failure at a crosshead speed of 0.5 mm /min, and the µTBS
was expressed in MPa. If the adhesive interface of any specimen was contaminated with
cyanoacrylate glue, the specimen was discarded because the bond strength would not have been
represented correctly.
Figure 9: Testing jig placed in the microtensile-testing machine.

62
Figure 10:Bonded microbars glued using cyanoacrylate glue to the free sliding parts
of a testing jig, and loaded in tension till failure at cross head speed 0.5 mm/min.
3.2.2.5 Evaluation of the mode of failure: A single operator inspected the two halves of each specimen under a stereomicroscope
(Wild/Leica M3Z Stereo Microscope, Heerbrugg, Switzerland) at 40x magnification. The
modes of failure were evaluated according to the following scheme:
1= Adhesive (crown material/cement interface): when at least 75% of the cement layer
exists on the substrate material (dentin or composite)
2= Adhesive failure (substrate/cement interface): When at least 75% of the cement layer
exists on the crown material(IPS e.max CAD or Paradigm MZ100)
3= Mixed: when adhesive failure occurs at both interfaces, the cement layer exists on less
than 75 % of the crown material and substrate.
4= Cohesive failure of the crown material
5= Cohesive failure of the substrate (dentin or composite)
6= Mixed cohesive/adhesive: when adhesive failure is accompanied with any cohesive
failure

63
3.2.2.6 Statistical analysis: Statistical analysis was computed using SPSS (PC+ version 20 software, Chicago, IL, USA).
Means and standard deviation values of the µTBS were calculated. This data is quantitative
(continuous) data. Statistical analysis was carried out using Factorial analysis of variance
(Factorial ANOVA) to explore the impact of CAD/CAM material, type of cement and substrate
on the µTBS. CAD/CAM material was divided in three levels according to the material /surface
treatment combination (Group 1: IPS e.max CAD GE; Group 2: IPS e.max HF; Group 3:
Paradigm MZ 100). Type of cement was divided in four levels(Group 1: Rely X Unicem;
Group 2: Clearfil SA; Group 3: Multilink Automix; Group 4: Rely X ARC). Substrate was
divided in two levels (Group 1: Dentin; Group 2: Composite resin).The significance level was
set at P ≤ 0.05 and 95 % confidence level.

64
4. Results
The results of factorial ANOVA are presented in Table 4. Interaction effect between
CAD/CAM material, type of cement and substrate was statistically significant, F (6, 216) =
9.547, (p<0.001).
Table 4: Factorial ANOVA (Dependent variable: Bond strength; Independent
variables: CAD/CAM material, type of cement and type of the substrate)
Source Type III Sum of
Squares
df Mean Square F Sig.
Corrected Model 9478.270a 23 412.099 124.094 .000
Intercept 87225.426 1 87225.426 26265.911 .000
CAD/CAM material 3823.080 2 1911.540 575.616 .000
Substrate 1642.325 1 1642.325 494.548 .000
Type of Cement 3452.245 3 1150.748 346.521 .000
CAD/CAM material * Substrate 178.997 2 89.499 26.950 .000
CAD/CAM material * Type of
Cement
134.965 6 22.494 6.774 .000
Substrate * Type of Cement 56.427 3 18.809 5.664 .001
CAD/CAM material * Substrate
* Type of Cement
190.230 6 31.705 9.547 .000
Error 717.306 216 3.321
Total 97421.001 240
Corrected Total 10195.576 239
a. R Squared = .930 (Adjusted R Squared = .922)
4.1 Comparison between resin cements Since a significant interaction was detected, comparison between types of cements was
performed within levels of the other independent factors; CAD/CAM material (Group 1: IPS
e.max CAD GE; Group 2: IPS e.max HF; Group 3: Paradigm MZ 100) and substrate (Group 1:
Dentin; Group 2: Composite resin).The follow-up analysis was carried out using one-way

65
analysis of variance (one-way ANOVA)for every level of comparison. One-way ANOVA
showed significance at p<0.001at all levels of comparison. The results of the one-way ANOVA
are presented in Table 5. Post-hoc comparisons were carried using Tukey‘s test; the
significance level was set at P ≤ 0.05 and 95 % confidence level. The means and the standard
deviation (SD) values are presented in Table 6.
Table 5: One way ANOVA (Dependent variable: Bond strength; Independent variable:
type of cement)
CAD/CAM
material
Substrate Sum of
Squares
df Mean
Square
F Sig.
IPS e.max
CAD GE
Dentin Between Groups 410.171 3 136.724 56.145 .000
Within Groups 87.667 36 2.435
Composite
resin
Between Groups 424.279 3 141.426 75.720 .000
Within Groups 67.239 36 1.868
IPS e.max
CAD HF
Dentin Between Groups 1020.627 3 340.209 100.513 .000
Within Groups 121.851 36 3.385
Composite
resin
Between Groups 346.209 3 115.403 41.820 .000
Within Groups 99.342 36 2.760
Paradigm
MZ100
Dentin Between Groups 843.215 3 281.072 55.920 .000
Within Groups 180.946 36 5.026
Composite
resin
Between Groups 789.367 3 263.122 59.106 .000
Within Groups 160.261 36 4.452

66
Table 6: Descriptive showing mean and standard deviation and the pairwise
comparison of the type of cements
CAD/CAM material
Substrate Cement N Mean (SD)
(MPa)*
95% Confidence Interval for Mean
IPS e.max CAD GE
Dentin Rely X Unicem 10 10.87 (2.06) (c)
9.39-12.34
Clearfil SA 10 8.61 (1.34) (d)
7.64-9.57
Multilink Automix 10 14.47 (0.90) (b)
13.82-15.11
Rely X ARC 10 16.92 (1.68) (a)
15.71-18.12
Composite resin
Rely X Unicem 10 11.59 (1.28) (d)
10.67-12.50
Clearfil SA 10 13.91 (0.82) (c)
13.32-14.49
Multilink Automix 10 17.6 (1.69) (b)
16.38-18.81
Rely X ARC 10 20.03 (1.50) (a)
18.95-21.10
IPS e.max CAD HF
Dentin Rely X Unicem 10 11.15 (1.38) (c)
10.16-12.14
Clearfil SA 10 10.58 (1.95) (c)
9.18-11.97
Multilink Automix 10 16.2 (1.48) (b)
15.13-17.26
Rely X ARC 10 23.16 (2.37) (a)
21.46-24.85
Composite resin
Rely X Unicem 10 22.48 (1.82) (b)
21.17-23.78
Clearfil SA 10 18.43 (0.92) (d)
17.76-19.09
Multilink Automix 10 22.6 (2.12) (b)
21.08-24.11
Rely X ARC 10 26.75 (1.52) (a)
25.66-27.83
Paradigm MZ100
Dentin Rely X Unicem 10 17.78 (2.04) (c)
16.31-19.24
Clearfil SA 10 17.37 (2.75) (c)
15.39-19.34
Multilink Automix 10 21.45 (1.70) (b)
20.23-22.66
Rely X ARC 10 28.81 (2.32) (a)
27.15-30.47
Composite resin
Rely X Unicem 10 23.16 (1.43) (c)
22.13-24.18
Clearfil SA 10 21.8 (1.11) (c)
21.00-22.59
Multilink Automix 10 29.03 (3.24) (b)
26.71-31.35
Rely X ARC 10 32.78 (1.99) (a)
31.35-34.20
*: Significant at P ≤ 0.05, Groups with different letters show statistically significant difference
according Tukey’s test results.

67
4.1.1 Grit-etched lithium disilicate glass ceramic (IPS e.max CAD GE)
Comparison between different types of cement was carried out when these cements
were used to bond the IPS e.max CAD grit-etched to dentin and composite resin substrates.The
means and the standard deviation (SD) values are presented in Figure 11 and Table 6.
Figure 11: Bar chart of the mean values of µTBS for different cements with IPS
e.max CAD grit-etched. The error bars represent standard deviation. For every level
of comparison, groups with different letters show a statistically significant
difference according to Tukey’s test results.

68
4.1.1.1 Dentin substrate:
One-way ANOVA was conducted to explore the effect of the type of cement on µTBS
when these cements were used to bond the IPS e.max CAD grit-etched to dentin. There was a
statistically significant difference(p<0.001) (Table 5).Post-hoc comparisons using Tukey‘s test
indicated that Rely X Arc had the highest mean µTBS, followed by Multilink Automix cement
then Rely X Unicem. Clearfil SA showed the lowest mean bond strength.
4.1.1.2 Composite resin substrate:
One-way ANOVA was conducted to explore the effect of the type of cement on the
µTBS when these cements were used to bond the IPS e.max CAD GE to composite resin.There
was a statistically significant difference (p <0.001) (Table 5). Post-hoc comparisons using
Tukey‘s test indicated that Rely X ARC had the highest statistically significant mean µTBS,
followed by Multilink Automix cement then Clearfil SA. Rely X Unicem showed statistically
significant lowest mean bond strength.

69
4.1.2 Hydroflouric acid etched lithium disilicate glass ceramic (IPS e.max
CAD HF)
Comparison between different types of cements was carried when these cements were
used to bond the IPS e.max CAD HF etched to dentin and composite resin substrates.The
means and the standard deviation (SD) values are presented in Figure 12 and Table 6.
Figure 12: Bar chart of the mean values of µTBS for different cements with IPS
e.max CAD HF. The error bars represent standard deviation. For every level of
comparison, groups with different letters are statistically significant different
according to Tukey’s test results.
70
4.1.2.1 Dentin Substrate: One-way ANOVA was conducted to explore the effect of the type of cement on µTBS,
when these cements were used to bond IPS e.max CAD HF to dentin. There was a statistically
significant difference (p <0.001)(Table 5). Post-hoc comparisons using Tukey‘s test indicated
that Rely X ARC had the highest mean µTBS, followed by Multilink Automix cement. There
was no statistically significant difference between Clearfil SA and Rely X Unicem, which had
the lowest mean bond strength.
4.1.2.2 Composite Substrate:
One-way ANOVA was conducted to explore the effect of type of cement on the µTBS,
when these cements were used to bond IPS e.max CAD HF to composite resin. There was a
statistically significant difference at p <0.001 (table 5). Post-hoc comparisons using the Tukey‘s
test indicated that Rely X ARC has the highest mean µTBS, followed by Multilink Automix
cement which showed no statistically significant difference from Rely X Unicem. Clearfil SA
showed the lowest mean bond strength.
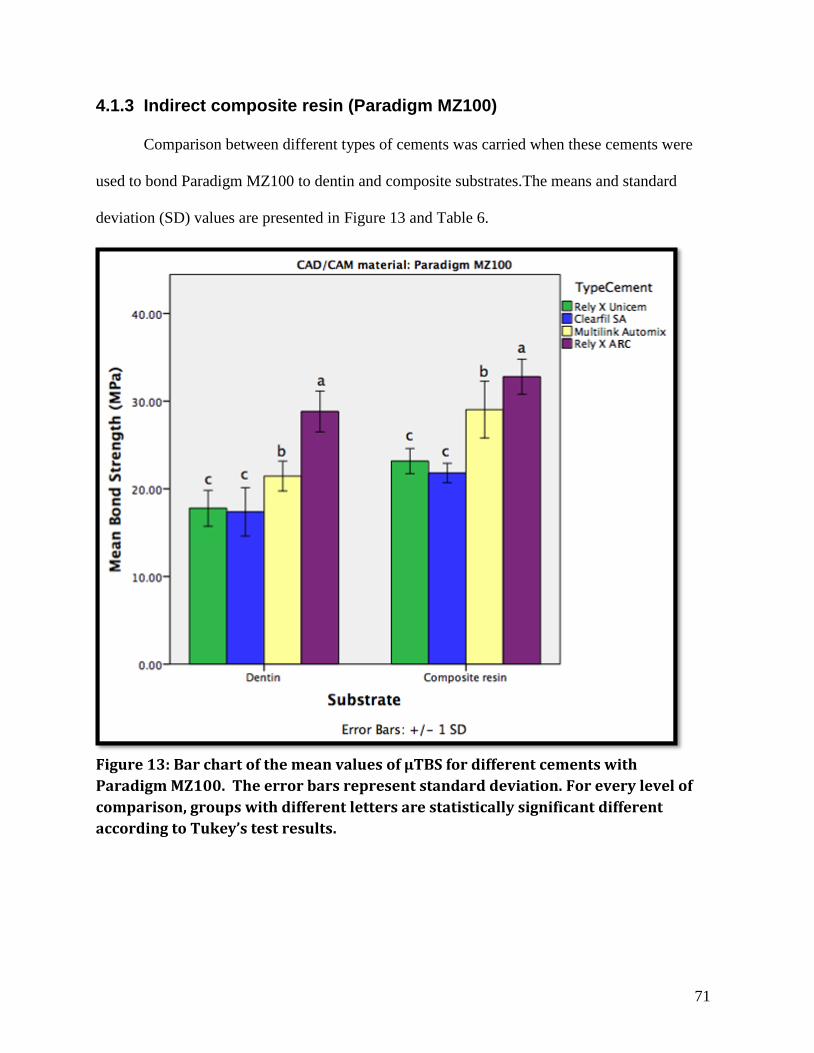
71
4.1.3 Indirect composite resin (Paradigm MZ100)
Comparison between different types of cements was carried when these cements were
used to bond Paradigm MZ100 to dentin and composite substrates.The means and standard
deviation (SD) values are presented in Figure 13 and Table 6.
Figure 13: Bar chart of the mean values of µTBS for different cements with
Paradigm MZ100. The error bars represent standard deviation. For every level of
comparison, groups with different letters are statistically significant different
according to Tukey’s test results.

72
4.1.3.1 Dentin substrate:
One-way ANOVA was conducted to explore the effect of type of cement on µTBS,
when these cements were used to bond Paradigm MZ100 to dentin. There was a statistically
significant difference (p <0.001) (Table 5).Post-hoc comparisons using Tukey‘s test indicated
that Rely X ARC had the highest statistically significant mean µTBS, followed by Multilink
Automix cement. There was no statistically significant difference between Clearfil SA and
RelyX Unicem, which showed the lowest mean bond strength.
4.1.3.2 Composite resin substrate:
One-way ANOVA was conducted to explore the effect of type of cement on the µTBS,
when these cements were used to bond Paradigm MZ100 to composite resin. There was a
statistically significant difference (p <0.001) (Table 5). Post-hoc comparisons using Tukey‘s
test indicated that Rely X ARC had the highest mean µTBS. This was followed by Multilink
Automix cement. There was no statistically significant difference between Clearfil SA and
RelyX Unicem which showed the lowest mean bond strength.
A summary of the graphs presented in this section comparing different resin cements is
presented in Figure 21.
73
4.2 Comparison between substrates: Due to the significant interaction among different factors detected by the factorial
ANOVA, further comparison between the substrates was carried within levels of the other
independent factors: Type of Cement (Group 1: Rely X Unicem; Group 2: Clearfil SA; Group
3: Multilink Automix; Group 4: Rely X ARC) and CAD/CAM material (Group 1: IPS e.max
CAD grit-etched; Group 2: IPS e.max HF; Group 3: Paradigm MZ 100). The follow-up analysis
to a significant interaction in factorial ANOVA was carried out using independent sample t-test.
The results of the independent sample t-test are presented in Table 7. The significance level was
set at P ≤ 0.05 and 95 % confidence level. The means and the standard deviation (SD) values
are presented in Table 6.

74
Table 7: Independent Samples Test (Dependent variable: Bond strength; Independent
variable: type of the substrate)
Type OF Cement
CAD/CAM material
Levene's Test for Equality of Variances
t-test for Equality of Means
F Sig. t df Sig. (2-tailed)
Rely X Unicem
EMX GE E.V.A 10.217 0.005 -0.936 18 0.362
E.V.N.A -0.936 15.034 0.364
EMX HF E.V.A 0.495 0.491 -15.627 18 0.000
E.V.N.A -15.627 16.738 0.000
PZ E.V.A 0.153 0.701 -6.807 18 0.000
E.V.N.A -6.807 16.146 0.000
Clearfil Sa EMX GE E.V.A 0.957 0.341 -10.634 18 0.000
E.V.N.A -10.634 14.889 0.000
EMX HF E.V.A 4.269 0.054 -11.494 18 0.000
E.V.N.A -11.494 12.861 0.000
PZ E.V.A 10.658 0.004 -4.712 18 0.000
E.V.N.A -4.712 11.844 0.001
Multilink Automix
EMX GE E.V.A 4.808 0.042 -5.141 18 0.000
E.V.N.A -5.141 13.732 0.000
EMX HF E.V.A 0.235 0.634 -7.808 18 0.000
E.V.N.A -7.808 16.098 0.000
PZ E.V.A 1.398 0.252 -6.543 18 0.000
E.V.N.A -6.543 13.616 0.000
Rely X ARC EMX GE E.V.A 0.243 0.628 -4.355 18 0.000
E.V.N.A -4.355 17.777 0.000
EMX HF E.V.A 4.786 0.042 -4.029 18 0.001
E.V.N.A -4.029 15.343 0.001
PZ E.V.A 0.203 0.658 -4.088 18 0.001
E.V.N.A -4.088 17.596 0.001
EMX GE: IPS. E.max CAD grit-etched; EMX HF: IPS e.mac CAD HF; PZ: Paradigm MZ100;
E.V.A: equal variance assumed; EV.N.A: equal variance not assumed

75
4.2.1 Self-adhesive resin cement (Rely X Unicem)
Comparison between different types of substrates was carried when Rely X Unicem
cement was used to bond different crown materials. The means and standard deviation (SD)
values are presented in Figure 14 and Table 6.
Figure 14: Bar chart of the mean values of µTBS for different substrates with Rely X
Unicem cement. The error bars represent standard deviation. For every level of
comparison, groups with different letters show a statistically significant difference
according to Tukey’s test results.

76
4.2.1.1 Grit-etched lithium disilicate glass ceramic (IPS e.max CAD GE): Independent sample t-test was conducted to explore the effect of the type of substrate on
µTBS when Rely X Unicem cement was used to bond IPS e.max grit-etched. The results of the
analysis show that there was no statistically significant difference between dentin and
composite resin in the mean bond strength (p=0.364) (Table 7).
4.2.1.2 Hydrofluoric acid etched lithium disilicate glass ceramic (IPS e.max CAD HF):
Independent sample t-test was conducted to explore the effect of the type of substrate on
µTBS, when Rely X Unicem cement was used to bond IPS e.max HF. There was statistical
difference (p <0.001) (Table 7), the results of the analysis showed that composite resin had
significantly higher mean µTBS compared to dentin.
4.2.1.3 Indirect composite resin (Paradigm MZ100): Independent sample t-test was conducted to explore the effect of the type of substrate on
µTBS, when Rely X Unicem cement was used to bond Paradigm MZ100. There was statistical
difference (p <0.001) (Table 7), the results of the analysis showed that composite resin had
significantly higher mean µTBS compared to dentin.

77
4.2.2 Self-adhesive resin cement (Clearfil SA)
Comparison between different types of substrates was carried when Clearfil SA cement
was used to bond different crown materials. The means and standard deviation (SD) values are
presented in Figure 15 and Table 6.
Figure 15: Bar chart of the mean values of µTBS for different substrates with Clearfil
SA cement. The error bars represent standard deviation. For every level of
comparison, groups with different letters show a statistically significant difference
according to Tukey’s test results.

78
4.2.2.1 Grit-etched lithium disilicate glass ceramic (IPS e.max CAD GE): Independent sample t-test was conducted to explore the effect of the type of substrate on
µTBS, when Clearfil SA cement was used to bond IPS e.max grit-etched. There was statistical
difference at the p <0.001 (Table 7), the results of the analysis showed that composite resin has
higher mean µTBS compared to dentin.
4.2.2.2 Hydrofluoric acid etched lithium disilicate glass ceramic (IPS e.max CAD HF):
Independent sample t-test was conducted to explore the effect of the type of substrate on
µTBS, when Clearfil SA cement was used to bond IPS e.max HF. There was statistical
difference at p <0.001 (Table 7), the results of the analysis showed that resin has higher mean
µTBS compared to dentin.
4.2.2.3 Indirect composite resin (Paradigm MZ100): Independent sample t-test was conducted to explore the effect of the type of substrate on
µTBS, when Clearfil SA cement was used to bond Paradigm MZ100. There was statistical
difference (p=0.001) (Table 7). The results of the analysis showed that composite resin has
higher mean µTBS compared to dentin.

79
4.2.3 Self-etch adhesive-based resin cement (Multilink Automix)
Comparison between different types of substrates was carried when Multilink Automix
cement was used to bond different crown materials. The means and standard deviation (SD)
values are presented in Figure 16 and Table 6.
Figure 16: Bar chart of the mean values of µTBS for different substrates with
Multilink cement. The error bars represent standard deviation. For every level of
comparison, groups with different letters show a statistically significant difference
according to Tukey’s test results.

80
4.2.3.1 Grit-etched lithium disilicate glass ceramic (IPS e.max CAD GE): Independent sample t-test was conducted to explore the effect of the type of substrate on
µTBS, when Multilink Automix cement was used to bond IPS e.max grit-etched. There was
statistical difference (p <0.001) (Table 7), the results of the analysis showed that composite
resin had significantly higher mean µTBS compared to dentin.
4.2.3.2 Hydrofluoric acid etched lithium disilicate glass ceramic (IPS e.max CAD HF):
Independent sample t-test was conducted to explore the effect of the type of substrate on
µTBS, when Multilink Automix cement was used to bond IPS e.max HF. There was statistical
difference (p <0.001) (Table 7), the results of the analysis showed that composite resin had
significantly higher mean µTBS compared to dentin.
4.2.3.3 Indirect composite resin (Paradigm MZ100): Independent sample t-test was conducted to explore the effect of the type of substrate on
µTBS, when Multilink Automix cement was used to bond Paradigm MZ100. There was
statistical difference (p <0.001) (Table 7), the results of the analysis showed that composite
resin had significantly higher mean µTBS compared to dentin.

81
4.2.4 Etch-and-rinse adhesive-based resin cement (Rely X ARC)
Comparison between different types of substrates was carried when Rely X Arc cement
was used to bond different crown materials. The means and standard deviation (SD) values are
presented in Figure 17 and Table 6.
Figure 17: Bar chart of the mean values of µTBS for different substrates with Rely X
Arc cement. The error bars represent standard deviation. For every level of
comparison, groups with different letters show a statistically significant difference
according to Tukey’s test results.
82
4.2.4.1 Grit-etched lithium disilicate glass ceramic (IPS e.max CAD GE): Independent sample t-test was conducted to explore the effect of the type of substrate on
µTBS, when Rely X ARC cement was used to bond IPS e.max sandblasted. There was
statistical difference (p <0.001) (Table 7), the results of the analysis showed that composite
resin had higher mean µTBS compared to dentin.
4.2.4.2 Hydrofluoric acid etched lithium disilicate glass ceramic (IPS e.max CAD HF):
Independent sample t-test was conducted to explore the effect of the type of substrate on
µTBS, when Rely X ARC cement was used to bond IPS e.max HF. There was statistical
difference (p=0.001) (Table 7). The results of the analysis showed that composite resin had
higher mean µTBS compared to dentin.
4.2.4.3 Indirect composite resin (Paradigm MZ100): Independent sample t-test was conducted to explore the effect of the type of substrate on
µTBS, when Rely X ARC cement was used to bond Paradigm MZ100. There was statistical
difference (p=0.001)(table 7). The results of the analysis showed that composite resin had
higher mean µTBS compared to dentin.
A summary of the graphs presented in this section comparing different substrates is
presented in Figure 22.
83
4.3 Comparison between CAD/CAM materials
Due to the significant interaction among different factors detected by factorial ANOVA,
comparison between CAD/CAM materials was carried within levels of the other independent
factors: Substrate (Group 1: Dentin; Group 2: Composite resin) and Type of Cement (Group 1:
Rely X Unicem; Group 2: Clearfil SA; Group 3: Multilink Automix; Group 4: Rely X ARC).
The follow-up analysis to the significant interaction in factorial ANOVA was carried out using
one-way analysis of variance (one way ANOVA). The results of the one-way ANOVA are
presented in Table 8. Post-hoc comparisons were carried using the Tukey‘s test. The
significance level was set at P ≤ 0.05 and 95 % confidence level. The means and standard
deviation (SD) values are presented in Table 6.

84
Table 8: One way ANOVA (Dependent variable: Bond strength; Independent variable:
CAD/CAM material)
Substrate Type of cement Sum of
Squares
df Mean
Square
F Sig.
Dentin Rely X
Unicem
Between Groups 305.818 2 152.909 44.265 .000
Within Groups 93.268 27 3.454
Clearfil
Sa
Between Groups 422.409 2 211.204 47.926 .000
Within Groups 118.986 27 4.407
Multilink
Automix
Between Groups 264.253 2 132.126 66.873 .000
Within Groups 53.346 27 1.976
Rely X
ARC
Between Groups 708.026 2 354.013 76.55 .000
Within Groups 124.864 27 4.625
Composite
Z100
restorative
Rely X
Unicem
Between Groups 843.065 2 421.532 179.152 .000
Within Groups 63.529 27 2.353
Clearfil
Sa
Between Groups 313.465 2 156.732 170.019 .000
Within Groups 24.89 27 0.922
Multilink
Automix
Between Groups 656.633 2 328.316 54.97 .000
Within Groups 161.261 27 5.973
Rely X
ARC
Between Groups 813.606 2 406.803 142.346 .000
Within Groups 77.162 27 2.858

85
4.3.1 Dentin substrate
Comparison between different CAD/CAM materials was carried when bonded to dentin
using different cements. The means and standard deviation (SD) values are presented in Figure
18 and Table 6.
Figure 18: Bar chart of the mean values of µTBS for different CAD/CAM
materialswith Dentin. The error bars represent standard deviation For every level
of comparison, groups with different letters show a statistically significant
difference according to Tukey’s test results.

86
4.3.1.1 Self-adhesive resin cement (Rely X Unicem): One-way analysis of variance was conducted to explore the effect of the type of
CAD/CAM material on µTBS, when bonded to dentin using Rely X Unicem cement. There was
a statistically significant difference (p <0.001) (Table 8). Post-hoc comparisons using Tukey‘s
test indicated that ParadigmMZ100 showed the highest mean bond strength. There was no
statistically significant difference between IPS e.max CAD grit-etched and IPS e.max CAD HF
etched, which showed the lowest mean bond strength.
4.3.1.2 Self-adhesive resin cement (Clearfil SA): One-way analysis of variance was conducted to explore the effect of the type of
CAD/CAM material on µTBS, when bonded to dentin using Clearfil SA cement. There was a
statistically significant difference (p <0.001) (Table 8). Post-hoc comparisons using Tukey‘s
test indicated that Paradigm MZ100 showed the highest mean bond strength. This was followed
by IPS e.max CAD HF etched. Finally, IPS e.max CAD grit-etched showed the lowest mean
bond strength.
4.3.1.3 Self-etch adhesive-based resin cement (Multilink Automix): One-way analysis of variance was conducted to explore the effect of the type of
CAD/CAM material on µTBS, when bonded to dentin using Multilink Automix cement. There
was a statistically significant difference (p <0.001) (Table 8). Post-hoc comparisons using
Tukey‘s test indicated that Paradigm MZ100 showed the highest mean bond strength. This was
followed by IPS e.max CAD HF etched. Finally, IPS e.max CAD grit-etched showed the lowest
mean bond strength.

87
4.3.1.4 Etch-and-rinse adhesive-based resin cements (Rely X ARC): One-way analysis of variance was conducted to explore the effect of the type of
CAD/CAM material on µTBS, when bonded to dentin using Rely X ARC cement. There was a
statistically significant difference (p <0.001) (Table 8).Post-hoc comparisons using Tukey‘s test
indicated that Paradigm MZ100 showed the highest mean bond strength, followed by IPS e.max
CAD HF etched. Finally, IPS e.max CAD grit-etched showed the lowest mean bond strength.
4.3.2 Composite resin substrate
Comparison between different CAD/CAM materials was carried out when bonded to
composite Z100 restorative using different cements. The means and standard deviation (SD)
values are presented in Figure 19 and Table 6.
4.3.2.1 Self-adhesive resin cement (Rely X Unicem):
One-way analysis of variance was conducted to explore the effect of the type of
CAD/CAM material on µTBS, when bonded to composite resin using Rely X Unicem cement.
There was astatistically significant difference (p <0.001) (Table 8). Post-hoc comparisons using
Tukey‘s test indicated no statistically significant difference between Paradigm MZ100 and IPS
e.max CAD HF etched which showed the highest mean bond strength. This was followed by
IPS e.max CAD grit-etched that showed the lowest mean bond strength.
4.3.2.2 Self-adhesive resin cement (Clearfil SA): One-way analysis of variance was conducted to explore the effect of the type of
CAD/CAM material on µTBS, when bonded to composite resin using Clearfil SA cement.
There was a statistically significant difference (p <0.001) (table 8). Post-hoc comparisons using
Tukey‘s test indicated that Paradigm MZ100 showed the highest mean bond strength, followed

88
by IPS e.max CAD HF etched. Finally, IPS e.max CAD grit-etched showed the lowest mean
bond strength.
Figure 19: Bar chart of the mean values of µTBS for different CAD/CAM materials
with Dentin. The error bars represent standard deviation For every level of
comparison, groups with different letters show a statistically significant difference
according to Tukey’s test results.

89
4.3.2.3 Self-etch adhesive-based resin cement (Multilink Automix):
One-way analysis of variance was conducted to explore the effect of the type of
CAD/CAM material on µTBS, when bonded to composite resin using Multilink Automix
cement. There was a statistically significant difference (p <0.001) (Table 8). Post-hoc
comparisons using Tukey‘s test indicated that Paradigm MZ100 showed the highest mean bond
strength, followed by IPS e.max CAD HF etched. Finally, IPS e.max CAD grit-etched showed
the lowest mean bond strength.
4.3.2.4 Etch-and-rinse adhesive-based resin cement (Rely X ARC): One-way analysis of variance was conducted to explore the effect of the type of
CAD/CAM material on µTBS, when bonded to composite resin using Rely X ARC cement.
There was a statistically significant difference (p <0.001) (Table 8). Post-hoc comparisons
using Tukey‘s test indicated that Paradigm MZ100 showed the highest mean bond strength,
followed by IPS e.max CAD HF etched. Finally, IPS e.max CAD grit-etched showed the lowest
mean bond strength.
A summary of the graphs presented in this section comparing CAD/CAM materials is
presented in Figure 23.
4.4 Modes of failure The distribution of the modes of failure in specimens of the microtensile test is shown in
Figure 20. The majority of the failures were adhesive failure (crown material/cement interface)
57.08%, followed by adhesive failure (substrate/cement interface) 28.75%; and finally mixed
failures 14.17%.

90
Figure 20: Pie chart showing distribution of the modes of failure in µTBS specimens.
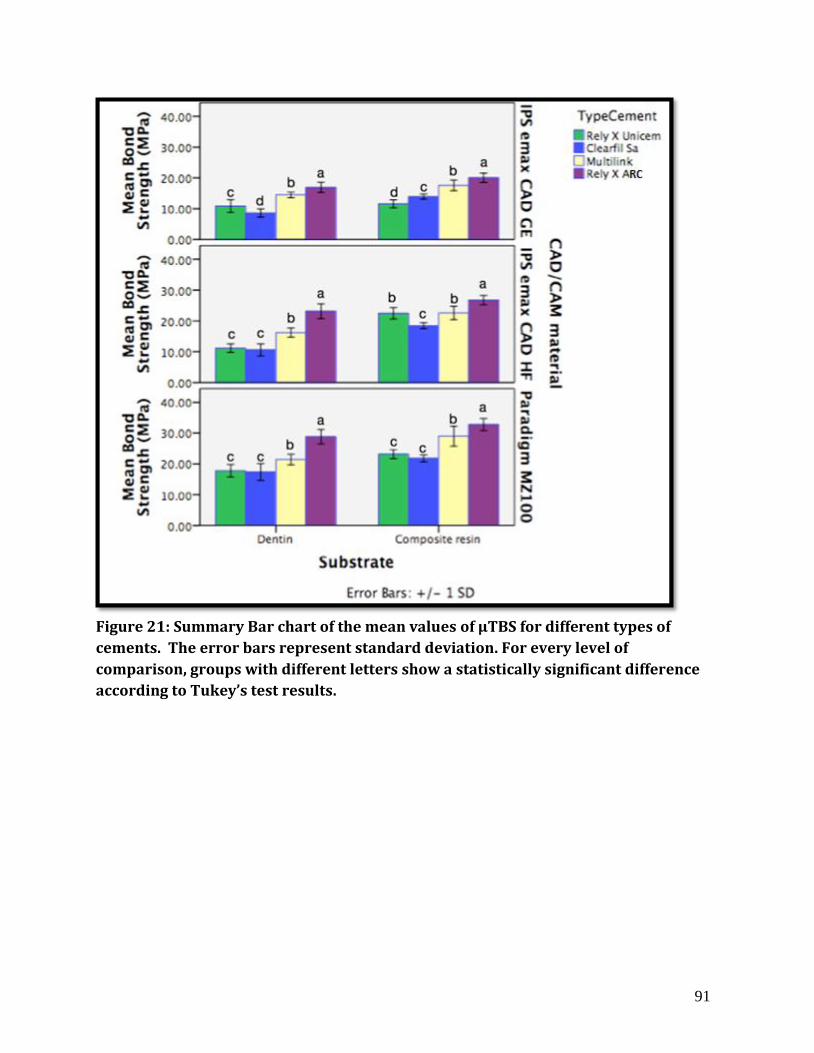
91
Figure 21: Summary Bar chart of the mean values of µTBS for different types of
cements. The error bars represent standard deviation. For every level of
comparison, groups with different letters show a statistically significant difference
according to Tukey’s test results.

92
Figure 22: Summary Bar chart of the mean values of µTBS for different Substrates.
The error bars represent standard deviation. For every level of comparison, groups
with different letters show a statistically significant difference according to Tukey’s
test results.

93
Figure 23: Summary Bar chart of the mean values of µTBS for different CAD/CAM
materials. The error bars represent standard deviation. For every level of
comparison, groups with different letters show a statistically significant difference
according to Tukey’s test results.

94
5. Discussion The microtensile bond strength (µTBS) test has been used to evaluate adhesion of dental
restorations to the underlying tooth substrate. It offers several advantages over conventional
tensile bond strength tests. 16
The configuration of the samples concentrates the stresses at the
adhesive interface as shown by the number of adhesive failures in the specimens of interest. 151
Also, the smaller the surface area of the specimens the lower is the amount of defects and flaws
of critical size at the adhesive interface giving better chance at evaluating the bonding
performance at this interface. 152
Also, µTBS test is considered more conservative compared to
conventional tensile test, since more specimens are produced per tooth.172
On the other hand, the current methodology for µTBS testing suffers from different
flaws that can affect the reliability of the test. The cutting procedures of the bonded specimens
induce stresses that cause several pretest failures in addition to weakening of the survived
specimens. 22,199
These pretest failures create a statistical problem when dealing with it. In the
literature there are three approaches of addressing these pretest failures, and each approach can
lead to a different result and conclusion from the same study.199
In the current study a new methodology was developed for µTBS testing, where
specimens were cut first and then bonded, thus avoiding the induction of unnecessary stresses
to the bonded specimens. The efficacy of this method is demonstrated by the low standard
deviation presented by our samples and the similar bond strength values between our study and
those of others which made use of the traditional method. 198,199
Moreover, this methodology
has the advantage of preventing pretest failures thus avoiding the statistical problem observed
with the conventional microtensile methodology. 199
This methodology was also capable of

95
concentrating the stresses at the adhesive interface as presented by the prevalence of adhesive
failures.
In this study our aim was to investigate the bond strength of two self-adhesive resin
cements (Rely X Unicem and Clearfil SA) and two adhesive-based resin cements (Multilink
Automix and Rely X Arc), when used to bond lithium disilicate glass ceramic (IPS e.max
CAD) and composite resin CAD/CAM material (Paradigm MZ100) to two types of substrates
(dentin and composite Z100 restorative).Comparing the performance of different cements, the
etch-and-rinse adhesive-based resin cement (Rely X ARC) prevailed in all groups with the
highest mean µTBS. The self-etch adhesive-based resin cement (Multilink Automix) was
ranked second highest regarding µTBS in almost all groups. The self-adhesive resin cements
(Rely X Unicem and Clearfil SA) both had the lowest bond strength in all groups.For dentin
substrate, this can be explained by the better demineralization ability of the etch-and-rinse
system with the maximum smear layer removal, exposing a greater quantity of dentinal tubules
and collagen fibers to resin infiltration, yielding the well documented hybrid layer. 80
The self-
etch system only dissolves the smear layer, but doesn‘t remove the dissolved calcium
phosphates which become embedded within the interfacial transition zone and encapsulated by
resin. These calcium phosphates are soluble and may explain the lower laboratory and clinical
bonding performance. 20
Also, the high concentrations of acidic resin monomers can make self-
etch adhesives behave like hydrophilic permeable membranes which allow water movement
from dentin to the restoration-adhesive interface and mediate hydrolytic reactions. 76, 85
Moreover, the residual solvent (water) that remains within the adhesive interface can weaken
the bond. 66
For these reasons the self-etching system showed less bond strength values
compared to etch-and-rinse resin cement systems. However, self-etching adhesive-based resin

96
cements have some advantages over self-adhesive resin cements. The low bonding performance
of self-adhesive resin cements could be explained by the weak infiltration of these cements into
dentin, as suggested by De Munk et al (2004), who stated that self-adhesive resin cements were
only capable of tangible infiltration of the dental surface, hence their inferior bonding
performance. 110
Furthermore, Monticelli et al (2008) stated that there was no demineralization
of dentin with self-adhesive resin cements and no resin penetration. 137
Also, the acidic
component of the self-adhesive resin cements may interfere with the polymerization reaction as
a result of improper neutralization of the acidic group, which in turn results in lower mechanical
properties of the set cement and lower bond strength values. 5
It is well known that acidic
monomers affect the free radical polymerization initiators, 204
reducing the degree of
polymerization as well as the rate of polymerization of light and self-cured resin formulations.
205For these reasons self-adhesive resin cements had weaker bond strength compared to
adhesive-based resin systems irrespective to the CAD/CAM material employed.
For composite resin substrate, this bonding performance could be related to the
chemical composition of the cement systems. The unreacted acidic monomers in self-etching
systems and self-adhesive systems might have negatively affected the polymerization reaction
and jeopardize adhesion. 5
These acidic monomers are hydrophilic and can mediate hydrolytic
reactions that can negatively affect the bond strength. Therefore, the two-step self-etching
system is advantageous in bond strength as a result of the two-step procedure that allows
applying the acidic monomers first then curing it followed by placement of the mixed cement.
The advantage of adhesive-based resin cements over self-adhesive resin cements has already
been demonstrated by De Angelis et al (2004), who found higher bond strength for etch-and-
rinse adhesive-based resin compared to self-etch adhesive-based resin cement, and both types

97
of the multistep adhesive-based resin cements showed higher bond strength values compared
with self-adhesive resin cements.199
When hydrofluoric acid etched lithium disilicate glass ceramic (IPS e.max CAD HF)
was bonded to composite resin, Rely X Unicem (self-adhesive resin cement)results were similar
to Multilink Automix (self-etch adhesive-based resin cement) which ranked second in bond
strength, and was significantly higher than Clearfil SA (self-adhesive resin cement), with the
lowest bond strength. This could be explained by the strong etching of the hydrofluoric acid
that increased the surface roughness on the ceramic surface, which in turn is reflected in an
increase in the micromechanical interlocking, and increase in the surface area that was silanated
resulting in extra chemical bonding. The increased surface area and roughness may have been
more beneficial to Rely X Unicem which has higher filler loading (72 wt.%) and bigger filler
particle size (<12.5 μm) compared to other resin cement materials, which leads to high
mechanical properties of the cement, and thus stronger engagement of the micro-roughness on
the etched ceramic surface without fracture of the resin cement. Multilink filler loading is (45.5
wt.%) and filler particle size (0.9 μm) and Clearfil SA whose filler loading is (66 wt.%) and
filler size (2.5 μm).The efficacy of etching lithium disilicate glass ceramic with hydrofluoric
acid have been reported by De Menezes et al who found significant increase in the surface
roughness for micromechanical bonding compared to grit-etched lithium disilicate glass
ceramic.197
However, Rely X Unicem and Clearfil SA presented similar results when hydrofluoric
acid etched lithium disilicate ceramic (IPS e.max CAD HF) was bonded to dentin. This could
be due to the 10-MDP monomer (10-methacryloyloxydecyl dihydrogen phosphate) groups in
the Clearfil SA that enhance the chemical bonding to dentin by forming strong and

98
hydrolytically stable ionic bonds with the hydroxyapatite. 106,206
Rely X Unicem has
methacrylated phosphoric esters to chemically bind to the hydroxyapatite, but these esters are
hydrolytically unstable with the release of phosphoric acid as by-product of hydrolysis which
can cause further demineralization of dentin and weakening of the adhesive interface. 106,206
. On
the other hand, Rely X Unicem has higher filler content and thus was expected to have higher
mechanical properties that would positively affect the bond strength values, therefore, resulting
in a similar performance for the two materials.
Interestingly, when Rely X Unicem was used to bond grit-etched lithium disilicate glass
ceramic (IPS e.max CAD GE) to composite resin, the results were inferior to those presented by
Clearfil SA. The literature indicates that grit-etching of lithium disilicate glass ceramic results
in lesser roughness than when the material is treated with hydrofluoric acid. 197
The reduced
micromechanical interlocking may have compromised the bond strength between Rely X
Unicem and lithium disilicate glass ceramic. However, Rely X Unicem had significantly higher
bond strength than Clearfil SA when used to bond IPS e.max CAD GE to dentin. This could be
related to the stress distribution and concentration at the adhesive interface as well as the resin
cement mechanical properties. Van Noort et al (1989)stated that the modulus of elasticity of the
materials forming the interface affects the stress distribution within the interface, 155
and Tam et
al (2000)indicated that fracture toughness of the interface is affected by the degree of
interaction whether mechanical or chemical between the constituents of the interface. 207
Clearfil
SA is capable of achieving good chemical adhesion to dentin through its 10-MDP monomers.
However, it has low modulus of elasticity 4.8 GPa compared to Rely X Unicem 7.9 GPa. 208
This could lead to unfavorable stress concentration at the crown material/cement interface and
lower fracture toughness of this interface.

99
In all other groups, Rely X Unicem behaved similarly to Clearfil SA with no statistical
difference. This could be due to balance between factors affecting the bond strength for the two
cements, like the stress distribution at the interfaces and the degree of mechanical and chemical
interaction between the cement and the crowns material together with the underlying substrate.
Comparing different substrates, composite resin substrate prevailed in almost all groups
with the highest µTBS, while dentin showed the lowest bond strength. This could be explained
by the copolymerization between monomers of the resin cement and residual monomers of the
composite substrate resulting in strong chemical bond. This explanation is in agreement with
that of Kallio et al (2001) who stated that the unreacted monomer groups in a composite
substrate could allow formation of covalent bonds through copolymerization between the
substrate and repair resin or intermediary resin. 209
Composite resin substrate showed no
statistical difference in bond strength from dentin substrate when bonded to IPS e.max CAD
GE using Rely X Unicem. This could be explained by the weak adhesion of Rely X Unicem to
the grit-etched lithium disilicate glass ceramic either mechanically due to the shallow
irregularities pattern created by grit-etching or chemically due to the chemical composition of
the cement, which makes the resin cement/ceramic interface a weak point and decreases the
fracture toughness of this interface and causes both substrates to behave similarly in bond
strength.
Comparing different crown materials, Paradigm MZ100, a composite resin material,
prevailed in almost all groups with the highest µTBS. The degree of conversion of Paradigm
MZ100 is 84%, thus providing 16% of unreacted monomers for copolymerization with the resin
cement monomers, resulting in strong chemical bond. 210,211
Also, the silane-coupling agent is
capable of increasing the bond strength between indirect composite restorations and resin

100
cements. 123
Moreover, the mechanical difference between composite and ceramic is an
important factor affecting the stress concentration at the adhesive interfaces. 198
The more brittle
ceramic material tends to fracture at the adhesive interface at lower values than the more
resilient composite. 198
This is in accordance with Van Noort et al. (1989) who showed that the
higher the elastic modulus of the material, the higher the stress generated at the edge of the
bonding interface. 155
IPS e.max CAD HF presented similar results to Paradigm MZ100, when
bonded to composite resin substrate using Rely X Unicem cement. The high filler loading of
Rely X Unicem as well as the larger filler size leads to high mechanical properties of the
cement resulting in more resistant micromechanical interlocking with the hydrofluoric acid
etched IPS e.max CAD material to be strong, while the other interface has a strong chemical
bond between the unreacted monomers of Rely X Unicem and the composite substrate, a
situation that result in two strong interfaces and stress distribution that enhances the bond
strength of the IPS e.max HF.
In all the other groups the hydrofluoric acid etched IPS e.max CAD showed superior
bond strength to the grit-etched IPS e.max CAD. As previously mentioned the increased surface
roughness created by the hydrofluoric acid etching over the grit-etched surface treatment may
have enhanced the micromechanical interlocking. 197
Hydrofluoric acid etched IPS e.max CAD
and the grit-etched IPS e.max CAD presented similar results when bonded to dentin using Rely
X Unicem cement. This could be explained by weak adhesion of Rely X Unicem to the dentin,
so stress concentration at this interface could lead to inferior bond strength results of the
hydrofluoric acid etched IPS e.max CAD. This explanation is in agreement with Brunzel et al
(2010) who stated that the adhesive interface between Rely X Unicem and dentin is a weak link
and was the cause of the recorded low tensile bond strength values.212
101
The modes of failure evaluated in this study were mostly adhesive failure at the (crown
material interface) 57.08%, followed by adhesive failure at the (substrate interface) 28.75%;
and finally mixed failures 14.17%. This indicates that the stresses were concentrated at the
adhesive interface with no cohesive failures. Cohesive failures are known to preclude
measurement of the interfacial bond strength. 16
This is in agreement with Salz et al (2010) who
mentioned that below 2mm2 of adhesive area, all specimens fail adhesively at the interface.
151

102
6. Limitations of the study This study has the following limitations:
1. The study is an in-vitro study, which helps in rapid assessment of dental biomaterials
bonding properties, but cannot substitute in-vivo studies.
2. Thermocycling in a water bath between 5 °C and 55 °C for500 cycles is a minimal
effect aging procedure. 213,214
However, based on the ISO TR 11405 (1994),
thermocycling for 500 cycles between 5 °C and 55 °C is a recommended protocol for
aging dental interfaces prior to adhesion testing. 215
3. This study was performed using the new microtensile specimen preparation
methodology while the conventional microtensile specimen preparation methodology
was not performed in this study, which limits direct comparison of both methodologies.
However, the results of this study are comparable with previous studies but with lower
standard deviations. 198,199
The absence of pre-test failures gives this methodology an
extra advantage.
7. Conclusions
Within the limitations of this in-vitro study, the following conclusions can be drawn:
Etch-and-rinse adhesive-based resin cements are capable of achieving the highest µTBS
between CAD/CAM materials and different substrates.
Self-adhesive resin cements showed the lowest bond strength irrespective of the crown
material or bonding substrate.
Composite resin crown material presents better bond strength results than lithium
disilicate glass ceramic.
Composite substrate showed better bonding performance than dentin substrate.

103
Hydrofluoric acid etching of lithium disilicate glass ceramic resulted in better bond
strength to different substrates than grit-etching of lithium disilicate glass ceramic.

104
Chapter 4 Microshear bond strength of self-adhesive resin cements to non-metallic crown CAD/CAM materials, composite
and dentin

105
1. Abstract Objectives: To determine microshear bond strength (μSBS) of two CAD/CAM crown materials
when bonded to dentin or composite-resin substrate using two self-adhesive, etch-and-rinse and
self-etch resin cement; and to compare the effect of two surface treatments of the ceramic
crown material on μSBS. Methods: Lithium disilicate glass ceramic (IPS e.max CAD, Ivoclar-
Vivadent/EMX), and composite-resin (Paradigm MZ-100, 3M-ESPE/PZ) blocks were sectioned
into microbars approximately 1×1×5 mm3. Custom-made composite-resin (Z100 restorative,
3M-ESPE/ZC) blocks, and coronal dentin from freshly extracted molars were sectioned into
slices 2mm ± 0.1mmthickness. EMX rods were either grit-etched (50μm Al2O3) or etched with
HF acid and silanated. PZ rods were only grit-etched and silanated. EMX and PZ specimens
were then bonded to either ZC or dentin slices using two self-adhesive cements (RelyX
Unicem, 3M-ESPE; Clearfil SA, Kuraray) and two adhesive-based cements (Multilink
Automix, Ivoclar-Vivadent;RelyX-ARC, 3M-ESPE) using custom-made device (n=10). Static
load 146 g was maintained until initial setting of cement. Specimens were stored in water
(37°C, 24 h), thermocycled (500 cycles, 5- 55°C), then subjected to μSBS test. Means and SDs
were calculated in MPa and data statistically analyzed by factorial ANOVA (α=0.05). Results:
ANOVA revealed significant differences among the groups (P<0.05). Comparing cements,
highest mean μSBS (8.65 ±0.3) was obtained with etch-and-rinse adhesive based cement
(RelyX-ARC), while lowest mean μSBS (6.25 ±0.3) with self-adhesive resin cement (Rely-X
Unicem). Comparing substrates, highest mean μSBS (7.5±1.5) was obtained with ZC, while
lowest mean μSBS (6.9±1.6) with dentin. Comparing crown materials, highest mean μSBS was
(7.59 ±0.24) with PZ, while lowest mean μSBS (6.57 ±0.24) with grit-etched EMX.
Conclusions: In overall adhesive-based cements resulted in higher mean μSBS, whereas self-

106
adhesive cements resulted in lower mean μSBS, irrespective of the substrate or crown material.
For EMX, HF-treatment resulted in higher mean μSBS as compared to grit-etching.
2. Introduction Clinically, the use of resin cements to bond esthetic restorations to the underlying
substrate is growing substantially, due to their strong bonding and esthetic shades. Self-
adhesive resin cements were recently introduced as a potential and equivalent substitute for the
conventional adhesive-based resin cements since they are capable of achieving good adhesion
to the tooth structure without the need to apply any adhesive system prior to cement application.
104Factors that can affect the bonding of indirect restorations to the underlying substrate include
the type of cement, the type of the indirect restorative material, the surface treatment of the
indirect restorative material and the nature of the bonding substrate. 4,13,14
Several studies have
been performed to determine the efficiency of self-adhesive resin cements and to investigate if
they were possible replacements for current conventional adhesive resin cement systems. The
results of these studies are controversial.63,104,105
Several in-vitro bond strength testing methods have been used to evaluate dental
adhesion, such as shear, tensile, microshear and microtensile bond strength tests. The ―micro‖
tests give the advantages of preparing several samples per tooth with conservative amount of
tooth structure and materials.151,172
Micro-shear bond strength (μSBS) testing is capable of concentrating the stresses at the
adhesive interface compared to conventional shear bond strength testing, 168,216
which in turn
reflects on the modes of the adhesive failure within the test to be mainly adhesive and reflect a
true interfacial debonding. 168,216
In addition, smaller specimens are less likely to have critical
107
size defects that can affect the outcome of the test. This is the reason why ―micro‖ tests are
having relatively higher bond strength values compared to the ―macro‖ test methods. 152,172
μSBS testing has an advantage over the conventional methodology used for microtensile
testing, since there are no sectioning and trimming procedures for the bonded specimens, thus
avoiding the pretest failures and the misinterpretation of the results that can be associated with
conventional µTBS testing. 172
Also, specimen preparation for µTBS testing is difficult to
conduct and time-consuming compared to microshear. 171
Conventional microshear testing
involves only one adhesive interface where the cement is bonded directly to the tooth substrate
and a blade or wire is applied to the interface inducing shearing forces. 170
In this study our aim
was to modify the conventional microshear testing methodology to involve two adhesive
interfaces, where the crown material is bonded to the underlying substrate using resin cement,
thus creating two interfaces: crown material/cement interface and substrate/cement interface,
which is a more clinically relevant situation. Stress distribution at the adhesive interfaces is
dependent on the elastic moduli of the components constituting the adhesive interfaces, which
can alter the crack propagation within the adhesive interfaces and affect the recorded bond
strength.155,207
Another aim of this study was to investigate the bond strength of self adhesive resin
cements versus adhesive-based resin cements when they are used to bond lithium disilicate
glass ceramic material and composite resin material to the underlying dentin and composite
resin substrates, and to compare the effect of two surface treatments on lithium disilicate
ceramic.

108
3. Materials and Methods
3.1 Materials All the materials used in the study and their composition (as reported by manufacturers) are
listed in Table 9.
3.2 Methods: 3.2.1 Pilot study:
The current study was preceded by an external pilot study to detect any problems with
the proposed methods of testing, where 2 samples per group were used in the pilot study.
Following the completion of pilot study, 240 specimens were used for the main study.
3.2.2 Main study
Twenty-four groups were formed (n=10)(Figure 24). The number of specimens per
group was calculated using web-based softwarefor sample size analysis at α=0.05 and 80%
power and effect size equal to 0.307 which yields a sample size of 7 samples per group. We
used 10 samples per group for this study to have more power. The effect size (f) was calculated
by using the following formula, developed by Cohen (1999).
𝑓=𝑑 ×1
2
𝑘+1
3 𝑘−1
Where k is the number of groups and d is the difference in means (x1-x2) divided by common
standard deviation (σ). Based on values obtained from the pilot study, x1=6.8, x2=5.43, σ= 1.34,
the d value was calculated (d= 1.022), and 𝑓 was calculated (0.307).
Power Analysis For ANOVA Designs http://www.math.yorku.ca/SCS/Online/power/

109
Table 9: Materials and their composition (as reported by manufacturers).
Material Classification Brand /
Manufacturer
Composition Lot #
CA
D/C
AM
Mat
eria
ls
Lithium
disilicate
ceramic
IPS e.max
CAD/
Ivoclar
Vivadent,
Liechtenstein
SiO2 (57 – 80 wt.%),
Li2O (11 – 19 wt.%)
K2O (0 – 13 wt.%),
P2O5 (0 – 11 wt.%),
ZrO2 (0 – 8 wt.%),
ZnO (0 – 8 wt.%),
Other and coloring oxides (0-12 wt.%)
P63946
Indirect
composite
resin
Paradigm™
MZ100/
3M ESPE, St
Paul, MN,
USA
85 wt.% ultrafine zirconia-silica
ceramic particles that reinforce a highly
cross-linked polymeric matrix.
The polymer matrix consists of
BisGMA and TEGDMA, and employs
a ternary initiator system.
N250997
Res
in C
emen
ts
Sel
f-ad
hes
ive
resi
n c
emen
tsyst
em
Sel
f-ad
hes
ive
cem
ent
RelyX™
Unicem/
3M ESPE, St
Paul, MN,
USA
It consists of two pastes:
Base paste: methacrylate monomers
containing phosphoric acid groups,
methacrylate monomers, silanated
fillers, initiator components, and
stabilizers.
Catalyst paste: methacrylate monomers,
alkaline (basic) fillers, silanated fillers,
initiator components, stabilizers, and
pigments.
(Filler=50% vol., 72 wt.%; avg. < 12.5
μm)
427554
Sil
ane
coupli
ng
agen
t
RelyX
Ceramic
primer /
3M ESPE, St
Paul, MN,
USA
Stable solution of a prehydrolyzed
silane-coupling agent, alcohol and
water.
N234072

110
Material Classification Brand /
Manufacturer
Composition Lot #
Res
in C
emen
ts
Sel
f-ad
hes
ive
resi
n c
emen
tsyst
em
Sel
f-ad
hes
ive
cem
ent
Clearfil SA/
Kuraray
Medical Inc.,
Sakazu,
Kurashiki,
Okayama,
Japan
It consists of two pastes:
Paste A: 10-MDP, Bis-GMA,
TEGDMA, Hydrophobic aromatic
dimethacrylate, dl-Camphorquinone,
BPO Initiator, Silanated barium glass
filler and Silanated colloidal silica.
Paste B: Bis-GMA, Hydrophobic
aromatic dimethacrylate, Hydrophobic
aliphatic dimethacrylate, Accelerators,
Pigments, and Surface treated sodium
fluoride, Silanated barium glass filler
and Silanated colloidal silica.
(Filler= 45 % vol., 66 wt.%; avg. 2.5
μm)
011AAA
Sil
ane
coupli
ng a
gen
t
Clearfil
Ceramic
primer/
Kuraray
Medical Inc.,
Sakazu,
Kurashiki,
Okayama,
Japan
Mixture of 3-trimethoxysilylpropyl
methacrylate (<5 wt.%), ethanol (>80
wt. %) and 10-Methacryloyloxydecyl
dihydrogen phosphate
00019D

111
Material Classification Brand /
Manufacturer
Composition Lot #
Res
in C
emen
ts
Adhes
ive-
bas
ed r
esin
cem
ents
yst
em
Sel
f-et
chin
g b
ondin
g
agen
t
Multilink
Primer A/B
/Ivoclar
Vivadent,
Liechtenstein
Two Bottle self-etching adhesive.
Multilink Primer A: water (85.7 wt.%)
and initiators (14.3 wt.%)
Multilink Primer B: Phosphonic acid
acrylate (48.1 wt.%), HEMA (48.1
wt.%), Methacrylate mod. polyacrylic
acid (3.8 wt.%) and Stabilizers (<0.02
wt.%)
Multilink
Primer
A:
P63825
Multilink
Primer B:
P65434
Adhes
ive-
bas
ed r
esin
cem
ent
Multilink
Automix/
Ivoclar
Vivadent,
Liechtenstein
It consists of two pastes:
Base paste:
Dimethacrylate and HEMA (30.5
wt.%), Barium glass filler and Silica
filler (45.5 wt.%), Ytterbiumtrifluoride
(23 wt.%), Catalysts and Stabilizers (1
wt.%), Pigments (<0.01 wt.%)
Catalyst paste:
Dimethacrylate and HEMA (30.2
wt.%), Barium glass filler and Silica
filler (45.5 wt.%), Ytterbiumtrifluoride
(23 wt.%),Catalysts and Stabilizers (1.3
wt.%)
(Filler=45.5 wt.%; avg. = 0.9 μm)
Multilink
Cement:
P67924
Sil
ane
coupli
ng a
gen
t
Monobond
Plus primer
/Ivoclar
Vivadent,
Liechtenstein
Solution of adhesive monomers (4
wt.%) and ethanol (96 wt.%), the
adhesive monomers combine three
different functional groups – silane
methacrylate, phosphoric acid
methacrylate and sulfide methacrylate.
Primer:
P59584

112
Material Classification Brand /
Manufacturer
Composition Lot #
Res
in C
emen
t
Adhes
ive-
bas
ed r
esin
cem
ents
yst
em
Aci
d e
tch
Scotchbond™
Phosphoric
Etchant /
3M ESPE, St
Paul, MN,
USA
The etchant is 35% phosphoric acid by
weight. It has a pH of approximately
0.6
N252067
Bondin
g a
gen
t
Adper™
Single Bond
Plus /
3M ESPE, St
Paul, MN,
USA
One-bottle adhesive containing ethanol,
2- HEMA, BisGMA, other
dimethacrylate resins, methacrylate-
modified polycarboxylic acid
copolymer, silica nanofiller, a small
amount of water and a photoinitiator
system.
N241285
Adhes
ive-
bas
ed r
esin
cem
ent
RelyX™ ARC/
3M ESPE, St
Paul, MN,
USA
It is composed of BisGMA and
TEGDMA polymer, it consists of two
pastes:
Paste A: zirconia/silica filler(68 wt.%),
pigments, amine and photo initiator
system.
Paste B:zirconia/silica filler (67 wt.%),
BPO activator
(Filler=67.5 wt.%; avg. = 1.5 μm)
N247407
Sil
ane
coupli
ng a
gen
t
RelyX
Ceramic
primer /
3M ESPE, St
Paul, MN,
USA
Stable solution of a prehydrolyzed
silane-coupling agent, alcohol and
water.
N234072

113
Abbreviations: BIS-GMA (bisphenol a diglycidyl ether dimethacrylate), BPO (benzoyl
peroxide), HEMA (hydroxyethyl methacrylate), MDP (methacryloyloxydecyl dihydrogen
phosphate), and TEGDMA (tetraethyleneglycol dimethacrylate).
Material Classification Brand /
Manufacturer
Composition Lot #
Mec
han
ical
Surf
ace
trea
tmen
t
mat
eria
l
Grit-etching
Aluminum
Oxide-50
Micron/
Danville
Engineering
Inc., California
50 microns aluminum oxide powder.
25671
Acid etching
IPS Ceramic
Etching Gel
/Ivoclar
Vivadent,
Liechtenstein
The etchant is <5% hydrofluoric acid. It
has a pH of approximately 2
P72319
Com
posi
te f
illi
ng
mat
eria
l
Composite
resin
Z100™
Restorative
/3M ESPE, St
Paul, MN,
USA
The matrix of this composite consists of
BisGMA and TEGDMA polymer. The
filler is zirconia/silica. The inorganic
filler loading is 66% by volume with a
particle size range of 3.5 to 0.01
micron.
N225470

114
Figure 24: Study groups, the total number of specimens are 240 specimens (10 per group x 24 group)
Lithium disilicate glass ceramic
(IPS e.max CAD)
(HF etched and silanated)
The Same
Indirect composite resin
(Paradigm MZ100)
(Grit-etched and silanated)
The Same
Lithium disilicate glass ceramic
(IPS e.max CAD)
(Grit-etched and silanated)
Composite resin
( Z100 Restorative)The same
Dentin
Self-adhesive resin cement
(Relx X Unicem)
Self-adhesive resin cement
(Clearfil SA)
Self-etch adhesive-based resin cement
(Multilink)
Etch-and-rinse adhesive-based resin cement
(Rely X ARC)

115
3.2.2.1 Specimen Preparation: Preparing IPS e.max CAD and Paradigm™ MZ100 specimens:
IPS e.max CAD Blocks (Ivoclar Vivadent, Liechtenstein) and Paradigm™ MZ100
Blocks (Ivoclar Vivadent, Liechtenstein)(Figure 2) were cut perpendicular to the long axis of
the block with a low speed diamond saw (Isomet, Buehler, Lake Bluff, IL) under copious water
to expose flat freshly-cut material surface. Each block was then cut perpendicular to the flat
surface into slabs of 1mm thickness using the same saw. The block of slabs was then rotated
90º and again cut perpendicular to the surface. IPS e.max CAD and Paradigm™ MZ100
microbars of cross sectional area 1mm2 ± 0.1 mm
2and 5-6 mm in length (Figure 26), were
separated to be utilized for microshear bond strength test. The IPS e.max CAD microbars were
crystallized in a ceramic furnace (EP 600 Combi, Ivoclar Vivadent, Liechtenstein) according to
the manufacturer instructions.
Figure 25: Crown materials, IPS e.max CAD (left), Paradigm MZ100 (right).

116
Figure 26: Sectioning Paradigm MZ100 crown material in a diamond cutting saw (Isomet-top), Microbars(bottom): 1: IPS e.max CAD, 2: Paradigm MZ100.
The IPS e.max CAD microbars and Paradigm™ MZ100 microbars were embedded in a
plastic rubbery base to expose the surface only for the surface treatment procedure, 50 µm
aluminum oxide particles (Figure 27) were used for grit-etching the microbars using an air
abrasion device (Microetcher ERC, Danville Engineering Inc., California)(Figure 28) from a
distance of approximately 10 mm for 15 seconds under 2 bar pressure at the nozzle. The
1 2

117
microbars were then cleaned with compressed air for 30 seconds and then further cleaned in
distilled water in an ultrasonic cleaner (FS5 Fisher Scientific, Sheboygan, Wisconsin, United
States) for 5 minutes and air-dried. Another group of IPS e.max CAD microbars was treated
with 5 % hydrofluoric acid (IPS Ceramic EtchingGel, Ivoclar Vivadent, Liechtenstein)(Figure
5) for 20 seconds, washed thoroughly for 1 min under tap water and air-dried. Then, the grit-
etched lithium disilicate ceramic (IPS. e.max CAD GE), the hydrofluoric acid etched lithium
disilicate ceramic (IPS e.max CAD HF) and the grit-etched composite resin (Paradigm MZ100)
were chemically treated with silane coupling agent presented in Table 9 according to
manufacturer instructions presented in Table 10.The surface that was utilized in adhesion and
exposed to surface treatment is the surface that was cut by the low speed saw.
Figure 27: Surface treatment materials,Aluminum oxide 50 micron powder (left),
IPS Ceramic etching gel (right)

118
Figure 28: The microetcher and dust collector cabinet.
Dentin substrate:
Intact caries-free human molars were collected and sterilized with gamma radiation
(Gamma cell 220, Atomic Energy Ltd, Mississauga, Canada) at the Department of Chemical
Engineering and Applied Chemistry, University of Toronto. Teeth were placed in a glass jar
that was placed in a cobalt chamber 5.5x8 inches, and exposed for 4 hours. The radiation dose
rate was 0.3 KGy/h. This method of sterilization has been proved to not alter the tooth tissue
mechanical or the physical properties. 202,203
Teeth were kept, wherever possible, in distilled
water in a refrigerator during and between all experimental procedures, in order to preserve
their optimum mechanical and physical properties. Roots were then embedded in chemically
cured acrylic resin bases (Ivolen, Ivoclar Vivadent, Liechtenstein, Germany) to facilitate
handling during cutting procedures.
The crown was cut perpendicular to the long axis at approximately 4 mm from the
cemento-enamel junction with a low speed diamond saw (Isomet, Buehler, Lake Bluff, IL)

119
under copious water to expose flat dentin surfaces. If needed, the surfaces were further ground
with the same saw until complete removal of enamel was achieved. This flat coronal surface of
dentin was further ground using a wheel diamond bur (#2909 314 040, Brassler, Komet, USA)
similar to the one used in crown preparation to obtain a clinically relevant surface roughness. A
tooth slice was obtained by a second cut parallel to the first one, approximately 2 mm towards
the pulp chamber. The slice was embedded in self-cured acrylic resin circular blocks (Ivolen,
Ivoclar Vivadent, Liechtenstein, Germany) with coronal dentin facing upwards, on which the
bonding procedure was performed.
Composite Z100™ Restorative substrate:
Z100™ Restorative Composite (3M ESPE, St Paul, MN, USA)was used to make
composite block in 2 mm increments. A Demi LED (light-emitting-diode) light polymerization
unit (Kerr Corporation, Middleton, WI, USA, 1100-1200 mW/cm2) was used for light-curing
each increment for 40 seconds. The surface layer of the block was cut using the low speed-
cutting saw under copious water to produce a flat composite resin surface.
The block was cut parallel to the flat composite surface into slices of 2 mm thickness
using the low speed cutting saw under copious water. For every slice, the flat surface to be
utilized in adhesion was further ground using a wheel diamond bur (#2909 314 040, Brassler,
Komet, USA) to obtain standardized roughness. The slices were embedded in self-cured acrylic
resin circular blocks (Ivolen, Ivoclar Vivadent, Liechtenstein, Germany) on which the bonding
procedure was performed.

120
3.2.2.2 Bonding procedure: Dimensions of microbars to be used for bonding were measured using a digital caliper
(Mastercraft, Toronto, Canada) and the surface area was calculated. The microbars were
randomly distributed over the groups. Each microbar was placed in the sleeve of the attachment
device to standardize the vertical position of the microbars and trial placement of the microbar
on the slice was performed prior to every bonding procedure (Figure 29). Once the position of
the rod on the substrate slice was satisfactory, bonding procedures were started. For the groups
to be bonded using RelyX ARC cement, the surface was etched with phosphoric acid and
bonding agent was applied according to the manufacturer instructions presented in Table 3. For
the groups to be bonded using Multilink cement, the surface was treated by self-etching
multilink primer according to the manufacturer instructions presented in Table3.
Four cements were used for the cementation procedures; each cement was mixed
according to the manufacturer instructions (Table 3) and applied to the microbar specimens
using microbrushes. The microbars were pressed against the underlying substrate slice using a
fixed pressure (146 gram) applied on the attachment device to reach a minimal film thickness
(Figure 29).Excess resin was removed from around the rods using microbrushes. Luting resins
were polymerized in 20 seconds stages in two opposite sides of the specimens using a Demi
LED (light-emitting-diode) light polymerization unit (Kerr Corporation, Middleton, WI, USA,
1100-1200 mW/cm2).

121
Figure 29: Attachment device (top), specimen pressed over the substrate (middle),
bonded specimen (bottom)

122
3.2.2.3 Thermocycling: Bonded specimens were stored in distilled water at 37°C for 24 hours. They were then
subjected to artificial thermal ageing (Thermocycling procedure) according to the ISO (The
International Organization for Standardization, ISO TR 11450 standard, 1994)
recommendations. Thermocycles were performed using a dwell time of 30 seconds in each bath
and a transfer time of 15 seconds between baths for 500 cycles between 5°C and 55°C. Then
specimens were subjected to the bond testing procedures immediately after thermocycling.
3.2.2.4 Microshear bond strength testing: The specimens were inspected for the interface quality (i.e., no voids or bubbles at the
interface).The specimens, which were mounted in a self-cured acrylic circular block, were fitted
in the clamp of the microshear testing machine (BISCO Microshear Tester, BISCO Inc.)(Figure
30). The blade of the machine was modified using self-cured acrylic resin to make the blade flat
in shape to fit the bonded ceramic and composite rods. Mechanical loading with speed of 0.5
mm/min was applied. The bonded area was calculated and the shear bond strength was
expressed in MPa.

123
Figure 30: Microshear bond strength testing; specimen fitted in the clamp of the microshear testing machine (top), specimen loaded in shear till failure (bottom)

124
3.2.2.5 Evaluation of the mode of failure: A single operator inspected the two halves of each specimen under a
stereomicroscope (Wild/Leica M3Z Stereo Microscope, Heerbrugg, Switzerland) at 40x
magnification to fully assess the quality of the interfacial bonding. The modes of failure were
assessed according to the following scheme:
1= Adhesive (crown material/cement interface): when at least 75% of the cement layer
exists on the substrate material (dentin or composite)
2= Adhesive failure (substrate/cement interface): when at least 75% of the cement layer
exists on the crown material (IPS e.max CAD or Paradigm MZ100)
3= Mixed: when adhesive failure occurs at both interfaces, the cement layer exists on less
than 75 % of the crown material and substrate.
4= Cohesive failure of the crown material
5= Cohesive failure of the substrate (dentin or composite)
6= Mixed cohesive/adhesive: when adhesive failure is accompanied with any cohesive
failure.
3.2.2.6 Statistical analysis: Statistical analysis was computed using SPSS (PC+ version 20 software, Chicago, IL,
USA). Data were presented as mean and standard deviation values of the microshear bond
strength(µSBS). This data is quantitative (continuous) data. Statistical analysis was carried out
using Factorial ANOVA. The significance level was set at P ≤ 0.05 and 95 % confidence level.
Factorial analysis of variance was conducted to explore the impact of CAD/CAM material, type
of cement and substrate on μSBS. CAD/CAM materials were divided into three groups
according to their material /surface treatment combination: Group 1: IPS e.max CAD GE;

125
Group 2: IPS e.max HF; Group 3: Paradigm MZ 100. Types of cement were divided into four
groups: Group 1: Rely X Unicem; Group 2: Clearfil SA; Group 3: Multilink Automix; Group 4:
Rely X ARC. Substrates were divided into two groups: Group 1: Dentin; Group 2: Composite
resin.

126
4. Results
The results of factorial ANOVA are presented in Table 10. All the investigated main
effects were statistically significant and all the interactions were not statistically significant.
Table 10:Factorial ANOVA (Dependent variable: Bond strength; Independent variables:
CAD/CAM material, type of cement and type of the substrate)
Source Type III Sum of
Squares
df Mean
Square
F Sig.
Corrected Model 303.200a 23 13.183 10.603 0.000
Intercept 12518.904 1 12518.904 10068.979 0.000
CAD/CAM material 50.827 2 25.414 20.44 0.000
Substrate 20.91 1 20.91 16.818 0.000
Type of Cement 210.259 3 70.086 56.37 0.000
CAD/CAM material * Substrate
0.786 2 0.393 0.316 0.729
CAD/CAM material* Type of
Cement 15.412 6 2.569 2.066 0.058
Substrate * Type of Cement 0.176 3 0.059 0.047 0.986
CAD/CAM material * Substrate
* Type of Cement 4.831 6 0.805 0.648 0.692
Error 268.556 216 1.243
Total 13090.66 240
Corrected Total 571.756 239
a. R Squared = .530 (Adjusted R Squared = .480)
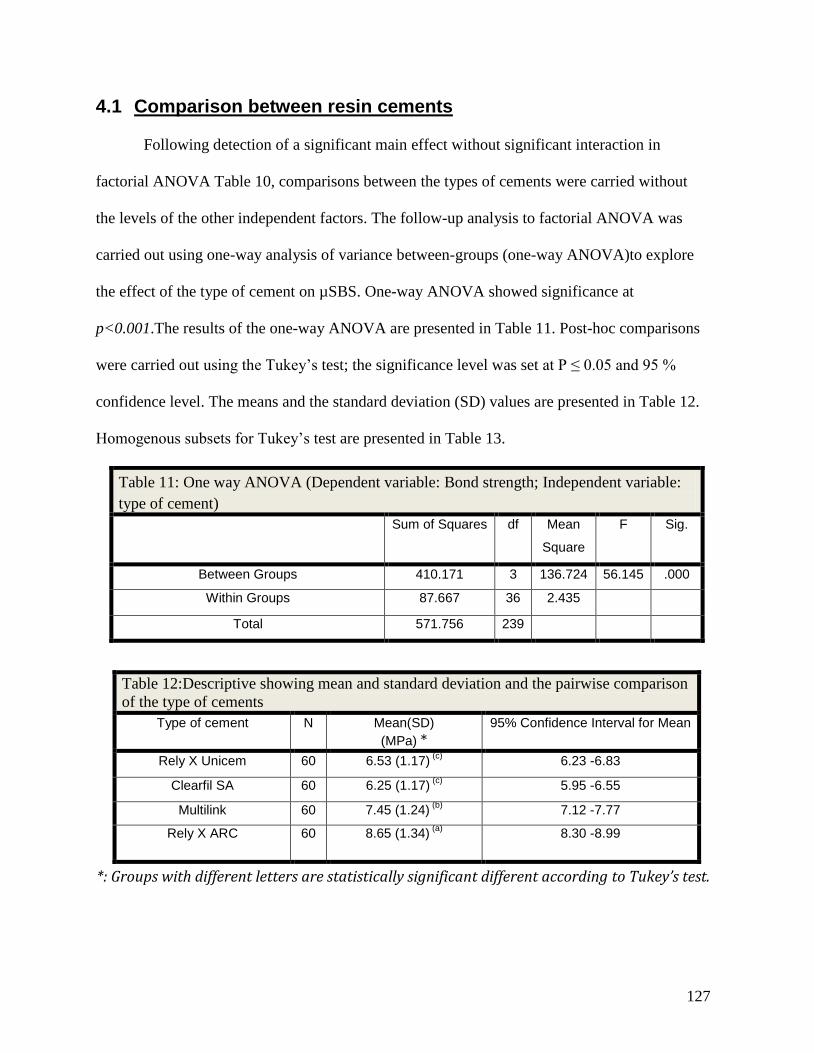
127
4.1 Comparison between resin cements Following detection of a significant main effect without significant interaction in
factorial ANOVA Table 10, comparisons between the types of cements were carried without
the levels of the other independent factors. The follow-up analysis to factorial ANOVA was
carried out using one-way analysis of variance between-groups (one-way ANOVA)to explore
the effect of the type of cement on µSBS. One-way ANOVA showed significance at
p<0.001.The results of the one-way ANOVA are presented in Table 11. Post-hoc comparisons
were carried out using the Tukey‘s test; the significance level was set at P ≤ 0.05 and 95 %
confidence level. The means and the standard deviation (SD) values are presented in Table 12.
Homogenous subsets for Tukey‘s test are presented in Table 13.
Table 12:Descriptive showing mean and standard deviation and the pairwise comparison
of the type of cements
Type of cement N Mean(SD)
(MPa) *
95% Confidence Interval for Mean
Rely X Unicem 60 6.53 (1.17) (c)
6.23 -6.83
Clearfil SA 60 6.25 (1.17) (c)
5.95 -6.55
Multilink 60 7.45 (1.24) (b)
7.12 -7.77
Rely X ARC 60 8.65 (1.34) (a)
8.30 -8.99
*: Groups with different letters are statistically significant different according to Tukey’s test.
Table 11: One way ANOVA (Dependent variable: Bond strength; Independent variable:
type of cement)
Sum of Squares df Mean
Square
F Sig.
Between Groups 410.171 3 136.724 56.145 .000
Within Groups 87.667 36 2.435
Total 571.756 239

128
Table 13:Means for Cement groups in homogeneous subsets are displayed
according toTukey HSD
Type of Cement N Subset for alpha = 0.05
1 2 3
Clearfil Sa 60 6.2533
Rely X Unicem 60 6.5350
Multilink 60
7.4500
Rely X ARC 60
8.6510
Sig.
.598 1.000 1.000
Post-hoc comparisons using the Tukey‘s test indicated that etch-and-rinse adhesive-
based resin cement (Rely X ARC) had the highest mean µSBS (p<0.001). This was followed by
self-etch adhesive-based resin cement (Multilink) (p<0.001). There was no statistically
significant difference between self-adhesive resin cement (Rely X Unicem) and self-adhesive
resin cement (Clearfil SA) (p=0.598), which showed the lowest mean µSBS. The means and
standard deviation (SD) values are presented in Figure 31.

129
Figure 31: Bar chart of the mean values of microshear bond strength (µSBS) for
different types of cements. The error bars represent standard deviation. Groups
with different letters show a statistically significant difference according to Tukey’s
test results.

130
4.2 Comparison between Substrates: Following detection of a significant main effect without significant interaction in
factorial ANOVA Table 10, comparison between substrates was carried without the levels of
the other independent factors. The follow-up analysis to a significant interaction in factorial
ANOVA was carried out using independent sample t-test. The means and the standard deviation
(SD) values are presented in Table 14.The results of the independent sample t-test are presented
in Table 15. The significance level was set at P ≤ 0.05 and 95 % confidence level.
Table 14:Descriptive analysis showing mean and standard deviation and
the pairwise comparison of the type of cements
Bond
Strength
Substrate N Mean
(MPa)*
Std.
Deviation
Dentin 120 6.9272(b)
1.57612
Composite resin 120 7.5175(a)
1.46452
*: Groups with different letters are statistically significant different.
Table 15:Independent Samples Test (Dependent variable: Bond strength;
Independent variable: type of the substrate)
BondStrength
Equal
variances
assumed
Equal
variances
not
assumed
Levene's Test for
Equality of
Variances
F .793
Sig. .374
t-test for Equality
of Means
t -3.006 -3.006
df 238 236.728
Sig. (2-tailed) .003 .003
Mean Difference -.59033 -.59033
Std. Error Difference .19640 .19640
95% Confidence Interval
of the Difference
Lower -.97725 -.97726
Upper -.20342 -.20341

131
T-test for independent samples indicated that composite resin substrate showed the
highest mean µSBS (p=0.003). The means and the standard deviation (SD) values are presented
in Figure 32.
Figure 32:Bar chart of the mean values of µSBS for different Substrates. The error
bars represent standard deviation. Groups with different letters show a statistically
significant difference according to Tukey’s test results.

132
4.3 Comparison between CAD/CAM materials Following detection of a significant main effect without significant interaction in
factorial ANOVA Table 10, comparison between CAD/CAM materials was carried without the
levels of the other independent factors. The follow-up analysis to factorial ANOVA was carried
out using one-way analysis of variance between-groups (one-way ANOVA) to explore the
effect of the CAD/CAM material on µSBS. One-way ANOVA showed significance at
p<0.001.The results of the one-way ANOVA are presented in Table 16. Post-hoc comparisons
were carried using the Tukey‘s test; the significance level was set at P ≤ 0.05 and 95 %
confidence level. The means and the standard deviation (SD) values are presented in Table 17.
Homogenous subsets for Tukey‘s test are presented in Table 18.
Table 17:Descriptive showing mean and standard deviation and the pairwise comparison
of the type of cements
Type of cement N Mean (SD)
(MPa) *
95% Confidence Interval for Mean
IPS e.max CAD GE 80 6.57 (1.17) (b)
6.31 -6.83
IPS e.max CAD HF 80 7.50 (1.51)(a)
7.16 -7.83
Paradigm MZ100 80 7.59 (1.70) (a)
7.21 -7.97
*: Significant at P ≤ 0.05, Groups with different letters are statistically significant different
according Tukey’s test results.
Table 16: One way ANOVA (Dependent variable: Bond strength; Independent
variable: CAD/CAM material)
Sum of Squares df Mean
Square
F Sig.
Between Groups 50.827 2 25.414 11.562 0.000
Within Groups 520.929 237 2.198
Total 571.756 239

133
Table 18:Means for Cement groups in homogeneous subsets are displayed
according toTukey HSD
CAD/CAM material N Subset for alpha = 0.05
1 2
IPS e.max CAD GE 80 6.5737
IPS e.max CAD HF 80
7.5000
Paradigm MZ100 80
7.5932
Sig.
1.000 .917
Post-hoc comparisons using the Tukey‘s test indicated that there was no statistically
significant difference between hydrofluoric acid etched lithium disilicate glass ceramic (IPS
e.max CAD HF) and composite resin CAD/CAM material (Paradigm MZ100) (p=0.917), which
showed the highest µSBS. This was followed by IPS e.max CAD GE, which showed the lowest
µSBS (p<0.001).The means and standard deviation (SD) values are presented in Figure 33.

134
Figure 33:Bar chart of the mean values of microshear bond strength (µSBS) for
different CAD/CAM materials. The error bars represent standard deviation. Groups
with different letters shows a statistically significant difference according to
Tukey’s test results.
4.4 Modes of failure The distribution of the modes of failure in the specimens of the microshear test is shown
in Figure 34, the majority of the failures were adhesive in nature at substrate interface 53.75%,
followed by adhesive failure at crown material interface 35%, and finally mixed failures
11.25%.
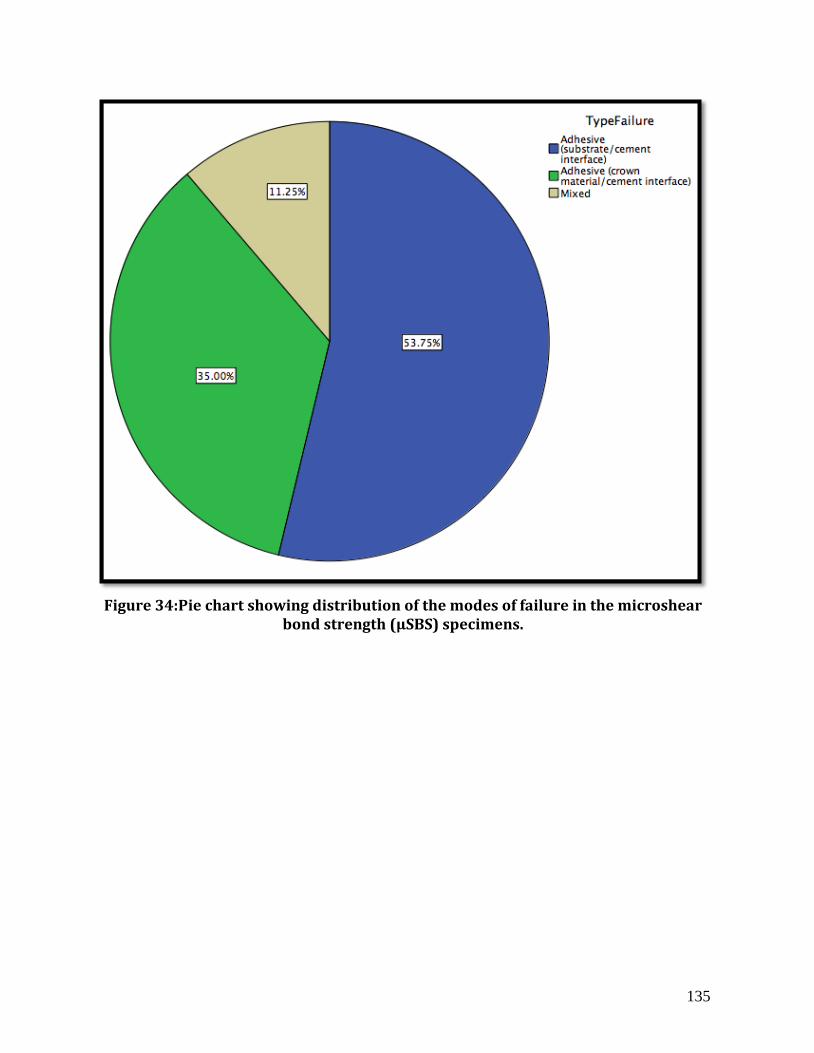
135
Figure 34:Pie chart showing distribution of the modes of failure in the microshear
bond strength (µSBS) specimens.

136
5. Discussion The microshear bond strength test has been introduced to evaluate adhesion of dental
restorations to the underlying tooth substrate as an alternative to conventional shear bond
strength testing, sharing with the microtensile bond strength testing the advantages of the
―micro‖ tests. 16
Microshear test is capable of better evaluation of the bond strength at adhesive
interfaces compared to conventional shear test as a consequence to the small surface area
specimens with decreased amount of defects and critical size flaws, and to the better stress
distribution at the adhesive interface. 151,152
Also, in microshear test, more specimens were
produced per tooth and per restoration, which is advantage over conventional shear test.172
The
main advantage of microshear test over the microtensile test (conventional methodology) is that
no sectioning of the bonded specimen is needed, thus avoiding the undue stresses that are
introduced to the microtensile specimens (conventional methodology) that lead to pretest
failures and may also affect the final bond strength results. 172
On the other hand, in the current
methodology for microshear testing, only one adhesive interface can be examined, where the
cement is bonded directly to the tooth substrate and a blade is applied to the interface inducing
shearing forces. In this study we modified the conventional microshear testing methodology to
involve two adhesive interfaces where the crown material is bonded to the underlying substrate
using resin cement in-between, thus creating a more clinically relevant situation.
Thermocycling was used in this study as a clinically relevant aging methodology.
Several studies have mentioned that 10,000 thermocycles correspond to one year of in-vivo
serviceability, which means that 500 cycles correspond to 18 day of in-vivo serviceability, thus
500 cycles is considered to be minimal aging effect. However, thermocycling for 500 cycles
between 5 °C and 55 °C is in agreement with the International Organization for

137
Standardization, ISO TR 11450 standard, 1994, 215
which considers thermocycling protocol as
an appropriate aging methodology for adhesion testing.
Comparing different cements, etch-and-rinse adhesive-based resin cement (Rely X
ARC) showed the highest statistically significant µSBS. Self-etch adhesive-based resin cement
(Multilink cement) ranked second regarding µSBS. Self-adhesive resin cements (Rely X
Unicem and Clearfil SA) were third rank with the lowest bond strength in all groups. These
results are in agreement with Ozcan et al (2012) who found that etch-and-rinse adhesive-based
resin cements have higher shear bond strength to dentin compared to self-etching adhesive resin
cements. 150
Also, in agreement with our findings, Zhang et al (2010)found that etch-and-rinse
adhesive-based resin cements and self-etch adhesive-based resin cement systems were capable
of achieving higher shear bond strength compared with self-adhesive resin cements, when used
to bond lithium disilicate ceramic restorative material and composite resin restorative material
to dentin. 217
The bonding performance of etch-and-rinse adhesive-based resin cements with
dentin substrate can be explained by the better etching ability of the etch-and-rinse system that
causes microporosities within the intertubular dentin, exposes collagen fibrils and removes the
smear layer.80
Also, the bonding performance of etch-and-rinse adhesive-based resin cement
with composite substrate could be related to the more hydrolytically stable chemical
composition of this cement in relation to other cements included in this study, 106,206
since high
concentrations of acidic resin monomers can make self-etch adhesives behave like hydrophilic
permeable membranes and mediate hydrolytic reactions at the adhesive interface. 76,85
Also, the
residual solvent (water) that remains within the adhesive interface can weaken the bond.66
Moreover, self-etching adhesive based resin cements are only capable of dissolving the smear
layer without removing it, thus calcium phosphates of the smear layer become entrapped in the

138
interfacial zone between the self-etch adhesive based resin cement and dentin and negatively
affect the bond strength. 20
This could explain the lower µSBS performance of self-etching
adhesive-based resin cement (Multilink Automix) in relation to etch-and-rinse adhesive-based
resin cement (Rely X ARC).
Self-etching adhesive-based resin cement (Multilink Automix) presented higher
microshear bond strength values compared to the two self-adhesive resin cements Rely X
Unicem and Clearfil SA. This could be explained by the incomplete neutralization of the acidic
groups in self-adhesive resin cements, which negatively affects the mechanical properties of
these cements as a result of interfering with the polymerization reaction initiators causing lower
degree of polymerization. 5,204,205
Also, it well known that self-adhesive resin cements are very
weak in etching and infiltrating dentin with no hybrid layer formation, 110,137
while self-etching
adhesive-based resin cements are capable of etching the dentin and forming hybrid layer.218
Comparing different substrates, composite resin showed the highest mean microshear
bond strength, while dentin showed the lowest mean microshear bond strength. This could be
related to the chemical bonding between unreacted monomers of the resin cement and that of
the composite resin substrate which has a 74% degree of conversion. 210
It has been reported by
Kallio et al (2001) that chemical covalent bonding could occur between unsaturated double
bonds of composite resin substrate and repair resin or intermediary resin.209
Comparing different crown materials, there was no statistically significant difference
between IPS e.max CAD HF etched and Paradigm MZ100, where both showed the highest
mean µSBS, while IPS e.max CAD GE showed the lowest mean µSBS. This could be
explained by the weak irregularities created at the surface of the ceramic when grit-etching is
employed that compromises the mechanical interlocking to this surface, 197
resulting in lower

139
bond strength values for the IPS e.max CAD GE. De Menezes et al demonstrated that
hydrofluoric acid etching of lithium disilicate ceramic rendered the surface rougher and better
for micromechanical retention as opposed to grit-etching of the same ceramic.197
The modes of failure evaluated in this study were mostly adhesive failure at the
substrate/cement interface 53.75%, followed by adhesive failure at the crown material/cement
interface 35%, and finally mixed failures 11.25%. This indicates that the stresses were
concentrated at the adhesive interface with no cohesive failures. Cohesive failures are known to
preclude measurement of the interfacial bond strength. 16
This is in agreement with Salz et al
(2010) who mentioned that below 2mm2 of adhesive area, all specimens fail adhesively at the
interface. 151
The modes of failure for the microtensile test mentioned in chapter 3 of this thesis
were mainly adhesive at the crown material/cement interface, while for the microshear test they
were primarily adhesive failures at the substrate/cement interface. This could be related to the
difference in stress distribution for every test because of the different test settings and the
difference in the direction of loading.

140
6. Limitations of the study This study has the following limitations:
1. As an in-vitro study, it helps in primary investigation of dental biomaterials bonding
properties but can‘t substitute in-vivo studies.
2. Thermocycling in a water bath between 5 °C and 55 °C for 500 can be considered of
minimal aging effect. 213,214
However, the ISO TR 11405 (1994) states that this
thermocycling protocol is recommended for aging dental interfaces prior to adhesion
testing. 215
3. This study was performed using the new microshear specimen preparation methodology
while the conventional microshear specimen preparation methodology was not
performed in this study as it tests only one adhesive interface, which limits direct
comparison of both methodologies.

141
7. Conclusions
Within the limitations of this in-vitro study, the following conclusions can be drawn:
Etch-and-rinse adhesive resin cements are capable of achieving the highest µSBS
between CAD/CAM materials and different substrates.
Self-adhesive resin cements showed the lowest µSBS between CAD/CAM materials
and different substrates.
Composite resin CAD/CAM materials and hydrofluoric acid etched lithium disilicate
ceramic showed similar µSBS to different substrates.
Composite substrate showed better bonding performance to CAD/CAM materials as
opposed to dentin substrate.
Hydrofluoric acid etching of lithium disilicate glass ceramic resulted in better bond
strength to different substrates than grit-etching of lithium disilicate glass ceramic.

142
Chapter 5 Retention Of CAD/CAM Crowns Using Self-adhesive Resin Cement

143
1. Abstract Objectives: To determine retention strength (RS) of etch-and-rinse and self-adhesive resin
cements when used to bond IP-e.max-CAD and Lava-Ultimate crowns to different substrates:
dentin, amalgam and composite. Methods: Ninety-six freshly extracted molars were prepared
to receive CAD/CAM crowns using special paralleling-device. After occlusal reduction, molars
were divided into three equal groups. One control group with no restorations, second restored
with mesio-occluso-distal amalgam (Permite-C, SDI Inc.) and third restored with mesio-
occluso-distal composite (Z100-restorative, 3M-ESPE). After crown preparations teeth were
scanned in 3d scanner (3shape-D810, 3shape) to determine surface area. Each group was further
divided into 4 equal subgroups. IPS- e.max-CAD (EMX) crowns were made for teeth in two
subgroups while composite crowns (Lava Ultimate) (LU) were made for the other two
subgroups. Crowns were milled using CEREC-3D system. Crowns of one EMX subgroup and
one LU subgroup were cemented to their respective teeth using (RelyX-Ultimate) (RXL).
Crowns of other two subgroups were cemented with (Rely-Unicem-2) (RXU). Crowns were
then subjected to compressive cyclic-loading (500,000 cycle, 80N, 1mm vertical, 1mm
horizontal, in water 37◦C, 2Hz) in chewing-simulator. Crowns were then pulled away from teeth
in Instron universal testing machine at cross head speed 0.5 mm/min. RS was calculated and
means and SDs determined. Data were statistically analyzed with multi-factorial ANOVA.
Results: ANOVA revealed significant difference in mean RS among subgroups (P<0.05).
Highest mean RS 3.88 (0.56) MPa was obtained when RXL was used to cement EMX crowns
to specimens of control group, while lowest mean RS 1.92 (0.2) MPa was obtained when RXU
was used to cement EMX crowns to specimens with amalgam fillings. Conclusions:
Irrespective of substrate, use of RXL etch-and –rinse cement resulted in significantly higher

144
mean RS whereas use of RXU resulted in significantly lower mean RS. Mean RS for composite
subgroups was higher than that of amalgam subgroups.
2. Introduction The increasing demand for esthetics in the posterior region of the mouth and
environmental concerns about restorations containing metals were behind the evolution of new
techniques for fabrication of non-metallic posterior inlays, onlays, and crowns. 219
The introduction of computer-aided design/computer-aided manufacturing (CAD/CAM)
technology in dentistry enabled dentists to use new treatment modalities. CAD/CAM machines
are now gaining popularity and are clinically proven. 220
The clinical success of these indirect
esthetic restorations depends in part on the adequate adhesion between the restoration and the
underlying bonding substrate.220,221
Resin cement systems have been successfully used to achieve adequate adhesion
between the indirect esthetic restorations and the underlying tooth substrate. 61
Resin cements
were divided into two subgroups according to the adhesive system utilized to prepare the tooth
surface prior to cementation. 61
One group used etch-and-rinse adhesive-based systems, while
the other group used self-etching primers. 61
Recently, self-adhesive resin cements were
introduced as a new subgroup of resin cements and were designed to bond directly to the tooth
structure without any pre-treatment to the tooth surface. 105
Several studies have been performed
to determine the efficiency of self-adhesive resin cements and to determine if they are a
possible replacement for current conventional adhesive resin cement systems, results being
controversial. 63,104,105
All these studies tested adhesion of resin cements to tooth substrate, yet
information about the effect of different substrates such as intact natural teeth and teeth with

145
composite or amalgam restorations on the retention of esthetic crowns are sparse in the
literature.
Several factors have been described that influence the bond strength of the indirect
esthetic restorations to the underlying bonding substrate. Some of these factors include the type
of the restoration, the type of the resin cement and the type of the bonding substrate. Also, the
outcomes of the bond strength testing showed variations with different methods of bond
strength measurement.4,13,14
In-vitro bond strength measurement tests provide immediate information on the bonding
effectiveness of new materials. The most commonly used bond strength tests are tensile and
shear tests. However, they were replaced recently by the micro tests, which allow the
production of multiple specimens from the same tooth. 172
Currently, the most common approach in micro bond strength testing is to load multiple
test specimens from each tooth in either a tensile (µTBS) or shear (µSBS) manner. However, in
microtensile bond strength testing procedures, sectioning and trimming steps may introduce
early micro cracking within the specimen and affect the recorded results, which may in turn
affect the validity of the results. Also, in microtensile bond strength testing procedures, a large
number of specimens show pre-test failures, and different studies used different statistical
approaches to deal with these pre-test failures either by excluding them from the results or
assigning them half of the lowest recorded bond strength value or assigning them a value of
zero, which also may undermine the validity of the results. In microshear bond strength testing,
the micro-cracking introduced during microtensile testing is avoided. However, highly non-
uniform stress distribution at the interface occurs and flashes of excess resin cements may exist
beyond the restoration which may affect the results.172,199

146
In spite of the considerable advances regarding adhesion testing, shortcomings of
present methods and the lack of an accepted standard protocol necessitate new adhesion testing
procedures. Currently there is very little evidence reporting the amount of force necessary to
remove a cemented crown. Lack of adequate retention can lead to the dislodgement, loss or
fracture of the crown.151,183
This in-vitro study was designed to evaluate the retention force of an etch-and-rinse and
a self-adhesive resin cement system when used to bond IPS e.max CAD and Lava Ultimate
crowns to sound natural teeth, natural teeth with amalgam filling and natural teeth with
composite resin filling. Non-metallic crowns were gripped by a new technique and pulled away
from the underlying teeth to measure their resistance to dislodgment.
3. Materials and Methods
3.1 Materials All the material used in the study and their composition (as reported by manufacturers) are
listed in Table 19.
3.2 Methods: 3.2.1 Pilot study:
The current study was preceded by an external pilot study to detect any problems with the
proposed methods of testing, where 2 samples per group were used in the pilot study. Following
the completion of the pilot study, 96 specimens were used for the main study.

147
3.2.2 Main study
Twelve groups were formed (n=8)(Figure 35). The number of specimens per group was
calculated using web-based softwarefor sample size analysis at α=0.05 and 80% power and
effect size equal to 0.356 which yields a sample size of 5 samples per group. We used 8
samples per group for this study to have more power. The effect size (f) was calculated by
using the following formula, developed by Cohen (1999).
𝑓=𝑑 ×1
2
𝑘+1
3 𝑘−1
Where k is the number of groups and d is the difference in means (x1-x2) divided by common
standard deviation (σ). Based on values obtained from the pilot study, x1=3.04, x2=2.45, σ=
0.52, the d value was calculated (d= 1.134), and 𝑓 was calculated (0.356).
Power Analysis For ANOVA Designs http://www.math.yorku.ca/SCS/Online/power/

148
Table 19: Material used in the study and their composition as reported by the manufacturer.
Material Classification Brand /
Manufacturer
Composition Lot #
CA
D/C
AM
Mat
eria
ls
Lithium
disilicate
ceramic
IPS e.max
CAD/
Ivoclar
Vivadent,
Liechtenstein
SiO2 (57 – 80 wt.%),
Li2O (11 – 19 wt.%)
K2O (0 – 13 wt.%),
P2O5 (0 – 11 wt.%),
ZrO2 (0 – 8 wt.%),
ZnO (0 – 8 wt.%),
Other and coloring oxides (0-12 wt.%)
P63946
Indirect
composite
resin
Lava™
Ultimate/
3M ESPE, St
Paul, MN,
USA
Composite material contains:
Zirconia-silica nanocluster: Synthesized
via a proprietary process from 20 nm
silica particles and 4 to 11 nm zirconia
particles;
Nanomere particles: 20 nm silica
nanomer particles and 4-11 nm zirconia
nanomere particles
The average nanocluster particle size is
0.6 to 10 micrometers.
Resin matrix composition was not
mentioned by the manufacturer
Total filler loading is 80% wt.
N481731

149
Res
in C
emen
ts
Sel
f-ad
hes
ive
resi
n c
emen
tsyst
em
Sel
f-ad
hes
ive
cem
ent
RelyX™
Unicem 2/
3M ESPE, St
Paul, MN,
USA
Self adhesive resin cement consists of
two pastes:
Base paste: methacrylate monomers
containing phosphoric acid groups,
methacrylate monomers, silanated
fillers, initiator components, stabilizers,
rheological additives.
Catalyst paste: methacrylate monomers,
alkaline (basic) fillers, silanated fillers,
initiator components, stabilizers,
pigments and rheological additives
(Filler=50% vol., 72 wt.%; avg. < 12.5
μm)
515337
Sil
ane
coupli
ng a
gen
t
RelyX
Ceramic
primer /
3M ESPE, St
Paul, MN,
USA
Stable solution of a prehydrolyzed
silane-coupling agent, alcohol and
water.
N470024

150
Res
in C
emen
t
Adhes
ive-
bas
ed r
esin
cem
ents
yst
em
Aci
d e
tch
Scotchbond
™Phosphori
c Etchant /
3M ESPE, St
Paul, MN,
USA
The etchant is 35% phosphoric acid by
weight. It has a pH of approximately 0.6
509513
Bondin
g a
gen
t
Scotchbond
™ Universal
Adhesive/
3M ESPE, St
Paul, MN,
USA
One-bottle adhesive containing MDP
Phosphate Monomer, Dimethacrylate
resins, HEMA ,
VitrebondTM Copolymer, Filler,
ethanol, water, initiators and silane
514135
Adhes
ive-
bas
ed r
esin
cem
ent
RelyX™
Ultimate/
3M ESPE, St
Paul, MN,
USA
Consists of two pastes:
Base paste: methacrylate monomers,
radiopaque silanated fillers, initiator
components, stabilizers, and rheological
additives.
Catalyst paste: methacrylate monomers,
radiopaque alkaline (basic) fillers,
initiator components, stabilizers,
pigments, rheological additives,
Fluorescence dye and Dark cure activator for Scotchbond
Universal
(Filler=43 vol.%; avg. = 13 μm)
514665
Sil
ane
coupli
ng a
gen
t
RelyX
Ceramic
primer /
3M ESPE, St
Paul, MN,
USA
Stable solution of a prehydrolyzed
silane-coupling agent, alcohol and
water.
N470024

151
Material Classification Brand /
Manufacturer
Composition Lot #
Mec
han
ical
Surf
ace
trea
tmen
t m
ater
ial
Grit-etching
Aluminum
Oxide-50
Micron/
Danville
Engineering
Inc.,
California
50 microns aluminum oxide powder.
25671
Acid etching
IPS Ceramic
Etching Gel
/Ivoclar
Vivadent,
Liechtenstein
The etchant is <5% hydrofluoric acid. It
has a pH of approximately 2
P72319
Tooth
fil
ling m
ater
ial
Composite
resin
Z100™
Restorative
/3M ESPE,
St Paul, MN,
USA
The matrix of this composite consists of
BisGMA and TEGDMA polymer. The
filler is zirconia/silica. The inorganic
filler loading is 66% by volume with a
particle size range of 3.5 to 0.01 micron.
N464768
Amalgam
Permite /
SDI Inc.,
Itasca,
USA
Non-gamma two admix alloy consists
of:
Ag 56%, Sn 27.9%, Cu 15.4%, In 0.5%,
Zn 0.2%, Hg 47.9%
Alloy particles are spherical and lath
cut.
110615102

152
Figure 35: Study groups, the total number of specimens is 96 (8 per group x 12 group)
Indirect composite resin
(Lava™ Ultimate)The Same
Lithium disilicate glass ceramic
(IPS e.max CAD)
Self-adhesive resin cement
(RelyX Unicem 2)The same
Etch-and-rinse adhesive based resin cement
(RelyX Ultimate )
Natural Teeth
Natural teeth with amalgam filling
Natural teeth with composite resin filling
153
3.2.2.1 Specimen collection and storage Intact caries-free human molars were collected and cleaned with periodontal
scalers and curettes, then sterilized with gamma radiation (Gamma cell 220, Atomic Energy
Ltd, Mississauga, Canada) at the Department of Chemical Engineering and Applied Chemistry,
University of Toronto. Teeth were placed in a cobalt chamber 5.5x8 inches, and exposed for 4
hours. The radiation dose rate was 0.3 KGy/h. This method of sterilization has been proved to
not alter the mechanical or physical properties of the tooth tissue. 202,203
Teeth were kept wet,
wherever possible, in distilled water in a refrigerator during and between all experimental
procedures, in order to preserve their optimum mechanical and physical properties.
3.2.2.2 Specimen preparation: The dimensions of the teeth were measured mesio-distally and bucco-lingually at
the cemento-enamel junction using a digital caliper (Mastercraft, Toronto, Canada)at
approximately the mid-point of every surface. An average width for every toothwas
calculated based on the bucco-lingual and the mesio-distal readings. Teeth were then
divided into three groups based on size: small (less than 8mm), medium (8-10 mm) and
large (more than 10mm). The teeth were randomly assigned to the study groups in such a
way to have even distribution of different sizes of the teeth. Every group included two
small molars, five medium-sized molars and one large molar(n=8). The roots of each
tooth were notched and 4-5 restorative pins (TMS Link, Coltene/Whaledent Inc.,
Cuyahoga Falls, USA) were inserted horizontally into the roots. The occlusal surface of the
teeth was attached to the vertical arm of a dental surveyor (Figure 36), using
thermoplastic dental compound (Impression Compound, Kerr Inc., USA), so that the long
axis of the tooth coincides with the vertical arm of the surveyor and the cemento-enamel

154
junction was parallel to the horizontal plane. Teeth were then mounted in acrylic resin
(Ivolen, Ivoclar Vivadent, Liechtenstein, Germany), at a level of 2 mm apical to the cemento-
enamel junction (CEJ), using a metal threaded cylinder creating a base. Teeth were then
separated from the surveyor arm.
Figure 36: Molar tooth inserted in acrylic resin inside the threaded metal base.
Occlusal reduction of the teeth was carried out to a vertical height of 4±0.25 mm
using wheel diamond bur (#2909, Komet, USA) mounted in a high-speed air turbine
handpiece with profuse water coolant. Specimens were then divided into three groups: a
control consisting of unrestored teeth, a group with teeth having mesio-occluso-distal
(M.O.D) amalgam restorations (3 mm width and 2 mm depth), and a group with teeth
having similar M.O.D composite restorations. For teeth having M.O.D restorations, cavity
preparation was done with tungsten carbide burs (#330, SS White, Great White Series,
Lakewood, NJ, USA) in a high speed air turbine handpiece with copious water coolant and
all the line angles were rounded to have a cavity with dimensions of 3mm±0.25 mm width

155
and 2 mm±0.25 depth. Bur was changed every eight-cavity preparations to ensure
sharpness of the bur. For amalgam restorations, permite amalgam capsules were
triturated for 9 seconds in an amalgamator (VARI-MIX III, Dentsply, USA) and amalgam
was condensed into the cavity with the aid of a tofflemire matrix retainer and band. For
composite resin restoration, the teeth were restored with composite Z100 restorative in
two increments, and each increment was light-cured for 40 seconds. Finishing of the
restorations was done after 24 hours storage of the teeth in water before crown
preparations.
Crown preparations were made with a 1 mm shoulder margin positioned just
occlusal to the cement-enamel junction and 10± 2 degree axial wall convergence for every
wall (20± 4degree total angle of convergence mesio-distally and 20± 4degree total angle
of convergence bucco-lingually) using flat-end taper diamond bur (#847, Brassler, USA)in a
high-speed air turbine handpiece with copious water coolant mounted in a parallelometer
to standardize the taper of the preparation (Figure37). Bur was changed every eight
preparations to ensure good cutting efficiency. The degree of taper was verified using
measuring software (Onde rulers v1.13.1, Ondeosoft Computing Inc.)when optical
impressions were subsequently taken by the CAD/CAM camera (Figure 40). Occlusal
surface was finished to create a non-anatomical occlusal table. 3D scanning was
performed using a 3D scanner (D810 3D Scanner, 3Shape Inc., New Jersey, USA) in order
to calculate the teeth surface area (Figure 38).

156
Figure 37: a) Parallelometer used to prepare teeth, b) Prepared natural molar tooth, C) Prepared natural tooth with composite restoration, D) Prepared natural tooth with amalgam restoration.
a b
c d

157
Figure 38: Top: 3D scanner, Bottom: scanned tooth for surface area determination.
3.2.2.3 Impressions and restoration design
Optical reflective medium spray (IPS contrast spray,Ivoclar Vivadent,
Liechtenstein) was used to cover the prepared teeth with a thin layer (Figure 39) .An
optical impression of the prepared tooth was captured using the CEREC 3D intraoral
camera. CEREC software was used to design crowns. Each crown was made with
anatomical features of lower second molar readily available on a computer program.
Minimum occlusal thickness (at central fossa) was designed to be 1.5 mm. Thickness of
crown at various points was verified with Boley gauge after milling.

158
Figure 39: Prepared tooth sprayed with the IPS contrast medium to be ready for optical impression.
Figure 40: Angle verification on the optical impression.

159
3.2.2.4 Crown fabrication Forty-eight crowns were fabricated from each crown material: IPS e.max CAD and
Lava Ultimate blocks, using the CEREC 3D milling unit (Figure 41). Cutting diamonds were
changed after milling eight crowns. IPS e.max CAD crowns were crystallized in a ceramic
furnace (EP 600 Combi, Ivoclar Vivadent, Liechtenstein) according to the manufacturer
instructions (Table2)(Figure 42).
a
b
c
Figure 41: a) Milling machine, b) IPS e.max CAD Block in the milling machine, C) Cerec 3 Machine.

160
Figure 42: IPS e.max Cad crowns in the EB600 Combi furnace.
Figure 43: Left: IPS e.max CAD crowns before crystallization, right: IPS e.max CAD crowns after crystallization.
161
3.2.2.5 Crowns surface treatment The intaglio surfaces of the IPS e.max CAD crowns were etched with 5%
hydrofluoric acid etching gel (IPS ceramic etching gel, Ivoclar Vivadent, Liechtenstein)for
20 sec then washed using water spray for 60 seconds, air-dried then silanated (RelyX
ceramic primer, 3M ESPE). The intaglio surfaces of Lava Ultimate crowns were grit-etched
with 50 µm aluminum oxide powder in an air abrasion device (Microetcher ERC, Danville
Engineering Inc., California) under 2 bar pressure at the nozzle. They were then cleaned with
compressed air-water spray for 30 seconds and further cleaned in distilled water in an
ultrasonic cleaner for 5 minutes, air-dried then silanated (RelyX ceramic primer, 3M
ESPE).
3.2.2.6 Cementation
All crowns were divided into two main groups, one group was cemented with etch-
and-rinse adhesive cement (Rely X Ultimate, 3M ESPE), the other group was cemented
with self-adhesive resin cement (Rely X Unicem 2, 3M ESPE). The cements were mixed
and applied to the intaglio surfaces of the crowns according to the manufacturer’s
instructions(Table 20). The crowns were initially seated on their respective abutments
using finger pressure, then the crowns were placed under a static load of 22 N for 5
minutes (Figure44), the excess cement was briefly light-cured then removed. After load
removal, each crown was light-cured for 20 seconds on each surface.

162
Table 20: Materials and sequence for their respective application (according to the manufacturer)
Materials
(Manufacturers)
Etchant Adhesive Ceramic
primer
Luting Resin
Cement
RelyX Unicem 2 (3M ESPE, St
Paul, USA)
------- ------ Apply
RelyX™
ceramic
primer to
the
roughened
crown
material
and allow
to dry for
5 seconds.
Dispense and
mix the
cement using
the automix
tips, then apply
the cement in a
thin layer on
the bonding
surfaces with
micro brush,
light cure for 2
seconds and
remove excess,
then light cure
for 20 seconds
per surface.
RelyX™
Ultimate
(3M ESPE, St
Paul, USA)
Apply
Scotchbond
™ Etchant
for 15
secondsto the
tooth
substrate,
water rinse
for 10
seconds. Dry
the surface
with gentle
air stream.
Apply 2
consecutive
coats of
Scotchbond™
Universal
Adhesive to the
tooth substrate
using
microbrush and
rub itin for 20
seconds, and
then dry the
surface with
gentle air
stream for 5
seconds. Then
light-cure for
10 seconds.
Apply
RelyX™
ceramic
primer to
the
roughened
crown
material
and allow
to dry for
5 seconds.
Dispense and
mix the
cement using
the automix
tips, then apply
the cement in a
thin layer on
the bonding
surfaces with
microbrush,
light cure for 2
seconds and
remove excess,
then light cure
for 20 seconds
per surface.

163
3.2.2.7 Cyclic loading Specimens with their metal threaded bases were then transferred to the plastic
chamber of a chewing simulator (chewing simulator CS-4, SD Mechatronik Co., Germany)
and secured in their place using putty rubber base impression material (Provil novo putty,
Heraeus Kulzer, Germany) and custom made acrylic ring (Ivolen, Ivoclar Vivadent,
Liechtenstein, Germany). Crowns were then subjected to compressive cyclic loading for
500,000 cycles at speed 2 Hz in a water bath of 37 C°. The chewing simulator stainless
steel antagonist cone, with 30° total taper and its end machined to a curvature equivalent to
Figure 44: Crowns were placed under static load of 22N for 5 minutes.

164
3mm diameter, was adjusted to contact the central fossa of the crowns and preload the
crowns with 80 N force by 0.2 mm vertical displacement, it was adjusted to move in two
directions, vertical movement of 1 mm and horizontal movement 1mm, to induce both
vertical and horizontal forces during the chewing cycles (Figure 45).
Figure 45: Crowns being aged in the chewing simulator.
3.2.2.8 Retention testing The outer surface of the e.max crowns were acid etched with hydrofluoric acid and
silanated, while the Lava Ultimate crowns outer surfaces were grit-etched and silanated.
Pink wax was used to protect and cover the restoration/tooth interface then acrylic resin was
built up over and around the crown inside a threaded metal cylinder to create a base
through which it can be attached to the universal testing machine(Figure 46). A dental
surveyor was used to adjust the alignment of the threaded metal base. The whole
assembly was attached to a universal testing machine (Instron 4301 universal tester,
Instron, USA) using special custom made attachment (Figure 47). Tensile force was
applied to dislodge the crown away from the tooth along the long axis with cross head

165
speed of 0.5 mm/min. The force of retention was recorded and then divided by the surface
area and retention stress was calculated in MPa.
a
b
c d
Figure 46: a) Protecting the restoration tooth interface with wax, b) building acrylic over the crown, c) adding the threaded metal base with acrylic over the crown, d) the attachment device; 1) the threaded metal base for crown, 2) the threaded metal base for tooth.

166
Figure 47: Top: Pulling the crowns out using Instron universal testing machine, Bottom: crown dislodged from its abutment.

167
3.2.2.9 Evaluation of the mode of failure:
A single operator inspected the dislodged crowns and their corresponding teeth
under a stereomicroscope (Wild/Leica M3Z Stereo Microscope, Heerbrugg, Switzerland) at 10x
magnification to fully assess the interfacial area. The modes of failure were inspected according
to the following scheme:
1) Adhesive (crown material/cement interface): when at least 75% of the cement layer
exists on the substrate material (dentin or composite)
2) Adhesive failure (substrate/cement interface): when at least 75% of the cement layer
exists on the Crown material (IPS e.mac CAD or Lava Ultimate)
3) Mixed: when adhesive failure occurs at both interfaces, the cement layer exists on less
than 75 % of the crown material and substrate.
4) Cohesive failure of the crown material
5) Cohesive failure of the substrate (dentin or composite)
6) Mixed cohesive/adhesive: when adhesive failure is accompanied with any cohesive
failure.
3.2.2.10 Statistical analysis: Statistical analysis was computed using SPSS (PC+ version 20 software, Chicago, IL,
USA). Data were presented as mean and standard deviation values of the retention strength.
This data is quantitative (continuous). Statistical analysis was carried out using Factorial
ANOVA. The significance level was set at P ≤ 0.05 and 95 % confidence level. Factorial
analysis of variance was conducted to explore the impact of CAD/CAM material, type of
cement and substrate on the retention strength. CAD/CAM material was divided into two
groups: Group 1: IPS e.max CAD; Group 2: Lava Ultimate. Types of cement were divided into

168
two groups: Group 1: Rely X Ultimate; Group 2: RelyX Unicem 2. Substrates were divided into
three groups: Group 1: Natural teeth; Group 2: Natural teeth with amalgam filling; Group 3:
Natural teeth with composite resin filling.

169
4. Results
All the investigated main effects were statistically significant at p<0.01, Table 21.
Interaction effect between CAD/CAM material and substrate was statistically significant,
F (2, 84) = 3.275, p=0.043.Interaction effect between CAD/CAM material and type of
cement was statistically significant, F (1, 84) = 4.416, p=0.039.
Table 21:Factorial ANOVA (Dependent variable: Bond strength; Independent
variables: CAD/CAM material, type of cement and type of the substrate)
Source Type III Sum of
Squares
df Mean
Square
F Sig.
Corrected Model 37.316a 11 3.392 36.934 0.000
Intercept 766.253 1 766.253 8342.439 0.000
CAD/CAM material 4.403 1 4.403 47.94 0.000
Substrate 30.724 2 15.362 167.249 0.000
Type of Cement 0.781 1 0.781 8.505 0.005
CAD/CAM material * Substrate 0.602 2 0.301 3.275 0.043
CAD/CAMmaterial * Type of
Cement 0.406 1 0.406 4.416 0.039
Substrate * Type of Cement 0.091 2 0.045 0.494 0.612
CAD/CAM material * Substrate *
Type of Cement 0.31 2 0.155 1.687 0.191
Error 7.715 84 0.092
Total 811.284 96
Corrected Total 45.031 95
a. R Squared = .829 (Adjusted R Squared = .806)

170
4.1 Comparison between resin cements Following detection of a significant interaction, comparison between the types of
cements was carried out within levels of the other independent factors: Substrate (Group
1: Natural teeth; Group 2: Natural teeth with amalgam filling; Group 3: Natural teeth with
composite resin filling) and CAD/CAM material (Group 1: IPS e.max CAD; Group 2:
Lava Ultimate). The follow-up analysis to a significant interaction in factorial ANOVA
was carried out using independent sample t-test. The results of the independent sample t-
test are presented in Table 22. The significance level was set at P ≤ 0.05 and 95 %
confidence level. The means and the standard deviation (SD) values are presented in
Table 23.
Table 22: indepent sample t-test (Dependent variable: Bond strength, Independent
variable: type of cement)
CAD/CAM material
Substrate Levene's Test for Equality of Variances
t-test for Equality of Means
F Sig. t df Sig. (2-tailed)
IPS e.max
CAD
Natural teeth
E.V.A 0.324 0.578 4.054 14 0.001
E.V.N.A 4.054 11.014 0.002
Natural teeth +
Amalgam
E.V.A 0.139 0.715 2.891 14 0.012
E.V.N.A 2.891 13.695 0.012
Natural teeth +
Composite
E.V.A 6.936 0.02 2.416 14 0.030
E.V.N.A 2.416 10.449 0.035
Lava
Ultimate
Natural teeth
E.V.A 1.173 0.297 2.644 14 0.019
E.V.N.A 2.644 11.534 0.022
Natural teeth +
Amalgam
E.V.A 0.488 0.496 2.565 14 0.022
E.V.N.A 2.565 12.356 0.024
Natural teeth +
Composite
E.V.A 1.259 0.281 2.489 14 0.026
E.V.N.A 2.489 11.594 0.029
E.V.A: equal variance assumed; E.V.N.A: equal variance not assumed

171
Table 23: Descriptive showing mean and standard deviation and the pairwise
comparison of the type of cements
CAD/CAM material
Substrate N Mean(SD) * 95% Confidence Interval for Mean
IPS e.max CAD
Natural teeth
Rely X Ultimate 8 3.88(0.56) (a)
3.40-4.35
Rely X Unicem 2 8 2.94(0.31) (b)
2.67-3.21
Natural teeth +
Amalgam
Rely X Ultimate 8 2.24(0.23) (a)
2.04-2.43
Rely X Unicem 2 8 1.92(0.20) (b)
1.75-2.09
Natural teeth +
Composite
Rely X Ultimate 8 2.91(0.22) (a)
2.72-3.10
Rely X Unicem 2 8 2.49(0.44) (b)
2.12-2.86
Lava Ultimate
Natural teeth
Rely X Ultimate 8 3.85(0.32) (a)
3.58-4.12
Rely X Unicem 2 8 3.50(0.19) (b)
3.33-3.66
Natural teeth +
Amalgam
Rely X Ultimate 8 2.35(0.14) (a)
2.23-2.47
Rely X Unicem 2 8 2.13(0.20) (b)
1.96-2.30
Natural teeth +
Composite
Rely X Ultimate 8 2.98(0.18) (a)
2.82-3.14
Rely X Unicem 2 8 2.66(0.30) (b)
2.40-2.92
*: Significant at P ≤ 0.05, Groups with different letters are statistically significant
different according Tukey’s test results.

172
4.1.1 Lithium disilicate glass ceramic (IPS e.max CAD)
Comparison between different types of cements was carried when these cements
were used to bond lithium disilicate glass ceramic crowns (IPS e.max CAD)to different
substrates (Natural teeth, Natural teeth + Amalgam, Natural Teeth + Composite). The
means and standard deviation (SD) values are presented in Figure 48 and Table 23.
4.1.1.1 Natural teeth
T-test for independent samples indicated that etch-and-rinse adhesive-based resin
cement (RelyX Ultimate) showed the highest mean retention strength (p=0.001),while
self-adhesive resin cement (RelyX Unicem 2), showed the lowest retention strength. The
means and standard deviation (SD) values are presented in Figure 48.
4.1.1.2 Natural teeth + Amalgam
T-test for independent samples indicated that etch-and-rinse adhesive-based resin
cement (RelyX Ultimate) showed the highest mean retention strength (p=0.012),while
self-adhesive resin cement (RelyX Unicem 2), showed the lowest retention strength. The
means and standard deviation (SD) values are presented in Figure 48.
4.1.1.3 Natural teeth + Composite T-test for independent samples indicated that etch-and-rinse adhesive-based resin
cement (RelyX Ultimate) showed the highest mean retention strength (p=0.035),while
self-adhesive resin cement (RelyX Unicem 2), showed the lowest retention strength. The
means and standard deviation (SD) values are presented in Figure 48.

173
Figure 48: Bar chart of the mean values of retention strength (RS) for different
cements with IPS e.max CAD. The error bars represent standard deviation.
For every level of comparison, groups with different letters shows a
statistically significant difference according to Tukey’s test results.

174
4.1.2 Composite resin (Lava Ultimate)
Comparison between different types of cements was carried when these cements
were used to bond composite resin crowns (Lava Ultimate) to different substrates
(Natural teeth, Natural teeth + Amalgam, Natural Teeth + Composite). The means and
the standard deviation (SD) values are presented in Figure 49 and Table 23.
4.1.2.1 Natural teeth
T-test for independent samples indicated that etch-and-rinse adhesive-based resin
cement (RelyX Ultimate) showed the highest mean retention strength (p=0.019), while
self-adhesive resin cement (RelyX Unicem 2), showed the lowest retention strength. The
means and standard deviation (SD) values are presented in Figure 49.
4.1.2.2 Natural teeth + Amalgam
T-test for independent samples indicated that etch-and-rinse adhesive-based resin
cement (RelyX Ultimate) showed the highest statistically significant mean retention
strength (p=0.022), while self-adhesive resin cement (RelyX Unicem 2), showed the
lowest retention strength. The means and standard deviation (SD) values are presented in
Figure 49.
4.1.2.3 Natural teeth + Composite
T-test for independent samples indicated that etch-and-rinse adhesive-based resin
cement (RelyX Ultimate) showed the highest mean retention strength (p=0.026), while
self-adhesive resin cement (RelyX Unicem 2), showed the lowest retention strength. The
means and standard deviation (SD) values are presented in Figure 49.

175
Figure 49: Bar chart of the mean values of retention strength (RS) for different
cements with Lava Ultimate. The error bars represent standard deviation. For
every level of comparison, groups with different letters shows a statistically
significant difference according to Tukey’s test results.

176
4.2 Comparison between substrates: Following detection of a significant interactions, comparison between the
substrates was carried out within levels of the other independent factors: CAD/CAM
material (Group 1: IPS e.max CAD; Group 2: Lava Ultimate) and type of cement (Group
1: Rely X Ultimate; Group 2: RelyX Unicem 2). The Follow-up analysis to a significant
interaction in factorial ANOVA was carried out using one-way analysis of variance
between-groups (one-way ANOVA) for every level of comparison. One-way ANOVA
show significance at p<0.001at all levels of comparison. The results of the one-way
ANOVA are presented in Table 24. Post-hoc comparisons were carried using Tukey‘s
test; the significance level was set at P ≤ 0.05 and 95 % confidence level. The means and
the standard deviation (SD) values are presented in Table 23.
Table 24: One way ANOVA (Dependent variable: Retention strength; Independent
variable: type of cement)
CAD/CAM
material
Substrate Sum of
Squares
df Mean
Square
F Sig.
IPS e.max
CAD
RelyX
Ultimate
Between Groups 10.851 2 5.426 37.882 0.000
Within Groups 3.008 21 0.143
RelyX
Unicem 2
Between Groups 4.169 2 2.084 18.485 0.000
Within Groups 2.368 21 0.113
Paradigm
MZ100
RelyX
Ultimate
Between Groups 9.078 2 4.539 85.385 0.000
Within Groups 1.116 21 0.053
RelyX
Unicem 2
Between Groups 7.628 2 3.814 65.467 0.000
Within Groups 1.223 21 0.058

177
4.2.1 Lithium disilicate glass ceramic (IPS e.max CAD)
Comparison between different substrates was carried out when etch-and-rinse
adhesive-based resin cement (RelyX Ultimate) and self-adhesive resin cement (RelyX
Unicem 2) were used to bond the lithium disilicate glass ceramic crowns (IPS e.max
CAD). The means and standard deviation (SD) values are presented in Figure 50 and
Table 23.
4.2.1.1 Etch-and-rinse adhesive-based resin cement (RelyX Ultimate)
One-way analysis of variance was conducted to explore the effect of the substrate
on the retention strength (RS)when etch-and-rinse adhesive-based resin cement (RelyX
Ultimate) was used to bond lithium disilicate glass ceramic crowns (IPS e.max CAD).
There was a statistically significant difference at p<0.001 (Table 24). Post-hoc
comparisons using the Tukey‘s test indicated that natural teeth had the highest mean
retention strength. This was followed by natural teeth + composite, which came in the
second rank. Finally, natural teeth + amalgam had the lowest retention strength.
4.2.1.2 Self-adhesive resin cement (RelyX Unicem 2)
One-way analysis of variance was conducted to explore the effect of the substrate
on the retention strength (RS)when self-adhesive resin cement (RelyX Unicem 2) was
used to bond lithium disilicate glass ceramic crowns (IPS e.max CAD). There was a
statistically significant difference at p<0.001 (Table 24). Post-hoc comparisons using
Tukey‘s test indicated that natural teeth had the highest mean retention strength. This was
followed by natural teeth + composite, which came in the second rank. Finally, natural
teeth + amalgam had the lowest retention strength.

178
Figure 50: Bar chart of the mean values of retention strength (RS) for different
substrates with IPS e.max CAD. The error bars represent standard deviation.
For every level of comparison, groups with different letters shows a
statistically significant difference according to Tukey’s test results.

179
4.2.2 Composite resin (Lava Ultimate)
Comparison between different substrates was carried when etch-and-rinse
adhesive-based resin cement (RelyX Ultimate) and self-adhesive resin cement (RelyX
Unicem 2) were used to bond the composite resin crowns (Lava Ultimate). The means
and standard deviation (SD) values are presented in Figure 51 and Table 23.
4.2.2.1 Etch-and-rinse (RelyX Ultimate)
One-way analysis of variance was conducted to explore the effect of the substrate
on the retention strength (RS) when etch-and-rinse adhesive-based resin cement (RelyX
Ultimate) was used to bond the composite resin crowns (Lava Ultimate). There was a
statistically significant difference at p<0.001 (Table 24). Post-hoc comparisons using
Tukey‘s test indicated that natural teeth had the highest mean retention strength. This was
followed by natural teeth + composite, which came in the second rank. Finally, natural
teeth + amalgam had the lowest retention strength.
4.2.2.2 Self-adhesive resin cement (RelyX Unicem 2)
One-way analysis of variance was conducted to explore the effect of the substrate
on the retention strength (RS) when self-adhesive resin cement (RelyX Unicem 2) was
used to bond the composite resin crowns (Lava Ultimate). There was a statistically
significant difference at p<0.001 (Table 24). Post-hoc comparisons using Tukey‘s test
indicated that natural teeth had the highest mean retention strength. This was followed by
natural teeth + composite, which came in the second rank. Finally, natural teeth +
amalgam had the lowest retention strength.
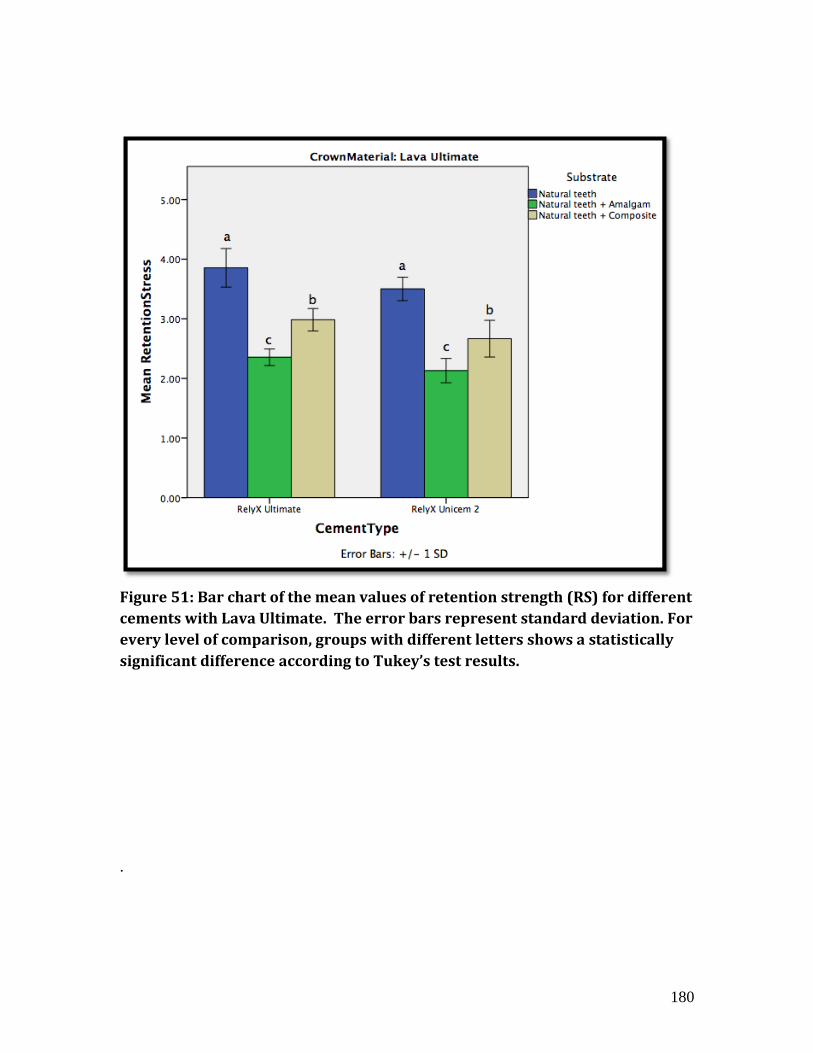
180
Figure 51: Bar chart of the mean values of retention strength (RS) for different
cements with Lava Ultimate. The error bars represent standard deviation. For
every level of comparison, groups with different letters shows a statistically
significant difference according to Tukey’s test results.
.

181
4.3 Comparison between CAD/CAM materials
Following detection of a significant interaction, comparison between the
CAD/CAM materials was carried within levels of the other independent factors:
Substrate (Group 1: Natural teeth; Group 2: Natural teeth with amalgam filling; Group 3:
Natural teeth with composite resin filling) and Type of cement (Group 1: RelyX
Ultimate; Group 2: RelyX Unicem 2). The follow up analysis to a significant interaction
in factorial ANOVA was carried out using independent sample t-test. The results of the
independent sample t-test are presented in Table 25. The significance level was set at P ≤
0.05 and 95% confidence level. The means and the standard deviation (SD) values are
presented in Table 23.
Table 25: Independent sample t-test (Dependent variable: Retention strength,
Independent variable: CAD/CAM material)
CAD/CAM material
Substrate Levene's Test for Equality of Variances
t-test for Equality of Means
F Sig. t df Sig. (2-tailed)
RelyX
Ultimate
Natural teeth
E.V.A 0.449 0.514 0.113 14 0.911
E.V.N.A
0.113 11.102 0.912
Natural teeth +
Amalgam
E.V.A 2.272 0.154 -1.17 14 0.261
E.V.N.A
-1.17 11.409 0.266
Natural teeth +
Composite
E.V.A 0.495 0.493 -0.623 14 0.543
E.V.N.A -0.623 13.532 0.544
RelyX
Unicem 2
Natural teeth
E.V.A 2.355 0.147 -4.188 14 0.001
E.V.N.A
-4.188 11.626 0.001
Natural teeth +
Amalgam
E.V.A 0.119 0.735 -2.013 14 0.064
E.V.N.A
-2.013 13.997 0.064
Natural teeth +
Composite
E.V.A 2.686 0.123 -0.905 14 0.381
E.V.N.A
-0.905 12.486 0.383
E.V.A: equal variance assumed; E.V.N.A: equal variance not assumed

182
4.3.1 Etch-and-rinse adhesive-based resin cement (RelyX Ultimate)
Comparison between different CAD/CAM materials was carried when bonded to
different substrates using etch-and-rinse adhesive-based resin cement (RelyX Ultimate).
The means and the standard deviation (SD) values are presented in Figure 52 and Table
23.
4.3.1.1 Natural teeth
T-test for independent samples indicated that there was no significant difference
in retention strength between lithium disilicate glass ceramic (IPS e.max CAD) and
composite resin (Lava Ultimate) crowns (p=0.911). The means and the standard deviation
(SD) values are presented in Figure 52.
4.3.1.2 Natural teeth + Amalgam
T-test for independent samples indicated that there was no significant difference
in retention strength between lithium disilicate glass ceramic (IPS e.max CAD) and
composite resin (Lava Ultimate) crowns (p=0.261). The means and the standard deviation
(SD) values are presented in Figure 52.
4.3.1.3 Natural teeth + Composite
T-test for independent samples indicated that there was no significant difference
in retention strength between lithium disilicate glass ceramic (IPS e.max CAD) and
composite resin (Lava Ultimate) crowns (p=0.543). The means and the standard deviation
(SD) values are presented in Figure 52.

183
Figure 52: Bar chart of the mean values of retention strength (RS) for different
CAD/CAM materials with RelyX Ultimate. The error bars represent standard
deviation. For every level of comparison, groups with different letters shows a
statistically significant difference according to Tukey’s test results.

184
4.3.2 Self-adhesive resin cement (RelyX Unicem 2)
Comparison between different CAD/CAM materials was carried when bonded to
different substrates using self-adhesive resin cement (RelyX Unicem 2). The means and
the standard deviation (SD) values are presented in Figure 53 and Table 23.
4.3.2.1 Natural teeth
T-test for independent samples indicated that composite resin crowns (Lava
Ultimate) showed the highest mean retention strength (p<0.01),lithium disilicate glass
ceramic crowns (IPS e.max CAD)showed the lowest retention strength. The means and
standard deviation (SD) values are presented in Figure 53.
4.3.2.2 Natural teeth + Amalgam
T-test for independent samples indicated that there was no significant difference
in retention strength between lithium disilicate glass ceramic (IPS e.max CAD) and
composite resin (Lava Ultimate) crowns (p=0.064). The means and the standard deviation
(SD) values are presented in Figure 53.
4.3.2.3 Natural teeth + Composite T-test for independent samples indicated that there was no significant difference
in retention strength between lithium disilicate glass ceramic (IPS e.max CAD) and
composite resin (Lava Ultimate) crowns (p=0.381). The means and the standard deviation
(SD) values are presented in Figure 53.
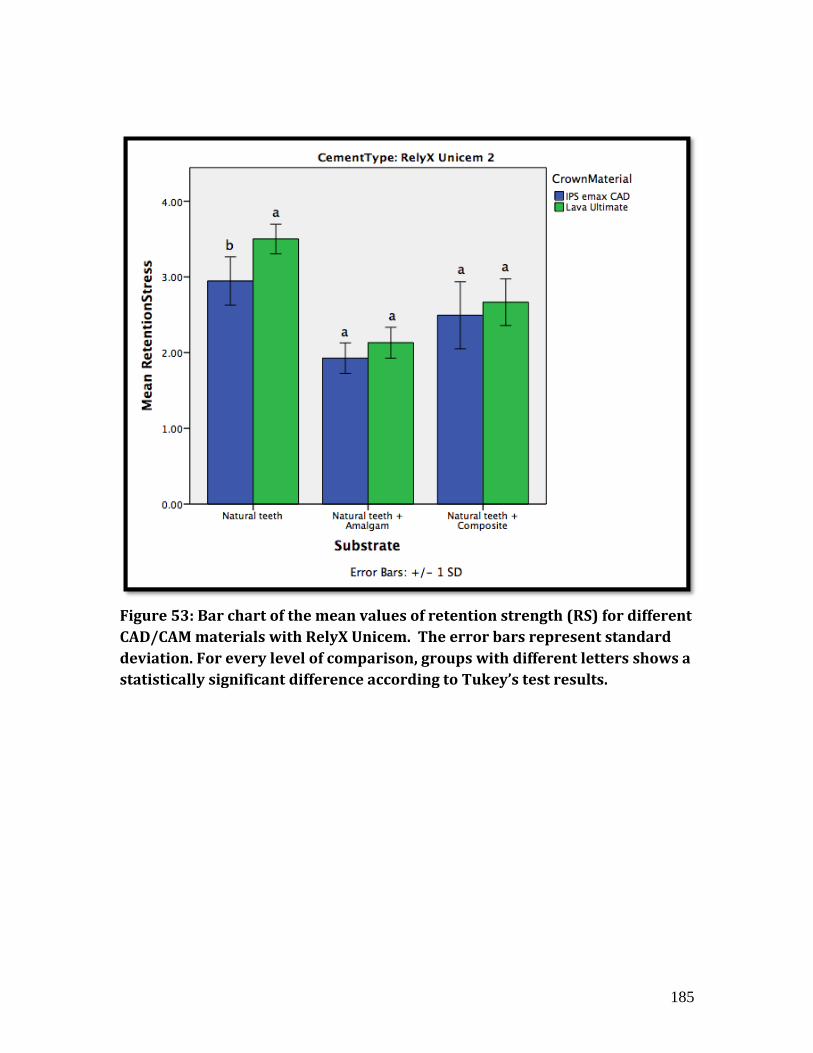
185
Figure 53: Bar chart of the mean values of retention strength (RS) for different
CAD/CAM materials with RelyX Unicem. The error bars represent standard
deviation. For every level of comparison, groups with different letters shows a
statistically significant difference according to Tukey’s test results.

186
4.4 Modes of failure The distribution of the modes of failure of the specimens of the retention strength
test is shown in figure (54), the majority of the failures were adhesive in nature at the
crown/cement interface42.71%, followed by adhesive failure at substrate/cement
interface 36.46%; followed by cohesive failures of substrate 15.63% and finally mixed
failures 5.21%.
Figure 54:Pie chart showing distribution of the modes of failure in the retention
strength (RS) Test.

187
Figure 55: Summary Bar chart of the mean values of Retention strength (RS)
for different types of cements. The error bars represent standard deviation.
For every level of comparison, groups with different letters shows a
statistically significant difference according to Tukey’s test results.

188
Figure 56: Summary Bar chart of the mean values of Retention strength (RS)
for different Substrates. The error bars represent standard deviation. For
every level of comparison, groups with different letters shows a statistically
significant difference according to Tukey’s test results.
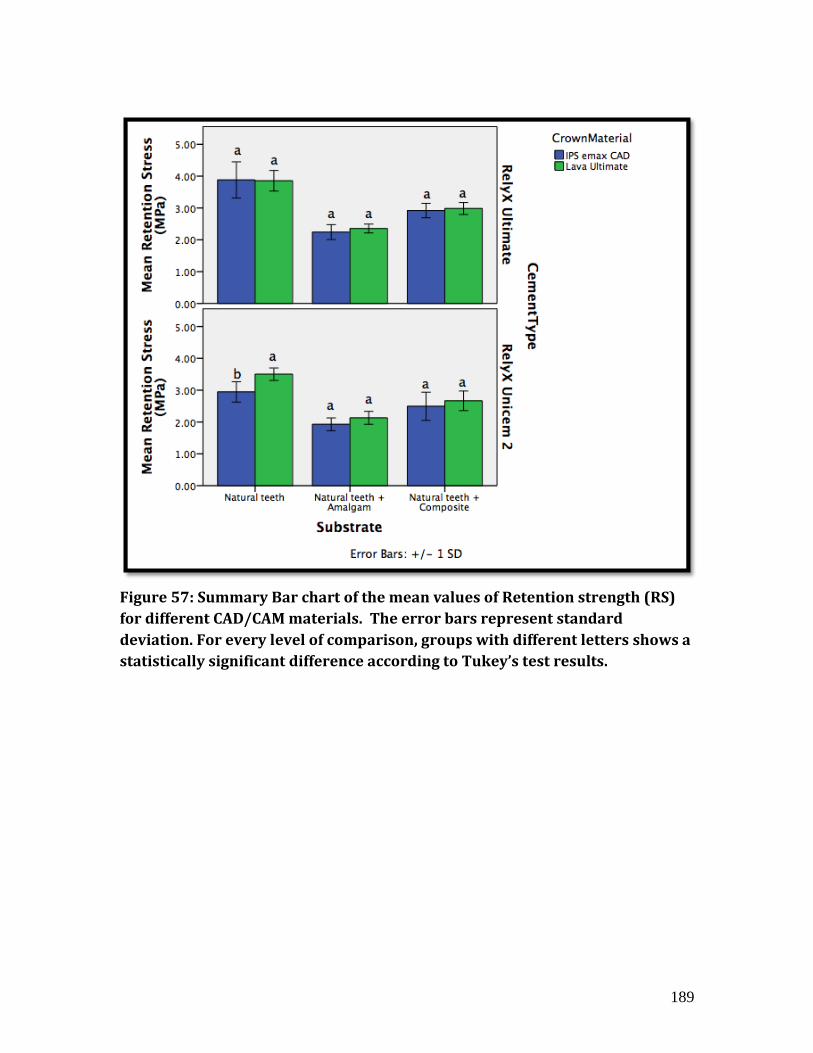
189
Figure 57: Summary Bar chart of the mean values of Retention strength (RS)
for different CAD/CAM materials. The error bars represent standard
deviation. For every level of comparison, groups with different letters shows a
statistically significant difference according to Tukey’s test results.

190
5. Discussion The retention strength test has been employed to evaluate adhesion of dental
crowns to the underlying tooth substrate. It offers several advantages over other adhesion
tests. The retention test considers the complex configuration of the substrate to which the
crown is cemented, not like the bond strength tests that consider the substrate as a one flat
surface. 15
This configuration factor is much higher in crowns cemented to their
underlying teeth, compared to simple composite or ceramic cylinders cemented onto flat
substrate surfaces as in bond strength tests assembly.15
The higher is the value of the
configuration factor, the more the stresses are induced at the bonded interfaces as a result
of polymerization shrinkage. 23
Several studies have shown the significant effect of the
configuration factor on adhesion, which might explain the low values obtained from
retention testing in the range of 1–10 MPa compared to that obtained from microtensile
bond strength testing in the range of 20–40 MPa.24
Chewing simulation was used as a clinically relevant aging methodology, where
crowns were subjected to chewing motion at a rate of 2 Hz, in a water bath of 37 C°, with
load of 80 N and 1 mm vertical and horizontal movement of the blunt indenter, for
500,000 cycles. For an average person, the number of the daily chewing cycles can be in
the range of 800 to 1400; 222
and may reach up to 2700. 223
However not all of these cycles
are active cycles and the number of active cycles would be less, therefore, half a million
cycles is considered to correspond to approximately 10 years of normal function in the
oral cavity. 223
The rate of chewing cycles was set at 2 Hz to simulate the natural
condition. This is in agreement with Bates et al. (1975), who found that the frequency of
normal chewing cycles can range from 1-2 Hz. 224
The load used in the chewing simulator

191
was 80 N, which lies within the range of normal masticatory forces that was estimated to
be in the range of 50 to 250 N, and may reach 500 to 800 N in parafunctional situations
such as clenching and bruxism. 225,226
The stainless steel antagonist cone usedwith30° total
taper and its end machined to a curvature equivalent to 3 mm diameter to reproduce
clinical contact pressure, is in agreement with Kelly et al. (1999) who stated that in order
to have clinically relevant contacts, the steel antagonists should have contact areas
ranging from 0.5 to 3 mm. 227
Comparing different cements, etch-and-rinse adhesive-based resin cement (RelyX
Ultimate) prevailed in all groups with the highest mean retention strength while self-
adhesive resin cement (Rely X Unicem 2) showed the lowest statistically significant
retention strength in all groups. This can be explained by the better demineralization
ability of the etch-and-rinse system with the maximum smear layer removal, exposing a
greater quantity of dentinal tubules, intertubular dentin and collagen fibers to resin
infiltration, yielding the well-documented hybrid layer. 80
The low bonding performance
of self-adhesive resin cements could be explained by the weak tangible infiltration of
these cements into dentin. 110
Monticelli et al (2008) reported no demineralization of
dentin and no hybrid layer formation with self-adhesive resin cements. 137
Furthermore,
interference with the polymerization reaction might occur as a result of incomplete
neutralization of the acidic group, which may in turn result in lower mechanical
properties of the set cement and lower bond strength values. It is well known that acidic
monomers are capable of reacting with the free radical polymerization initiators, resulting
in a decrease in the degree of polymerization of the resin cement. 5,204,205
In addition, these
acidic monomers are hydrophilic and can mediate hydrolytic reactions through increased

192
water sorption that can negatively affect the bond strength. 228
Kumbuloglu et al. (2004),
found that RelyX Unicem had the lowest degree of conversion compared to three other
adhesive-based cements: 56% when light-cured and only 26% when self-cured. 229
Lower
degree of conversion and higher residual monomer could have strong impact in lowering
the mechanical properties of the self-adhesive resin cement in relation to the etch-and-
rinse adhesive-based resin cement. Piwowarczyk et al. (2003) found that RelyX Unicem
had lower flexural and compressive strength compared with three other adhesive-based
resin cements. 230
Results of the present study are in agreement with De Angelis et al
(2004) who found that multi-step adhesive-based resin cements are capable of achieving
higher bond strength compared with RelyX Unicem self-adhesive resin cements when
bonding lithium disilicate glass ceramic disks and composite resin disks to dentin. 199
Furthermore, Frankenberger et al (2008), found that etch-and-rinse adhesive-based resin
cements have better marginal sealability than RelyX Unicem self-adhesive resin cement,
and thus can provide better adhesive luting of glass ceramic esthetic restorations. 231
Comparing different substrates, non-restored natural teeth prevailed in all groups
with the highest statistically significant retention strength, while natural teeth restored
with composite resin ranked second , and natural teeth restored with amalgam
restorations showed the lowest mean retention strength. Non-restored natural teeth are
one-component substrate (dentin) with uniform mechanical properties such as the
modulus of elasticity and the degree of resilience, compared to other substrates when two
components exist, dentin and restoration, where each component had its own mechanical
properties and responded differently to applied stresses. When restorations were aged in
the chewing simulator, every component responded to the applied stress with different

193
degrees of elastic deformation based on different moduli of elasticity, which could lead to
stress concentration and development of cracks within the cement layer, thus weakening
the overall retention strength. Van Noort et al (1989) reported that stress distribution
within the adhesive interface is affected by the modulus of elasticity of the materials
forming the interface. 155
Natural teeth with composite restorations presented higher mean
retention strength compared to natural teeth with amalgam restoration. This could be
explained by the copolymerization between unreacted monomers of the resin cement and
that of the composite substrate, thus increasing the retention strength. Kallio et al (2001)
demonstrated that the unreacted monomer groups in a composite substrate could allow
formation of covalent bonds through copolymerization between the substrate and repair
resin or intermediary resin.209
Comparing different crown materials, there was no statistically significant
difference between lithium disilicate glass ceramic (IPS e.max CAD) and composite resin
(Lava Ultimate) crowns in all groups, except when self-adhesive resin cement (RelyX
Unicem 2)was used to bond crowns to natural teeth, where composite resin (Lava
ultimate) crowns showed the highest mean retention strength. This could be explained by
the weak mechanical properties of the self-adhesive resin cement (RelyX Unicem 2) in
relation to the etch-and-rinse adhesive based resin cement, which resulted in weaker
micromechanical retention to the lithium disilicate ceramic in comparison with the
composite substrate. However, this was not the case for other groups cemented with self-
adhesive resin cement (RelyX Unicem 2) where both the ceramic and the composite resin
crown materials showed similar mean retention strength values. This could be due to the
two component nature of the substrate in these groups, where every component responds

194
to stresses in a different way and could lead to stress concentration with the adhesive
interface and weakening of the overall retention strength, which could result in similar
retention strength for both crown materials. Van Noort et al (1989) mentioned that the
stress distribution within the adhesive interface is dependent on the modulus of elasticity
of the materials forming this adhesive interface. 155
Tam et al (2000) demonstrated that
fracture toughness of the adhesive interface is affected by the elastic moduli of the
materials constituting the interface as well as the degree of interaction whether
mechanical or chemical between these materials.207
The distribution of the modes of failure in this study was mainly adhesive failure
at the crown/cement interface 42.71%, followed by adhesive failure at the
substrate/cement interface 36.46%, followed by cohesive failures of substrate 15.63%
and finally mixed failures 5.21%. This indicates that the retention strength test was
capable of concentrating the stresses at the adhesive interface. Cohesive failures of the
substrate could indicate that the retention strength at the adhesive interface was high
enough to withstand the pulling forces compared to the substrate.175
195
6. Limitations of the study This study has the following limitations:
1. It is an in-vitro study that helps in preliminary assessment of dental biomaterials
bonding properties, but cannot be an alternative to in-vivo studies.
2. Using natural teeth with different sizes and shapes creates a problem in
standardization, however, even distribution of different sizes of the teeth among
the study groups was achieved and the surface area of the prepared teeth was
measured and considered in bond strength calculations.
3. This study did not include control group of specimens that were not subjected to
fatigue cyclic loading and hence the effect of cyclic loading was not tested.
7. Conclusions
Within the limitations of this in-vitro study, the following conclusions can be drawn:
Etch-and-rinse adhesive-based resin cement was capable of achieving the highest
retention strength irrespective of the crown material or the bonding substrate.
Self-adhesive resin cement showed the lowest retention strength irrespective of
the crown material or the bonding substrate.
Non-restored natural teeth were capable of achieving better retention strength
compared to restored teeth irrespective of the crown material or the cement.
Amalgam restorations negatively affect the retention strength to crown materials
irrespective of the cement.
Lithium disilicate glass ceramic crowns and composite resin crowns can achieve
similar retention strength when luted with etch-and-rinse adhesive-based resin
cement irrespective of the bonding substrate.

196
Chapter 6 Microleakage Of CAD-CAM Crowns Using Self-adhesive Resin Cement

197
1. Abstract Objectives: To determine the microleakage of etch-and-rinse adhesive-based resin
cement and self-adhesive resin cement systems, when used to bond lithium disilicate
glass ceramic (IPS e.max CAD) and composite resin (Lava Ultimate) crowns to sound
natural teeth. Methods: Thirty-two freshly extracted molars were prepared to receive
CAD/CAM crowns using a special paralleling device and were divided into four equal
groups. IPS- e.max-CAD (EMX) crowns were made for teeth in two groups while
composite crowns (Lava Ultimate) (LU) were made for the other two groups. Crowns
were milled using CEREC-3D system. Crowns of one EMX group and one LU group
were cemented to their respective teeth using etch-and-rinse adhesive-based resin cement
(RelyX-Ultimate) (RXL). Crowns of other two groups were cemented with self-adhesive
resin cement (Rely-Unicem-2) (RXU). Crowns were then subjected to compressive
cyclic-loading (500,000 cycle, 80N, 1mm vertical, 1mm horizontal, in water at 37◦C,
2Hz) in chewing-simulator. Crown specimens wereimmersed in 2% aqueous solution
of red basic Procion dye for 24 hours.The specimens were sectioned mesio-distally and
the dye penetration was evaluated under stereomicroscope. Data were then statistically
analyzed with Mann Whitney U test. Results: Mann Whitney U test revealed significant
difference among the cement groups (P<0.05). RelyX Unicem showed statistically
significantly higher microleakage scores compared to RelyX Ultimate. There was no
significant difference between IPS e.max CAD and Lava Ultimate regarding
microleakage scores. Conclusions: this in-vitro study showed that etch-and-rinse
adhesive-based resin cement (RelyX Ultimate) resulted in lower microleakage scores

198
compared to self-adhesive resin cement (RelyX Unicem 2). Crown material had no effect
on the microleakage scores.
2. Introduction Microleakage is defined as the movement of fluids carrying bacteria, molecules
and ions at the boundary between a restoration and a tooth. 190
Although it is difficult to
detect clinically, microleakage is considered to be a major factor influencing the
longevity of dental restorations since it may lead to staining at the margins of the
restoration, recurrent caries at the tooth/restoration interface, hypersensitivity of restored
teeth, or development of pulpal pathology. 25,191,193,232
Several methods have been used to evaluate microleakage around dental
restorations whether in-vitro or in-vivo. In-vitro microleakage testing of dental materials
is a commonly accepted evaluation technique of margin integrity. In-vitro studies use
different techniques including the use of tracers such as dyes, radioactive isotopes,
chemical tracers, and bacteria, as well as marginal percolation of water and exposure to
air pressure, neutron activation analysis (NAA), scanning electron microscopy (SEM),
and electrical conductivity.25
Several factors have been described to influence the microleakage of bonded
crown restorations, which include lack of adequate adhesion of the cement to the tooth
structure, shrinkage of the cement on setting, mechanical failure of the cement and type
of the crown material. 191,232
Different types of cement systems vary considerably in
solubility, strength, and ability to adhere to tooth structure. Several studies have found
significant differences among cement systems in their ability to prevent interfacial
leakage between the cement and the tooth structure. 193,232-234
A recent in-vitro study

199
found that composite crowns (Paradigm MZ 100, 3M ESPE) showed higher
microleakage scores compared with feldspathic ceramic crowns (VITABLOCS Mark II,
VIDENT). 235
However, in another study, microleakage scores of both types of crowns
were similar.194
This study was designed to compare the microleakage of an etch-and-rinse and a
self-adhesive resin cement systems when used to bond a lithium disilicate glass ceramic
crowns (IPS e.max CAD, Ivoclar Vivadent Inc.) and composite-resin crowns (Lava
Ultimate, 3M ESPE) to sound dentin.
3. Materials and Methods
3.1 Materials All the material used in the study and their composition (as reported by manufacturers)
are listed in Table 26
3.2 Methods: 3.2.1 Pilot study:
The current study was preceded by an external pilot study to detect any problems with the
proposed methods of testing. Where 2 specimens per group were prepared for the pilot
study. Following the completion of pilot study, 32 specimens were used for the main
study.
3.2.2 Main study
Four groups were formed (n=8)(Figure 58). The number of specimens per group
was calculated using web-based softwarefor sample size analysis at α=0.05 and 80%
Sample size Analysis For Independent Samples Design http://www.stat.ubc.ca/~rollin/stats/ssize/n2.html/

200
power. Based on values obtained from the pilot study, x1=0.5, x2=1.25, σ= 0.34,and
according to Lehmann (1998), sample size for non-parametric tests= sample size for
parametric test ×15%, which yields a sample size of 5 samples per group.We used 8
samples per group for this study to optimize power.
Table 26: Material used in the Microleakage Study and their composition (according to the manufacturer)
Material Classification Brand /
Manufacturer
Composition Lot #
CA
D/C
AM
Mat
eria
ls
Lithium
disilicate
ceramic
IPS e.max
CAD/
Ivoclar
Vivadent,
Liechtenstein
SiO2 (57 – 80 wt.%),
Li2O (11 – 19 wt.%)
K2O (0 – 13 wt.%),
P2O5 (0 – 11 wt.%),
ZrO2 (0 – 8 wt.%),
ZnO (0 – 8 wt.%),
Other and coloring oxides (0-12 wt.%)
P63946
Indirect
composite
resin
Lava™
Ultimate/
3M ESPE, St
Paul, MN,
USA
Composite material contains:
Zirconia-silica nanocluster: Synthesized
via a proprietary process from 20 nm
silica particles and 4 to 11 nm zirconia
particles;
Nanomere particles: 20 nm silica
nanomer particles and 4-11 nm zirconia
nanomere particles
The average nanocluster particle size is
0.6 to 10 micrometers.
Resin matrix composition was not
mentioned by the manufacturer
Total filler loading is 80% wt.
N481731

201
Res
in C
emen
ts
Sel
f-ad
hes
ive
resi
n c
emen
tsyst
em
Sel
f-ad
hes
ive
cem
ent
RelyX™
Unicem 2/
3M ESPE, St
Paul, MN,
USA
Self adhesive resin cement consists of
two pastes:
Base paste: methacrylate monomers
containing phosphoric acid groups,
methacrylate monomers, silanated
fillers, initiator components, stabilizers,
rheological additives.
Catalyst paste: methacrylate monomers,
alkaline (basic) fillers, silanated fillers,
initiator components, stabilizers,
pigments and rheological additives
(Filler=50% vol., 72 wt.%; avg. < 12.5
μm)
515337
Sil
ane
coupli
ng a
gen
t
RelyX
Ceramic
primer /
3M ESPE, St
Paul, MN,
USA
Stable solution of a prehydrolyzed
silane-coupling agent, alcohol and
water.
N470024

202
Res
in C
emen
t
Adhes
ive-
bas
ed r
esin
cem
ents
yst
em
Aci
d e
tch
Scotchbond
™Phosphori
c Etchant /
3M ESPE, St
Paul, MN,
USA
The etchant is 35% phosphoric acid by
weight. It has a pH of approximately 0.6
509513
Bondin
g a
gen
t
Scotchbond
™ Universal
Adhesive/
3M ESPE, St
Paul, MN,
USA
One-bottle adhesive containing MDP
Phosphate Monomer, Dimethacrylate
resins, HEMA ,
VitrebondTM Copolymer, Filler,
ethanol, water, initiators and silane
514135 A
dhes
ive-
bas
ed r
esin
cem
ent
RelyX™
Ultimate/
3M ESPE, St
Paul, MN,
USA
Consists of two pastes:
Base paste: methacrylate monomers,
radiopaque silanated fillers, initiator
components, stabilizers, and rheological
additives.
Catalyst paste: methacrylate monomers,
radiopaque alkaline (basic) fillers,
initiator components, stabilizers,
pigments, rheological additives,
Fluorescence dye and Dark cure activator for Scotchbond
Universal
(Filler=43 vol.%; avg. = 13 μm)
514665
Sil
ane
coupli
ng a
gen
t
RelyX
Ceramic
primer /
3M ESPE, St
Paul, MN,
USA
Stable solution of a prehydrolyzed
silane-coupling agent, alcohol and
water.
N470024

203
Material Classification Brand /
Manufacturer
Composition Lot #
Mec
han
ical
Surf
ace
trea
tmen
t m
ater
ial
Grit-etching
Aluminum
Oxide-50
Micron/
Danville
Engineering
Inc.,
California
50 microns aluminum oxide powder.
25671
Acid etching
IPS Ceramic
Etching Gel
/Ivoclar
Vivadent,
Liechtenstein
The etchant is <5% hydrofluoric acid. It
has a pH of approximately 2
P72319

204
Figure 58: Study groups, the total number of specimens are 32 specimens
(8 per group x 4 group)
3.2.2.1 Specimen collection and storage
Intact caries-free human molars were collected and cleaned with
periodontal scalers and curettes, then sterilized with gamma radiation (Gamma cell 220,
Atomic Energy Ltd, Mississauga, Canada) at the Department of Chemical Engineering
and Applied Chemistry, University of Toronto. Teeth were placed in a cobalt chamber
5.5x8 inches, and exposed for 4 hours. The radiation dose rate was 0.3 KGy/h. This
method of sterilization has been proved to not alter the mechanical or the physical
Indirect composite resin
(Lava™ Ultimate)The Same
Lithium disilicate glass ceramic
(IPS e.max CAD)
Self-adhesive resin cement
(RelyX Unicem 2)The same
Etch-and-rinse adhesive-based resin cement
(RelyX Ultimate)
Natural Teeth
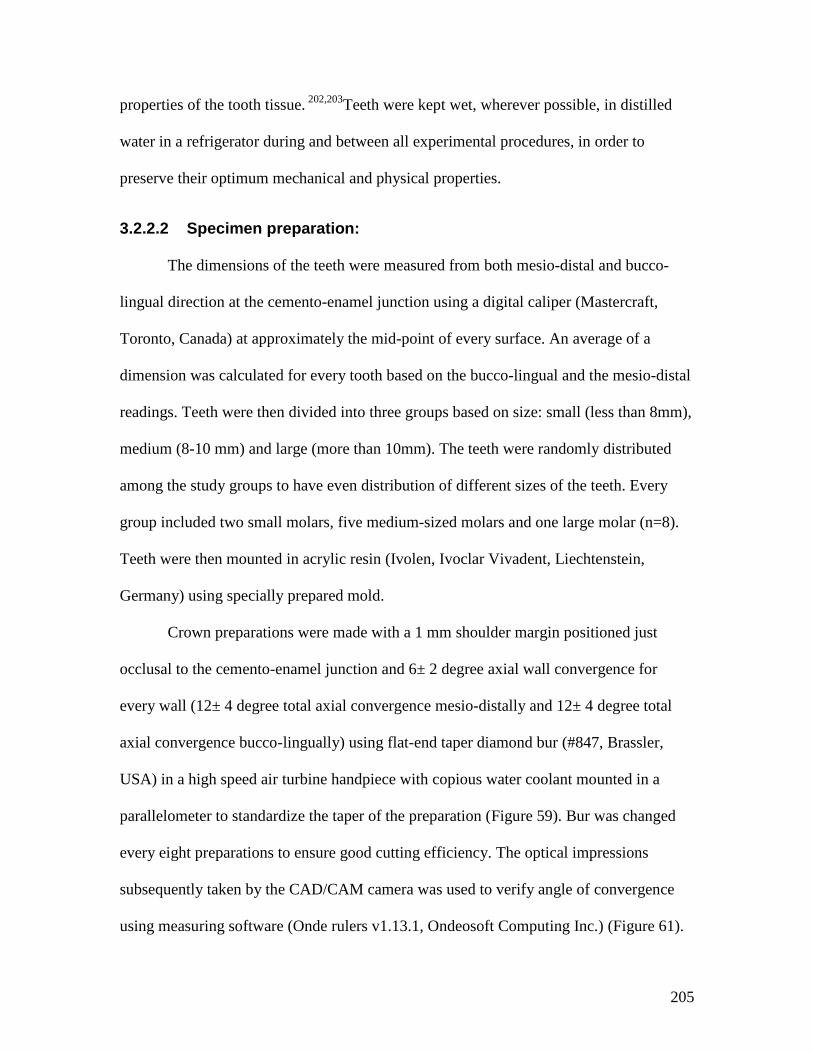
205
properties of the tooth tissue. 202,203
Teeth were kept wet, wherever possible, in distilled
water in a refrigerator during and between all experimental procedures, in order to
preserve their optimum mechanical and physical properties.
3.2.2.2 Specimen preparation: The dimensions of the teeth were measured from both mesio-distal and bucco-
lingual direction at the cemento-enamel junction using a digital caliper (Mastercraft,
Toronto, Canada) at approximately the mid-point of every surface. An average of a
dimension was calculated for every tooth based on the bucco-lingual and the mesio-distal
readings. Teeth were then divided into three groups based on size: small (less than 8mm),
medium (8-10 mm) and large (more than 10mm). The teeth were randomly distributed
among the study groups to have even distribution of different sizes of the teeth. Every
group included two small molars, five medium-sized molars and one large molar (n=8).
Teeth were then mounted in acrylic resin (Ivolen, Ivoclar Vivadent, Liechtenstein,
Germany) using specially prepared mold.
Crown preparations were made with a 1 mm shoulder margin positioned just
occlusal to the cemento-enamel junction and 6± 2 degree axial wall convergence for
every wall (12± 4 degree total axial convergence mesio-distally and 12± 4 degree total
axial convergence bucco-lingually) using flat-end taper diamond bur (#847, Brassler,
USA) in a high speed air turbine handpiece with copious water coolant mounted in a
parallelometer to standardize the taper of the preparation (Figure 59). Bur was changed
every eight preparations to ensure good cutting efficiency. The optical impressions
subsequently taken by the CAD/CAM camera was used to verify angle of convergence
using measuring software (Onde rulers v1.13.1, Ondeosoft Computing Inc.) (Figure 61).

206
Occlusal surface was finished to create a non-anatomical occlusal tableand maintain a
vertical height of 4±0.25 mm using wheel diamond bur (#2909, Komet, USA) mounted in
a high-speed air turbine handpiece with profuse water coolant.
Figure 59: Left: parallelometer adjusted for 6° axial wall convergence, Right: Tooth embedded in acrylic resin ready for crown preparation.
3.2.2.3 Impressions and restoration design
Optical reflective medium (IPS contrast spray, Ivoclar Vivadent, Liechtenstein)
was used to cover the prepared teeth with a thin layer. An optical impression of the
prepared tooth was captured using the CEREC 3D intraoral camera. CEREC software
was used to design crowns (Figure 60). Each crown was made with anatomical features
of lower second molar readily available in computer program. Minimum occlusal
thickness (at central fossa) was 1.5 mm. Thickness of crown at various points was
verified with Boley gauge (miltex, Germany) following milling.

207
Figure 60: Cerec 3D software was used to design crowns
Figure 61: Angle verification on the optical impression.
3.2.2.4 Crown fabrication Sixteen crowns were fabricated from each crown material: IPS. e.max CAD and
the Lava Ultimate blocks, using the CEREC 3D milling unit (Figure 62). Cutting
diamonds were changed after milling eight crowns. IPS. E.max CAD crowns were

208
crystallized in a ceramic furnace (EP 600 Combi, Ivoclar Vivadent, Liechtenstein)
(Figure 65) according to the manufacturer instructions.
Figure 62: Cerec 3D milling unit.
Figure 63: Inside the milling chamber, burs ready to mill IPS e.max CAD.

209
Figure 64: Milled IPS e.max CAD crown.
Figure 65: IPS e.max Cad crowns in the EB600 Combi furnace.

210
3.2.2.5 Crowns surface treatment
The intaglio surfaces of the IPS. e.max CAD crowns were etched with 5%
hydrofluoric acid etching gel (IPS ceramic etching gel, Ivoclar Vivadent, Liechtenstein)
for 20 seconds then washed using water spray for 60 seconds, air-dried then silanated
(RelyX ceramic primer, 3M ESPE). The intaglio surfaces of Lava Ultimate crowns were
grit-etched with 50 µm aluminum oxide powder under 2 bar pressure at the nozzle, then
cleaned with compressed air-water spray for 30 seconds and further cleaned in distilled
water in an ultrasonic cleaner for 5 minutes, air-dried then silanated.
3.2.2.6 Cementation All crowns were divided into two main groups: one group was cemented with
etch-and-rinse adhesive cement (Rely X Ultimate, 3M ESPE) and the other group was
cemented with self-adhesive resin cement (Rely X Unicem 2, 3M ESPE). The cements
were mixed and applied to the intaglio surfaces of the crowns according to the
manufacturer‘s instructions (Table 20). The crowns were initially seated on their
respective teeth using finger pressure, and then the crowns were placed under a static
load of 22 N for 5 minutes (Figure 66). The excess cement was briefly light-cured to gel
point then removed. After load removal, each crown was light cured for 20 seconds on
each surface.

211
Figure 66: Crowns were placed under static load of 22N for 5 minutes.
3.2.2.7 Cyclic loading Specimens with their acrylic base were then transferred to the plastic chamber of
a chewing simulator (chewing simulator CS-4, SD Mechatronik Co., Germany)(Figure
67) and secured in their place using putty rubber base impression material (Provil novo
putty, Heraeus Kulzer, Germany) and custom made acrylic ring (Ivolen, Ivoclar
Vivadent, Liechtenstein, Germany). Crowns were then subjected to compressive cyclic
loading for 500,000 cycles at speed 2 Hz in a water bath of 37 C°. The chewing

212
simulator stainless steel antagonist cone, with 30° total taper and its end machined to a
curvature equivalent to 3 mm diameter, was adjusted to contact the central fossa of the
crowns and preload the crowns with 80 N force by 0.2 mm vertical displacement. It was
adjusted to move in two directions: vertical movement of 1 mm and horizontal movement
1mm, to induce both vertical and horizontal forces during the simulated chewing cycles.
Figure 67: Crowns being aged in the chewing simulator.
3.2.2.8 Microleakage testing The root surfaces and acrylic base of every specimen were sealed with nail polish
except for 1 mm around the crown margins (Figure 68). Crowns were subjected to
microleakage testing by immersion in 2% aqueous solution of red Procion dye
(Pararosanilin, Imperial Chemical Industries)(Figure 69) for 24 hours at 37°C. Then the
specimens were rinsed thoroughly in water for five minutes and then sectioned
mesiodistally using a low-speed saw with a diamond blade (Isomet 1000, Buehler Ltd.,

213
Lake Bluff, IL)(Figure 70). Images of tooth sections were examined under
stereomicroscope at 10x magnification, and a five-point scale was used to score
microleakage at both mesial and distal aspects of each section as follows:
0 = no leakage.
1 = microleakage up to one third of axial wall.
2 = microleakage up to two-thirds of axial wall.
3 = microleakage along full length of axial wall.
4 = microleakage extending onto occlusal surface.
The section with the deepest dye penetration was selected as a representative of every
specimen.
3.2.2.9 Data analysis
The microleakage data are qualitative (ordinal) data. Data were statistically
analyzed with non-parametric Mann-Whitney U-test (P<0.05) at 95% confidence interval
level and with analysis of ranks to detect the significant differences between different
types of cement and also between crown materials.

214
Figure 68:Root surfaces and acrylic base sealed with nail polish.
Figure 69: Procion Dye.
Figure 70: low-speed saw with a diamond blade (Isomet 1000, Buehler Ltd.,
Lake Bluff, IL) used for sectioning specimens mesiodistally.

215
4. Results
4.1 Comparison between resin cements Mann-Whitney U test was conducted to explore the impact of the type of cement
on the microleakage scores within the levels of the other independent variable
(CAD/CAM material). CAD/CAM material was divided into two groups: Group 1: IPS
e.max CAD; Group 2: Lava Ultimate. Types of cement was divided into two groups:
Group 1: Rely X Ultimate; Group 2: RelyX Unicem. The mean ranks are presented in
Table 27 and the results of the Mann-Whitney U test are presented in Table 28.
Table 27: Independent Samples Test (Dependent variable: Retention strength;
Independent variable: type of cement) CAD/CAM material Dependant
Variable Cement Mean Rank Sum of Ranks
IPS Emax CAD Microleakage RelyX Ultimate 12.91 206.5
RelyX Unicem 20.09 321.5
Lava Ultimate Microleakage RelyX Ultimate 12.06 193
RelyX Unicem 20.94 335
Table 28: Results of the Mann-Whitney U test
CAD/CAM Blocks Microleakage
IPS Emax CAD Mann-Whitney U 70.500
Wilcoxon W 206.500
Z -2.396
Asymp. Sig. (2-tailed) .017
Exact Sig. [2*(1-tailed Sig.)] .029b
Lava Ultimate Mann-Whitney U 57.000
Wilcoxon W 193.000
Z -3.141
Asymp. Sig. (2-tailed) .002
Exact Sig. [2*(1-tailed Sig.)] .007b
a. Grouping Variable: Cement
b. Not corrected for ties.

216
4.1.1 Lithium disilicate glass ceramic (IPS e.max CAD)
Forlithium disilicate glass ceramic crowns (IPS e.max CAD), Mann-Whitney U
test revealed that self-adhesive resin cement (RelyX Unicem 2) showed higher
microleakage scores compared to etch-and-rinse adhesive-based resin cements (RelyX
Ultimate) (U=70.5, z=-2.396, p=0.029).The Mean Ranks are presented in Table 27. The
groups modes are presented in Figure 71 and the distribution of microleakage scores are
shown in Figure72.
Figure 71: Modes of microleakage scores for cements used to bond IPS e.max
CAD crowns
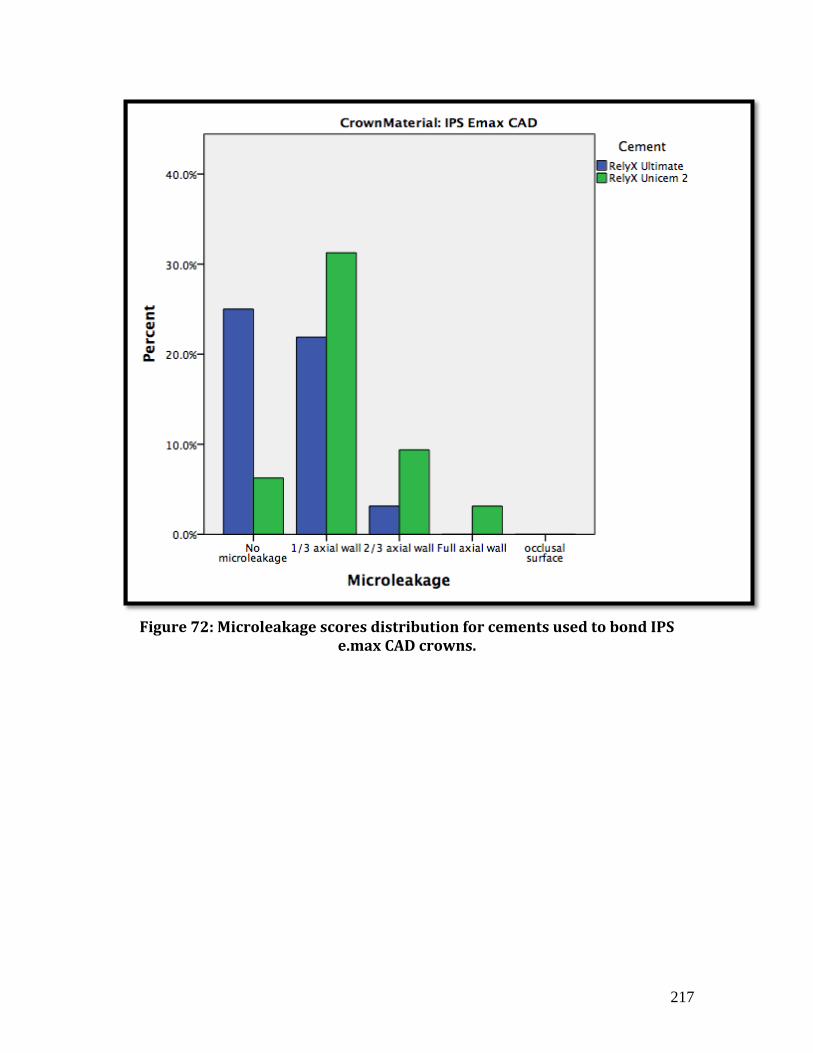
217
Figure 72: Microleakage scores distribution for cements used to bond IPS
e.max CAD crowns.

218
4.1.2 Composite resin (Lava Ultimate)
For Lava Ultimate crowns, Mann-Whitney U test revealed that self-adhesive resin
cement (RelyX Unicem 2) showed higher microleakage scores compared to etch-and-
rinse adhesive-based resin cement (RelyX Ultimate) (U=57, z=-3.141, p=0.007).The
Mean Ranks are presented in Table 27. The groups modes are presented in Figure 73 and
the distribution of microleakage scores are shown in Figure 74.
Figure 73: Groups Modes of microleakage scores for cements used to bond
Lava Ultimate crowns.

219
Figure 74: Microleakage scores distribution for cements used to bond Lava
Ultimate crowns.

220
4.2 Comparison between CAD/CAM materials Mann-Whitney U test was conducted to explore the impact of the type of the
CAD/CAM material on the microleakage scores within the levels of the other
independent variable (Type of cements). CAD/CAM material was divided into two
groups (Group 1: IPS e.max CAD; Group 2: Lava Ultimate). Type of cement was divided
into two groups (Group 1: Rely X Ultimate; Group 2: RelyX Unicem). The mean ranks
are presented in Table 29 and the results of the Mann-Whitney U test are presented in
Table 30.
Table 29: Independent Samples Test (Dependent variable: Retention strength;
Independent variable: type of cement) Type of cement Dependant
Variable CAD/CAM material
Mean Rank Sum of Ranks
RelyX Ultimate Microleakage IPS e.max CAD 17.22 275.5
Lava Ultimate 15.78 252.5
RelyX Unicem 2 Microleakage IPS e.max CAD 17.06 273
Lava Ultimate 15.94 255
Table 30: Results of the Mann-Whitney U test
Type of cement Microleakage
RelyX Ultimate Mann-Whitney U 116.5
Wilcoxon W 252.5
Z -0.495
Asymp. Sig. (2-tailed) 0.621
Exact Sig. [2*(1-tailed Sig.)] .669b
RelyX Unicem 2 Mann-Whitney U 119
Wilcoxon W 255
Z -0.429
Asymp. Sig. (2-tailed) 0.668
Exact Sig. [2*(1-tailed Sig.)] .752b
a. Grouping Variable: Cement
b. Not corrected for ties.

221
4.2.1 Etch-and-rinse resin cement (RelyX Ultimate)
For etch-and-rinse adhesive-based resin cement (RelyX Ultimate) , Mann-
Whitney U test revealed no significant difference between lithium disilicate glass ceramic
crowns (IPS e.max CAD) and composite resin crowns (Lava Ultimate) (U=116.5, z=-
0.495, p=0.669).The Mean Ranks are presented in Table 29. The groups modes are
presented in Figure 75 and the distribution of microleakage scores are shown in Figure
76.
Figure 75: Groups Modes of microleakage scores for CAD/CAM materials that was bonded with RelyX Ultimate cement

222
Figure 76: Microleakage scores distribution for CAD/CAM materials that was bonded with RelyX Ultimate cement

223
4.2.2 Self-adhesive resin cement (RelyX Unicem 2)
For self-adhesive resin cement (RelyX Unicem 2), Mann-Whitney U test revealed
no significant difference between lithium disilicate glass ceramic crowns (IPS
e.max CAD) and composite resin crowns (Lava Ultimate) (U=119, z=-0.429,
p=0.752).The Mean Ranks are presented in Table 29. The group modes are
presented in Figure 77 and the distribution of microleakage scores are shown in
Figure 78.
Figure 77: Groups Modes of microleakage scores for CAD/CAM materials that
were bonded with RelyX Unicem 2 cement.

224
Figure 78: Microleakage scores distribution for CAD/CAM materials that were
bonded with RelyX Unicem 2cement

225
Figure 79: Microleakage in IPS e.max CAD & RelyX ultimate showing scores of
zero on mesial and distal sides.
Figure 80: Microleakage in IPS e.max CAD & RelyX Unicem 2 showing scores of
one on mesial and distal sides.

226
Figure 81: Microleakage in Lava Ultimate& RelyX ultimate showing scores of
zero on mesial and one on distal side.
Figure 82: Microleakage in Lava Ultimate& RelyX Unicem showing scores of
one on mesial and two on distal side.

227
5. Discussion Microleakage testing investigates the sealability of adhesive interfaces. Clinically,
if the adhesive interface or the adhesion process is compromised, this results in
microleakage, which in turn could result in further adhesive failure.193
In this study, crowns were subjected to chewing forces at a rate of 2 Hz, in a
water bath of 37 C°, with load of 80 N and 1 mm vertical and horizontal movement of the
blunt indenter, for 500,000 cycles which is considered to correspond to 10 years of
normal function in the oral cavity. 223
Bates et al. (1975) reported that the normal chewing
cycles frequency can range from 1-2 Hz. 224
The applied load80 N lies within the range of
the normal masticatory forces which was estimated to be in the range of 50 to 250 N, and
may reach 500 to 800 N in parafunctional conditions such as clenching and bruxism.
225,226Clinical contact pressure was reproduced by the stainless steel load applicator with
30° total taper and its end machined to a curvature equivalent to 3 mm diameter. Kelly et
al. (1999) reported that contact areas ranging from 0.5 to 3 mm are considered clinically
relevant contacts.227
In the current study our aim was to investigate the effect of an etch-and-rinse
adhesive-based resin cement (RelyX Ultimate) and self-adhesive resin cement (RelyX
Unicem 2) on the sealability of the adhesive interface when used to bond lithium
disilicate glass ceramic crowns (IPS e.max CAD) and composite resin crowns (Lava
Ultimate) to tooth structure. Also, this study aimed to investigate the effect of the crown
material on this sealability.
When comparing different types of cements, self-adhesive resin cement (RelyX
Unicem 2) presented the highest microleakage score irrespective of the crown material,

228
while the etch-and-rinse adhesive-based resin cement (RelyX Ultimate) showed the
lowest microleakage scores irrespective of the crown material. This could be partly
explained by the strong etching and resin infiltration of the etch-and-rinse adhesive based
resin cement with subsequent hybrid layer formation, 150,218,236,237
which can result in
stronger micromechanical bonding to tooth structure and low microleakage scores. 199
On
the other hand, the weaker adhesion of the self-adhesive resin as a consequence of their
weak demineralization of tooth structure and tangible resin infiltration with no hybrid
layer formation could be the reason of high microleakage scores. 110,137
Furthermore, the chemical composition of the cement plays an important role,
where etch-and-rinse adhesive-based resin cement is more hydrolytically stable as
opposed to the self-adhesive resin cement that incorporates acidic monomers in its
chemical formulation to be capable of etching the tooth structure. 106,206
These acidic
monomers are hydrophilic and results in increased water sorption which in turn mediate
hydrolytic reactions at the adhesive interface therebycompromising adhesion to tooth
structure. 228
Also, self-adhesive resin cement is characterized by low degree of
conversion as opposed to etch-and-rinse adhesive based resin cement, a condition that is
associated with increased microleakage as a consequence to leaching out of the residual
monomer and ingress of the oral fluids through the created microgaps. 229
Results of the
present study are in agreement with Kassem et al (2011) who found that self-adhesive
resin cement (RelyX Unicem) showed the highest microleakage scores when compared to
the adhesive-based resin cement Panavia F, when both cements were used to cement
feldspathic ceramic crowns.238

229
When comparing different crown materials, there was no significant difference in
microleakage scores between IPS e.max CAD ceramic crowns and Lava Ultimate
composite resin crowns. This shows that the main factor in sealing the adhesive interface
is the cement rather than the crown material. Our results are in agreement with Kassem et
al (2011) who found that there was no significant difference in microleakage scores
between ceramic and composite crowns.194
6. Limitations of the study This study has the following limitations:
1. This is an in-vitro study that helps in primary examination of dental biomaterials
bonding properties, but cannot be an alternative to in-vivo studies.
2. Implementing natural teeth in a study creates standardization problem due to
different sizes and shapes of these teeth. However, even distribution of different
sizes of the teeth among the study groups was achieved which help improving
standardization.
3. There was no control group of specimens that were not subjected to fatigue cyclic
loading in this study and hence the effect of cyclic loading can‘t be demonstrated
in this study.
7. Conclusions: Within the limitations of this in-vitro study, the following conclusions can be drawn:
Etch-and-rinse adhesive-based resin cement was capable of achieving better
sealability irrespective of the crown material bonded to dentin.

230
Self-adhesive resin cement showed the highest microleakage scores irrespective
of the crown material bonded to dentin.
Crown material had no effect on the microleakage scores.

231
Chapter 7 Summary and conclusions

232
This study investigated adhesion and microleakage of adhesive-based and self-
adhesive resin cements when used to cement lithium disilicate glass ceramic and
composite resin CAD/CAM crown materials to different substrates. Several testing
approaches were utilized as follows:
1. Microtensile bond strength testing (chapter 3): the results of this part favored
adhesive-based resin cements over self-adhesive resin cements, composite resin
crown material (Paradigm MZ100) over lithium disilicate glass ceramic crown
material (IPS e.max CAD) and composite resin substrate over dentin substrate.
Also, based on the findings, hydrofluoric acid etching surface treatment resulted
in superior bonding of the lithium disilicate glass ceramic to the substrate
compared to grit-etching.
2. Microshear bond strength testing (chapter 4): the results of this part favored
adhesive-based resin cements over self-adhesive resin cements and composite
substrate over dentin substrate. However, composite resin crown material
(Paradigm MZ100) and lithium disilicate glass ceramic crown material (IPS
e.max CAD)behaved similarly regarding the bond strength when IPS e.max CAD
was treated with hydrofluoric acid etching.
3. Retention strength testing (chapter 5): the results of this part favored adhesive-
based resin cement over self-adhesive resin cement and non-restored natural teeth
substrate over amalgam and composite resin restored natural teeth. Amalgam
restorations were found to result in decreased retention strength. No difference in
retention strength was detected for composite resin crown material (Lava

233
Ultimate) and lithium disilicate glass ceramic crown material (IPS e.max CAD)
when luted with etch-and-rinse adhesive-based resin cements.
4. Microleakage testing (chapter 6): the results of this part favored etch-and-rinse
adhesive-based resin cement over the self-adhesive resin cement. However,
composite resin crown material (Lava Ultimate) and lithium disilicate glass
ceramic crown material (IPS e.max CAD) had no effect on the microleakage
scores.

234
References
1. Hannig M, Rahlf B, Schlichting B. Marginal behavior of "kulzer" composite inlays
under simultaneous mechanical and thermal loading. Dtsch Zahnarztl Z.
1991;46(9):618-620.
2. Mörmann WH, Brandestini M, Lutz F. The cerec system: Computer-assisted
preparation of direct ceramic inlays in 1 setting. Quintessenz. 1987;38(3):457-470.
3. Mörmann WH. CEREC vitablocs mark II machinable ceramic. In: Mörmann WH, ed.
CAD/CIM in aesthetic dentistry. First ed. Chicago: Quintessence; 1996:205-216.
4. Peumans M, Hikita K, De Munck J, et al. Effects of ceramic surface treatments on
the bond strength of an adhesive luting agent to CAD-CAM ceramic. J Dent.
2007;35(4):282-288.
5. Mazzitelli C, Monticelli F, Osorio R, Casucci A, Toledano M, Ferrari M. Effect of
simulated pulpal pressure on self-adhesive cements bonding to dentin. Dent Mater.
2008;24(9):1156-1163.
6. Terry DA, Blatz MB. Surface treatments for tooth-colored restorations: Part i. Dent
Today. 2010;29(8):108-110.
7. Terry DA, Blatz MB. Surface treatments for tooth-colored restorations: Part 2.
Dent Today. 2011;30(3):126, 128, 130-131.

235
8. Crown and bridge cementation.
http://multimedia.3m.com/mws/mediawebserver?mwsId=SSSSSu7zK1fslxtUMxtv
o8_xev7qe17zHvTSevTSeSSSSSS&fn=rel_arc_tg_01.pdf.
9. Hummel SK, Marker V, Pace L, Goldfogle M. Surface treatment of indirect resin
composite surfaces before cementation. J Prosthet Dent. 1997;77(6):568-572.
10. Swift Jr. EJ, Brodeur C, Cvitko E, Pires JAF. Treatment of composite surfaces for
indirect bonding. Dent Mater. 1992;8(3):193-196.
11. Soares C, Giannini M, de Oliveira M, Paulillo LAMS, Martins LRM. Effect of surface
treatments of laboratory-fabricated composites on the microtensile bond strength
to a luting resin cement. J. Appl. Oral Sci. 2004;12(1):45-50.
12. Spitznagel FA, Horvath SD, Guess PC, Blatz MB. Resin bond to indirect composite
and new ceramic/polymer materials: A review of the literature. J Esthet Restor Dent.
2014.
13. El Zohairy AA, De Gee AJ, Mohsen MM, Feilzer AJ. Effect of conditioning time of
self-etching primers on dentin bond strength of three adhesive resin cements. Dent
Mater. 2005;21(2):83-93.
14. Mak Y-, Lai SCN, Cheung GSP, Chan AWK, Tay FR, Pashley DH. Micro-tensile bond
testing of resin cements to dentin and an indirect resin composite. Dent Mater.
2002;18(8):609-621.

236
15. Heintze SD. Crown pull-off test (crown retention test) to evaluate the bonding
effectiveness of luting agents. Dent Mater. 2010;26(3):193-206.
16. Pashley DH, Carvalho RM, Sano H, Nakajima M, Yoshiyamae M, Shono Y. The
microtensile bond test: A review. J Adhes Dent. 1999;1(4):299-309.
17. Bona AD, Anusavice KJ, Shen C. Microtensile strength of composite bonded to
hot-pressed ceramics. J Adhes Dent. 2000;2(4):305-313.
18. Della Bona A, Anusavice KJ, Mecholsky JJ,Jr. Failure analysis of resin composite
bonded to ceramic. Dent Mater. 2003;19(8):693-699.
19. Phrukkanon S, Burrow MF, Tyas MJ. The influence of cross-sectional shape and
surface area on the microtensile bond test. Dent Mater. 1998;14(3):212-221.
20. Van Meerbeek B, Peumans M, Poitevin A, et al. Relationship between bond-
strength tests and clinical outcomes. Dent Mater. 2010;26(2):e100-e121.
21. El Zohairy AA, Saber MH, Abdalla AI, Feilzer AJ. Efficacy of microtensile versus
microshear bond testing for evaluation of bond strength of dental adhesive systems
to enamel. Dent Mater. 2010;26(9):848-854.
22. Beloica M, Goracci C, Carvalho CA, et al. Microtensile vs microshear bond
strength of all-in-one adhesives to unground enamel. J Adhes Dent. 2010;12(6):427-
433.

237
23. Feilzer AJ, De Gee AJ, Davidson CL. Setting stress in composite resin in relation to
configuration of the restoration. J Dent Res. 1987;66(11):1636-1639.
24. Nikolaenko SA, Lohbauer U, Roggendorf M, Petschelt A, Dasch W, Frankenberger
R. Influence of c-factor and layering technique on microtensile bond strength to
dentin. Dent Mater. 2004;20(6):579-585.
25. Schmid-Schwap M, Graf A, Preinerstorfer A, Watts DC, Piehslinger E, Schedle A.
Microleakage after thermocycling of cemented crowns - A meta-analysis. Dent
Mater.2011;27(9):855-869.
26. Trajtenberg CP, Caram SJ, Kiat-Amnuay S. Microleakage of all-ceramic crowns
using self-etching resin luting agents. Oper Dent. 2008;33(4):392-399.
27. Miyazaki T, Hotta Y. CAD/CAM systems available for the fabrication of crown
and bridge restorations. Aust Dent J. 2011;56(SUPPL. 1):97-106.
28. Duret F, Preston JD. CAD/CAM imaging in dentistry. Curr Opin Dent.
1991;1(2):150-154.
29. Mörmann WH. The evolution of the CEREC system. J Am Dent Assoc. 2006;137(9
SUPPL.):7S-13S.
30. Mörmann WH, Brandestini M, Lutz F, Barbakow F. Chairside computer-aided
direct ceramic inlays. Quintessence Int. 1989;20(5):329-339.

238
31. Schaefer O, Decker M, Wittstock F, Kuepper H, Guentsch A. Impact of digital
impression techniques on the adaption of ceramic partial crowns in vitro. J Dent.
2014;42(6):677-683.
32. Sirona Dental Systems. Cerec bluecam: Proven and effecient.
http://www.sirona.com/en/news-events/campaigns-and-promotions/cerec-
packages/classic/cerec-ac-with-cerec-bluecam-classic/. Updated 2014. Accessed
july/18, 2014.
33. Sirona Dental Systems. The new CEREC omnicam. scanning simplicity.
http://www.sirona.com/en/news-events/campaigns-and-promotions/the-new-
cerec-omnicam/. Updated 2014. Accessed july/18, 2014.
34. Galhano GAP, Pellizzer EP, Mazaro JVQ. Optical impression systems for CAD-CAM
restorations. J Craniofac Surg. 2012;23(6):e572-e579. Accessed 18 July 2014.
35. Poticny DJ, Klim J. CAD/CAM in-office technology: Innovations after 25 years for
predictable, esthetic outcomes. J Am Dent Assoc. 2010;141 Suppl 2:5S-9S. Accessed 3
August 2011.
36. Sirona Dental Systems. Sirona connect. digital impressions for practices and
laboratories. http://www.sirona.com/en/products/digital-dentistry/sirona-
connect/. Updated 2014. Accessed july/18, 2014.
37. Henry Schein Inc. E4D LabworksTM. http://www.henryschein.com/us-
en/zahn/DigitalDentistry/D4D.aspx. Updated 2014. Accessed July,18, 2014.
239
38. E4D Technologies. D4D technologies.
http://www.e4d.com/announcements/d4d-technologies-launches-new-adaptive-
learning-technology-for-dental-teaching-institutions. Updated 2012. Accessed
july/18, 2014.
39. Andersson M, Odén A. A new all-ceramic crown. A dense-sintered, high-purity
alumina coping with porcelain. Acta Odontol Scand. 1993;51(1):59-64.
40. Andersson M, Carlsson L, Persson M, Bergman B. Accuracy of machine milling
and spark erosion with a CAD/CAM system. J Prosthet Dent. 1996;76(2):187-193.
41. Odén A, Andersson M, Krystek-Ondracek I, Magnusson D. Five-year clinical
evaluation of procera AllCeram crowns. J Prosthet Dent. 1998;80(4):450-456.
42. Miyazaki T, Hotta Y, Kunii J, Kuriyama S, Tamaki Y. A review of dental CAD/CAM:
Current status and future perspectives from 20 years of experience. Dent Mater J.
2009;28(1):44-56.
43. Fasbinder DJ. Computerized technology for restorative dentistry. Am J Dent.
2013;26(3):115-120.
44. Trost L, Stines S, Burt L. Making informed decisions about incorporating a
CAD/CAM system into dental practice. J Am Dent Assoc. 2006;137(9 SUPPL.):32S-
36S.
45. Christensen GJ. Computerized restorative dentistry: State of the art. J Am Dent
Assoc. 2001;132(9):1301-1303.

240
46. Giordano R. Materials for chairside CAD/CAM-produced restorations. J Am Dent
Assoc. 2006;137(9 SUPPL.):14S-21S.
47. Andreiotelli M, Kamposiora P, Papavasiliou G. Digital data management for
CAD/CAM technology. an update of current systems. Eur J Prosthodont Restor Dent.
2013;21(1):9-15.
48. Poticny DJ, Klim J. CAD/CAM in-office technology: Innovations after 25 years for
predictable, esthetic outcomes. J Am Dent Assoc. 2010;141 Suppl 2:5S-9S.
49. ivoclarvivadent. IPS e.max CAD.
http://www.ivoclarvivadent.com/en/all/products/all-ceramics/ips-emax-
technicians/ips-emax-cad. Accessed 8/4/2011, 2011.
50. 3M ESPE. Lava ultimate CAD/CAM restorative.
http://multimedia.3m.com/mws/media/781394O/lava-ultimate-technical-
product-profile-global.pdf?fn=Lava_Ult_TPP.pdf. Accessed July/10, 2014.
51. 3M ESPE. Technical product profile: Paradigm C.
http://multimedia.3m.com/mws/mediawebserver?mwsId=SSSSSu7zK1fslxtUNx2x
n8_Zev7qe17zHvTSevTSeSSSSSS--&fn=paradigm_c_tp.pdf. Accessed 8/4/2011,
2011.
52. Neumann P. CAD/CAM--ceramics an overview for the cerec practitioner. Int J
Comput Dent. 1999;2(1):45-57.

241
53. Al-Hiyasat AS, Saunders WP, Sharkey SW, Smith GM, Gilmour WH. Investigation
of human enamel wear against four dental ceramics and gold. J Dent. 1998;26(5-
6):487-495.
54. Seghi RR, Sorensen JA. Relative flexural strength of six new ceramic materials.
Int J Prosthodont. 1995;8(3):239-246.
55. Poticny DJ, Klim J. CAD/CAM in-office technology: Innovations after 25 years for
predictable, esthetic outcomes. J Am Dent Assoc. 2010;141 Suppl 2:5S-9S.
56. Sirona. CEREC - the dentists choice for all ceramic restorations - CEREC - CEREC
products - CEREC blocs.
http://www.sirona.com/ecomaXL/index.php?site=CEREC_UK_cerec_blocs. Accessed
8/4/2011, 2011.
57. Dentsply. CELTRA duo: CAD blocks for CEREC and INLAB .
http://www.dentsply.com/content/dam/dentsply/pim/manufacturer/Prosthetics/
CAD___CAM/Materials/ZLS___High_Strength_Glass/Celtra_DUO/Celtra-DUO-ngfn6of-
en-1402. Accessed July/14, 2014.
58. Vident. VITA ENAMEIC: Technical and scientific documentation.
http://vident.com/wp-content/uploads/2013/07/Enamic-Technical-L-10025E.pdf-
8_13.pdf. Accessed July/14, 2014.

242
59. Mormann W, Wolf D, Ender A, Bindl A, Gohring T, Attin T. Effect of two self-
adhesive cements on marginal adaptation and strength of esthetic ceramic
CAD/CAM molar crowns. J Prosthodont. 2009;18(5):403-410.
60. Xuan Y-. Ceramic materials and bonding technology in oral cosmetics. J Clin
Rehab Tissue Eng Res. 2011;15(34):6420-6423.
61. Manso AP, Silva NRFA, Bonfante EA, Pegoraro TA, Dias RA, Carvalho RM.
Cements and adhesives for all-ceramic restorations. Dent Clin North Am.
2011;55(2):311-332.
62. Pegoraro TA, da Silva NR, Carvalho RM. Cements for use in esthetic dentistry.
Dent Clin North Am. 2007;51(2):453-71.
63. Hitz T, Stawarczyk B, Fischer J, Hämmerle CH, Sailer I. Are self-adhesive resin
cements a valid alternative to conventional resin cements? A laboratory study of the
long-term bond strength. Dent Mater: official publication of the Academy of Dental
Materials. 2012;28(11):1183-1190. Accessed 4 August 2014.
64. Sumita B. Mitra, Roberto R. Braga. Materials for adhesion and luting. In: Ronald
L. Sakaguchi, John M. Powers. Craig’s Restorative Dental Materials. Thirteenth
Edition. Mosby, Inc., an affiliate of Elsevier Inc.; 2012:342.
65. Stamatacos C, Simon JF. Cementation of indirect restorations: An overview of
resin cements. Compend Contin Educ Dent Suppl. (Jamesburg, N.J.: 1995).
2013;34(1):42-"44, 46".

243
66. Van Meerbeek B, De Munck J, Yoshida Y, et al. Adhesion to enamel and dentin:
Current status and future challenges. Oper Dent. 2003;28(3):215-235.
67. De Munck J, Van Landuyt K, Peumans M, et al. A critical review of the durability
of adhesion to tooth tissue: Methods and results. J Dent Res. 2005;84(2):118-132.
68. Pashley DH, Tay FR, Yiu C, et al. Collagen degradation by host-derived enzymes
during aging. J Dent Res. 2004;83(3):216-221.
69. Hebling J, Pashley DH, Tjäderhane L, Tay FR. Chlorhexidine arrests subclinical
degradation of dentin hybrid layers in vivo. J Dent Res. 2005;84(8):741-746.
70. De Munck J, Van Den Steen PE, Mine A, et al. Inhibition of enzymatic degradation
of adhesive-dentin interfaces. J Dent Res. 2009;88(12):1101-1106.
71. Xu J, Stangel I, Butler IS, Gilson DFR. An FT-raman spectroscopic investigation of
dentin and collagen surfaces modified by 2-hydroxyethylmethacrylate. J Dent Res.
1997;76(1):596-601.
72. Nishiyama N, Suzuki K, Komatsu K, Yasuda S, Nemoto K. A 13C NMR study on the
adsorption characteristics of HEMA to dentinal collagen. J Dent Res. 2002;81(7):469-
471.
73. Tay FR, Gwinnett AJ, Pang KM, Wei SHY. Resin permeation into acid-conditioned,
moist, and dry dentin: A paradigm using water-free adhesive primers. J Dent Res.
1996;75(4):1034-1044.

244
74. Van Meerbeek B, Conn L.J. J, Duke ES, Eick JD, Robinson SJ, Guerrero D.
Correlative transmission electron microscopy examination of nondemineralized and
demineralized resin-dentin interfaces formed by two dentin adhesive systems. J
Dent Res. 1996;75(3):879-888.
75. Van Meerbeek B, Yoshida Y, Lambrechts P, et al. A TEM study of two water-based
adhesive systems bonded to dry and wet dentin. J Dent Res. 1998;77(1):50-59.
76. Tay FR, Pashley DH, Suh BI, Carvalho RM, Itthagarun A. Single-step adhesives are
permeable membranes. J Dent. 2002;30(7-8):371-382.
77. De Munck J, Van Landuyt K, Peumans M, et al. A critical review of the durability
of adhesion to tooth tissue: Methods and results. J Dent Res. 2005;84(2):118-132.
78. Van Meerbeek B, De Munck J, Yoshida Y, et al. Adhesion to enamel and dentin.
current state and future tasks - part 2. Asthetische Zahnmedizin. 2004;7(2):95-109.
79. Tay FR, Pashley DH. Aggressiveness of contemporary self-etching systems. I:
Depth of penetration beyond dentin smear layers. Dent Mater. 2001;17(4):296-308.
80. Van Meerbeek B, De Munck J, Yoshida Y, et al. Adhesion to enamel and dentin:
Current status and future challenges. Oper Dent. 2003;28(3):215-235.
81. Pashley DH, Tay FR. Aggressiveness of contemporary self-etching adhesives part
II: Etching effects on unground enamel. Dent Mater. 2001;17(5):430-444.

245
82. Van Meerbeek B, Peumans M, Poitevin A, et al. Relationship between bond-
strength tests and clinical outcomes. Dent Mater. 2010;26(2):e100-e121.
83. Van Landuyt KL, Snauwaert J, Peumans M, De Munck J, Lambrechts P, Van
Meerbeek B. The role of HEMA in one-step self-etch adhesives. Dent Mater.
2008;24(10):1412-1419.
84. De Munck J, Van Meerbeek B, Satoshi I, et al. Microtensile bond strengths of one-
and two-step self-etch adhesives to bur-cut enamel and dentin. Am J Dent.
2003;16(6):414-420.
85. Tay FR, Pashley DH. Water treeing - A potential mechanism for degradation of
dentin adhesives. Am J Dent. 2003;16(1):6-12.
86. Sano H, Yoshikawa T, Pereira RNR, et al. Long-term durability of dentin bonds
made with a self-etching primer, in vivo. J Dent Res. 1999;78(4):906-911.
87. Inoue S, Vargas MA, Abe Y, et al. Microtensile bond strength of eleven
contemporary adhesives to dentin. J Adhes Dent. 2001;3(3):237-245.
88. Yoshida Y, Nagakane K, Fukuda R, et al. Comparative study on adhesive
performance of functional monomers. J Dent Res. 2004;83(6):454-458.
89. Inoue S, Koshiro K, Yoshida Y, et al. Hydrolytic stability of self-etch adhesives
bonded to dentin. J Dent Res. 2005;84(12):1160-1164.

246
90. Coutinho E, Van Landuyt K, De Munck J, et al. Development of a self-etch
adhesive for resin-modified glass lonomers. J Dent Res. 2006;85(4):349-353.
91. Tay F, Pashley D. Have dentin adhesives become too hydrophilic? J Can Dent
Assoc. 2003;69(11):726-731.
92. Van Landuyt K, Mine A, De Munck J, et al. Are one-step adhesives easier to use
and better performing? multifactorial assessment of contemporary one-step self-
etching adhesives. J Adhes Dent. 2009;11(3):175-190.
93. Hill EE. Dental cements for definitive luting: A review and practical clinical
considerations. Dent Clin North Am. 2007;51(3):643-658.
94. Burgess JO, Ghuman T, Cakir D. Self-adhesive resin cements. J Esthet Restor Dent.
2010;22(6):412-419.
95. Braga RR, Cesar PF, Gonzaga CC. Mechanical properties of resin cements with
different activation modes. J Oral Rehabil. 2002;29(3):257-262.
96. Kenneth J. Anusavice, H. Ralph Rawls, Chiayi Shen. Resin-based composites. In:
Phillips' science of dental material. 12th ed. ; 2013:286-287.
97. Breeding LC, Dixon DL, Caughman WF. The curing potential of light-activated
composite resin luting agents. J Prosthet Dent. 1991;65(4):512-518.
98. Burrow M. Understanding adhesive dentistry. Ann R Australas Coll Dent Surg.
2010;20:75-79.
247
99. Myers ML, Caughman WF, Rueggeberg FA. Effect of restoration composition,
shade, and thickness on the cure of a photoactivated resin cement. J Prosthodont.
1994;3(3):149-157.
100. Caughman WF, Chan DC, Rueggeberg FA. Curing potential of dual-
polymerizable resin cements in simulated clinical situations. J Prosthet Dent.
2001;85(5):479-484.
101. Kenneth J. Anusavice, H. Ralph Rawls, Chiayi Shen. Dental cements. In:
Phillips' Science Of Dental Materials. 12th ed. Saunders, an imprint of Elsevier Inc.;
2013:307.
102. Paul SJ, Scharer P. The dual bonding technique: A modified method to improve
adhesive luting procedures. Int J Periodontics Restorative Dent. 1997;17(6):536-545.
103. Makkar S, Malhotra N. Self-adhesive resin cements: A new perspective in luting
technology. Dent Update. 2013;40(9):758-768.
104. Weiser F, Behr M. Self-adhesive resin cements: A clinical review. J Prosthodont.
2014.
105. Radovic I, Monticelli F, Goracci C, Vulicevic ZR, Ferrari M. Self-adhesive resin
cements: A literature review. J Adhes Dent. 2008;10(4):251-258.
106. Ferracane JL, Stansbury JW, Burke FJT. Self-adhesive resin cements - chemistry,
properties and clinical considerations. J Oral Rehabil. 2011;38(4):295-314.

248
107. Swift EJ,Jr. Self-adhesive resin cements-part I. J Esthet Restor Dent.
2012;24(3):221-225.
108. Abo-Hamar SE, Hiller K-, Jung H, Federlin M, Friedl K-, Schmalz GS. Bond
strength of a new universal self-adhesive resin luting cement to dentin and enamel.
Clin Oral Investig. 2005;9(3):161-167.
109. Al-Assaf K, Chakmakchi M, Palaghias G, Karanika-Kouma A, Eliades G.
Interfacial characteristics of adhesive luting resins and composites with dentine.
Dent Mater. 2007;23(7):829-839.
110. De Munck J, Vargas M, Van Landuyt K, Hikita K, Lambrechts P, Van Meerbeek B.
Bonding of an auto-adhesive luting material to enamel and dentin. Dent Mater.
2004;20(10):963-971.
111. Goracci C, Cury AH, Cantoro A, Papacchini F, Tay FR, Ferrari M. Microtensile
bond strength and interfacial properties of self-etching and self-adhesive resin
cements used to lute composite onlays under different seating forces. J Adhes Dent.
2006;8(5):327-335.
112. Hikita K, Van Meerbeek B, De Munck J, et al. Bonding effectiveness of adhesive
luting agents to enamel and dentin. Dent Mater. 2007;23(1):71-80.
113. Piwowarczyk A, Bender R, Ottl P, Lauer H-. Long-term bond between dual-
polymerizing cementing agents and human hard dental tissue. Dent Mater.
2007;23(2):211-217.

249
114. Trkmen C, Durkan M, Cimilli H, Oksz M. Tensile bond strength of indirect
composites luted with three new self-adhesive resin cements to dentin. J. Appl. Oral
Sci. 2011.
115. Peutzfeldt A, Sahafi A, Flury S. Bonding of restorative materials to dentin with
various luting agents. Oper Dent. 2011.
116. Burke FJ, Fleming GJ, Abbas G, Richter B. Effectiveness of a self-adhesive resin
luting system on fracture resistance of teeth restored with dentin-bonded crowns.
Eur J Prosthodont Restor Dent. 2006;14(4):185-188.
117. El Badrawy W, Hafez R, El Naga AIA, Ahmed D. Nanoleakage for self-adhesive
resin cements used in bonding CAD/CAD ceramic material to dentin. Eur J Dent.
2011;5(3):281-290.
118. Schenke F, Hiller KA, Schmalz G, Federlin M. Marginal integrity of partial
ceramic crowns within dentin with different luting techniques and materials. Oper
Dent. 2008;33(5):516-525.
119. Ghazy M, El-Mowafy O, Roperto R. Microleakage of porcelain and composite
machined crowns cemented with self-adhesive or conventional resin cement. J
Prosthodont. 2010;19(7):523-530.
120. Awliya W, Odén A, Yaman P, Dennison JB, Razzoog ME. Shear bond strength of a
resin cement to densely sintered high-purity alumina with various surface
conditions. Acta Odontol Scand. 1998;56(1):9-13.

250
121. Krämer N, Lohbauer U, Frankenberger R. Adhesive luting of indirect
restorations. Am J Dent. 2000;13(5 SPEC. ISS.):60D-76D.
122. Borges GA, Sophr AM, De Goes MF, Sobrinho LC, Chan DCN. Effect of etching
and airborne particle abrasion on the microstructure of different dental ceramics. J
Prosthet Dent. 2003;89(5):479-488.
123. Soares C, Giannini M, de Oliveira M, Paulillo LAMS, Martins LRM. Effect of
surface treatments of laboratory-fabricated composites on the microtensile bond
strength to a luting resin cement. J. Appl. Oral Sci. 2004;12(1):45-50.
124. Mak Y, Lai SCN, Cheung GSP, Chan AWK, Tay F, Pashley D. Micro-tensile bond
testing of resin cements to dentin and an indirect resin composite. Dent mater.
2002;18(8):609-621.
125. Hahn P, Attin T, Grfke M, Hellwig E. Influence of resin cement viscosity on
microleakage of ceramic inlays. Dent mater. 2001;17(3):191-196.
126. Peumans M, Van Meerbeek B, Lambrechts P, Vanherle G. Porcelain veneers: A
review of the literature. J Dent. 2000;28(3):163-177.
127. Touati B, Quintas AF. Aesthetic and adhesive cementation for contemporary
porcelain crowns. Practical procedures aesthetic dentistry. 2001;13(8):611-20.
128. Kiyan V, Saraceni CHC, da Silveira B, Aranha ACC, Eduardo CdP. The influence of
internal surface treatments on tensile bond strength for two ceramic systems. Oper
Dent. 2007;32(5):457-465.

251
129. Shahverdi S, Canay S, Sahin E, Bilge A. Effects of different surface treatment
methods on the bond strength of composite resin to porcelain. J Oral Rehabil.
1998;25(9):699-705.
130. Kato H, Matsumura H, Atsuta M. Effect of etching and sandblasting on bond
strength to sintered porcelain of unfilled resin. J Oral Rehabil. 2000;27(2):103-110.
131. Chen JH, Matsumura H, Atsuta M. Effect of different etching periods on the bond
strength of a composite resin to a machinable porcelain. J Dent. 1998;26(1):53-58.
132. Janda R, Roulet J-, Wulf M, Tiller H-. A new adhesive technology for all-ceramics.
Dent Mater. 2003;19(6):567-573.
133. Bona AD, Shen C, Anusavice KJ. Work of adhesion of resin on treated lithia
disilicate-based ceramic. Dent Mater. 2004;20(4):338-344.
134. Bona AD, Anusavice KJ, Mecholsky Jr. JJ. Failure analysis of resin composite
bonded to ceramic. Dent Mater. 2003;19(8):693-699.
135. Seghi RR, Sorensen JA. Relative flexural strength of six new ceramic materials.
Int J Prosthodont. 1995;8(3):239-246.
136. Soares CJ, Soares PV, Pereira JC, Fonseca RB. Surface treatment protocols in the
cementation process of ceramic and laboratory-processed composite restorations: A
literature review. J Esthet Restor Dent. 2005;17(4):224-235.

252
137. Monticelli F, Osorio R, Mazzitelli C, Ferrari M, Toledano M. Limited
decalcification/diffusion of self-adhesive cements into dentin. J Dent Res.
2008;87(10):974-979.
138. Kern M, Thompson VP. Sandblasting and silica coating of a glass-infiltrated
alumina ceramic: Volume loss, morphology, and changes in the surface composition.
J Prosthet Dent. 1994;71(5):453-461.
139. Thurmond JW, Barkmeier WW, Wilwerding TM. Effect of porcelain surface
treatments on bond strengths of composite resin bonded to porcelain. J Prosthet
Dent. 1994;72(4):355-359.
140. Calamia JR. Etched porcelain veneers: The current state of the art. Quintessence
Int. 1985;16(1):5-12.
141. Lucena-Martin C, Gonzalez-Lopez S, Navajas-Rodriguez De Mondelo JM. The
effect of various surface treatments and bonding agents on the repaired strength of
heat-treated composites. J Prosthet Dent. 2001;86(5):481-488.
142. Behr M, Rosentritt M, Sikora MI, Karl P, Handel G. Marginal adaptation and
fracture resistance of adhesively luted glass fibre-composite reinforced molar
crowns with different inner crown surfaces. J Dent. 2003;31(7):503-508.
143. Foxton RM, Nakajima M, Hiraishi N, et al. Relationship between ceramic primer
and ceramic surface pH on the bonding of dual-cure resin cement to ceramic. Dent
Mater. 2003;19(8):779-789.

253
144. Bailey JH. Porcelain-to-composite bond strengths using four organosilane
materials. J Prosthet Dent. 1989;61(2):174-177.
145. Kenneth J. Anusavice, Ralph W. Phillips. <br />. In: Kenneth J. Anusavice, Ralph
W. Phillips, ed. Phillip’s science of dental materials. 10th ed. Philadelphia: Saunders;
1996:583-618.
146. Barghi N. To silanate or not to silanate: Making a clinical decision. Compend
Contin Educ Dent. 2000;21(8):659-62, 664.
147. Soderholm K-M, Shang S-. Molecular orientation of siliane at the surface of
colloidal silica. J Dent Res. 1993;72(6):1050-1054.
148. Berry T, Barghi N, Chung K. Effect of water storage on the silanization in
porcelain repair strength. J Oral Rehabil. 1999;26(6):459-463.
149. Chen J-, Matsumura H, Atsuta M. Effect of etchant, etching period, and silane
priming on bond strength to porcelain of composite resin. Oper Dent.
1998;23(5):250-257.
150. Ozcan M, Mese A. Adhesion of conventional and simplified resin-based luting
cements to superficial and deep dentin. Clin Oral Investig. 2012;16(4):1081-1088.
151. Salz U, Bock T. Testing adhesion of direct restoratives to dental hard tissue - a
review. J Adhes Dent. 2010;12(5):343-371.

254
152. Sano H, Shono T, Sonoda H, et al. Relationship between surface area for
adhesion and tensile bond strength - evaluation of a micro-tensile bond test. Dent
Mater. 1994;10(4):236-240.
153. Ferrari M, Goracci C, Sadek F, Eduardo P, Cardoso C. Microtensile bond strength
tests: Scanning electron microscopy evaluation of sample integrity before testing.
Eur J Oral Sci. 2002;110(5):385-391.
154. Van Noort R, Cardew GE, Howard IC, Noroozi S. The effect of local interfacial
geometry on the measurement of the tensile bond strength to dentin. J Dent Res.
1991;70(5):889-893.
155. Van Noort R, Noroozi S, Howard IC, Cardew G. A critique of bond strength
measurements. J Dent. 1989;17(2):61-67.
156. Neves AdA, Coutinho E, Cardoso MV, et al. Influence of notch geometry and
interface on stress concentration and distribution in micro-tensile bond strength
specimens. J Dent. 2008;36(10):808-815.
157. Neves AdA, Coutinho E, Poitevin A, Van der Sloten J, Van Meerbeek B, Van
Oosterwyck H. Influence of joint component mechanical properties and adhesive
layer thickness on stress distribution in micro-tensile bond strength specimens.
Dent Mater. 2009;25(1):4-12.

255
158. Sadek FT, Monticelli F, Muench A, Ferrari M, Cardoso PEC. A novel method to
obtain microtensile specimens minimizing cut flaws. J. Biomed. Mater. Res., Part B.
Applied Biomaterials. 2006;78(1):7-14. Accessed 4 September 2011.
159. Jones CT, Chan DCN, Pashley D, De Goes MF, Nelson SK. Microtensile bond
strength testing and failure analysis of hybrid and flowable composites. J Adhes
Dent. 2006;8(1):13-20.
160. Sadek FT, Muench A, Poiate IA, Junior EP, Cardoso PEC. Influence of specimens'
design and manufacturing process on microtensile bond strength to enamel -
laboratory and FEA comparison. Mater. Res. 2010;13(2):253-260.
161. Poitevin A, De Munck J, Van Landuyt K, et al. Influence of three specimen
fixation modes on the micro-tensile bond strength of adhesives to dentin. Dent
Mater J. 2007;26(5):694-699.
162. Poitevin A, De Munck J, Van Landuyt K, et al. Critical analysis of the influence of
different parameters on the microtensile bond strength of adhesives to dentin. J
Adhes Dent. 2008;10(1):7-16.
163. de la Macorra JC. Statistics: A nuisance, a tool, or a must? J Adhes Dent.
2007;9(5):424-424.
164. Eckert GJ, Platt JA. A statistical evaluation of microtensile bond strength
methodology for dental adhesives. Dent Mater. 2007;23(3):385-391.

256
165. Sarr M, Mine A, de Munck J, et al. Immediate bonding effectiveness of
contemporary composite cements to dentin. Clin Oral Investig. 2010;14(5):569-577.
166. Mine A, De Munck J, Cardoso MV, et al. Bonding effectiveness of two
contemporary self-etch adhesives to enamel and dentin. J Dent. 2009;37(11):872-
883.
167. Shimada Y, Senawongse P, Harnirattisai C, Burrow MF, Nakaoki Y, Tagami J.
Bond strength of two adhesive systems to primary and permanent enamel. Oper
Dent. 2002;27(4):403-409.
168. Shimada Y, Yamaguchi S, Tagami J. Micro-shear bond strength of dual-cured
resin cement to glass ceramics. Dent Mater. 2002;18(5):380-388.
169. McDonough WG, Antonucci JM, He J, et al. A microshear test to measure bond
strengths of dentin-polymer interfaces. Biomaterials. 2002;23(17):3603-3608.
170. Foong J, Lee K, Nguyen C, et al. Comparison of microshear bond strengths of
four self-etching bonding systems to enamel using two test methods. Aust Dent J.
2006;51(3):252-257.
171. Shimada Y, Kikushima D, Tagami J. Micro-shear bond strength of resin-bonding
systems to cervical enamel. Am J Dent. 2002;15(6):373-377.
172. Armstrong S, Geraldeli S, Maia R, Raposo LHA, Soares C, Yamagawa J. Adhesion
to tooth structure: A critical review of "micro" bond strength test methods. Dent
mater. 2010;26(2):e50-e62.

257
173. ISO. Dental materials – testing of adhesion to toothstructure. technical
specification no. 11405. 2003.
174. Yildirim S, Tosun G, Koyutrk A, et al. Microtensile and microshear bond
strength of an antibacterial self-etching system to primary tooth dentin. Eur J Dent.
2008;2(1):11-17.
175. el-Mowafy OM, Fenton AH, Forrester N, Milenkovic M. Retention of metal
ceramic crowns cemented with resin cements: Effects of preparation taper and
height. J Prosthet Dent. 1996;76(5):524-529.
176. Johnson GH, Lepe X, Zhang H, Wataha JC. Retention of metal-ceramic crowns
with contemporary dental cements. J Am Dent Assoc. 2009;140(9):1125-1136.
177. Ayad MF, Rosenstiel SF, Salama M. Influence of tooth surface roughness and
type of cement on retention of complete cast crowns. J Prosthet Dent.
1997;77(2):116-121.
178. Gorodovsky S, Zidan O. Retentive strength, disintegration, and marginal quality
of luting cements. J Prosthet Dent. 1992;68(2):269-274.
179. Sharma S, Patel JR, Sethuraman R, Singh S, Wazir ND, Singh H. A comparative
evaluation of the effect of resin based sealers on retention of crown cemented with
three types of cement - an in vitro study. J Clin Diagn Res. 2014;8(3):251-255.

258
180. Palacios RP, Johnson GH, Phillips KM, Raigrodski AJ. Retention of zirconium
oxide ceramic crowns with three types of cement. J Prosthet Dent. 2006;96(2):104-
114.
181. Simon JF, de Rijk WG, Hill J, Hill N. Tensile bond strength of ceramic crowns to
dentin using resin cements. Int J Comput Dent. 2011;14(4):309-319.
182. Ernst CP, Cohnen U, Stender E, Willershausen B. In vitro retentive strength of
zirconium oxide ceramic crowns using different luting agents. J Prosthet Dent.
2005;93(6):551-558.
183. Simon JF, De Rijk WG, Hill J, Hill N. Tensile bond strength of ceramic crowns to
dentin using resin cements. Int J Comput Dent. 2011;14(4):309-319.
184. Carnaggio TV, Conrad R, Engelmeier RL, et al. Retention of CAD/CAM all-
ceramic crowns on prefabricated implant abutments: An in vitro comparative study
of luting agents and abutment surface area. J Prosthodont. 2012;21(7):523-528.
185. Ayad MF, Rosenstiel SF, Woelfel JB. The effect of recementation on crown
retention. Int J Prosthodont. 1998;11(2):177-182.
186. Ernst CP, Wenzl N, Stender E, Willershausen B. Retentive strengths of cast gold
crowns using glass ionomer, compomer, or resin cement. J Prosthet Dent.
1998;79(4):472-476.
187. Johnson GH, Lepe X, Bales DJ. Crown retention with use of a 5% glutaraldehyde
sealer on prepared dentin. J Prosthet Dent. 1998;79(6):671-676.

259
188. Kidd EA. Microleakage: A review. J Dent. 1976;4(5):199-206.
189. Taylor MJ, Lynch E. Microleakage. J Dent. 1992;20(1):3-10.
190. Kidd EA. Microleakage in relation to amalgam and composite restorations. A
laboratory study. Br Dent J. 1976;141(10):305-310.
191. Patel S, Saunders WP, Burke FJT. Microleakage of dentin-bonded crowns placed
with different luting materials. Am J Dent. 1997;10(4):179-183.
192. Al-Saleh M, El-Mowafy O, Tam L, Fenton A. Microleakage of posterior composite
restorations lined with self-adhesive resin cements. Oper Dent. 2010;35(5):556-563.
193. Trajtenberg CP, Caram SJ, Kiat-Amnuay S. Microleakage of all-ceramic crowns
using self-etching resin luting agents. Oper Dent. 2008;33(4):392-399.
194. Kassem AS, Atta O, El-Mowafy O. Combined effects of thermocycling and load-
cycling on microleakage of computer-aided design/computer-assisted manufacture
molar crowns. Int J Prosthodont. 2011;24(4):376-378.
195. Samimi P, Barekatain M, Alaei S. Comparison of microleakage of composite
restorations using fifth and sixth generation dentin bonding agent: An in vivo study.
J Contemp Dent Pract. 2012;13(5):632-636.
196. Arora A, Acharya SR, Vidya SM, Sharma P. A comparative evaluation of dentinal
hypersensitivity and microleakage associated with composite restorations in

260
cavities preconditioned with air abrasion - an ex vivo study. Contemp Clin Dent.
2012;3(3):306-313.
197. Fernando Carlos Hueb de Menezes, Gilberto Antônio Borges, Thiago Assunção
Valentino, Maria Angélica Hueb de Menezes Oliveira, Cecília Pedroso Turssi,
Lourenço Correr-Sobrinho. Effect of surface treatment and storage on the bond
strength of different ceramic systems. Brazilian Journal of Oral Sciences.
2009;8(3):119-123.
198. El Zohairy AA, De Gee AJ, Mohsen MM, Feilzer AJ. Microtensile bond strength
testing of luting cements to prefabricated CAD/CAM ceramic and composite blocks.
Dent Mater. 2003;19(7):575-583.
199. De Angelis F, Minnoni A, Vitalone LM, et al. Bond strength evaluation of three
self-adhesive luting systems used for cementing composite and porcelain. Oper Dent.
2011;36(6):626-634.
200. Versluis A, Douglas WH, Sakaguchi RL. Thermal expansion coefficient of dental
composites measured with strain gauges. Dent Mater. 1996;12(5):290-294.
201. Hashimoto M, Ohno H, Kaga M, Endo K, Sano H, Oguchi H. In vivo degradation of
resin-dentin bonds in humans over 1 to 3 years. J Dent Res. 2000;79(6):1385-1391.
202. White JM, Goodis HE, Marshall SJ, Marshall GW. Sterilization of teeth by gamma
radiation. J Dent Res. 1994;73(9):1560-1567.

261
203. Brauer DS, Saeki K, Hilton JF, Marshall GW, Marshall SJ. Effect of sterilization by
gamma radiation on nano-mechanical properties of teeth. Dent Mater.
2008;24(8):1137-1140.
204. Salz U, Zimmermann J, Salzer T. Self-curing, self-etching adhesive cement
systems. J Adhes Dent. 2005;7(1):7-17.
205. Suh BI, Feng L, Pashley DH, Tay FR. Factors contributing to the incompatibility
between simplified-step adhesives and chemically-cured or dual-cured composites.
part III. effect of acidic resin monomers. J Adhes Dent. 2003;5(4):267-282.
206. Van Landuyt KL, Snauwaert J, De Munck J, et al. Systematic review of the
chemical composition of contemporary dental adhesives. Biomaterials.
2007;28(26):3757-3785.
207. Tam LE, Pilliar RM. The effect of interface stiffness on dentin-composite
interfacial fracture resistance. J Dent. 2000;28(7):487-493.
208. Aguiar TR, de Oliveira M, Arrais CA, Ambrosano GM, Rueggeberg F, Giannini M.
The effect of photopolymerization on the degree of conversion, polymerization
kinetic, biaxial flexure strength, and modulus of self-adhesive resin cements. J
Prosthet Dent. 2014.
209. Kallio TT, Lastumaki TM, Vallittu PK. Bonding of restorative and veneering
composite resin to some polymeric composites. Dent Mater. 2001;17(1):80-86.

262
210. Madani DA. Fracture resistance of non-metallic molar crowns manufactured with
CEREC 3D. 2010.
211. Rusin RP. Properties and applications of a new composite block for CAD/CAM.
Compend Contin Educ Dent. 2001;22(6 Suppl):35-41.
212. Brunzel S, Yang B, Wolfart S, Kern M. Tensile bond strength of a so-called self-
adhesive luting resin cement to dentin. J Adhes Dent. 2010;12(2):143-150.
213. Gale MS, Darvell BW. Thermal cycling procedures for laboratory testing of
dental restorations. J Dent. 1999;27(2):89-99.
214. De Munck J, Van Landuyt K, Coutinho E, et al. Micro-tensile bond strength of
adhesives bonded to class-I cavity-bottom dentin after thermo-cycling. Dent Mater.
2005;21(11):999-1007.
215. International Organization for Standardization. ISO TR 11405. In: Dental
materials-guidance on testing of adhesion to tooth structure. First ed. ; 1994:15-25.
216. Banomyong D, Palamara JE, Burrow MF, Messer HH. Effect of dentin
conditioning on dentin permeability and micro-shear bond strength. Eur J Oral Sci.
2007;115(6):502-509.
217. Zhang C, Degrange M. Shear bond strengths of self-adhesive luting resins fixing
dentine to different restorative materials. J Biomater Sci Polym Ed. 2010;21(5):593-
608.

263
218. Van Meerbeek B, De Munck J, Yoshida Y, et al. Adhesion to enamel and dentin:
Current status and future challenges. Oper Dent. 2003;28(3):215-235.
219. Tsitrou EA, Northeast SE, van Noort R. Evaluation of the marginal fit of three
margin designs of resin composite crowns using CAD/CAM. J Dent. 2007;35(1):68-
73.
220. Jedynakiewicz NM, Martin N. CEREC: Science, research, and clinical application.
Compend Contin Educ Dent. (Jamesburg, N.J.: 1995). 2001;22(6 Suppl):7-13.
221. Otto T, De Nisco S. Computer-aided direct ceramic restorations: A 10-year
prospective clinical study of cerec CAD/CAM inlays and onlays. Int J Prosthodont.
2002;15(2):122-128.
222. Drummond J, Eliades G. Ceramic behavior under different environmental and
loading conditions. Dental materials in vivo: aging and related phenomena.Chicago:
Quintessence. 2003:35-45.
223. Wiskott HW, Nicholls JI, Belser UC. Stress fatigue: Basic principles and
prosthodontic implications. Int J Prosthodont. 1995;8(2):105-116.
224. Bates JF, Stafford GD, Harrison A. Masticatory function-a review of the
literature: (II) speed of movement of the mandible, rate of chewing and forces
developed in chewing. J Oral Rehabil. 1975;2(4):349-361.

264
225. Kampe T, Haraldson T, Hannerz H, Carlsson GE. Occlusal perception and bite
force in young subjects with and without dental fillings. Acta Odontol Scand.
1987;45(2):101-107.
226. Kiliaridis S, Kjellberg H, Wenneberg B, Engstrom C. The relationship between
maximal bite force, bite force endurance, and facial morphology during growth. A
cross-sectional study. Acta Odontol Scand. 1993;51(5):323-331.
227. Kelly JR. Clinically relevant approach to failure testing of all-ceramic
restorations. J Prosthet Dent. 1999;81(6):652-661.
228. Ronald L. Sakaguchi, John M. Powers. Craig's restorative dental materials. In:
Self-adhesive resin cements. Thirteenth Edition; 2012:344.
229. Kumbuloglu O, Lassila LV, User A, Vallittu PK. A study of the physical and
chemical properties of four resin composite luting cements. Int J Prosthodont.
2004;17(3):357-363.
230. Piwowarczyk A, Lauer HC. Mechanical properties of luting cements after water
storage. Oper Dent. 2003;28(5):535-542.
231. Frankenberger R, Lohbauer U, Schaible RB, Nikolaenko SA, Naumann M. Luting
of ceramic inlays in vitro: Marginal quality of self-etch and etch-and-rinse adhesives
versus self-etch cements. Dent Mater. 2008;24(2):185-191.
232. Albert FE, El-Mowafy OM. Marginal adaptation and microleakage of procera
AllCeram crowns with four cements. Int J Prosthodont. 2004;17(5):529-535.

265
233. Gu X-, Kern M. Marginal discrepancies and leakage of all-ceramic crowns:
Influence of luting agents and aging conditions. Int J Prosthodont. 2003;16(2):109-
116.
234. Piwowarczyk A, Lauer H-, Sorensen JA. Microleakage of various cementing
agents for full cast crowns. Dent Mater. 2005;21(5):445-453.
235. Kassem AS, Atta O, El-Mowafy O. Fatigue resistance and microleakage of
CAD/CAM ceramic and composite molar crowns. J Prosthodont. 2012;21(1):28-32.
236. Tyas MJ, Burrow MF. Adhesive restorative materials: A review. Aust Dent J.
2004;49(3):112-21; quiz 154.
237. Stamatacos C, Simon JF. Cementation of indirect restorations: An overview of
resin cements. Compend Contin Educ Dent. 2013;34(1):42-4, 46.
238. Kassem AS, Atta O, El-Mowafy O. Fatigue resistance and microleakage of
CAD/CAM ceramic and composite molar crowns. J Prosthodont. 2012;21(1):28-32.