Embed Size (px)
Citation preview

BMB/Ch 178 final Fall, 2018
Instructions
Please read the instruction carefully before starting to work on the Final. The time spent reading and digesting the instructions does not count into your time limit.
Finals are due Friday, Dec. 14 by 6 pm. Please drop off the completed finals in a box outside Shu-ou’s office (109 Braun).
The final exam is 3 hours and you will have use of lecture notes, course material, and textbook. You are not allowed to discuss the exam with others and all the work should be your own. You are not allowed to use online resources to aid in the completion of final. You cannot consult exams from previous years.
This exam seeks to test that you have a firm and broad grasp of the concepts presented throughout the course, and the ability to make connections between experimental data and molecular mechanisms. Please be concise in your answers. In most cases the answer is fairly specific, and either you know it or you do not. You are not expected to describe minutiae, and writing long paragraphs in the hope that you will chance upon the right key words will not help you.
Have Excel or another data plotting software ready before starting the exam.
You are encouraged to use a word processor for the final but it is not a requirement. If you type your exam on a computer, you don’t have to count time for printing. If you write your answers by hand, please make sure that they are legible! You won’t get credit for answers that can’t be read. Where figures are required, you can either draw them or make them using a data analysis software (such as excel).
Please set a timer when you start and stop immediately when the time limit is reached. You can do work after the time limit is up but you cannot expect full credit for work past the time limit. In such cases, please note explicitly when the time is up. Please note that this is done purely on the honor system, which Caltech takes seriously.

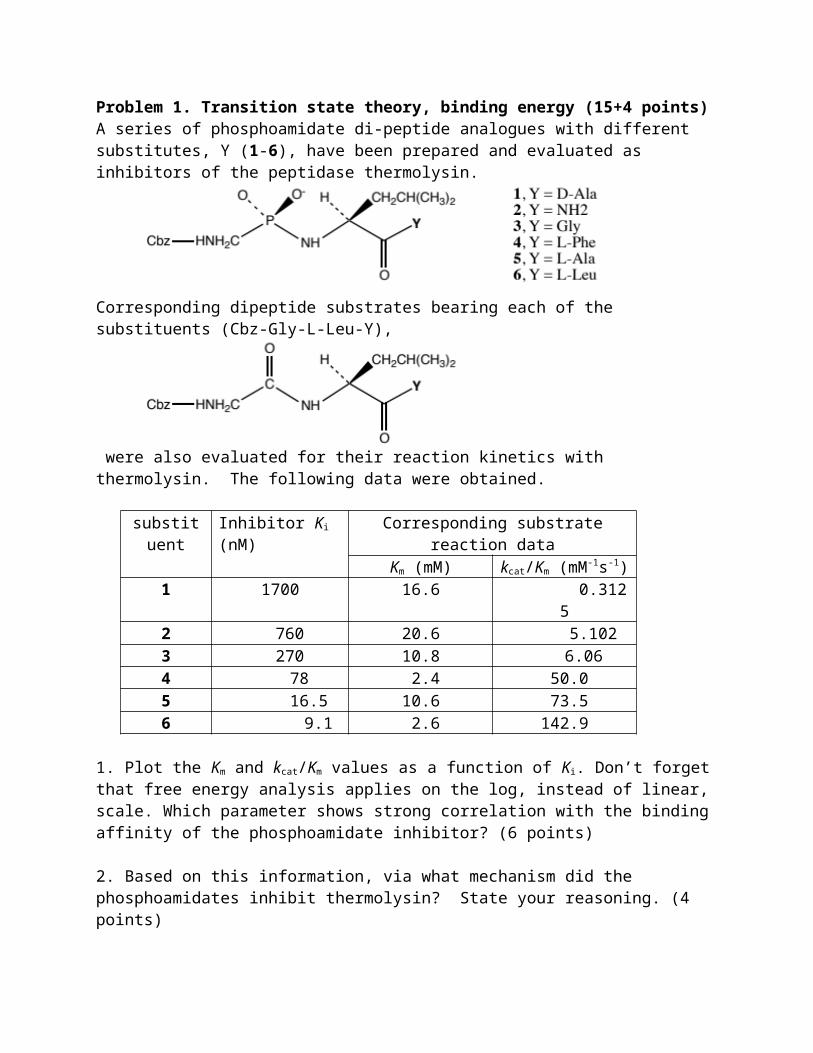
Problem 1. Transition state theory, binding energy (15+4 points)A series of phosphoamidate di-peptide analogues with different substitutes, Y (1-6), have been prepared and evaluated as inhibitors of the peptidase thermolysin.
Corresponding dipeptide substrates bearing each of the substituents (Cbz-Gly-L-Leu-Y),
were also evaluated for their reaction kinetics with thermolysin. The following data were obtained.
substituent Inhibitor Ki (nM) Corresponding substrate reaction dataKm (mM) kcat/Km (mM-1s-1)
1 1700 16.6 0.31252 760 20.6 5.1023 270 10.8 6.064 78 2.4 50.05 16.5 10.6 73.56 9.1 2.6 142.9
1. Plot the Km and kcat/Km values as a function of Ki. Don’t forget that free energy analysis applies on the log, instead of linear, scale. Which parameter shows strong correlation with the binding affinity of the phosphoamidate inhibitor? (6 points)
2. Based on this information, via what mechanism did the phosphoamidates inhibit thermolysin? State your reasoning. (4 points)
3. What principle of enzymatic catalysis do these data illustrate? (4 points)
4. Based on the above information, what is the putative transition state structure of this reaction? (4 points)
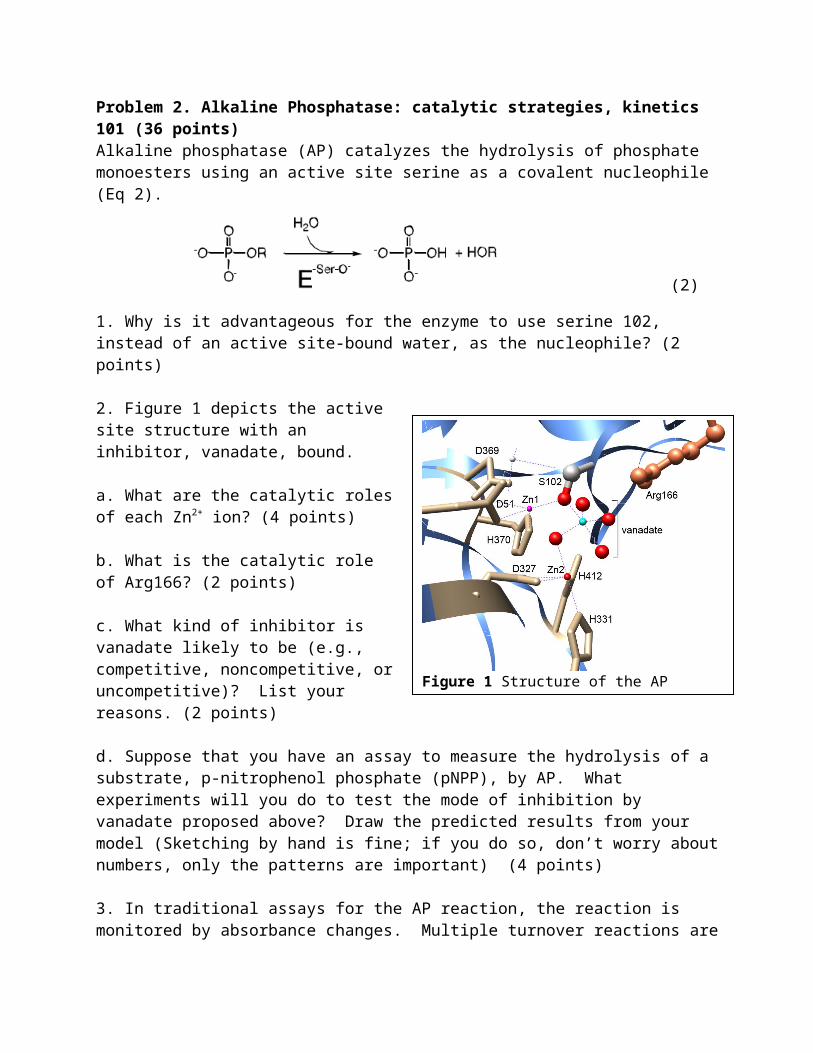
Problem 2. Alkaline Phosphatase: catalytic strategies, kinetics 101 (36 points)Alkaline phosphatase (AP) catalyzes the hydrolysis of phosphate monoesters using an active site serine as a covalent nucleophile (Eq 2).
(2)
1. Why is it advantageous for the enzyme to use serine 102, instead of an active site-bound water, as the nucleophile? (2 points)
2. Figure 1 depicts the active site structure with an inhibitor, vanadate, bound.
a. What are the catalytic roles of each Zn2+ ion? (4 points)
b. What is the catalytic role of Arg166? (2 points)
c. What kind of inhibitor is vanadate likely to be (e.g., competitive, noncompetitive, or uncompetitive)? List your reasons. (2 points)
d. Suppose that you have an assay to measure the hydrolysis of a substrate, p-nitrophenol phosphate (pNPP), by AP. What experiments will you do to test the mode of inhibition by vanadate proposed above? Draw the predicted results from your model (Sketching by hand is fine; if you do so, don’t worry about numbers, only the patterns are important) (4 points)
3. In traditional assays for the AP reaction, the reaction is monitored by absorbance changes. Multiple turnover reactions are followed and reasonable data can only be obtained with at least 0.5 µM pNPP substrate because of the low absorption coefficients of pNPP. However, one of the products of the reaction, Pi, binds to AP with Kd < 0.1 µM.
(a) Will this assay accurately measure the reaction rates? What are the problem(s)? (4 points)
(b) To measure reaction rate constant more accurately, a radioactive assay is developed in which 32P-labeled substrates, at concentrations < 1 nM, is used. The concentration of AP is varied and in excess to substrate. The following reaction time course can be observed (Fig. 2):
Figure 1 Structure of the AP active site.
Figure 2 Time course of AP reaction with a radioactive assay.

What are the advantages of this assay over the pNPP based spectroscopic assays? (6 points)
4. AP is non-specific with respective to its leaving group. This allows a Brønsted relationship between reaction rate and leaving group ability to be constructed for a series of alkyl phosphates (Fig. 3):
(a) Estimate the leaving group Brønsted slope of this reaction (2 points)
(b) What does this result suggest about the nature of the transition state for the AP reaction? (2 points)
5. The kcat/Km of the reaction for alkyl phosphates shows a bell-shaped pH dependence (Fig. 4):The acidic limbs of the pH dependences for trifluoroethyl phosphate () and ethyl phosphate () give pKa values of 5.6±0.1 and 6.4±0.1, respectively. The solution pKa
values for deprotonation of 2,2,2-trifluoroethyl phosphate monoanion is 5.62±0.02, and that for ethyl phosphate monoanion is 6.36±0.02.
(a) Which deprotonation event is responsible for the acidic limb of the pH dependence in Figure 2? (2 points)
(b) Which is the reactive species for the AP reaction, the phosphate monoanion or the phosphate dianion? (2 points)
6. Being one of the most ancient phosphomonoesterases, alkaline phosphatase also harbors promiscuous activity towards phosphate diesters and sulfate esters. Suggest how this catalytic promiscuity could have contributed to the evolution of phosphodiesterases and sulfatases. (4 points)
Figure 3 Leaving group dependence for reaction of AP.
Figure 4. pH dependence of reactions with 2, 2,2-trifluoroethyl phosphate () and ethyl phosphate ().
Problem 3. Kinetics in complex systems (28 points)Ffh and FtsY are two GTPases that bind one another in the GTP-form, and upon binding, their GTPase activities are greatly stimulated. The interaction and reciprocal activation between Ffh and FtsY can therefore be measured by following GTP hydrolysis. In steady-state measurements, Ffh is limiting (0.1 µM), GTP is in excess to saturate both proteins, and the concentration of FtsY is varied to alter the degree of complex formation. Eq 3 shows a schematic of this reaction, in which the superscripts denote bound nucleotide (T = GTP, D = GDP), and the rate constants of the individual reaction steps are specified. Independent measurements showed that all subsequent steps (dissociation of D•Ffh from FtsY•D and exchange of bound GDP to GTP) are rapid.
(3)
(1) The steady-state rate constants measured for this reaction are: kcat = 0.71 s-1, Km = 1.6 µM, and kcat/Km = 4.4 x 10⁵ M-1s-1. What are the two alternative interpretations of the steady-state rate constants in relationship to the values of k1, k-1, and k2? (6 points)
(2) Independent fluorescence assays were carried out to measure the association and dissociation between T•Ffh and FtsY•T using a non-hydrolyzable GTP analogue. The obtained rate constants are: k1 = 5.2 x 10⁵ M-1s-1, and k-1 = 0.091 s-1. Given this information, which of the two interpretations above is true? Which molecular steps do the steady-state rate constants report on? Explain your reasoning. (3 points)
(3) Table 1 shows the results of measurements for the reaction of Ffh with a set of FtsY mutants, whose steady-state rate constants relative to wildtype FtsY are summarized. Using a cutoff of 3-fold, identify the mutants that are defective in this reaction (2 points). Which mutants are specifically defective in Ffh binding, but not GTP hydrolysis from the complex (2 points)?
Table 1. Summary of rate constants for wildtype and mutant FtsY in the reciprocally stimulated GTPase reaction. FtsY construct Stimulated GTPase reaction
(kc/Km)rel k catrel
Wild-type (1) (1)N302A 0.057 0.11T307A 0.0052 0.014R333A 0.0097 0.036A335W 0.15 0.025A336W 0.012 0.016K399A 0.042 0.46G455W 0.22 0.43E475K 0.055 0.63E284A 1.2 0.83N287A 1.0 0.99E289A 1.1 1.0E318A 1.0 1.1

K322A 1.1 0.98N347A 1.1 1.3N348A 0.96 1.0H355A 1.1 0.43T356A 0.91 1.3S362A 1.0 0.54
(4) For mutants with significantly compromised kcat values, to further test whether they are also defective in binding Ffh, a competition assay was carried out using the mutant FtsY as a competitive inhibitor of the reaction of wildtype Ffh and FtsY. Representative data for two mutants are shown below.
Combining the inhibition data and the information in Table 1, what are the defect(s) of mutants FtsY(T307A) and FtsY(A335W) (4 points)?
(5) An independent assay measures the biological function of Ffh and FtsY: mediating nascent protein translocation across the ER membrane. The results with wildtype and mutant FtsYs are shown on the right:
Based on these results and the data in Table 1, is the binding of Ffh with FtsY rate-limiting for the translocation reaction? Explain your reasoning (3 points).
(6) A co-crystal structure of the Ffh•FtsY complex bound to the non-hydrolyzable GTP analogue, GMPPNP, is shown on the right, with a zoom-in of the catalytic active site on top. The nucleotides bound to Ffh and FtsY, the nucleophilic water (W), and bound Mg2+
are highlighted. Residues in the catalytic loop are in red. What are the catalytic roles of the highlighted active site residues (6 points)? Given the structural information, what is likely the defect caused by the FtsY(A335W) mutation (2 points)?
Problem 4: Single Molecule Kinetics (18 points)The Tetrahymena group I ribozyme catalyzes the cleavage of an oligonucleotide substrate:
CCCUCUA5 CCCUCUOH + pA5
Binding of the oligonucleotide substrate to the enzyme occurs in two-steps, involving (i) base pairing between the substrate and the ribozyme to form a P1 duplex; and (ii) docking of the P1 duplex into the ribozyme active site. A model of the structures of the ribozyme in the docked and undocked states based on crosslinking data (substrate highlighted in blue) is shown below
Single molecule fluorescence is used to study the docking of P1 in this ribozyme. To immobilize the ribozyme on a glass surface, a 3’-extension is added to the ribozyme that anneals with a DNA oligo, which is tethered to the glass surface via a biotin tag (Fig. 1).
a) To study the docking of P1 by FRET, where will you place the fluorescent dyes, and which pair of fluorescent probes will you use? Explain why. (3 points)
b) The following fluorescence time traces were observed for the wildtype all-ribose substrate (rS) and for a modified substrate, -3mS, in which docking of P1 is substantially destabilized by a methoxy substitution of a 2’-hydroxyl group. Which one of these time traces belongs to rS, and which one belongs to -3mS? (2 points)
c) The dwell times of molecules in the docked and undocked states are analyzed and their probability distributions are shown below:

Based on these data, estimate the rate constants for docking and undocking, and the equilibrium constant for docking of the all-ribose and the -3mS substrates. (9 points)
(4) Which kinetic parameter does the -3m substitution primarily affect? (2 points) Based on this information, can you suggest how the -3m substitution disfavors docking of the P1 duplex? (2 points)