Embed Size (px)
Citation preview
ADDRESSING FOOD ACCESS BARRIERS: THE PROMISE AND POTENTIAL OF SMALL FOOD RETAILERS
Joel Gittelsohn, PhDCenter for Human NutritionJohns Hopkins Bloomberg School of Public Health
February 26, 2016
Topics•Working with small stores to improve access to healthy choices in low income and low access communities
•Baltimore Healthy Stores•Baltimore Healthy Carryouts•B’More Healthy! Retail Rewards•Future Directions
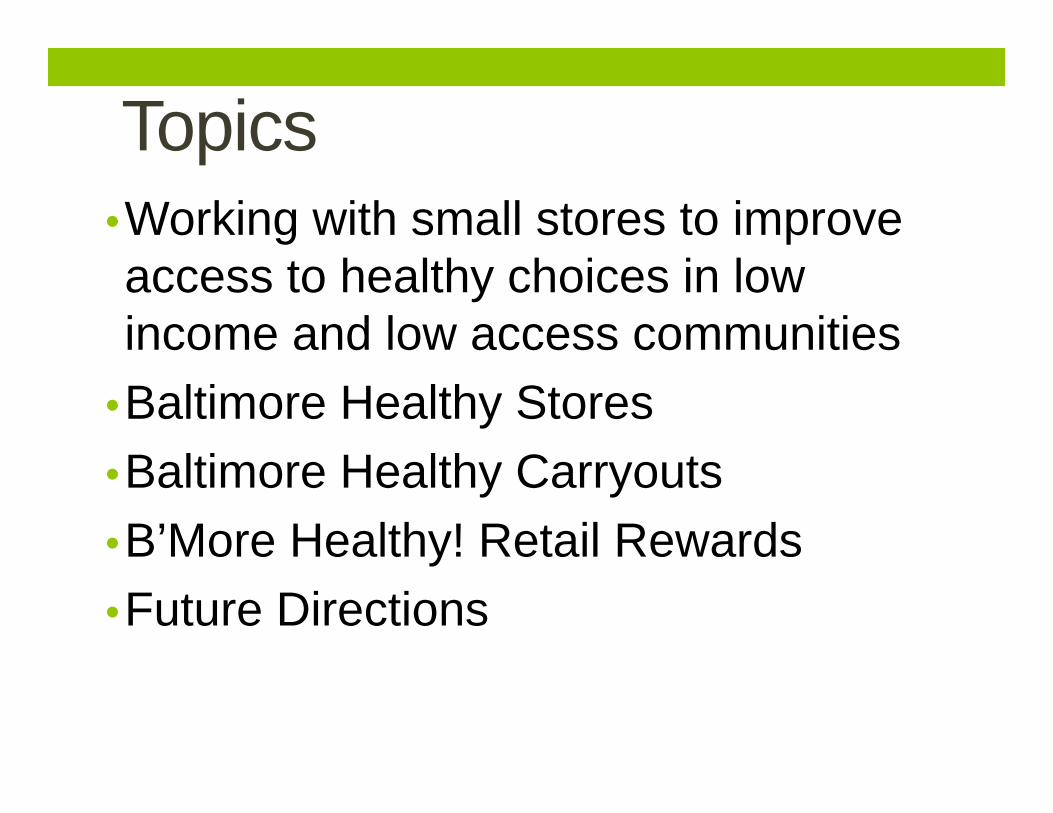
Educational versus Environmental interventions
• Educational interventions assist people in making choices among available options.
• Environmental interventions change the options.
• Educational and environmental interventions work well in combination (supply-demand).
Components of Access•Availability
•Price
•Ease of obtaining • (transportation to get to store, finding food once you get to store)
Why work in food stores?• Can reach the main food preparers/shoppers within a household
• Can increase the availability of affordable, culturally-acceptable healthy foods
• Often one of few community “centers” in some settings
• Food stores exist in most communities
Early Food Store Intervention Trials: Limitations• Mostly in supermarkets, few in small stores• Little work in small prepared food sources
• Limited formative research• Little emphasis on participatory approaches• Limited use of behavior change theory
• Few intervention strategies, with limited reinforcement/integration of activities
• Some addressed access, but few pricing
• Limited evaluation (e.g. lack of dietary assessments)• Little process evaluation
(References: Seymour et al 2004, Glanz et al 1995, Wechsler et al 2000, French and Stables 2005)
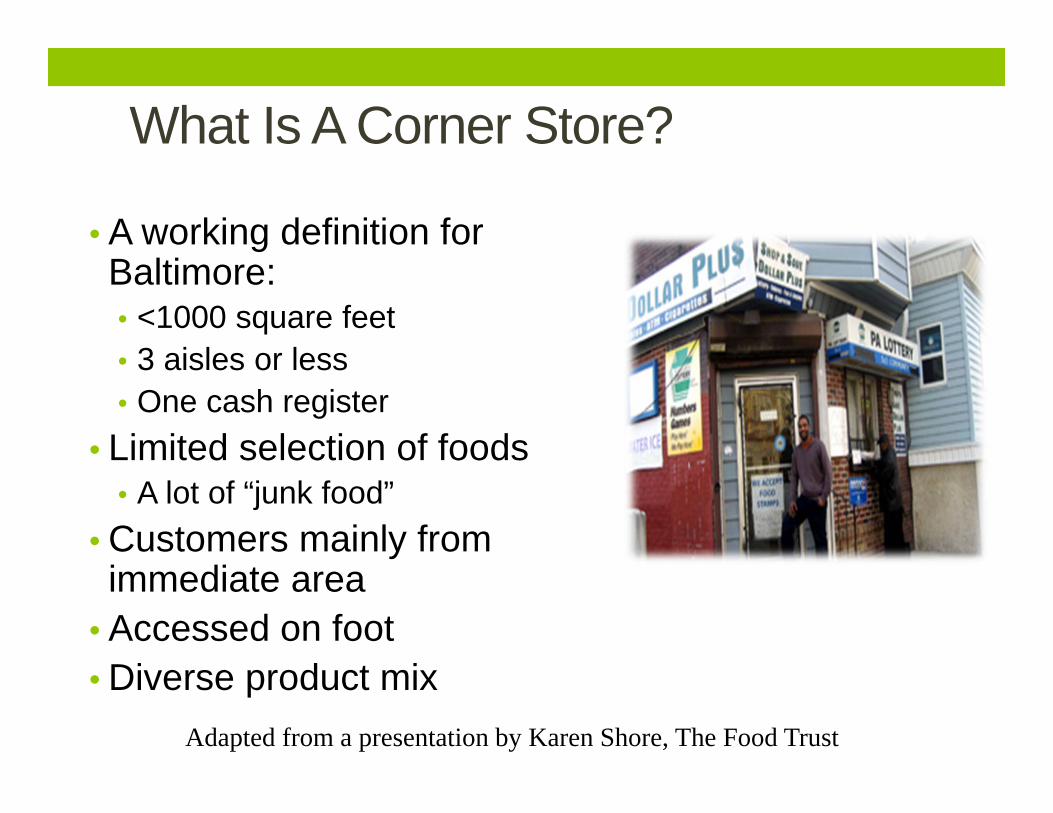
What Is A Corner Store?
• A working definition for Baltimore:• <1000 square feet• 3 aisles or less• One cash register
• Limited selection of foods• A lot of “junk food”
• Customers mainly from immediate area
• Accessed on foot• Diverse product mix
Adapted from a presentation by Karen Shore, The Food Trust
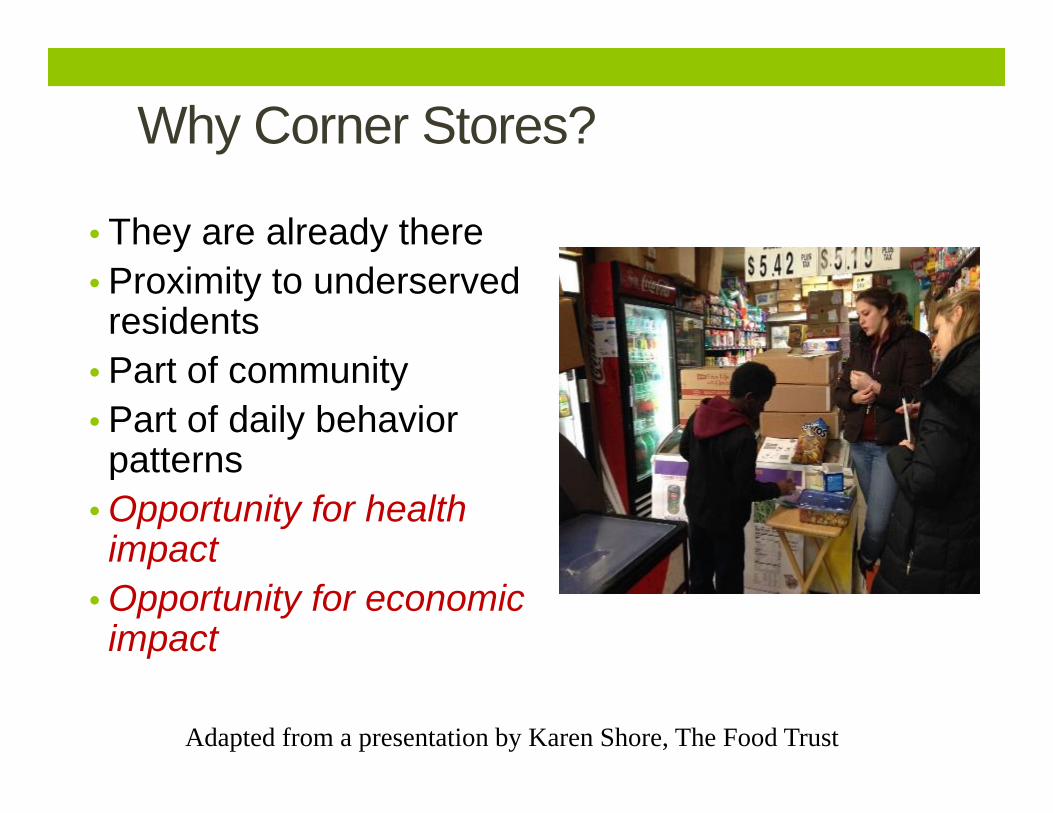
Why Corner Stores?
• They are already there• Proximity to underserved residents
• Part of community• Part of daily behavior patterns
• Opportunity for health impact
• Opportunity for economic impact
Adapted from a presentation by Karen Shore, The Food Trust
Opportunity for Health Impact
• 356.6 kcal per purchase• Students spent $1.07 on 2 items per purchase• Baltimore children report spending >$3/day at corner stores when they use them
• 53% shop once a day • 42% shop 2+ times a day• Energy dense, low-nutritive foods and beverages
Data Source: Kelley E. Borradaile, Sandy Sherman, Stephanie S. Vander Veur, Tara McCoy, Brianna Sandoval, Joan Nachmani, Allison Karpyn, and Gary D. Foster Snacking in Children: The Role of Urban Corner Stores Pediatrics 2009 : peds.2009-0964v1-peds.2009-0964.
Corner Store Purchases:
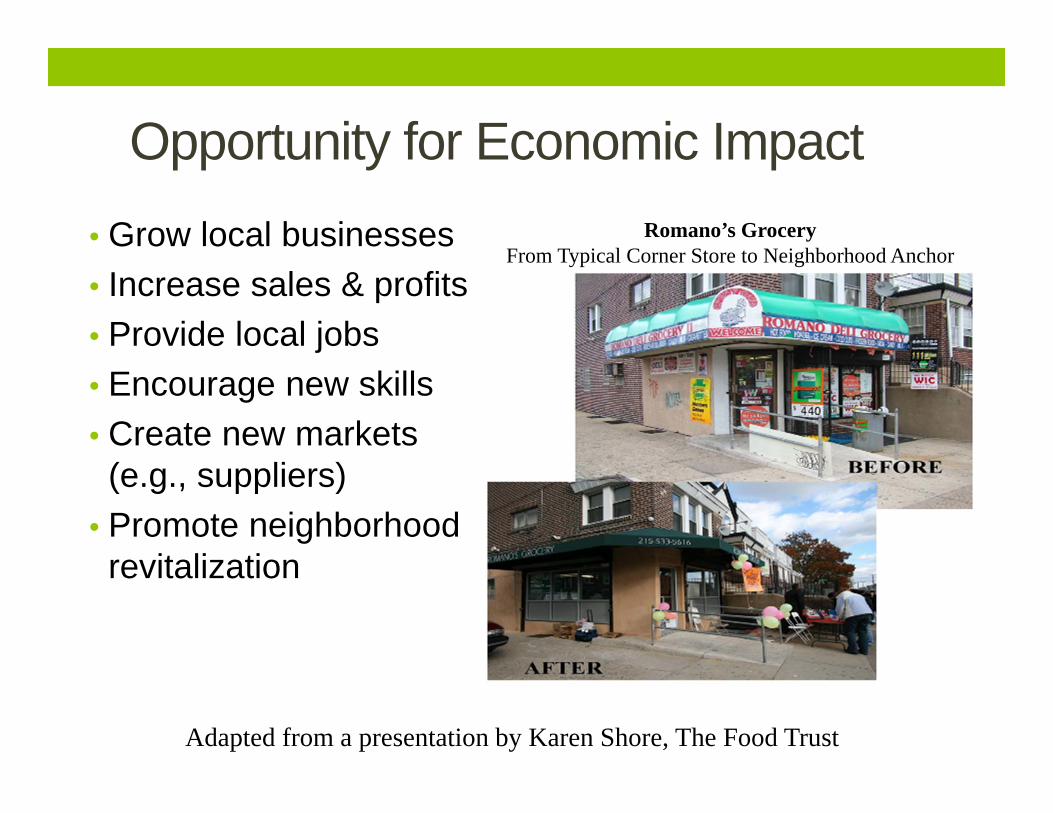
Opportunity for Economic Impact• Grow local businesses• Increase sales & profits• Provide local jobs• Encourage new skills• Create new markets (e.g., suppliers)
• Promote neighborhood revitalization
Romano’s GroceryFrom Typical Corner Store to Neighborhood Anchor
Adapted from a presentation by Karen Shore, The Food Trust
Baltimore-based small food source studies
•Baltimore Healthy Stores
•Baltimore Healthy Carryouts
•B’More Healthy! Retail Rewards
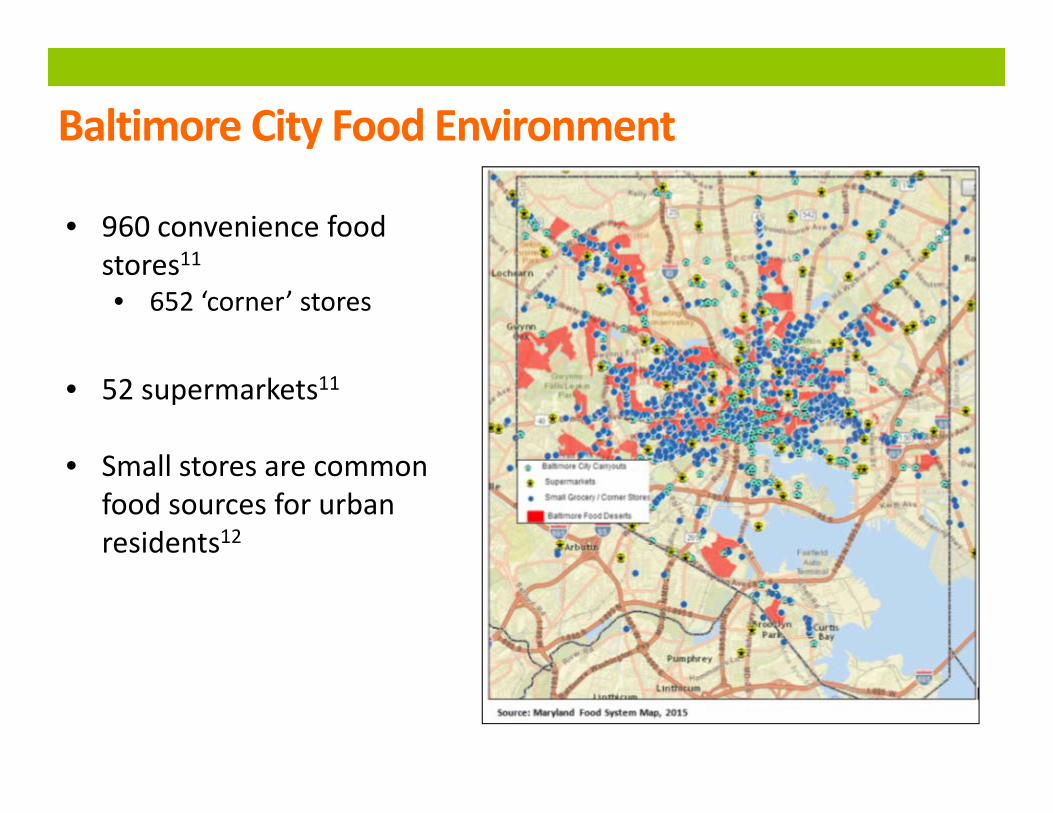
Baltimore City Food Environment
• 960 convenience food stores11• 652 ‘corner’ stores
• 52 supermarkets11
• Small stores are common food sources for urban residents12
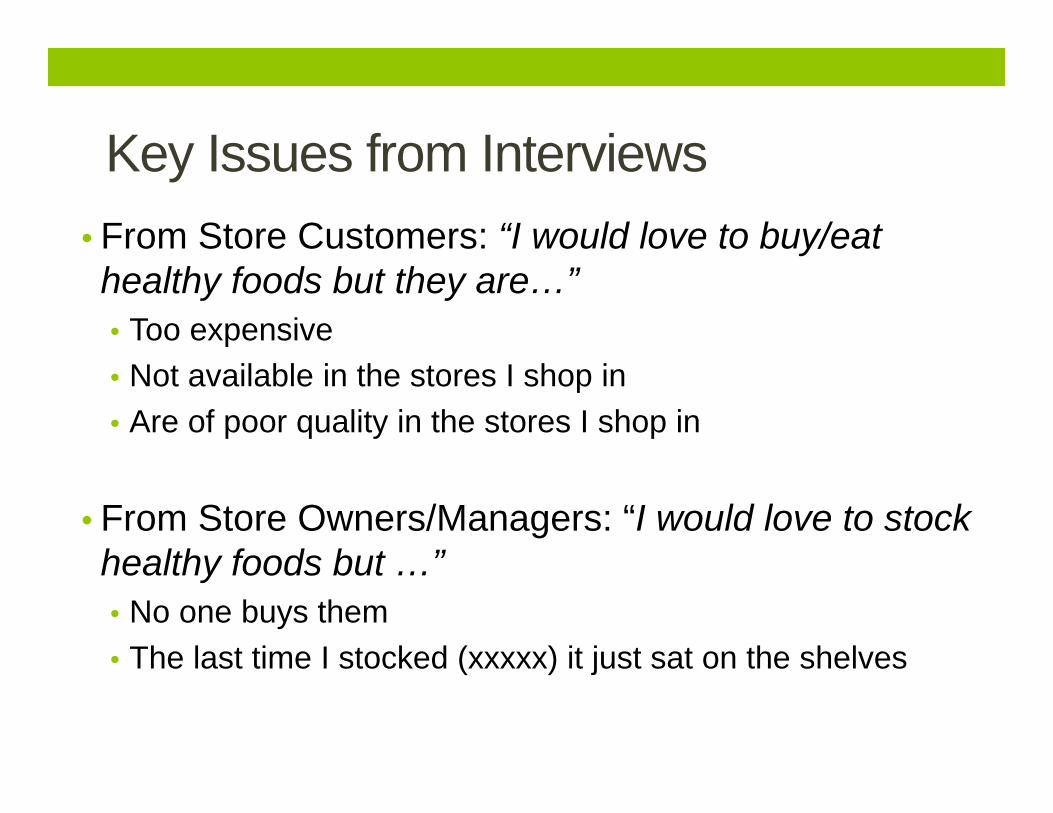
Key Issues from Interviews• From Store Customers: “I would love to buy/eat healthy foods but they are…”• Too expensive• Not available in the stores I shop in• Are of poor quality in the stores I shop in
• From Store Owners/Managers: “I would love to stock healthy foods but …”• No one buys them• The last time I stocked (xxxxx) it just sat on the shelves
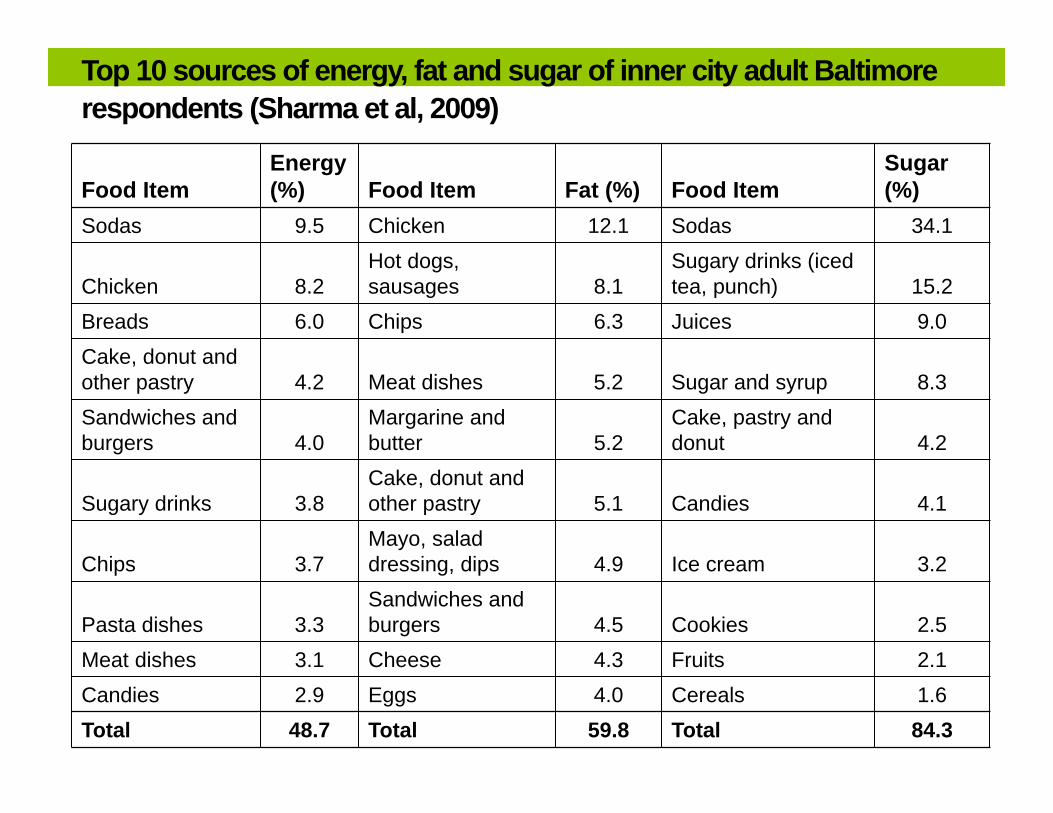
Top 10 sources of energy, fat and sugar of inner city adult Baltimore respondents (Sharma et al, 2009)
Food ItemEnergy (%) Food Item Fat (%) Food Item
Sugar (%)
Sodas 9.5 Chicken 12.1 Sodas 34.1
Chicken 8.2Hot dogs, sausages 8.1
Sugary drinks (iced tea, punch) 15.2
Breads 6.0 Chips 6.3 Juices 9.0Cake, donut and other pastry 4.2 Meat dishes 5.2 Sugar and syrup 8.3Sandwiches and burgers 4.0
Margarine and butter 5.2
Cake, pastry and donut 4.2
Sugary drinks 3.8Cake, donut and other pastry 5.1 Candies 4.1
Chips 3.7Mayo, salad dressing, dips 4.9 Ice cream 3.2
Pasta dishes 3.3Sandwiches and burgers 4.5 Cookies 2.5
Meat dishes 3.1 Cheese 4.3 Fruits 2.1Candies 2.9 Eggs 4.0 Cereals 1.6Total 48.7 Total 59.8 Total 84.3
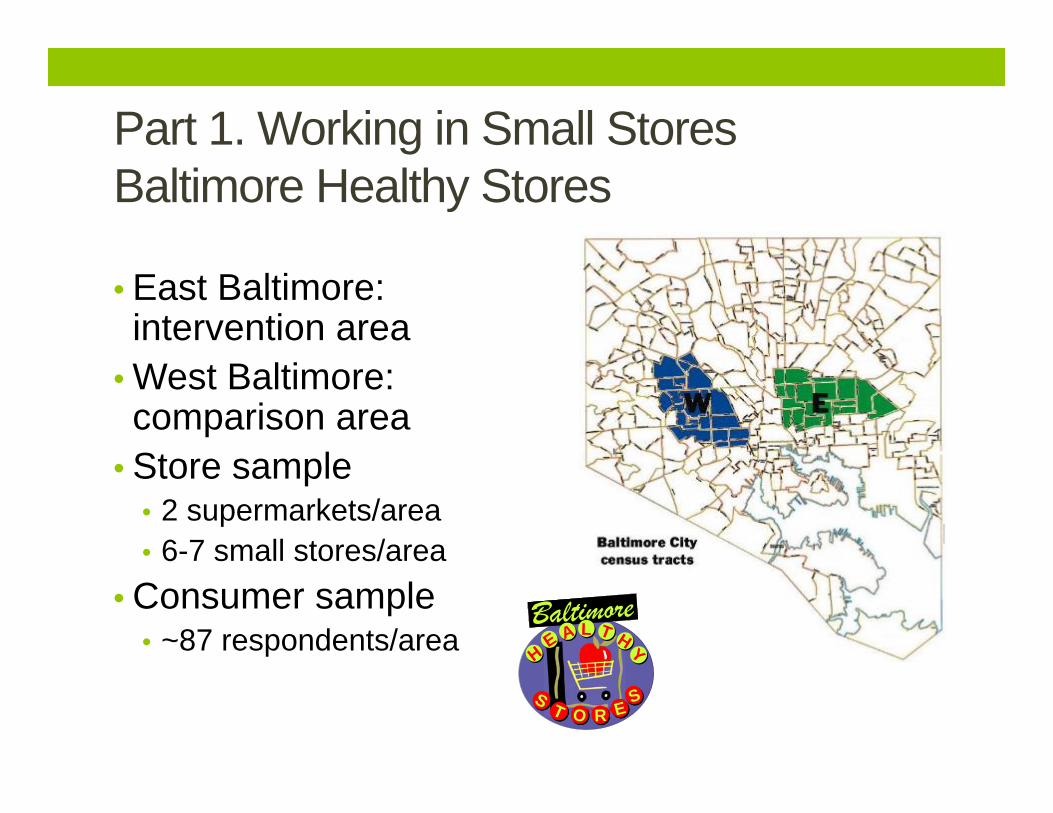
Part 1. Working in Small StoresBaltimore Healthy Stores
• East Baltimore: intervention area
• West Baltimore: comparison area
• Store sample• 2 supermarkets/area• 6-7 small stores/area
• Consumer sample• ~87 respondents/area
BaltimoreBaltimoreEE YY
TTAA LL HHHH
TT EEOO RRSS SS
TT EEOO RRSS SS

Community workshops
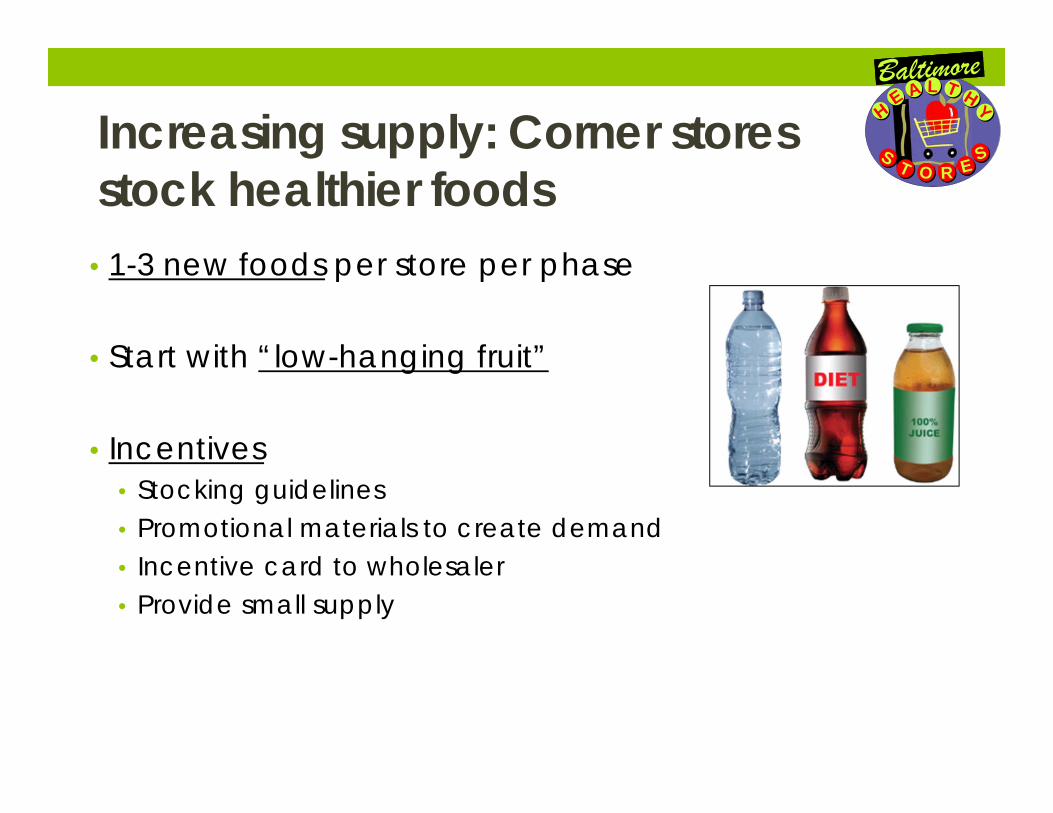
• 1-3 new foods per store per phase
• Start with “low-hanging fruit”
• Incentives• Stocking guidelines• Promotional materials to create demand• Incentive card to wholesaler • Provide small supply
Increasing supply: Corner stores stock healthier foods
BaltimoreBaltimoreEE YY
TTAA LL HHHH
TT EEOO RRSS SS
TT EEOO RRSS SS
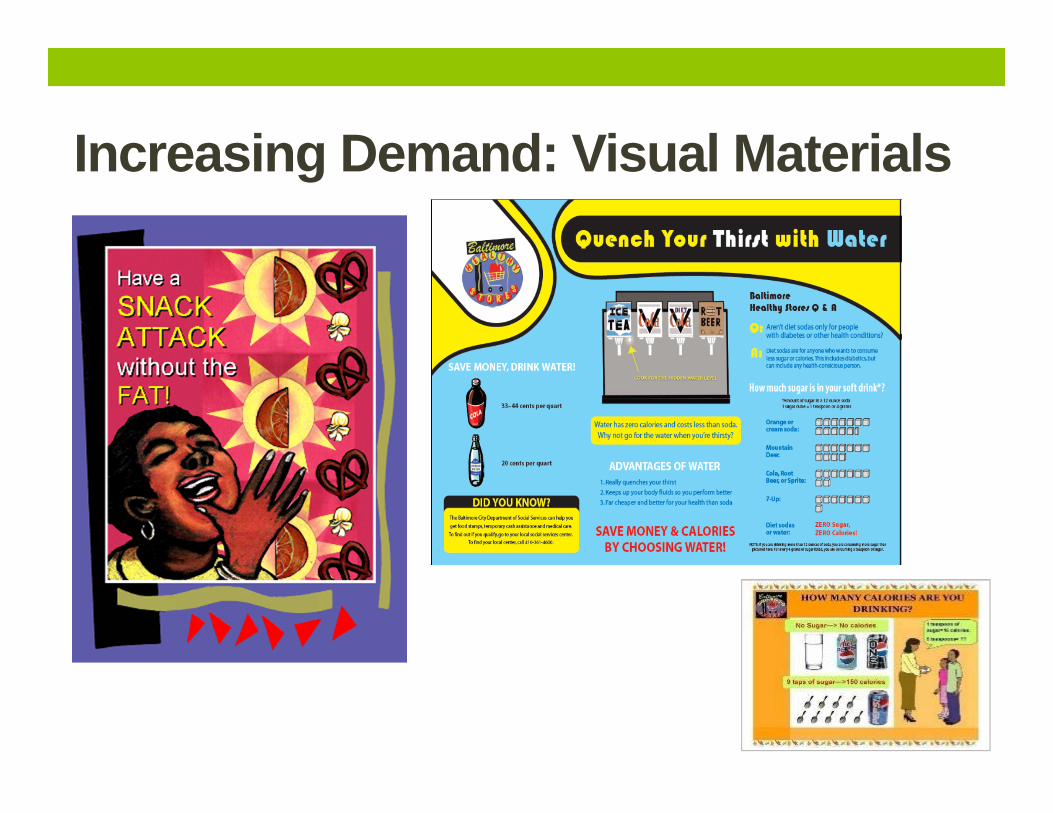
Increasing Demand: Visual Materials
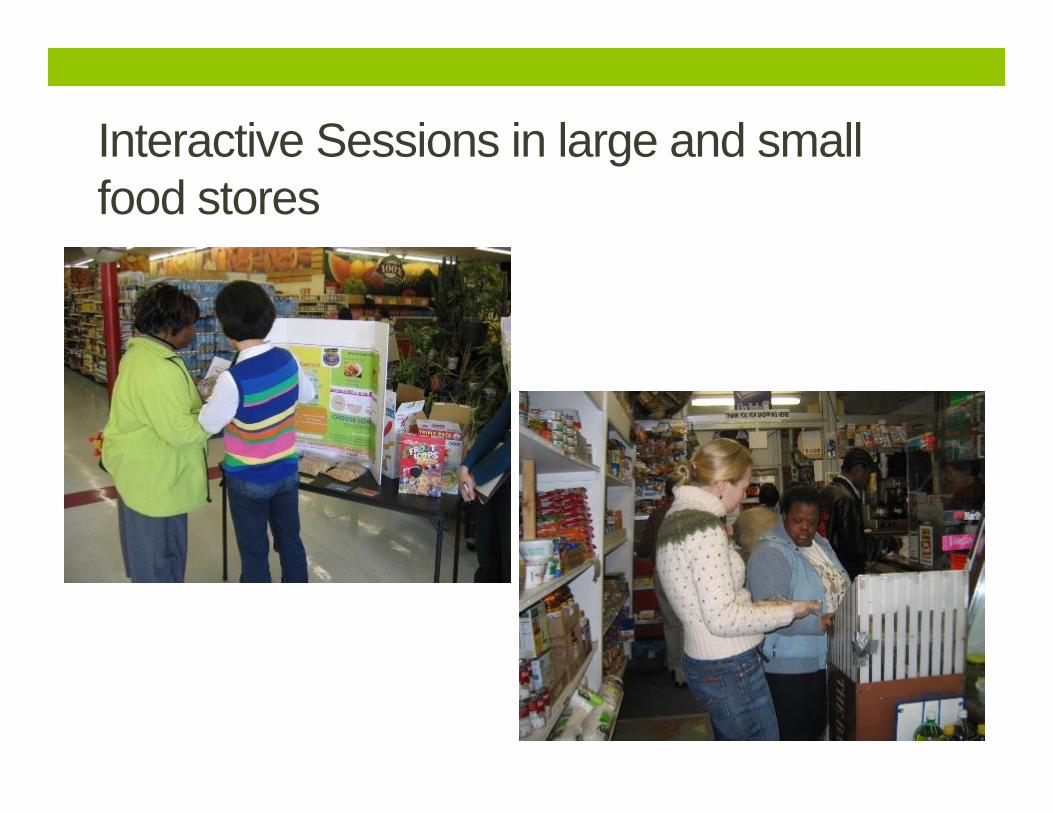
Interactive Sessions in large and small food stores
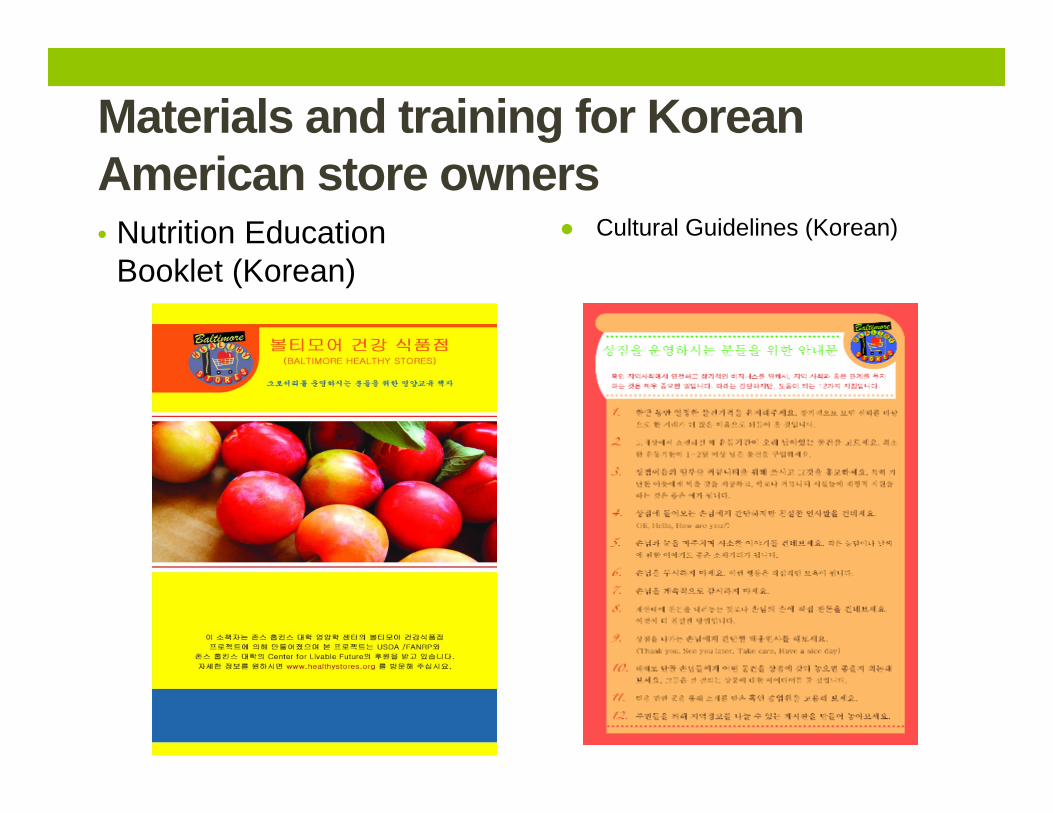
• Nutrition Education Booklet (Korean)
Materials and training for Korean American store owners
Cultural Guidelines (Korean)
21 / 63
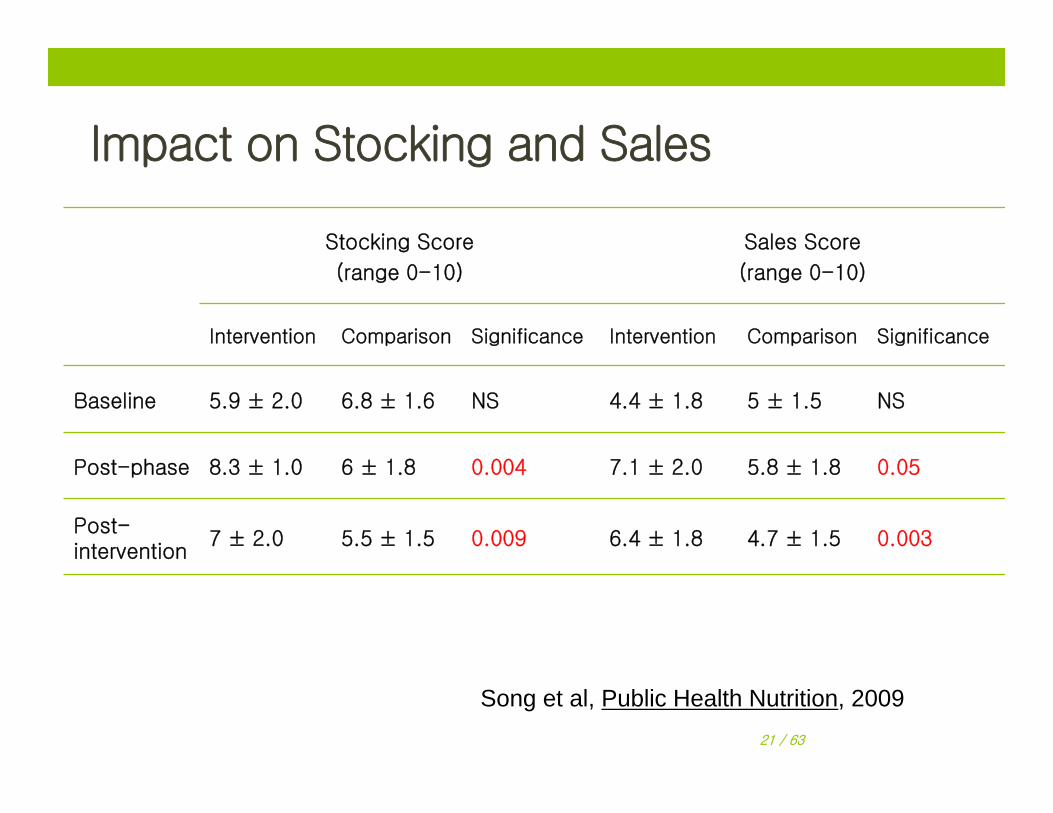
Impact on Stocking and Sales
Stocking Score
(range 0-10)
Sales Score
(range 0-10)
Intervention Comparison Significance Intervention Comparison Significance
Baseline 5.9 ± 2.0 6.8 ± 1.6 NS 4.4 ± 1.8 5 ± 1.5 NS
Post-phase 8.3 ± 1.0 6 ± 1.8 0.004 7.1 ± 2.0 5.8 ± 1.8 0.05
Post-intervention
7 ± 2.0 5.5 ± 1.5 0.009 6.4 ± 1.8 4.7 ± 1.5 0.003
Song et al, Public Health Nutrition, 2009
• N=85 respondents measured pre and post
• After adjustment for baseline value, age, sex and SES:
• Significant impact on food preparation methods and frequency of purchase of promoted foods
• Positive trend for healthy food intentions
Consumer Results
Gittelsohn et al, Health Education and Behavior, 2009
Lessons Learned• We can get small stores to increase stocking of healthier
foods, and show impact on consumer food choices
• Sustainability of small store interventions possible in Baltimore
• BUT: people in Baltimore’s low income food environments get food from many places
Part 2. Changing the prepared food source environment:
Baltimore Healthy Carryouts
Baltimore Healthy Carryout Aims
• To develop, implement and evaluate a culturally appropriate multi-component carryout intervention to reduce risk factors for diet-related chronic diseases in a low income urban setting
Conduct formative research on the availability, pricing and consumption of carryout foods
Develop culturally-appropriate intervention materials and implement the intervention is 4 stores
To evaluate a pilot trial of a carry-out intervention in eight local carry-outs (food sales, energy and fat intake, psychosocial factors)
Environmental Assessment
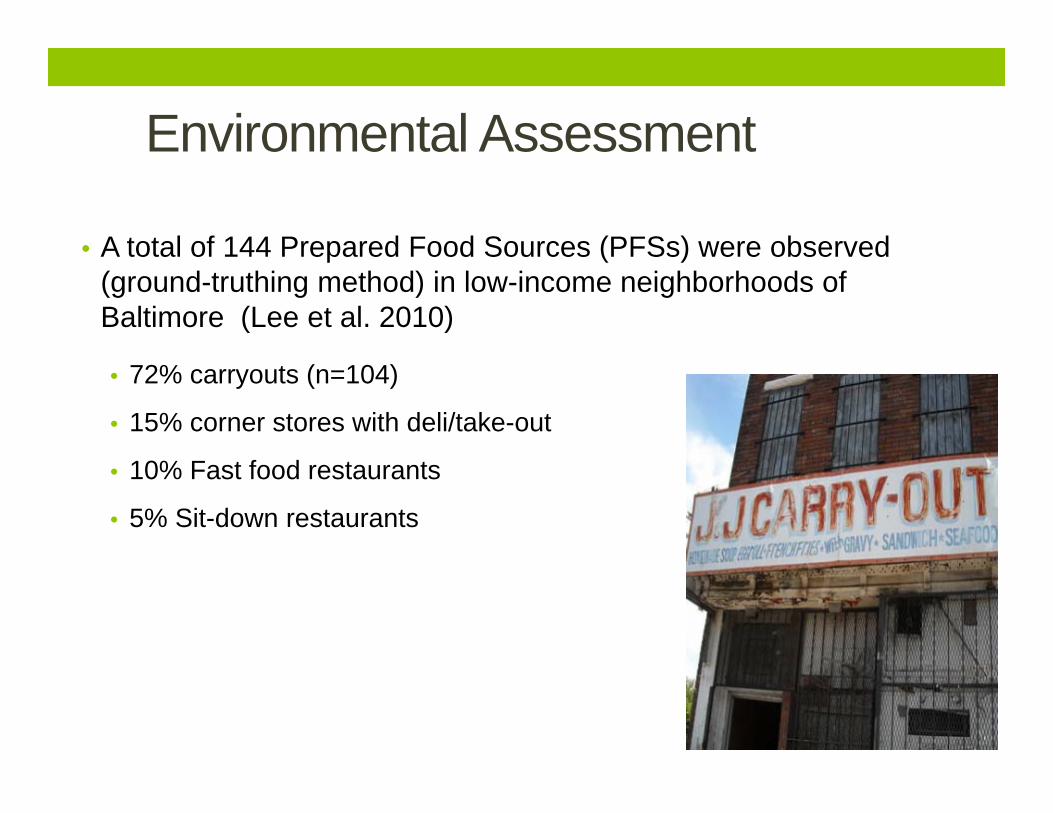
• A total of 144 Prepared Food Sources (PFSs) were observed (ground-truthing method) in low-income neighborhoods of Baltimore (Lee et al. 2010)
• 72% carryouts (n=104)
• 15% corner stores with deli/take-out
• 10% Fast food restaurants
• 5% Sit-down restaurants
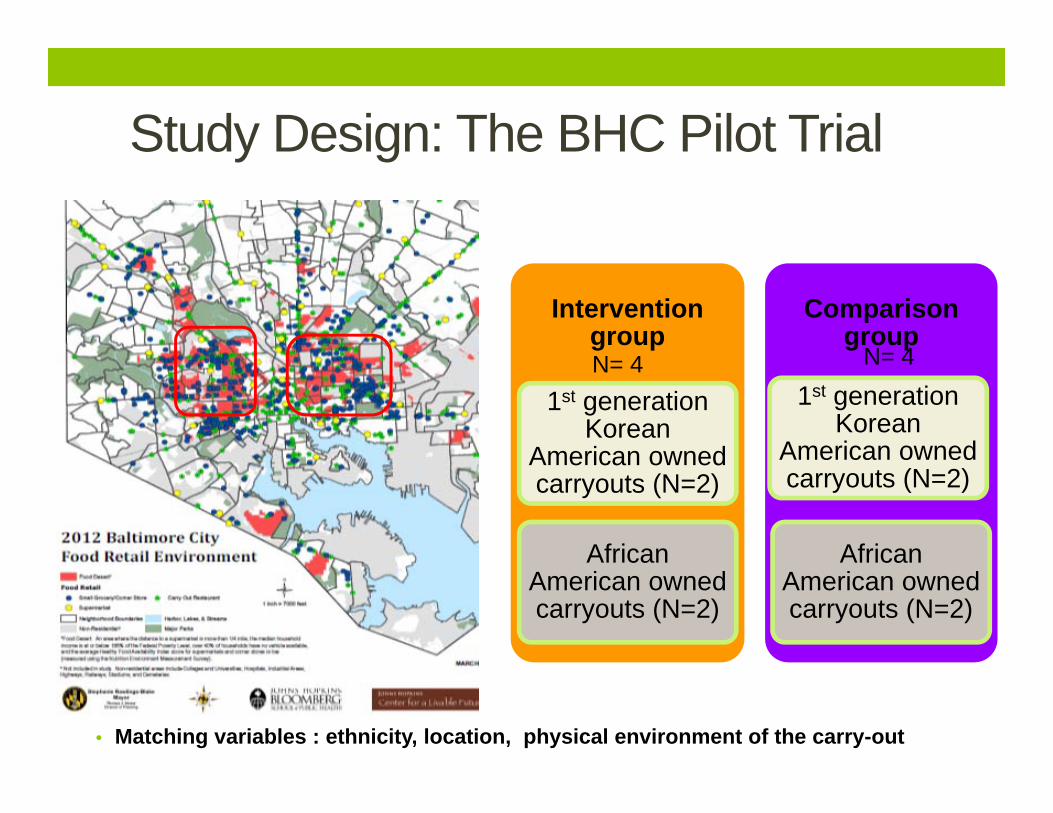
Study Design: The BHC Pilot Trial
• Matching variables : ethnicity, location, physical environment of the carry-out
Intervention group
1st generation Korean
American owned carryouts (N=2)
African American owned carryouts (N=2)
Comparison group
1st generation Korean
American owned carryouts (N=2)
African American owned carryouts (N=2)
N= 4N= 4
Intervention Phases
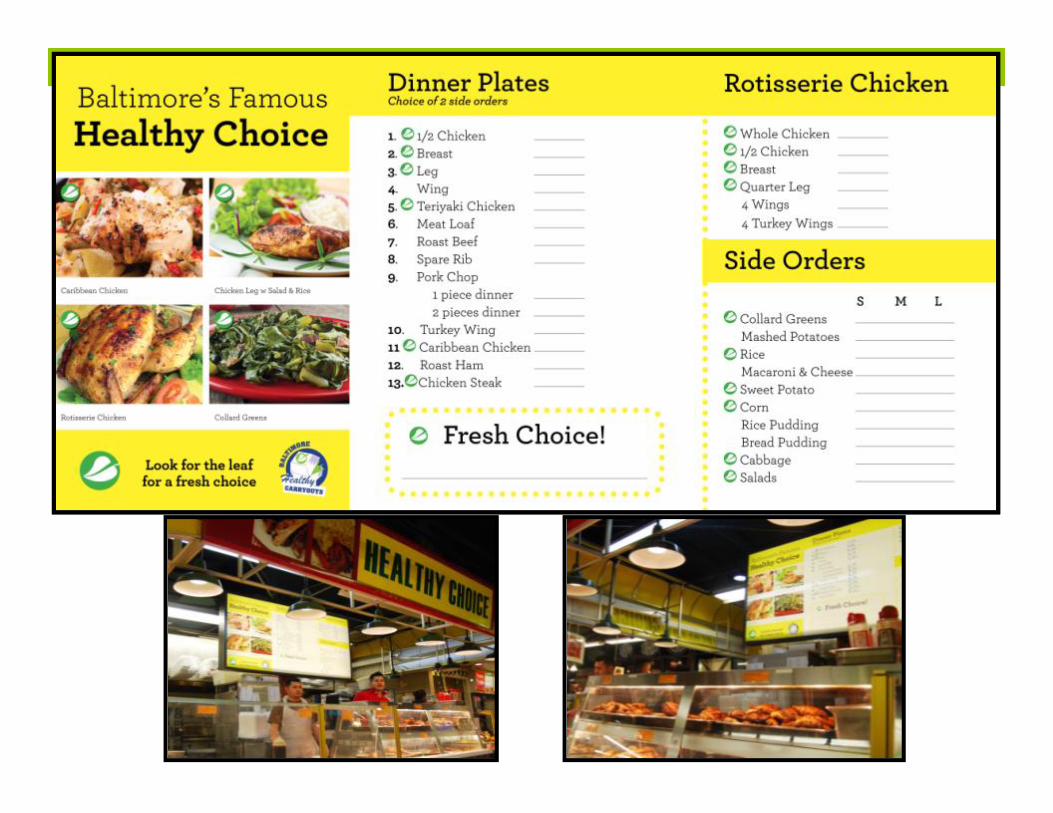
• Phase 1: Modified Menu Boards & Menu Labeling
• Phase 2: Healthy Sides & Beverages
• Phase 3: Affordable Healthy Combo Meals
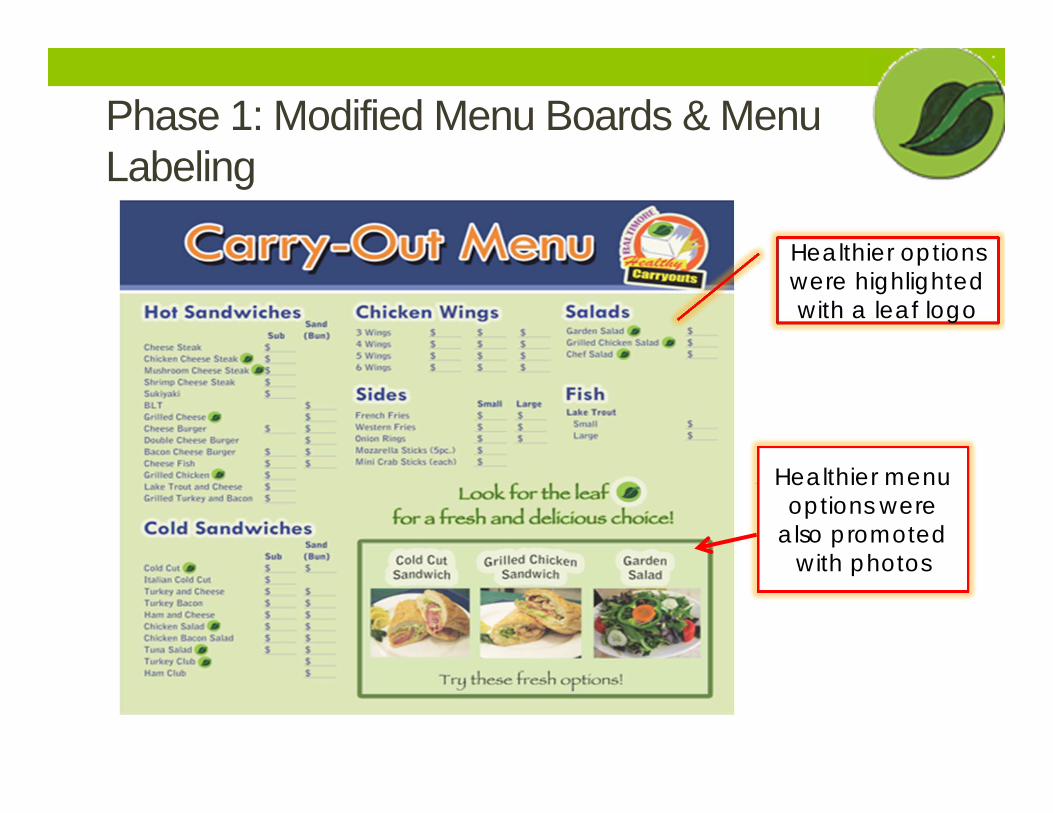
Phase 1: Modified Menu Boards & Menu Labeling
Before
Healthier options were highlighted with a leaf logo
Healthier menu options were
also promoted with photos
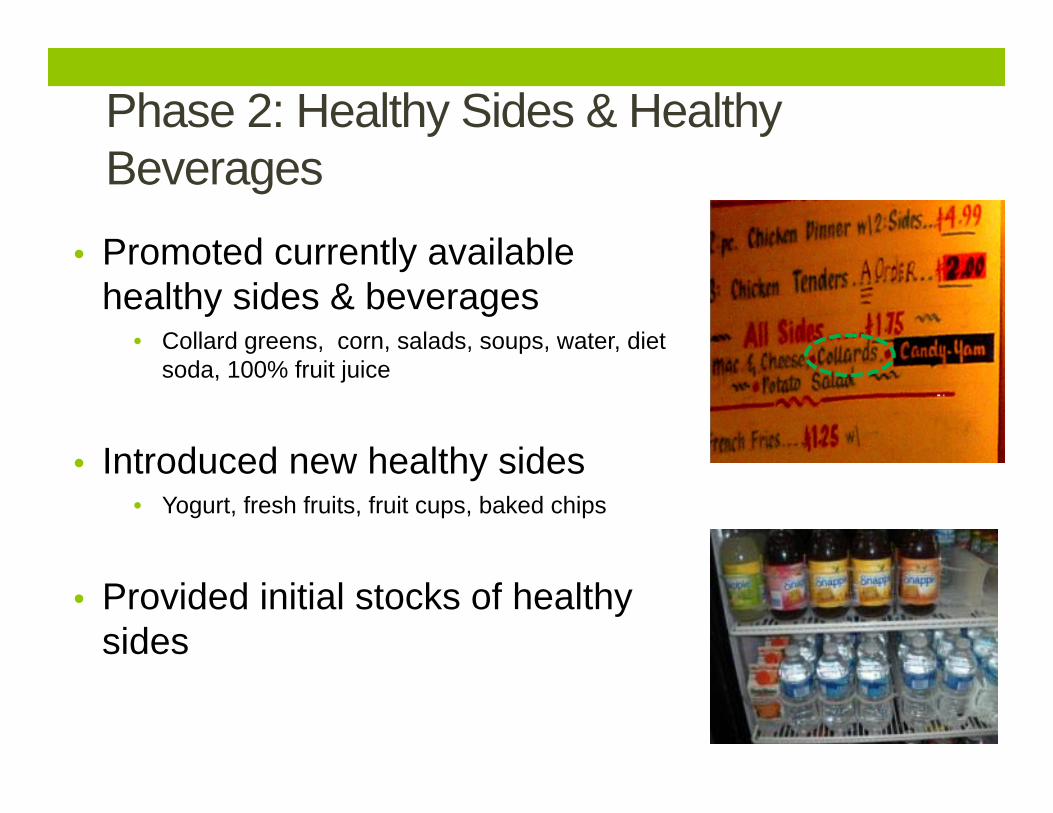
Phase 2: Healthy Sides & Healthy Beverages
• Promoted currently available healthy sides & beverages
• Collard greens, corn, salads, soups, water, diet soda, 100% fruit juice
• Introduced new healthy sides • Yogurt, fresh fruits, fruit cups, baked chips
• Provided initial stocks of healthy sides
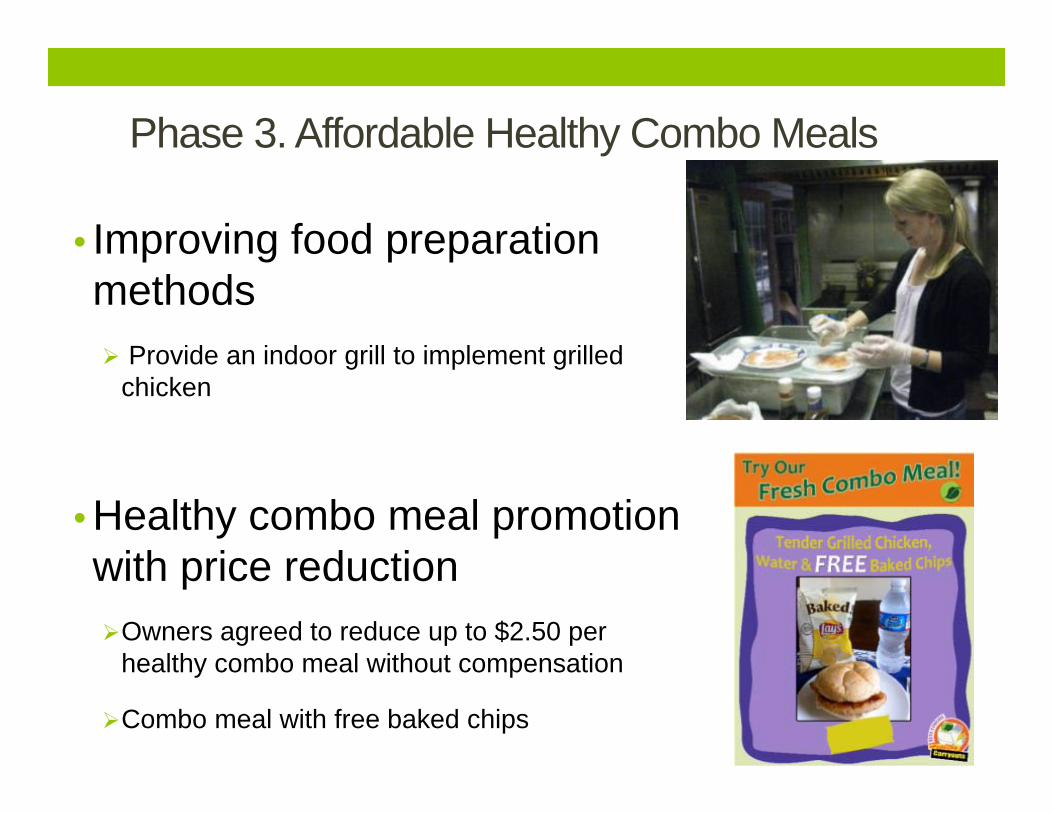
Phase 3. Affordable Healthy Combo Meals
• Improving food preparation methods Provide an indoor grill to implement grilled
chicken
• Healthy combo meal promotion with price reduction Owners agreed to reduce up to $2.50 per
healthy combo meal without compensation
Combo meal with free baked chips
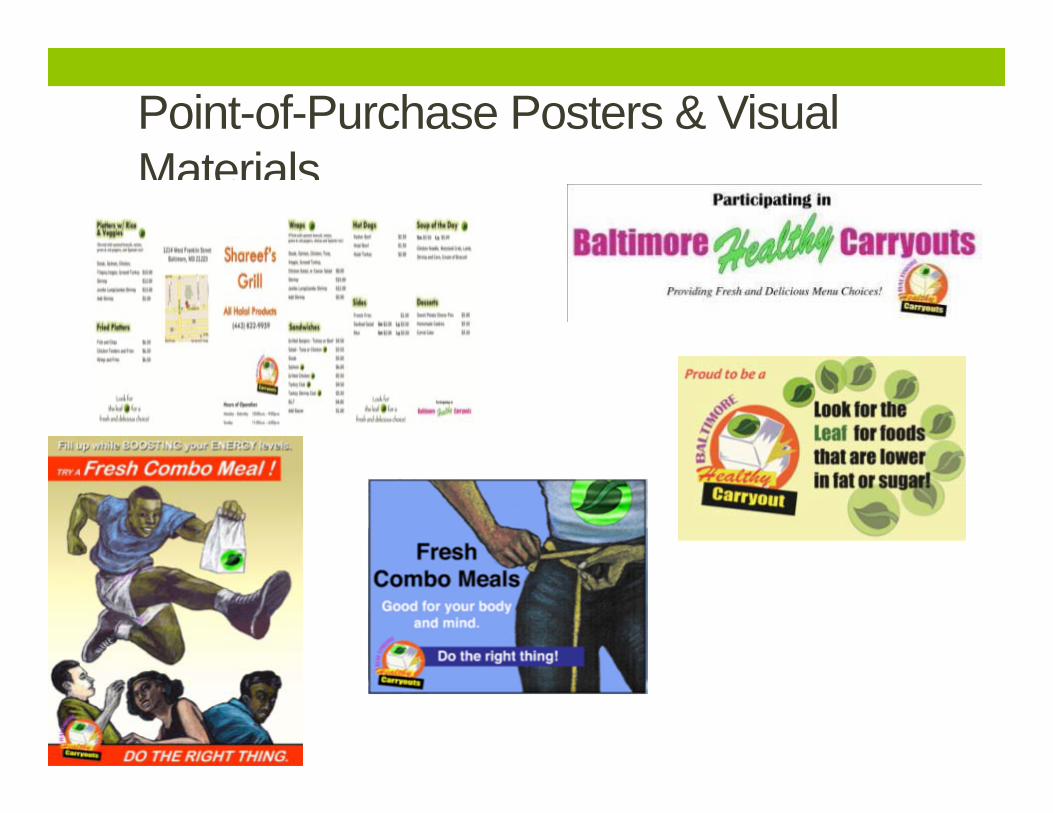
Point-of-Purchase Posters & Visual Materials
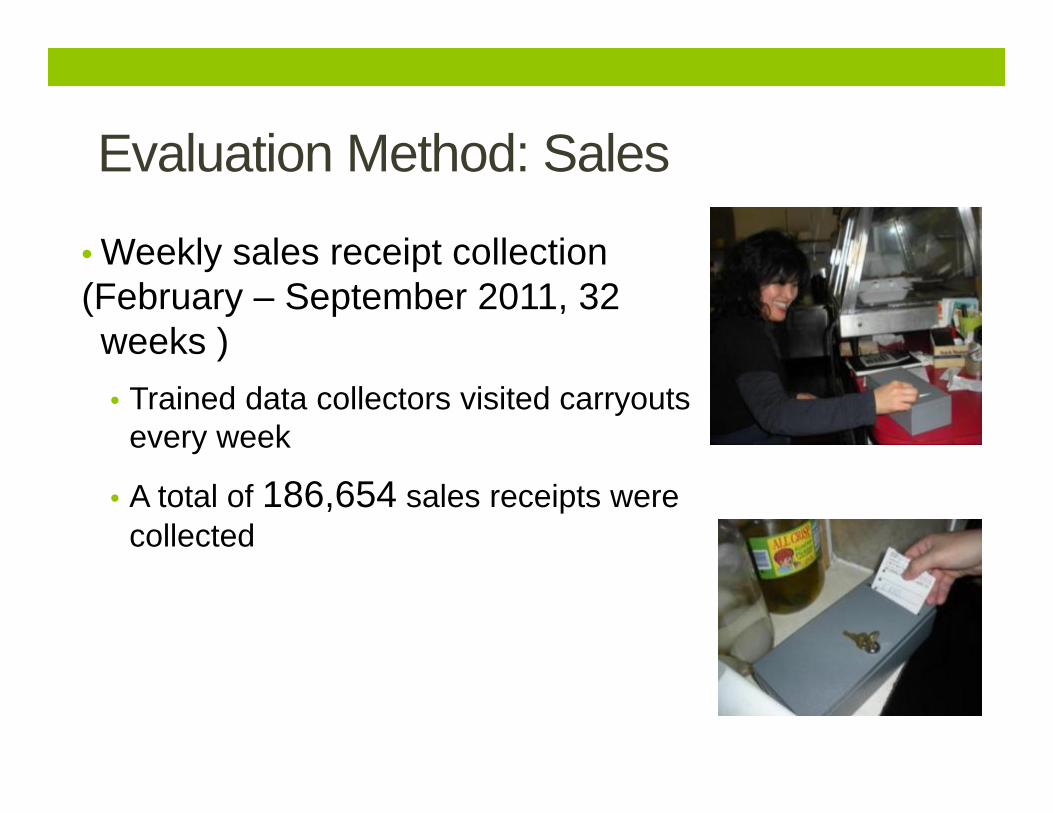
• Weekly sales receipt collection (February – September 2011, 32 weeks ) • Trained data collectors visited carryouts
every week
• A total of 186,654 sales receipts were collected
Evaluation Method: Sales
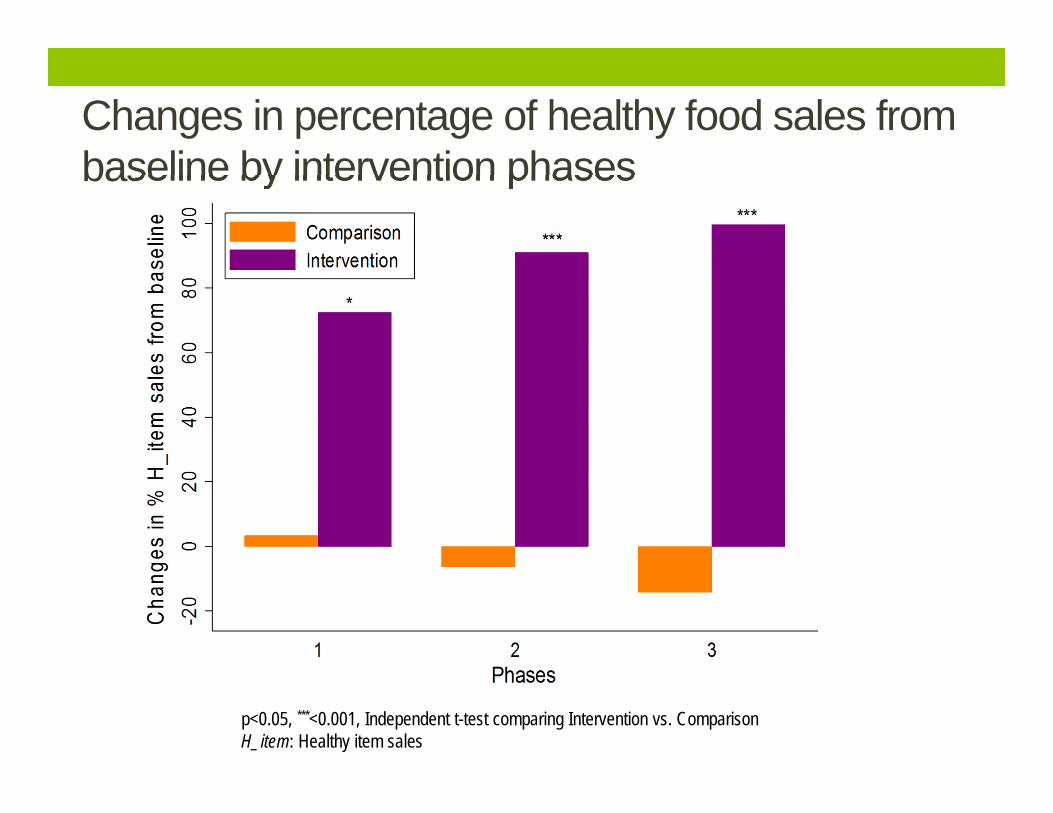
Changes in percentage of healthy food sales from baseline by intervention phases
p<0.05, ***<0.001, Independent t-test comparing Intervention vs. ComparisonH_item: Healthy item sales
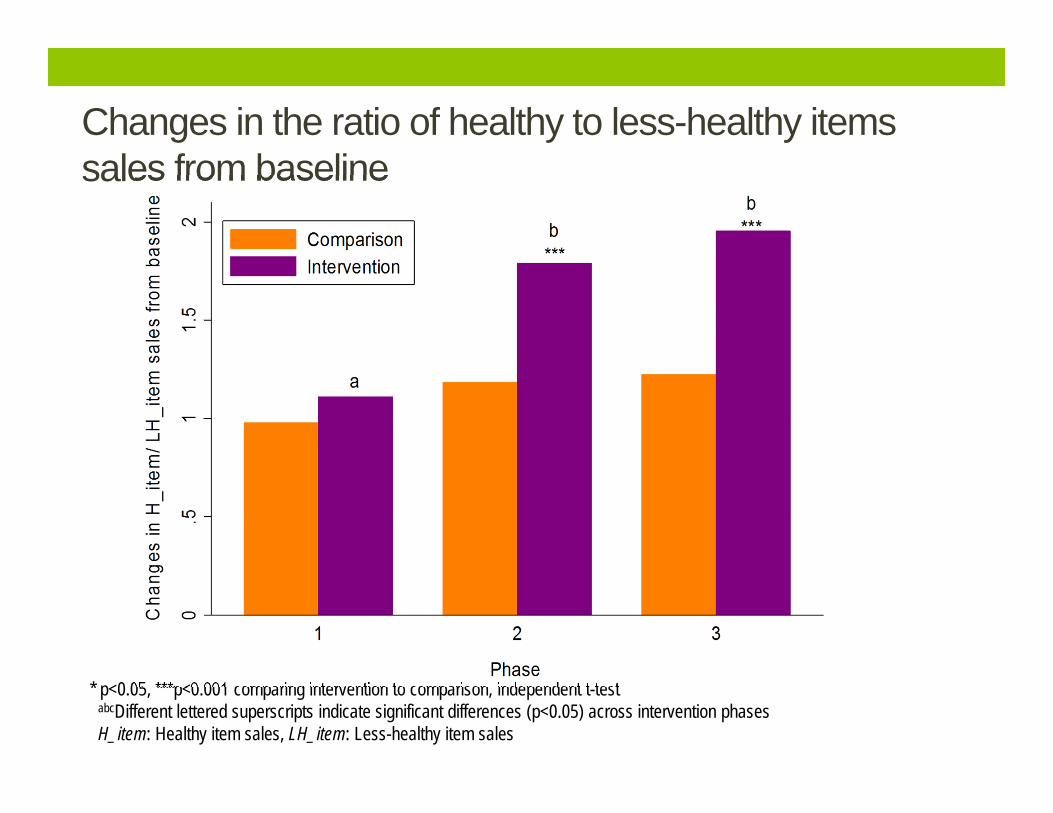
Changes in the ratio of healthy to less-healthy items sales from baseline
* p<0.05, ***p<0.001 comparing intervention to comparison, independent t-testabcDifferent lettered superscripts indicate significant differences (p<0.05) across intervention phases H_item: Healthy item sales, LH_item: Less-healthy item sales
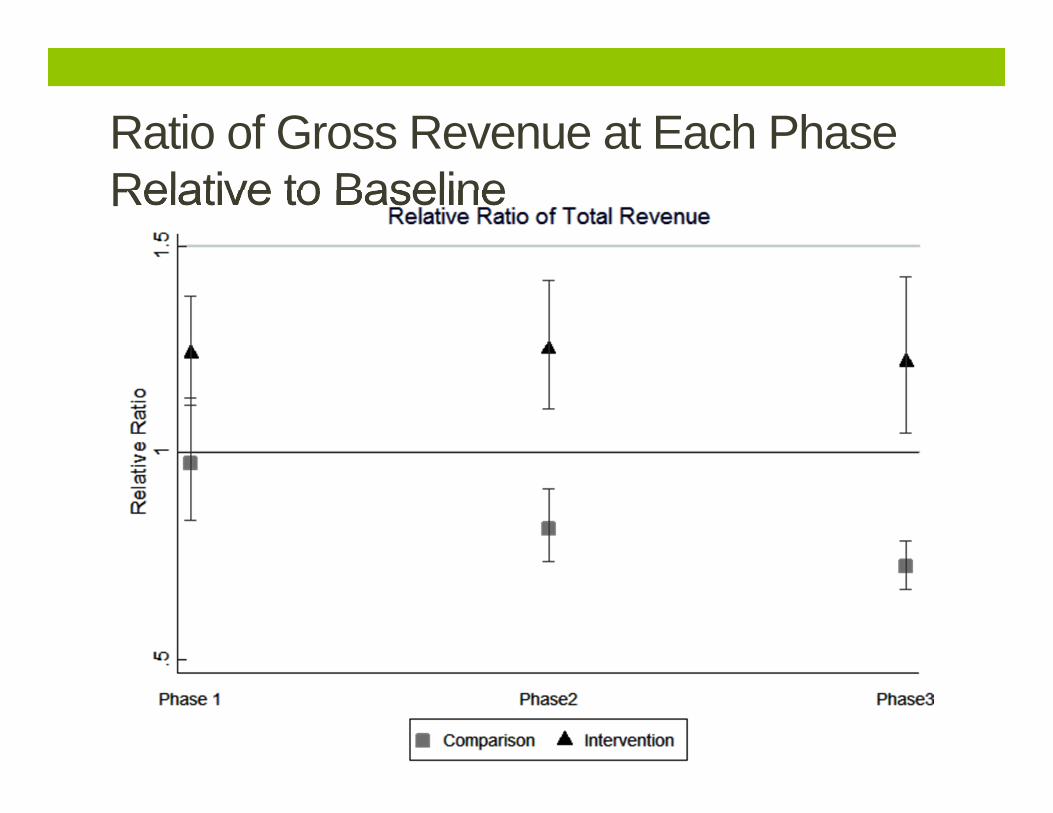
Ratio of Gross Revenue at Each Phase Relative to Baseline
Lessons Learned
• We can get small carryouts to change, and show impact on sales and consumer food choices
• Sustainability of carryout interventions possible in Baltimore
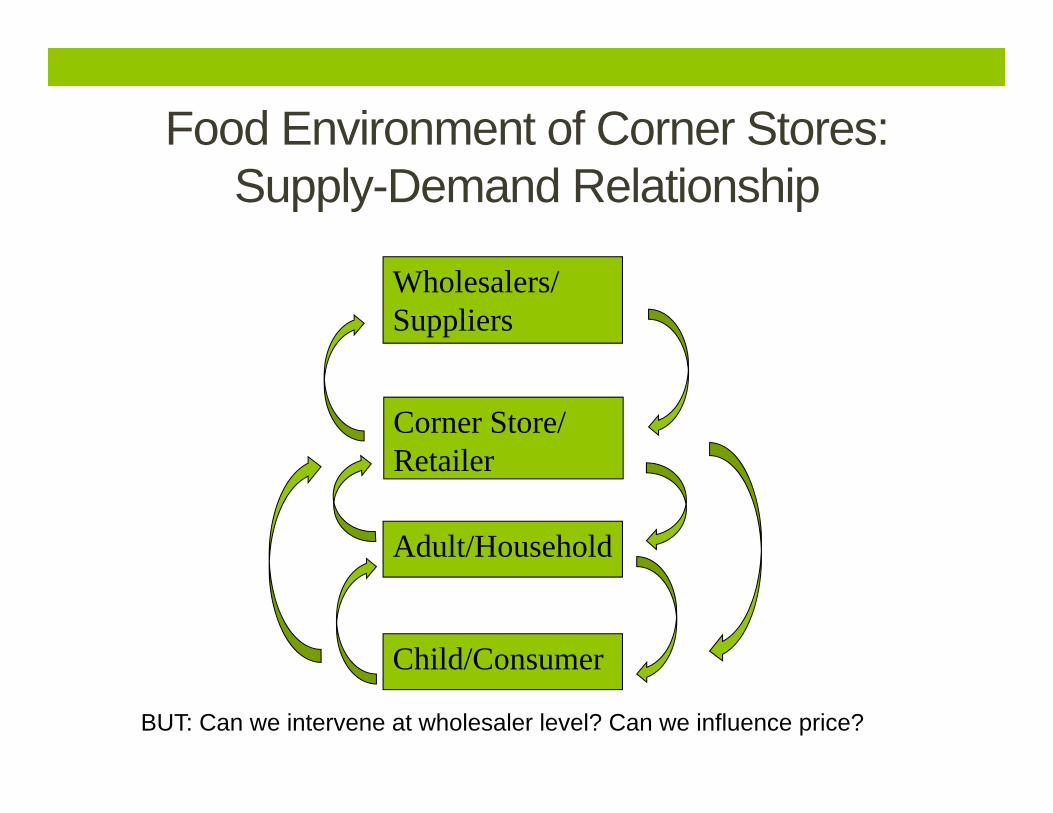
Food Environment of Corner Stores: Supply-Demand Relationship
Wholesalers/ Suppliers
Corner Store/ Retailer
Adult/Household
Child/Consumer
BUT: Can we intervene at wholesaler level? Can we influence price?
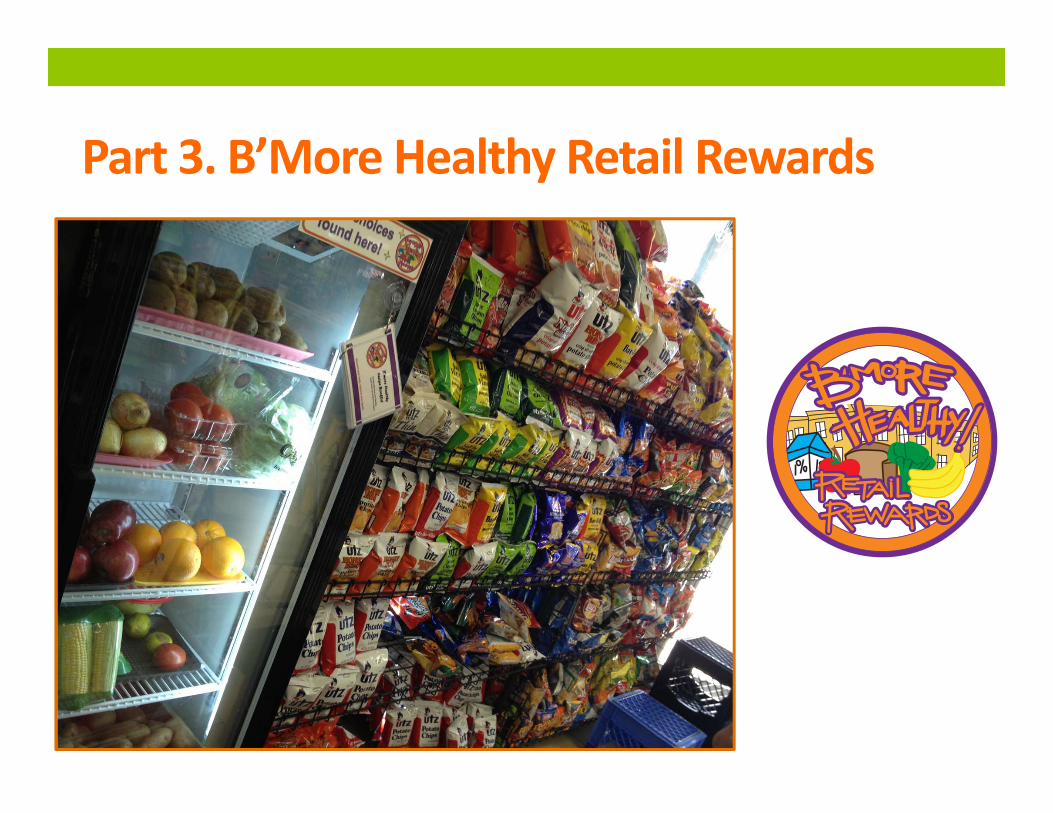
Part 3. B’More Healthy Retail Rewards
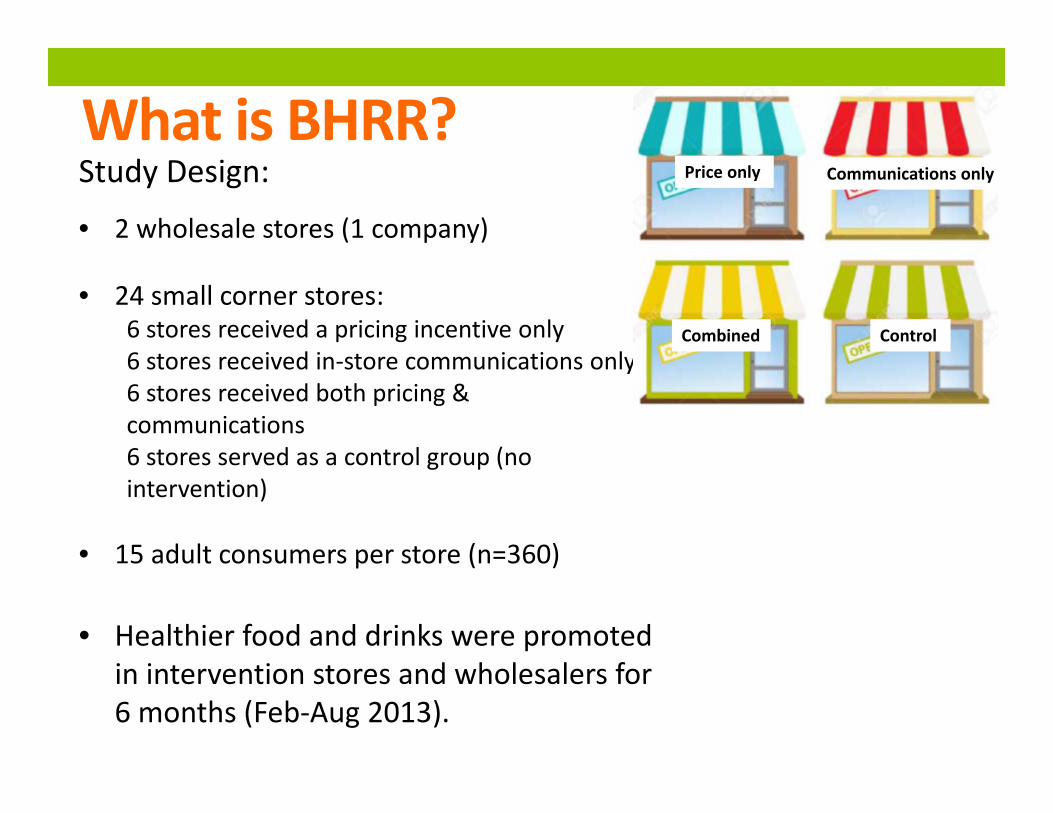
What is BHRR?Study Design:
• 2 wholesale stores (1 company)
• 24 small corner stores:6 stores received a pricing incentive only6 stores received in‐store communications only6 stores received both pricing & communications6 stores served as a control group (no intervention)
• 15 adult consumers per store (n=360)
• Healthier food and drinks were promoted in intervention stores and wholesalers for 6 months (Feb‐Aug 2013).
Price only Communications only
Combined Control
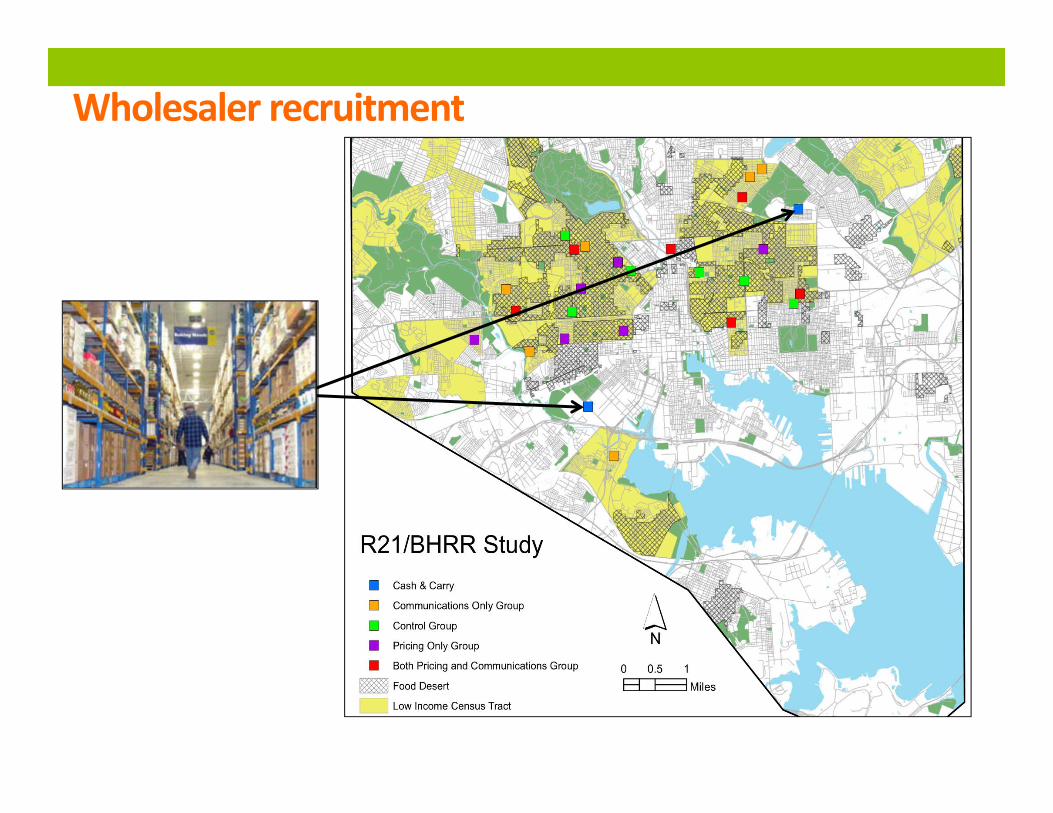
Wholesaler recruitment
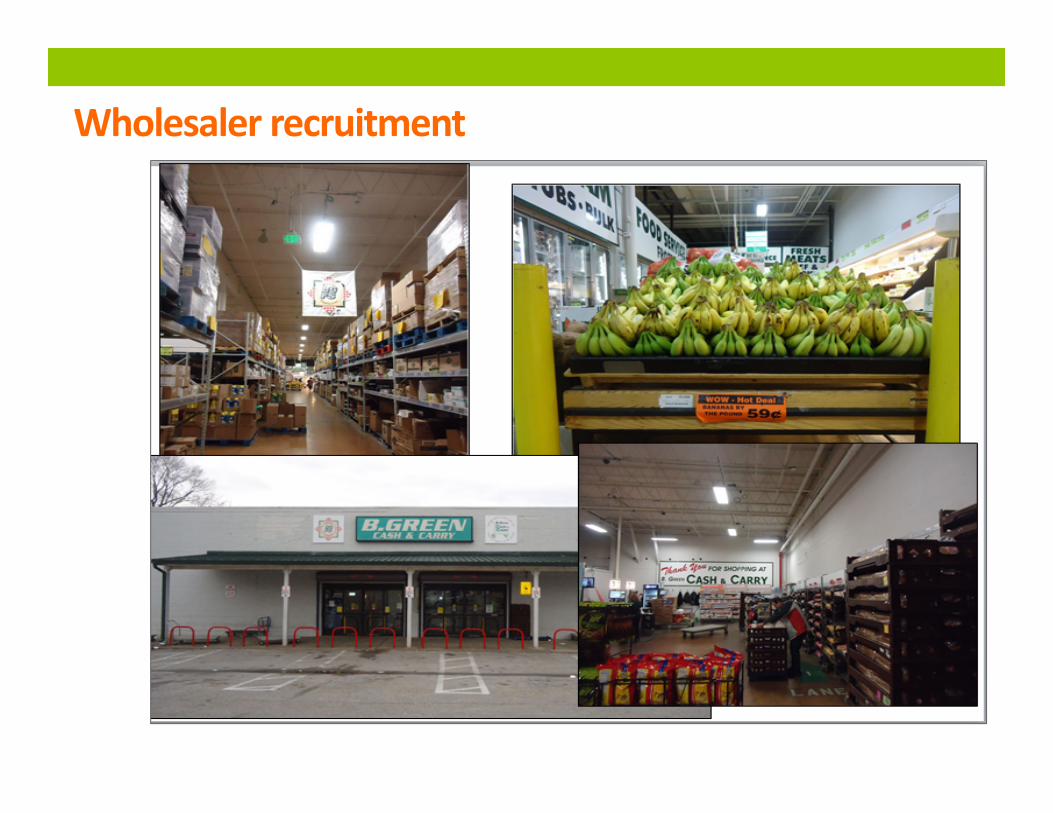
Wholesaler recruitment
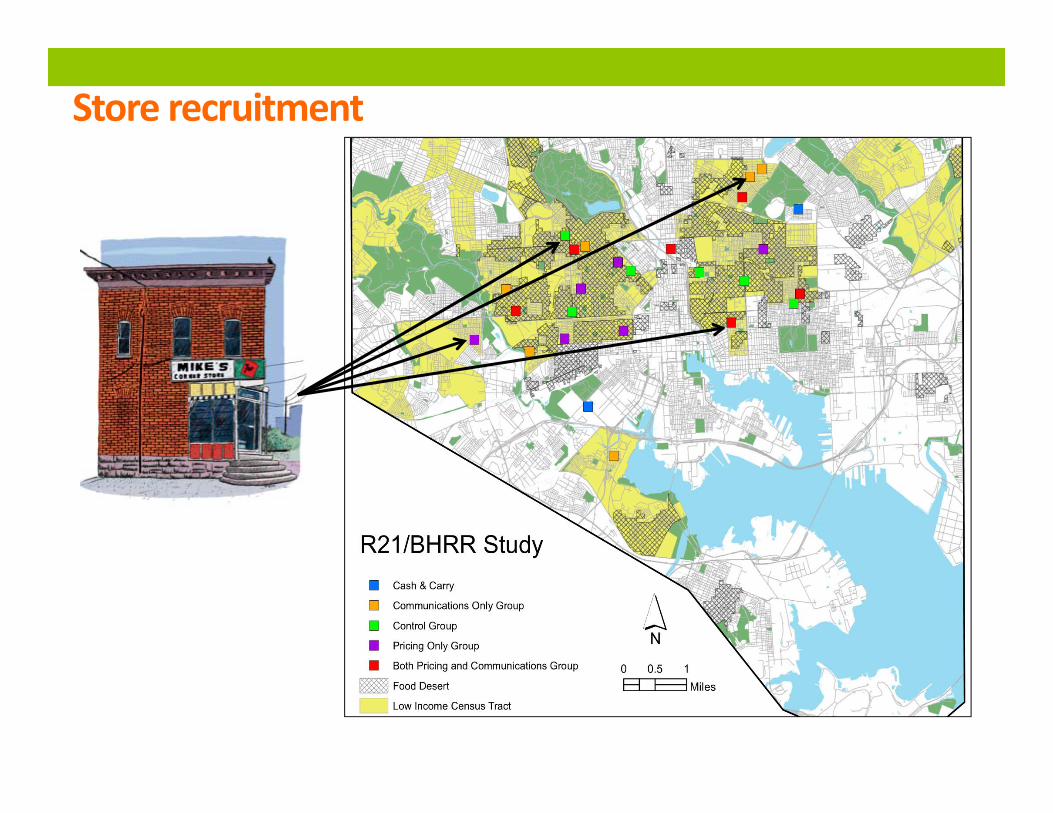
Store recruitment
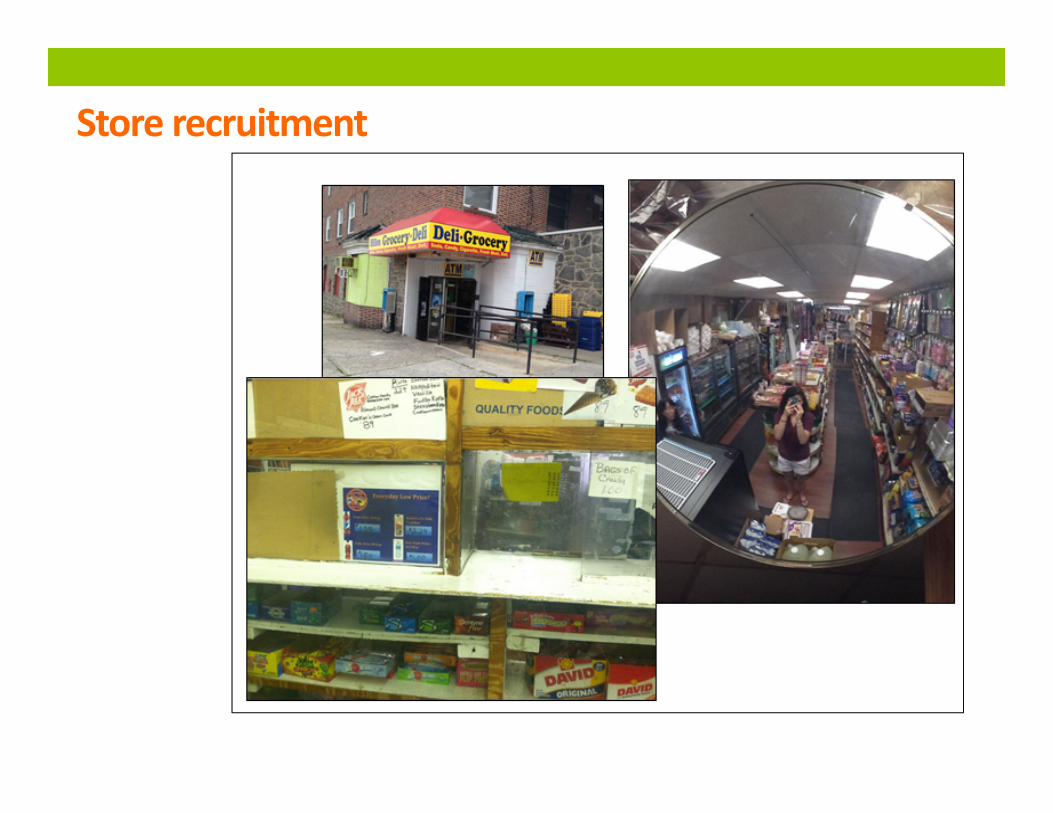
Store recruitment
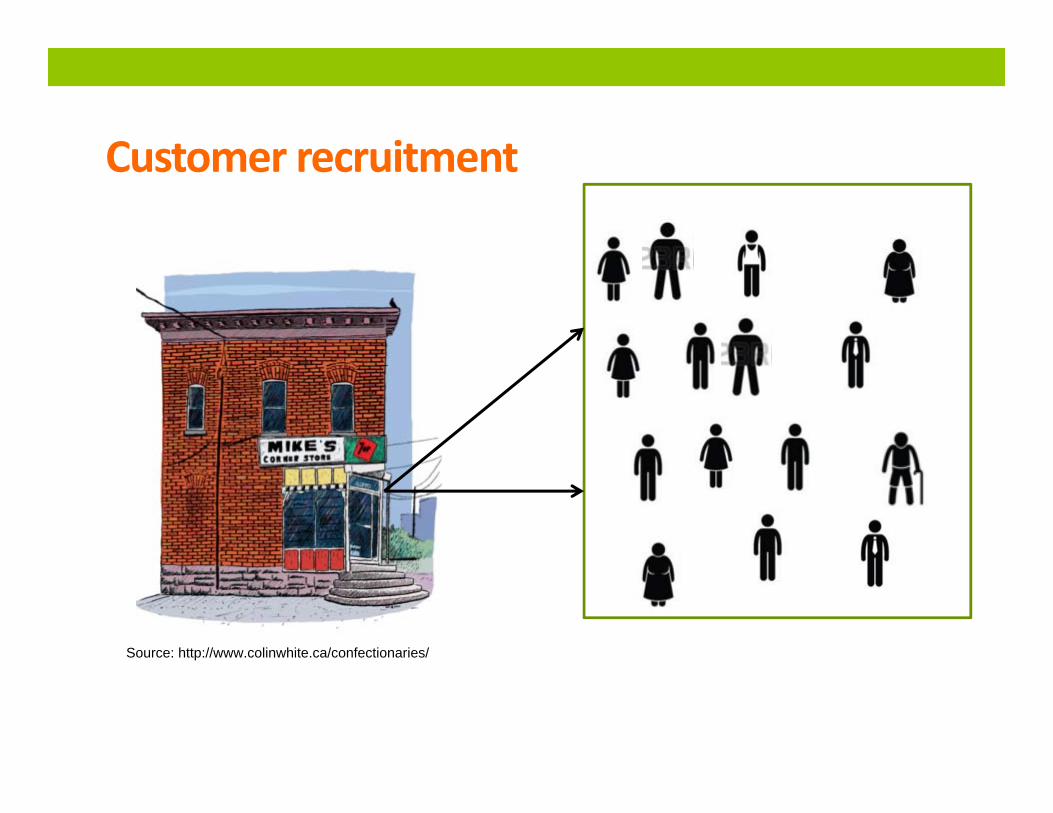
Customer recruitment
Source: http://www.colinwhite.ca/confectionaries/
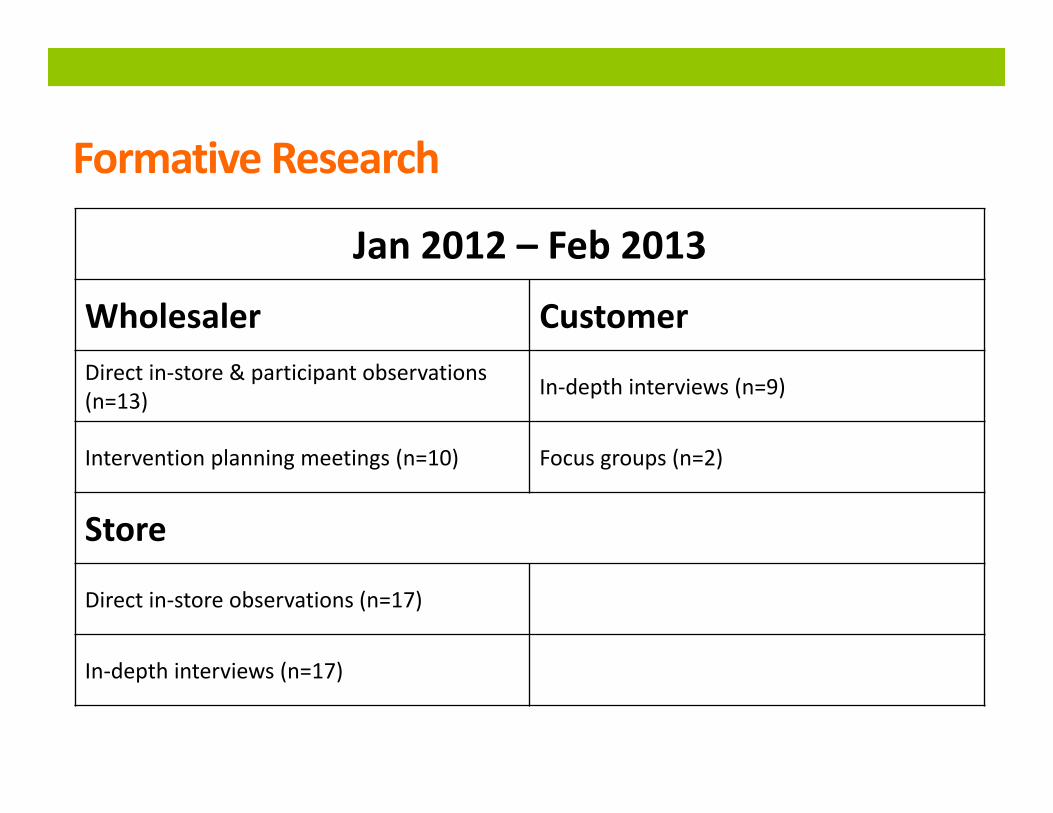
Formative Research
Jan 2012 – Feb 2013
Wholesaler CustomerDirect in‐store & participant observations (n=13) In‐depth interviews (n=9)
Intervention planning meetings (n=10) Focus groups (n=2)
Store
Direct in‐store observations (n=17)
In‐depth interviews (n=17)
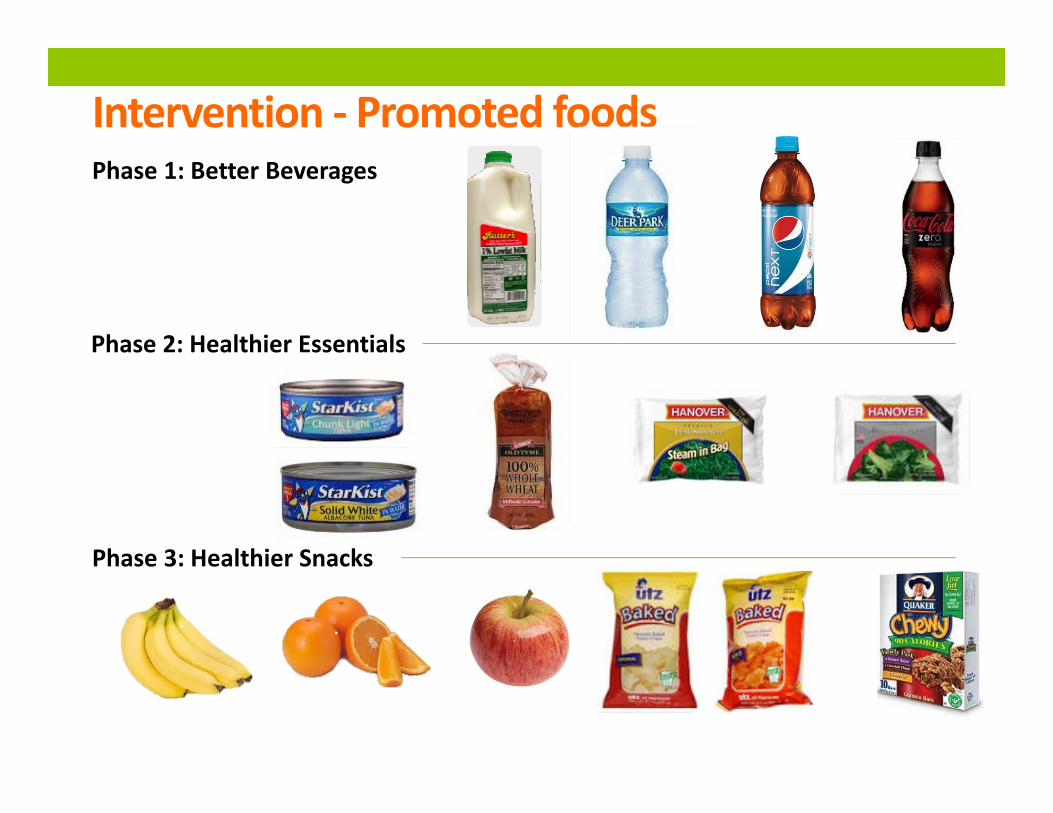
Intervention ‐ Promoted foodsPhase 1: Better Beverages
Phase 2: Healthier Essentials
Phase 3: Healthier Snacks
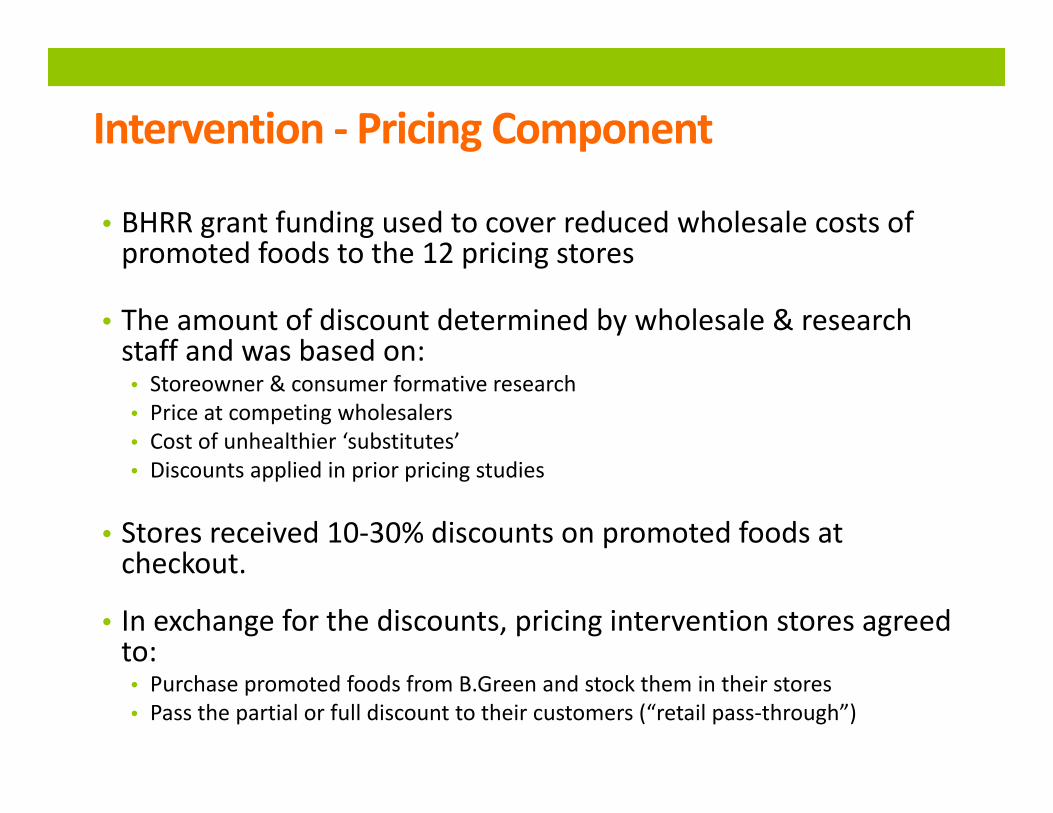
Intervention ‐ Pricing Component
• BHRR grant funding used to cover reduced wholesale costs of promoted foods to the 12 pricing stores
• The amount of discount determined by wholesale & research staff and was based on:• Storeowner & consumer formative research• Price at competing wholesalers• Cost of unhealthier ‘substitutes’• Discounts applied in prior pricing studies
• Stores received 10‐30% discounts on promoted foods at checkout.
• In exchange for the discounts, pricing intervention stores agreed to:• Purchase promoted foods from B.Green and stock them in their stores• Pass the partial or full discount to their customers (“retail pass‐through”)
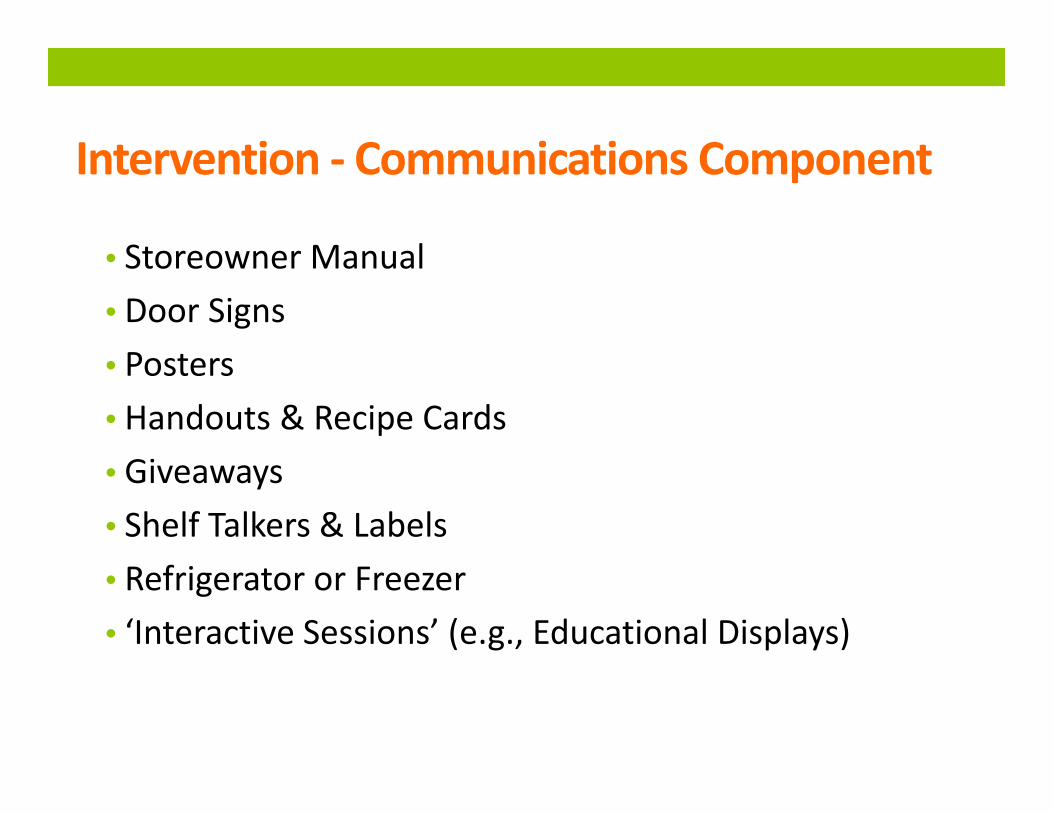
Intervention ‐ Communications Component
• Storeowner Manual• Door Signs• Posters• Handouts & Recipe Cards• Giveaways• Shelf Talkers & Labels• Refrigerator or Freezer• ‘Interactive Sessions’ (e.g., Educational Displays)
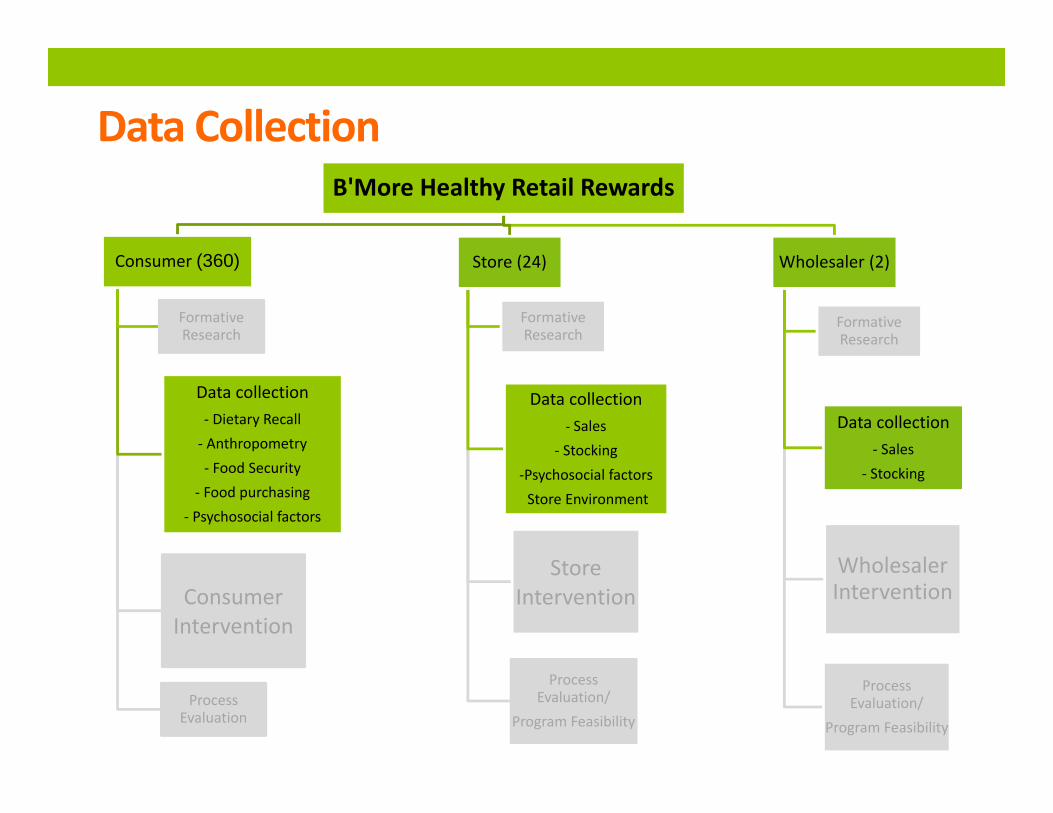
Data CollectionB'More Healthy Retail Rewards
Consumer (360)
Formative Research
Data collection ‐ Dietary Recall‐ Anthropometry‐ Food Security
‐ Food purchasing‐ Psychosocial factors
ConsumerIntervention
Process Evaluation
Store (24)
Formative Research
Data collection ‐ Sales
‐ Stocking‐Psychosocial factorsStore Environment
StoreIntervention
Process Evaluation/
Program Feasibility
Wholesaler (2)
Formative Research
Data collection ‐ Sales
‐ Stocking
Wholesaler Intervention
Process Evaluation/
Program Feasibility
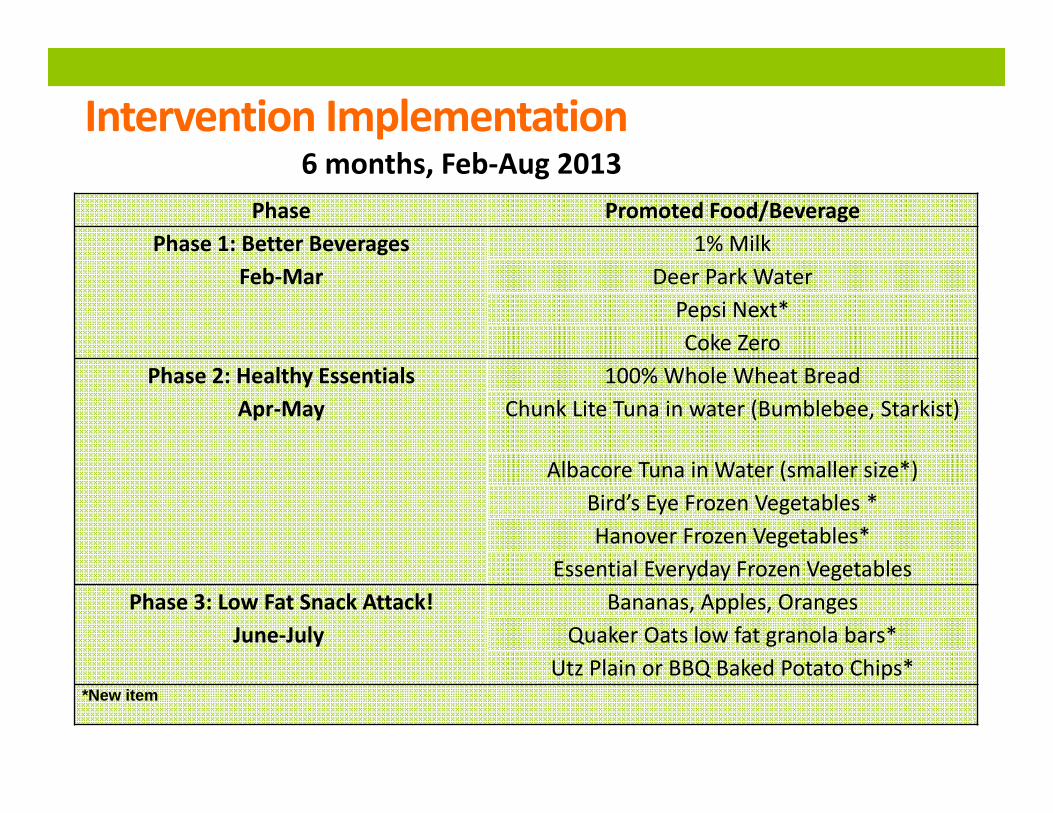
Intervention Implementation
Phase Promoted Food/BeveragePhase 1: Better Beverages
Feb‐Mar1% Milk
Deer Park WaterPepsi Next*Coke Zero
Phase 2: Healthy EssentialsApr‐May
100% Whole Wheat BreadChunk Lite Tuna in water (Bumblebee, Starkist)
Albacore Tuna in Water (smaller size*)Bird’s Eye Frozen Vegetables *Hanover Frozen Vegetables*
Essential Everyday Frozen VegetablesPhase 3: Low Fat Snack Attack!
June‐JulyBananas, Apples, Oranges
Quaker Oats low fat granola bars*Utz Plain or BBQ Baked Potato Chips*
*New item
6 months, Feb‐Aug 2013
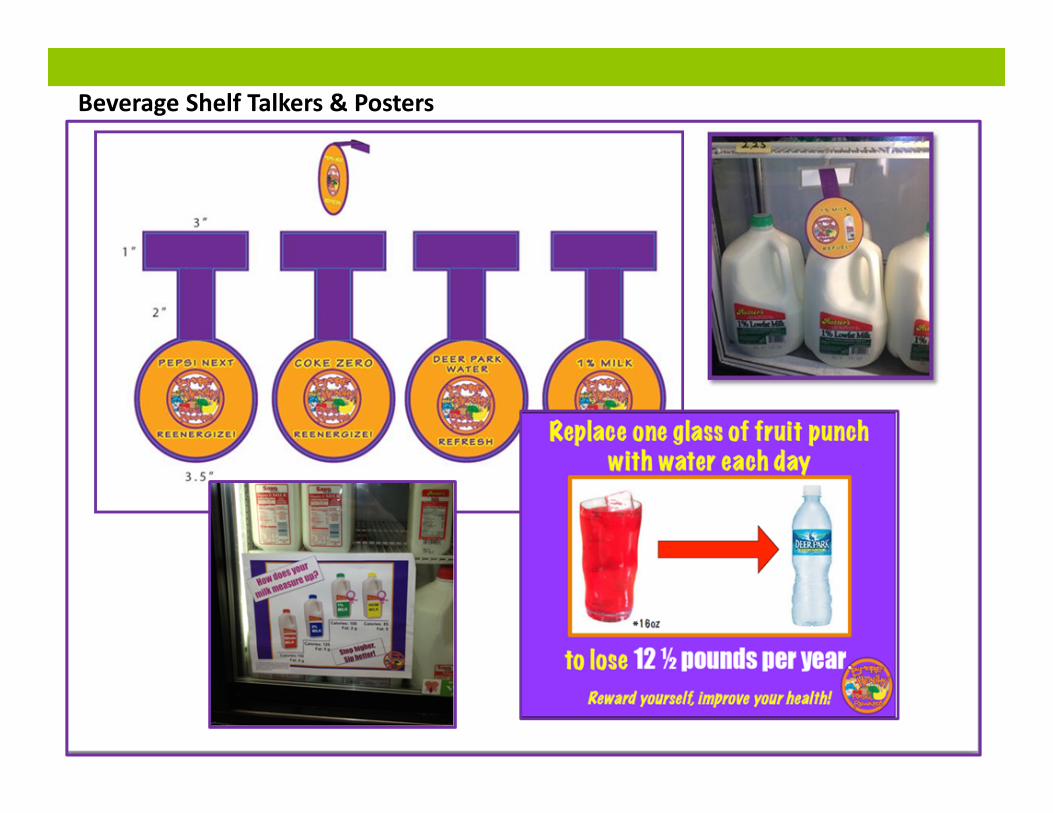
Beverage Shelf Talkers & Posters
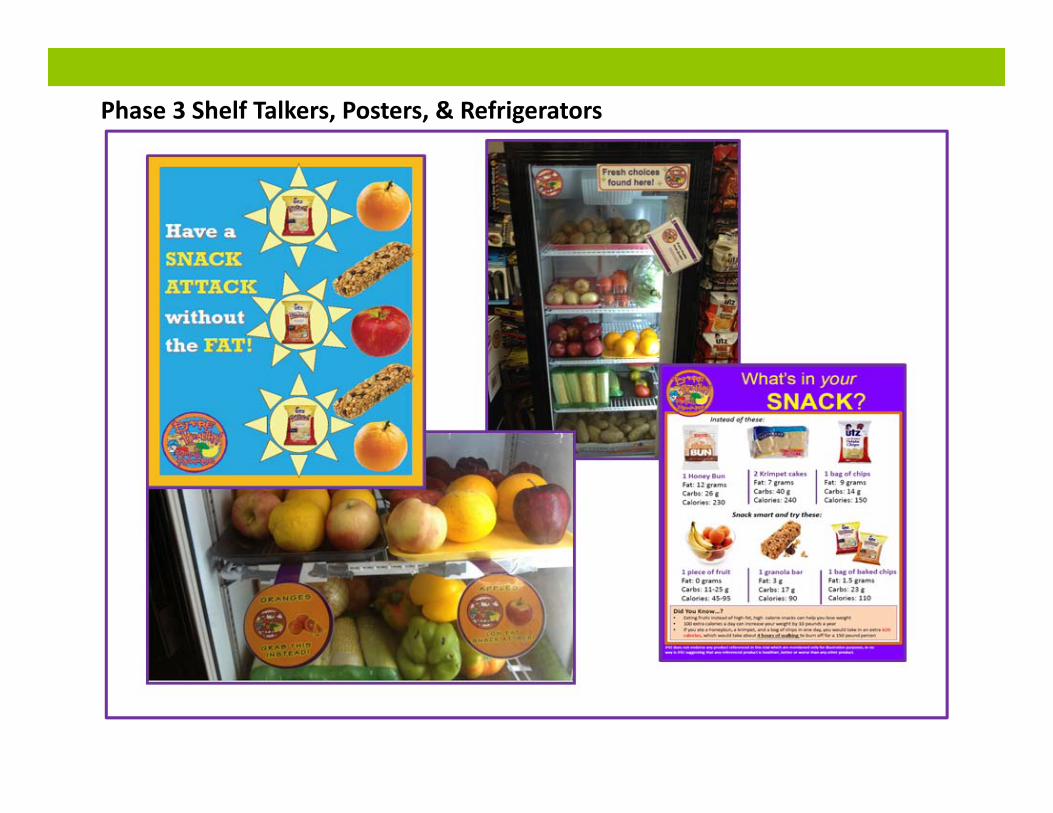
Phase 3 Shelf Talkers, Posters, & Refrigerators
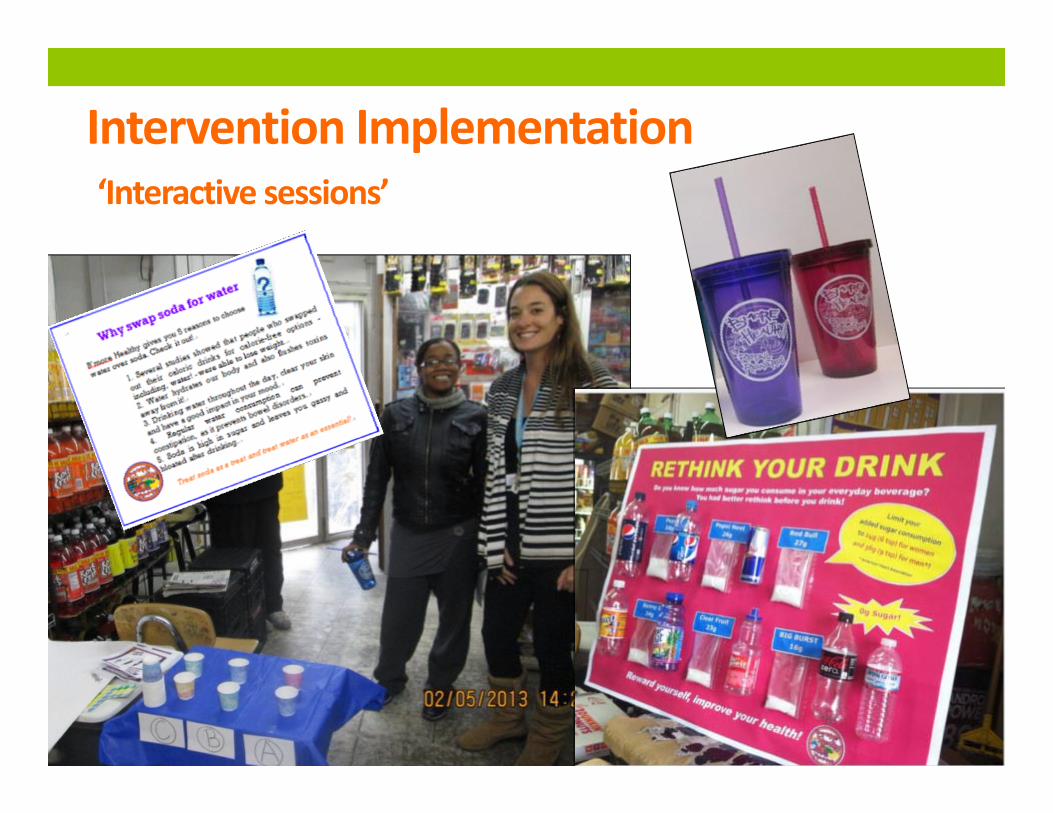
Intervention Implementation‘Interactive sessions’
Hypothesis 1
• H1: Intervention stores(owners) (n=18) would demonstrate significantly greater change (increase) in promoted food stocking, sales, and psychosocial factor scores compared to control stores from baseline to post‐intervention.
Combined, P, C > Control
Hypothesis 2
• H2: Combined intervention stores(owners) (n=6) would see the greatest change (increase) compared to single intervention stores and control from baseline to post‐intervention.
Combined > P, C, Control
Research Question
• Did pricing intervention storeowners (n=12) comply with the agreements of the performance‐based allowance (stocking the item and retail pass‐through)?
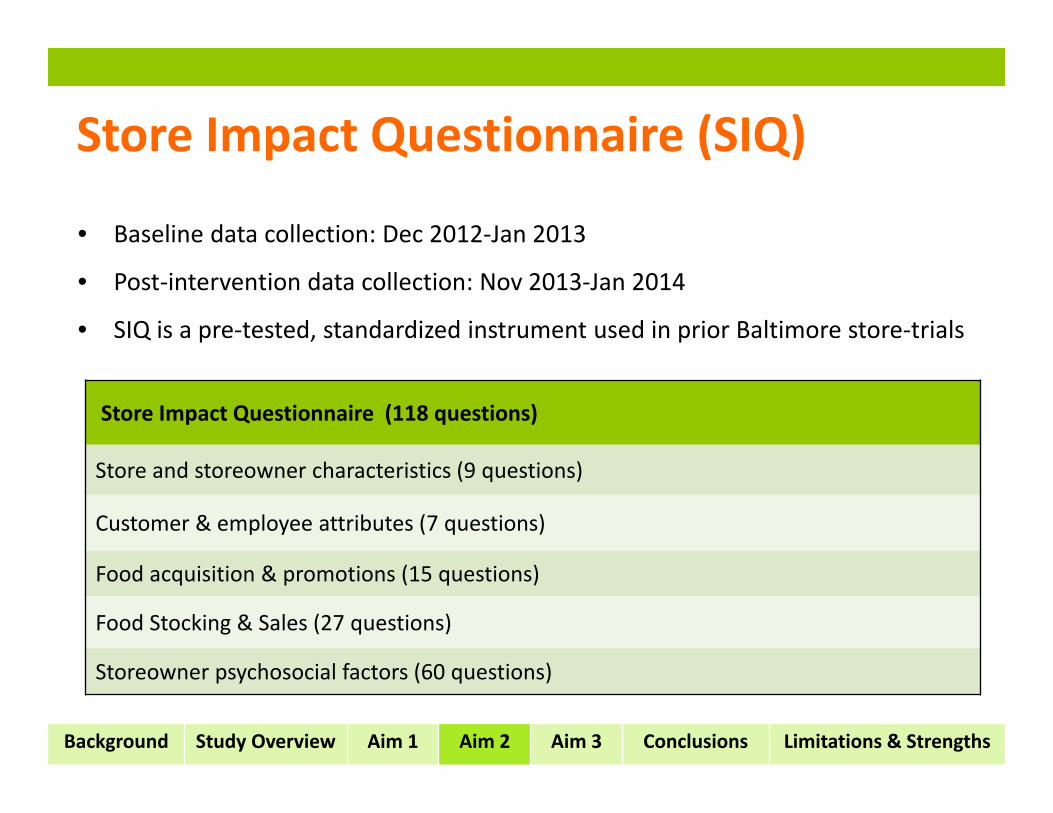
Store Impact Questionnaire (118 questions)
Store and storeowner characteristics (9 questions)
Customer & employee attributes (7 questions)
Food acquisition & promotions (15 questions)
Food Stocking & Sales (27 questions)
Storeowner psychosocial factors (60 questions)
Store Impact Questionnaire (SIQ)
• Baseline data collection: Dec 2012‐Jan 2013
• Post‐intervention data collection: Nov 2013‐Jan 2014
• SIQ is a pre‐tested, standardized instrument used in prior Baltimore store‐trials
Background Study Overview Aim 1 Aim 2 Aim 3 Conclusions Limitations & Strengths
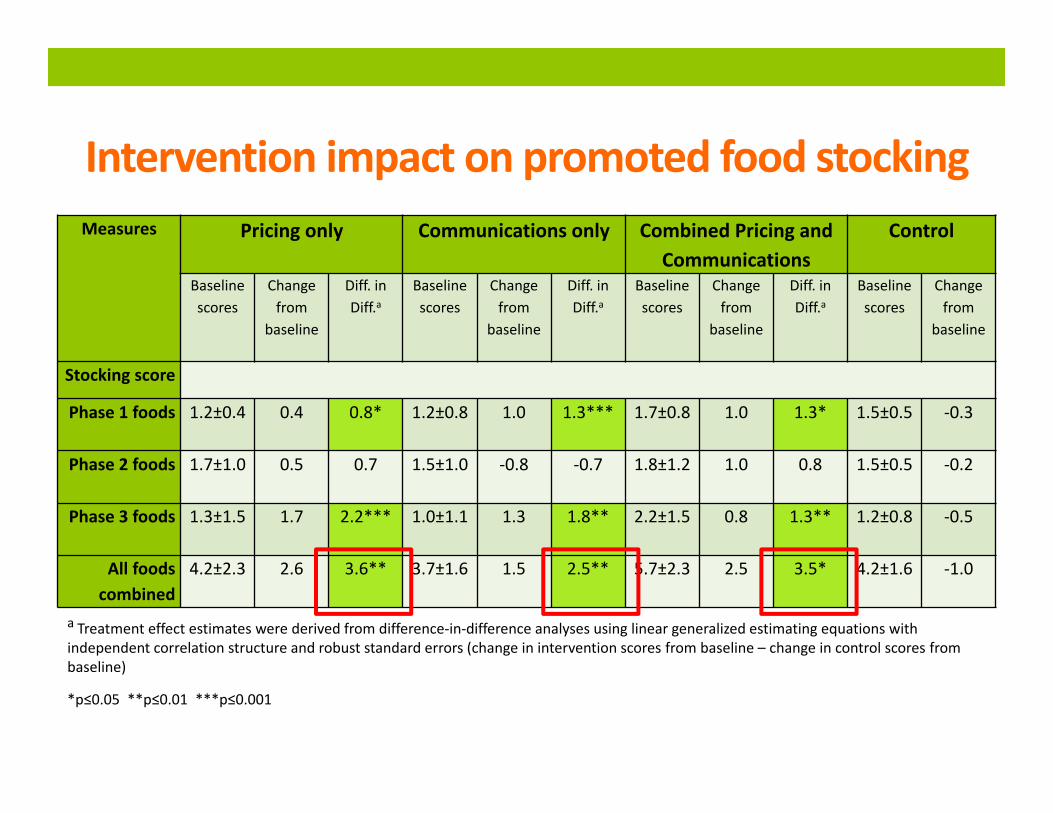
Intervention impact on promoted food stockingMeasures Pricing only Communications only Combined Pricing and
CommunicationsControl
Baseline scores
Change from
baseline
Diff. in Diff.a
Baseline scores
Change from
baseline
Diff. in Diff.a
Baseline scores
Change from
baseline
Diff. in Diff.a
Baseline scores
Change from
baseline
Stocking score
Phase 1 foods 1.2±0.4 0.4 0.8* 1.2±0.8 1.0 1.3*** 1.7±0.8 1.0 1.3* 1.5±0.5 ‐0.3
Phase 2 foods 1.7±1.0 0.5 0.7 1.5±1.0 ‐0.8 ‐0.7 1.8±1.2 1.0 0.8 1.5±0.5 ‐0.2
Phase 3 foods 1.3±1.5 1.7 2.2*** 1.0±1.1 1.3 1.8** 2.2±1.5 0.8 1.3** 1.2±0.8 ‐0.5
All foods combined
4.2±2.3 2.6 3.6** 3.7±1.6 1.5 2.5** 5.7±2.3 2.5 3.5* 4.2±1.6 ‐1.0
a Treatment effect estimates were derived from difference‐in‐difference analyses using linear generalized estimating equations with independent correlation structure and robust standard errors (change in intervention scores from baseline – change in control scores from baseline)
*p≤0.05 **p≤0.01 ***p≤0.001
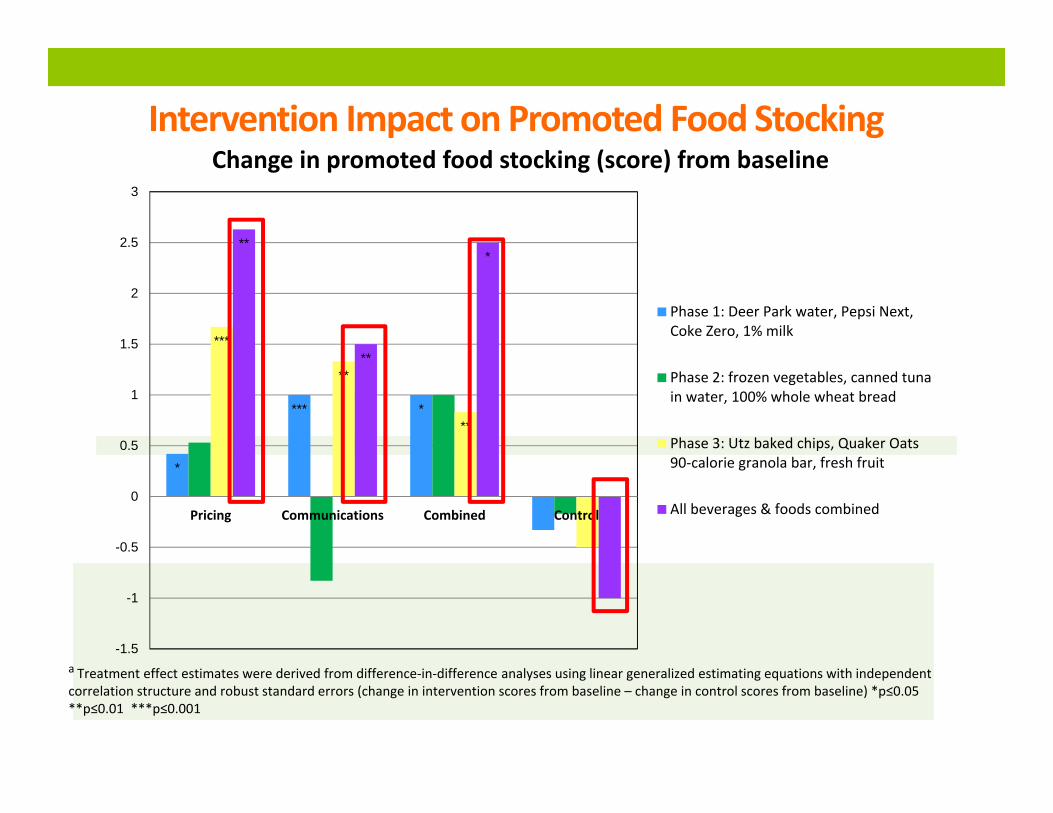
Intervention Impact on Promoted Food Stocking
a Treatment effect estimates were derived from difference‐in‐difference analyses using linear generalized estimating equations with independent correlation structure and robust standard errors (change in intervention scores from baseline – change in control scores from baseline) *p≤0.05 **p≤0.01 ***p≤0.001
*
*** *
***
**
**
**
**
*
-1.5
-1
-0.5
0
0.5
1
1.5
2
2.5
3
Pricing Communications Combined Control
Change in promoted food stocking (score) from baseline
Phase 1: Deer Park water, Pepsi Next,Coke Zero, 1% milk
Phase 2: frozen vegetables, canned tunain water, 100% whole wheat bread
Phase 3: Utz baked chips, Quaker Oats90‐calorie granola bar, fresh fruit
All beverages & foods combined
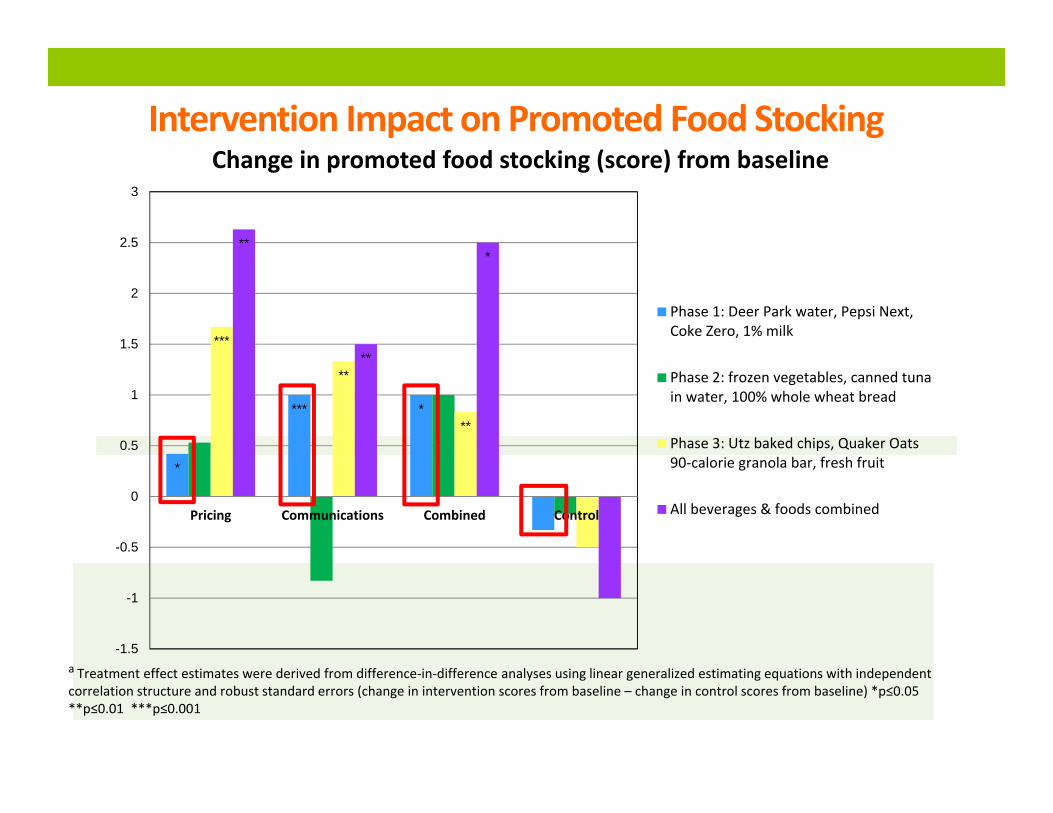
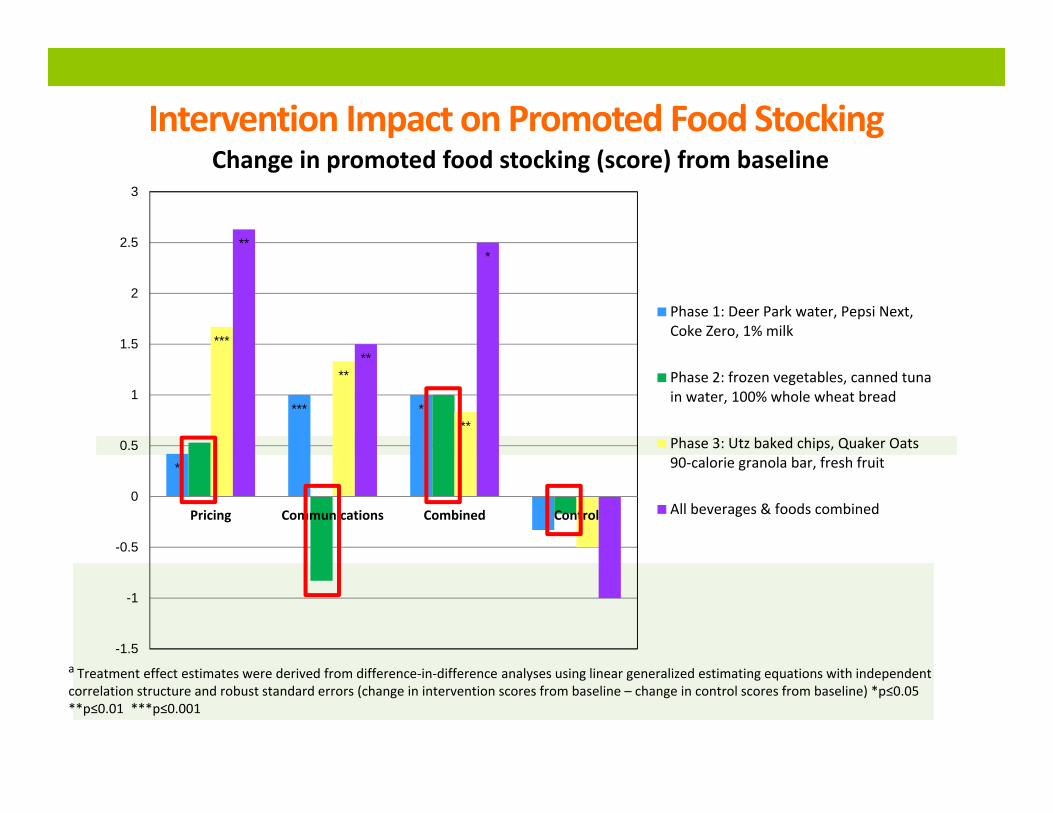
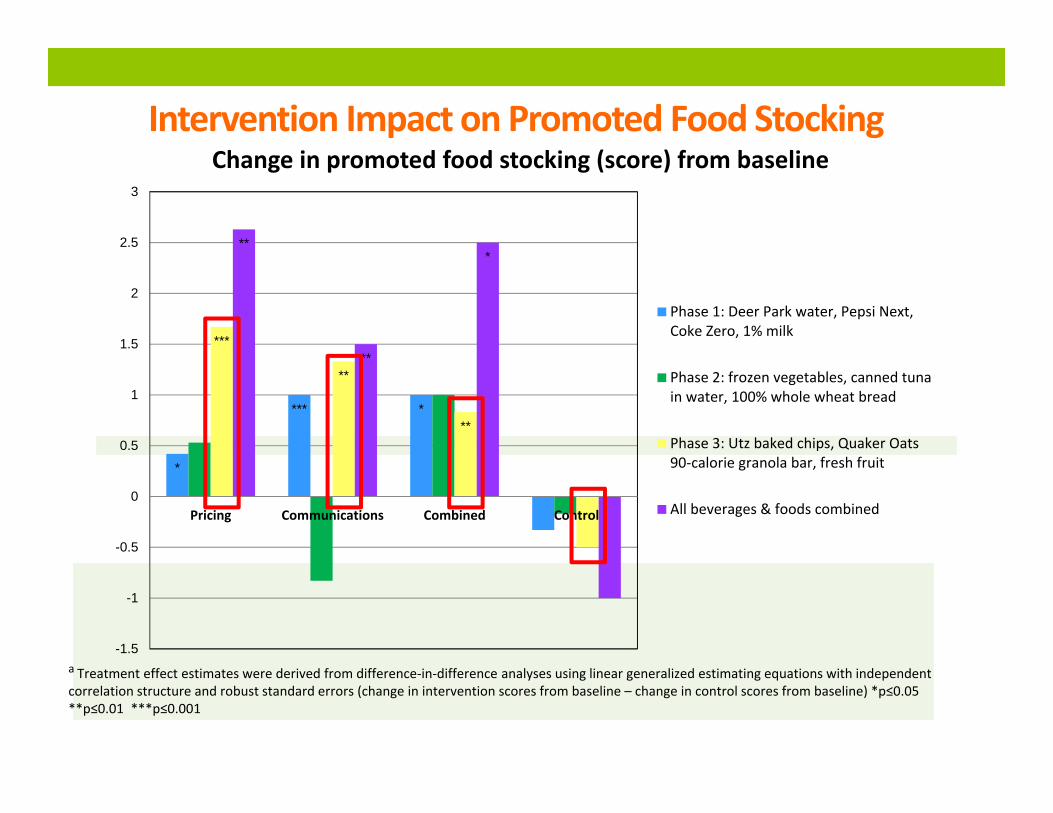
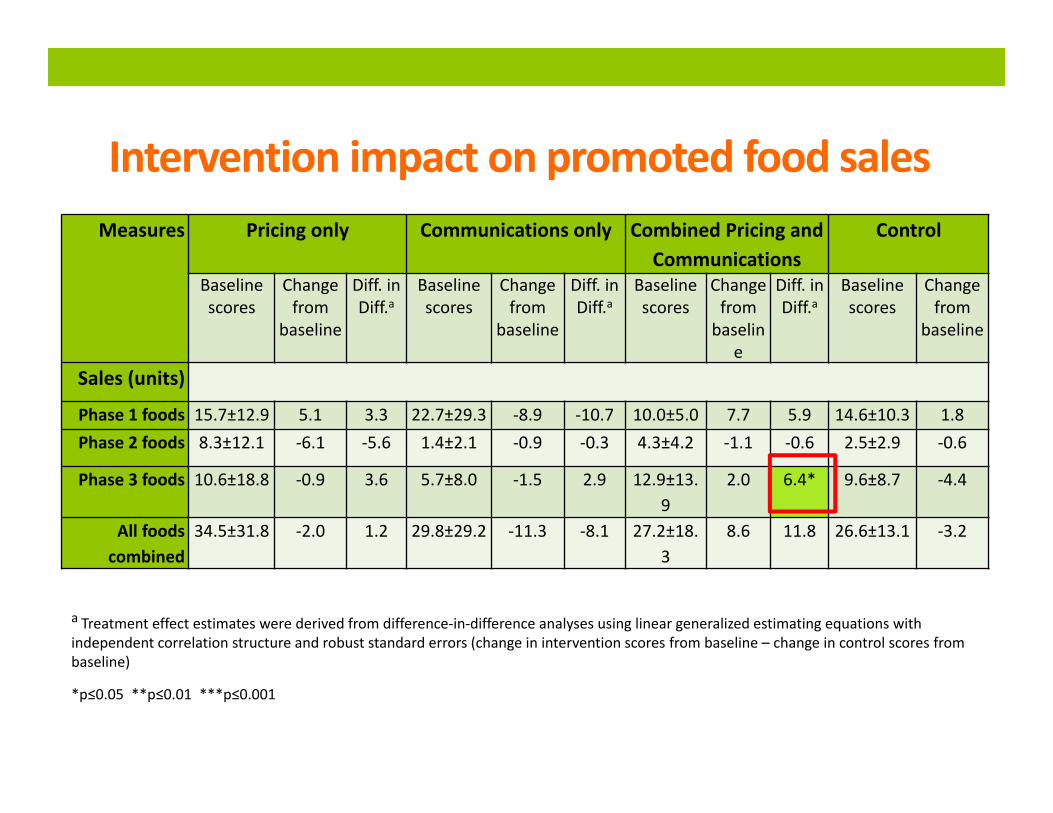
Intervention impact on promoted food salesMeasures Pricing only Communications only Combined Pricing and
CommunicationsControl
Baseline scores
Change from
baseline
Diff. in Diff.a
Baseline scores
Change from
baseline
Diff. in Diff.a
Baseline scores
Change from baselin
e
Diff. in Diff.a
Baseline scores
Change from
baseline
Sales (units)
Phase 1 foods 15.7±12.9 5.1 3.3 22.7±29.3 ‐8.9 ‐10.7 10.0±5.0 7.7 5.9 14.6±10.3 1.8Phase 2 foods 8.3±12.1 ‐6.1 ‐5.6 1.4±2.1 ‐0.9 ‐0.3 4.3±4.2 ‐1.1 ‐0.6 2.5±2.9 ‐0.6
Phase 3 foods 10.6±18.8 ‐0.9 3.6 5.7±8.0 ‐1.5 2.9 12.9±13.9
2.0 6.4* 9.6±8.7 ‐4.4
All foods combined
34.5±31.8 ‐2.0 1.2 29.8±29.2 ‐11.3 ‐8.1 27.2±18.3
8.6 11.8 26.6±13.1 ‐3.2
a Treatment effect estimates were derived from difference‐in‐difference analyses using linear generalized estimating equations with independent correlation structure and robust standard errors (change in intervention scores from baseline – change in control scores from baseline)
*p≤0.05 **p≤0.01 ***p≤0.001
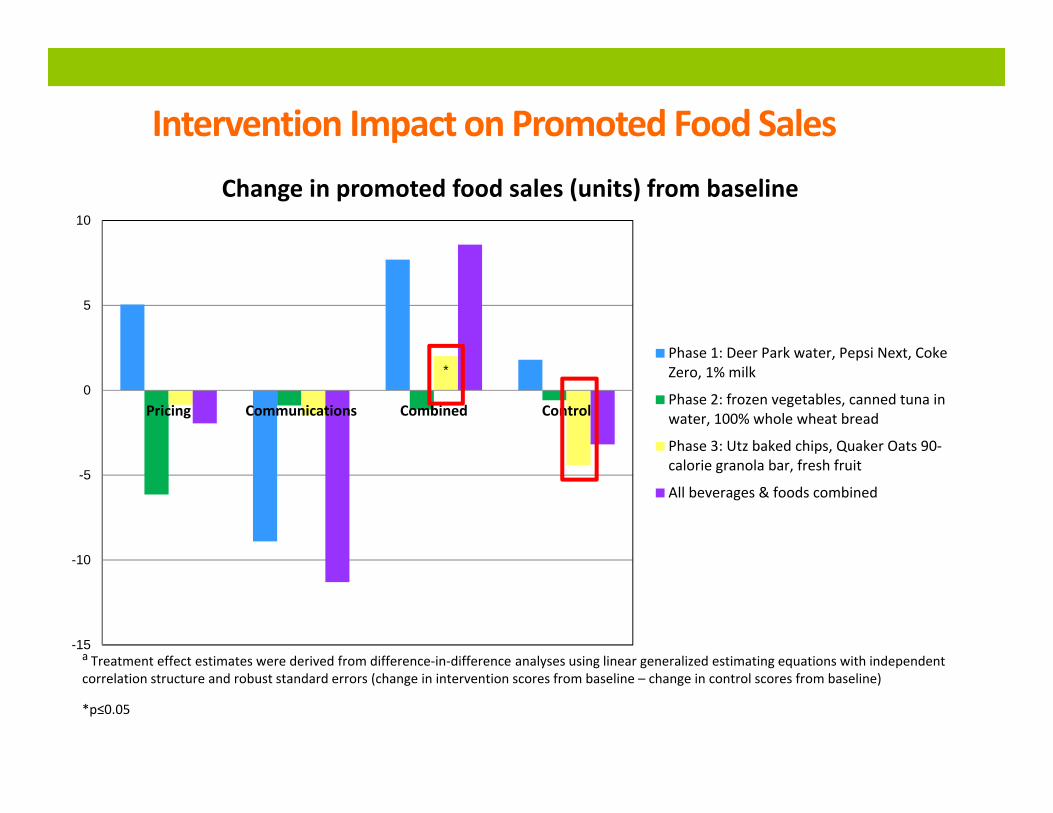
Intervention Impact on Promoted Food Sales
a Treatment effect estimates were derived from difference‐in‐difference analyses using linear generalized estimating equations with independent correlation structure and robust standard errors (change in intervention scores from baseline – change in control scores from baseline)
*p≤0.05
*
-15
-10
-5
0
5
10
Pricing Communications Combined Control
Change in promoted food sales (units) from baseline
Phase 1: Deer Park water, Pepsi Next, CokeZero, 1% milk
Phase 2: frozen vegetables, canned tuna inwater, 100% whole wheat bread
Phase 3: Utz baked chips, Quaker Oats 90‐calorie granola bar, fresh fruit
All beverages & foods combined
Evidence of ‘retail pass‐through’• Research question: Did pricing intervention storeowners (n=12) comply with the agreements of the performance‐based allowance?
Two requirements:1. stocking the item2. retail pass‐through
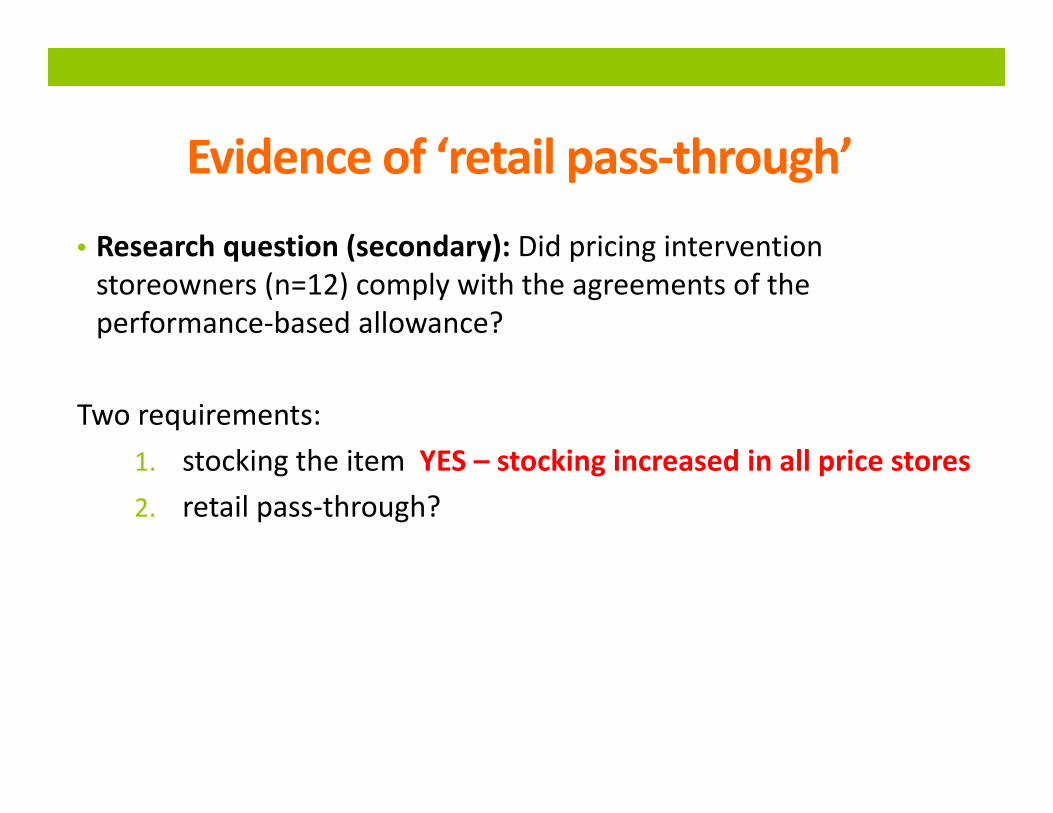
Evidence of ‘retail pass‐through’• Research question (secondary): Did pricing intervention storeowners (n=12) comply with the agreements of the performance‐based allowance?
Two requirements:1. stocking the item YES – stocking increased in all price stores
Evidence of ‘retail pass‐through’• Research question (secondary): Did pricing intervention storeowners (n=12) comply with the agreements of the performance‐based allowance?
Two requirements:1. stocking the item YES – stocking increased in all price stores2. retail pass‐through?
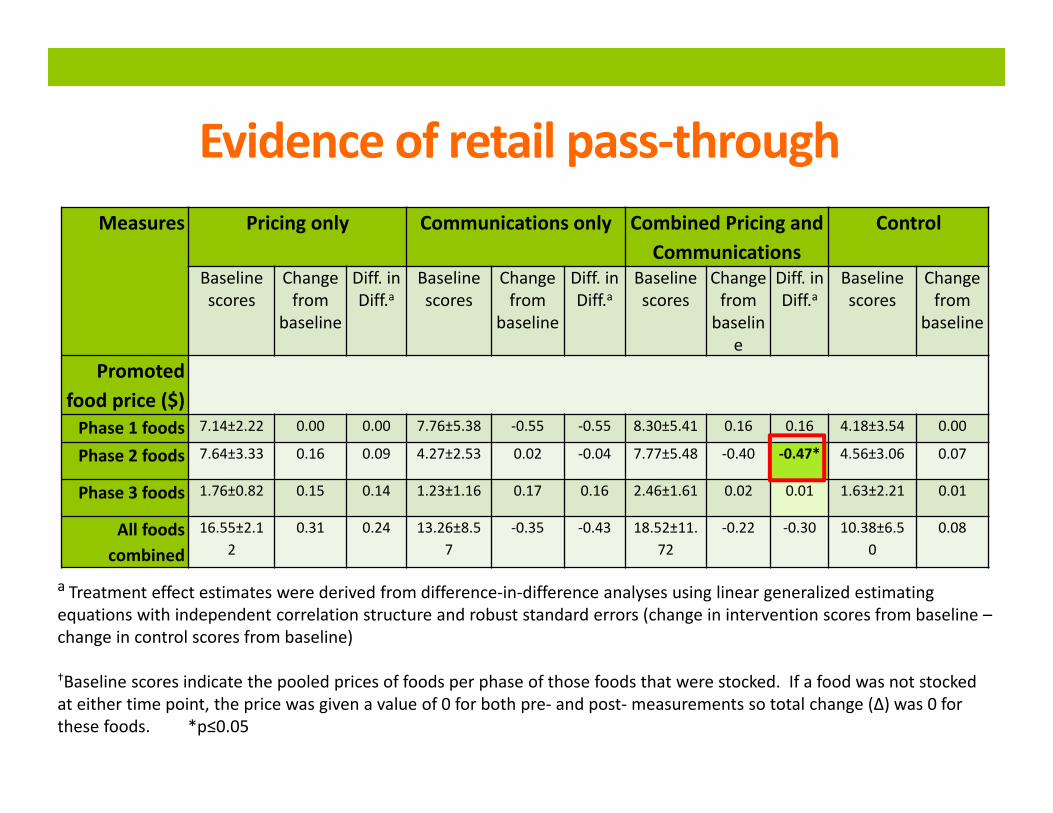
Evidence of retail pass‐throughMeasures Pricing only Communications only Combined Pricing and
CommunicationsControl
Baseline scores
Change from
baseline
Diff. in Diff.a
Baseline scores
Change from
baseline
Diff. in Diff.a
Baseline scores
Change from baselin
e
Diff. in Diff.a
Baseline scores
Change from
baseline
Promoted food price ($)Phase 1 foods 7.14±2.22 0.00 0.00 7.76±5.38 ‐0.55 ‐0.55 8.30±5.41 0.16 0.16 4.18±3.54 0.00
Phase 2 foods 7.64±3.33 0.16 0.09 4.27±2.53 0.02 ‐0.04 7.77±5.48 ‐0.40 ‐0.47* 4.56±3.06 0.07
Phase 3 foods 1.76±0.82 0.15 0.14 1.23±1.16 0.17 0.16 2.46±1.61 0.02 0.01 1.63±2.21 0.01
All foods combined
16.55±2.12
0.31 0.24 13.26±8.57
‐0.35 ‐0.43 18.52±11.72
‐0.22 ‐0.30 10.38±6.50
0.08
a Treatment effect estimates were derived from difference‐in‐difference analyses using linear generalized estimating equations with independent correlation structure and robust standard errors (change in intervention scores from baseline –change in control scores from baseline)
†Baseline scores indicate the pooled prices of foods per phase of those foods that were stocked. If a food was not stocked at either time point, the price was given a value of 0 for both pre‐ and post‐measurements so total change (Δ) was 0 for these foods. *p≤0.05
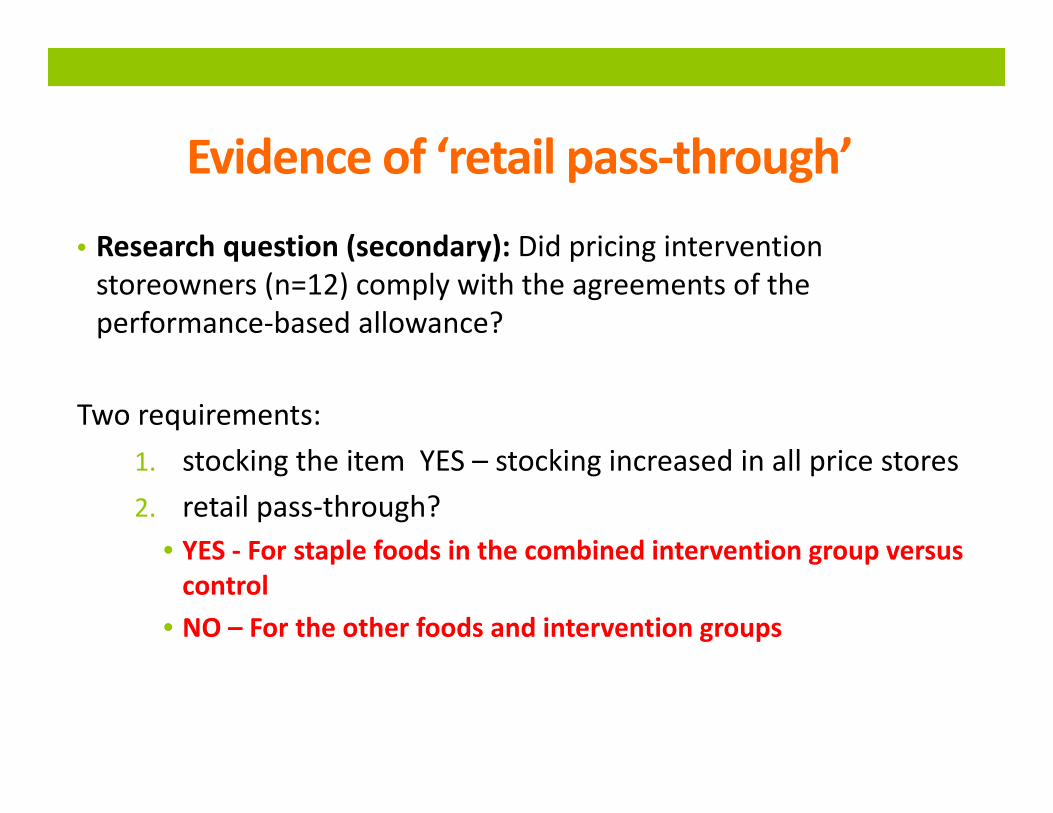
Evidence of ‘retail pass‐through’• Research question (secondary): Did pricing intervention storeowners (n=12) comply with the agreements of the performance‐based allowance?
Two requirements:1. stocking the item YES – stocking increased in all price stores2. retail pass‐through?
• YES ‐ For staple foods in the combined intervention group versus control
• NO – For the other foods and intervention groups
BHRR Summary
• All intervention groups saw significant increases in stocking of promoted foods compared to control.
• Statistically significant increases were found for healthier snack food sales in the combined intervention group compared to control.
• The increase in total snack sales was seen despite a lack of evidence of retail pass‐through to customers in the combined group compared to control.
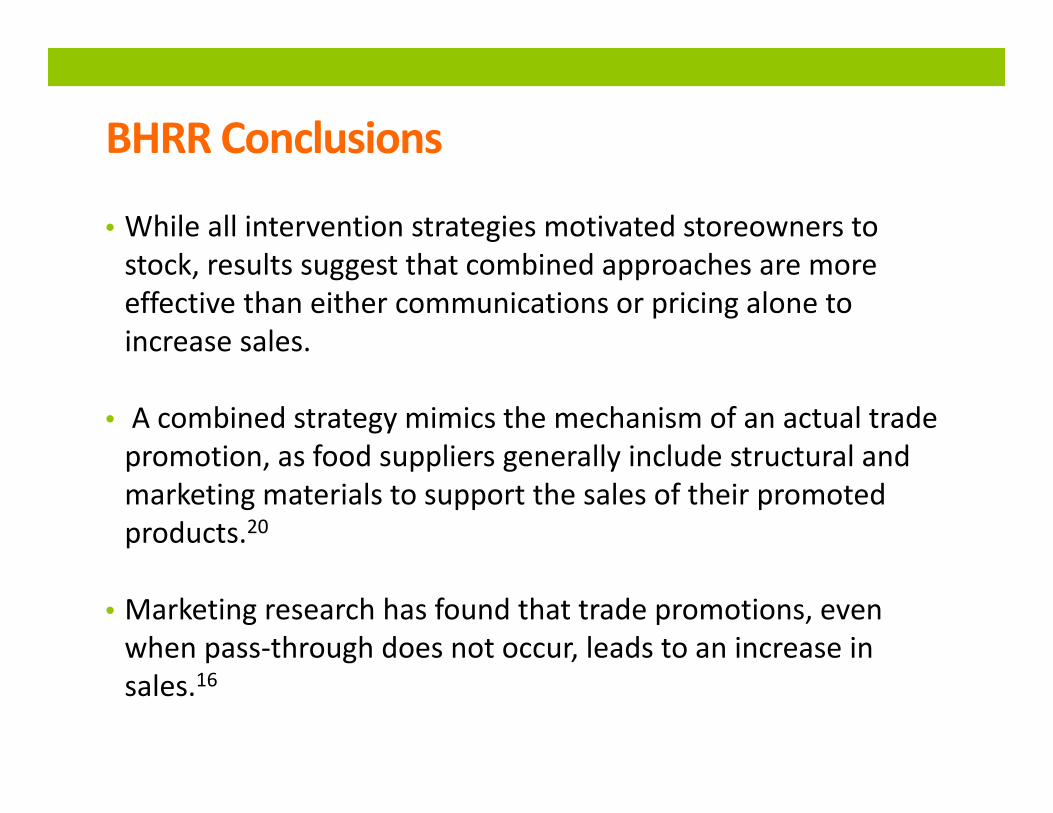
BHRR Conclusions
• While all intervention strategies motivated storeowners to stock, results suggest that combined approaches are more effective than either communications or pricing alone to increase sales.
• A combined strategy mimics the mechanism of an actual trade promotion, as food suppliers generally include structural and marketing materials to support the sales of their promoted products.20
• Marketing research has found that trade promotions, even when pass‐through does not occur, leads to an increase in sales.16
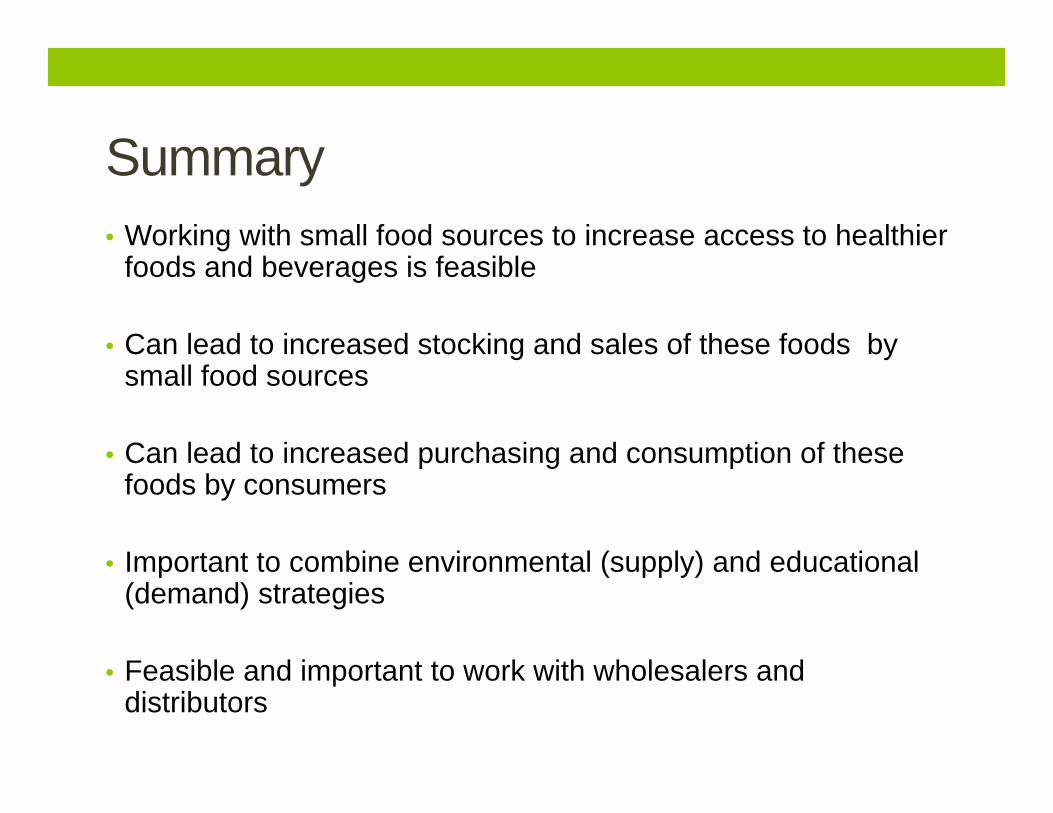
Summary• Working with small food sources to increase access to healthier
foods and beverages is feasible
• Can lead to increased stocking and sales of these foods by small food sources
• Can lead to increased purchasing and consumption of these foods by consumers
• Important to combine environmental (supply) and educational (demand) strategies
• Feasible and important to work with wholesalers and distributors
Questions?Nadine Suzanne Budd, MSEmail: [email protected]: 410‐991‐0767
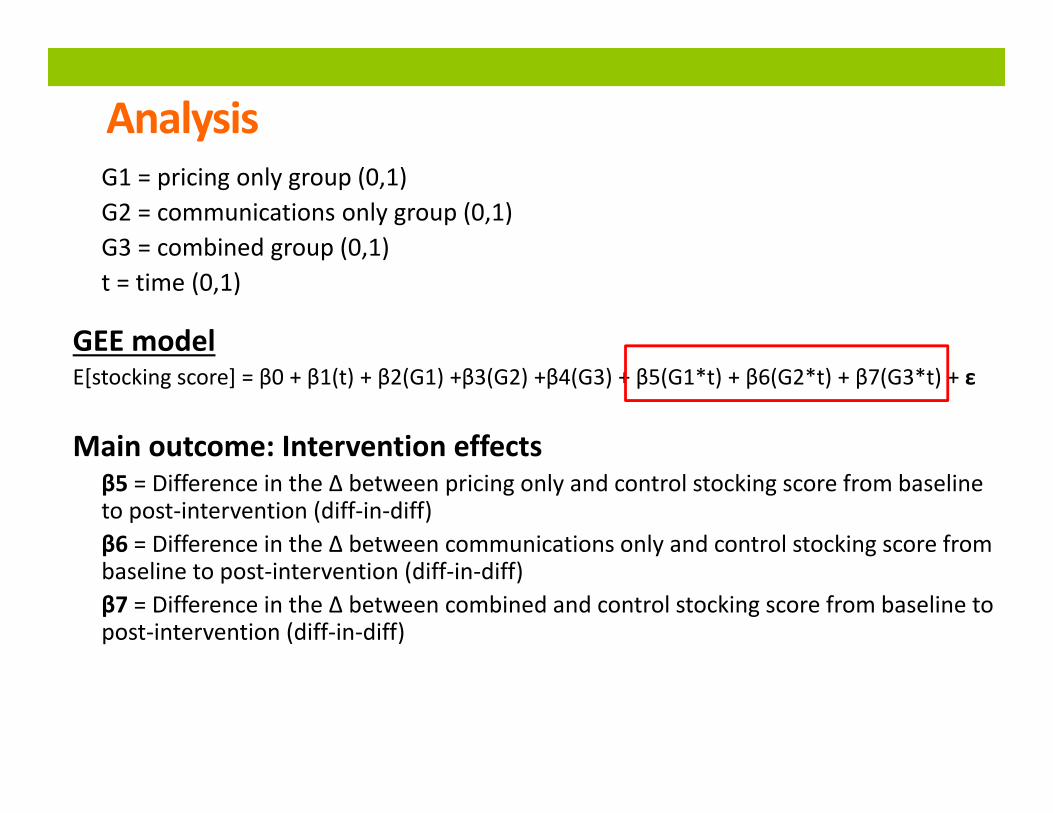
AnalysisG1 = pricing only group (0,1)G2 = communications only group (0,1)G3 = combined group (0,1)t = time (0,1)
GEE modelE[stocking score] = β0 + β1(t) + β2(G1) +β3(G2) +β4(G3) + β5(G1*t) + β6(G2*t) + β7(G3*t) + ε
Main outcome: Intervention effectsβ5 = Difference in the Δ between pricing only and control stocking score from baseline to post‐intervention (diff‐in‐diff)β6 = Difference in the Δ between communications only and control stocking score from baseline to post‐intervention (diff‐in‐diff)β7 = Difference in the Δ between combined and control stocking score from baseline to post‐intervention (diff‐in‐diff)