Embed Size (px)
Citation preview

Department of Chemistry and Chemical Engineering CHALMERS UNIVERSITY OF TECHNOLOGY Gothenburg, Sweden 2018
Characterization of biopolymers for
barriers in food packaging Master’s thesis in Materials Chemistry
SARA ÖHMAN


MASTER’S THESIS 2018
Characterization of biopolymers for barriers in food packaging
SARA ÖHMAN
Department of Chemistry and Chemical Engineering
CHALMERS UNIVERSITY OF TECHNOLOGY
Gothenburg, Sweden 2018

iv
Characterization of biopolymers for barriers in food packaging SARA ÖHMAN
© SARA ÖHMAN, 2018
Supervisor: Åsa Nyflött, Stora Enso
Examiner. Prof. Anette Larsson, Chemistry and Chemical Engineering
Master’s Thesis 2018:
Department of Chemistry and Chemical engineering
Chalmers University of Technology
SE-412 96 Gothenburg
Telephone +46 31 772 1000
Cover: FESEM and SEM images of bio-based barrier coatings on paperboard.

v
Characterization of biopolymers for barriers in food packaging
SARA ÖHMAN
Department of Chemistry and Chemical engineering
Chalmers University of Technology
ABSTRACT
The demand for bio-based packaging is emerging in the world and paperboard packaging could be an
excellent solution for fully bio-based food packaging. Today they are limited by the common barrier
coatings made of fossil-based plastics. Research are ongoing regarding using biopolymers as barrier
coatings, which would be a solution to the dilemma but their inferior properties to petroleum-based
polymers are an obstacle. For greater understanding, this research was aimed to characterize and
investigate the possibilities for bio-based polymers to replace fossil-based polymers as barrier coatings
in food packaging. The main drawback with biopolymers used as barriers and especially moisture
barriers are their brittleness and moisture sensitivity. Therefore, methods such as Cobb 600, pinholes
and climate cycling in moisture generator were used to evaluate the moisture barrier properties of chosen
biopolymers in herein developed formulations. The most promising moisture barriers were further on
characterized with Thermogravimetric Analysis (TGA), Differential Scanning Calorimetry (DSC) and
Scanning Electron Microscopy (SEM). Crosslinking attempts were done with sodium alginate and CaCl2
resulting in improved moisture barrier properties and for starch and proteins with succinic acid (SA) but
did rather impair the barrier performance. Starch blends of Perfectafilm with sodium alginate or
Carnauba wax (CW) dispersion showed an even and covering barrier visualized by SEM, as well as
crosslinked alginate. Best barrier performance in Cobb 600 and pinholes exhibited the crosslinked
alginate. The mechanical properties of these barriers are crucial for the application in food package and
need to be studied in future work, where also optimization of formulations and crosslinking should be
conducted. The outcome of this study suggests the materials most likely for continued research to be
alginate, wax dispersion and modified starch, additionally, suitable modifications of proteins could
create potential for moisture barrier capability. Nevertheless, the biopolymer barriers are not yet
adequate substitutes to fossil-based ones.
Keywords: Biopolymers, barrier coating, dispersion coating, dispersion barrier, food packaging,
moisture barrier, paperboard, PLA dispersion, soy protein, potato protein, sodium alginate, modified
starch, CW dispersion.


vii
ACKNOWLEDGEMENT
This master thesis project has been carried out in collaboration between Chalmers University of
Technology and Stora Enso. During spring 2018 I was placed at Stora Enso Research Center in Karlstad
for this master thesis and would like to express my sincere thanks to Åsa Nyflött, who was my excellent
supervisor throughout the project, helping me answering all my abstract questions and gave guidance in
the right direction of this project.
I would further on like to send a big thank you to my examiner Anette Larsson for the expert advices
for this project. I also owe a big thanks to Robert and Kimmo for performing the SEM and FESEM
imaging and to Camilla for introduction to characterization methods and to Elsa, Malin, Claes, Leif and
Kerstin for the introduction to the bench coater, WVTR, moisture generator, Cobb and assistance in
interpretation of uncertain results. Lastly, I want to thank the whole Stora Enso team at RCK for creating
such a good ambience during the work with this project and showing great interest in the topic. This
project would not have been possible without the support from my family and friends always being there
for me and believing in me.
Sara Öhman, Gothenburg, June 2018


ix
LIST OF ABBREVIATIONS
CW – Carnauba Wax
DLVO – Derjaguin, Landau, Verwey, Overbeek
DMA – Dynamic Mechanical Analysis
DSC – Differential Scanning Calorimetry
FESEM – Field-Emission Scanning Electron Microscopy
FTIR – Fourier-Transform Infrared Spectroscopy
Mw – Molecular Weight
PLA – Polylactic Acid
PPI – Potato Protein Isolate
RH – Relative Humidity
SA – Succinic acid
SEM – Scanning Electron Microscopy
SPI – Soy Protein Isolate
Tg – Glass Transition Temperature
Tm – Melting Temperature
TGA – Thermogravimetric Analysis
wt % - Weight to weight percentage
WVTR – Water Vapor Transmission Rate
WVP – Water Vapor Permeability

x
I TABLE OF CONTENTS
Acknowledgement ................................................................................................................................. vii
List of Abbreviations .............................................................................................................................. ix
List of Figures ....................................................................................................................................... xii
List of Tables ........................................................................................................................................ xiv
1 Introduction ..................................................................................................................................... 1
Aim .......................................................................................................................................... 1
Limitations............................................................................................................................... 1
Research Questions ................................................................................................................. 2
Thesis Outline .......................................................................................................................... 3
2 Theoretical Background .................................................................................................................. 4
Biopolymers ............................................................................................................................ 4
Starch ....................................................................................................................................... 5
2.2.1 Starch Blends ................................................................................................................... 7
Polylactic Acid (PLA) ............................................................................................................. 7
Wax ......................................................................................................................................... 8
2.4.1 CW Dispersion ................................................................................................................ 8
Alginate ................................................................................................................................... 8
Proteins .................................................................................................................................... 9
2.6.1 Soy Protein .................................................................................................................... 10
2.6.2 Potato Protein ................................................................................................................ 10
Moisture Barrier .................................................................................................................... 11
Plasticizers ............................................................................................................................. 12
Mechanisms for Film Formation ........................................................................................... 12
2.9.1 Latex Film Forming Mechanism ................................................................................... 13
2.9.2 Film Formation of Latex Blends and Hybrids ............................................................... 14
2.9.3 Starch Film Formation Mechanism ............................................................................... 14
2.9.4 Film Formation of Starch Blends .................................................................................. 14
2.9.5 Alginate Film Formation Mechanism............................................................................ 15
2.9.6 Protein Film Formation Mechanism .............................................................................. 15
2.9.7 Wax Film Formation Mechanism .................................................................................. 15
3 Materials and Methods .................................................................................................................. 17
Preparation of Formulations .................................................................................................. 17
3.1.1 Starches ......................................................................................................................... 18
3.1.2 Polylactic Acid .............................................................................................................. 18
3.1.3 Wax ............................................................................................................................... 18

xi
3.1.4 Sodium Alginate ............................................................................................................ 18
3.1.5 Soy Protein Isolate (SPI) ............................................................................................... 19
3.1.6 Potato Protein Isolate (PPI) ........................................................................................... 19
Barrier Coating ...................................................................................................................... 19
Process Plan and Performance Comparison .......................................................................... 19
Pinholes ................................................................................................................................. 20
Cobb 600 ............................................................................................................................... 20
Water Vapor Transmission Rate (WVTR) ............................................................................ 21
Climate Cycling in Moisture Generator ................................................................................ 21
Thermogravimetric Analysis (TGA) ..................................................................................... 21
Differential Scanning Calorimetry (DSC) ............................................................................. 21
Fourier-Transform Infrared Spectroscopy (FTIR) ................................................................ 21
Scanning Electron Microscopy (SEM) .................................................................................. 22
4 Results and Discussion .................................................................................................................. 23
Starch ..................................................................................................................................... 23
4.1.1 Crosslinking with Succinic Acid ................................................................................... 25
PLA ....................................................................................................................................... 26
Wax ....................................................................................................................................... 29
Sodium Alginate .................................................................................................................... 30
SPI ......................................................................................................................................... 35
PPI ......................................................................................................................................... 36
Plasticizer .............................................................................................................................. 38
Degradation of Biopolymers ................................................................................................. 39
Moisture Barrier Performance ............................................................................................... 40
5 Conclusion and Future Work......................................................................................................... 41
6 Bibliography .................................................................................................................................. 43
I Appendix - Materials & Formulations ........................................................................................ II-1
I.I Material properties .................................................................................................................. II-1
I.II Formulations and concentrations ......................................................................................... II-2
I.III Reference formulations ....................................................................................................... II-3
I.IV Coating amounts .................................................................................................................. II-3
II Appendix – Pinhole results .......................................................................................................... II-4
III Appendix - Cobb 600 results .................................................................................................. III-6
IV Appendix – Climate Cycling .................................................................................................. IV-8

xii
LIST OF FIGURES
Figure 1. Categories of biopolymers, courtesy of Nyflött [4]. ................................................................ 4 Figure 2. Biopolymers classified by type and origin [13]. ...................................................................... 5 Figure 3. Structure of the biopolymers amylopectin and amylose, the primary polymers in starch [17].
................................................................................................................................................................. 6 Figure 4. Alternating monomer structure of sodium alginate consisting of mannuronate (M) and
guluronate (G), reused with permission from Elsevier [33]. ................................................................... 8 Figure 5. Crosslinking of alginic acid with Ca2+ ions, reused with permission from Elsevier [14]. ....... 9 Figure 6. Film forming mechanism of latex particles, edited from Kuusipalo [15]. ............................. 13 Figure 7. DLVO interaction energy theory. VR= Electrostatic repulsion, VA= Van der Waals attraction,
VT= Total interaction. ............................................................................................................................ 14 Figure 8. Light microscopy of Ecosphere particles. .............................................................................. 18 Figure 9. Process flow chart of the study. ............................................................................................. 20 Figure 10. Pinholes comparison of starch types. Reference of Ecosphere was plasticized with sorbitol
and xylitol. Starch/CW were used at a 5:1 ratio, Perfectafilm x85 was not combined with CW.
Starch/alginate ratio was also 5:1 .......................................................................................................... 24 Figure 11. Cobb 600 comparison of starch types. Ecosphere reference sample is plasticized with S, X.
Starch/CW were used at a 5:1 ratio, Perfectafilm x85 was not combined with CW. Starch/alginate ratio
was also 5:1. .......................................................................................................................................... 25 Figure 12. FTIR effect of adding crosslinking agent SA to Perfectafilm x85. Perfectafilm x85
reference (red) and Perfectafilm x85-0.15 % SA, dried at 105 °C (blue). ............................................ 26 Figure 13. DSC thermograph for Perfectafilm x150/PLA plasticized with sorbitol and xylitol, cycling
from -20 °C to 230 °C twice with a cooling step. ................................................................................. 27 Figure 14. SEM (A) and FESEM (B) image of Perfectafilm x150/PLA dispersion blend. Surface
imaging (A) with 1000 x magnitude and cross-section (B) with 3500 x magnitude. ............................ 28 Figure 15. DSC thermogram of Perfectafilm x150/CW blend, plasticized with sorbitol and xylitol.
Cycling from -20 °C to 230 °C twice with a cooling step. .................................................................... 29 Figure 16. SEM (A) tilt imaging and FESEM (B) on cross-section of Perfectafilm x150/CW blend
plasticized with sorbitol and xylitol. ..................................................................................................... 30 Figure 17. FTIR spectra of CaCl2 crosslinked sodium alginate (blue), reference (red). ....................... 32 Figure 18. SEM (A) surface imaging and FESEM (B) of cross-section of sodium alginate plasticized
with sorbitol and crosslinked with 25 ml CaCl2. Surface imaging of 500 x magnitude and cross-section
at 3500 x magnitude. ............................................................................................................................. 32 Figure 19. SEM (A) tilt image and FESEM (B) cross-section image of Perfectafilm x150/alginate
blend plasticized with sorbitol and xylitol. Tilt image at 500 x magnitude and cross-section at 3500 x
magnitude. ............................................................................................................................................. 33 Figure 20. DCS thermograph of coated alginate plasticized with sorbitol and crosslinked with CaCl2.
Cycling from -20 °C to 230 °C twice with a cooling step. .................................................................... 34 Figure 21. DSC Thermograph of coated Perfectafilm x150/alginate plasticized with sorbitol and
xylitol. Cycling from -20 °C to 230 °C twice with a cooling step. ....................................................... 35 Figure 22. FTIR of SPI crosslinked with SA and plasticized with mannitol (red), PPI with mannitol
(blue) and PPI reference (green)............................................................................................................ 36 Figure 23. PPI reference (red) and PPI plasticized by sorbitol and with 5% SA(blue) ......................... 37 Figure 24. SEM (A-B) and FESEM (C) imaging of PPI-0.15 % SA. Tilt imaging at 150 x
magnification (A), surface imaging (B) at 1000 x magnification and cross-section(C) at 3500 x
magnification. ........................................................................................................................................ 37 Figure 25. Cobb 600 results for plasticizer comparison of sorbitol and mannitol. Sample numbers are
represented in Table 10. ........................................................................................................................ 38

xiii
Figure 26. TGA thermogram for reference biopolymers. Sodium alginate (blue), CW dispersion (red),
Perfectafilm x150 (green) and PLA dispersion (black). ........................................................................ 39 Figure 27. TGA results for the Perfectafilm x150 blends used as an indication for DSC range to be
used. Perfectafilm x150/sodium alginate (red), Perfectafilm x150/CW dispersion (green), Perfectafilm
x150/PLA/Alginate (purple), Perfectafilm x150/PLA dispersion (brown), Sodium alginate-CaCl2-25
ml (black), reference paperboard (blue). ............................................................................................... 40 Figure 28. Climate cycling of reference board (200 g/m2). Cycling program: 50-80-50-20-50 % RH.
............................................................................................................................................................ IV-8 Figure 29. Climate cycling of sodium alginate crosslinked with 25 ml CaCl2 coated on one side of
paperboard, S-sorbitol used as plasticizer. Cycling program: 50-80-50-20-50 % RH. ...................... IV-9 Figure 30. Climate cycling of starch blend consisting of Perfectafilm x150 and PLA dispersion, coated
on one side of paperboard, SX-sorbitol and xylitol used as plasticizers. Cycling program: 50-80-50-20-
50 % RH. ............................................................................................................................................ IV-9 Figure 31. Climate cycling of starch blend consisting of Perfectafilm x150 and sodium alginate, coated
on one side of paperboard, SX-sorbitol and xylitol used as plasticizers. Cycling program: 50-80-50-20-
50 % RH. .......................................................................................................................................... IV-10 Figure 32. Climate cycling of starch blend consisting of Perfectafilm x150 and CW dispersion, coated
on one side of paperboard, SX-sorbitol and xylitol used as plasticizers. Cycling program: 50-80-50-20-
50 % RH. .......................................................................................................................................... IV-10

xiv
LIST OF TABLES
Table 1. Starch content by type in terms of amylose and amylopectin percentage, edited from Carvalho
[16]. ......................................................................................................................................................... 6 Table 2. Information about investigated materials, obtained from supplier safety data sheets. ............ 17 Table 3. Pinholes classification of results ............................................................................................. 20 Table 4. Final formulations for characterization; CaCl2 crosslinked alginate and starch blends
consisting of Perfectafilm x150 with alginate, wax, PLA and PLA/alginate plasticized with sorbitol (S)
and xylitol (X). ...................................................................................................................................... 23 Table 5. Climate cycling of Perfectafilm x150/PLA blend at 50-80-50-20-50 % RH. ......................... 28 Table 6. Climate cycling of Perfectafilm x150/CW blend at 50-80-50-20-50 % RH. .......................... 30 Table 7. Cobb 600 values for sodium alginate with combinations. S-Sorbitol, M-Mannitol, X-Xylitol,
SA-Succinic acid, G-glycerol. Coated with rod no. 3 or 7. ................................................................... 31 Table 8. Climate cycling of Alginate-Sorbitol-CaCl2-25 ml at 50-80-50-20-50 % RH. ....................... 33 Table 9. Climate cycling of Perfectafilm x150/Alginate at 50-80-50-20-50 % RH. ............................. 33 Table 10. Biopolymers used for plasticizer comparison ....................................................................... 38 Table 11. Summary of climate cycling data for four barrier coatings presented in each material section.
S-Sorbitol, X-Xylitol. ............................................................................................................................ 40 Table 12. Material properties for the biopolymers included in the study. ........................................... II-1 Table 13. Coating formulations of coated samples. Concentration is calculated as the polymer weight
divided by polymer plus solution weight. Plasticizer is calculated as a percentage of polymer weight.
S-Sorbitol, M-Mannitol, X-Xylitol, G-Glycerol. ................................................................................ II-2 Table 14. Formulations for reference barrier coating. ......................................................................... II-3 Table 15. Coating amounts for all barrier coatings. S-Sorbitol, X-Xylitol, G-Glycerol, SA-Succinic
acid. ..................................................................................................................................................... II-3 Table 16. Barrier coatings tested for pinholes. S-Sorbitol, X-Xylitol, G-Glycerol, SA-Succinic acid. II-
4 Table 17. Pinhole results for starch-based formulations. .................................................................... II-5 Table 18. Results of all Cobb 600 tests, polymer amounts and additives. S-Sorbitol, X-Xylitol, G-
Glycerol, SA-Succinic acid ................................................................................................................ III-6 Table 19. Cobb 600 results for different starch types and blends. ..................................................... III-7 Table 20. Climate cycling of reference paperboard. .......................................................................... IV-8

1
1 INTRODUCTION
Sustainable awareness is overall increasing in the world and so does the interest in bio-based food
packaging. Compared to fossil-based plastic packages or aluminum packages, barrier coated paperboard
packages can give a significantly lower carbon footprint [1]. Today food packages made of paperboard
can act as a container for aqueous liquids due to its barrier coatings, which consists of a material with
excellent moisture barrier properties. These barriers are in general made of fossil-based material. The
challenge nowadays is to replace these fossil-based polymers with bio-based polymers, which are a more
environmental friendly option and currently an expanding market, driven by the increasing awareness
for low environmental impact [2].
The ideal case would be to replace the fossil-based materials with bio-based ones and improve the
sustainability of the package without affecting the primary functions. Improved knowledge about the
materials are essential to be able to achieve the transformation to bio-based materials. Investigation and
characterization of the bio-based materials are required to fully understand their properties and if
modifications and additives are needed for the polymer to be applicable as a sufficient moisture barrier
coating. Compared to fossil-based polymers, biopolymers show differing properties, often hydrophilic
and most commonly are additives vital due to brittleness [3].
To keep paperboard packages in contact with liquids, one of the most important properties are the water
resistance. The package also need to be able to preserve the food and not mechanically break. Another
important aspect is food safety and quality to minimize food spoilage [4]. Barrier coatings on paperboard
packages are consequently utilized to improve the barrier properties of the existing paperboard for longer
preservation, quality and protection of the food and package.
AIM
By investigating several biopolymers for the use as barrier coatings in food package, the main purpose
is to find suitable candidates that are possible substitutes for fossil-based polymers. Most of the
biopolymers are known to be grease resistant but present a weaker water resistance and are brittle. Due
to that fact, the aim of this project in particular, will be to find biopolymers together with additives that
shows good moisture barrier properties, for example a water vapor transmission rate (WVTR) below 10
g/(m2·24 h). While the used materials to as big extent as possible, not loses their natural properties. This
will be done by comparing chemical properties of bio-based barriers from aqueous solutions, along with
functional properties such as coatability and processability required for coating of paperboard.
LIMITATIONS
Non-commercial materials will not be concerned, meaning that synthetizations, modifications
and other chemical reactions modifying materials into new variations will not be concerned.
Crosslinking that requires additional chemical reaction steps except addition of a crosslinker
compound to solution or coated paperboard will not be performed.
Pilot and full-scale coating trials will not be included in the study.
Confirmation tests of biodegradability or compostability will not be performed.

2
RESEARCH QUESTIONS
Which of the chosen biopolymers are physical and rheological suitable for coating on
paperboard? A biopolymer needs to be found that has a usable viscosity in room temperature
for coating by a bench coater with rod or blade and with a high solid content, preferably above
20 %, to minimize drying time.
Is mixing with filler, plasticizer or other compounds needed? To overcome brittleness of
biopolymers and to improve their pure polymer barrier properties, the need and content of fillers,
plasticizers and crosslinkers should be theoretically investigated and studied in the context of
the limitations.
Which three of the coated paperboard samples are the most promising as barriers (moisture)
for food packaging and will be characterized? The three polymers with best barrier properties
in terms of high water resistance, low brittleness and most homogenous coating will be chosen
for further characterizing. This will be evaluated by pinholes test, Cobb 600 and visual
performance of the coating.
What are the effects of additives, crosslinking, formulation and coating conditions? Evaluation
of additive effects such as crosslinking will be done with Fourier-Transform Infrared
Spectroscopy (FTIR). Differential Scanning Calorimetry (DSC) will be done to observe
temperature effects on glass transition temperature (Tg), melting temperature (Tm) and limits for
coating temperatures. Tg and Tm affects the performance, degradation and the usability of the
barrier. Also, brittleness will be evaluated by DSC (Dynamic Mechanical Analysis (DMA)
might be needed to study eventual phase separations between polymer and plasticizer, if used).
Thermogravimetric Analysis (TGA) will be performed to control degradation of the polymers
and, in case of fillers, to evaluate amount of ash and to see if the fillers have been modified.
Scanning Electron Microscopy (SEM) and Field-Emission Scanning Electron Microscopy
(FESEM) imaging should be performed to get a visual overview, to see homogeneity and
coverage of the paperboard. Climate cycling in a moisture generator should be done to
determine how much water that is absorbed, namely the water solubility in the materials and
water retention.
Which biopolymer is most promising to be used as a barrier in both practical and chemical
sense? The biopolymer, which is easy to coat and most likely for upscaling, the one that has
highest water resistance, low brittleness and homogenous coating. For this a concentration as
high as possible but with remained manageable viscosity and the fraction of biopolymer versus
additives should be determined.

3
THESIS OUTLINE
The thesis will be built up by theory about different bio-based polymers and properties important for
forming moisture barrier coatings followed by the methods used to formulate and characterize these and
eventually the results of the characterization of the biopolymers used as coatings.
Chapter 2 – Theoretical background, presents the properties and behavior of the biopolymers and the
present research for these materials in bio-based moisture barriers. Provides literature background for
contents and amounts in the formulations.
Chapter 3 – Methods and materials, describes the process to formulation of each barrier coating and
the laboratory methods and equipment used to evaluate and characterize the materials and barriers.
Chapter 4 – Results and discussion, the barrier coating results are presented and discussed separately
for each material and general properties. Plasticizers are also presented and discussed separately.
Chapter 5 – Conclusion and future work, the most promising barrier coatings from this study are
concluded and future improvements for bio-based moisture barrier coatings discussed.

4
2 THEORETICAL BACKGROUND
BIOPOLYMERS
Biopolymers in food packaging has been an expanding topic for several years and are of high interest
nowadays due to the environmental awareness and replacement of fossil-based materials [3]. Today
plastics made from fossil-based materials are used for food packaging and as the major commercial
materials in barrier coatings in packaging made of paperboard. Several biopolymers are however already
introduced and will expand commercially for different purpose in food and beverage packaging [2].
Such as Bio PBS, PLA, starch, waxes, soy protein and corn zein protein are available. Cellulose esters
and nitrocellulose coatings are also used but not yet commonly used in food packaging.
The European Bioplastics Association’s definition of bioplastics can be divided in three classes [5].
First; polymers that are bio-derived and biodegradable/compostable, second; fossil-fuel derived
polymers but biodegradable and third; the bio-derived but non-biodegradable polymers. The three
classes along with a non-biodegradable and petroleum-based class, thus fossil-based polymers, are
presented in Figure 1. The project will mainly focus on biopolymers defined as in the first class; bio-
derived and biodegradable or compostable. Biopolymers can also be defined as macromolecules
produced by living organisms [6], which does not apply to all classes in the European Bioplastics
Association’s definition. Polysaccharides in form of starch, alginate and cellulose are however
macromolecules produced from living organisms and biodegradable, hence fits in the first class of the
definition, as does proteins. Starch, proteins and PLA can all be degraded by the human body [7].
Figure 1. Categories of biopolymers, courtesy of Nyflött [4].
There are several classes and origin of bio-based polymers, see Figure 2. Biopolymers such as chitosan,
whey protein isolate, corn zein protein and graphene-polymer nanocomposites has shown promising
properties to be applied as barrier coatings [8] - [9]. These materials have been chosen to not be included
in this study based on various reasons. Whey is animal based and therefore excluded from this study.
Commercial chitosan is mostly animal based and therefore excluded even though plant-based chitosan
is possible to find, but to a high cost [10]. Corn zein and graphene-polymer nanocomposites will not be
investigated further in this study due to availability and time limitations of the project. Another
promising class of materials for barriers are nanocelluloses. Nanocelluloses represents potential
materials for blending into barrier coatings for improved barrier properties, such as oxygen barrier and
WVTR [11] - [12]. Cellulosic materials will not be further investigated due to that these materials have

5
been and are undergoing extensive studies by several research groups it will be outside the context and
time frame of this study.
Figure 2. Biopolymers classified by type and origin [13].
One of the most important chemical modifications are chemical crosslinking of the biopolymers, which
has been shown to improve both mechanical and moisture barrier properties [7], [14]. By interconnecting
the polymer chains with chemical bonds, the crosslinking gives a stronger 3D-network with new
covalent bonds to overcome inadequate properties. Physical crosslinking is another way to link the
polymer chains with non-covalent bonds. Chemical and physical crosslinking can be both intra- and
intermolecular. It improves aqueous stability but changes the rheology, which can lead to difficulties in
processing the polymer solution.
Glutaraldehyde is a common crosslinker used for biopolymers such as proteins and carbohydrates but
has shown to be cytotoxic above a concentration of 8 %. Recently attempts to crosslink biopolymers
with citric acid has been done and shows improvements in mechanical properties [7]. Notice
nevertheless that one of the common classes of crosslinkers, short chain aldehydes, has been reported to
be potentially toxic. Several crosslinkers can be used with different efficiency and main functions but
for materials in contact with food packaging, non-toxic chemicals should be used to carry out the
crosslinking.
STARCH
Starch is a semicrystalline polysaccharide extracted from plants such as potato, corn, wheat, rice and
cassava and consists of two types of molecules: amylose and amylopectin which both are built up by
glucose units connected by α-1,4-glycosidic bonds [15]. The ratio of the polymers depends on the plant
source, see Table 1.

6
Table 1. Starch content by type in terms of amylose and amylopectin percentage, edited from Carvalho [16].
Starch Amylose (wt.%) Amylopectin (wt.%)
Wheat 30 70
Corn 28 72
Potato 20 80
Rice 20-30 80-70
Cassava 16 84
Waxy maize 0 100
The main chemical difference between the molecules are characterized by the high branching level in
amylopectin, with α-1,6-glycosidic bonds at the branch points, compared to the linear structure of
amylose, see Figure 3.
Figure 3. Structure of the biopolymers amylopectin and amylose, the primary polymers in starch [17].
Based on the OH-rich structure of starch it is classified as a hydrophilic compound, but native starch is
insoluble in cold water [18]. By using the acetylation reaction on starch, water barrier properties such
as water vapor permeability (WVP) and water adsorption can be improved [19]. But there are several
other ways of improving the water retention properties described in literature.
Crosslinking is another common way to improve barrier properties of starch. Succinic acid (SA) has
been used to crosslink oxidized cassava starch and has together with additional phosphorylation showed
significantly improved stable viscosity, stability, toughness, water dispersibility, adhesion and film
properties [20]. Wheat starch has also been modified with a mixture of SA and acetanhydride which
improved adhesion [21], this was done at a pH of 9. Esterification can be created by ester linkage when
the hydroxyl groups in anhydro-glucose molecules of starch reacts with the carboxylic groups of the
SA. The result can be both crosslinking and substitution. Modifications with medium-chain fatty acids
has shown to improve the water resistance of starch without decreasing the biodegradability and could
be used in edible films, hence safe for food packaging [22].

7
The type of starch is one of the key parameters in starch films because there is a natural difference in
the amylose-amylopectin ratio among species, see Table 1 [23]. With high content of amylose, lower
energy input can be used in the coating process. This is due to lower crystallinity since the highly
branched amylopectin mainly forms the crystalline regions of the starch granule and needs to be
degraded. Further on amylose has lower viscosity due to lower molecular weight and is therefore easier
to handle.
Recent research have been done adding bentonite clay into starch formulations which resulted in a huge
reduction in WVTR to 15 g/(m2·24 h) compared to WVTR of uncoated paper 670 g/(m2·24 h) [5]. There
was also a reducing effect of only adding plasticizer to some starches, but for both plasticizer and clay
the opposite effect on WVTR was seen in a few different starch samples, demonstrating the importance
of choosing the correct formulation for each material.
2.2.1 Starch Blends
Cassava starch and Carnauba wax (CW) has shown promising results as a combined barrier film,
especially interesting since the blend with CW reduced the WVP and water solubility [18]. With more
than 20 weight percent (wt %) wax, the WVP increased again, probably due to that the starch matrix
became insufficient or wax particles uneven distributed. The wax can have an influence on the starch
crystallization probably by forming complexes with the amylose and/or amylopectin.
Starch has also been combined with sodium alginate and fluorocarbons for improvement of uniformity
of the coating and grease resistance [24]. Corn starch and sodium alginate has been mixed to be used as
an edible film to investigate the optimal proportions of the blend [25]. The proportions were determined
depending on mechanical and barrier properties such as WVP and tensile strength. The researchers
suggested the ratio of starch and sodium alginate to be 3:2.
POLYLACTIC ACID (PLA)
Polylactic acid (PLA) is a linear aliphatic polyester which on the contrary to natural starch, proteins and
alginate is a synthetically made biopolymer by polymerization of lactic acid monomers [26]. PLA is
biodegradable, compostable and can be synthesized from crops such as sugarcane, corn and starch [2].
Brittleness and thermal instability could be an obstacle for direct replacement of the fossil-based barriers
with extruded PLA [26]. However, a high-performance biodegradable polymer could potentially be
obtained by blending PLA with other polymers and by carrying out chemical modifications on the
polymer, such as dispersion.
The molecular weight of PLA can vary greatly depending on the polymerization process [23]. The
process itself is rather complex and includes several chemical reactions. Condensation or ring-opening
gives chain formation, intramolecular transesterification resulting in ring formations and there are also
degradation and racemization happening. Due to that the chiral monomer lactic acid exists in two
stereoisomeric forms, L-lactic acid and D-lactic acid, different types of PLA can be produced
chemically. L-lactic acid is the most common stereoisomer found in nature. L-PLA will exhibit high
crystallinity, while addition of D-PLA will reduce crystallinity and improve film-formation [13], [23].
Both amorphous and semi-crystalline PLA exists, depending on its composition, stereochemistry and
heat treatments. PLA can also be produced with copolymerization together with another compound,
preferably biodegradable and non-toxic, to improve and tailor desired properties.
PLA is insoluble in water but of hygroscopic nature and has a Tg around 50° C and Tm around 130-150
°C that are influenced by the molecular weight and other molecular properties and can be increased up

8
to 180 °C [13], [23]. Further on a coating weight as high as 50 g/m2 has been required for sufficient
barrier performance in WVTR [5].
A blend of PLA and starch has been conducted in earlier research to overcome current issues with sole
PLA [27]. Even though PLA and starch are incompatible due to their polarity, the adhesion between
them can be improved with coupling agents or, a more environmentally friendly method, pre-process
drying. The water absorption of these blends was shown to be increasing proportional to starch content.
WAX
Wax is a lipid, a hydrophobic material mainly consisting of long-chain aliphatic substances [13], [28].
Waxes have low surface energy that, when applied to a surface, can improve the hydrophobicity.
Characteristics of lipid films are mainly their high thickness and brittleness. Studies have been done
with beeswax as one component in a barrier coating, which gave significantly reduced WVTR for
chitosan coated paperboard [13]. The same effect has been shown for CW in a combination with sodium
caseinate and mica as a barrier coating on paperboard. In this study a dispersion of CW will be
investigated.
2.4.1 CW Dispersion
CW is a natural wax found in palm tree leaves of Copoernica cerifera and is one of the hardest natural
waxes. The main constituents of the wax particles are aliphatic esters, straight chained primary alcohols
and hydroxy-fatty acids [29]. The chains range from C24-C32. CW exhibit the highest melting point
among natural vegetable waxes [30]. Emulsions of CW have the ability to form super hydrophobic films
that are solvent resistant [28].
ALGINATE
Alginates are unbranched anionic polysaccharides consisting of two monomers originating from the
brown seaweed/algae [31] - [32]. The biopolymer is built up of two monomers, β-D-mannuronate (M)
and α-L-guluronate (G) linked by a 1,4-glycosidic bond, which building up block copolymers with a
different ratio between the two monomers depending on the natural alginate source. The blocks are
either built up homogeneously with only guluronate, GG blocks, only mannuronate, MM blocks, or
heterogeneous alternating blocks, GM blocks, see Figure 4.
Figure 4. Alternating monomer structure of sodium alginate consisting of mannuronate (M) and guluronate (G), reused with
permission from Elsevier [33].
Alginate has unique colloidal properties and can become an insoluble polymer by crosslinking with
divalent ions, for example Ca2+ [31], [34]. Ionic crosslinking introduces ionic bonds between the
crosslinker ion and alginate blocks. Divalent ions will interact and stabilize the conformation with the
guluronate and can be incorporated in GG or GM blocks. The MM blocks are not much affected by the

9
ion addition. The ions have higher affinity to the α-L-guluronic (G) monomers. Ahigh GG block content
in the alginate will create highly crosslinked polymer which will become brittle but also influence and
decrease the water vapor permeability of the films, see Figure 5.A high content of GM blocks is therefore
desirable to get a flexible crosslinked material.
The process for crosslinking has been studied with direct mixing of the crosslinker into alginate solution,
which led to gel clumps as a result from the irreversible and fast reaction [31]. Therefore, a diffusion-
and internal setting method was suggested. The diffusion method functioned by letting a cast film be
put in a divalent ion solution, so the ions migrate into the alginate network and triggers crosslinking,
which worked well for small scale, but films were brittle. The internal setting method is based on
addition of inactivated Ca2+ to the alginate matrix and activated by a pH shift right before casting films.
Several crosslinking agent has been tested for sodium alginate and two of the most efficient were CaCl2
and CaHPO4, both having Ca2+ as divalent crosslinking ion [31]. CaHPO4 performed better regarding
tensile strength and elongation at break but CaCl2 showed stronger reduction in permeability in
upscaling trials. The lowest permeability of water vapor and oxygen was obtained at a Ca2+concentration
of 0.01 g/g alginate for CaHPO4 and 0.012 g/g alginate for CaCl2 [24].
By crosslinking with CaCl2 it has been shown that the water absorption of alginate films is readily
reduced and on the contrary, it is increased with the addition of organically modified montmorillonite
(OMMT) [35]. After crosslinking, the alginate shows similar properties to soy protein isolate (SPI) films
regarding water absorption. Another chemical modification of alginate is esterification [33]. By the
successful addition of alkyl groups onto the backbone of the polymer, hydrophobicity increased.
Figure 5. Crosslinking of alginic acid with Ca2+ ions, reused with permission from Elsevier [14].
PROTEINS
Proteins are polymers consisting of amino acids as their monomers [36]. Due to the 20 amino acids
found in proteins there are an enormous number of combinations imaginable, which creates polymers

10
exhibiting different interactions and possible chemical reactions. In this sense, proteins differ from the
polysaccharides which only present one or a few types of monomers for each polymer. In this study
protein isolates are used, which requires a concentration above 90% [37]. Due to the amino acid side
chains with functional groups, proteins are naturally suitable for modifications such as crosslinking,
which is an important process for improving mechanical and chemical properties and reducing the
solubility in aqueous solutions [38]. Beyond that proteins are excellent film forming materials [13].
Proteins have intrinsic hydrophilic properties, subsequent a high WVP and oxygen permeability, hence
limited use in moisture barrier applications [13]. Research are ongoing, and it has already been shown
that blends of whey protein with cellulose or beeswax provided a film that reduced the WVTR with up
to 92 %. Only vegetable-based proteins will be investigated in this study and not animal-based milk
protein like whey. Due to the interactions between protein chains, like natural occurring disulfide bonds,
protein films exhibit brittleness [39]. To improve flexibility plasticizers are needed in these types of
films.
2.6.1 Soy Protein
Soy proteins are extracted from soybeans and the main constituents are fractions of 7S β-conglycinin
and 11S glycinin. Where S stands for Svedberg (S) number and indicating the size of the protein, the
higher number the larger protein [36]. ß‐ conglycinin is rich in the amino acids asparagine, glutamine,
leucine and arginine but has fewer disulfide bonds than glycinin which limits disulfide crosslinking. In
total soy protein isolate (SPI) contain over 50 % of polar amino acids, which enhances the hydrophilicity.
Improvement of moisture barrier properties has been done by crosslinking soy protein films with
formaldehyde by post-treatment and by creating soy protein composites with montmorillonite [35].
Films made of soy protein usually has a concentration about 4-10 wt % and requires a plasticizer
concentration of 25 wt % of SPI, since lower plasticizer content gave fragile and brittle films [40].
With respect to alginate films unmodified soy protein films have superior properties regarding water
resistance, which can be further improved by crosslinking of the both materials [35]. Genipin as a
crosslinker for SPI significantly improved mechanical properties such as elongation at break and tensile
strength [38]. Genipin is a natural crosslinker and about 10,000 times less cytotoxic than another
common crosslinker, glutaraldehyde. A way to reduce the WVP and develop the mechanical and barrier
properties is physical crosslinking in form of γ-irradiation on protein films. Except for crosslinking,
introduction of layered silicates, such as montmorillonite, into SPI films also showed improved water
barrier properties [35].
Several material blends and composites has been investigated with soy protein as one component due to
its excellent film forming but low water barrier capacity [40]. For example, the addition of lipids such
as epoxidized soybean oil and virgin olive oil has been studied for improvement of moisture barrier
properties.
As a processing technique, the SPI can be heat-treated and will then denature and form new bonds
leading to reformed configuration [41]. At 65-70 °C the protein unfolds and exposes its sulfhydryl and
hydrophobic groups which allows reformation of disulfide bonds and new arrangement of the polymer
chains. It has been found that the optimal drying conditions are 60 °C and 60 % relative humidity (RH)
for SPI films in laboratory conditions for best influence on mechanical properties and solubility in water.
2.6.2 Potato Protein
Normally known for its starch content, potatoes also contain proteins which has a nutritional value equal
to egg and soy proteins. The potato protein extraction can be done directly from the potato tubers or
from industrial side-streams [42]. The isolated potato proteins consist mainly of patatin (also known as

11
tuberin), but also of protease inhibitors and a group of other high-molecular-weight proteins, for example
enzymes in form of kinases [43]. Patatins are glycoproteins and comprised by approximately 366 amino
acids [42].
Potato protein isolate (PPI), which will be used in this study, has recently been studied and compared
for the use in biopolymer films [44]. Conventionally, the potato proteins are extracted by a heat treatment
in a way that they lose their functionality due to temperatures up to 120 °C. Patatins denature already at
40-70 °C. Other techniques such as membrane separation, ion-exchange chromatography or expanded
bed adsorption has later been investigated. The protein isolate used in this study is not isolated from the
conventional process due to their liquid and non-denatured state in solution.
In a study by Newson et al., [44], the effect of different plasticizers on PPI was compared. The outcome
from the research was that the plasticizers in general possessed a poor performance of reducing
brittleness. Only glycerol showed sufficient plasticizing properties on PPI but on the contrary enhanced
swelling. In earlier studies a dried and denatured PPI has been used, in this study non-denatured proteins
isolate will be used.
MOISTURE BARRIER
To present decent moisture barrier properties, a polymer film should be non-soluble in water and water
resistant at ambient environment and temperatures. The problem faced with biopolymers are their
hydrophilicity and high solubility in water. In this study, their natural moisture barrier properties have
been characterized and compared with each other and reference paperboard to find better water
withstanding formulations. By using different additives, modifications and blends of materials the
properties can be improved [3].
Barrier properties in terms of water diffusion into the coating can be decreased by increasing the
effective path length for diffusion. By adding water insoluble particles in the coating matrix, obstacles
for diffusion increases and the path becomes more tortuous, resulting in lower water vapor permeability
[32]. Another common way to improve the moisture barrier properties is to inhibit the dissolution of the
polymer chains by crosslinking [3]. The crosslinking introduces additional bonds increasing the
interaction which hinders the dissolution of the polymer chains. Heat treatment is another method where
heating of the polymer coating to temperatures greater than their Tg can have a positive impact on
properties such as density, morphology and crystallinity. The properties of the material which affects
the barrier performance could be for example branching level, polymer chain flexibility and degree of
crystallinity. Crystalline regions have due to the order of polymer chains lower rates of diffusivity
compared to amorphous parts [4].
For moisture barriers, water vapor permeability (WVP) or water vapor transmission rate (WVTR) are
two commonly reported measurements which are related to mass transport in the material [45]. Mass
transport is further on a combination of solubility and diffusivity, described above in this section, which
by other means is the permeability [4]. Another method used for prediction of the moisture barrier is the
pinholes test to observe holes in the barrier. It is a critical test for the barrier since a pinhole free coating
is vital for a functional moisture barrier [15]. To avoid pinholes, proper surface wetting is essential and
a sufficient and covering coating amount is important, which further on depends on the surface
roughness of the paperboard and the adhesion of the barrier to the substrate. The smoother the surface
is, the higher the chance is for a pinhole free coating layer. Therefore, the smoother the surface of the
substrate is, the lower amount of dispersion is required to obtain desired barrier properties.

12
PLASTICIZERS
To decrease the brittleness of biopolymers, plasticizers can be utilized to reduce the intermolecular
forces in the polymer chains [46]. This creates free volume and chain movement, hence increased
flexibility, which further on gives a drawback in form of higher permeability. The plasticizing effect can
be internal or external whereas internal plasticizing occurs by covalent bonds between the plasticizer
and the polymer and is created during polymerization.The external effect is made of low molecular
weight substances that are inserted and positioned between the polymer chains and 3D-network and the
material expands as a result.
For a good plasticizer, the critical factors are low Tm, low volatility and compatibility with the type of
material to plasticize [36]. Water is described as the most effective plasticizer due to its ability to affect
Tg and has a low molecular weight (Mw) but isn this research not useable due to the moisture sensitivity
of the biopolymers. The permanence in the film and the amount of plasticizer are other points to consider
when using plasticizers. This is important for the barrier and mechanical properties which can greatly
vary depending on the plasticizer’s efficiency in the specific material, which also differs between types
of plasticizers. The plasticizing effect can be described by several mechanisms [36]:
The plasticizing substance can function as a lubricant which facilitates mobility of polymer
chains against each other.
Disruption of polymer interactions such as hydrogen bonds, van der Waals or ionic forces with
other polymer chains.
The plasticizer can increase the free volume and mobility of polymer chains, which has been
used to understand the lowering of Tg in the plasticized material.
Plasticizing effects can also be explained by the coiled spring theory, concerning tangled
macromolecules.
The effect of plasticizers on several biopolymer films has been examined in earlier research [47].
Glycerol has been shown to increase both the oxygen and water vapor permeability (WVP) to a higher
extent than for sorbitol which gave almost constant values of oxygen permeability. In the same study
triethanolamine (TEA) as a plasticizer decreased the oxygen permeability but acted like glycerol on the
WVP. The lowest WVP conducted were obtained from plasticizing polysaccharides with sorbitol and
proteins with TEA. The difference can mainly be explained by the different Mw of the plasticizers.
Another study has shown that sorbitol in combination with xylitol were a better combination than xylitol
or sorbitol combined with glycerol regarding mechanical properties for starch [3].
MECHANISMS FOR FILM FORMATION
The biopolymers studied in this project are all prepared as dispersion or solution barrier coatings. They
present different film-forming mechanisms depending on their natural behavior and pre-modifications.
The aim with forming a barrier film is to have a uniform, nonporous solid film with the desired properties
where the film forming process has a crucial influence on final barrier properties [48]. The film
formation is not only affected by the type of material but also by external drying conditions; temperature,
IR drying intensity, time and relative humidity in the environment [15]. The films can also be applied
with different techniques such as blade, wire wound rod and air knife. The wire wound rods were utilized
for coating of dispersion barriers in this study because they give a result in-between the uniformsurface
of using a blade and even coating thickness, namely contour coating, of using an air knife coater.

13
2.9.1 Latex Film Forming Mechanism
Synthetic latex is a type of material consisting of polymeric particles stabilized by surfactants in a
waterborne, colloidal, dispersion [15], [48]. Fine polymer particles are used for latex barrier coatings
and are commonly made by emulsion polymerization, where this study includes dispersions with latex
behavior based on PLA and CW (if the particles are not melted). To achieve a sufficient barrier, stirring
right before coating is important for an even distribution of particles, while avoiding bubbles in the
barrier coating dispersion. The bubbles are removed by vacuum defoaming in this study.
The particles must be able to coalescence while drying, to form a nonporous film [15]. The coalescence
is started upon drying when the water and other volatiles are evaporated whereas the particles then form
a uniform dense packed polymer particle layer. The temperature when drying needs to be higher than
the polymers Tg for the particles to deform and further on for a less brittle and even film to form [48].
Typical for latexes is that optical transparency is achieved at film forming, therefore there exists a
“minimum film formation temperature” where this occurs. Dispersion barrier films are usually used to
achieve an even coating thickness rather than even surface to give stronger barrier properties.
The film forming mechanism can be divided into three possibly overlapping steps; drying, particle
deformation and diffusion. A more detailed process can be described by separating the process into six
steps, see Figure 6 [15].
Figure 6. Film forming mechanism of latex particles, edited from Kuusipalo [15].
A Water evaporation
B Percolation
C Dense Packing
D Coalescence
E Autohesion
F Final film
Water evaporation makes the solid content increase and particles to come closer to each other until
percolation is reached, which is a continuous contact between particles across the layer [48]. At this
point the particles have no longer individual movability and starts to flocculate until they start to dense
pack due to further water evaporation [15]. The voids are filled by deformed particles during the
coalescence, resulting in a non-porous film after sufficient deforming. The autohesion step consists of
further gradual coalescence by inter-diffusion of polymer chains. The final film is now formed, and the
particles has lost their individuality to a homogenous film.
The particles are spherical in the dispersion but at temperatures above their Tg and when in close contact
where deformation starts over large areas, in the coalescence and autohesion step, the molecular chains

14
can move across particle boundaries. This increases the strength of the film due to less distinct
boundaries. The deformation and dense-packing of the particles happens more easily for some particles
depending on material properties such as elasticity (viscoelasticity), the polymer modulus, particle size,
size distribution, Tg and additives in the latex dispersion.
The interactions of the latex particles can be described by the DLVO theory where the two most
important interactions are the Van der Waals attraction and electrostatic repulsion, see Figure 7. When
the water first is evaporated the solid content increases and the electrostatic repulsion forces are
developed between the particles. As the drying continues the coalescence starts due to further water loss
and after reaching a required energy barrier the attractive forces will take the overhand.
2.9.2 Film Formation of Latex Blends and Hybrids
Latex dispersions mixed with other compounds can form a smooth film [48]. Here the Tg plays an
important role. Soft particles (T > Tg) mixed with hard particles (T < Tg) at a temperature T, will form a
film out of the soft ones due to easier coalescence and the hard ones will be dispersed throughout the
film. Therefore, not both components need to fulfill the latex film forming requirement of the
temperature greater than Tg.
2.9.3 Starch Film Formation Mechanism
The solid content and amylose ratio is important for the film forming mechanism of starch [49]. The
major film formation is generally dominated by aggregation and packing of swollen, gelatinized, starch
granules, like the mechanism for latex dispersions [46]. There is also a microstructural development
during the film formation [49]. The initial stages of the microstructural film formation mechanism
include coli-to-helix transition, primarily driven by cooling, followed by helix aggregation or gelating
and rearrangement of aggregates. Whereas the last two steps are caused by drying.
It has been shown that starches with high linear amylose content interacts by hydrogen bonding,
compared to the starches containing high amount of branched amylopectin which had little interaction
over all. Amylopectin is due to its higher molecular weight and highly branched structure more slowly
crystallized by evaporation of water than amylose. This gives a film that is stronger and more flexible
with increasing amylose content, which probably are linked to the crystallization of amylose [49]. In
this study three different types of modified starches are investigated.
2.9.4 Film Formation of Starch Blends
Starch blends are often used to overcome limitations of natural starch-based films, such as high water
sorption and poor mechanical properties. The film formation mechanism is greatly dependent of the
Figure 7. DLVO interaction energy theory. VR= Electrostatic repulsion, VA= Van
der Waals attraction, VT= Total interaction.

15
“quality of mixing” of the components [23]. It can be defined as the scale and intensity of segregation
of the materials, related to the interfacial area and concentration gradients of the materials. This can be
concluded as the homogeneity of the mixture, where as a fully homogenous mixture is obtained when
no chemical or physical properties vary within the mixture. To increase the homogeneity, the scale of
segregation and intensity of segregation needs to be decreased. To get a highly homogenous film, the
shear forces from the mixers need to overcome a breakpoint depending on the viscous forces at where
interfacial tension overcomes the stabilizing surface tension.
Polyester and starch blends with different viscosity has been shown to separate upon drying and cooling
[23]. The polyester will migrate to the surface and the starch layer will be found below due to higher
viscosity.This structure will however present higher water resistance than only a starch surface, due to
the polyester surface. In this study the only polyester-starch blend investigated is using PLA in a particle
dispersion. Starch blend films containing sodium alginate and CW are also investigated.
2.9.5 Alginate Film Formation Mechanism
The main mechanism in polysaccharide films are the same, breaking down the polymer into segments
and restructuring of the polymer into a gel or film matrix [46]. Commonly this is done by creating
hydrogen bonds, and for the alginate case also ionic crosslinking. Sodium alginate, which is used in this
study, will normally form a water-soluble film whereas calcium alginate will form an oil-soluble film
[50]. Films from alginates can be made with two characteristics, either by evaporating a solution of
alginate to get a water-soluble film or by further treating the film with di- or trivalent cations to crosslink
and get a non-soluble film. Commonly Ca2+ ions are used for this physical crosslinking, which can be
viewed as junction zones of several Ca2+ ions aggregating and coordinated by oxygen atoms, not as
chemical crosslinking [34]. The water-insoluble films will though swell upon prolonged exposure to
aqueous liquids due to that they do not repel water. Alginate water-soluble films are brittle but can be
plasticized and are non-sticky [50].
2.9.6 Protein Film Formation Mechanism
The film formation of proteins involves several mechanisms creating intermolecular bonding where the
interactions can consist of disulfide, hydrogen or hydrophobic bonds but also electrostatic or ionic
interaction [39]. The matrix in protein-based films generally get its structure from the protein-protein
interactions which are heat catalyzed [46]. The main mechanism is thus believed to be an endothermic
process of polymerization of the denatured protein together with surface dehydration. Compared to other
film-forming materials proteins are special in the case of the conformational denaturation, electrostatic
charges and amphiphilic nature. In this study soy and potato protein are studied.
When heat processing is used the proteins disaggregate and denature before they dissociate and unravel
and finally align in the direction of the flow [36]. This allows recombination and crosslinking of the
polymers and can increase the Tg. The film matrix protein structure can be modified by heat, pressure,
irradiation, mechanical treatments or crosslinking among others. To affect the film forming mechanism
of proteins the pH can be changed, heat denaturation performed, change solvent and do chemical
modifications of side chains and crosslinking among others [46]. In a study of thermoplastic
compression molding of proteins, it has been found that the higher temperatures used, the more extensive
is the denaturation and crosslinking of the proteins [36]. Compression molding at 140 °C instead of 104
°C resulted in a film nearly insoluble but still flexible.
2.9.7 Wax Film Formation Mechanism
The mechanism of the film formation in pure waxes is based on wax melts that crystallizes and therefore
the film formation is dependent on the cooling process into wax crystals. Wax dispersion film formation
is similar to the latex film formation mechanism as long as used below Tm. In this study a dispersion of

16
CW is used. The CW used in the dispersion has a melting temperature of about 84 °C and is therefore
not melted when coated without heating. If the barrier coatings are dried at temperatures above Tm, the
wax particles will melt and have lower viscosity and thereby either penetrate the paperboard or flow
over the surface to the valleys.

17
3 MATERIALS AND METHODS
Based on the literature study, several biopolymers were found as potential barriers and the materials in
Table 2 were acquired for characterization in this project. The paperboard, Ensocoat™ produced by
Stora Enso, on which the barriers were coated had a surface weight of 210 g/m2 and dry surface weight
of 200 g/m2 which were used for calculating coating amounts.
Table 2. Information about investigated materials, obtained from supplier safety data sheets.
Material Type Product no. / Name Supplier
Starch Corn, Modified AMITROCOAT 8903 Agrana
Starch Corn, Modified EcosphereTM 2349 BiolatexTM Binder Ecosynthetix
Starch Potato, Modified Perfectafilm x150 Avebe
Starch Potato, Modified Perfectafilm x85 Avebe
Wax disp. CW LUBA-print CA 30 Münzing
PLA disp. Polylactic acid Landy PL 1005 Miyoshi oil & fat co.,ltd
Alginate Alginic acid sodium salt 180947 Sigma Aldrich
Soy Protein Soy protein isolate Soy Protein Isolate Self Omninutrition
Potato Protein Potato protein isolate PR1803B Avebe
PREPARATION OF FORMULATIONS
All the formulations were based on literature from studies done earlier in the field. Many formulations
found in theory were applicable for edible films, in which transparency and a low solid concentration is
desirable. For barrier coatings in food packaging a solid content above 20 % would be desired as well
as a coating thickness of about 5-10 µm. The concentrations, content and references for each formulation
can be found in Appendix - Materials & Formulations. The procedures were analogous for most of the
formulations.
In general, the plasticizer was dissolved in water during stirring and heating before the addition of the
biopolymer with continued stirring and heating. All samples except the proteins were prepared by
mixing with a blender from Janke & Kunkel, Ika-Werk (Staufen im Briesgau, Germany) model Re 166
which had a capacity of 50-600 rpm. Soy protein solutions were further mixed with an Ultra Thorrax
T45, 10000 rpm, from Janke & Kunkel, Ika-Werk (Staufen im Briesgau, Germany) to reach higher
sheering forces to get an even solution and to avoid protein aggregation.
Before coating, samples that contained foam or visual bubbles were placed in a vacuum desiccator
equipment for reduction of bubbles and foam. Some formulations had, due to viscosity, to be coated
before cooling to room temperature.
The additives used were glycerol (CAS 56-81-5, Merck, Germany), D-sorbitol (CAS 50-70-4, Sigma-
Aldrich, Germany), D-mannitol (CAS 69-65-8, VWR, Belgium) and xylitol (CAS 87-99-0, Alfa Aesar,
Germany) which were used for plasticizing and succinic acid (CAS 110-15-6, BioAmber, Canada) and
CaCl2 (CAS 10043-52-4, Merck, Germany) for crosslinking. The chemicals were used as received.
The used plasticizers were based on earlier research mentioned in Section 2.8, but optimization studies
for all materials was not available. Due to some difference in plasticizer used in this study compared to
available literature, new combinations were formulated for other plasticizers for each material. For all
formulations normal tap water was used to simulate big scale conditions. All film solutions were

18
prepared without pH adjustment and the concentration is written as the wt % of all components except
the plasticizers which were added as a wt % of polymers.
3.1.1 Starches
All starches were heated until gelatinization
before coating. The Amitrocoat starch has been
pre-gelatinized which means physically modified
and soluble in cold water. The Perfectafilm starch
has a 100 % amylopectin content and is also
physically modified while Ecosphere, see Figure
8, has been modified with methods such as
internal crosslinkers and plasticizers to form the
starch particles described in the patent for the
material [51].
Attempts for crosslinking with SA was done
based on earlier promising results as mentioned
earlier in Section 2.2 but due to the set limitations,
phosphorylation step was not done. SA was
dissolved in 10 mL H2O at a concentration of 0.15 wt % SA to polymer and added to the solution during
stirring. The coated samples were then dried at 105 °C and duplicates were dried at 150 °C based on
literature suggestions.
Starch concentrations was kept at 30 % except for starch blends, see Appendix - Materials &
Formulations for full information about the formulations.
3.1.2 Polylactic Acid
PLA was used as received in a dispersion, with a concentration of around 40 %. Plasticizer were
dissolved in 5 ml H2O before added to the solution during stirring, without pre-heating of the dispersion.
PLA and thermoplastic starch blends were discussed by Plackett, [23], it was there suggested that
modified starch might improve interfacial bonding between the polymers due to the immiscibility
between native starch and hydrophobic polymers. Therefore, PLA was blended with the modified
starches in this study, at the same ratio as the wax blends.
3.1.3 Wax
The wax dispersion was used as received, with a concentration of around 30 %, without pre-heating and
plasticizers were added as in Section 3.1.2. In the combination with starch, the wax dispersion was added
at temperatures below its Tm. The starch and wax blend was based on the formulations done by Santos
et al., [18], which suggested a wax/starch ratio of 1:5 but herein starch was gelatinized with the
plasticizer before the addition of wax.
3.1.4 Sodium Alginate
Sodium alginate formulation was based on a procedure described by Rhim et al., [35], although the solid
content was increased to 6.86 % instead of 4.67 % and different plasticizer were used. Other research
groups have been using concentrations up to 7.5 % as reported by Jost and Reinelt [31]. After coating,
crosslinking with a 5 % solution of CaCl2 was done based on an immersion process studied by Rhim
[52]. The crosslinking was performed at the surface by pouring a solution of 100 ml or 25 ml CaCl2-
solution on top of the board for 5 min.
Figure 8. Light microscopy of Ecosphere particles.

19
Alginate-starch blend was prepared based on the method utilized by Jiang et al. [24] but developed into
a higher solid content of 15 %, excluding plasticizer. Starch was dissolved in 50 ml H2O, together with
plasticizer and gelatinized. Thereafter alginate dissolved in 30 ml H2O was added and stirred.
3.1.5 Soy Protein Isolate (SPI)
SPI formulations were based on a method by Cho & Rhee, [53], dissolved in water with pre-dissolved
plasticizer during stirring and further stirred at 10000 rpm for two minutes. Concentration was increased
up to 15 wt % SPI as in the procedure suggested by Rhim et al. [35].
3.1.6 Potato Protein Isolate (PPI)
PPI was used as received in an aqueous solution with a concentration of 18 % potato proteins. This made
the formulation preparation different from the SPI. Plasticizer was added directly during stirring to the
PPI solution and dissolved in the solution before coating.
Crosslinking attempts were done with SA using three different concentrations, 0.15 %, 0.5 % and 5 %
of polymer weight. The acid was added directly into the PPI solution after dissolution of plasticizer in
the solution.
BARRIER COATING
Barriers were coated with a bench coater, K303 Multicoater purchased from RK Print Coat Instrument
(Litlington, United Kingdom) equipped with an on-line IR drying system from Ircon Drying Systems
(Vänersborg, Sweden). Several dryings could be performed by letting the IR system sweep over the
surface again after coating. Wire wounded rods used for coating had a wire diameter of 0.3 mm (No.3)
to 1.02 mm (No. 7) [54]. Starch barriers with SA were dried in a TS4057 oven from Termaks (Bergen,
Norway) at 105 °C and 150 °C.
All coated samples were stored in 23 °C with 50% RH for at least 12 hours. Coating amounts were
measured simultaneously as moisture content of the coated paperboard by using a moisture analyzer,
EM120-HR, Precisa Gravimetrics AG (Dietikon, Switzerland). The sample was heated and weight loss
in terms of moisture vaporizing measured.
PROCESS PLAN AND PERFORMANCE COMPARISON
The materials investigated has varying natural behavior and properties. Due to that an iterative process
was used for characterizing and excluding materials based on trials, see Figure 9. After coating the
formulations, the barriers were tested and the ones which did not performed as desired were eliminated
or reformulated in other combinations. The characterization was performed on the better performing
moisture barrier coatings and further exclusion of materials were done until a conclusion about most
promising moisture barrier materials and formulations could be done.

20
Figure 9. Process flow chart of the study.
To achieve that conclusion, some comparisons between chosen materials were done:
Comparison between starch types as barrier coatings was done with pinholes and Cobb 600
tests, since they have the same film forming mechanism.
The CW particles in dispersion was compared with the PLA dispersion which also exhibit the
same film forming mechanism.
The protein isolates are both water soluble and built up by amino acids but differing in
composition and appearance, due to their similarities and alike general properties they were
compared.
PINHOLES
The test was carried out by applying a red solution mainly consisting of turpentine with a paintbrush
over the surface and letting it set for 15 seconds before removing the excess liquid with paper. Results
were examined by counting and dividing the pinholes into levels, see Table 3 .
Table 3. Pinholes classification of results
Pinholes no. Pinhole levels
0 0
1-50 1
50-100 2
>100 3
No barrier 4
COBB 600
The water absorptiveness was determined by the ISO 535:2014(E) standard method Cobb. The coated
paperboard was weight and put onto the equipment with a metal ring, having an area of 100 cm2, tightly
attached upon the coated surface. Distilled H2O, 100 ml, was poured into the metal ring for direct contact
with the barrier. Cobb 600 is determined by 600 seconds of water contact. After the removal of the

21
water, the paperboard was blotted, and the weight of the board was once again measured and recalculated
to grams water absorbed per square meter (g/m2).
WATER VAPOR TRANSMISSION RATE (WVTR)
The moisture barrier property was expressed by WVTR. It is the amount of water vapor permeating an
area unit per time in a specific environment [23].WVTR is normally decreased with increased coating
weight and drying temperature [15]. WVTR was measured with a Permatran-W®, model 3/34, from
Mocon (Minneapolis, USA) in 50 % RH and 23 °C according to ASTM F 1249. Circular duplicate
samples with an area of 50 cm2 was used.
CLIMATE CYCLING IN MOISTURE GENERATOR
For determination of moisture uptake, sorption, among the barrier coated samples a moisture generator
was used. The samples were placed hanging in a chamber where the climate was controlled and
cycled. The program used was 120 min at 50 % RH, 660 min at 80 % RH, 660 min at 50 % RH, 660
min at 20 % RH and 660 min at 50 % RH.
THERMOGRAVIMETRIC ANALYSIS (TGA)
TGA was used to study the degradation temperatures of polymers by recorded mass loss with increasing
temperature, using a TGA/SDTA 851e apparatus from Mettler Toledo (Ohio, USA). The samples were
placed in unsealed platina pans and heated with air from 50 °C to 900 °C, the air flow was 50 ml/min
DIFFERENTIAL SCANNING CALORIMETRY (DSC)
DSC is a characterization technique that was used to identify thermal transitions of the polymers and
influences on them by polymer interactions. It is done by heat flow comparison of sample and an empty
reference. From the thermograms, information about Tg, Tm and crystallization characteristics was
obtained. A DSC 3 STARe System, Mettler Toledo (Ohio, USA), was used together with an auto
sampler. A program of two cycles was used with temperature range -20 °C to 230 °C, with heating and
cooling of 10 K/min with N2 gas with a flow of 50 ml/min. Samples were prepared in 40 µl aluminum
crucible with a hole in the lid for gas outlet.
FOURIER-TRANSFORM INFRARED SPECTROSCOPY (FTIR)
FTIR was used to evaluate crosslinking and plasticizer effects. Analysis were done on coated paperboard
using a Nicolet iS10, Thermo Scientific (Massachusetts, USA). Spectra were collected with a resolution
of 4 at a range of 400 – 4000 cm-1 with 32 scans. Attenuated total reflection (ATR) technique was
performed with Smart Orbit accessory, Thermo Scientific (Massachusetts, USA) and diamond crystal
with a penetration depth of 2 µm.

22
SCANNING ELECTRON MICROSCOPY (SEM)
For visualization of the barrier coatings SEM was performed. Field-emission SEM (FESEM) was
performed on cross-sections of the samples at Stora Enso Research Center Imatra (RCI) with a FEI
Quanta 200 SEM, FEI (Brno, Czech Republic) and a solid-state detector for imaging from backscattered
electrons. Tilt imaging and surface visualization was performed at Stora Enso Research Center Karlstad
(RCK) using an EVO MA10, Zeiss (Oberkochen, Germany).
An IM4000, Hitachi (Tokyo, Japan), ion-beam cutter was used to prepare cross-section samples for
FESEM. The samples were sputtered for seven hours with argon ions at an acceleration voltage of 3 kV,
0.08 cm3·min-1 gas flow and discharge voltage of 1.5 kV and further on sputtered with carbon. The tilt
and surface samples were gold sputtered before epoxy embedding and set for hardening for 12 hours.
After epoxy embedding the samples were polished in four steps and rinsed with ethanol between each
step.

23
4 RESULTS AND DISCUSSION
The results of barrier coating performance are presented in sections of each material type while the
plasticizers, degradation of biopolymers and WVTR are presented separately. The moisture content for
all barrier coated samples were between 6-8 % after drying.
All the polymers where rheological possible to coat with a concentration around 10-30 %, except
alginate which had a max concentration of 5 % to possibly 7 % due to higher viscosity than the other
materials. The drying conditions varied for several samples, for example alginate needed three times IR
drying to be dried while wax dispersion was limited to one IR drying to not melt. Perfectafilm x150/CW
blend required a temperature at 50-60 °C to be coatable due to high viscosity at lower temperatures. PPI,
PLA dispersion and wax dispersion had very low viscosity compared to the other samples, but they were
still possible to coat. PPI might have been on the low viscosity limit due to floating of the solution
between coating and full drying. The PLA and wax dispersions had in combination with the low
viscosity also highest solid content of around 40 % and 30 %, respectively. Plasticizers are required for
all starch, protein and alginate samples. PPI was in the end found to require higher than 20 % plasticizer
and for alginate 40 % was used as suggested by literature [47].
Most of the starch solution samples increase in viscosity when stored. The viscosity was not measured
but a visual appearance was noted, and the bench coater acted as the limit for the viscosity possible or
not. SPI formulations were not storable in room temperature due to bacterial growth identified by a
distinct odor.
After formulation development and barrier tests, four starch blends and crosslinked alginate was chosen
for further characterization with TGA, DSC, WVTR and SEM, see Table 4. The two combinations with
PLA was not successful regarding coating morphology identified with SEM. Therefore, the two
starch/PLA blends were eliminated, and left were barrier coatings no. 1-3 in Table 4 as the most
promising ones.
Table 4. Final formulations for characterization; CaCl2 crosslinked alginate and starch blends consisting of Perfectafilm x150
with alginate, wax, PLA and PLA/alginate plasticized with sorbitol (S) and xylitol (X).
No. Final formulations for characterization
1 Alginate-S-CaCl2- 25 ml
2 Perfectafilm x150-Alg-S, X
3 Perfectafilm x150-Wax-S, X
4 Perfectafilm x150-PLA-S, X
5 Perfectafilm x150-PLA-Alg-S, X
STARCH
Four starches were examined in this study, but Perfectafilm x85 only partly due to that it is the same
product as Perfectafilm x150 only lower in viscosity, and due to availability, the tests were mainly
performed with Perfectafilm x150. Some results do though indicate a difference between the two, with
Perfectafilm x85 as the superior one in Cobb 600, see Figure 11, possibly due to the evenness of the
coating. Perfectafilm x85 was possible to coat at 30 % while Perfectafilm x150 had to be reduced to 20
% to achieve good coatability, by reason of the higher viscosity.

24
The starch types were expected to perform different due to their diverse nature and pre-modifications.
Comparison of Cobb 600 and pinholes result for the different starch formulations are presented in
Figure 11. Cobb 600 comparison of starch types. Ecosphere reference sample is plasticized with S, X.
Starch/CW were used at a 5:1 ratio, Perfectafilm x85 was not combined with CW. Starch/alginate ratio
was also 5:1.
Figure 10. Pinholes comparison of starch types. Reference of Ecosphere was plasticized with sorbitol and xylitol. Starch/CW
were used at a 5:1 ratio, Perfectafilm x85 was not combined with CW. Starch/alginate ratio was also 5:1
From pinhole levels, no clear pattern was observed but Ecosphere was in general inferior. All starches
exhibited in some cases an uncertain behavior in terms of that there were not round pinholes present but
instead it might have been small cracks or colored fibers, but neither going through the paperboard.
These were classed as level three of pinholes in case of potential cracks in the barrier. All combinations
of starch with alginate except Ecosphere had level zero of pinholes, which probably was due to good
compatibility with alginate, related to the similar structure and film-forming mechanism mentioned in
Section 2.9.5. Amitrocoat/CW blend had zero pinholes, but a Cobb 600 level in range with Perfectafilm
x150/CW, see Figure 11. On the opposite, Ecosphere/CW blend had level four pinholes, but had the
lowest Cobb 600 value of all single coated formulations. An explanation for this might be the wax being
spread over the surface hindering the water to pass through but not compatible with Ecosphere creating
phase separation, but this was not visually confirmed. All starch pinholes results are presented in Table
17.
Several samples showed a high number of tiny pinholes not penetrating through the paperboard. These
were assumed to origin from bubbles and foam in the barrier solution hinting that there was a thin film
formed beneath the bubbles which hindered penetration throughout the paperboard. Therefore, vacuum
degassing was performed on Amitrocoat and Ecosphere references, resulting in a lower number of
pinholes for the first but not the latter type, which is why Ecosphere was excluded for further
characterization.

25
Figure 11. Cobb 600 comparison of starch types. Ecosphere reference sample is plasticized with S, X. Starch/CW were used
at a 5:1 ratio, Perfectafilm x85 was not combined with CW. Starch/alginate ratio was also 5:1.
The Ecosphere starch should be somewhat more hydrophobic than Amitrocoat, hence show lower water
permeability. This is due to that Amitrocoat starch has longer chains and should be able to hold more
water. This was not seen in Cobb 600 for the reference samples, but Ecosphere might have been better
if the reference had been non-plasticized, because when combining them both with alginate and glycerol
Amitrocoat had more than twice as high Cobb value. They both presented higher Cobb values compared
to Perfectafilm in combination with alginate.
Perfectafilm x150 was in the end chosen to be used in combination with the other materials and the
results for each starch blend will be found in respective materials section. Potentially could further tests
have been done with Perfectafilm x85 due to higher solid content possible for coating, but this was not
possible due to lack of material.
The DSC thermograms presented for each starch blend only contain minor differences, this is due to
that the change of heat capacity at Tg or heat flow signal is much weaker for starch than for conventional
polymers [55]. Additionally, Perfectafilm x150 consists of 100 % amylopectin which has a Tg in the
range of 50-60 °C which could be disappearing in the broad peak for water and of course the paperboard
plays a big role in the results because it is the main constituent of the sample. The barrier represents only
a small amount of the weight logged in DSC. The DSC thermographs are presented for each material
that is combined with starch in respective section.
4.1.1 Crosslinking with Succinic Acid
The crosslinking attempt with SA had failed at the higher drying temperature, 150 °C, which was
confirmed visually by the cracked structure of Amitrocoat and confirmed by pinholes test on all samples
with a result of level three. This was expected since 150 °C is much higher than the commonly used 105
°C, but the literature suggested it as a crosslinking temperature and it was therefore investigated. The
samples dried at 105 °C was tested with pinholes, where a lot of tiny pinholes or cracks were visual,
level three was ascribed to all samples except level one for Perfectafilm x85. It was confirmed with
FTIR that there was an effect of the addition of SA in the absorption bands of Perfectafilm x85, see
Figure 12, but both the pinholes and Cobb 600 values had increased.

26
The changes in the FTIR bands were mainly at 3694 cm-1, 1794 cm-1, 1732 cm-1, and around 1400 cm-
1, see Figure 12. The change at 1400 cm-1 was attributed to an increase in -CH3 symmetric vibrations
and the appearance of the bands at 1794 cm-1 and 1732 cm-1 to stretching of carbonyl, C=O, probably
as aldehyde, ketone or ester. At 3694 cm-1 it is a signal of free OH-stretching. Since this product consists
of 100 % amylopectin there is a high content of branches and end points that would be available for
reaction than in the more symmetrical amylose, but no conclusion of how the molecule has bonded with
Perfectafilm x85 couldbe done. As described in Section 2.2, crosslinking with SA and its derivatives
has produced ester bonds. If the bands at 1794-1732 cm-1 would be ascribed to ester bonds a potential
crosslinking could be present. Due to the opposite of expected crosslinking effects in test results, the
FTIR result was assumed to be misleading. Therefore, this crosslinking method was not further
investigated for starch.
Figure 12. FTIR effect of adding crosslinking agent SA to Perfectafilm x85. Perfectafilm x85 reference (red) and Perfectafilm
x85-0.15 % SA, dried at 105 °C (blue).
PLA
The coatings with PLA performed very well in pinholes test, even though there were a rather unusual
result, the liquid colored the surface, but nothing went through the paperboard, hence zero pinholes
was ascribed to the samples, see Table 16.
For Cobb 600, both single and double layered coating was tested for PLA dispersion due to the
unsatisfying Cobb 600 results for PLA dispersion. As expected the double layered barriers performed
better than all single layered tests with 54 g/m2 for PLA, reducing the Cobb value with 23-27 %. For
single layered coating the Perfectafilm x150/PLA combination with only sorbitol, 64 g/m2, was superior
to all other PLA barrier coated samples and highest Cobb 600 result was seen for further combination
with both starch and alginate at 76 g/m2, see Table 18.
The double layered coatings gave higher coating amounts than desired 5-10 g/m2, single layered
coatings and starch/PLA had a value of 4.3 g/m2, see Table 15.

27
From Cobb 600 and pinholes results it was decided to continue characterizing the Perfectafilm
x150/PLA starch and Perfectafilm x150/PLA/Alginate blends. The double layered coatings were not
further studied due to that the main interest lies in the performance of single layered barrier coatings due
to technical, practical and economical aspects. It was however proved that a second layer improved the
barrier properties, which was expected.
From the TGA results, see Figure 26 in section 4.8, it was concluded that the PLA dispersion degrades
in two steps. First, probably evaporation ofthe liquid solution at 60 °C and secondly the PLA particles
starting to degrade at 250 °C, which works for a DSC program up to 230 °C. The DSC results for the
coated Perfectafilm x150/PLA can be seen in Figure 13. The large endothermic peak at 80 °C is due to
water loss upon heating. The steps created in the peak at 100 °C and 120 °C could be the melting of
PLA particles at different size, but the Tm is usually somewhat higher as mentioned in Section 2.3. The
broad vague peak in the second heating step is probably the representation of the second melting of the
PLA particles and is broad due to the spread particle agglomerates melting over a wider temperature
range than single particles. Nothing remarkable was seen in the cooling step except for a small step at
180-190 °C, also seen in first heating-step, potentially representing the recrystallizing of the particles or
vaporization of some compound.
Figure 13. DSC thermograph for Perfectafilm x150/PLA plasticized with sorbitol and xylitol, cycling from -20 °C to 230 °C
twice with a cooling step.
In the climate cycling in the moisture generator, Perfectafilm x150/PLA blend followed the expected
behavior, see Figure 30 and Table 5, but had a lower moisture content at the final 50 % RH compared
to reference paperboard, see Table 20, indicating a reducing effect of moisture uptake by the barrier and
no water retention of the barrier itself. Due to that all barriers only were coated on one side, the range
of the moisture difference between the samples was small, ±1 %.
When increasing the RH from 50 % to 80 % an efficient moisture barrier will reduce the moisture uptake
compared to the reference paperboard, and a lower moisture content will be seen at equilibrium. When
going from 50 % to 20 % RH a sample that have high water retention will show a higher moisture
content, furthermore a sufficient barrier would have reduced the water retention capacity leading to a
lower moisture content. It can also be the barrier itself taking up moisture which will show an increased

28
moisture content compared to pure paperboard. In the final step when going back to 50 % RH the water
retention of the sample and barrier can be observed, if above zero the paperboard and or the barrier have
taken up moisture. If the percentage is also higher than for the reference board, it can be concluded that
the barrier has taken up moisture. For Perfectafilm x150/PLA there were an effect of a functioning
barrier in all steps.
Table 5. Climate cycling of Perfectafilm x150/PLA blend at 50-80-50-20-50 % RH.
Climate cycling of Perfectafilm x150/PLA-Sorbitol/Xylitol
RH % Moisture content (%) at eq.
50 0.06
80 2.86
50 0.17
20 -2.46
50 -0.27
The Perfectafilm x150/PLA/Alginate combination failed as a reason of technical issues during climate
cycling but were inferior to both Perfectafilm x150/PLA and Perfectafilm x150/Alginate in the other
tests and was therefore eliminated. From the SEM images it could be concluded that there was a
heterogeneous dispersion of PLA particles in the starch matrix, see Figure 14. The noncontinuous PLA
content was somewhat expected since the ratio of 1:5 was low and compatibility with starch should be
low due to different nature, starch soluble in water and PLA not, which explains the aggregation of PLA
particles. It could also be the effect of interaction between dispersion stabilizers and the starch but these
resons were not further investigated. Literature do anyhow suggest blends of the two polymers as
mentioned in Section 3.1.2, but with different formulations and processing.
Figure 14. SEM (A) and FESEM (B) image of Perfectafilm x150/PLA dispersion blend. Surface imaging (A) with 1000 x
magnitude and cross-section (B) with 3500 x magnitude.
For a continuous film the PLA amount should have been higher but even though this PLA-islands are
present, the barrier properties regarding Cobb 600, pinholes and climate cycling was in range with the
other starch combinations. When using SEM, it could be seen that the particles were melting at higher
resolutions, this could be utilized in the formulation and drying process, showing that higher mixing
temperatures, above Tm and drying intensity might melt the particles and could create a uniform film.
Due to this uneven PLA distribution in the starch matrix this particular formulation of starch/PLA was
eliminated but for future studies PLA used in a barrier coating has potential.
A B

29
To compare PLA with the other material non-soluble in water, the CW creating an even film when
mixed with starch. Their difference was expected and can be explained by their different nature, PLA
polymerization from lactic acid and CW which is a natural vegetable wax from threes. Since the CW is
one of the hardest natural waxes, the PLA dispersion could be expected to be more flexible, which might
be possible since there were no opposing results for that in this study. This could be confirmed with
mechanical tests in further studies.
WAX
First thing observed regarding the CW dispersion was the sensitivity to drying conditions. At more than
one IR drying the surface became matte, uneven colored and scratch sensitive, which probably was
caused by melting of the starch particles during drying. Therefore, only one drying with the IR
equipment was used. The effect of this was noticed by higher pinholes level at more than one drying,
see Table 16.
The wax dispersion itself gave zero pinholes when coated and when combined with Amitrocoat, but in
the case with Perfectafilm combination, pinholes were present but in a lower amount when dried once
and plasticized with only sorbitol. The Cobb 600 value for the both starches were nevertheless the same,
remarkably there was a big difference in CW/Ecosphere blend which had the lowest Cobb value of all
single layer coated barriers, see Table 18, but still the highest pinholes level. This might be an indication
for incompatibility of the two polymers but good individual performance of the CW dispersion. Which
could be expected of OH-rich starch and the nonpolar wax.
In the characterization with DSC the coated paperboard followed the behavior as for the other tested
samples with the big water peak at 85 °C representing water and other compounds in the dispersion.
There could be two peaks in one due to that Tm of CW should be around 80-85°C which could explain
the minor shift to the right compared to PLA dispersion. A recrystallization step could be seen at 80-70
°C in the cooling step which agrees with the assumed melting. A small step can be seen at 40 °C in the
first heating step which it is hard to do any assumptions about.
Figure 15. DSC thermogram of Perfectafilm x150/CW blend, plasticized with sorbitol and xylitol. Cycling from -20 °C to 230
°C twice with a cooling step.

30
In the climate cycling Perfectafilm x150/CW performed worse than the paperboards in all steps. At the
last climate, 50 % RH, Perfectafilm x150/CW had a water retention of 0.07 % which were even higher
than 0.04 % of the reference board, meaning that the barrier took up moisture itself, which would be
ascribed to the starch matrix and not the wax particles, see Table 6 and Figure 28. The high moisture
content could in general possibly be explained by the pinholes present, but anyhow no pinholes could
be observed in SEM and FESEM showing a very even surface, see Figure 16.
Table 6. Climate cycling of Perfectafilm x150/CW blend at 50-80-50-20-50 % RH.
Climate cycling of Perfectafilm x150/CW-Sorbitol/Xylitol
RH % Moisture content (%) at eq.
50 0.07
80 3.14
50 0.44
20 -2.12
50 -0.07
Figure 16. SEM (A) tilt imaging and FESEM (B) on cross-section of Perfectafilm x150/CW blend plasticized with sorbitol and
xylitol.
As for PLA dispersion, double layered coating was tested with Cobb 600 for CW dispersion. An
improvement of 20-25 % was seen which was not as great as for PLA dispersion. The double
combinations were not further investigated in this study but proved improvement of barrier properties
for double layered wax coating.
The wax formulations are a bit complicated to analyze since the results in several cases are opposing
from one test to another. It can though be concluded that CW in the right combinations can perform
really good in barrier tests, but optimization needs to be done to find a formulation with a consistent
sufficient performance in all types of tests. From SEM it can also be concluded that the barrier is
evenly covering the surface with Perfectafilm x150 without clear pinholes present.
SODIUM ALGINATE
Alginate was the superior material regarding pinholes. For all combinations and reference samples,
except for Amitrocoat-glycerol combination, no pinholes could be seen, results are presented in Table
16. Due to that, it could be somewhat expected to see a good performance in Cobb 600 but with respect
to the water solubility of alginate, the CaCl2 crosslinked samples were expected to perform best in Cobb
A
B A B

31
600. So was the case except for when combined with Perfectafilm x85 and coated with rod 7 which had
an even lower value. The sample with Perfectafilm x150 was coated with rod 3 which might be the
reason for higher Cobb value, see Table 7.
Table 7. Cobb 600 values for sodium alginate with combinations. S-Sorbitol, M-Mannitol, X-Xylitol, SA-Succinic acid, G-
glycerol. Coated with rod no. 3 or 7.
Test
No: Combination (rod type)
Conc.
(Wt %) Additive
Additive (g), (% of
polymer wt)
Cobb
(g/m2)
1 Alginate/Perfectafilm x85 (#7) 2+20 S 4.4 (20 %) 62.2
2 Alginate-CaCl2-25 ml (#7) S 2 (40%) 61.6
3 Alginate-CaCl2-100 ml (#7) 5 S 2 (40 %) 65.8
4 Alginate-CaCl2-100 ml (#7) 5 M 2 (40 %) 68.4
5 Alginate/Perfectafilm x85 (#3) 2+20 S 4.4 (20 %) 69.6
6 Alginate Perfectafilm x150/PLA
(#3)
S, X 2 (33 %) 76.4
7 Alginate/Perfectafilm x85-SA
0.15% (#3)
2+20 S 4.4 (20 %) 79
8 Alginate/Perfectafilm x150 (#3) 2+10 S, X 3 (20 %) 81.8
9 Alginate/Ecosphere (#3) 1+5 G 2 (33 %) 89
10 Alginate/Amitrocoat (#3) 1+5 G 2 (33 %) 195.8
The coating amounts of alginate presented in Table 15 are in general low compared to the other
materials. This is mainly explained by the low concentration of the formulations. To get the desired
coating amount rod no. 7 should be used for all coatings containing alginate. Rod no. 3 was used when
starch was the main component but as can be concluded from the mentioned results that it gave an
insufficient coating amount.
The crosslinking of alginate with CaCl2 was vital for a better moisture barrier performance, the first
attempts was done with 100 ml CaCl2-solution on a crosslinking area of 100 cm2. The barrier was heavily
affected and the paperboard beneath started to curl. The volume was therefore decreased to 25 ml
keeping the 5 % CaCl2 concentration and five min crosslinking time. The pinholes result was unchanged
at zero and the Cobb 600 results improved. The crosslinking was confirmed with FTIR, see Figure 17.
An attempt to add crosslinker in solution was done but as described in literature by Rhim, [52], the
solution became heavily crosslinked after a few minutes and not coatable.

32
Figure 17. FTIR spectra of CaCl2 crosslinked sodium alginate (blue), reference (red).
Changes in the FTIR spectra of the crosslinked sample (blue) with respect to the reference (red) caused
by crosslinking can be observed at 2955 cm-1, 1795 cm-1, 1730 cm-1, 1500 cm-1 and 1028 cm-1. Other
differences are ascribed to the effect of plasticizing by comparison with a non-crosslinked but plasticized
sample. At 2955 cm-1 the absorbance of C-H stretching is reduced and at 1730-1795 cm-1 C=O stretching
does no longer has an absorbance band. At 1500 cm-1 the band is narrowed towards 1424 cm-1 because
of less symmetric O-C-O stretching. The reduction of the band at 1028 cm-1 is attributed to less CO-
stretching. This reduction of absorption bands was expected due to that the crosslinking will hinder
stretching and bending of the alginate chains and create ionic bonds with Ca2+, organizing the structure
into the “eggbox” shape, see Figure 5.
Further characterization with TGA, DSC and SEM were due to the pinholes and Cobb 600 results done
on three formulations; 25 ml crosslinked alginate, in combination with Perfectafilm x150 and with both
Perfectafilm x150 and PLA. The latter one was eliminated from the SEM and FESEM result showing
the same behavior as for PLA/starch with PLA particle agglomerates distributed in the starch/alginate
film, see Figure 14.
Figure 18. SEM (A) surface imaging and FESEM (B) of cross-section of sodium alginate plasticized with sorbitol and
crosslinked with 25 ml CaCl2. Surface imaging of 500 x magnitude and cross-section at 3500 x magnitude.
A B

33
The combination with Perfectafilm x150/alginate had somewhat more pinholes than crosslinked alginate
when visualizing the surfaces in SEM, see Figure 18 and Figure 19, and higher values in Cobb 600
which gave the outcome that CaCl2-crosslinked alginate would be the most promising alginate
formulation.
Figure 19. SEM (A) tilt image and FESEM (B) cross-section image of Perfectafilm x150/alginate blend plasticized with sorbitol
and xylitol. Tilt image at 500 x magnitude and cross-section at 3500 x magnitude.
In addition to the promising Cobb results and SEM imaging, the 25 ml crosslinked alginate barrier had
the lowest moisture content in the climate cycling at the last cycle step, 50 % RH, with -0.6 %.
Interestingly it also exhibits the highest moisture content at 80 % RH and lowest at 20 % RH, see Table
8 and Figure 29. It indicates water sorption of alginate but also release of the water at the 20 % RH step.
This means that the alginate barrier coating is sensitive to the RH in the environment, which can be
crucial for the application.
Table 8. Climate cycling of Alginate-Sorbitol-CaCl2-25 ml at 50-80-50-20-50 % RH.
Climate cycling of Alginate-Sorbitol-CaCl2-25 ml
RH % Moisture content (%) at eq.
50 -0.07
80 3.30
50 -0.09
20 -2.98
50 -0.6
Climate cycling of the starch blend was somewhat better than the crosslinked sample and reference
paperboard, especially in the final, 50 % RH, where it had a moisture content of -0.23 compared to 0.04
of the reference paperboard, see Table 9. At the intermediate 50 % RH it had higher moisture content
than the crosslinked sample, indicating that it is less tunable by the environment.
Table 9. Climate cycling of Perfectafilm x150/Alginate at 50-80-50-20-50 % RH.
Climate cycling of Perfectafilm x150/Alginate-Sorbitol/Xylitol
RH % Moisture content (%) at eq.
50 0.01
80 2.90
50 0.15
A B

34
20 -2.49
50 -0.23
In TGA it could be seen that alginate started to degrade at 230 °C and were therefore the reason to
limiting the DSC cycling up to 230 ° C. The DCS thermographs for both crosslinked alginate and in the
starch blend were following the same behavior as the other barriers. A step could be seen at 140 °C in
the broad water loss peak probably due to Tm for sodium alginate, according to literature [56].
Figure 20. DCS thermograph of coated alginate plasticized with sorbitol and crosslinked with CaCl2. Cycling from -20 °C to
230 °C twice with a cooling step.
From the DSC result of Perfectafilm x150/alginate, see Figure 21, no significant peaks were seen except
the loss of water represented at 85 °C in first heating step. The step at 140 °C in crosslinked alginate
was not present in the starch blend. Only a small step at 25 °C was seen but cannot be associated to
neither Tg for starch, nor alginate [57]. By comparing the thermographs, degradation for the crosslinked
alginate can be assumed to start due to the vague peak at 200-220 °C, but for the starch blend no effect
that could be related to degradation can be seen, which is in order with literature suggesting that starch
blends shift the melting temperature [57].

35
Figure 21. DSC Thermograph of coated Perfectafilm x150/alginate plasticized with sorbitol and xylitol. Cycling from -20 °C
to 230 °C twice with a cooling step.
The GG/MM/GM-block ratio is not known for the sodium alginate used in this study but does have an
influence on the crosslinking ability. Therefore, a known ratio with high GG-block content would be
preferable and probably will decrease the water vapor transmission rate further. Calcium alginate is
another type of alginate that should be investigated in future studies since it is an oil-soluble film and
probably will present better moisture barrier properties than sodium alginate.
SPI
When doing formulations with SPI, a lot of foam was created. The foam was removed by vacuum
degassing in a vacuum exicator as for some of the starches. Improvement in pinholes was seen both
using the defoaming method and by increasing the shear forces and treatment time with the Ultra
Thorrax up to two min. The later coatings were very smooth and had less pinholes, but the Cobb 600
values was still the worst of the tested materials, see Table 18. This was not so unexpected since SPI
without additives has shown to have a very high WVP of 354 g µm/m2·day·atm in literature [39].
Therefore, it could be of high interest to combine SPI with other materials such as starch or alginate.
A crosslinking attempt was done with SA and confirmed with FTIR showing new absorption bands at
2827 cm-1 caused by CH stretching and 1733 cm-1 from C=O stretching, see Figure 22. The change in
bands indicates the presence of SA but nevertheless the pinholes result became worse (level three) than
for only plasticized SPI (level zero) which was problematic and the reason for no further investigation
of this formulation.
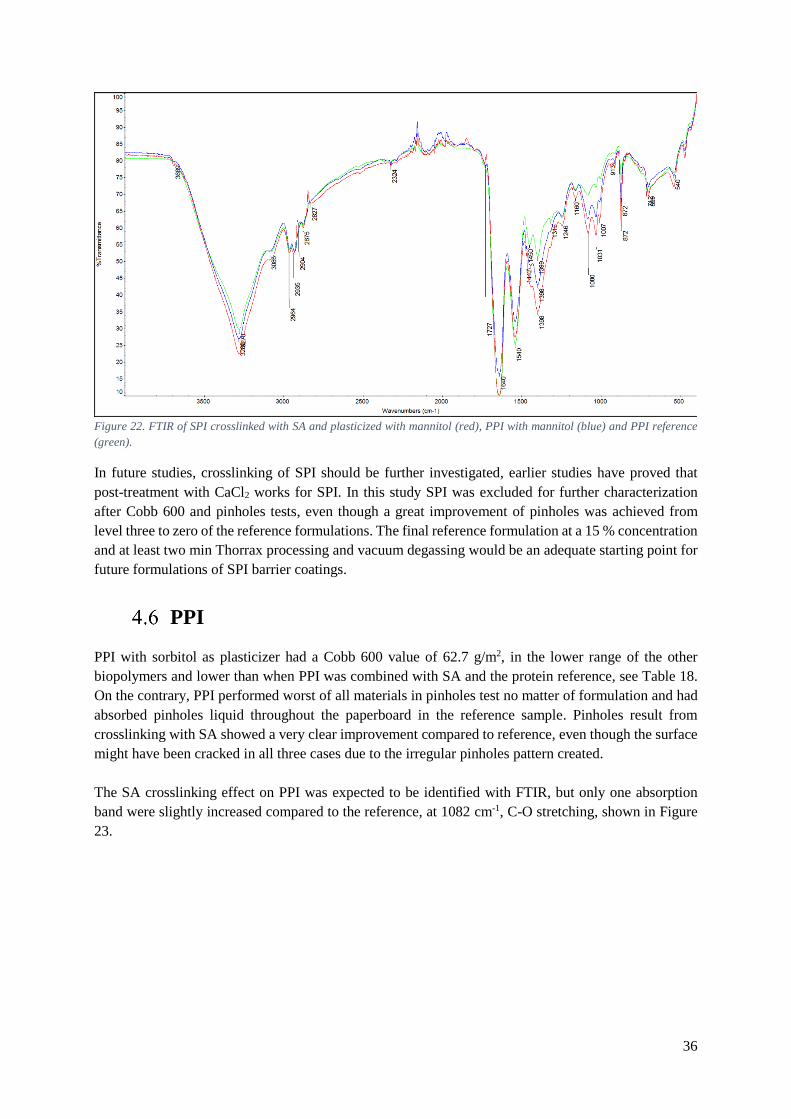
36
Figure 22. FTIR of SPI crosslinked with SA and plasticized with mannitol (red), PPI with mannitol (blue) and PPI reference
(green).
In future studies, crosslinking of SPI should be further investigated, earlier studies have proved that
post-treatment with CaCl2 works for SPI. In this study SPI was excluded for further characterization
after Cobb 600 and pinholes tests, even though a great improvement of pinholes was achieved from
level three to zero of the reference formulations. The final reference formulation at a 15 % concentration
and at least two min Thorrax processing and vacuum degassing would be an adequate starting point for
future formulations of SPI barrier coatings.
PPI
PPI with sorbitol as plasticizer had a Cobb 600 value of 62.7 g/m2, in the lower range of the other
biopolymers and lower than when PPI was combined with SA and the protein reference, see Table 18.
On the contrary, PPI performed worst of all materials in pinholes test no matter of formulation and had
absorbed pinholes liquid throughout the paperboard in the reference sample. Pinholes result from
crosslinking with SA showed a very clear improvement compared to reference, even though the surface
might have been cracked in all three cases due to the irregular pinholes pattern created.
The SA crosslinking effect on PPI was expected to be identified with FTIR, but only one absorption
band were slightly increased compared to the reference, at 1082 cm-1, C-O stretching, shown in Figure
23.

37
Figure 23. PPI reference (red) and PPI plasticized by sorbitol and with 5% SA(blue)
Crosslinking was expected since proteins containing positive amino groups, hence should be more likely
to crosslink with negative SA than starch. The PPI solution was received at pH 3 which also could have
an impact on crosslinking but was not further investigated. It could later be confirmed with SEM that
PPI with 0.15 % SA had a fully cracked surface with very thin coverage, but the cracked flakes seemed
smooth, see Figure 24. Another factor to consider is the potentially uneven distribution of the coating
due to its low viscosity, which could explain the uncertain observations of the SEM tilt image with
different stacked parts charged.
Figure 24. SEM (A-B) and FESEM (C) imaging of PPI-0.15 % SA. Tilt imaging at 150 x magnification (A), surface imaging
(B) at 1000 x magnification and cross-section(C) at 3500 x magnification.
A B
C

38
Due to the cracked surface and poor performance in Cobb and pinholes, PPI was excluded from further
characterization. An improvement of the barrier in mechanical aspects can be made by increasing the
plasticizer content to higher levels than 100 wt %. This will on the other hand deteriorate the moisture
barrier ability. Since this material was received as a liquid solution it should have even greater potential
that SPI to be combined with other biopolymers to improve its barrier properties.
PLASTICIZER
Mannitol and sorbitol as plasticizers were compared by performing Cobb 600 test on several samples
plasticized with either of the two, see Table 10. Since the substances are very similar structure-wise,
only differing in the direction of one OH group no big differences was expected and observed, see Figure
25.
Table 10. Biopolymers used for plasticizer comparison
Figure 25. Cobb 600 results for plasticizer comparison of sorbitol and mannitol. Sample numbers are represented in Table 10.
Further tests were performed with sorbitol and in combination with xylitol due to that it is a wider
studied substance for plasticizing biopolymers according to literature. Glycerol was tested for a few
starch samples but showed significantly higher Cobb values for starch/alginate blend, which was the
reason for exclusion of glycerol. For many materials a plasticizer content of 20-45 weight-fraction was
suggested but the plasticizers allow swelling of starch and reduces water resistance due to more flexible
polymer chains, therefore the lower suggested percentages were used in most cases, see Table 13 for
concentrations used.
4549535761656973778185899397
1 2 3 4 5 6
Co
bb
60
0 (
g/m
2)
Sample Number
Comparison of Sorbtiol and Mannitol
Mannitol Sorbitol
Sample no. Biopolymer
1 PLA
2 2x PLA
3 Wax dispersion
4 2xWax disp.
5 SPI
6 Sodium Alginate
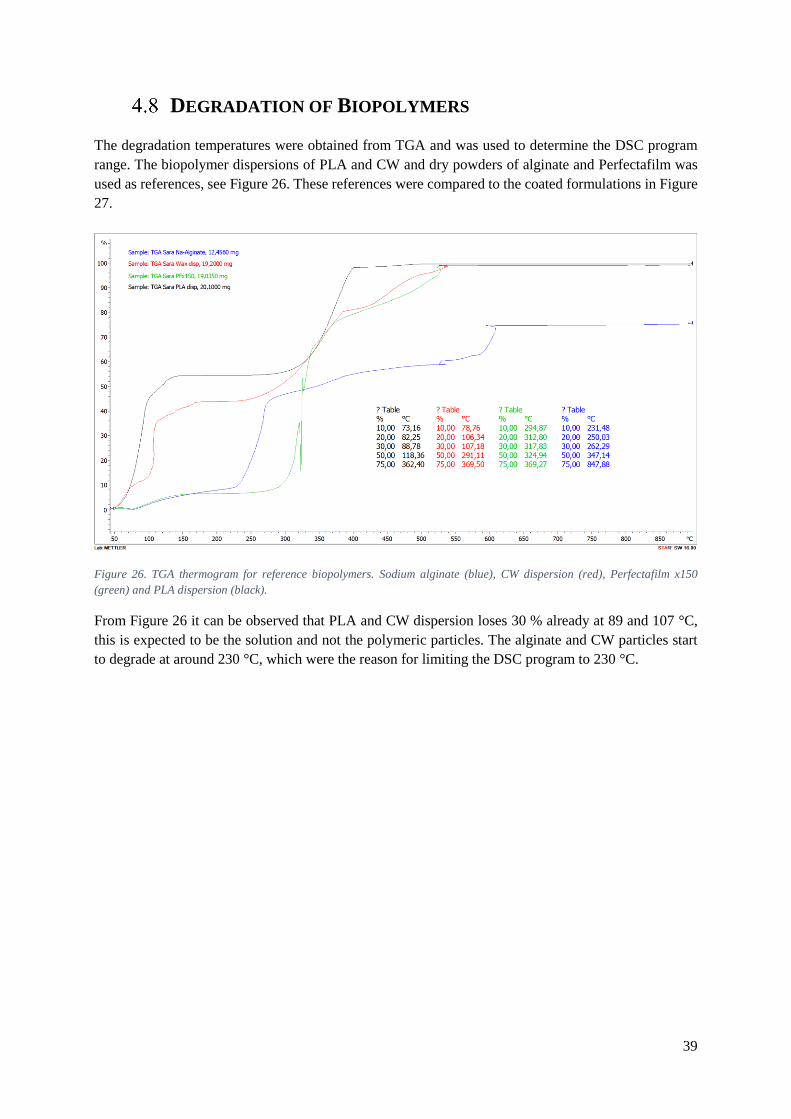
39
DEGRADATION OF BIOPOLYMERS
The degradation temperatures were obtained from TGA and was used to determine the DSC program
range. The biopolymer dispersions of PLA and CW and dry powders of alginate and Perfectafilm was
used as references, see Figure 26. These references were compared to the coated formulations in Figure
27.
Figure 26. TGA thermogram for reference biopolymers. Sodium alginate (blue), CW dispersion (red), Perfectafilm x150
(green) and PLA dispersion (black).
From Figure 26 it can be observed that PLA and CW dispersion loses 30 % already at 89 and 107 °C,
this is expected to be the solution and not the polymeric particles. The alginate and CW particles start
to degrade at around 230 °C, which were the reason for limiting the DSC program to 230 °C.

40
Figure 27. TGA results for the Perfectafilm x150 blends used as an indication for DSC range to be used. Perfectafilm
x150/sodium alginate (red), Perfectafilm x150/CW dispersion (green), Perfectafilm x150/PLA/Alginate (purple), Perfectafilm
x150/PLA dispersion (brown), Sodium alginate-CaCl2-25 ml (black), reference paperboard (blue).
When performing TGA on the coated paperboard none of the samples loses more than 10 % at 230 °C
which confirms that the temperature works for DSC analysis.
MOISTURE BARRIER PERFORMANCE
The results from WVTR was all out of range or at the maximum readable value, 91.8486 g/(m² · day),
which makes the results unreliable. It can be concluded that they are higher than for common barrier
materials made of fossil-based plastics.
The climate cycling was another test revealing the performance of the barriers. In Table 11 the data
presented in each material section is concluded.
Table 11. Summary of climate cycling data for four barrier coatings presented in each material section. S-Sorbitol, X-Xylitol.
Climate cycling in moisture generator
RH % Moisture content (%) at equilibrium
Perfectafilm
x150/Alginate-S/X
Perfectafilm
x150/PLA-S/X
Perfectafilm
x150/CW-S/X
Alginate-Sorbitol-
CaCl2-25 ml
50 0.01 0.06 0.07 -0.07
80 2.90 2.86 3.14 3.30
50 0.15 0.17 0.44 -0.09
20 -2.49 -2.46 -2.12 -2.98
50 -0.23 -0.27 -0.07 -0.6
It can be seen that the alginate crosslinked with CaCl2 is the most tunable by the moisture changes. At
80 % RH the starch/PLA and Starch/alginate has the lowest moisture levels, which means most
efficient barriers in this environment. In the final 50 % RH observations regarding the moisture
retention can be done, if it goes back to start value at the first 50 % RH or stays with a higher moisture

41
value means that moisture has been trapped in the barrier or board. All formulations have low values
except for the starch/CW combination which is on the negative side but close to zero, hence more
moisture than the others but not more than in the beginning. From this test starch combined with
alginate or PLA performs best, while alginate is the poorest in moisture impact and starch/wax
intermediate.
5 CONCLUSION AND FUTURE WORK
Several biopolymers investigated as barriers in this study performed very well in some assessments, but
fewer was there that presented an appropriate moisture barrier in all tests. Formulations with only
biopolymers were in the most cases inferior to combinations of several biopolymer, which agrees with
literature mentioned in Section 2 for each material. Therefore, different polymer blends were examined
as barriers, using starch as the base in these formulations due to good film-forming properties and
processability. The starch type chosen for characterization, Perfectafilm, had zero pinholes and lowest
Cobb 600 value of all reference samples. It was expected that Perfectafilm x150 and Perfectafilm x85
would have shown the same reference properties, but when the reference of Perfectafilm x150 was tested
after characterization of biopolymers it turned out to be inferior to Perfectafilm x85. Probably a suitable
viscosity would have been in the range between the two Perfectafilm types.
Successful crosslinking of alginate was performed with CaCl2, the main effect was shown by a reduction
in Cobb 600 values and confirmed by FTIR. Since earlier research mentioned in Section 2.2 crosslinked
starch with derivatives of SA and conducted pre/post-modifications, the expectations for only using SA
was open-ended. Some effects on molecular level was confirmed with FTIR on Perfectafilm, but not
distinguished to if bonds were created or if it was a change in FTIR bands due to free SA molecules.
However, the performance of the barriers did not improve by the addition of SA.
The most efficient bio-based moisture barriers appearing from this research seems to be a multi-layered
coating, when referring to the PLA and CW dispersion double coated layers which had lowest Cobb 600
values. There are though many aspects driving the need for a single layer coating, such as less raw
material required and lower weight leading to lower environmental impact. The single layered barriers
all performed about three times better than pure paperboard (234 g/m2) in Cobb 600 but were still far of
inferior quality to fossil-based plastics.
It should also be noticed that the pinholes results might be the same level for some samples, but very
different appearance in the reality. Small surface cracks for the Perfectafilm x85 but tiny circular
pinholes for the SPI. In this case the Perfectafilm x85 can be assumed to present better barrier properties
but be very brittle. It might be possible to fully eliminate the cracks by adding more plasticizer and
vacuum treat the solutions further before coating. A problem is the increase of water uptake with
increasing plasticizer, but to decrease the WVP, a lipid plasticizer can be used [46]. The optimization of
plasticizers could be done in the future by also looking at the mechanical properties. Nanoclays have
been suggested as a possible filler to reduce costs and in some cases to improve the moisture barrier
properties, but the sustainability is a concern [26]. Optimization studies of crosslinkers should be done
and environmental aspects of such material evaluated. Interesting combinations would be
Perfectafilm/sodium alginate blend coated with rod 7 and CaCl2 post-treatment and to study the
crosslinking of SPI with CaCl2. The outcome of this study suggests beyond that the materials most likely
for continued research as alginate, wax dispersion and modified starch, but they are not yet adequate
substitutes to fossil-based polymers.

42

43
6 BIBLIOGRAPHY
[1] StoraEnso, "Barrier Coating Options," Stora Enso, 2016. [Online]. Available:
http://assets.storaenso.com/se/renewablepackaging/DownloadDocuments/BarrierCoating-en.pdf.
[Accessed 02 05 2018].
[2] G. M. Insights, "Biopolymer Coatings Market Size By Product," Global Market Insights, 2017.
[Online]. Available: https://www.gminsights.com/industry-analysis/biopolymer-coatings-market.
[Accessed 23 02 2018].
[3] J. Vartiainen, M. Vähä-Nissi and A. Harlin, "Biopolymer Films and Coatings in Packaging
Applications—A Review of Recent Developments," MSA, vol. 5, pp. 708-718, 2014.
[4] Å. Nyflött, "Structure - Performance Relations of Oxygen Barriers for Food Packaging,"
Karlstad University, Karlstad, 2017.
[5] C. Johansson, J. Bras, I. Mondragon, P. Nechita, D. Plackett, P. Simon, D. G. Svetec, S.
Virtanen, M. G. Baschetti, C. Breen, F. Clegg and S. Aucejo, "Renewable fibres and bio-based
materials for packaging applications - A review of recent developments," Bioresources, vol. 2,
no. 7, pp. 2506-2552, 2012.
[6] A. Wilkinson and A. D. McNaught, IUPAC Compendium of Chemical Terminology (the "Gold
Book"), 2 ed., M. Nic, B. Kosata, A. Jenkins and J. Jirat, Eds., Oxford: Blackwell Scientific
Publications, 1997.
[7] N. Reddy, R. Reddy and Q. Jiang, "Crosslinking biopolymers for biomedical applications,"
Trends Biotechnol, vol. 33, no. 6, pp. 362-369, 2015.
[8] O. Weizman, A. Dotan, N. Yiftach and A. Ophir, "Modified whey protein coatings for improved
gas barrier properties of biodegradable films," Polym Advan Technol, vol. 28, no. 2, pp. 261-
270, 2017.
[9] F. A. Momany, D. J. Sessa, J. W. Lawton, G. W. Selling, S. A. Hamaker and J. L. Willett,
"Structural Characterization of α-Zein," J Agr Food Chem, vol. 2, no. 54, pp. 543-547, 2006.
[10] Chitosanlab, "Chitosanlab Vegan," Chitosanlab, [Online]. Available:
https://chitosanlab.com/vegan/need-less-25kg/. [Accessed 01 03 2018].
[11] J. Vartiainen, Y. Shen, T. Kaljunen, T. Malm, M. Vähä-Nissi, M. Putkonen and A. Harlin, "Bio-
based multilayer barrier films by extrusion, dispersion coating and atomic layer deposition," J
Appl Polym Sci, vol. 133, no. 2, 2015.
[12] S. Mirmehdi, P. R. G. Hein, C. I. G. d. L. Sarantópoulos, M. V. Dias and G. H. D. Tonoli,
"Cellulose nanofibrils/nanoclay hybrid composite as a paper coating: Effects of spray time,
nanoclay content and corona discharge on barrier and mechanical properties of the coated
papers," Food Packaging and Shelf Life, vol. 15, pp. 87-94, 2018.
[13] V. K. Rastogi and P. Samyn, "Bio-Based Coatings for Paper Applications," Coatings, vol. 4, no.
5, pp. 887-930, 2015.

44
[14] H. M. Azeredo and K. W. Waldron, "Crosslinking in polysaccharide and protein films and
coatings for food contact – A review," Trends in Food Sci & Tech, vol. 52, pp. 109-122, 2016.
[15] J. Kuusipalo, Paper and Paperboard Converting, Helsinki: Finnish Paper Engineer's Association,
2008.
[16] A. J. Carvalho, "Chapter 15 - Starch: Major Sources, Properties and Applications as
Thermoplastic Materials;," in Monomers, Polymers and Composites from Renewable Resources,
M. N. Belgacem and A. Gandini, Eds., Amsterdam, Elsevier, 2008, pp. 321-342.
[17] W. Commons, "File:Figure 03 02 06.jpg," 2016. [Online]. Available:
https://commons.wikimedia.org/wiki/File:Figure_03_02_06.jpg. [Accessed 07 05 2018].
[18] T. M. Santos, A. M. B. Pinto, A. V. de Oliveira, H. L. Ribeiro, C. A. Caceres, E. N. Ito and H.
M. Azeredo, "Physical properties of cassava starch–carnauba wax emulsion films as affected by
component proportions," Int J Food Sci Tech, vol. 49, no. 9, 2014.
[19] K. Khwaldia, E. Arab-Tehrany and S. Desobry, "Biopolymer Coating on Paper Packaging
Materials," CRFSFS, vol. 9, no. 1, pp. 82-91, 2010.
[20] Z. Zhu, H. Zheng and X. Li, "Effects of succinic acid cross‐ linking and mono‐ phosphorylation
of oxidized cassava starch on its paste viscosity stability and sizability," Starch - Stärke, vol. 65,
no. 9-10, 2013.
[21] Đ. Ačkar, D. Šubarić, J. Babić, B. Miličević and A. Jozi, "Modification of wheat starch with
succinic acid/acetanhydride and azelaic acid/acetanhydride mixtures. II. Chemical and physical
properties," J Food Technol, vol. 51, no. 8, 2014.
[22] Đ. Ačkar, J. Babić, A. Jozinović, B. Miličević, S. Jokić, R. Miličević, M. Rajič and D. Šubarić,
"Starch Modification by Organic Acids and Their Derivatives: A Review," Molecules, vol. 20,
pp. 19554-19570, 2015.
[23] D. Plackett, Biopolymers - New Materials For Sustainable Films and Coatings, 1 ed., D.
Plackett, Ed., John Wiley & Sons, Ltd, 2011.
[24] X. Jiang, G. Chen and Z. Q. Fang, "The Application of Starch-Sodium Alginate Composite
Coating on Transparent Paper for Food Packaging," in Advanced Materials and Engineering
Materials III, vol. 893, K. Kida, Ed., Durnten-Zürich, Trans Tech Publications, 2014, pp. 472-
477.
[25] L. Wang, S. Ma, L. Lu and Y. Zhao, "Preparation Process of Corn Starches/Sodium Alginate
Blend Edible Films," in 2011 International Conference on Remote Sensing, Environment and
Transportation Engineering, 2011, pp. 7003-7005.
[26] C. Ingaro and V. Siracusa, "Quality-and sustainability-related issues associated with
biopolymers for food packaging applications: a comprehensive review," in Biodegradable and
Biocompatible Polymer Composites, N. G. Shimpi, Ed., , Woodhead Publishing, 2018, pp. 401-
418.
[27] . G. K. G. Kovács and T. Tábi, "Biodegradable polymers based on starch and poly(lactic acid),"
Plastics Research Online, 2011.

45
[28] W. Tinto, T. Elufioye and J. Roach, "Chapter 22 - Waxes," in Pharmacognosy, S. Badal and R.
Delgoda, Eds., Boston, Academic Press, 2017, pp. 443-455.
[29] A. Lozhechnikova, H. Bellanger, B. Michen, I. Burgert and M. Österberg, "Surfactant-free
carnauba wax dispersion and its use for layer-by-layer assembled protective surface coatings on
wood," Appl Surf Sci, vol. 396, pp. 1273-1281, 2017.
[30] J. Milanovic, S. Levic, V. Manojlovic, V. Nedovic and B. Bugarski, "Carnauba wax
microparticles produced by melt dispersion technique," Chem Pap, vol. 65, no. 2, pp. 213-220,
2011.
[31] V. Jost and M. Reinelt, "Effect of Ca2+ induced crosslinking on the mechanical and barrier
properties of cast alginate films," J Appl Polym Sci, vol. 135, no. 5, p. 45754, 2018.
[32] G. George, S. B. Kumar and A. Srinivasan, "Polymer Nanocomposites for Food Packaging
Applications," in Advances in Polymer Materials and Technology, A. Srinivasan and S.
Bandyopadhyay, Eds., Taylor & Francis Group, 2017, pp. 741-777.
[33] J.-S. Yang, Y.-J. Xie and W. He, "Research progress on chemical modification of alginate: A
review," Carbohyd Polym, vol. 84, no. 1, pp. 33-39, 2011.
[34] B. A. Harper, "Understanding interactions in wet alginate film formation used for in-line food
processes," Ontario, 2013.
[35] J.-W. Rhim, J.-H. Lee and S.-I. Hong, "Water resistance and mechanical properties of
biopolymer (alginate and soy protein) coated paperboards," LWT - Food Sci Technol, vol. 39, no.
7, pp. 806-813, 2006.
[36] V. Hernandez-Izquierdo and J. Krochta, "Thermoplastic Processing of Proteins for Film
Formation—A Review," J Food Sci, vol. 73, no. 2, 2008.
[37] K. Shimada and J. C. Cheftel, "Sulfhydryl Group/Disulfide Bond Interchange Reactions during
Heat-Induced Gelation of Whey Protein Isolat," J Agr Food Chem, vol. 37, no. 1, pp. 161-168,
1989.
[38] F. Garavand, M. Rouhi, S. H. Razavi, I. Cacciotti and R. Mohammadi, "Improving the integrity
of natural biopolymer films used in food packaging by crosslinking approach: A review," Int J
Biol Macromol, vol. 104, no. A, pp. 687-707, 2017.
[39] A. Chiralt, C. González-Martinez, M. Vargas and L. Atarés, "Edible films and coatings from
proteins," in Proteins in Food Processing, 2 ed., R. Y. Yada, Ed., Woodhead Publisher, 2018,
pp. 477-500.
[40] D. Carpiné, J. L. A. Dagostin, L. C. Bertan and M. R. Mafra, "Development and
Characterization of Soy Protein Isolate Emulsion-Based Edible Films with Added Coconut Oil
for Olive Oil Packaging: Barrier, Mechanical, and Thermal Properties," Food Bioprocess Tech,
vol. 8, no. 8, pp. 1811-1823, 2015.
[41] R. R. Koshy, S. K. Mary, S. Thomas and L. A. Pthan, "Environment friendly green composites
based on soy protein isolate – A review," Food Hydrocolloid, vol. 50, pp. 174-192, 2015.

46
[42] A. Waglay and S. Karboune, "Chapter 4 - Potato Proteins: Functional Food Ingredients," in
Advances in Potato Chemistry and Technology, 2 ed., J. Singh and L. Kaur, Eds., San Diego,
Academic Press, 2016, pp. 75 - 104.
[43] S. González-Pérez and J. Arellano, "15 - Vegetable protein isolates," in Handbook of
Hydrocolloids (Second edition), 2 ed., G. Phillips and P. Williams, Eds., Woodhead Publishing,
2009, pp. 383 - 419.
[44] D. Schäfer, M. Reinelt, A. Stäbler and M. Schmidt, "Mechanical and Barrier Properties of Potato
Protein Isolate-Based Films," Coatings, vol. 8, no. 2, 2018.
[45] P. M. Tomasula, "Using dairy ingredients to produce edible films and biodegradable packaging
materials," in Dairy Derived Ingredients - Food and Nutraceutical Uses, Woodhead Publishing,
2009, pp. 589-624.
[46] J. H. Han, Innovations in Food Packaging (Second Edition), 2nd ed., J. H. Han, Ed., Academic
Press, 2014.
[47] V. Jost and C. Stramm, "Influence of plasticizers on the mechanical and barrier properties of cast
biopolymer films," J Appl Polym Sci, vol. 133, no. 2, 2015.
[48] J. L. Keddie and A. F. Routh, Fundamentals of Latex Film Formation, H. Pasch, Ed., Dordrecht:
Springer, 2010.
[49] Z. L. And and J. Han, "Film-Forming Characteristics of Starches," J Food Sci, vol. 70, no. 1, pp.
E31-E36, 2005.
[50] D. J. McHugh, "Chapter 2 - Production, Properties and Uses of Alginates," in Production and
Utilization of Products from Commercial Seaweeds, D. J. McHugh, Ed., Rome, Food and
Agriculture Organization of the United Nations, 1987.
[51] R. H. Wildi, E. Van Egdom and S. Bloembergen, "Process for Producing Biopolymer
Nanoparticles". US Patent 6,677,386, 2008.
[52] J.-W. Rhim, "Physical and mechanical properties of water resistant sodium alginate films," LWT
- Food Sci Technol, vol. 37, no. 3, pp. 323-330, 2004.
[53] S. Y. Cho and C. Rhee, "Mechanical properties and water vapor permeability of edible films
made from fractionated soy proteins with ultrafiltration," LWT - Food Sci Technol, vol. 37, no. 8,
pp. 833-839.
[54] R. P. C. Instruments, "K303 Multicoater," RK PrintCoat Instruments Ltd., [Online]. Available:
http://rkprint.com/wp-content/uploads/2017/11/New-K303-MULTICOATER-11.17.pdf.
[Accessed 23 04 2018].
[55] P. Liu, L. Yu, X. Wang, D. Li, L. Chen and X. Li, "Glass transition temperature of starches with
different amylose/amylopectin ratios," J Cereal Sci, vol. 51, no. 3, pp. 388-391, 2010.
[56] Helmiyati and M. Aprilliza, "Characterization and properties of sodium alginate from brown
algae used as an ecofriendly superabsorbent," in IOP Conference Series: Materials Science and
Engineering, 2017.

47
[57] Siddaramaiah, T. Mruthyunjaya Swamy, B. Ramaraj and J. Hee Lee, "Sodium alginate and its
blends with starch: Thermal and morphological properties," J Appl Polym Sci, vol. 109, no. 6,
2008.

II-1
I APPENDIX - MATERIALS & FORMULATIONS
Properties of the tested materials, formulations, concentrations and coating amounts are shown in this
section.
I.I MATERIAL PROPERTIES
The properties of the materials used in this study are collected in Table 12 and collected from safety
data sheets associated with each product.
Table 12. Material properties for the biopolymers included in the study.
Biopolymer Solubility Appearance pH Viscosity
(mPa*s)
Density
(kg/m3)
Particle
size (µm)
Solids
(%)
Tm
(°C)
Amitrocoat 8903 Gel in cold
H2O White 5-7 1000 600 - - -
Ecosphere 2349 Water disp. White 3.0-6.0 175-350 500-700 0.05-0.15 - -
Luba print
CW dispersion Water disp.
Yellowish
White 5.8-7.2 3-10
990-
1010 3 ~30 82-88
PLA dispersion
Water disp.
in Alkaline
cond.
- - 100 - 5 40 -
Sodium alginate Soluble in its
sodium form
Faint Yellow/
Light Brown 6.5-8.5
15-25
1 % in H2O - - - -
SPI Soluble Yellowish - - - - - -
PPI Soluble in
cold H2O
Clear
yellowish 3 - - - 18 -
Perfectafilm x150 Soluble White - 150 - - - -
Perfectafilm x85 Soluble White - 85 - - - -

II-2
I.II FORMULATIONS AND CONCENTRATIONS
The complete setup of formulations that were coated are listed in Table 13 together with
corresponding concentration.
Table 13. Coating formulations of coated samples. Concentration is calculated as the polymer weight divided by polymer
plus solution weight. Plasticizer is calculated as a percentage of polymer weight. S-Sorbitol, M-Mannitol, X-Xylitol, G-
Glycerol.
No: Biopolymer Polymer (g) or
(% of solution) Additive
Plasticizer
(wt %) Solvent (H2O)
Conc.
(wt %)
1 PLA disp 40% S, X 20 5 g 27
2 PLA disp 40% M, X 20 5 g 27
3 CW disp 30% S, X 20 5 g 23
4 CW disp 30% M, X 20 5 g 23
5 Alginate-CaCl2-100ml 5g S 40 95 g 5
6 Alginate-CaCl2-100ml 5g M 40 95 g 5
7 SPI 15g S 20 85 g 15
8 SPI 15g M 20 85 g 15
9 Ecosphere/CW disp 15g/10g S 20 82.5 g 17
10 Amitrocoat/CW disp 15g/10g S 20 82.5 g 17
11 Ecosphere/Alginate 5g/1g G 33 50g/30g 7
12 Amitrocoat/Alginate 5g/1g G 33 50g/30g 7
13 Amitrocoat 30g S, X 20 70g 30
14 Perfectafilm x85/Alginate 20g/2g S 20 66.67g/30g 19
15 PPI 18% S 20 - 18
16 PPI-0.015% SA 18% S 20 - 18
17 PPI-0.5 % SA 18% S 20 - 18
18 PPI-5 %SA 18% S 20 - 18
19 Perfectafilm x150/Alginate 10g/2g S, X 20 50g/30g 13
20 Perfectafilm x150/CW disp 15g/10g S, X 20 82.5g 17
21 Perfectafilm x150/PLA disp 15g/10g S, X 20 75g 19
22 Perfectafilm x150/PLA
disp/Alginate
15g/10g/2g S, X 18 75g/-/30g 16
23 Alginate-CaCl2-25ml 5g S 40 95g 5
24 Perfectafilm x85-0.015%
SA
30g - - 70g 30
25 Amitrocoat-0.015% SA 30g - - 70g 30
26 Ecosphere-0.015% SA 30g - - 70g 30
27 SPI-0.015% SA 15g M 20 85g 15

II-3
I.III REFERENCE FORMULATIONS
Table 14. Formulations for reference barrier coating.
Test No: Biopolymer Polymer (g) or (% of solution) Added H2O (g) Conc. (%)
1 PLA 40 % - 40
2 CW 30 % - 30
3 Ecosphere 30 g 70 30
4 Amitrocoat 30 g 70 30
5 Perfectafilm x85 15 g 50 23
6 Perfectafilm x150 15 g 60 20
7 PPI 18 % - 18
8 SPI 15 g 85 15
9 Alginate 2 g 28 6.67
I.IV COATING AMOUNTS
Table 15. Coating amounts for all barrier coatings. S-Sorbitol, X-Xylitol, G-Glycerol, SA-Succinic acid.
Biopolymer Conc. (%) Additive Coating weight (g) Coating settings
Alginate/Ecosphere 7 G 2.52 IRcoat. Rod no. 3
Perfectafilm x150/PLA
disp/Alginate 16 S, X 3.15 IRcoat. Rod no. 3
Alginate/Amitrocoat 7 G 3.16 IRcoat. Rod no. 3
Alginate 5 S 3.79 IRcoat. Rod no. 7
Perfectafilm x150/CW 17 S, X 4.10 IRcoat. Rod no. 3
Perfectafilm x150/Alginate 13 S, X 4.10 IRcoat. Rod no. 3
Perfectafilm x150/PLA 19 S, X 4.26 IRcoat. Rod no. 3
Perfectafilm x85+0.15 % SA 30 - 4.42 Rod no. 3
CW 30 - 6.31 IRcoat. Rod no. 3
Alginate 5 M 6.31 IRcoat. Rod no. 7
Alginate-CaCl2-25ml 5 S, X 6.47 IRcoat. Rod no. 7
PLA 27 S, X 7.08 IRcoat. Rod no. 3
CW/Amitrocoat 17 S 7.57 IRcoat. Rod no. 3
CW 30 - 8.04 IRcoat. Rod no. 3
Amitrocoat-0.15 % SA 30 - 8.36 Rod no. 3
Ecosphere-0.15 % SA 30 - 8.68 Rod no. 3
PLA 27 M, X 8.99 IRcoat. Rod no. 3
CW/Ecosphere 17 S 11.36 IRcoat. Rod no. 3
CW 23 M, X 11.99 2 x IRcoat. Rod no. 3
Ecosphere 30 S 13.02 Rod no. 4
CW 23 S, X 14.67 2 x IRcoat. Rod no. 3
PLA 27 M, X 16.87 2 x IRcoat. Rod no. 3
PLA 27 S, X 18.29 2x IRcoat. Rod no. 3

II-4
II APPENDIX – PINHOLE RESULTS
Pinhole test were performed on all coated barriers and the full result is presented in this chapter together
with the comparison of the results for all starch-based barrier coatings.
Table 16. Barrier coatings tested for pinholes. S-Sorbitol, X-Xylitol, G-Glycerol, SA-Succinic acid.
Test no. Biopolymer Additive Pinholes level
1 Alginate - CaCl2 – 100 ml #3 - 0
17 Alginate - CaCl2 – 100 ml #7 S 0
17 Alginate - CaCl2 – 25 ml #7 S 0
15 Alginate/Perfectafilm x85 #7 S? 0
12 Alginate/Perfectafilm x85 #3 S 0
16 Alginate/Perfectafilm x150 S, X 0
7 Amitrocoat/Alginate G 0
13 Perfectafilm x150/PLA/Alginate S, X 0
10 Perfectafilm x150/PLA - 2 dry S 0
4 PLA S, X 0
14 2 x PLA S, X 0
38 Perfectafilm x150 - 0
2 Ecosphere - 0
3 Amitrocoat (Vacuum) - 0
6 SPI (Vacuum) S 0
8 CW - 0
9 CW/ Amitrocoat S 0
18 Amitrocoat - 1
19 Perfectafilm x85 (105 °C)-0.15 % SA - 1
20 Perfectafilm x150/PLA - 3 dry S 1
21 Perfectafilm x150/PLA 2 dry S, X 1
22 Alginate/Ecosphere G 1
23 2x CW S, X 1
24 Perfectafilm x150/CW 1 dry S 1
25 Perfectafilm x150/CW S, X 2
26 Ecosphere (150 °C)-0.15 % SA - 3
27 Ecosphere (105 °C)-0.15 % SA - 3
28 Amitrocoat (105 °C)-0.15% SA - 3
29 Ecosphere S, X 3
30 SPI-0.15% SA - 3
31 Ecosphere (Vacuum) S, X 3
32 Perfectafilm x150/CW 2 dry S 3
33 PPI-0.15 % SA S 3
34 Perfectafilm x85 - 3
35 Ecosphere/CW S
36 PPI - 4
37 PPI - 0.5 % SA S 4
38 PPI - 5 % SA S 4

II-5
Table 17. Pinhole results for starch-based formulations.
Test no. Biopolymer Additive Pinholes level
1 Perfectafilm x85/Alginate #7 S 0
2 Perfectafilm x85/Alginate #3 S 0
3 Perfectafilm x85 (105 °C) -0.15 % SA S 1
4 Perfectafilm x85 - 3
5 Perfectafilm x150 - 0
5 Perfectafilm x150/Alginate S, X 0
6 Perfectafilm x150/PLA/Alginate S, X 0
7 Perfectafilm x150/PLA - 2 dry S 0
8 Perfectafilm x150/PLA - 3 dry S 1
9 Perfectafilm x150/PLA - 2 dry S, X 1
10 Perfectafilm x150/CW - 1 dry S 1
11 Perfectafilm x150/CW S, X 2
12 Perfectafilm x150/CW - 2 dry S 3
13 Amitrocoat/Alginate G 0
14 Amitrocoat (Vacuum) - 0
15 Amitrocoat/CW S 0
16 Amitrocoat - 1
17 Amitrocoat (105 °C) -0.15 % SA - 3
19 Ecosphere/Alginate G 1
20 Ecosphere (150 °C) -0.15 % SA - 3
21 Ecosphere (105 °C) -0.15 % SA - 3
22 Ecosphere S, X 3
23 Ecosphere (Vacuum) S, X 3

III-6
III APPENDIX - COBB 600 RESULTS
Cobb 600 were performed on all coated barriers and the full result is presented in this chapter together
with the comparison of the results for starch types.
Table 18. Results of all Cobb 600 tests, polymer amounts and additives. S-Sorbitol, X-Xylitol, G-Glycerol, SA-Succinic acid
Test
No: Biopolymer Additive
Additive (g), (%
of polymer wt) Cobb (g/m2)
1 2x CW dispersion S, X 0.9 (30 %) 49.5
2 2x CW dispersion M, X 0.9 (30 %) 52
3 2x PLA dispersion M, X 0.8 (20 %) 53.7
4 2x PLA dispersion S, X 0.8 (20 %) 54
5 CW/Ecosphere S 3.6 (20 %) 57.1
6 Perfectafilm x85 - - 60.4
7 Alginate-CaCl2-25ml S 2 (40%) 61.6
8 Alginate/Perfectafilm
x85 (#7)
S 4.4 (20 %) 62.2
9 PPI S - 62.7
10 Perfectafilm x150/PLA S 3.8 (20 %) 63.7
11 Amitrocoat (vacuum) - - 65.3
12 CW M, X 0.9 (30 %) 65.4
13 Alginate-CaCl2-100 ml S 2 (40 %) 65.8
14 CW S, X 0.9 (30 %) 66.1
15 PPI - SA 0.15% S - 66.4
16 Perfectafilm x150/PLA S, X 3 (20 %) 66.4
17 CW/Amitrocoat S 3.6 (20 %) 68
18 CW/Perfectafilm x150 S 3.6 (20 %) 68.2
19 Alginate-CaCl2-100 ml M 2 (40 %) 68.4
20 Perfectafilm x150 - - 69.5
21 Alginate / Perfectafilm
x85 (#3)
S 4.4 (20 %) 69.6
22 Ecosphere (vacuum) S, X 1.8 (6 %) 70
23 PPI (Vacuum) - - 71.2
24 PLA M, X 0.8 (20 %) 72
25 PLA S, X 0.8 (20 %) 73.7
26 PPI S - SA 5% (20%) 74.8
27 Perfectafilm
x150/PLA/Alginate
S, X 2 (33 %) 76.4
28 Alginate / Perfectafilm
x150
S, X 3 (20 %) 81.8
29 Alginate/Ecosphere G 2 (33 %) 89
30 SPI (vacuum) M 3 (20 %) 92
31 SPI (vacuum) S 3 (20 %) 96
32 Alginate/Amitrocoat G 2 (33 %) 195.8

III-7
Table 19. Cobb 600 results for different starch types and blends.
Test
No: Biopolymer Additive
Additive (g), (%
of polymer wt) Cobb (g/m2)
6 Perfectafilm x85 - - 60.4
8 Perfectafilm x85/Alginate (#7) S 4.4 (20 %) 62.2
21 Perfectafilm x85/Alginate (#3) S 4.4 (20 %) 69.6
10 Perfectafilm x150/PLA S 3.8 (20 %) 63.7
16 Perfectafilm x150/PLA S, X 3 (20 %) 66.4
18 Perfectafilm x150/CW S 3.6 (20 %) 68.2
20 Perfectafilm x150 - - 69.5
27 Perfectafilm x150/PLA/Alginate S, X 2 (33 %) 76.4
28 Perfectafilm x150/Alginate S, X 3 (20 %) 81.8
11 Amitrocoat (vacuum) - - 65.3
17 Amitrocoat/CW S 3.6 (20 %) 68
32 Amitrocoat/Alginate G 2 (33 %) 195.8
5 Ecosphere/CW S 3.6 (20 %) 57.1
22 Ecosphere (vacuum) S, X 1.8 (6 %) 70.1
29 Ecosphere/Alginate G 2 (33 %) 89

IV-8
IV APPENDIX – CLIMATE CYCLING
Climate cycling in moisture generator was performed on the Perfectafilm x150 blends but failed for
Perfectafilm x150/PLA/Alginate due to technical issues. The four remaining results and reference
paperboard are presented in graphs following moisture content and corresponding relative humidity.
Equilibrium moisture content for paperboard are presented in Table 20.
Table 20. Climate cycling of reference paperboard.
Climate cycling of reference paperboard
RH % Moisture content (%) at eq.
50 -0.04
80 2.97
50 0.34
20 -2.15
50 0.03
Figure 28. Climate cycling of reference board (200 g/m2). Cycling program: 50-80-50-20-50 % RH.
0
10
20
30
40
50
60
70
80
90
100
-3,2-2,8-2,4
-2-1,6-1,2-0,8-0,4
00,40,81,21,6
22,42,83,23,6
0 2 4 6 8 10 12 14 16 18 20 22 24 26 28 30 32 34 36 38 40 42 44 46
RH
(%
)
Mo
istu
re c
on
ten
t (%
)
Time (h)
Climate cycling of reference paperboard

IV-9
Figure 29. Climate cycling of sodium alginate crosslinked with 25 ml CaCl2 coated on one side of paperboard, S-sorbitol used
as plasticizer. Cycling program: 50-80-50-20-50 % RH.
Figure 30. Climate cycling of starch blend consisting of Perfectafilm x150 and PLA dispersion, coated on one side of
paperboard, SX-sorbitol and xylitol used as plasticizers. Cycling program: 50-80-50-20-50 % RH.
0
10
20
30
40
50
60
70
80
90
100
-3,2-2,8-2,4
-2-1,6-1,2-0,8-0,4
00,40,81,21,6
22,42,83,23,6
0 2 4 6 8 10 12 14 16 18 20 22 24 26 28 30 32 34 36 38 40 42 44 46
RH
(%
)
Mo
istu
re c
on
ten
t (%
)
Time (h)
Climate cycling of Alginate/S-CaCl2-25 ml
0
10
20
30
40
50
60
70
80
90
100
-3,2-2,8-2,4
-2-1,6-1,2-0,8-0,4
00,40,81,21,6
22,42,83,23,6
0 2 4 6 8 10 12 14 16 18 20 22 24 26 28 30 32 34 36 38 40 42 44 46
RH
(%
)
Mo
istu
re c
on
ten
(%
)
Time (h)
Climate cycling of Perfectafilm x150/PLA/SX

IV-10
Figure 31. Climate cycling of starch blend consisting of Perfectafilm x150 and sodium alginate, coated on one side of
paperboard, SX-sorbitol and xylitol used as plasticizers. Cycling program: 50-80-50-20-50 % RH.
Figure 32. Climate cycling of starch blend consisting of Perfectafilm x150 and CW dispersion, coated on one side of
paperboard, SX-sorbitol and xylitol used as plasticizers. Cycling program: 50-80-50-20-50 % RH.
0
10
20
30
40
50
60
70
80
90
100
-3,2-2,8-2,4
-2-1,6-1,2-0,8-0,4
00,40,81,21,6
22,42,83,23,6
0 2 4 6 8 10 12 14 16 18 20 22 24 26 28 30 32 34 36 38 40 42 44 46
RH
(%
)
Mo
istu
re c
on
ten
(%
)
Time (h)
Climate cycling of Perfectafilm x150/Alg/SX
0
10
20
30
40
50
60
70
80
90
100
-3,2-2,8-2,4
-2-1,6-1,2-0,8-0,4
00,40,81,21,6
22,42,83,23,6
0 2 4 6 8 10 12 14 16 18 20 22 24 26 28 30 32 34 36 38 40 42 44 46
RH
(%
)
Mo
istu
re c
on
ten
(%
)
Time (h)
Climate cycling of Perfectafilm x150/CW/SX


![3. biopolymers - entropy biopolymersbiomechanics.stanford.edu/me239_12/me239_s05.pdf · Robert Hooke [1678] De Potentia Restitutiva. 3.3 biopolymers - entropy 13 example - entropic](https://img.pdfslide.us/doc/110x75/5e0c7ec29304af68b87dbf52/3-biopolymers-entropy-bio-robert-hooke-1678-de-potentia-restitutiva-33-biopolymers.jpg)