Embed Size (px)
Citation preview
Additional ASMA Time Performance Indicator document – Edition 00-016 Page i
Additional ASMA Time Performance Indicator document Level 1 and 2 documentation of the Additional ASMA Time performance indicator
Overview The Additional Arrival Sequencing and Metering Area (ASMA) Time addresses the time impact of the management of the arrival flow in the airspace surrounding an airport, and thus flight duration (i.e. efficiency).
This document describes the conceptual (i.e. Level 1), and logical and implementation independent model (i.e. Level 2) of the additional ASMA time performance indicator.
This version is a draft for consultation purposes (e.g. agreement on scope, presentation). The approved version of this document is quality controlled as part of the PRU Quality Management System.
Edition Number: 00-04 Edition Date: 24/02/2015 Status: Draft Intended For: Performance Scheme Stakeholders Category: Performance Monitoring and Reporting – Level 1/2
European Organization for Safety of Air Navigation

Additional ASMA Time Performance Indicator document – Edition 00-016 Page i
TITLE
Additional ASMA Time Performance Indicator document
Publications Reference: ISBN Number:
Document Identifier Edition Number: 00-06 Edition Date: 24/02/2015
Abstract This document describes the conceptual, logical and implementation independent model of the additional ASMA time performance indicator.
Keywords Performance indicator Additional Arrival
Sequencing and Metering Area (ASMA)
Authority Name Unit
Document Author Laura Capelleras PRU/SQS
Document Reviewer Rainer Koelle
Arnau Arnaiz
PRU/SQS
PRU/SQS
External Reviewers Esther Calvo Fernandez AENA
Document Approver
Additional ASMA Time Performance Indicator document – Edition 00-016 Page ii
Table of Contents
1. INTRODUCTION ................................................................................................................... 4
1.1 General .............................................................................................................................. 4
1.2 Purpose of the document ................................................................................................... 4
1.3 Scope ................................................................................................................................. 4
1.4 Summary of the performance indicator information .......................................................... 5
1.5 Acronyms and terminology ................................................................................................ 6
2. CONCEPTUAL MODEL ........................................................................................................ 7
2.1 What we ideally would like to measure .............................................................................. 7
2.2 Concept of runway optimisation ........................................................................................ 7
2.3 Conceptual approach ......................................................................................................... 8
3. LOGICAL MODEL ................................................................................................................. 9
3.1 Assumptions ...................................................................................................................... 9
3.2 Grouping of flights ............................................................................................................ 10
3.3 Overview of the logical model of the Additional and Unimpeded ASMA Times .............. 11
3.4 Logical approach to Additional ASMA Time calculation .................................................. 13
3.5 Logical approach to Unimpeded ASMA Time calculation ............................................... 13
4. MATHEMATICAL MODEL ................................................................................................... 14
4.1 Mathematical model of the Additional ASMA Time performance indicator ..................... 14 4.1.1 Step A: Filtering ....................................................................................................... 14 4.1.2 Step B: Determination of unimpeded time AC-RWY-SEC combination .................. 14 4.1.3 Step C: Calculation of Additional ASMA Time per flight .......................................... 15 4.1.4 Step D: Calculation of the Additional ASMA Time per airport ................................. 15
4.2 Mathematical model of the Unimpeded ASMA Time ....................................................... 16 4.2.1 Step 1: Filtering ........................................................................................................ 16 4.2.2 Step 2: Computations at flight level: ASMA Time, Congestion level ....................... 16 4.2.3 Step 3: Computation of the Saturation level ............................................................ 17 4.2.4 Step 4: Identification of unimpeded flights ............................................................... 19 fuci = 1, ∀fci ∋ seq fci ≤ 0.5 ∗ Lci0, otherwise .................................................. 20 4.2.5 Step 5: Computation of unimpeded time per grouping ............................................ 20
5. CALIBRATION OF MODEL PARAMETERS ....................................................................... 22
5.1 ASMA sectors .................................................................................................................. 22
5.2 Unimpeded times ............................................................................................................. 22
5.3 Day Time.......................................................................................................................... 23
6. SOURCE DATA ................................................................................................................... 24

Additional ASMA Time Performance Indicator document – Edition 00-016 Page iii
6.1 Main and secondary data sources ................................................................................... 24
7. QUALITY MANAGEMENT................................................................................................... 25
7.1 The Airport Operator Data Flow process ......................................................................... 25
7.2 Quality Assurance Framework......................................................................................... 25
7.3 Data Quality Checks ........................................................................................................ 26
7.4 Performance Indicator Quality Checks ............................................................................ 26
REFERENCES ............................................................................................................................ 27
REVISION HISTORY ................................................................................................................... 27
List of Figures Figure 1: Outbound and Inbound Traffic Queues from a Flight Phase Perspective.......................................... 7 Figure 2: Performance Measurement Approach ............................................................................................... 8 Figure 3: Conceptual approach for Additional ASMA Time ............................................................................... 9 Figure 4: ASMA sectors and bearing ............................................................................................................... 10 Figure 5: Logical steps of Additional ASMA Time calculation ......................................................................... 11 Figure 6: Logical steps of unimpeded ASMA Time calculation ....................................................................... 12 Figure 7: ASMA sectors and bearing ............................................................................................................... 22 Figure 8: Airport Data Flow process scheme including activities and actors involved. ................................... 25 Figure 9: Quality Performance Areas and corresponding Quality Indicators .................................................. 26
List of Tables Table 1: Performance Indicator summary ......................................................................................................... 5 Table 2: Acronyms and terminology .................................................................................................................. 6 Table 3: Data Sources ..................................................................................................................................... 24
Additional ASMA Time Performance Indicator document – Edition 00-016 Page 4
1. Introduction
1.1 General
This document describes the conceptual, informational, and implementation independent model of the additional ASMA time performance indicator.
The indicator is used as part of the performance monitoring and reporting under:
x SES: IR691/2010 and IR390/2013; and
x EUROCONTROL: performance review reporting.
1.2 Purpose of the document
The purpose of this document is twofold:
x to present the concept, and underlying logical and mathematical modelling of the indicator; and
x to document the processing and use of data for the calculation of the indicator.
1.3 Scope
This document covers the data processing and calculation of the additional ASMA time performance indicator.
The calculation of this performance indicator is performed according to the Airport Operator Data Flow standard for data collection and processing, under the responsibility of the airports division in the QoS department of the PRU, which is compliant with IR691/2010 and IR390/2013. For the calculation of the indicator, the Airport Operator Data Flow is combined with trajectory data provided by the Network Manager.
The associated processes and procedures are documented as part of the PRU Quality Management System.
This performance indicator is also defined in the Implementing Regulation (390/2013), Annex I, Section 2 Environment, 2.2 (b).
Additional ASMA Time Performance Indicator document – Edition 00-016 Page 5
1.4 Summary of the performance indicator information
Additional ASMA Time summary Current version status Monitoring
Version status and evolution
Conceptual Phase 2008 phase completed Technical Development 2008 phase completed Prototyping / Validation 2008 phase completed Monitoring 2009-today active Target Setting n/a Phase Out n/a
Context
KPA (SES II Performance Scheme): Environment (RP2) / Capacity (RP1)
KPA (PRC/PRU) : Efficiency Focus Area: Airport impact on flight duration Trade Offs: throughput and ATFM arrival delays. Originator: ATMAP project Supports the SES II Performance Scheme (IR 691/2010 Annex I -Section 1 - 3.1 and Section 2 - 3.1) Trade-off can be observed between additional ASMA time, ATFM delay and runway throughput.
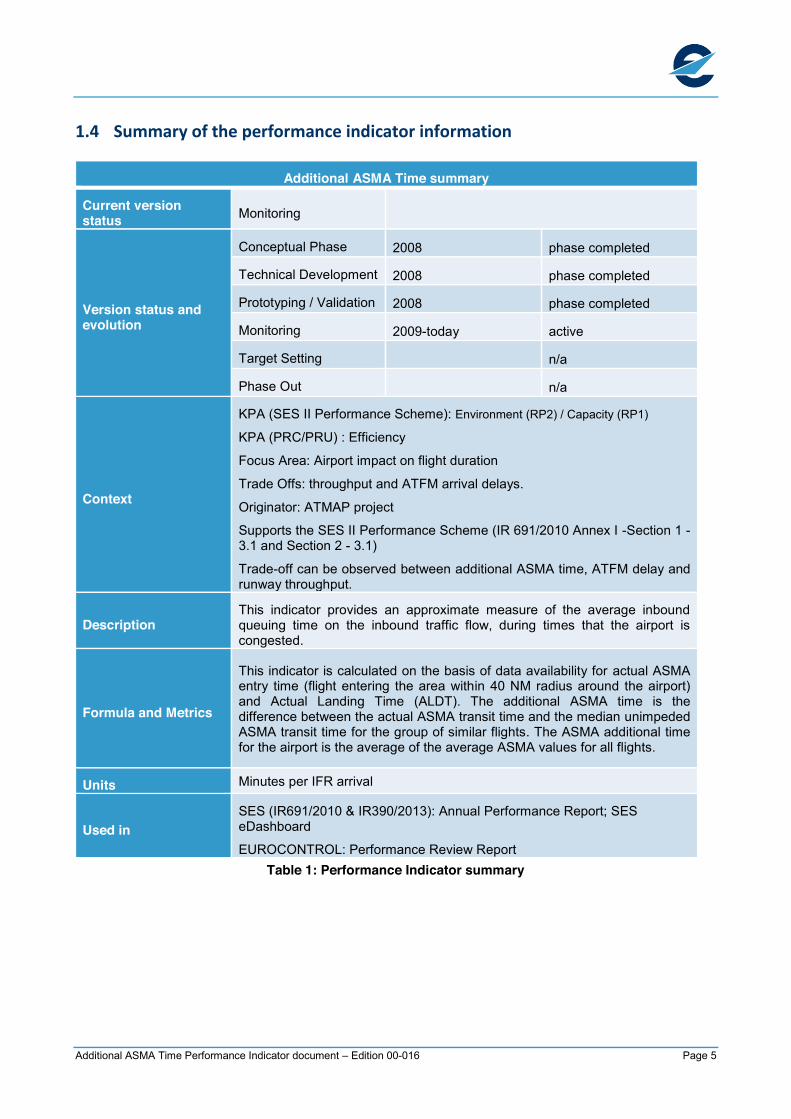
Description This indicator provides an approximate measure of the average inbound queuing time on the inbound traffic flow, during times that the airport is congested.
Formula and Metrics
This indicator is calculated on the basis of data availability for actual ASMA entry time (flight entering the area within 40 NM radius around the airport) and Actual Landing Time (ALDT). The additional ASMA time is the difference between the actual ASMA transit time and the median unimpeded ASMA transit time for the group of similar flights. The ASMA additional time for the airport is the average of the average ASMA values for all flights.
Units Minutes per IFR arrival
Used in SES (IR691/2010 & IR390/2013): Annual Performance Report; SES eDashboard
EUROCONTROL: Performance Review Report Table 1: Performance Indicator summary
Additional ASMA Time Performance Indicator document – Edition 00-016 Page 6
1.5 Acronyms and terminology
Term Definition
AC Aircraft class AdASMA Additional ASMA Time ALDT Actual Landing Time ASMA Arrival Sequencing and Metering Area
ATFM Air Traffic Flow Management
ATM Air Traffic Management
ATMAP ATM Airport Performance project
ET Entry Time
ICAO International Civil Aviation Organization
IR691 COMMISSION REGULATION (EU) No 691/2010
IR390 COMMISSION REGULATION (EU) No 390/2013
KPA Key Performance Area
KPI Key Performance Indicator
PI Performance Indicator
PRU Performance Review Unit
QoS Quality of Service
RWY Runway
SEC ASMA sector
SES Single European Sky
TMA Terminal Manoeuvring Area Table 2: Acronyms and terminology

Additional ASMA Time Performance Indicator document – Edition 00-016 Page 7
2. Conceptual model
2.1 What we ideally would like to measure
On the conceptual level, the indicator aims to address the operational penalty associated with techniques used to maximize runway utilisation for inbound traffic flows at an airport, i.e. the accumulation of additional approach time resulting from speed control, path stretching and circling in the vicinity of the airport (use of holding patterns/stacks).
2.2 Concept of runway optimisation
When aircraft cannot fly unimpeded 4D trajectories, there are generally three places at which queuing takes place, as illustrated in the Figure:
1. At the departure stand (pre-departure queuing to optimise network performance)
2. At the departure runway (take-off queuing, e.g. runway holding)
3. In the arrival terminal airspace (arrival queuing in the Arrival Sequencing and Metering Area or ASMA, using speed control, stacks, holding, extension of approach path etc.)
Figure 1: Outbound and Inbound Traffic Queues from a Flight Phase Perspective
Uncertainty of approach conditions (e.g. pilot performance, landing clearance time, approach speed, wind conditions) makes traffic supply to runways a stochastic phenomenon.
In order to ensure continuous traffic demand at runways and maximise runway usage, a minimum level of queuing is required. A certain extent of arrival queuing in airspace is necessary to allow arrival management (sequencing and metering) to optimise runway utilisation when demand is at or near the operational capacity.

Additional ASMA Time Performance Indicator document – Edition 00-016 Page 8
However, additional time in holding is detrimental to operations efficiency, fuel consumption and environment. Therefore, a trade-off exists between approach efficiency and runway throughput.
Optimisation of the runway utilisation may require:
1. Re-sequencing the take-off/ landing order at the runway (first come is not first served), and
2. buffering a sufficient number of aircraft in the queue to be able to fine tune the metering (to optimise the separation of aircraft released from the queue to the runway).
In both cases some aircraft will suffer a certain penalty in terms of queuing time. Higher runway utilisation targets may require higher levels of departure (take-off) queuing in the manoeuvring area and arrival queuing in airspace. This effect can be reduced if aircraft are already delivered to the queue in the right sequence and at the required time intervals.
To reduce cost and environmental impact, the departure and arrival queuing time should be kept to the minimum needed to achieve the selected runway utilisation objectives. If possible, any departure and arrival delay that is needed for other reasons than sequencing and metering should therefore be absorbed at the departure stand through ATFM delays and local ATC pre-departure delay. If this is done properly, then measuring outbound and inbound queuing time allows assessing the “operational cost” associated with sequencing and metering in function of the selected runway utilisation objectives.
2.3 Conceptual approach
The additional ASMA time is a proxy for the management of the arrival flow, understood as the average arrival runway queuing time on the inbound traffic flow, during periods of congestion at airports.
Performance in terms of additional ASMA time is monitored on the basis of regular reporting in comparison to a nominal reference. Based on regular reporting, metrics are derived for the respective reporting month. The current measurements are compared to a nominal reference to address the level of efficiency. The reference is derived from the statistical analysis of a reference period sample. This approach is depicted in Figure 2. Based on regular reporting, metrics are derived for the respective reporting month. The current measurements are compared to a nominal reference to address the level of efficiency. The reference is derived from the statistical analysis of a reference period sample.
Figure 2: Performance Measurement Approach
The indicator is defined as the difference between the ASMA transit time (actual ASMA time) and the unimpeded ASMA time, based on ASMA transit times in periods of low traffic.
𝐴𝑐𝑡𝑢𝑎𝑙 𝐴𝑆𝑀𝐴 𝑇𝑖𝑚𝑒 = 𝑈𝑛𝑖𝑚𝑝𝑒𝑑𝑒𝑑 𝐴𝑆𝑀𝐴 𝑇𝑖𝑚𝑒 + 𝐴𝑑𝑑𝑖𝑡𝑖𝑜𝑛𝑎𝑙 𝐴𝑆𝑀𝐴 𝑇𝑖𝑚𝑒
The unimpeded reference time is determined based on a statistical analysis of historic data observed at the airport, averaged for groupings of similar flights. The additional ASMA time is a measure for the extent of which the actual ASMA time exceeds the unimpeded reference.
Additional ASMA Time Performance Indicator document – Edition 00-016 Page 9
3. Logical model
This section describes the underlying logical modelling and drives the implementation of the additional ASMA time algorithm.
3.1 Assumptions
The purpose of the additional ASMA time indicator is to provide an approximate measure of the average inbound queuing time on the inbound traffic flow, during times that the airport is congested.
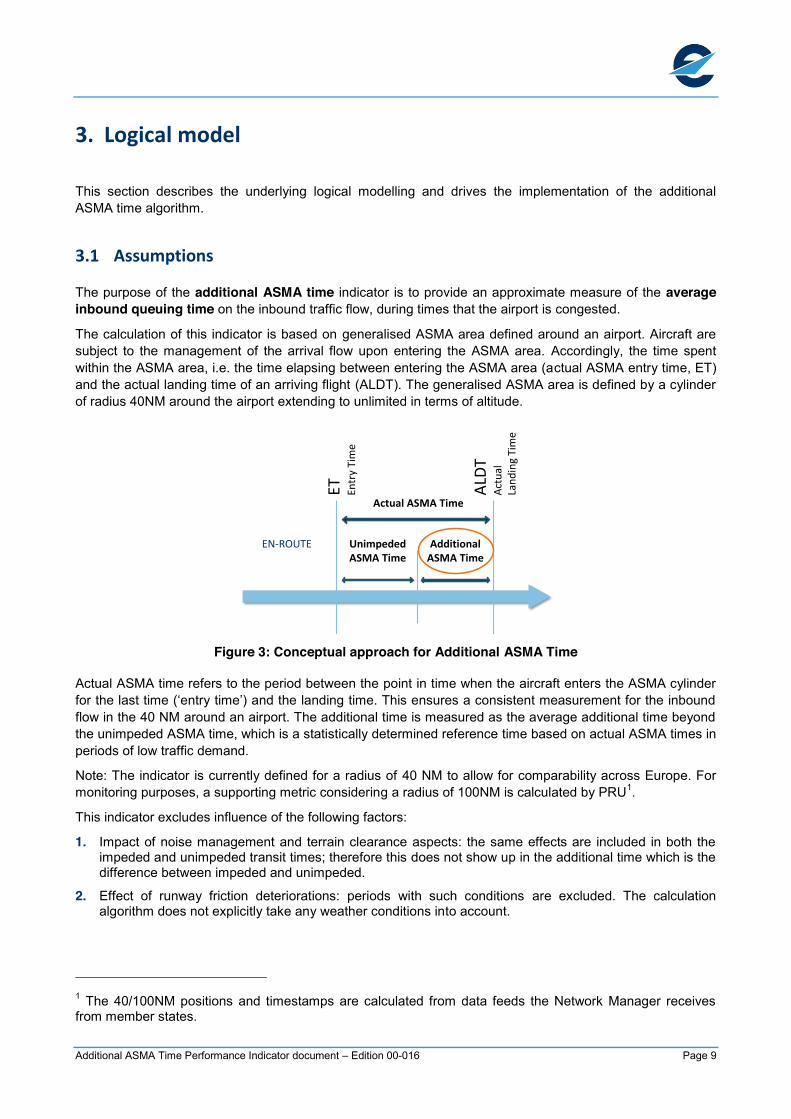
The calculation of this indicator is based on generalised ASMA area defined around an airport. Aircraft are subject to the management of the arrival flow upon entering the ASMA area. Accordingly, the time spent within the ASMA area, i.e. the time elapsing between entering the ASMA area (actual ASMA entry time, ET) and the actual landing time of an arriving flight (ALDT). The generalised ASMA area is defined by a cylinder of radius 40NM around the airport extending to unlimited in terms of altitude.
Figure 3: Conceptual approach for Additional ASMA Time
Actual ASMA time refers to the period between the point in time when the aircraft enters the ASMA cylinder for the last time (‘entry time’) and the landing time. This ensures a consistent measurement for the inbound flow in the 40 NM around an airport. The additional time is measured as the average additional time beyond the unimpeded ASMA time, which is a statistically determined reference time based on actual ASMA times in periods of low traffic demand.
Note: The indicator is currently defined for a radius of 40 NM to allow for comparability across Europe. For monitoring purposes, a supporting metric considering a radius of 100NM is calculated by PRU1.
This indicator excludes influence of the following factors:
1. Impact of noise management and terrain clearance aspects: the same effects are included in both the impeded and unimpeded transit times; therefore this does not show up in the additional time which is the difference between impeded and unimpeded.
2. Effect of runway friction deteriorations: periods with such conditions are excluded. The calculation algorithm does not explicitly take any weather conditions into account.
1 The 40/100NM positions and timestamps are calculated from data feeds the Network Manager receives from member states.
ET Entr
y Ti
me
ALDT
Actu
alLa
ndin
g Ti
me
EN-ROUTE Unimpeded ASMA Time
Additional ASMA Time
Actual ASMA Time

Additional ASMA Time Performance Indicator document – Edition 00-016 Page 10
3.2 Grouping of flights
To reduce the number of combinations of unique entry points and arrival runway, arriving flights entering the ASMA area within certain limits are grouped together. The clustering is based on observed arrival flows (i.e. crossing of flown trajectory with the ASMA cylinder).
The result of this clustering yields the ASMA sectors and may not be confused with the actual TMA or approach sectors around the airport. Each ASMA sector covers a major arrival flow, and the extent of the sector is based on visualization of arrival radar tracks (see figure below) and the aforementioned entry points.
Figure 4: ASMA sectors and bearing
The indicator is first calculated at disaggregated level, i.e. per comparable grouping of flights with the same combination of ASMA sector, landing runway and aircraft class. Each grouping of flights has an unimpeded reference associated.
Taking the weighted average of the values for all groups produces the ASMA additional time for the airport.
Additional ASMA Time Performance Indicator document – Edition 00-016 Page 11
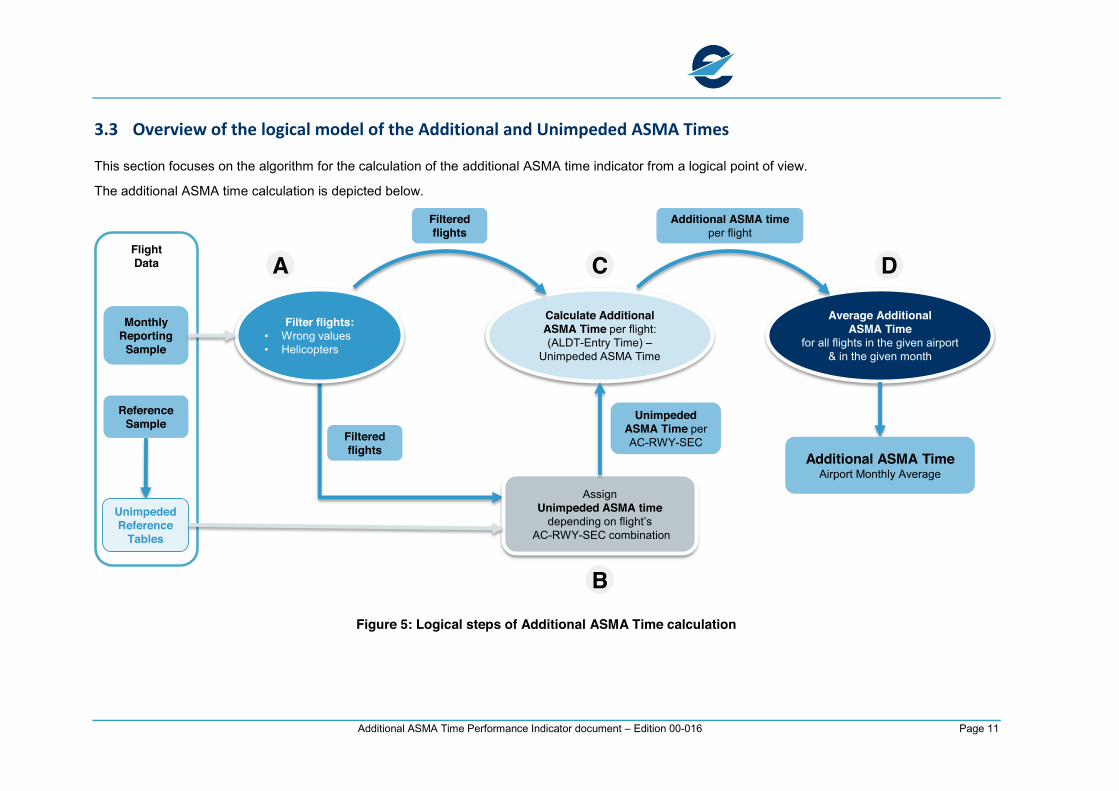
3.3 Overview of the logical model of the Additional and Unimpeded ASMA Times
This section focuses on the algorithm for the calculation of the additional ASMA time indicator from a logical point of view.
The additional ASMA time calculation is depicted below.
Figure 5: Logical steps of Additional ASMA Time calculation
Filter flights: • Wrong values • Helicopters
Calculate Additional ASMA Time per flight: (ALDT-Entry Time) –
Unimpeded ASMA Time
Average Additional ASMA Time
for all flights in the given airport & in the given month
Assign Unimpeded ASMA time
depending on flight’sAC-RWY-SEC combination
B
A C D
Additional ASMA time per flight
Unimpeded ASMA Time per AC-RWY-SEC
Additional ASMA Time Airport Monthly Average
Filteredflights
Flight Data
Monthly Reporting
Sample
Reference Sample
Unimpeded Reference
Tables
Filteredflights
Additional ASMA Time Performance Indicator document – Edition 00-016 Page 12
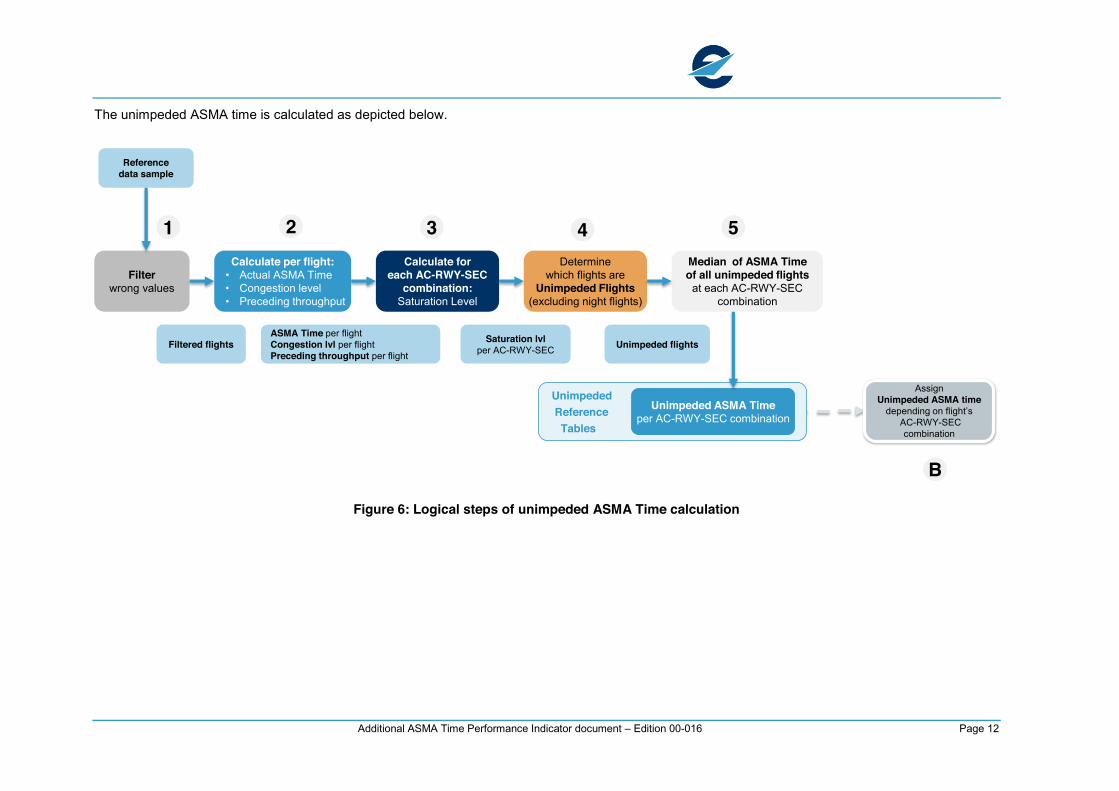
The unimpeded ASMA time is calculated as depicted below.
Figure 6: Logical steps of unimpeded ASMA Time calculation
Unimpeded Reference Tables
Filter wrong values
Calculate for each AC-RWY-SEC
combination: Saturation Level
Determine which flights are
Unimpeded Flights(excluding night flights)
Median of ASMA Time of all unimpeded flights
at each AC-RWY-SEC combination
ASMA Time per flightCongestion lvl per flightPreceding throughput per flight
2 3
Saturation lvlper AC-RWY-SEC
4
Unimpeded flightsFiltered flights
51
Referencedata sample
Unimpeded ASMA Time per AC-RWY-SEC combination
Calculate per flight: • Actual ASMA Time• Congestion level• Preceding throughput
Assign Unimpeded ASMA time
depending on flight’sAC-RWY-SEC combination
B

Additional ASMA Time Performance Indicator document – Edition 00-016 Page 13
3.4 Logical approach to Additional ASMA Time calculation
The computation of the indicator is based on four consecutive steps:
A. Filter out the flights with erroneous data and helicopters.
B. The unimpeded times are calculated from a reference dataset in a separate process that is explained in the next section, and their values are constant for groups of similar flights (same ASMA entry sector, same arrival runway, same aircraft class).
C. Calculation of the average additional time for each group of similar flights by calculating the additional time for each flight through subtraction of the group’s unimpeded time from the actual time each flight spent in ASMA space.
D. The calculation of the average additional ASMA time for the airport which is the weighted average of the average additional ASMA times of all groups of similar inbound flights. [min/IFR flight].
3.5 Logical approach to Unimpeded ASMA Time calculation
The unimpeded ASMA time for each flight is taken from the unimpeded reference tables. These are calculated by averaging the actual ASMA time for the unimpeded flights from a reference sample (e.g. one year worth of data). The basis of the algorithm is to determine which flights are unimpeded.
The unimpeded ASMA time corresponds to the ASMA time that an aircraft of a given triplet, aircraft type – entry sector – runway combination, would spend if no additional sequencing time would be added, i.e., if the operation would be unimpeded. The unimpeded times are calculated from a reference data set, and their values are constant for each triplet combination.
The process steps are described below:
1. The flights with no data or with wrong data are filtered;
2. Actual ASMA time and congestion level are calculated per flight;
3. For each flight and flight groupings of same aircraft type – entry sector – runway combination, calculate the saturation level per grouping;
4. From these flights, determine which flights are unimpeded by comparing congestion level and saturation level, for each grouping of flights with a different AC – SEC – RWY combination;
5. The unimpeded time is calculated as the median of all flights in the grouping of combinations AC-SEC-RWY, for groupings that have at least 20 unimpeded flights. No unimpeded reference time is calculated for the groupings that have less than 20 unimpeded flights. Night flights are excluded.
Additional ASMA Time Performance Indicator document – Edition 00-016 Page 14
4. Mathematical model
The aim of this section is to describe how the logical model is modelled mathematically:
4.1 Mathematical model of the Additional ASMA Time performance indicator
ASMA (Arrival Sequencing and Metering Area) is defined as the airspace within a radius of 40NM around an airport. The additional ASMA time is a proxy for the average arrival runway queuing time of the inbound traffic flow, during times when the airport is congested.
Mathematically, the actual ASMA transit time per flight is calculated as the difference between the entry time at ASMA cylinder and ALDT. The additional ASMA time performance indicator is calculated as the difference between the actual transit time, and a previously computed transit time reference considered as unimpeded ASMA time.
Throughout this chapter units for each variable are shown in [ ] brackets.
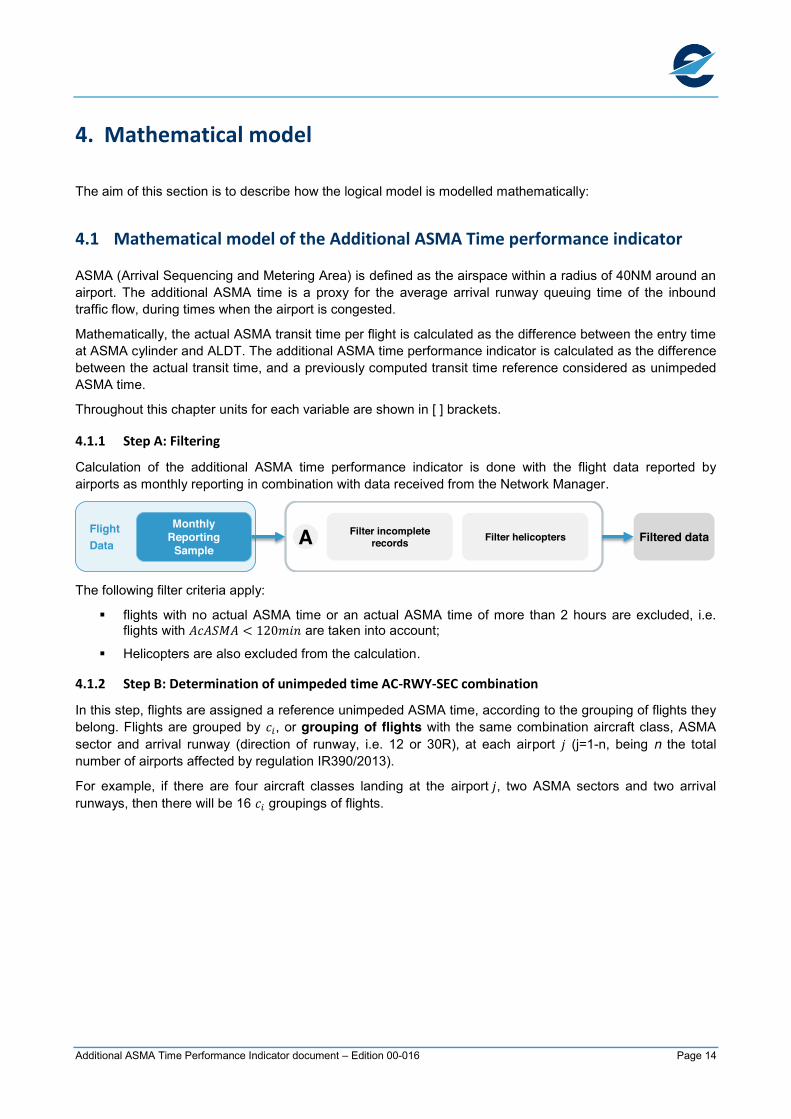
4.1.1 Step A: Filtering
Calculation of the additional ASMA time performance indicator is done with the flight data reported by airports as monthly reporting in combination with data received from the Network Manager.
The following filter criteria apply:
� flights with no actual ASMA time or an actual ASMA time of more than 2 hours are excluded, i.e. flights with 𝐴𝑐𝐴𝑆𝑀𝐴 < 120𝑚𝑖𝑛 are taken into account;
� Helicopters are also excluded from the calculation.
4.1.2 Step B: Determination of unimpeded time AC-RWY-SEC combination
In this step, flights are assigned a reference unimpeded ASMA time, according to the grouping of flights they belong. Flights are grouped by 𝑐 , or grouping of flights with the same combination aircraft class, ASMA sector and arrival runway (direction of runway, i.e. 12 or 30R), at each airport 𝑗 (j=1-n, being n the total number of airports affected by regulation IR390/2013).
For example, if there are four aircraft classes landing at the airport 𝑗, two ASMA sectors and two arrival runways, then there will be 16 𝑐 groupings of flights.
A Filtered dataFilter helicoptersFlight Data
Monthly Reporting
SampleFilter incomplete
records
Additional ASMA Time Performance Indicator document – Edition 00-016 Page 15
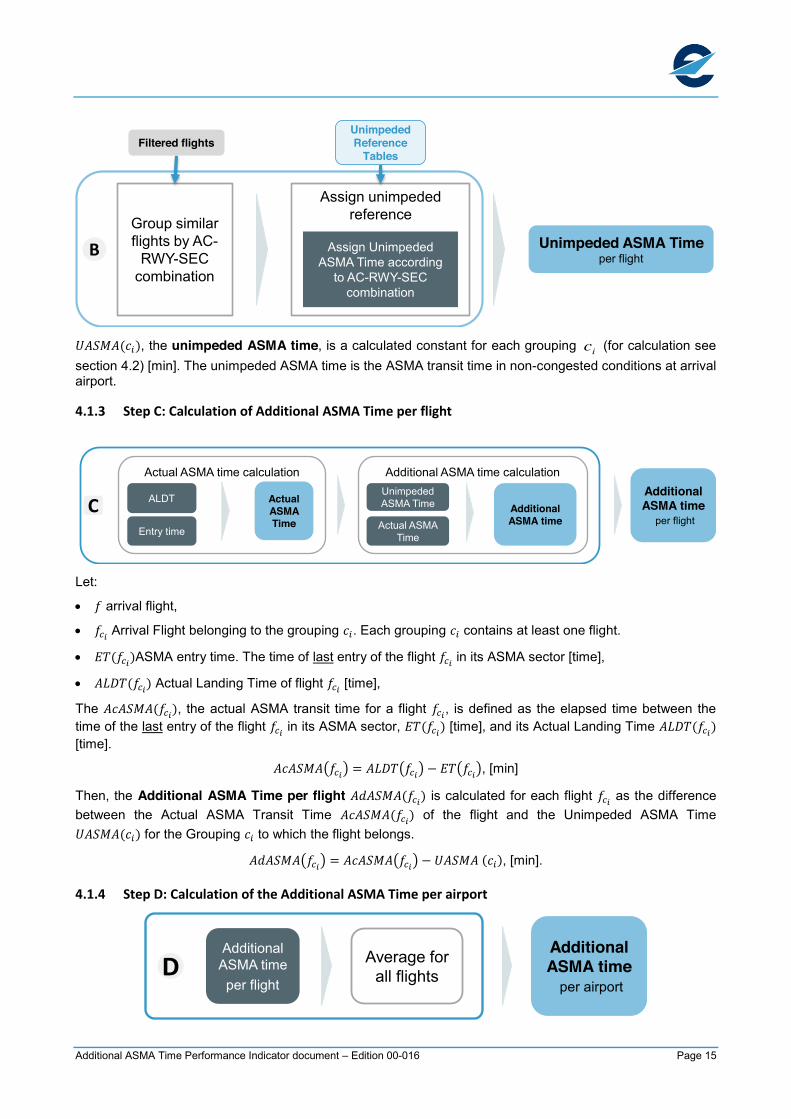
𝑈𝐴𝑆𝑀𝐴(𝑐 ), the unimpeded ASMA time, is a calculated constant for each grouping ic (for calculation see section 4.2) [min]. The unimpeded ASMA time is the ASMA transit time in non-congested conditions at arrival airport.
4.1.3 Step C: Calculation of Additional ASMA Time per flight
Let:
x 𝑓 arrival flight,
x 𝑓 Arrival Flight belonging to the grouping 𝑐 . Each grouping 𝑐 contains at least one flight.
x 𝐸𝑇(𝑓 )ASMA entry time. The time of last entry of the flight 𝑓 in its ASMA sector [time],
x 𝐴𝐿𝐷𝑇(𝑓 ) Actual Landing Time of flight 𝑓 [time],
The 𝐴𝑐𝐴𝑆𝑀𝐴(𝑓 ), the actual ASMA transit time for a flight 𝑓 , is defined as the elapsed time between the time of the last entry of the flight 𝑓 in its ASMA sector, 𝐸𝑇(𝑓 ) [time], and its Actual Landing Time 𝐴𝐿𝐷𝑇(𝑓 ) [time].
𝐴𝑐𝐴𝑆𝑀𝐴 𝑓 = 𝐴𝐿𝐷𝑇 𝑓 − 𝐸𝑇 𝑓 , [min]
Then, the Additional ASMA Time per flight 𝐴𝑑𝐴𝑆𝑀𝐴(𝑓 ) is calculated for each flight 𝑓 as the difference between the Actual ASMA Transit Time 𝐴𝑐𝐴𝑆𝑀𝐴(𝑓 ) of the flight and the Unimpeded ASMA Time 𝑈𝐴𝑆𝑀𝐴(𝑐 ) for the Grouping 𝑐 to which the flight belongs.
𝐴𝑑𝐴𝑆𝑀𝐴 𝑓 = 𝐴𝑐𝐴𝑆𝑀𝐴 𝑓 − 𝑈𝐴𝑆𝑀𝐴 (𝑐 ), [min].
4.1.4 Step D: Calculation of the Additional ASMA Time per airport
Group similar flights by AC-
RWY-SEC combination
Assign unimpeded reference
Unimpeded ASMA Time per flight
Assign Unimpeded ASMA Time according
to AC-RWY-SEC combination
B
Unimpeded Reference
TablesFiltered flights
Actual ASMA time calculation
Actual ASMA Time
Additional ASMA time calculation
CAdditional ASMA time
per flight
ALDT
Entry time
Additional ASMA time
Unimpeded ASMA Time
Actual ASMA Time
Average for all flightsD
Additional ASMA time
per airport
Additional ASMA time per flight
Additional ASMA Time Performance Indicator document – Edition 00-016 Page 16
x 𝑁 is the total number of IFR arrivals in the data set used for calculation of the additional ASMA time performance indicator, [count].
The additional ASMA time for a given airport 𝐴𝑑𝐴𝑆𝑀𝐴 is the average of the additional ASMA time 𝐴𝑑𝐴𝑆𝑀𝐴 𝑓 , for all the flights 𝑓 at that airport that have an unimpeded reference, in the sample 𝑁 .
𝐴𝑑𝐴𝑆𝑀𝐴 = , [min/IFR arrival flight].
4.2 Mathematical model of the Unimpeded ASMA Time
The unimpeded ASMA time is the ASMA transit time in non-congested conditions at arrival airports. The unimpeded ASMA time is used (as a constant number for each combination of aircraft class, ASMA sector and arrival runway) in the calculation of the additional ASMA time. The unimpeded ASMA times are calculated for IFR arriving flights, at each airport.
The following section details the calculation done as part of each step. The units for each variable are shown in [ ] brackets.
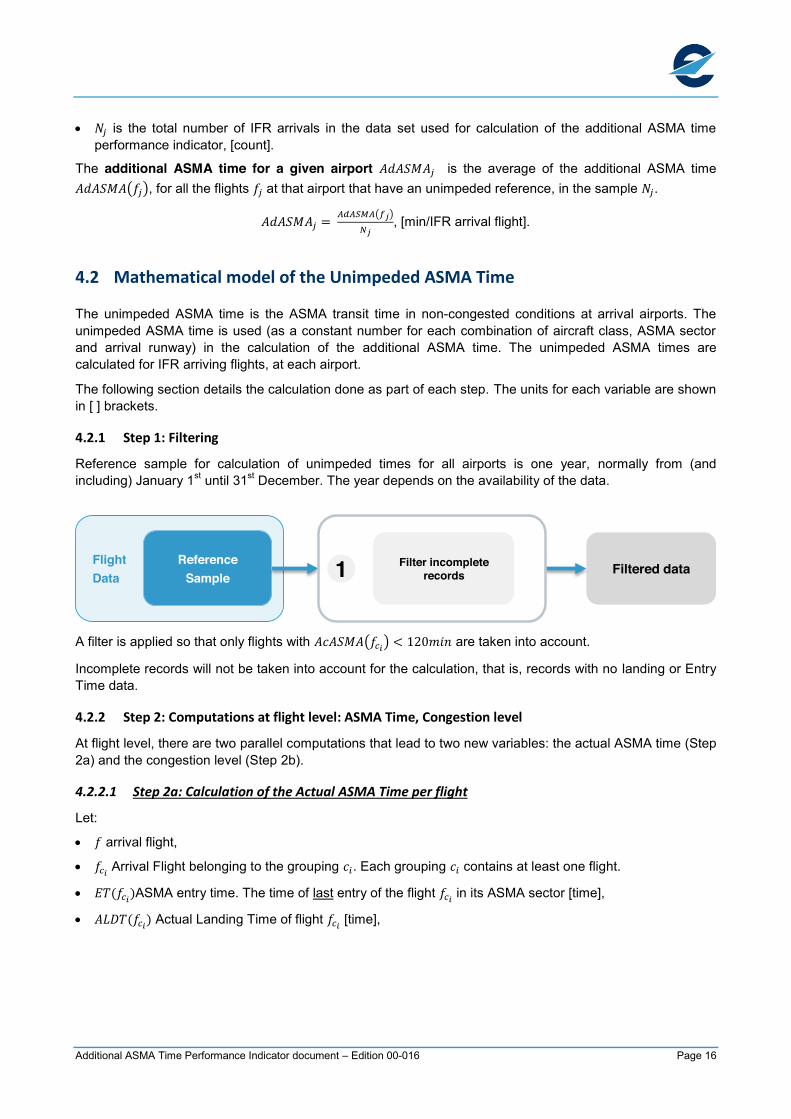
4.2.1 Step 1: Filtering
Reference sample for calculation of unimpeded times for all airports is one year, normally from (and including) January 1st until 31st December. The year depends on the availability of the data.
A filter is applied so that only flights with 𝐴𝑐𝐴𝑆𝑀𝐴 𝑓 < 120𝑚𝑖𝑛 are taken into account.
Incomplete records will not be taken into account for the calculation, that is, records with no landing or Entry Time data.
4.2.2 Step 2: Computations at flight level: ASMA Time, Congestion level
At flight level, there are two parallel computations that lead to two new variables: the actual ASMA time (Step 2a) and the congestion level (Step 2b).
4.2.2.1 Step 2a: Calculation of the Actual ASMA Time per flight
Let:
x 𝑓 arrival flight,
x 𝑓 Arrival Flight belonging to the grouping 𝑐 . Each grouping 𝑐 contains at least one flight.
x 𝐸𝑇(𝑓 )ASMA entry time. The time of last entry of the flight 𝑓 in its ASMA sector [time],
x 𝐴𝐿𝐷𝑇(𝑓 ) Actual Landing Time of flight 𝑓 [time],
Flight Data
ReferenceSample
Filtered data1 Filter incomplete records
Additional ASMA Time Performance Indicator document – Edition 00-016 Page 17
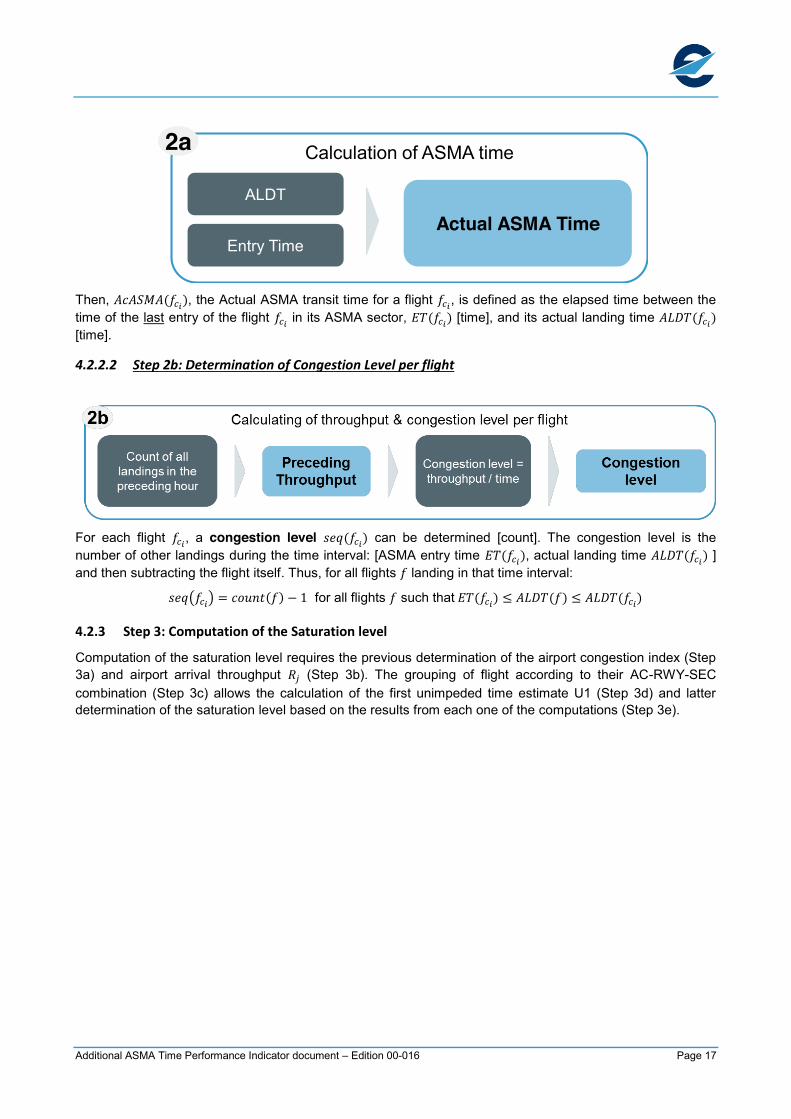
Then, 𝐴𝑐𝐴𝑆𝑀𝐴(𝑓 ), the Actual ASMA transit time for a flight 𝑓 , is defined as the elapsed time between the time of the last entry of the flight 𝑓 in its ASMA sector, 𝐸𝑇(𝑓 ) [time], and its actual landing time 𝐴𝐿𝐷𝑇(𝑓 ) [time].
4.2.2.2 Step 2b: Determination of Congestion Level per flight
For each flight 𝑓 , a congestion level 𝑠𝑒𝑞(𝑓 ) can be determined [count]. The congestion level is the number of other landings during the time interval: [ASMA entry time 𝐸𝑇(𝑓 ), actual landing time 𝐴𝐿𝐷𝑇(𝑓 ) ] and then subtracting the flight itself. Thus, for all flights 𝑓 landing in that time interval:
𝑠𝑒𝑞 𝑓 = 𝑐𝑜𝑢𝑛𝑡(𝑓) − 1 for all flights 𝑓 such that 𝐸𝑇(𝑓 ) ≤ 𝐴𝐿𝐷𝑇(𝑓) ≤ 𝐴𝐿𝐷𝑇(𝑓 )
4.2.3 Step 3: Computation of the Saturation level
Computation of the saturation level requires the previous determination of the airport congestion index (Step 3a) and airport arrival throughput 𝑅 (Step 3b). The grouping of flight according to their AC-RWY-SEC combination (Step 3c) allows the calculation of the first unimpeded time estimate U1 (Step 3d) and latter determination of the saturation level based on the results from each one of the computations (Step 3e).
Actual ASMA Time
Calculation of ASMA time
ALDT
Entry Time
2a
Additional ASMA Time Performance Indicator document – Edition 00-016 Page 18
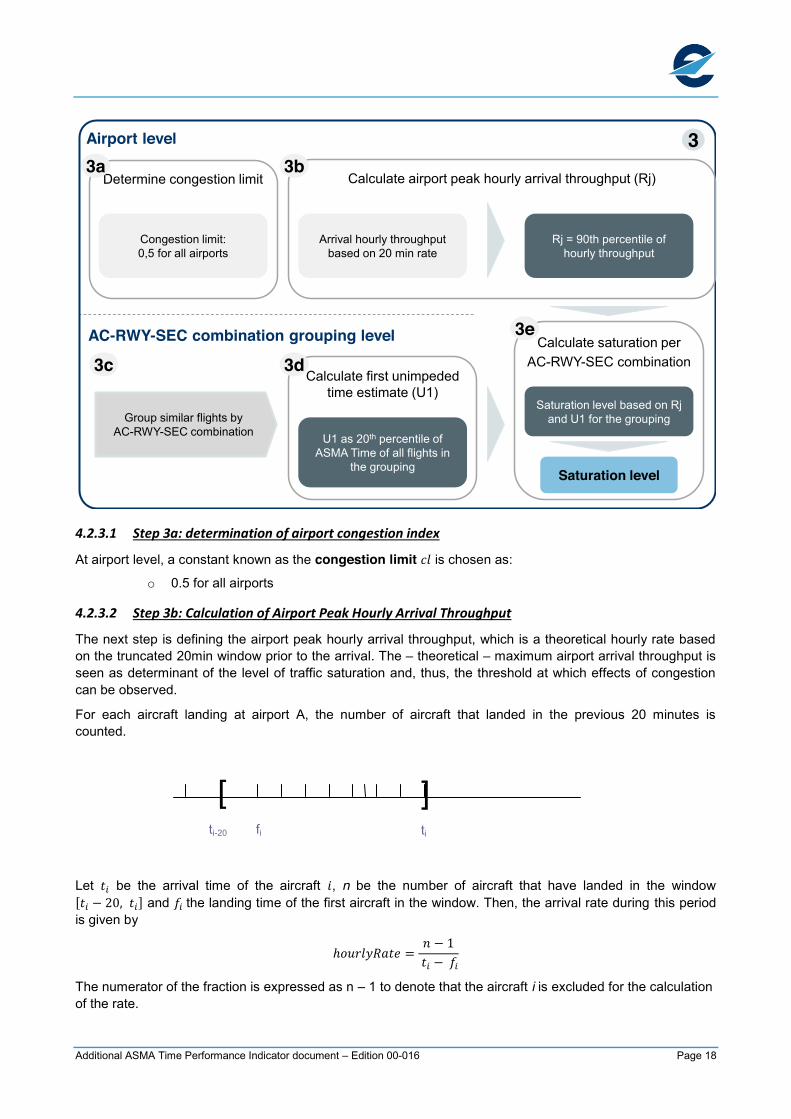
4.2.3.1 Step 3a: determination of airport congestion index
At airport level, a constant known as the congestion limit 𝑐𝑙 is chosen as:
o 0.5 for all airports
4.2.3.2 Step 3b: Calculation of Airport Peak Hourly Arrival Throughput
The next step is defining the airport peak hourly arrival throughput, which is a theoretical hourly rate based on the truncated 20min window prior to the arrival. The – theoretical – maximum airport arrival throughput is seen as determinant of the level of traffic saturation and, thus, the threshold at which effects of congestion can be observed.
For each aircraft landing at airport A, the number of aircraft that landed in the previous 20 minutes is counted.
Let 𝑡 be the arrival time of the aircraft 𝑖, n be the number of aircraft that have landed in the window [𝑡 − 20, 𝑡 ] and 𝑓 the landing time of the first aircraft in the window. Then, the arrival rate during this period is given by
ℎ𝑜𝑢𝑟𝑙𝑦𝑅𝑎𝑡𝑒 =𝑛 − 1
𝑡 − 𝑓
The numerator of the fraction is expressed as n – 1 to denote that the aircraft i is excluded for the calculation of the rate.
3
Group similar flights by AC-RWY-SEC combination
Calculate saturation per AC-RWY-SEC combination
AC-RWY-SEC combination grouping level
Calculate first unimpeded time estimate (U1)
Calculate airport peak hourly arrival throughput (Rj)
Airport level
Congestion limit:0,5 for all airports
Determine congestion limit
U1 as 20th percentile of ASMA Time of all flights in
the grouping
Saturation level based on Rjand U1 for the grouping
3a 3b
3c 3d
3e
Arrival hourly throughput based on 20 min rate
Rj = 90th percentile of hourly throughput
Saturation level
]
ti [ ti-20 fi

Additional ASMA Time Performance Indicator document – Edition 00-016 Page 19
Therefore, the arrival throughput for each flight 𝑓(𝑐 ) is calculated as:
∀ ( ) :
⎩⎪⎨
⎪⎧ 𝑐𝑜𝑢𝑛𝑡( 𝑓|𝐴𝐿𝐷𝑇 𝑓 − 20 𝑚𝑖𝑛 ≤ 𝐴𝐿𝐷𝑇(𝑓) ≤ 𝐴𝐿𝐷𝑇 𝑓 )
𝑏𝑎𝑠𝑒 = 𝐴𝐿𝐷𝑇 𝑓 − min ( 𝐴𝐷𝐿𝑇(𝑓) ∈ 𝐴𝐿𝐷𝑇 𝑓 − 20, 𝐴𝐿𝐷𝑇 𝑓 )
ℎ𝑜𝑢𝑟𝑙𝑦𝑅𝑎𝑡𝑒 𝑓 = 𝑐𝑜𝑢𝑛𝑡 − 1
𝑏𝑎𝑠𝑒
For example, for a flight landing at 07:04:00hrs, the first preceding arrival is observed at 06:45:04. The resulting rate base is hence 18:56 minutes. Assuming 9 arrivals would be observed in this window (without counting the flight 07:04:00 flight), this yields a (theoretical) hourly throughput of: ℎ𝑜𝑢𝑟𝑙𝑦 𝑑𝑒𝑝. 𝑡ℎ𝑟𝑜𝑢𝑔ℎ𝑝𝑢𝑡(𝑓𝑙𝑖𝑔ℎ𝑡) =
: = 0.4754 = 28.52
The peak hourly arrival throughput of the airport, 𝑅 , is calculated as the 90th percentile of all ℎ𝑜𝑢𝑟𝑙𝑦𝑅𝑎𝑡𝑒 values in the reference sample
𝑅 = 90𝑡ℎ 𝑝𝑒𝑟𝑐𝑒𝑛𝑡𝑖𝑙𝑒 (ℎ𝑜𝑢𝑟𝑙𝑦𝑅𝑎𝑡𝑒), [flights/hour]
4.2.3.3 Step 3c: Grouping of similar flights by AC-RWY-SEC combination
Flights are grouped by 𝑐 , or Grouping of flights with the same combination aircraft class, ASMA sector and arrival runway (direction of runway, i.e. 12 or 30R), at each airport 𝑗 (j=1-n, being n the total number of airports affected by regulation IR390/2013).
For example, if there are four aircraft classes landing at the airport 𝑗, two ASMA sectors and two arrival runways there will be 16 𝑐 groupings of flights.
4.2.3.4 Step 3d: Calculation of the first Unimpeded ASMA Time estimate
𝑈 (𝑐 ) is defined as the first Unimpeded ASMA Time estimate for each grouping of flights 𝑐 , being the 20th percentile of all the ASMA transit times of the flights belonging to that grouping [min].
U (𝑐 ) = 20𝑡ℎ 𝑝𝑒𝑟𝑐𝑒𝑛𝑡𝑖𝑙𝑒 𝐴𝑐𝐴𝑆𝑀𝐴 𝑓
4.2.3.5 Step 3e: Determination of the Saturation Level per grouping
While the congestion level is a measure for the traffic encountered by an individual flight, the saturation threshold describes the maximum traffic level served under non-congested traffic conditions. As an upper bound for the saturation threshold, the saturation level can be estimated as the maximum number of aircraft landing under non-congested conditions (expressed by the first estimate of the unimpeded ASMA time).
Dependent on the previous steps 3b and 3d the saturation level is calculated by multiplying the estimate of the unimpeded time U1 with the peak hourly throughput Rj, to provide an estimation of the (theoretical) maximum number of arrivals per hour served by the airport without congestion. The result is rounded to the next unit.
𝐿(𝑐 ), the saturation level of the grouping 𝑐 , is calculated as: 𝐿(𝑐 ) = 𝑟𝑜𝑢𝑛𝑑∗ ( )
4.2.4 Step 4: Identification of unimpeded flights
To ensure that a flight is unimpeded, its congestion level needs to be sufficiently smaller than the saturation level. Departing flights are considered as non-congested, if their congestion limit is equal or below the saturation threshold.
However, it needs to be ensured that the data sample is big enough to produce a statistically relevant sample for the chosen stand/runway combination and robust estimate of the unimpeded time.
0
2
4
6
8
10
12
0 40 80 120 160 200
Flig
hts(
thou
sand
)-5
0
5
10
15
20
25
30
35
0 40 80 120 160 200
Congestion level
Min
/Flig
ht
20th percentile

Additional ASMA Time Performance Indicator document – Edition 00-016 Page 20
To limit the impact of any congestion effect (and to address the sample size), the saturation threshold is estimated as a fraction of the saturation level. This limitation is achieved with the definition of the congestion limit 𝑐𝑙, a constant defined in Step 3a.
Based on the previous outputs, the identification of the unimpeded flights is done: the saturation level, corrected with the congestion limit, is compared to the congestion level.
With the aim of designating the unimpeded flights, 𝑓𝑢 is defined as a binary variable, denoting that a flight 𝑓 belonging to the grouping 𝑐 is an unimpeded flight. A flight is considered unimpeded if its congestion level 𝑠𝑒𝑞(𝑓 ) is less than or equal to the product of congestion limit 𝑐𝑙 and the flight’s grouping saturation level 𝐿(𝑐 ).
4.2.5 𝒇𝒖𝒄𝒊 = 𝟏, ∀𝒇𝒄𝒊 ∋ 𝒔𝒆𝒒 𝒇𝒄𝒊 ≤ 𝟎. 𝟓 ∗ 𝑳(𝒄𝒊)𝟎, 𝒐𝒕𝒉𝒆𝒓𝒘𝒊𝒔𝒆
Step 5: Computation of unimpeded time per grouping
The unimpeded ASMA time per grouping is computed as the median of the ASMA time only for the unimpeded flights.
The unimpeded ASMA time 𝑈𝐴𝑆𝑀𝐴 (𝑐 ) for a grouping 𝑐 is a calculated constant at the airport 𝑗.
In order to derive statistically meaningful and representative unimpeded times per group, only those groupings with equal or more than 20 flights are retained in the calculation. For groupings 𝑐 that have less than 20 unimpeded flights 𝑓𝑢 , the associated unimpeded time 𝑈𝐴𝑆𝑀𝐴 (𝑐 ) is not calculated. These groupings 𝑐 do not have unimpeded times (consequently, it is not possible to calculate additional ASMA time for those groupings).
Night flights are excluded from the calculation at this point, so only the flights taking off during day time are considered for the calculation of the reference unimpeded times. On the standard calculation day time is defined between 06:30 and 22:00 of airport local time. Calibration of day time definition may lead to different definition in some of the busiest airports (see section 5).
For the groupings 𝑐 that have 20 or more unimpeded flights, the unimpeded time is defined as the median of the Actual ASMA Transit Time 𝐴𝑐𝐴𝑆𝑀𝐴 𝑓 , of all unimpeded flights 𝑓𝑢 belonging to the grouping of flights.
𝑈𝐴𝑆𝑀𝐴 (𝑐 ) = 𝑚𝑒𝑑𝑖𝑎𝑛 (𝐴𝑐𝐴𝑆𝑀𝐴 𝑓 ), ∀𝑐 ∋ 𝑐𝑜𝑢𝑛𝑡(𝑓𝑢 ) ≥ 20𝑛𝑢𝑙𝑙, 𝑜𝑡ℎ𝑒𝑟𝑤𝑖𝑠𝑒
These times are aggregated in Unimpeded References Tables for the calculation of the additional ASMA time as described in Section 4.1.
Although unimpeded ASMA time constants for each 𝑐 are relatively static in time, regular checks are made to ensure that they remain representative of the operations for the airport under consideration (see section 5.2). In case a change of unimpeded times is detected, the causes of that change (i.e. new procedure implementation, change of TMA design) are investigated. When required, new unimpeded time constants
Flight is unimpeded4
If flight congestion level is lower than(congestion limit) * (saturation level) for its AC-RWY-SEC combination
Congestion level per flight
Saturation level per AC-RWY-SEC
Congestion limit (0,5)
Unimpeded ASMA timeper AC-RWY-SEC combination
Median of ASMA Time of unimpeded flights 5
Filter groupings with less than 20
unimpeded flightsFilter night
flights

Additional ASMA Time Performance Indicator document – Edition 00-016 Page 21
are calculated. However, because the unimpeded time constants calculation method is based on statistical analysis of the Actual ASMA transit time, a period of several months after the change is required before new robust unimpeded times can be established.
Additional ASMA Time Performance Indicator document – Edition 00-016 Page 22
5. Calibration of model parameters
This section describes the model parameters that need to be customized for every airport, and the approach used for obtaining and updating them.
For the additional ASMA time indicator, the parameters that need manual calibration are the ASMA sectors and the unimpeded times.
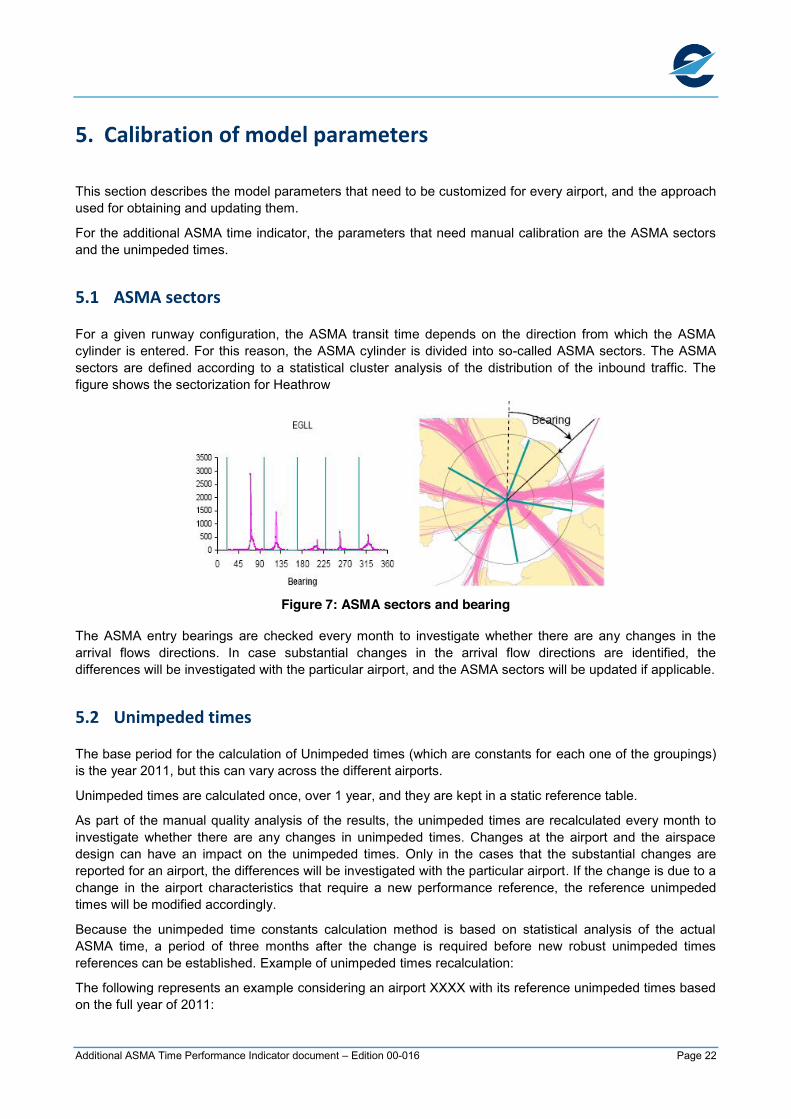
5.1 ASMA sectors
For a given runway configuration, the ASMA transit time depends on the direction from which the ASMA cylinder is entered. For this reason, the ASMA cylinder is divided into so-called ASMA sectors. The ASMA sectors are defined according to a statistical cluster analysis of the distribution of the inbound traffic. The figure shows the sectorization for Heathrow
Figure 7: ASMA sectors and bearing
The ASMA entry bearings are checked every month to investigate whether there are any changes in the arrival flows directions. In case substantial changes in the arrival flow directions are identified, the differences will be investigated with the particular airport, and the ASMA sectors will be updated if applicable.
5.2 Unimpeded times
The base period for the calculation of Unimpeded times (which are constants for each one of the groupings) is the year 2011, but this can vary across the different airports.
Unimpeded times are calculated once, over 1 year, and they are kept in a static reference table.
As part of the manual quality analysis of the results, the unimpeded times are recalculated every month to investigate whether there are any changes in unimpeded times. Changes at the airport and the airspace design can have an impact on the unimpeded times. Only in the cases that the substantial changes are reported for an airport, the differences will be investigated with the particular airport. If the change is due to a change in the airport characteristics that require a new performance reference, the reference unimpeded times will be modified accordingly.
Because the unimpeded time constants calculation method is based on statistical analysis of the actual ASMA time, a period of three months after the change is required before new robust unimpeded times references can be established. Example of unimpeded times recalculation:
The following represents an example considering an airport XXXX with its reference unimpeded times based on the full year of 2011:
Additional ASMA Time Performance Indicator document – Edition 00-016 Page 23
As part of the monthly values calculation, the unimpeded times will be recalculated each month (e.g. for June 2014) and compared with the “reference” ones (based on 2011).
x If the values are considered similar enough, the static values will be kept: the airport reference period will still be 2011. The validity of the reference unimpeded times based on 2011 will be extended to June 2014)
x If a change is detected in the June 2014 results (the unimpeded times recalculated based on June 2014 are significantly different from the 2011 ones), the issue will be investigated and discussed with the airport, in order to decide which new reference to take. If, for example, the change was due to a new runway opened in June 2014, the new reference will be the following year: June 2014-June 2015. However, if the difference corresponds to a runway closure of 3 months, the reference would be modified only for the affected 3 months.
Two parameters can trigger the renewal of the unimpeded time reference for one airport, each month:
x The number of flights that do not have unimpeded reference (are not in a grouping with more than 20 unimpeded flights) are more than 10% of the total traffic of the concerned month.
x The standard deviation of the unimpeded times of all the flights of the month is higher than 2 minutes.
5.3 Day Time
Due to extended opening hours in certain airports, day time may be extended for the filtering of the flights in the unimpeded ASMA time calculation.
Additional ASMA Time Performance Indicator document – Edition 00-016 Page 24
6. Source data
6.1 Main and secondary data sources
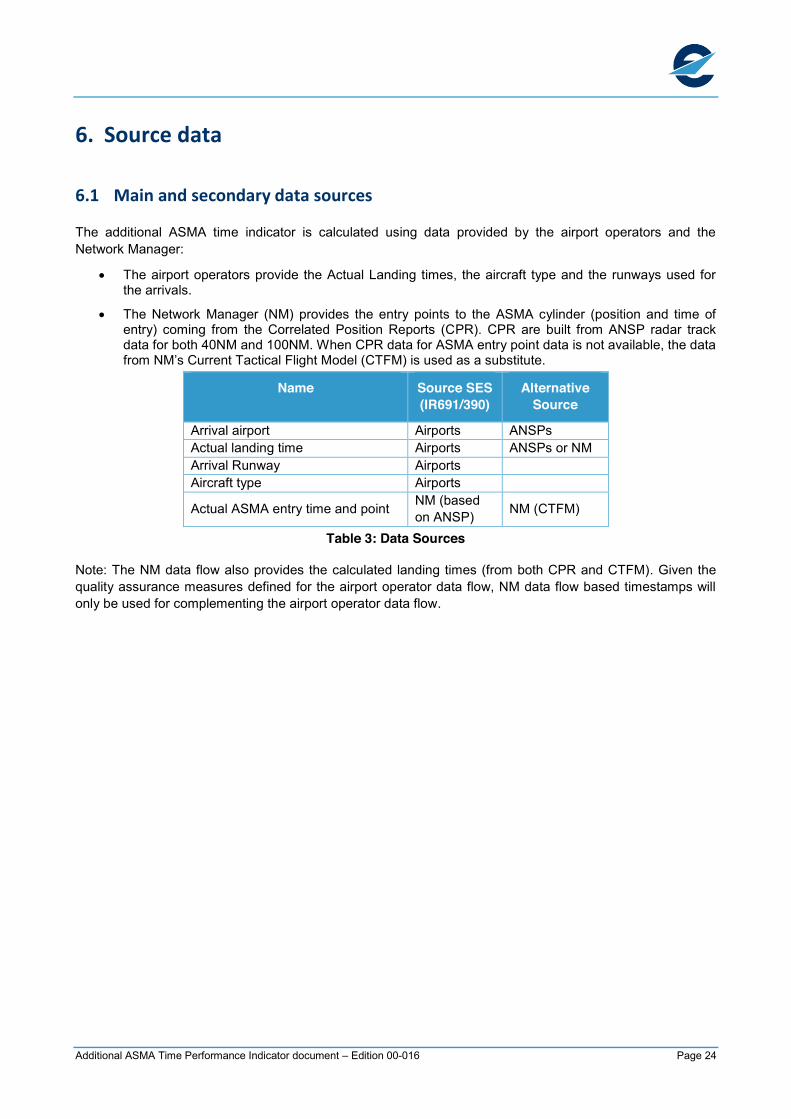
The additional ASMA time indicator is calculated using data provided by the airport operators and the Network Manager:
x The airport operators provide the Actual Landing times, the aircraft type and the runways used for the arrivals.
x The Network Manager (NM) provides the entry points to the ASMA cylinder (position and time of entry) coming from the Correlated Position Reports (CPR). CPR are built from ANSP radar track data for both 40NM and 100NM. When CPR data for ASMA entry point data is not available, the data from NM’s Current Tactical Flight Model (CTFM) is used as a substitute.
Name Source SES (IR691/390)
Alternative Source
Arrival airport Airports ANSPs Actual landing time Airports ANSPs or NM Arrival Runway Airports Aircraft type Airports
Actual ASMA entry time and point NM (based on ANSP) NM (CTFM)
Table 3: Data Sources
Note: The NM data flow also provides the calculated landing times (from both CPR and CTFM). Given the quality assurance measures defined for the airport operator data flow, NM data flow based timestamps will only be used for complementing the airport operator data flow.
Additional ASMA Time Performance Indicator document – Edition 00-016 Page 25
7. Quality management
7.1 The Airport Operator Data Flow process
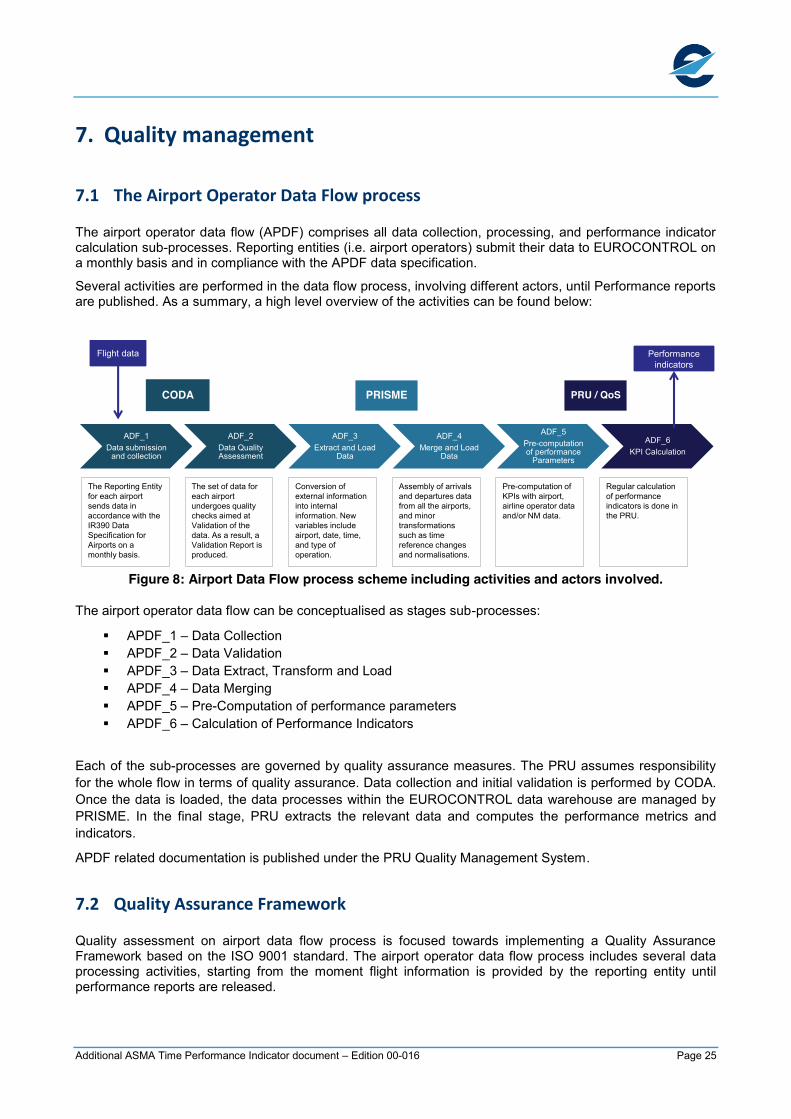
The airport operator data flow (APDF) comprises all data collection, processing, and performance indicator calculation sub-processes. Reporting entities (i.e. airport operators) submit their data to EUROCONTROL on a monthly basis and in compliance with the APDF data specification.
Several activities are performed in the data flow process, involving different actors, until Performance reports are published. As a summary, a high level overview of the activities can be found below:
Figure 8: Airport Data Flow process scheme including activities and actors involved.
The airport operator data flow can be conceptualised as stages sub-processes:
� APDF_1 – Data Collection � APDF_2 – Data Validation � APDF_3 – Data Extract, Transform and Load � APDF_4 – Data Merging � APDF_5 – Pre-Computation of performance parameters � APDF_6 – Calculation of Performance Indicators
Each of the sub-processes are governed by quality assurance measures. The PRU assumes responsibility for the whole flow in terms of quality assurance. Data collection and initial validation is performed by CODA. Once the data is loaded, the data processes within the EUROCONTROL data warehouse are managed by PRISME. In the final stage, PRU extracts the relevant data and computes the performance metrics and indicators.
APDF related documentation is published under the PRU Quality Management System.
7.2 Quality Assurance Framework
Quality assessment on airport data flow process is focused towards implementing a Quality Assurance Framework based on the ISO 9001 standard. The airport operator data flow process includes several data processing activities, starting from the moment flight information is provided by the reporting entity until performance reports are released.
ADF_1Data submission
and collection
ADF_2Data Quality Assessment
ADF_3Extract and Load
Data
ADF_4Merge and Load
Data
ADF_5Pre-computation of performance
Parameters
ADF_6KPI Calculation
CODA PRISME PRU / QoS
The Reporting Entity for each airport sends data in accordance with the IR390 Data Specification for Airports on a monthly basis.
Regular calculation of performance indicators is done in the PRU.
The set of data for each airport undergoes quality checks aimed at Validation of the data. As a result, a Validation Report is produced.
Conversion of external information into internal information. New variables include airport, date, time, and type of operation.
Assembly of arrivals and departures data from all the airports, and minor transformations such as time reference changes and normalisations.
Pre-computation of KPIs with airport, airline operator data and/or NM data.
Flight data Performance indicators

Additional ASMA Time Performance Indicator document – Edition 00-016 Page 26
Standard Operating Procedures for all these sub-processes have been established and is quality controlled. The documentation is published under the PRU Quality Management System.
7.3 Data Quality Checks
For the APDF the following quality areas have been identified. Quality controls in support of these quality areas are implemented and regularly monitored as part of the aforementioned APDF sub-processes.
Figure 9: Quality Performance Areas and corresponding Quality Indicators
More detail on these quality checks can be found in the Airport Data Flow Data Specifications (see [3]).
7.4 Performance Indicator Quality Checks
The average additional ASMA time per flight grouped by airport and month represents the main result from the performance indicator calculation process. In addition, this process provides parameters that are used for data validation and statistical analysis:
− average unimpeded time − standard deviation − Values for 25%,50% and 75% percentiles − number of flights, number of unimpeded flights and number of flights with valid data − total additional time, unimpeded time and 25%, 50% and 75% percentile − completeness and coverage of the traffic sample
These metrics are used for PRU internal validation activities and may trigger case-by-case analyses if significant variations are observed.
Mapping Mapping consists of checking the format of submitted data and ensuring that the data to be stored in PRISME follow the same coding convention
Completeness This process checks the number of operated flights, and the amount of not null values for the main fields in the airport data (e.g., OOOI, STA, STD)
Matching A set of filters is applied to search among flights submitted by the airport operators/air carriers and find the exact flight matches in the NM database
Data Accuracy Validation
This quality check mainly assesses the quality of OOOI data (Off Block, Take Off, Landing, In Block) through a set of acceptability criteria.

Additional ASMA Time Performance Indicator document – Edition 00-016 Page 27
References
[1] COMMISSION IMPLEMENTING REGULATION (EU) No 390/2013, Laying down a performance scheme for air navigation services and network functions, 3 May 2013. Available at: http://eur-lex.europa.eu/LexUriServ/LexUriServ.do?uri=OJ:L:2013:128:0001:0030:EN:PDF
[2] COMMISSION REGULATION (EU) No 691/2010, Laying down a performance scheme for air navigation services and network functions and amending Regulation (EC) No 2096/2005 laying down common requirements for the provision of air navigation services, 29 July 2010. Available at: http://eur-lex.europa.eu/LexUriServ/LexUriServ.do?uri=OJ:L:2010:201:0001:0022:EN:PDF
[3] Airport Data Flow Data Specifications
[4] Performance Review Commission, ATM Airport Performance (ATMAP) Framework, Measuring Airport Airside and Nearby Airspace Performance, December 2009
Revision History
Edition Description Comment 00-01 New draft – all pages New document
00-02 Modifications of the description of the mathematical model
Improved links between mathematical and logical models
00-03 Consistency corrections across different publications for the mathematical model
Corrections on the congestion limit and the Unimpeded reference sample
00-03a Editorial changes Alignment of terminology
00-04 Modifications based on external revision by AENA Corrections to calculation logical model and rephrasing of text to expand calculation details.
00-05 Refinement of the logical and mathematical models and the description of the new unimpeded reference versions method.
00-06 Increased detail in algorithm description and minor corrections.
00-07 Improvement in the KPA definition