Embed Size (px)
Citation preview
Addison Wesley Longman, Inc. © 2000
Chapter 14
Inequality in Earnings
Addison Wesley Longman, Inc. © 2000
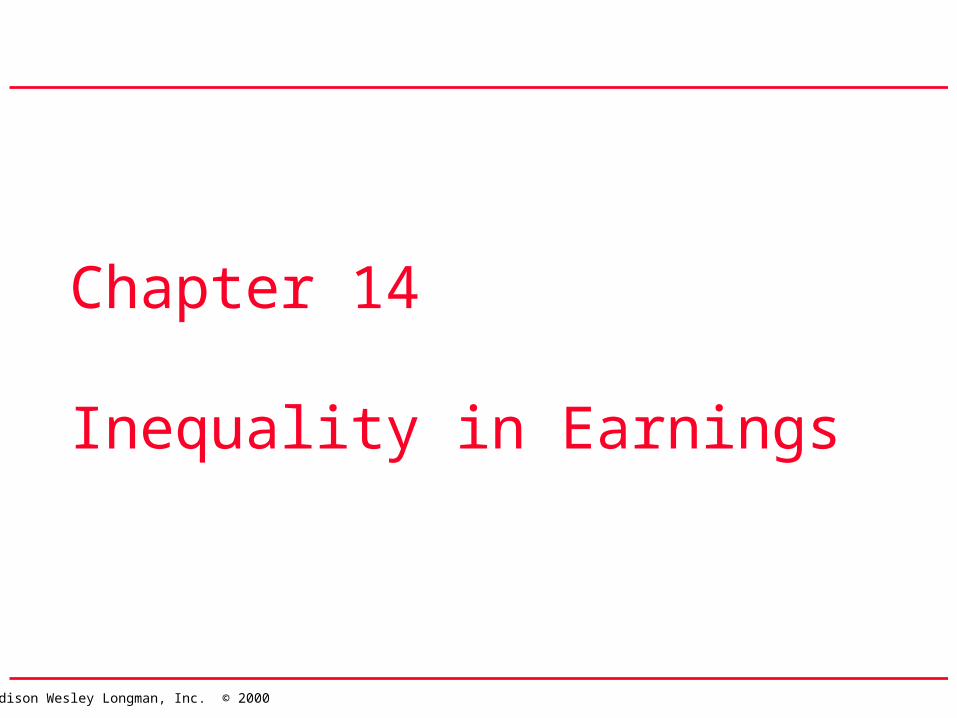
Earnings Distribution with Perfect EqualityFigure 14.1
Addison Wesley Longman, Inc. © 2000
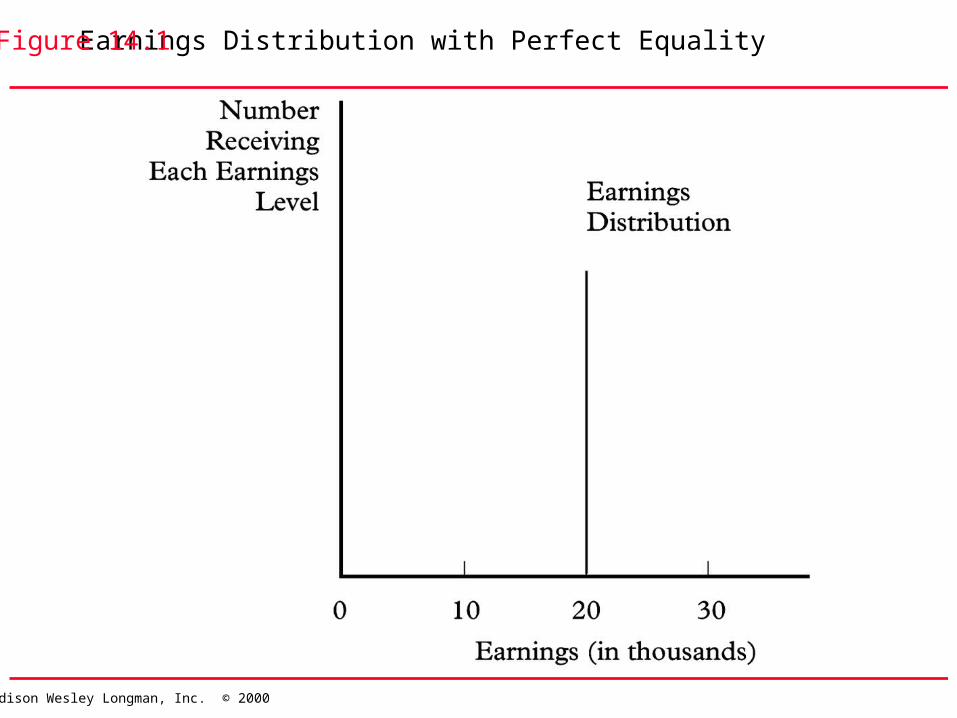
Distributions of Earnings with Different Degrees of DispersionFigure 14.2
Addison Wesley Longman, Inc. © 2000
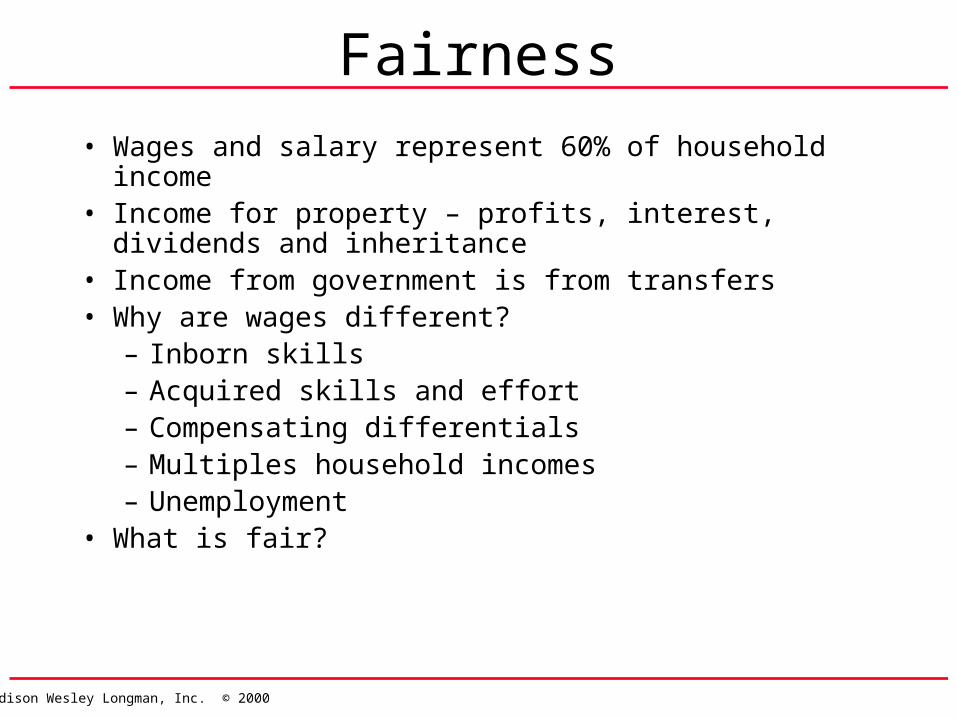
Fairness
• Wages and salary represent 60% of household income• Income for property – profits, interest, dividends and
inheritance• Income from government is from transfers • Why are wages different?
– Inborn skills– Acquired skills and effort– Compensating differentials– Multiples household incomes– Unemployment
• What is fair?

Addison Wesley Longman, Inc. © 2000
Addison Wesley Longman, Inc. © 2000
Addison Wesley Longman, Inc. © 2000
Addison Wesley Longman, Inc. © 2000

Addison Wesley Longman, Inc. © 2000
Addison Wesley Longman, Inc. © 2000
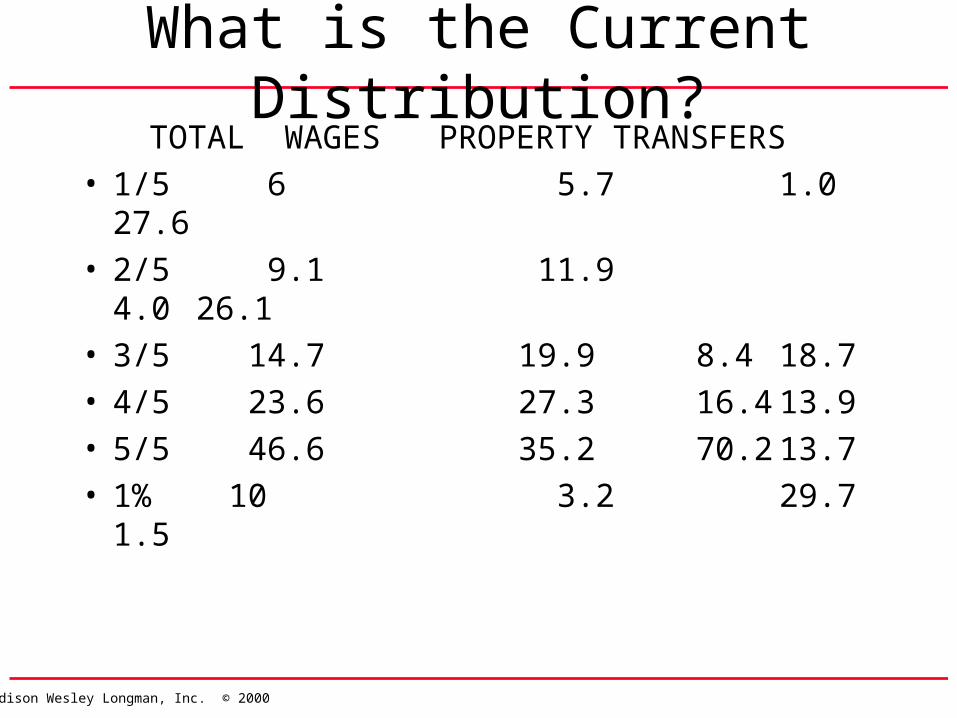
What is the Current Distribution?TOTAL WAGES PROPERTY TRANSFERS
• 1/5 6 5.7 1.0 27.6• 2/5 9.1 11.9 4.0 26.1• 3/5 14.7 19.9 8.4 18.7• 4/5 23.6 27.3 16.4 13.9• 5/5 46.6 35.2 70.2 13.7• 1% 10 3.2 29.7 1.5
Addison Wesley Longman, Inc. © 2000
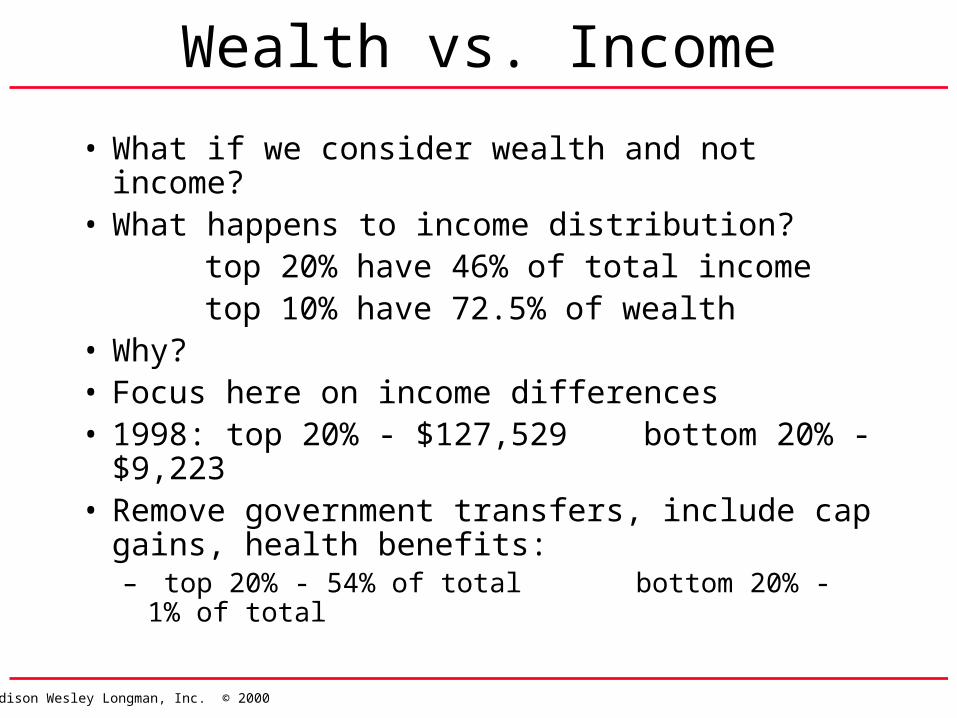
Wealth vs. Income
• What if we consider wealth and not income? • What happens to income distribution?
top 20% have 46% of total income top 10% have 72.5% of wealth
• Why?• Focus here on income differences• 1998: top 20% - $127,529 bottom 20% - $9,223• Remove government transfers, include cap gains,
health benefits:– top 20% - 54% of total bottom 20% - 1% of total

Addison Wesley Longman, Inc. © 2000
Source of Wage Differences
• Technology– technology rewards skilled workers– Technology is a substitute for unskilled labor
and a complement for skilled labor• Generational Movement
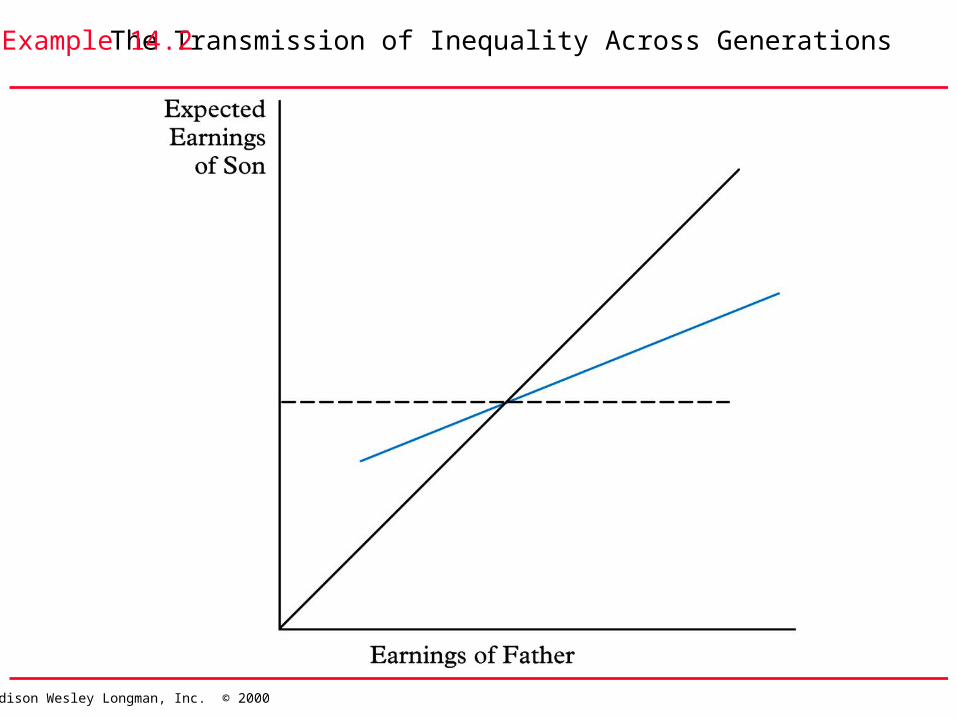
– Father in lowest 5% in earnings, son has 75% chance of being in lowest half
– Father in highest 5%, son has 75% chance of being in upper half
– 41% of families in lowest 1/5 in 1969 remain there in 1994
– 6% of those families made it to the top 1/5
Addison Wesley Longman, Inc. © 2000
The Transmission of Inequality Across GenerationsExample 14.2

Addison Wesley Longman, Inc. © 2000

Addison Wesley Longman, Inc. © 2000
Comparisons• International comparisons
– Ratio of earnings of the 80th% to the 20th%• US ratio for men is 4• Highest discrepancy in developed world• Canada, UK, France are over 3• Sweden, Australia under 2.25
• Comparisons over time– 1997: ratio was 3.43– 1975: ratio was 2.58– (lower income group lost income in real dollars)
• Comparisons by gender– 1997: ratio was 4.4– 1975: ratio was 4.41– (both groups improved in real dollars)
Addison Wesley Longman, Inc. © 2000
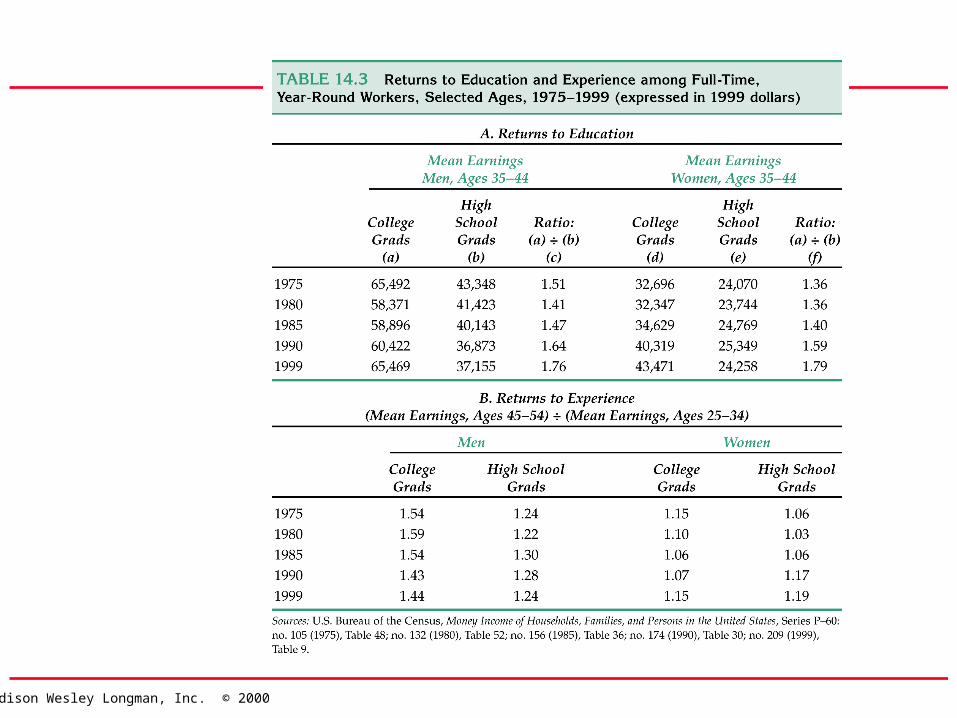
Explanations• Ratio of college to high school earnings has
risen
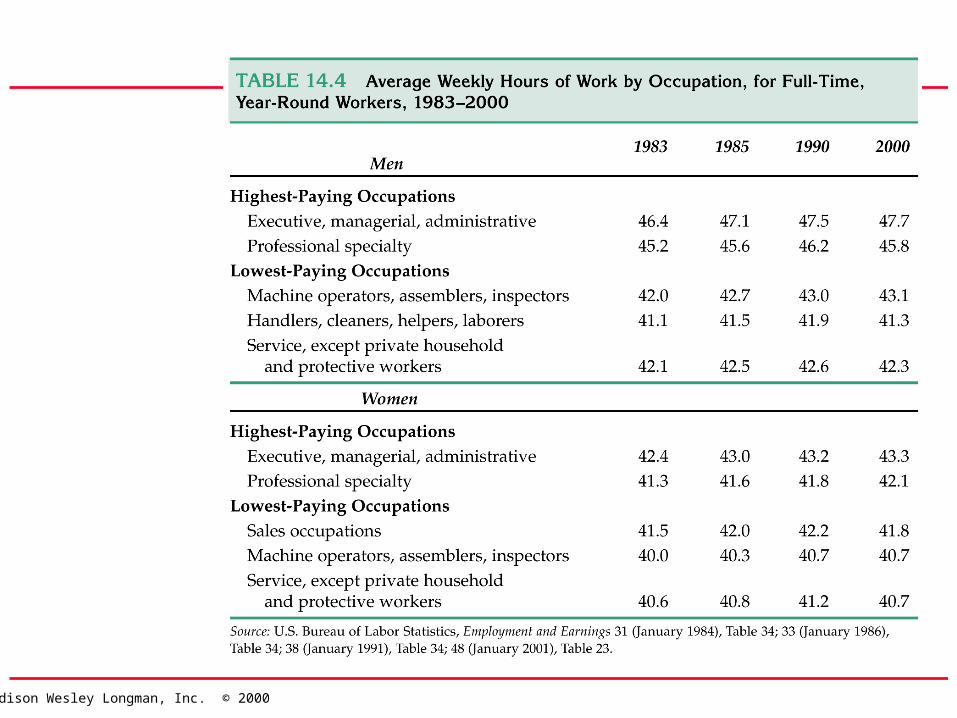
• Are high earners working more hours? – A little. Low earners have been made part-time,
but the difference in hour changes is small.
• Theory offers some explanations– Supply– Demand– Market changes

Addison Wesley Longman, Inc. © 2000
Changes in Supply As the Dominant Cause of Wage ChangesFigure 14.3
Addison Wesley Longman, Inc. © 2000
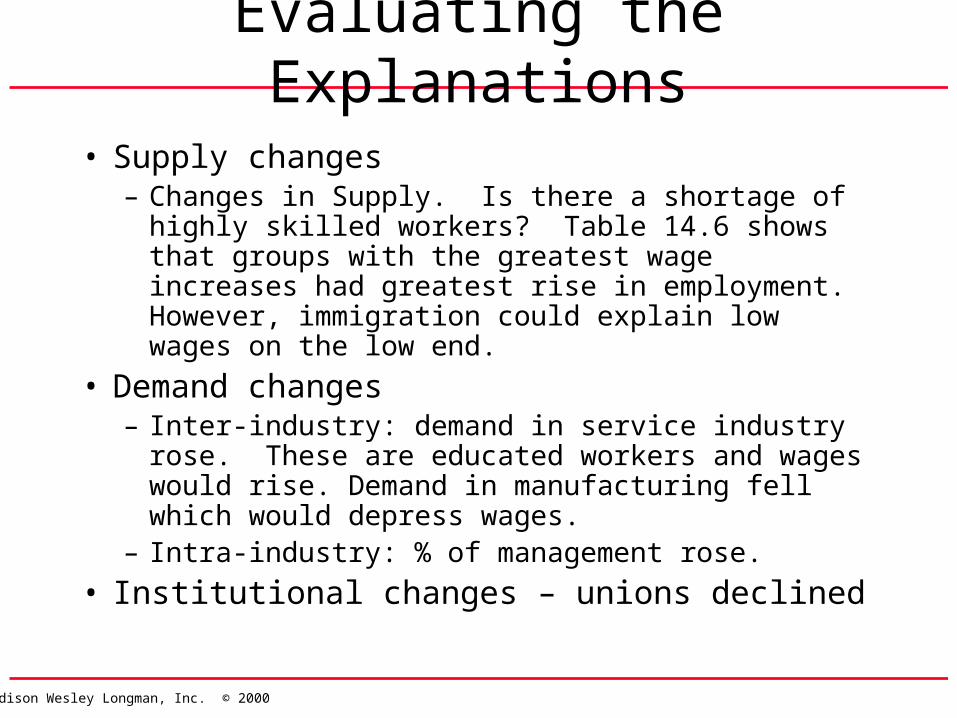
Evaluating the Explanations
• Supply changes– Changes in Supply. Is there a shortage of highly skilled
workers? Table 14.6 shows that groups with the greatest wage increases had greatest rise in employment. However, immigration could explain low wages on the low end.
• Demand changes– Inter-industry: demand in service industry rose. These
are educated workers and wages would rise. Demand in manufacturing fell which would depress wages.
– Intra-industry: % of management rose.
• Institutional changes – unions declined

Addison Wesley Longman, Inc. © 2000
Lorenz Curves for 1980 and 1992 Distributions of Income in the United States
Figure 14A.1
Addison Wesley Longman, Inc. © 2000
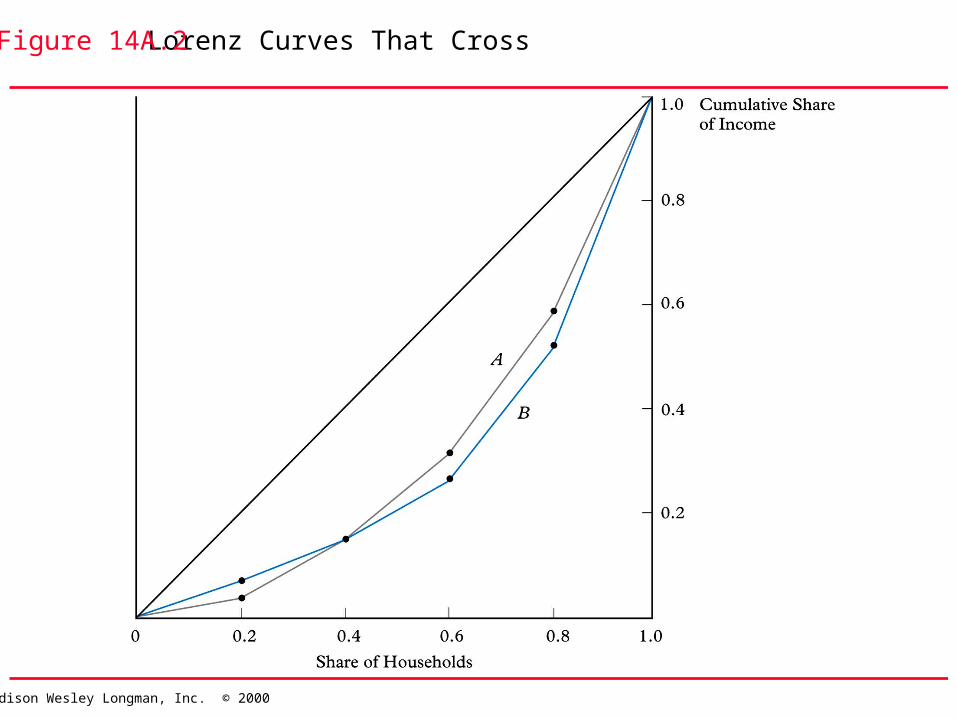
Lorenz Curves That CrossFigure 14A.2