Embed Size (px)
Citation preview
Addison Wesley Longman, Inc. © 2000
Chapter 9
Investments in Human Capital:Education and Training

Addison Wesley Longman, Inc. © 2000
EDUCATION & TRAINING
• Education/Training - raises stock of human capital• Migration/Job Search - raises value of the stock• Societal Choice and Individual Choice
– Global competition, high tech jobs etc.
– US schools fare poorly (6th out of 6 in table 9.4)
• Human capital is $305,000/person in US– $387,000 in Germany– $563,000 in Japan– 59% of wealth in US– 64% of wealth worldwide
Addison Wesley Longman, Inc. © 2000
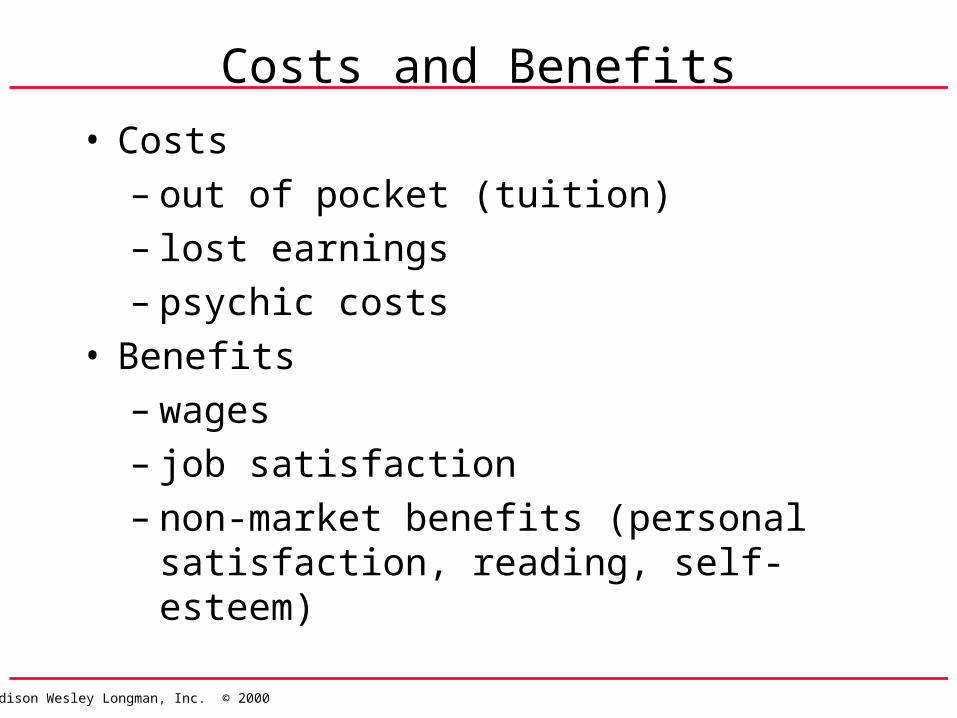
Costs and Benefits
• Costs– out of pocket (tuition)– lost earnings– psychic costs
• Benefits– wages– job satisfaction– non-market benefits (personal satisfaction,
reading, self-esteem)
Addison Wesley Longman, Inc. © 2000
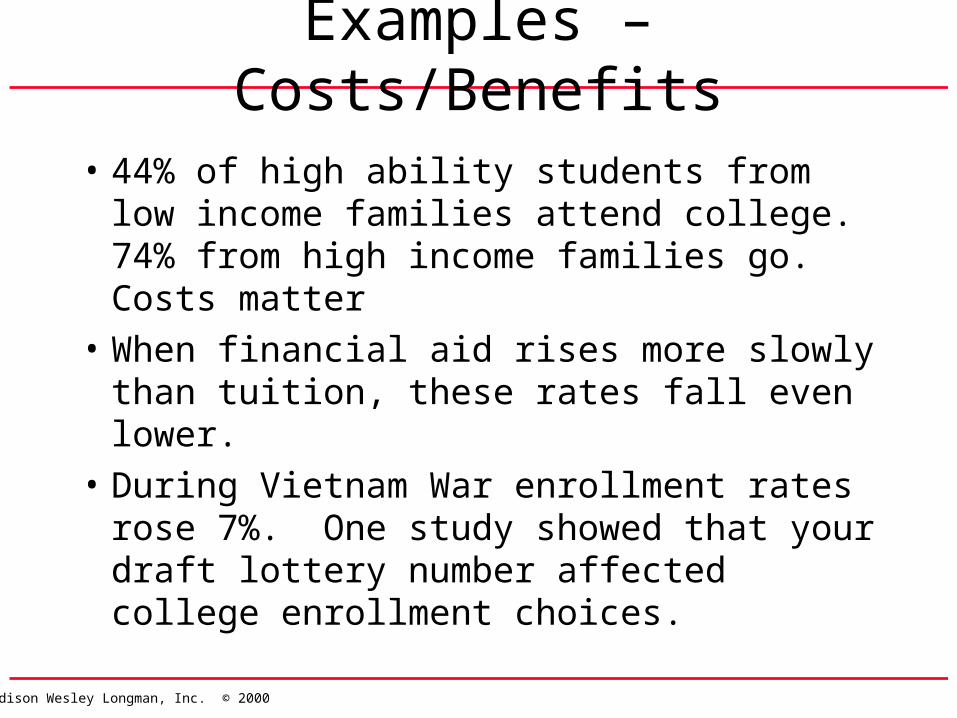
Examples – Costs/Benefits
• 44% of high ability students from low income families attend college. 74% from high income families go. Costs matter
• When financial aid rises more slowly than tuition, these rates fall even lower.
• During Vietnam War enrollment rates rose 7%. One study showed that your draft lottery number affected college enrollment choices.
Addison Wesley Longman, Inc. © 2000
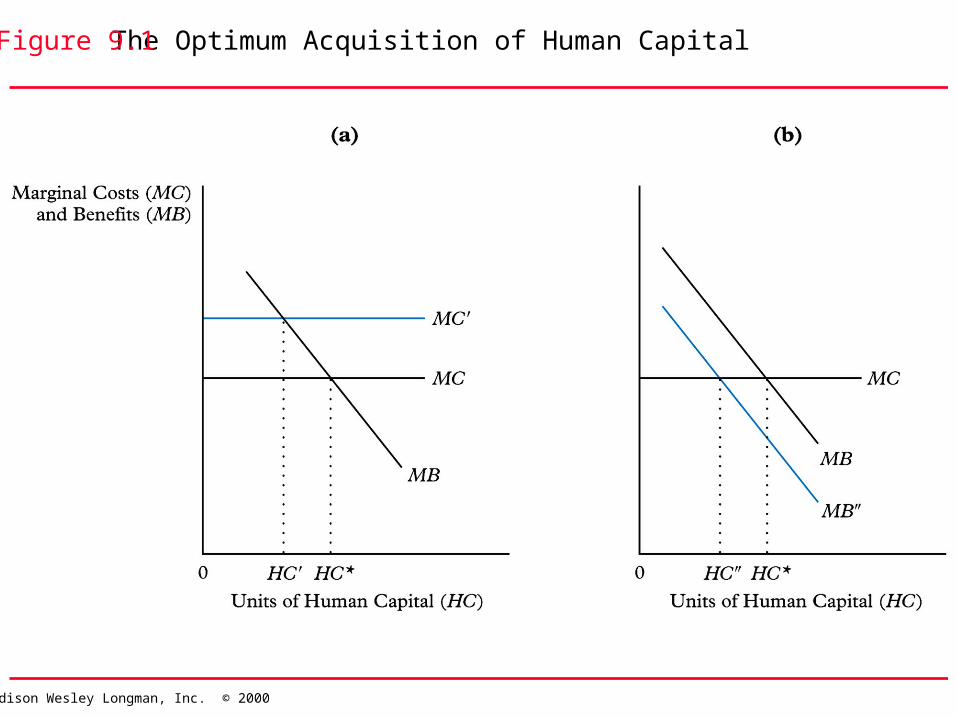
The Optimum Acquisition of Human CapitalFigure 9.1
Addison Wesley Longman, Inc. © 2000
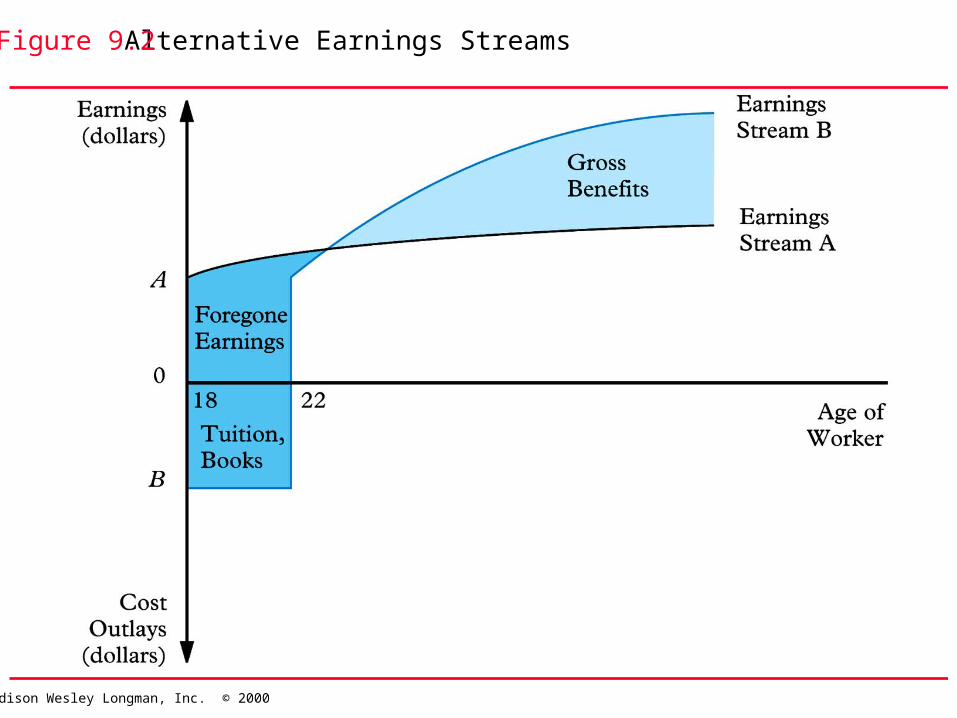
Alternative Earnings StreamsFigure 9.2
Addison Wesley Longman, Inc. © 2000
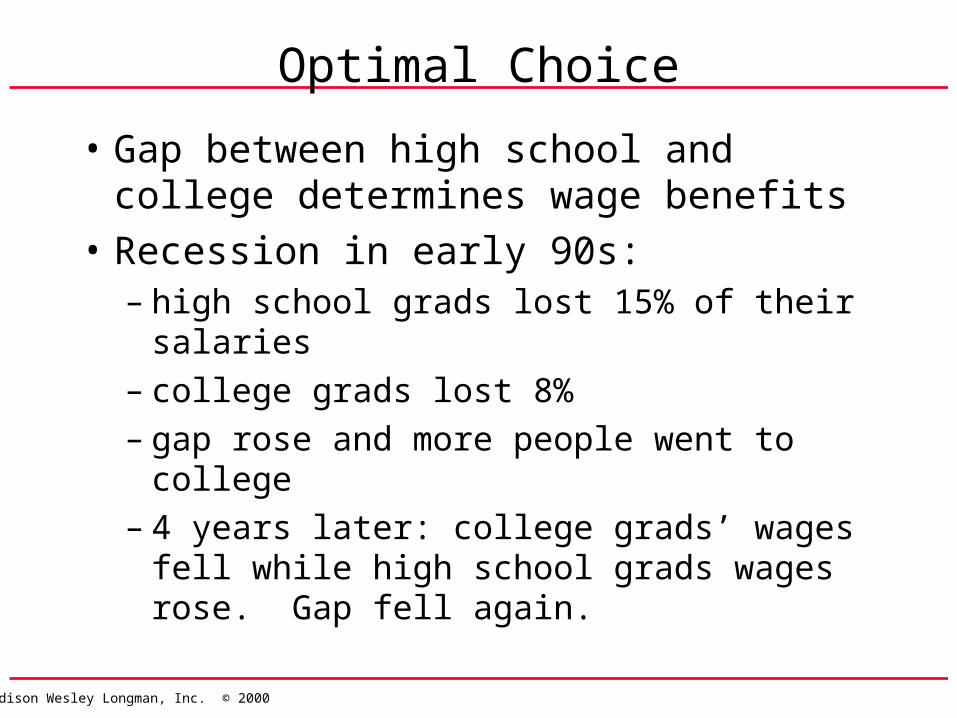
Optimal Choice
• Gap between high school and college determines wage benefits
• Recession in early 90s:– high school grads lost 15% of their salaries– college grads lost 8%– gap rose and more people went to college– 4 years later: college grads’ wages fell while
high school grads wages rose. Gap fell again.
Addison Wesley Longman, Inc. © 2000
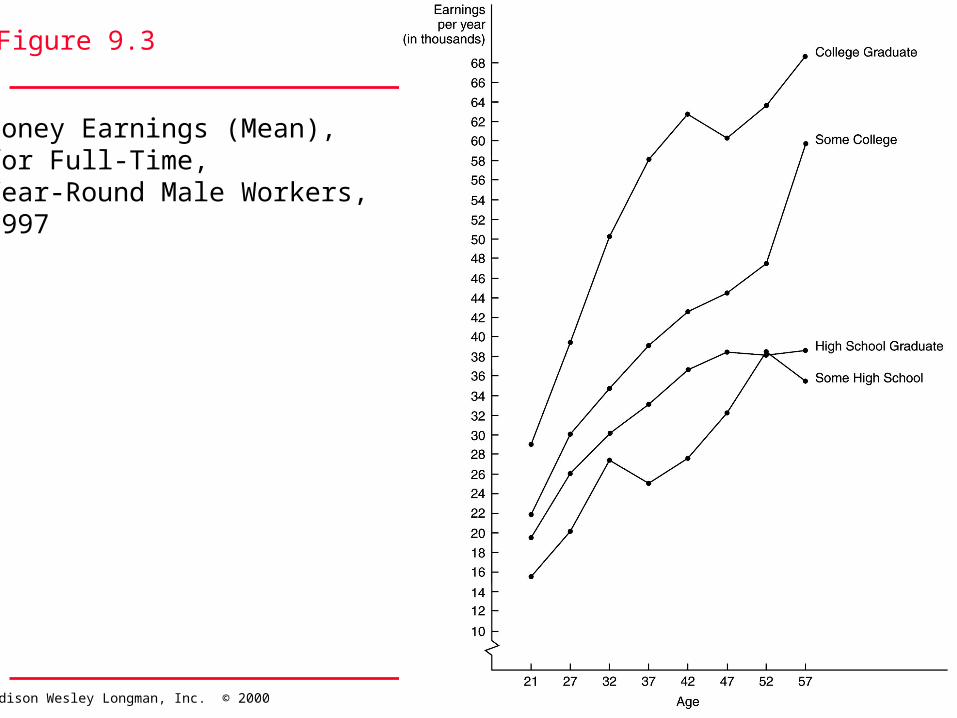
Money Earnings (Mean), for Full-Time, Year-Round Male Workers,1997
Figure 9.3
Addison Wesley Longman, Inc. © 2000
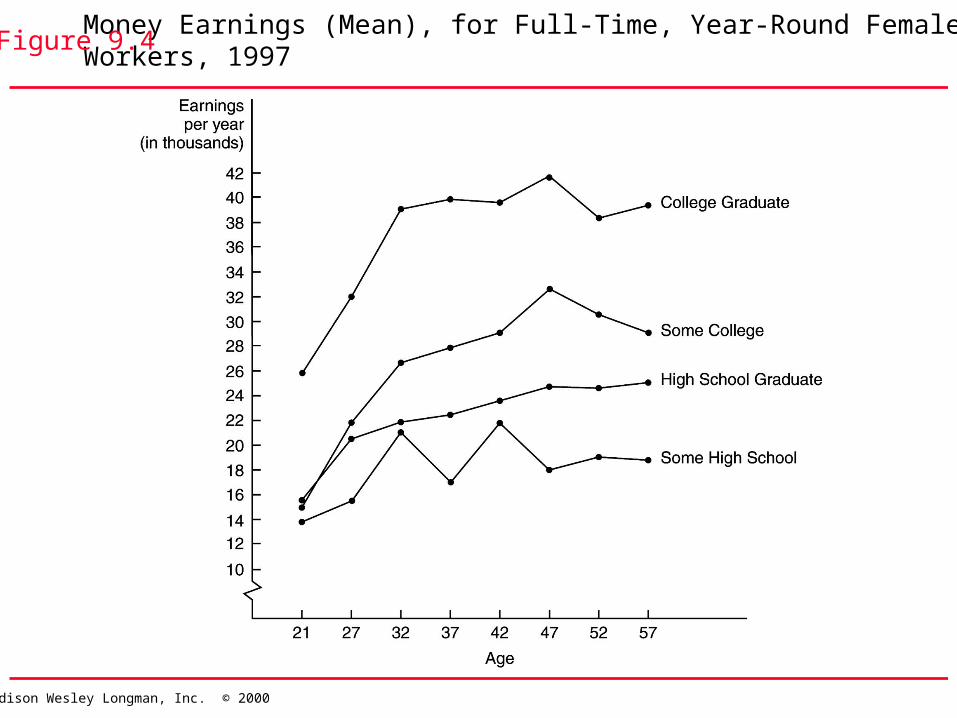
Money Earnings (Mean), for Full-Time, Year-Round Female Workers, 1997
Figure 9.4
Addison Wesley Longman, Inc. © 2000
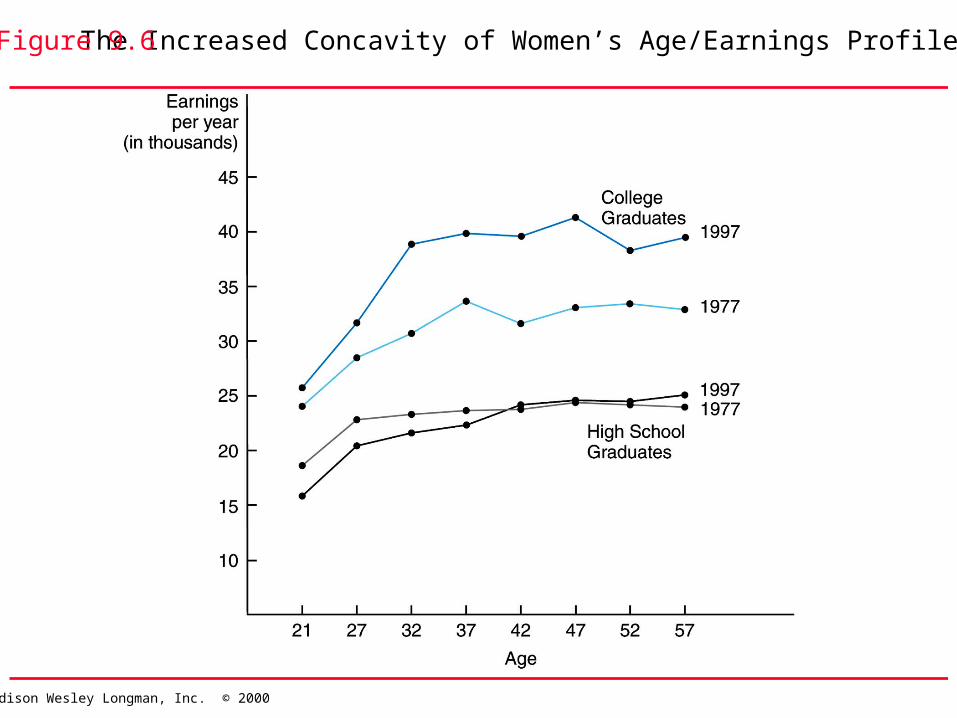
The Increased Concavity of Women’s Age/Earnings ProfilesFigure 9.6
Addison Wesley Longman, Inc. © 2000
GENDER DIFFERENCES
• Why do women with college degrees benefit less particularly in terms of experience?
• Experience seems to be less important– may be choosing jobs where experience is less
important (non-corporate career paths)– maybe taking time out of labor market so that age
is not a good measure of experience• Overall: women might choose less education
– gap is smaller– less time in labor market to receive benefits
• Women receive > 50% of college degrees. Why?

Addison Wesley Longman, Inc. © 2000
RETURN ON EDUCATION
• Wage estimates: 5-12% return
• Biased estimates?– Upward bias - people who become educated are
on average smarter, more ambitious etc and would have received higher wages anyway.
– Downward bias - many benefits are left out. This only measure the dollar value.
– Selection bias - Managers may be poor mechanics!
Addison Wesley Longman, Inc. © 2000
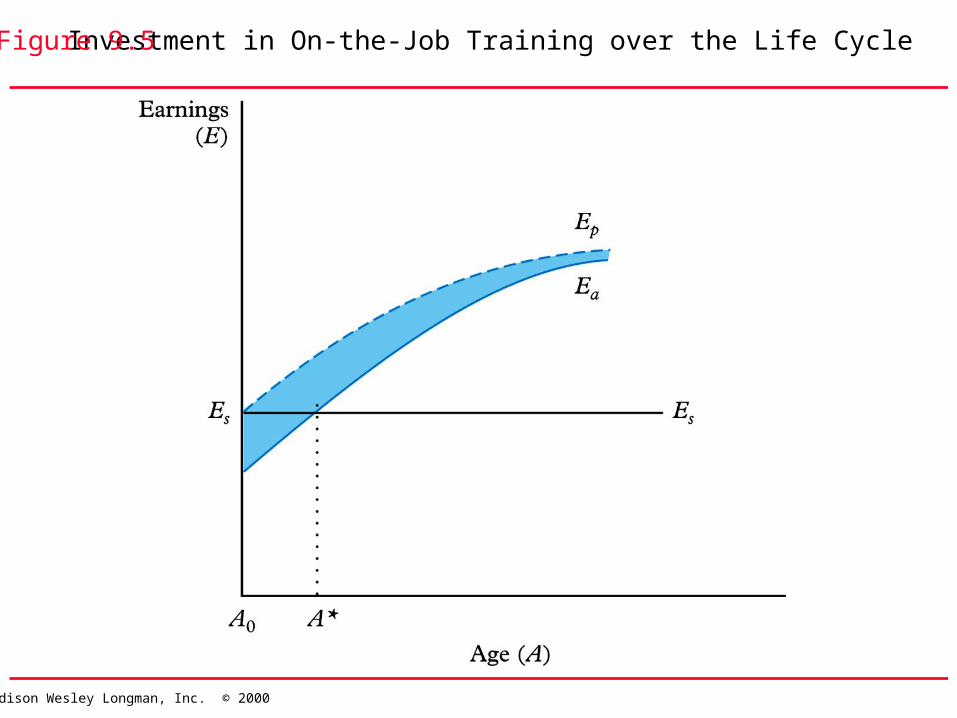
Investment in On-the-Job Training over the Life CycleFigure 9.5

Addison Wesley Longman, Inc. © 2000
The Benefits to Workers of Educational SignalingFigure 9.7

Addison Wesley Longman, Inc. © 2000
The Lifetime Benefits and Costs of Educational SignalingFigure 9.8
Addison Wesley Longman, Inc. © 2000
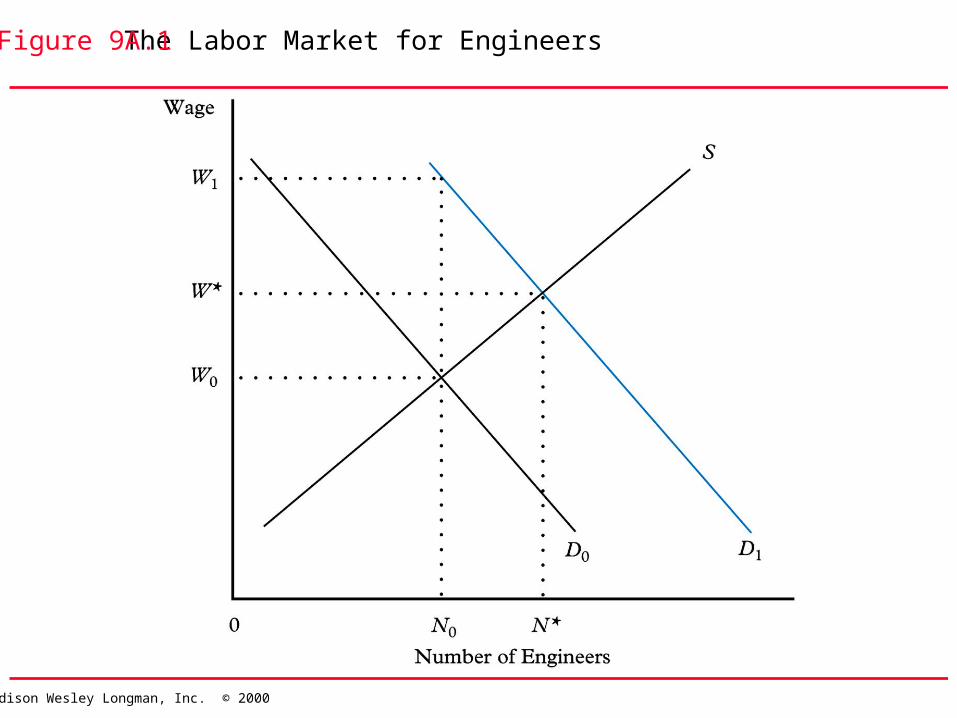
The Labor Market for EngineersFigure 9A.1
Addison Wesley Longman, Inc. © 2000
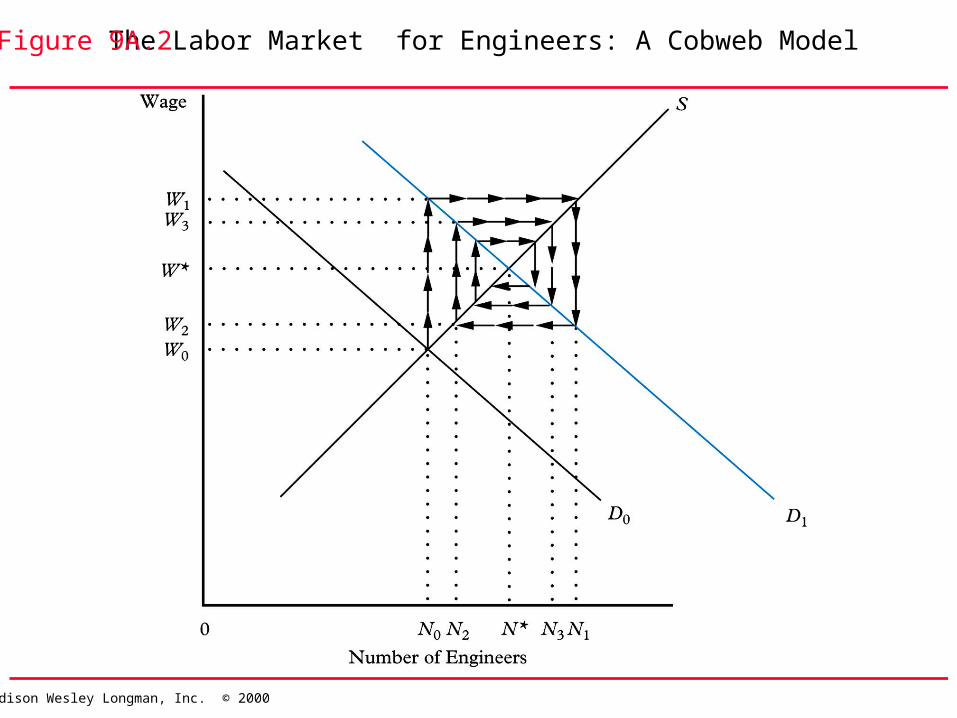
The Labor Market for Engineers: A Cobweb ModelFigure 9A.2

Addison Wesley Longman, Inc. © 2000
• http://www.bls.gov/emp/emped00.pdf
• http://www.census.gov/prod/2004pubs/p20-550.pdf