Embed Size (px)
Citation preview
0
Addis Ababa City Public Expenditure Review
July 2010
Pub
lic D
iscl
osur
e A
utho
rized
Pub
lic D
iscl
osur
e A
utho
rized
Pub
lic D
iscl
osur
e A
utho
rized
Pub
lic D
iscl
osur
e A
utho
rized
1
Table of Contents
Page
Executive Summary ................................................................................................... 2 I. Background ............................................................................................................ 3 II. Socio-Economic Profile of Addis Ababa ................................................................ 3
2.1 Demographic Structure................................................................................. 3 2.2 Economic structure, income and poverty profile.......................................... 4
III. Overview on Fiscal Devolution ............................................................................... 5 3.1 Legal, policy and Constitutional framework ................................................ 5 3.2 Practice of fiscal devolution ......................................................................... 6
IV. Planning and Budgeting Process ..............................................................................9 4.1 City Development Strategy ...........................................................................9 4.2 Budgeting process at city level ......................................................................9 4.3 Planning and budgeting at sub-city levels ....................................................10 4.4 Participation and transparency in the budget process...................................11
V. Overview of City Expenditure, Revenue and Financing. .........................................12 5.1 Expenditure Structure ..................................................................................12 5.2 Expenditure Outturn .......................................... .........................................14 5.3 Revenue Structure .......................................... .............................................15 5.4 Revenue Outturn .......................................... ...............................................17 5.5 Expenditure Financing .......................................... ......................................18
VI. Institutional context of Decentralization in Selected Sectors and Service Delivery Outcomes.................................................................................................................20
6.1. EDUCATION SECTOR: 6.1.1 Education sector budget formula /unit cost approach ...................20 6.1.2 Service Delivery in Education........................................................21
6.2 HEALTH SECTOR: ....................................................................................23 6.2.1 Service Delivery in Health..............................................................24
6.3 ROAD INFRASTRUCTURE......................................................................25 6.4 HOUSING DEVELOPMENT.....................................................................25
VII. Findings and Challenges..........................................................................................27 References.......................................................................................................................26 Annex..............................................................................................................................27
2
Executive Summary
Since 2003, following Addis Ababa City Government Revised Charter Proclamation, Addis
Ababa has achieved significant decentralization of service delivery to sub-cities and Kebeles.
Decentralization achievements at sub-city level is relatively strong while capacity problems
still prevail at Kebeles to fully exercise decentralized service provision.
Revenue collection in Addis Ababa has significantly grown in the last five years in nominal
terms, but it is still not in line with the city’s trend in level of economic activity. Aggregate
revenue outturns compared to original approved budgets are also low and volatile both at city
and sub-city levels. The weak revenue outturn has resulted in high expenditure deviation
between the budget and actual outlays. Although expenditure deviation at city level is still
high, the deviation has been decreasing in recent years.
Generally, there is a capacity problem in the budget preparation at city level. Revenues are
usually set ambitiously. With less than expected revenue outturns, disbursements by Bureau
of Finance and Economic Development (BoFED) to capital projects in different bureaus of
the city administration are usually below the approved budgets. As a result, project
implementations are usually delayed and uncertainty and frustration in project implementing
bodies is frequent.
During 2004/05 -2008/09, the city’s total nominal revenue and grants has grown by an annual
average rate of 21 percent. Total expenditure on the other hand has grown with an alarming
average annual rate of 39 percent, mainly as a result of huge capital expenditure on housing
development, which reached birr 1.5 billion in 2008/09. As a result, the city is continuously in
overall budget deficit since 2006/07. In 2007/08 and 2008/09, the deficit has significantly
widened and was financed by bond issued by the city administration worth birr1 billion in
both years. Since the city administration’s loan on bonds is used to finance outlays of
housing construction which in the future would raise capital revenue from beneficiaries, the
deficit is not expected to endanger the city government’s financial capability to discharge its
functions and obligations in the future.
The city’s expenditure to a large extent (with few exceptions) reflects the city government’s
priorities stipulated in the city strategic plan. Road construction, housing development and
water supply are the most important sectors given special priority in capital expenditure.
Other priority sectors of the strategic plan including education and health services however
are not fully reflected in the city’s capital expenditure.
3
The trend in the city’s pro-poor expenditure in proportion of total spending has increased
through 2004/05-2008/09 because of the big capital outlays on housing development. The
share of other pro-poor sectors including education and health is however declining. Among
the pro-poor sectors, spending was quite low on public health. The share of spending on
public health which was around 3% of the city’s total spending in 2008/09 is less than one
third of other regional states’ average spending share in the sector. As a result of such low
spending on health, public health service delivery of Addis Ababa in weak and has shown
little improvement in the five years since 2004/05.
Service delivery outcomes in education on the other hand are mixed. Positive achievement is
notable on secondary schools in which the number of government schools and students has
increased significantly since 2004/05. In primary and junior schools however results are not
as such significant. Although the number of government schools both at primary and
secondary levels has significantly increased during 2004/05-2008/09, the number of students
enrolled in government schools has declined slightly. This is the result of the city residents’
preference to non-government schools which provide generally better quality education than
government schools.
Outcomes on road and housing development are remarkable. An extensive construction of
new roads and upgrading of the existing ones during 2004/05-2008/09 has brought
considerable results both in length and quality measurements. Total length of road in the city
has increased from 2200 km in 2004/05 to 2814 km in 2008/09. The city’s housing problem is
also being moderated slowly by the development of condominium houses. The city
administration has constructed about 77,991 condominium houses during 2004/05 – 2008/09
and more than 60 % of the distributed houses given to women.
4
I. Background This study on Addis Ababa is part of the national Public Expenditure Review (PFR-2010)
study and the report is one of the four regional PER-2010 reports. The objective of the study
is to review the institutional arrangements for managing public finances in Addis Ababa city
administration, to assess the level, trend, and composition of public revenue, spending and
financing as well as to review the planning and budgeting process. The study has also tried to
evaluate the city administration’s service delivery outcomes in education and health sectors as
well as road and housing development which are the two most prioritized sectors in terms of
their share from the total capital outlay.
The report has reviewed different studies, plans and performance reports of the various
sectors in the city administration. The analysis is largely based on information and data
obtained from different bureaus of the city administration especially Addis Ababa Bureau of
Finance and Economic Development. The quantitative and qualitative information are
collected by visits to relevant City Administration Bureaus and Federal Ministries.
II. Socio-Economic Profile of Addis Ababa
2.1 Demographic Structure
Addis Ababa, the capital of Ethiopia, is the industrial, commercial and cultural centre of the
country. Being the seat of various regional and international institutions, it is an important
political and diplomatic hub of Africa. With a population of more than 2.7 million (CSA
2008), Addis Ababa is the largest city in Ethiopia. According to the 2007 population and
housing census of the Central Statistical Agency, the city accounts for 30% of the nation’s
urban population and is ethnically diverse. 52.4% of the population is female, a slightly
higher rate than the national ratio (51%). Addis Ababa also has the highest number of female-
headed households (38.5%) in Ethiopia.
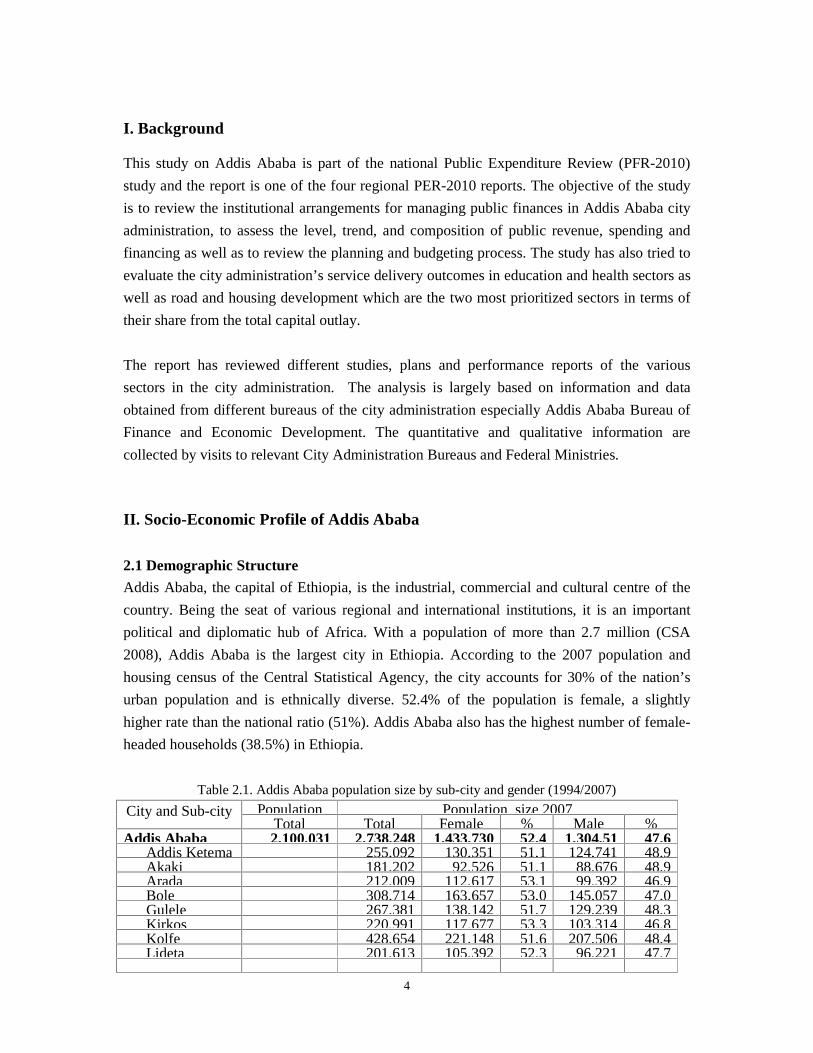
Table 2.1. Addis Ababa population size by sub-city and gender (1994/2007)
Population Population size 2007City and Sub-city Total Total Female % Male %
Addis Ababa 2,100,031 2,738,248 1,433,730 52,4 1,304,51 47,6Addis Ketema 255,092 130,351 51,1 124,741 48,9Akaki 181,202 92,526 51,1 88,676 48,9Arada 212,009 112,617 53,1 99,392 46,9Bole 308,714 163,657 53,0 145,057 47,0Gulele 267,381 138,142 51,7 129,239 48,3Kirkos 220,991 117,677 53,3 103,314 46,8Kolfe 428,654 221,148 51,6 207,506 48,4Lideta 201,613 105,392 52,3 96,221 47,7
5
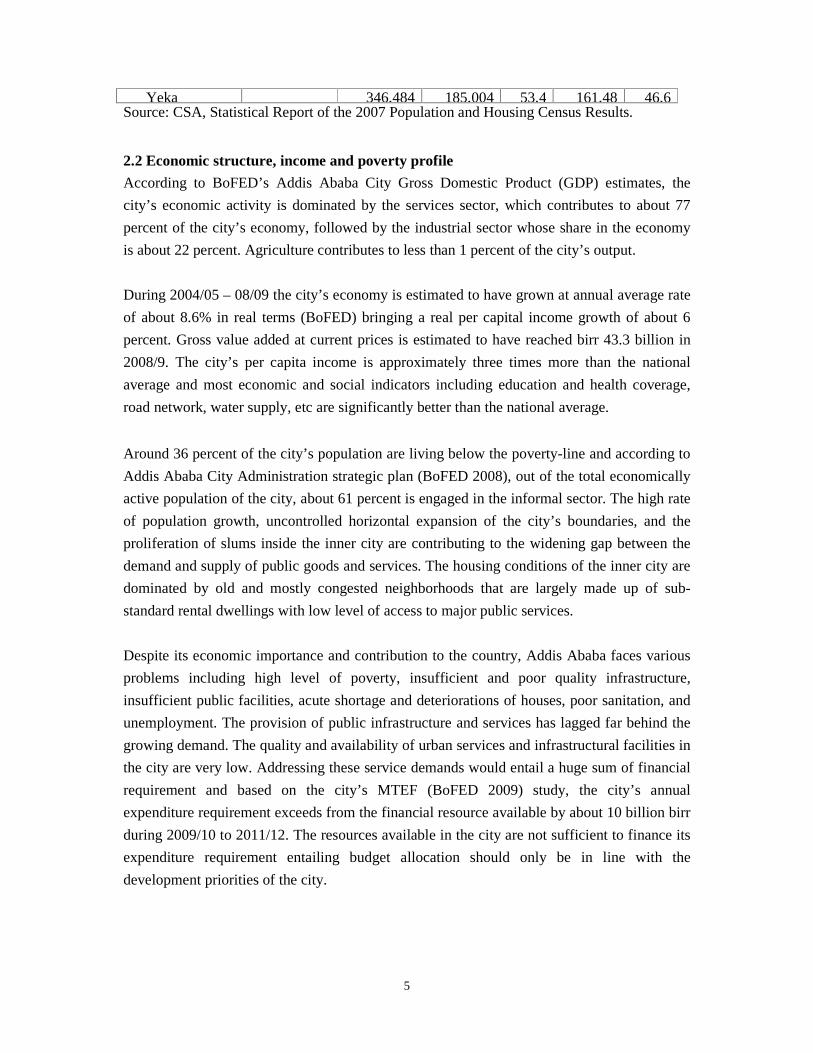
Yeka 346,484 185,004 53,4 161,48 46,6Source: CSA, Statistical Report of the 2007 Population and Housing Census Results.
2.2 Economic structure, income and poverty profile
According to BoFED’s Addis Ababa City Gross Domestic Product (GDP) estimates, the
city’s economic activity is dominated by the services sector, which contributes to about 77
percent of the city’s economy, followed by the industrial sector whose share in the economy
is about 22 percent. Agriculture contributes to less than 1 percent of the city’s output.
During 2004/05 – 08/09 the city’s economy is estimated to have grown at annual average rate
of about 8.6% in real terms (BoFED) bringing a real per capital income growth of about 6
percent. Gross value added at current prices is estimated to have reached birr 43.3 billion in
2008/9. The city’s per capita income is approximately three times more than the national
average and most economic and social indicators including education and health coverage,
road network, water supply, etc are significantly better than the national average.
Around 36 percent of the city’s population are living below the poverty-line and according to
Addis Ababa City Administration strategic plan (BoFED 2008), out of the total economically
active population of the city, about 61 percent is engaged in the informal sector. The high rate
of population growth, uncontrolled horizontal expansion of the city’s boundaries, and the
proliferation of slums inside the inner city are contributing to the widening gap between the
demand and supply of public goods and services. The housing conditions of the inner city are
dominated by old and mostly congested neighborhoods that are largely made up of sub-
standard rental dwellings with low level of access to major public services.
Despite its economic importance and contribution to the country, Addis Ababa faces various
problems including high level of poverty, insufficient and poor quality infrastructure,
insufficient public facilities, acute shortage and deteriorations of houses, poor sanitation, and
unemployment. The provision of public infrastructure and services has lagged far behind the
growing demand. The quality and availability of urban services and infrastructural facilities in
the city are very low. Addressing these service demands would entail a huge sum of financial
requirement and based on the city’s MTEF (BoFED 2009) study, the city’s annual
expenditure requirement exceeds from the financial resource available by about 10 billion birr
during 2009/10 to 2011/12. The resources available in the city are not sufficient to finance its
expenditure requirement entailing budget allocation should only be in line with the
development priorities of the city.
6
III. Overview on Fiscal Devolution
3.1 Legal, Policy and Constitutional framework
Since 2003, Addis Ababa is a self-administrated chartered city and to a large extent
autonomous. The city charter of Addis Ababa lays out the constitutional procedures and
structures. The city’s main administrative organs are city, sub-city and Kebele
administrations.
The majority political party or a coalition in the city council elects the Mayor and the Deputy
Mayor, the members of the city court, and the general auditor. It also approves members of
the city cabinet chosen by the Mayor that consists of the bureau heads representing the sector
bureaus. The Mayor also chooses the city manager who executes municipal services such as
housing and construction.
The city council is authorised to transfer tasks and decision-making authority to the sub-cities
and Kebeles. The sub-cities and Kebeles are self-governed and are managed by sub-city
councils and Kebele councils respectively which in turn elect Chief Executive Officers
(CEOs) (comparable to local mayors). The councils are supported by standing committees
(comparable to the city cabinet) and sub-city/Kebele managers. The CEOs are accountable to
the Mayor as well as to the council which elected them.
The city administration is divided into two divisions: state and municipal functions. State
functions are executed by the Bureaus of Capacity Building, Culture and Tourism, Education,
Finance and Economic Development, Health, Information and Culture, Justice and Legal
Affairs, Social and Civil Affairs, Trade and Industry Development, Women’s Affairs, Works
and Urban Development, and Youth and Sport. The Bureaus are managed by a Head of
Bureau and correspond to the structures of the federal government. Together with the Mayor
these Head of Bureaus constitute the Cabinet.
Municipal functions are administered by the Mayor who on his part mandates the city
managers with their supervision. Municipal sectors are the City Roads Authority, Fire and
Emergency Service, House Development Project Office, Housing Agency, Infrastructure and
Construction Authority, Land Development and Administration, Residents Identification and
Civil Status Documents Service, Sanitation, Beautification and Parks Development Agency,
and Water and Sewage Authority.
7
Through the city charter and further federal laws, Addis Ababa City receives to a large extent
fiscal sovereignty. Accordingly, the city is able to finance its expenditures itself through tax
and non-tax revenues. Apart from revenues from the federal road fund which finances road
maintenance, the city does not receive any federal aid and is not part of the financial
equalisation scheme between the federal government and the regions.
3.2 Practice of fiscal devolution
The Addis Ababa City Administration is authorised to assess and collect tax on income from
employment within the city (excluding employees of Oromia Region, of the Federal
Government and Federal Public Enterprises); fix and collect land use fee, land rent and urban
house tax; profit, excise and turnover taxes from individual businessmen; tax on income from
rented houses and other properties; stamp duty on contracts and agreements; fees on license
issued and services delivered; municipal taxes as well as capital gains tax on property in the
city. It also has the right to receive value added tax collected by Federal Government from
individual. Taxes and fees are collected at the sub-city level. The collected taxes and fees are
however transferred to the central Addis Ababa BoFED account. As determined in the city
budget, sub-cities receive an allocation of the collected funds and are free to decide on their
priorities such as education or local development. As significant differences in revenue
collection exist between the different sub-cities, a financial equalisation scheme is practised
within Addis Ababa.
In the sub-cities and Kebeles, elected councils make the decisions regarding expenditure
assignment. Through the Kebele councils, local people are encouraged to participate in the
budget process. This devolution of decision-making power to the sub-cities and Kebeles was
introduced in 2003 after the federal proclamation to re-organize the city and improve
achievements of development objectives and good governance through decentralization of
public services.
Despite significant achievements in decentralization of service delivery to sub-cities and
Kebeles since 2003, capacity problems prevail especially at Kebeles to fully exercise
decentralized service provision. Currently for example, Kebeles administer the construction of
primary and secondary schools. In the health sector, on the other hand, Kebeles do not play an
active role and health centers are still managed by sub-cities. Community participation in the
budget process both at sub-cities and Kebeles is also generally low or non-existent.
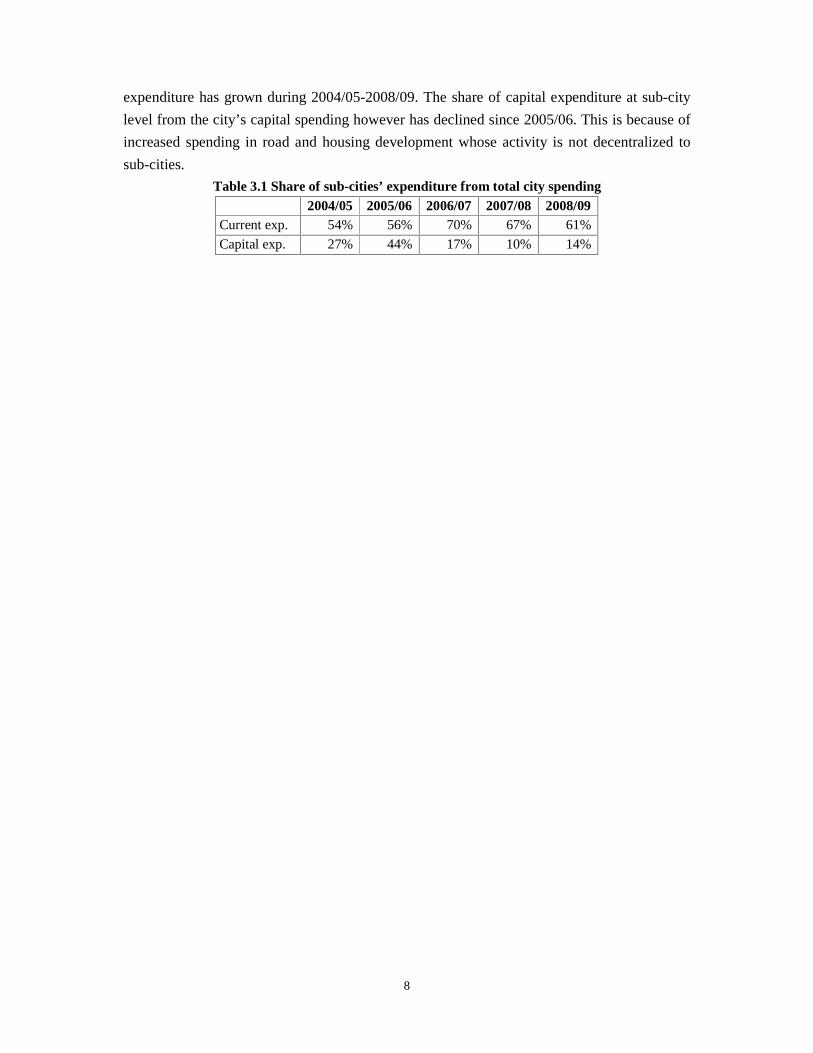
Addis Ababa’s fiscal devolution to sub-cities is reflected in expenditure at sub-city level in
proportion to expenditure at city level. On average more than 60 percent of the city’s current
expenditure is spent at sub-cities. The share of sub-cities spending out of the total current
8
expenditure has grown during 2004/05-2008/09. The share of capital expenditure at sub-city
level from the city’s capital spending however has declined since 2005/06. This is because of
increased spending in road and housing development whose activity is not decentralized to
sub-cities.
Table 3.1 Share of sub-cities’ expenditure from total city spending 2004/05 2005/06 2006/07 2007/08 2008/09 Current exp. 54% 56% 70% 67% 61%
Capital exp. 27% 44% 17% 10% 14%
9
IV. Planning and Budgeting Process
4.1 City Development Strategy
The city administration had prepared a strategic plan in 2007 which was later improved by the
newly elected administration in 2008. The plan is prepared for the years from 2008/09 to
2012/13. The development strategy is prepared based on the people’s need, the country’s plan
for accelerated and sustainable development to end poverty (PASDEP), and the federal urban
development and governance programme.
Based on consultations made with the community at different levels of administration and in
different periods, the Addis Ababa city government has tried to evaluate the city’s basic
economic and social problems, service delivery gaps and identify priority sectors based on the
needs of the society. Accordingly the administration has identified the priority sectors in
capital project/program budget allocation to be housing, drinking water, road, small and micro
enterprise development, health, education, solid waste management and local development.
The specified priority area represent almost all of the major divisions of functional
classification of sectors According to the strategic plan document, these sectors are given
special emphasis in the preparation of the strategy.
Moreover, the development strategy specifies capacity building as the core operational area of
the city administration. The city administration has about 35 thousand employees in all
bureaus, sub-cities and other administrative bodies. The employees and the institutions being
the major instruments of the city’s public service delivery, are given due consideration in the
strategic plan. Institutional transformation through appropriately decentralized institutional
structure, capacity building and attitudinal change is believed key for improved service
delivery by the city administration.
The strategic plan has set targets of achievement in different sectors. According to the city’s
medium term expenditure framework (BoFED, 2009) the general resource allocation and
budgeting is guided by this strategic plan.
4.2 Budgeting process at city level
At city level, the Bureau of Finance and Economic Development (BoFED) prepares annual
budget proposals and submits them to the city cabinet for approval after undertaking
discussions with responsible bodies. Before 2008, the city administration used to prepare
10
budgets on an annual basis and transfer grants to the sub-cities in the form of both specific
and general grants and to city bureaus only in the form of specific grant. Budgets were
allocated using annual budgeting, which was made on incremental basis. The city
administration with the objectives of linking budgets with city policies and planning,
maintaining effectiveness and efficiency in budget utilization, ensure macro-economic
stability and provide budget predictability to sectors, changed its budgeting into a multi-year
budget framework and the first Medium Term Expenditure Framework (MTEF) was prepared
in 2008. The city’s budget for 2008/09 and subsequent years were prepared based on MTEF.
Annual plans are prepared based on the approved MTEF which has 3-year revolving
projection. After the budget hearing, the budget is presented to the city cabinet and the city
council respectively. The Mayor in accordance with the city cabinet allocates the budget to
the different sectors and submits quarterly and annual reports to the city council. The different
departments follow up the budget implementation with monthly performance reports and
quarterly budget reports. Budget performance is also followed up by MoFED which receives
quarterly financial performance reports from BoFED. In case of budget deficits the city
administration has to borrow money from MoFED or other sources.
4.3 Planning and budgeting at sub-city level
The budgeting process at city-level is repeated at the sub-city level. Sub-cities prepare their
own budget plans which are largely based on the city’s strategic plan as well as Kebele budget
plans. They are administered and implemented by the finance offices and must also be
approved by the sub-city cabinet and council. The sub-city budgets are taken into
consideration by BoFED which subsequently allocates grants to the sub-cities. While the sub-
cities are, in theory, free to allocate the money they receive to Kebeles and sectors according
to their priorities, they are still largely influenced by city priorities and receive budget ceilings
from BoFED. If sub-cities are late with their budget planning, BoFED determines their budget
for them.
Budget implementation is controlled by performance reports submitted by sub-city CEOs to
the sub-city councils. Moreover, budget performance reports in the sectors are prepared three
times a year together with semi-annual and annual internal audits. Budget deficit in financing
a particular expenditure within one public body or sub-city is usually handled by budget
transfer (which is possible for example from salary to other recurrent budget and from
recurrent to capital budget). Budget deficits at sub-city level however cannot be addressed by
the sub-cities themselves, but have to be met through requests to the city administration.
Based on the request, the city cabinet may approve supplementary budget or transfer unused
funds from other sub-cities.
11
There are regular meetings between the sub-cities and city administration to align planning.
Sector offices also meet at the city level in order to exchange information and adjust annual
plans and budgets. In terms of organisation, the different administrative levels are connected
through the Integrated Budget and Expenditure (IBEX) system and sub-city offices receive
support from BoFED in their policy formulation and capacity building trainings for their staff.
4.4 Participation and transparency in the budget process
Participation of residents in the budgeting process is encouraged and budgetary meetings are
open to the population. The approved budget is published in a governmental newspaper, the
Federal Negarit Gazeta as well as on the local radio (Addis FM). Kebeles play a major role in
especially encouraging direct participation. This includes the preparation and submittal of
budget plans to the sub-cities. People’s Advisory Councils have been set up at Kebele, sub-
city, and city levels. The councils deliberate on policies, strategies, and programmes.
However, participation and decentralisation of power are not fully realised yet.
12
V. Overview of City Expenditure, Revenue and Financing.
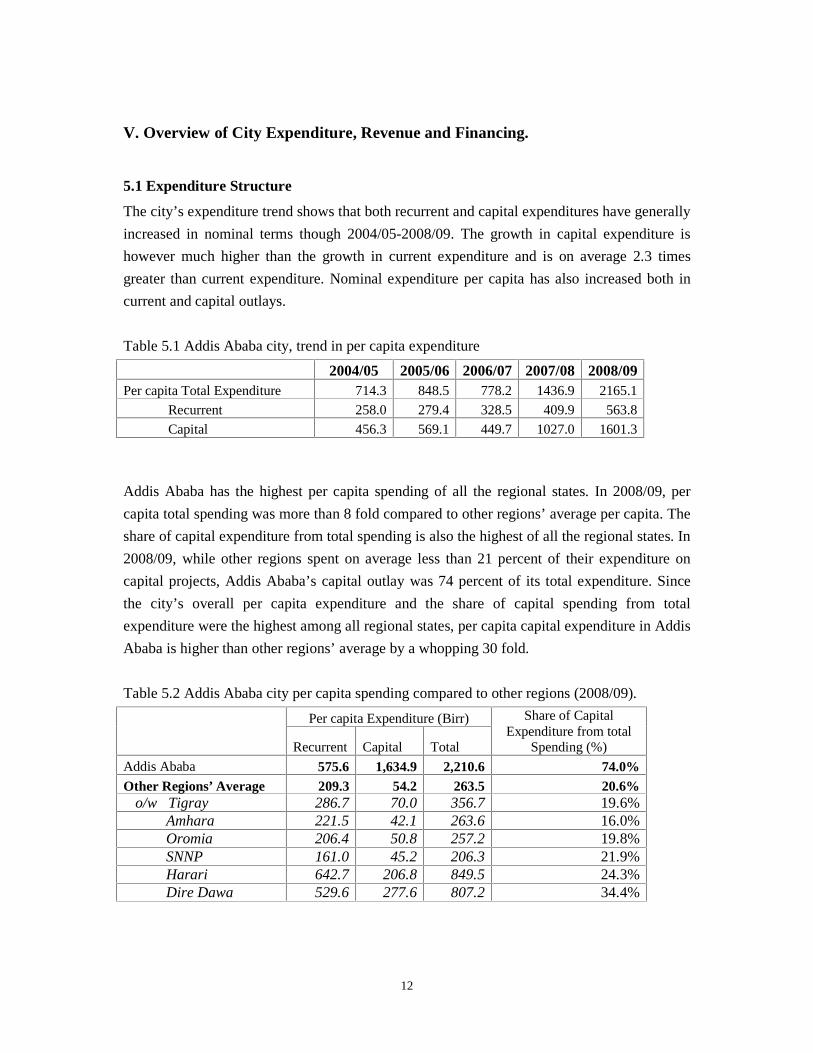
5.1 Expenditure Structure
The city’s expenditure trend shows that both recurrent and capital expenditures have generally
increased in nominal terms though 2004/05-2008/09. The growth in capital expenditure is
however much higher than the growth in current expenditure and is on average 2.3 times
greater than current expenditure. Nominal expenditure per capita has also increased both in
current and capital outlays.
Table 5.1 Addis Ababa city, trend in per capita expenditure
2004/05 2005/06 2006/07 2007/08 2008/09Per capita Total Expenditure 714.3 848.5 778.2 1436.9 2165.1
Recurrent 258.0 279.4 328.5 409.9 563.8
Capital 456.3 569.1 449.7 1027.0 1601.3
Addis Ababa has the highest per capita spending of all the regional states. In 2008/09, per
capita total spending was more than 8 fold compared to other regions’ average per capita. The
share of capital expenditure from total spending is also the highest of all the regional states. In
2008/09, while other regions spent on average less than 21 percent of their expenditure on
capital projects, Addis Ababa’s capital outlay was 74 percent of its total expenditure. Since
the city’s overall per capita expenditure and the share of capital spending from total
expenditure were the highest among all regional states, per capita capital expenditure in Addis
Ababa is higher than other regions’ average by a whopping 30 fold.
Table 5.2 Addis Ababa city per capita spending compared to other regions (2008/09).
Per capita Expenditure (Birr)
Recurrent Capital Total
Share of Capital Expenditure from total
Spending (%)
Addis Ababa 575.6 1,634.9 2,210.6 74.0%Other Regions’ Average 209.3 54.2 263.5 20.6%
o/w Tigray 286.7 70.0 356.7 19.6%Amhara 221.5 42.1 263.6 16.0%Oromia 206.4 50.8 257.2 19.8%SNNP 161.0 45.2 206.3 21.9%Harari 642.7 206.8 849.5 24.3%Dire Dawa 529.6 277.6 807.2 34.4%
13
Addis Ababa’s expenditure pattern to a large extent reflects the city government’s priorities
stipulated in the city strategic plan. Infrastructure development in road and housing
development are the two most important sectors given special priority in expenditure. The two
sectors together account 74 percent of the city’s capital outlay in 2008/09. Water supply as a
priority sector can be also clearly noted in its relatively high capital expenditure. Other
priority sectors indicated in the strategic plan of the city including education and health
services however seem to be less reflected in the city’s capital expenditure.
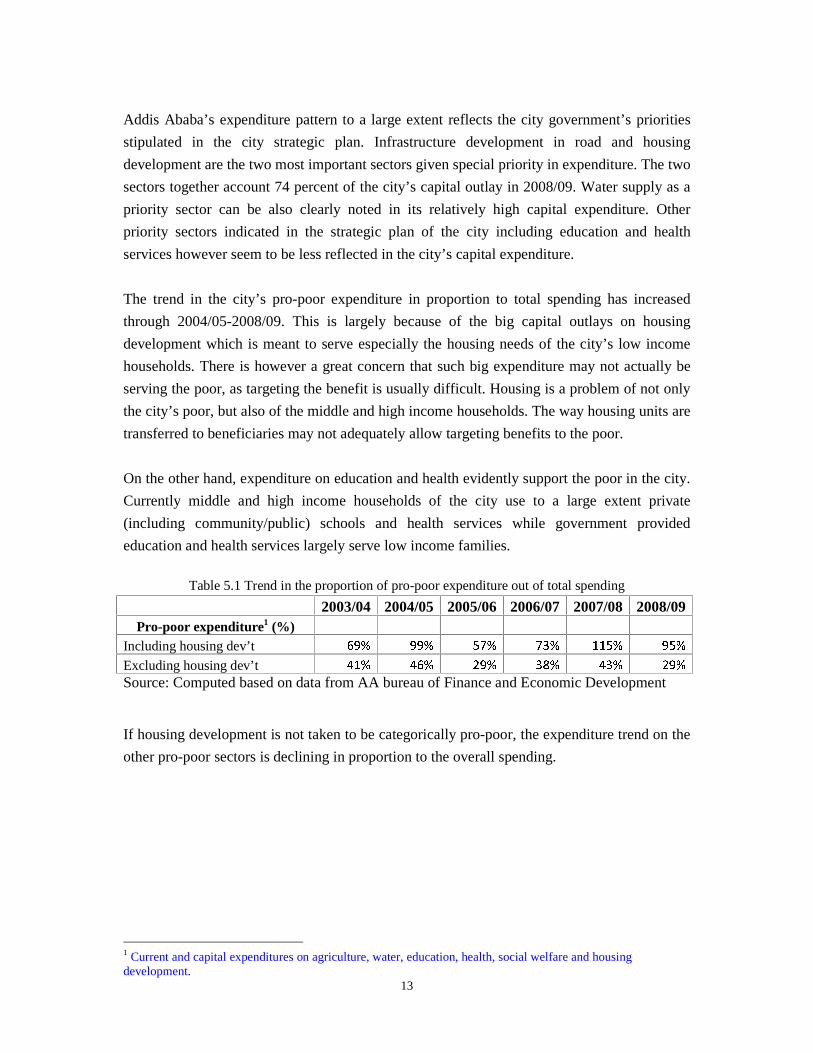
The trend in the city’s pro-poor expenditure in proportion to total spending has increased
through 2004/05-2008/09. This is largely because of the big capital outlays on housing
development which is meant to serve especially the housing needs of the city’s low income
households. There is however a great concern that such big expenditure may not actually be
serving the poor, as targeting the benefit is usually difficult. Housing is a problem of not only
the city’s poor, but also of the middle and high income households. The way housing units are
transferred to beneficiaries may not adequately allow targeting benefits to the poor.
On the other hand, expenditure on education and health evidently support the poor in the city.
Currently middle and high income households of the city use to a large extent private
(including community/public) schools and health services while government provided
education and health services largely serve low income families.
Table 5.1 Trend in the proportion of pro-poor expenditure out of total spending
2003/04 2004/05 2005/06 2006/07 2007/08 2008/09Pro-poor expenditure1 (%)
Including housing dev’t
Excluding housing dev’t Source: Computed based on data from AA bureau of Finance and Economic Development
If housing development is not taken to be categorically pro-poor, the expenditure trend on the
other pro-poor sectors is declining in proportion to the overall spending.
1 Current and capital expenditures on agriculture, water, education, health, social welfare and housing development.
14
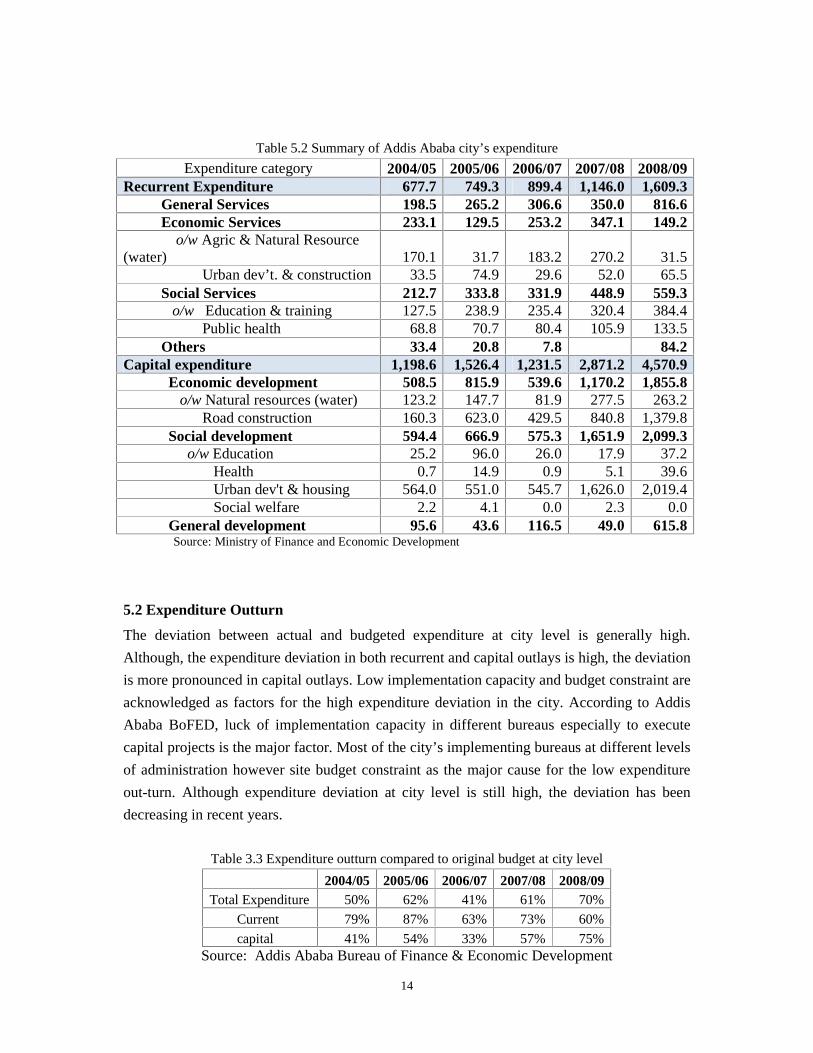
Table 5.2 Summary of Addis Ababa city’s expenditure
Expenditure category 2004/05 2005/06 2006/07 2007/08 2008/09Recurrent Expenditure 677.7 749.3 899.4 1,146.0 1,609.3
General Services 198.5 265.2 306.6 350.0 816.6Economic Services 233.1 129.5 253.2 347.1 149.2
o/w Agric & Natural Resource (water) 170.1 31.7 183.2 270.2 31.5
Urban dev’t. & construction 33.5 74.9 29.6 52.0 65.5Social Services 212.7 333.8 331.9 448.9 559.3
o/w Education & training 127.5 238.9 235.4 320.4 384.4Public health 68.8 70.7 80.4 105.9 133.5
Others 33.4 20.8 7.8 84.2Capital expenditure 1,198.6 1,526.4 1,231.5 2,871.2 4,570.9
Economic development 508.5 815.9 539.6 1,170.2 1,855.8o/w Natural resources (water) 123.2 147.7 81.9 277.5 263.2
Road construction 160.3 623.0 429.5 840.8 1,379.8Social development 594.4 666.9 575.3 1,651.9 2,099.3
o/w Education 25.2 96.0 26.0 17.9 37.2Health 0.7 14.9 0.9 5.1 39.6Urban dev't & housing 564.0 551.0 545.7 1,626.0 2,019.4Social welfare 2.2 4.1 0.0 2.3 0.0
General development 95.6 43.6 116.5 49.0 615.8Source: Ministry of Finance and Economic Development
5.2 Expenditure Outturn
The deviation between actual and budgeted expenditure at city level is generally high.
Although, the expenditure deviation in both recurrent and capital outlays is high, the deviation
is more pronounced in capital outlays. Low implementation capacity and budget constraint are
acknowledged as factors for the high expenditure deviation in the city. According to Addis
Ababa BoFED, luck of implementation capacity in different bureaus especially to execute
capital projects is the major factor. Most of the city’s implementing bureaus at different levels
of administration however site budget constraint as the major cause for the low expenditure
out-turn. Although expenditure deviation at city level is still high, the deviation has been
decreasing in recent years.
Table 3.3 Expenditure outturn compared to original budget at city level
2004/05 2005/06 2006/07 2007/08 2008/09Total Expenditure 50% 62% 41% 61% 70%
Current 79% 87% 63% 73% 60%
capital 41% 54% 33% 57% 75%Source: Addis Ababa Bureau of Finance & Economic Development
15
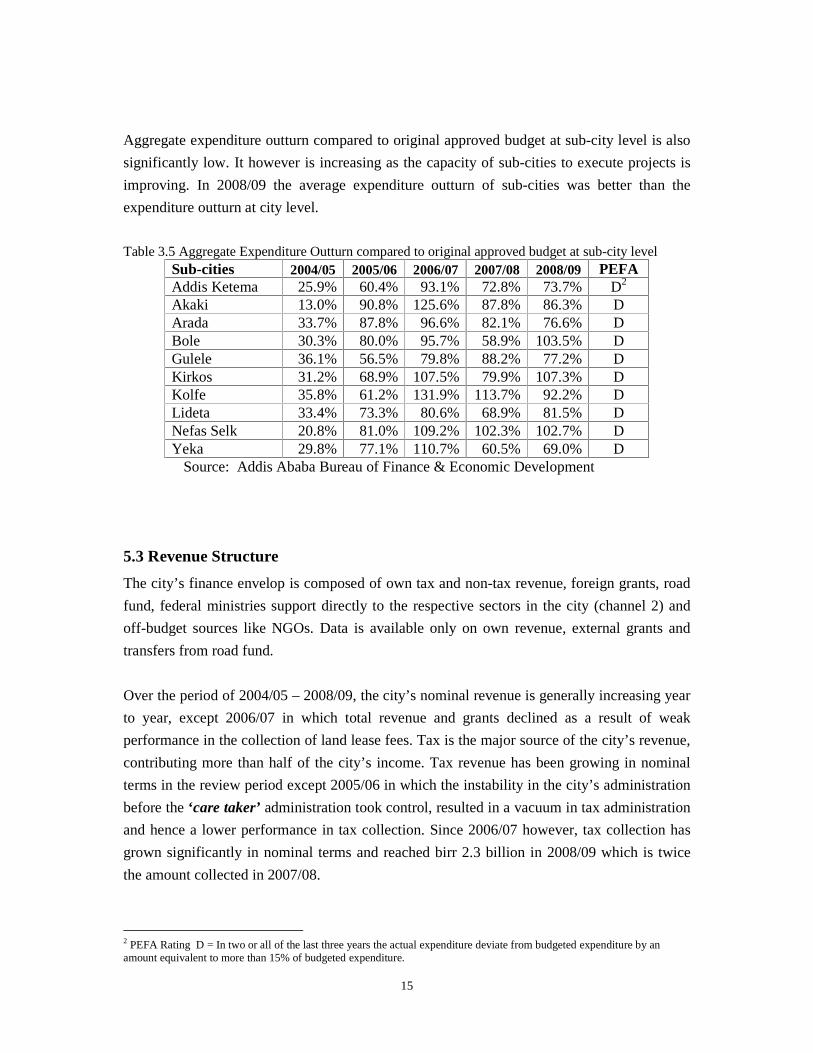
Aggregate expenditure outturn compared to original approved budget at sub-city level is also
significantly low. It however is increasing as the capacity of sub-cities to execute projects is
improving. In 2008/09 the average expenditure outturn of sub-cities was better than the
expenditure outturn at city level.
Table 3.5 Aggregate Expenditure Outturn compared to original approved budget at sub-city level Sub-cities 2004/05 2005/06 2006/07 2007/08 2008/09 PEFA Addis Ketema 25.9% 60.4% 93.1% 72.8% 73.7% D2
Akaki 13.0% 90.8% 125.6% 87.8% 86.3% DArada 33.7% 87.8% 96.6% 82.1% 76.6% DBole 30.3% 80.0% 95.7% 58.9% 103.5% DGulele 36.1% 56.5% 79.8% 88.2% 77.2% DKirkos 31.2% 68.9% 107.5% 79.9% 107.3% DKolfe 35.8% 61.2% 131.9% 113.7% 92.2% DLideta 33.4% 73.3% 80.6% 68.9% 81.5% DNefas Selk 20.8% 81.0% 109.2% 102.3% 102.7% DYeka 29.8% 77.1% 110.7% 60.5% 69.0% D
Source: Addis Ababa Bureau of Finance & Economic Development
5.3 Revenue Structure
The city’s finance envelop is composed of own tax and non-tax revenue, foreign grants, road
fund, federal ministries support directly to the respective sectors in the city (channel 2) and
off-budget sources like NGOs. Data is available only on own revenue, external grants and
transfers from road fund.
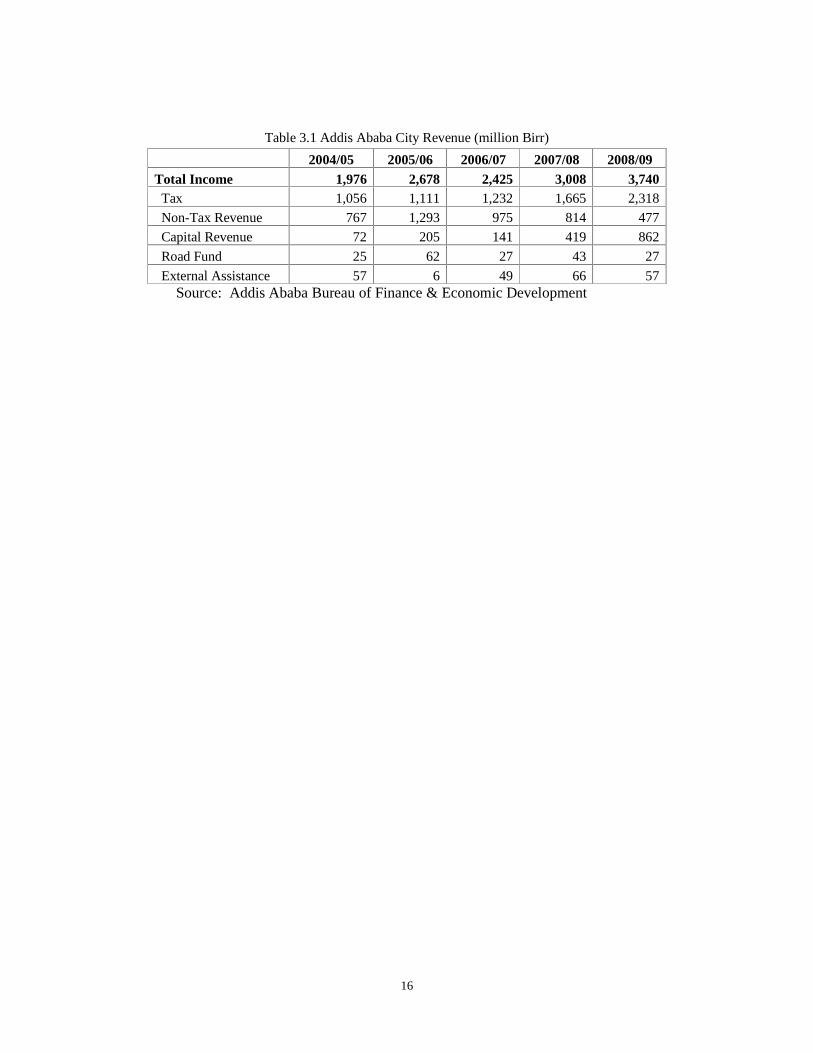
Over the period of 2004/05 – 2008/09, the city’s nominal revenue is generally increasing year
to year, except 2006/07 in which total revenue and grants declined as a result of weak
performance in the collection of land lease fees. Tax is the major source of the city’s revenue,
contributing more than half of the city’s income. Tax revenue has been growing in nominal
terms in the review period except 2005/06 in which the instability in the city’s administration
before the ‘care taker’ administration took control, resulted in a vacuum in tax administration
and hence a lower performance in tax collection. Since 2006/07 however, tax collection has
grown significantly in nominal terms and reached birr 2.3 billion in 2008/09 which is twice
the amount collected in 2007/08.
2 PEFA Rating D = In two or all of the last three years the actual expenditure deviate from budgeted expenditure by an amount equivalent to more than 15% of budgeted expenditure.
16
Table 3.1 Addis Ababa City Revenue (million Birr)
2004/05 2005/06 2006/07 2007/08 2008/09 Total Income 1,976 2,678 2,425 3,008 3,740 Tax 1,056 1,111 1,232 1,665 2,318
Non-Tax Revenue 767 1,293 975 814 477
Capital Revenue 72 205 141 419 862
Road Fund 25 62 27 43 27
External Assistance 57 6 49 66 57 Source: Addis Ababa Bureau of Finance & Economic Development
17
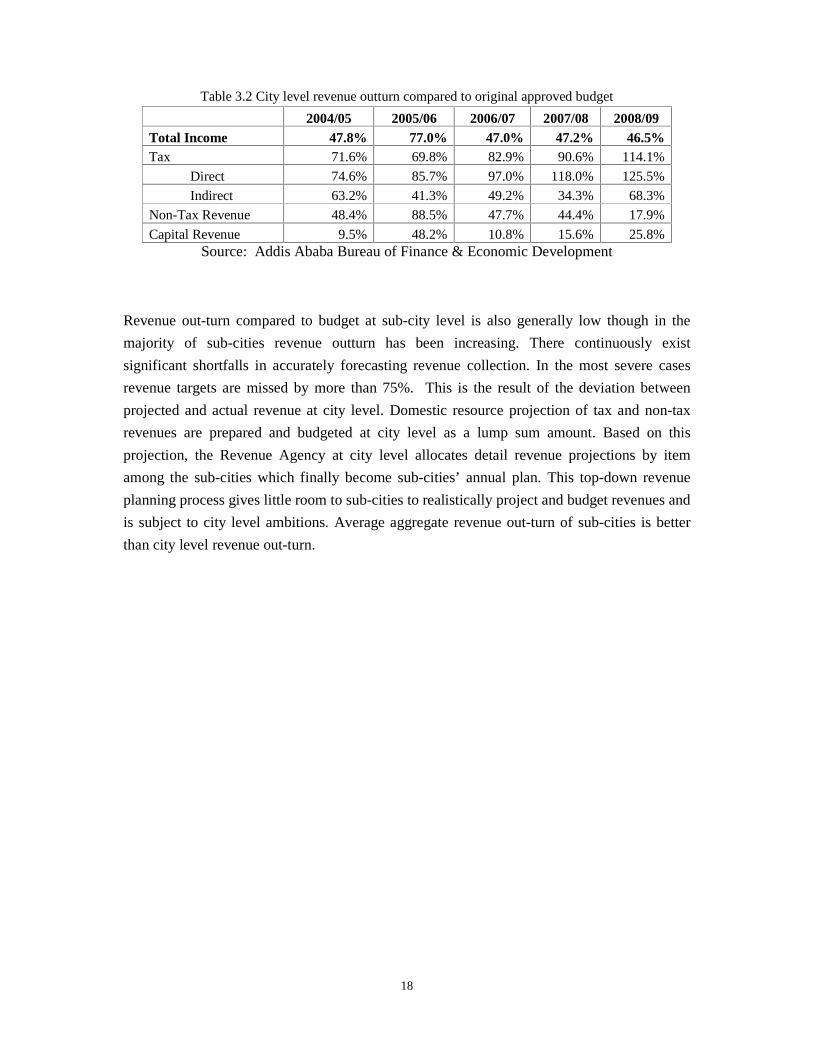
5.4 Revenue Outturn
Despite increasing revenue in nominal terms, revenue outturn to budget in the city remains
volatile and generally low. Aggregate city level budgeted revenue outturns between 2004/05
and 2008/09 are constantly below 50% (except for 2005/06 which was 77%). This shows poor
planning capacity in revenue projection on one hand and weak implementation capacity in
resource mobilization on the other.
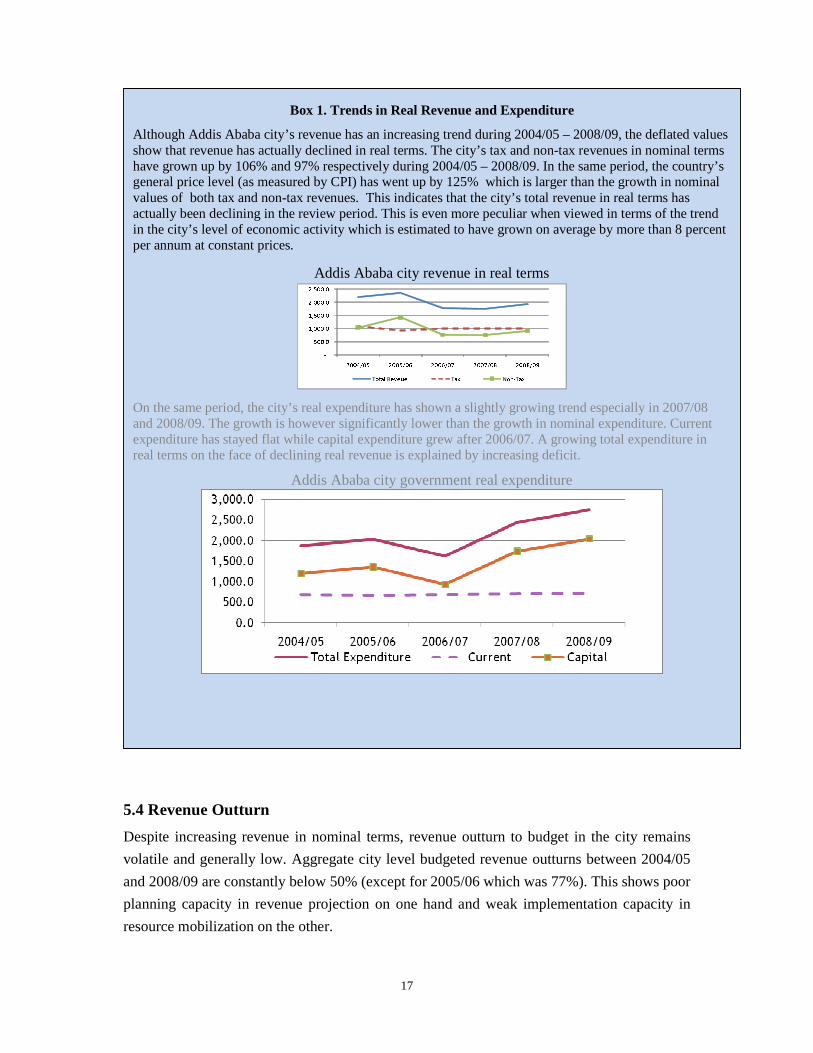
Box 1. Trends in Real Revenue and Expenditure
Although Addis Ababa city’s revenue has an increasing trend during 2004/05 – 2008/09, the deflated values show that revenue has actually declined in real terms. The city’s tax and non-tax revenues in nominal terms have grown up by 106% and 97% respectively during 2004/05 – 2008/09. In the same period, the country’s general price level (as measured by CPI) has went up by 125% which is larger than the growth in nominal values of both tax and non-tax revenues. This indicates that the city’s total revenue in real terms has actually been declining in the review period. This is even more peculiar when viewed in terms of the trend in the city’s level of economic activity which is estimated to have grown on average by more than 8 percent per annum at constant prices.
Addis Ababa city revenue in real terms
T R T N T
On the same period, the city’s real expenditure has shown a slightly growing trend especially in 2007/08 and 2008/09. The growth is however significantly lower than the growth in nominal expenditure. Current expenditure has stayed flat while capital expenditure grew after 2006/07. A growing total expenditure in real terms on the face of declining real revenue is explained by increasing deficit.
Addis Ababa city government real expenditure
18
Table 3.2 City level revenue outturn compared to original approved budget
2004/05 2005/06 2006/07 2007/08 2008/09 Total Income 47.8% 77.0% 47.0% 47.2% 46.5%Tax 71.6% 69.8% 82.9% 90.6% 114.1%
Direct 74.6% 85.7% 97.0% 118.0% 125.5%
Indirect 63.2% 41.3% 49.2% 34.3% 68.3%
Non-Tax Revenue 48.4% 88.5% 47.7% 44.4% 17.9%
Capital Revenue 9.5% 48.2% 10.8% 15.6% 25.8%Source: Addis Ababa Bureau of Finance & Economic Development
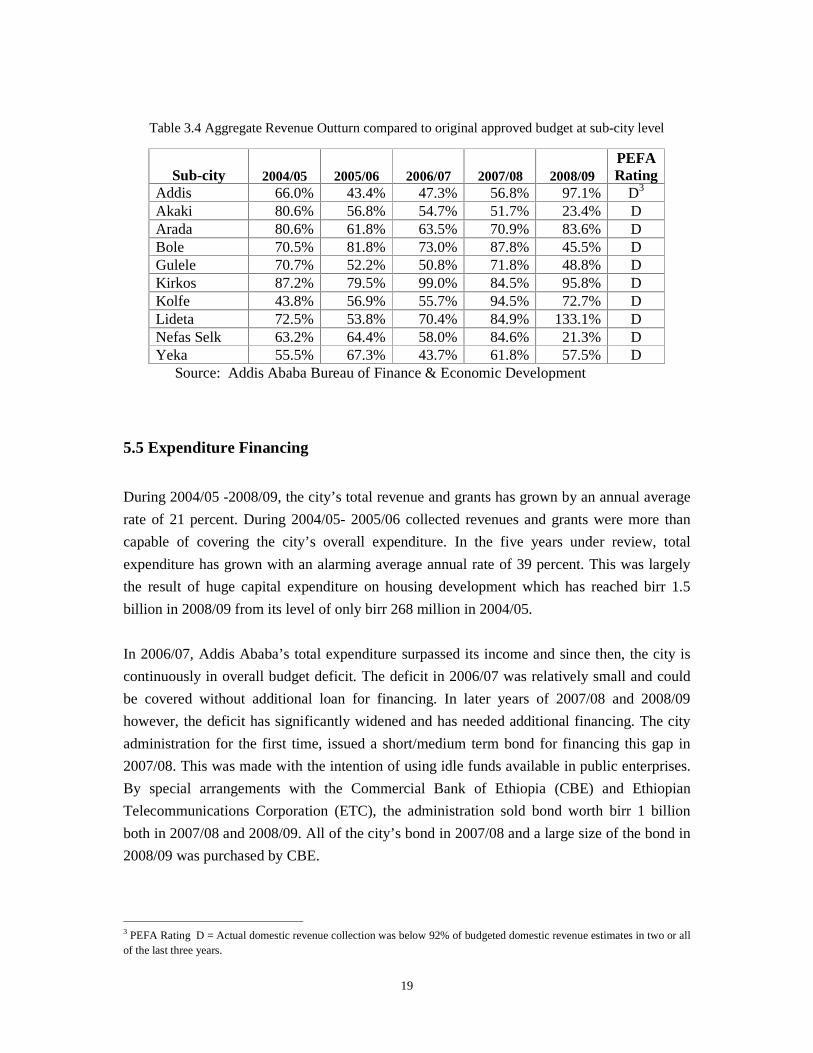
Revenue out-turn compared to budget at sub-city level is also generally low though in the
majority of sub-cities revenue outturn has been increasing. There continuously exist
significant shortfalls in accurately forecasting revenue collection. In the most severe cases
revenue targets are missed by more than 75%. This is the result of the deviation between
projected and actual revenue at city level. Domestic resource projection of tax and non-tax
revenues are prepared and budgeted at city level as a lump sum amount. Based on this
projection, the Revenue Agency at city level allocates detail revenue projections by item
among the sub-cities which finally become sub-cities’ annual plan. This top-down revenue
planning process gives little room to sub-cities to realistically project and budget revenues and
is subject to city level ambitions. Average aggregate revenue out-turn of sub-cities is better
than city level revenue out-turn.
19
Table 3.4 Aggregate Revenue Outturn compared to original approved budget at sub-city level
Source: Addis Ababa Bureau of Finance & Economic Development
5.5 Expenditure Financing
During 2004/05 -2008/09, the city’s total revenue and grants has grown by an annual average
rate of 21 percent. During 2004/05- 2005/06 collected revenues and grants were more than
capable of covering the city’s overall expenditure. In the five years under review, total
expenditure has grown with an alarming average annual rate of 39 percent. This was largely
the result of huge capital expenditure on housing development which has reached birr 1.5
billion in 2008/09 from its level of only birr 268 million in 2004/05.
In 2006/07, Addis Ababa’s total expenditure surpassed its income and since then, the city is
continuously in overall budget deficit. The deficit in 2006/07 was relatively small and could
be covered without additional loan for financing. In later years of 2007/08 and 2008/09
however, the deficit has significantly widened and has needed additional financing. The city
administration for the first time, issued a short/medium term bond for financing this gap in
2007/08. This was made with the intention of using idle funds available in public enterprises.
By special arrangements with the Commercial Bank of Ethiopia (CBE) and Ethiopian
Telecommunications Corporation (ETC), the administration sold bond worth birr 1 billion
both in 2007/08 and 2008/09. All of the city’s bond in 2007/08 and a large size of the bond in
2008/09 was purchased by CBE.
3 PEFA Rating D = Actual domestic revenue collection was below 92% of budgeted domestic revenue estimates in two or all of the last three years.
Sub-city 2004/05 2005/06 2006/07 2007/08 2008/09 PEFA Rating
Addis 66.0% 43.4% 47.3% 56.8% 97.1% D3
Akaki 80.6% 56.8% 54.7% 51.7% 23.4% DArada 80.6% 61.8% 63.5% 70.9% 83.6% DBole 70.5% 81.8% 73.0% 87.8% 45.5% DGulele 70.7% 52.2% 50.8% 71.8% 48.8% DKirkos 87.2% 79.5% 99.0% 84.5% 95.8% DKolfe 43.8% 56.9% 55.7% 94.5% 72.7% DLideta 72.5% 53.8% 70.4% 84.9% 133.1% DNefas Selk 63.2% 64.4% 58.0% 84.6% 21.3% DYeka 55.5% 67.3% 43.7% 61.8% 57.5% D
20
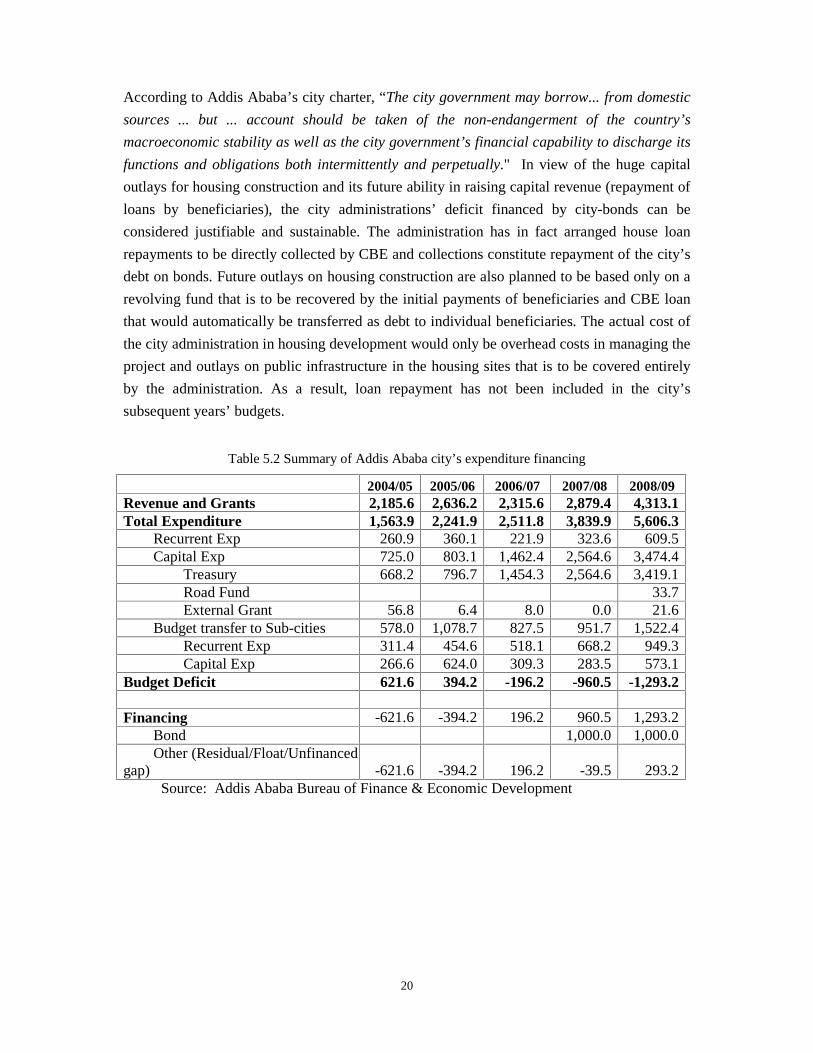
According to Addis Ababa’s city charter, “The city government may borrow... from domestic
sources ... but ... account should be taken of the non-endangerment of the country’s
macroeconomic stability as well as the city government’s financial capability to discharge its
functions and obligations both intermittently and perpetually." In view of the huge capital
outlays for housing construction and its future ability in raising capital revenue (repayment of
loans by beneficiaries), the city administrations’ deficit financed by city-bonds can be
considered justifiable and sustainable. The administration has in fact arranged house loan
repayments to be directly collected by CBE and collections constitute repayment of the city’s
debt on bonds. Future outlays on housing construction are also planned to be based only on a
revolving fund that is to be recovered by the initial payments of beneficiaries and CBE loan
that would automatically be transferred as debt to individual beneficiaries. The actual cost of
the city administration in housing development would only be overhead costs in managing the
project and outlays on public infrastructure in the housing sites that is to be covered entirely
by the administration. As a result, loan repayment has not been included in the city’s
subsequent years’ budgets.
Table 5.2 Summary of Addis Ababa city’s expenditure financing
2004/05 2005/06 2006/07 2007/08 2008/09 Revenue and Grants 2,185.6 2,636.2 2,315.6 2,879.4 4,313.1Total Expenditure 1,563.9 2,241.9 2,511.8 3,839.9 5,606.3
Recurrent Exp 260.9 360.1 221.9 323.6 609.5Capital Exp 725.0 803.1 1,462.4 2,564.6 3,474.4
Treasury 668.2 796.7 1,454.3 2,564.6 3,419.1Road Fund 33.7External Grant 56.8 6.4 8.0 0.0 21.6
Budget transfer to Sub-cities 578.0 1,078.7 827.5 951.7 1,522.4Recurrent Exp 311.4 454.6 518.1 668.2 949.3Capital Exp 266.6 624.0 309.3 283.5 573.1
Budget Deficit 621.6 394.2 -196.2 -960.5 -1,293.2
Financing -621.6 -394.2 196.2 960.5 1,293.2Bond 1,000.0 1,000.0Other (Residual/Float/Unfinanced
gap) -621.6 -394.2 196.2 -39.5 293.2Source: Addis Ababa Bureau of Finance & Economic Development
21
VI. Institutional context of Decentralization and Service Delivery Outcomes in Selected Sectors
6.1. EDUCATION SECTOR:
Since 2005, budget decentralisation is practised in the education sector. Schools are organised
as cost centres and each has its own annual and 3-year budget as well as a strategic plan.
Budgets are then compiled by the sub-city bureaus and included in the sub-city budget. Based
on their budgets, sub-cities request money from BoFED.
Recurrent costs are covered by the government whereas capital costs are covered by
government and donor funding. There are three levels of expenditure management: the
Education Bureau is responsible for managing technical and vocational schools and teachers
training colleges. Elementary and high-schools are managed by sub-cities. The Education
Bureau transfers funds to the sub-cities which then transfer funds directly to the schools
(Channel 1A and 1B). Kebeles do not receive any funds. Donor funds (such as UNICEF, WB,
and AfDB) are administrated by the federal government through MoFED and MoE and
transferred directly to the sector office (Channel 2). The education budget is allocated to sub-
cities based on unit cost approach.
6.1.1 Education sector budget formula /unit cost approach
For the allocation of recurrent budget to sub-cities, two recent consecutive years’ average
expenditure on education by all sub-cities is used. The unit cost for each sub-city is derived
by dividing each sub-city’s education expenditure by the number of students. The unit cost
and the number of students expected to be enrolled are then used to determine sub-cities’
recurrent expenditure on education by the following formula.
RB = [ (ES/N) + (EO/N) ] * S
Where:
RB = Total recurrent budget for the coming budget year;
S = Number of students expected to be enrolled in the coming budget year;
ES = Average expenditure on salary in two recent consecutive years;
N = Average number of students in two recent consecutive years;
EO = Average operating expenditure in two recent consecutive years;
Capital budget for education to sub-cities is allocated based on specific grant. In specific grant
budget allocation, sub-cities’ capital budget is determined by detailed discussion among
22
BOFED and respective city level and sub-city level bureaus/offices. The discussion is made to
evaluate ongoing and proposed projects and to determine priorities. Construction of new
schools constitutes the greater part the capital budget in education and its allocation is
determined by a population-based needs assessment survey and student population numbers
that is undertaken by the Education Bureau together with the sub-cities. Sub-cities’ capital
budgets on education are then determined by consensus on the objective of narrowing down
the gap in basic service delivery among sub-cities.
6.1.2 Service Delivery in Education
The service provision in education sector in Addis Ababa have a mixed result when viewed
from enrolment and quality indicators. Enrolment in both primary and secondary education
has remained more or less the same during 2004/05-2008/09. Student–teacher ratios on the
other hand have significantly improved in both primary and secondary schools. It may be
partly unsuitable to evaluate the city’s service delivery results based on such indicators of
access and quality as there are a number of non-government schools in the city. For example,
the number of non-government primary schools in 2008/09 was three times more than the
number of government schools. The enrolment rates of Addis Ababa on the other hand
represent students in both schools. The city has been supporting non-government schools
particularly public schools in different ways including in the provision of training of teachers
as well as capital subsidies to public schools for the construction of classrooms. The results
represented by the general access and quality indicators however cannot be clearly attributed
to the city’s service delivery outcomes.
Although the city administration’s contribution to the overall education level can fairly be
recognized, the explicit results on education service provision to the community should only
be viewed from government schools whose number has generally increased during 2004/05 -
2008/09. By the capital outlays on education, the city administration has been able to increase
the number of government schools of different levels. This is particularly true for government
high-schools whose number has more than doubled to reach 44 in 2008/09 from its level of
only 21 schools in 2004/05. The number of primary and junior schools has also increased
significantly in this period growing on an annual rate of 8 percent. On the other hand, there is
little progress in government provided kindergartens in the city. Pre-school child development
service is almost fully provided by the private sector.
23
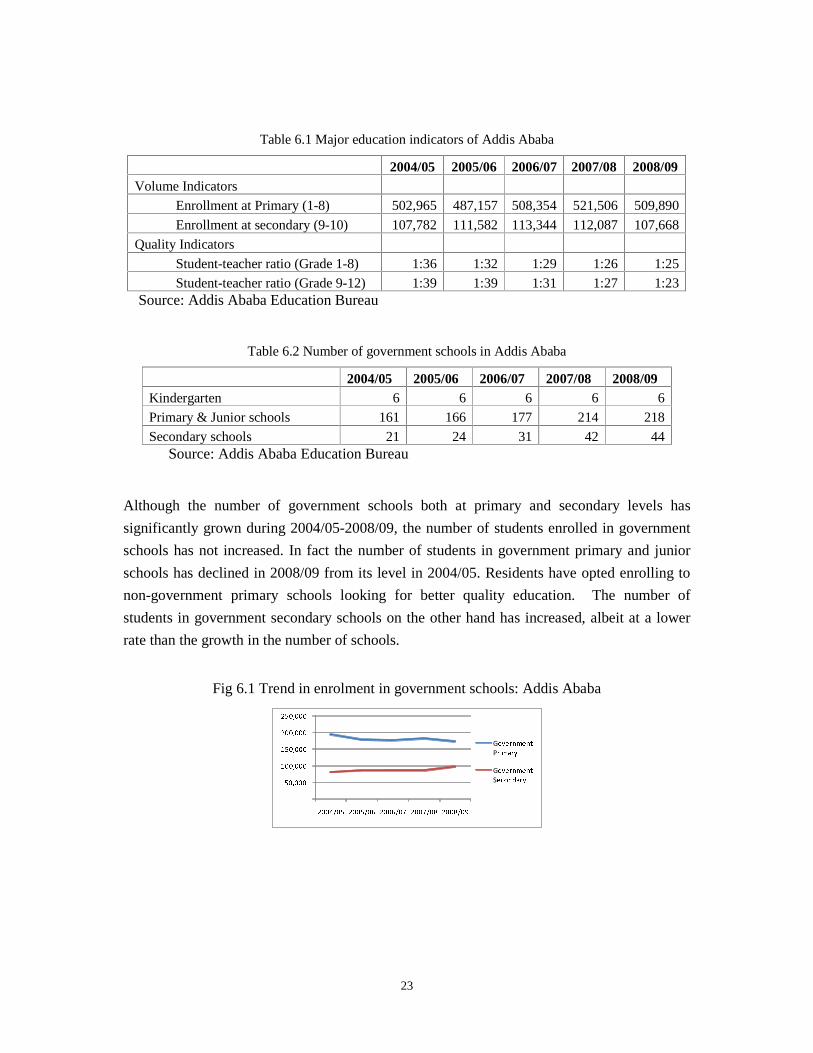
Table 6.1 Major education indicators of Addis Ababa
2004/05 2005/06 2006/072007/08 2008/09 Volume Indicators
Enrollment at Primary (1-8) 502,965 487,157 508,354 521,506 509,890
Enrollment at secondary (9-10) 107,782 111,582 113,344 112,087 107,668
Quality Indicators
Student-teacher ratio (Grade 1-8) 1:36 1:32 1:29 1:26 1:25
Student-teacher ratio (Grade 9-12) 1:39 1:39 1:31 1:27 1:23Source: Addis Ababa Education Bureau
Table 6.2 Number of government schools in Addis Ababa
2004/05 2005/06 2006/07 2007/08 2008/09 Kindergarten 6 6 6 6 6
Primary & Junior schools 161 166 177 214 218
Secondary schools 21 24 31 42 44Source: Addis Ababa Education Bureau
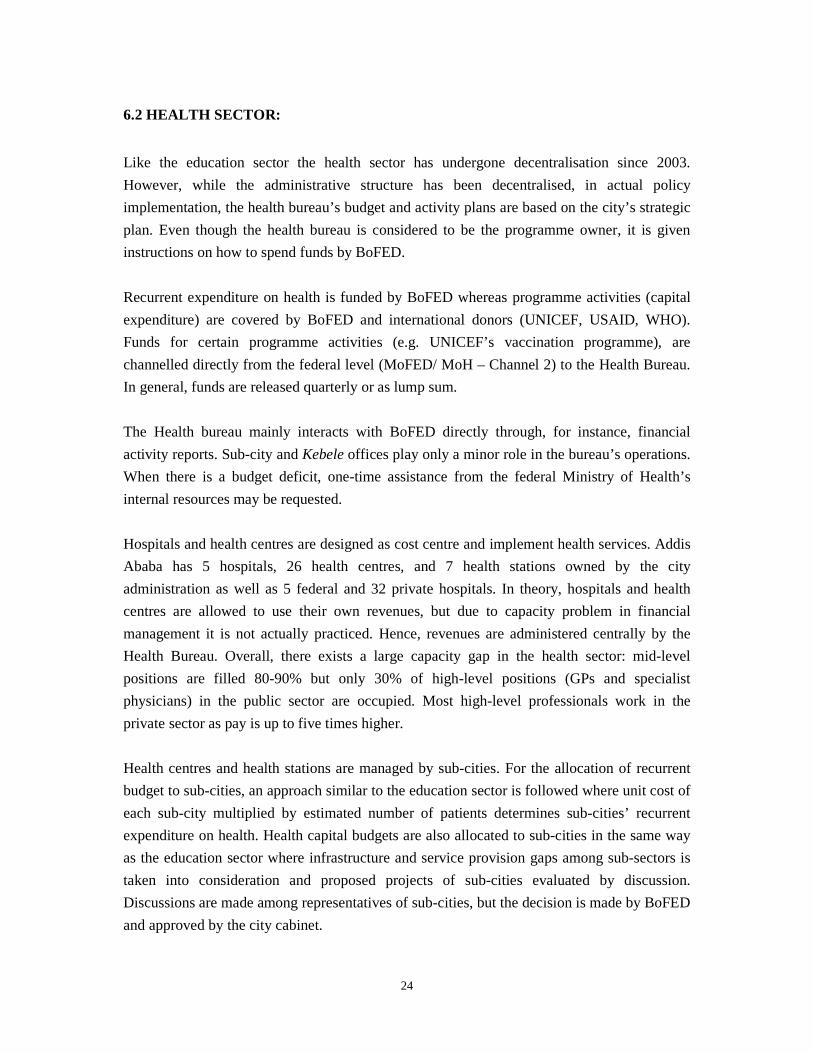
Although the number of government schools both at primary and secondary levels has
significantly grown during 2004/05-2008/09, the number of students enrolled in government
schools has not increased. In fact the number of students in government primary and junior
schools has declined in 2008/09 from its level in 2004/05. Residents have opted enrolling to
non-government primary schools looking for better quality education. The number of
students in government secondary schools on the other hand has increased, albeit at a lower
rate than the growth in the number of schools.
Fig 6.1 Trend in enrolment in government schools: Addis Ababa
G P
G S
24
6.2 HEALTH SECTOR:
Like the education sector the health sector has undergone decentralisation since 2003.
However, while the administrative structure has been decentralised, in actual policy
implementation, the health bureau’s budget and activity plans are based on the city’s strategic
plan. Even though the health bureau is considered to be the programme owner, it is given
instructions on how to spend funds by BoFED.
Recurrent expenditure on health is funded by BoFED whereas programme activities (capital
expenditure) are covered by BoFED and international donors (UNICEF, USAID, WHO).
Funds for certain programme activities (e.g. UNICEF’s vaccination programme), are
channelled directly from the federal level (MoFED/ MoH – Channel 2) to the Health Bureau.
In general, funds are released quarterly or as lump sum.
The Health bureau mainly interacts with BoFED directly through, for instance, financial
activity reports. Sub-city and Kebele offices play only a minor role in the bureau’s operations.
When there is a budget deficit, one-time assistance from the federal Ministry of Health’s
internal resources may be requested.
Hospitals and health centres are designed as cost centre and implement health services. Addis
Ababa has 5 hospitals, 26 health centres, and 7 health stations owned by the city
administration as well as 5 federal and 32 private hospitals. In theory, hospitals and health
centres are allowed to use their own revenues, but due to capacity problem in financial
management it is not actually practiced. Hence, revenues are administered centrally by the
Health Bureau. Overall, there exists a large capacity gap in the health sector: mid-level
positions are filled 80-90% but only 30% of high-level positions (GPs and specialist
physicians) in the public sector are occupied. Most high-level professionals work in the
private sector as pay is up to five times higher.
Health centres and health stations are managed by sub-cities. For the allocation of recurrent
budget to sub-cities, an approach similar to the education sector is followed where unit cost of
each sub-city multiplied by estimated number of patients determines sub-cities’ recurrent
expenditure on health. Health capital budgets are also allocated to sub-cities in the same way
as the education sector where infrastructure and service provision gaps among sub-sectors is
taken into consideration and proposed projects of sub-cities evaluated by discussion.
Discussions are made among representatives of sub-cities, but the decision is made by BoFED
and approved by the city cabinet.
25
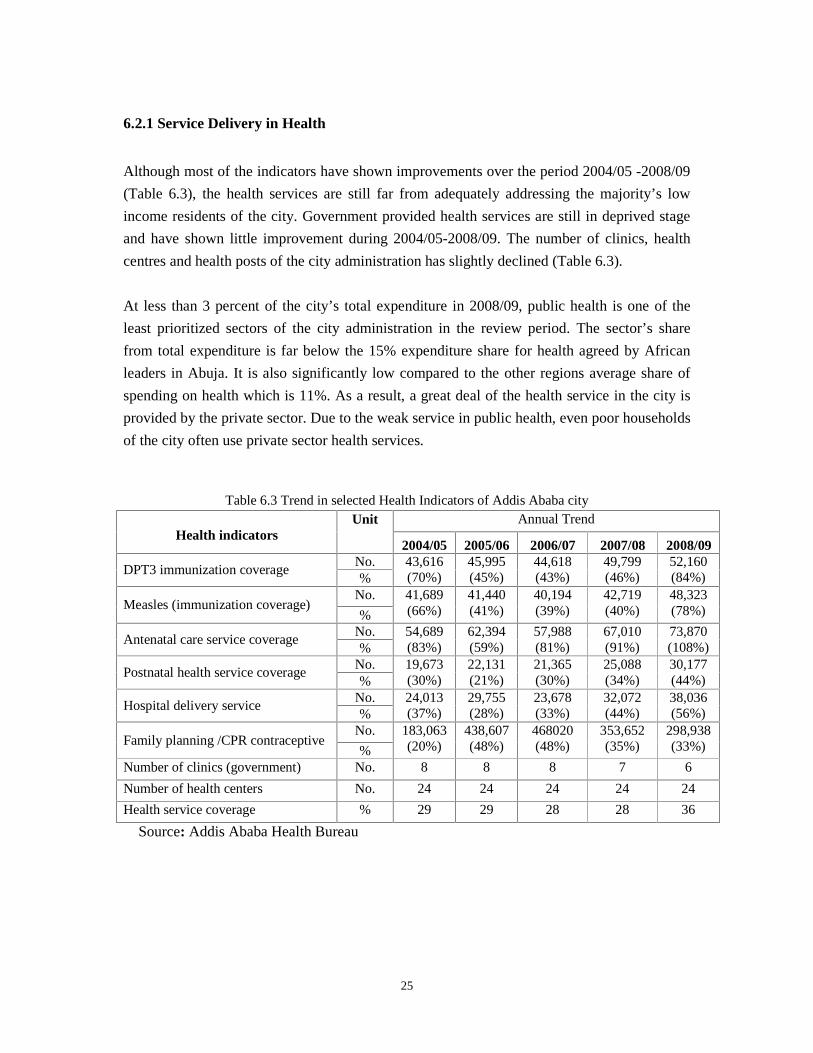
6.2.1 Service Delivery in Health
Although most of the indicators have shown improvements over the period 2004/05 -2008/09
(Table 6.3), the health services are still far from adequately addressing the majority’s low
income residents of the city. Government provided health services are still in deprived stage
and have shown little improvement during 2004/05-2008/09. The number of clinics, health
centres and health posts of the city administration has slightly declined (Table 6.3).
At less than 3 percent of the city’s total expenditure in 2008/09, public health is one of the
least prioritized sectors of the city administration in the review period. The sector’s share
from total expenditure is far below the 15% expenditure share for health agreed by African
leaders in Abuja. It is also significantly low compared to the other regions average share of
spending on health which is 11%. As a result, a great deal of the health service in the city is
provided by the private sector. Due to the weak service in public health, even poor households
of the city often use private sector health services.
Table 6.3 Trend in selected Health Indicators of Addis Ababa city Annual Trend
Health indicators Unit
2004/05 2005/06 2006/07 2007/08 2008/09 No.
DPT3 immunization coverage %
43,616 (70%)
45,995 (45%)
44,618 (43%)
49,799 (46%)
52,160 (84%)
No. Measles (immunization coverage)
%
41,689 (66%)
41,440 (41%)
40,194 (39%)
42,719 (40%)
48,323 (78%)
No. Antenatal care service coverage
%54,689 (83%)
62,394 (59%)
57,988 (81%)
67,010 (91%)
73,870 (108%)
No. Postnatal health service coverage
%19,673 (30%)
22,131 (21%)
21,365 (30%)
25,088 (34%)
30,177 (44%)
No. Hospital delivery service
%24,013 (37%)
29,755 (28%)
23,678 (33%)
32,072 (44%)
38,036 (56%)
No. Family planning /CPR contraceptive
%
183,063 (20%)
438,607 (48%)
468020 (48%)
353,652 (35%)
298,938 (33%)
Number of clinics (government) No. 8 8 8 7 6
Number of health centers No. 24 24 24 24 24
Health service coverage % 29 29 28 28 36
Source: Addis Ababa Health Bureau
26
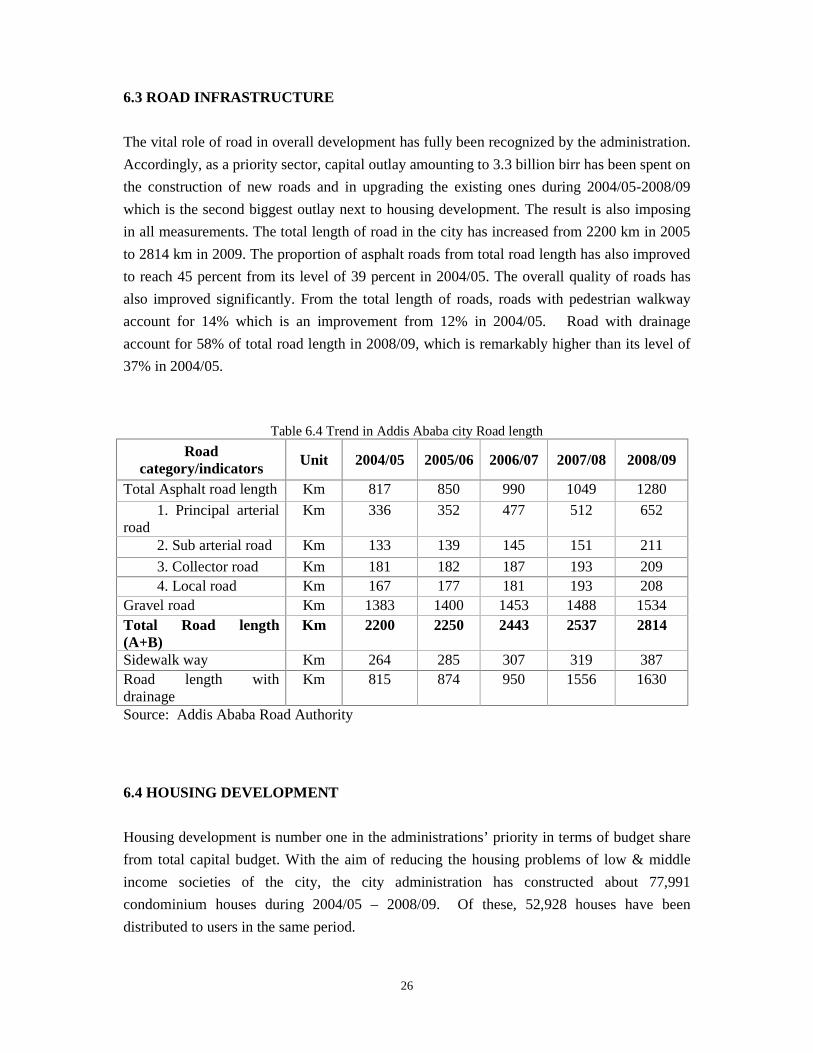
6.3 ROAD INFRASTRUCTURE
The vital role of road in overall development has fully been recognized by the administration.
Accordingly, as a priority sector, capital outlay amounting to 3.3 billion birr has been spent on
the construction of new roads and in upgrading the existing ones during 2004/05-2008/09
which is the second biggest outlay next to housing development. The result is also imposing
in all measurements. The total length of road in the city has increased from 2200 km in 2005
to 2814 km in 2009. The proportion of asphalt roads from total road length has also improved
to reach 45 percent from its level of 39 percent in 2004/05. The overall quality of roads has
also improved significantly. From the total length of roads, roads with pedestrian walkway
account for 14% which is an improvement from 12% in 2004/05. Road with drainage
account for 58% of total road length in 2008/09, which is remarkably higher than its level of
37% in 2004/05.
Table 6.4 Trend in Addis Ababa city Road length
Road category/indicators Unit 2004/05 2005/06 2006/07 2007/08 2008/09
Total Asphalt road length Km 817 850 990 1049 1280
1. Principal arterial road
Km 336 352 477 512 652
2. Sub arterial road Km 133 139 145 151 211
3. Collector road Km 181 182 187 193 209 4. Local road Km 167 177 181 193 208
Gravel road Km 1383 1400 1453 1488 1534 Total Road length (A+B)
Km 2200 2250 2443 2537 2814
Sidewalk way Km 264 285 307 319 387 Road length with drainage
Km 815 874 950 1556 1630
Source: Addis Ababa Road Authority
6.4 HOUSING DEVELOPMENT
Housing development is number one in the administrations’ priority in terms of budget share
from total capital budget. With the aim of reducing the housing problems of low & middle
income societies of the city, the city administration has constructed about 77,991
condominium houses during 2004/05 – 2008/09. Of these, 52,928 houses have been
distributed to users in the same period.
27
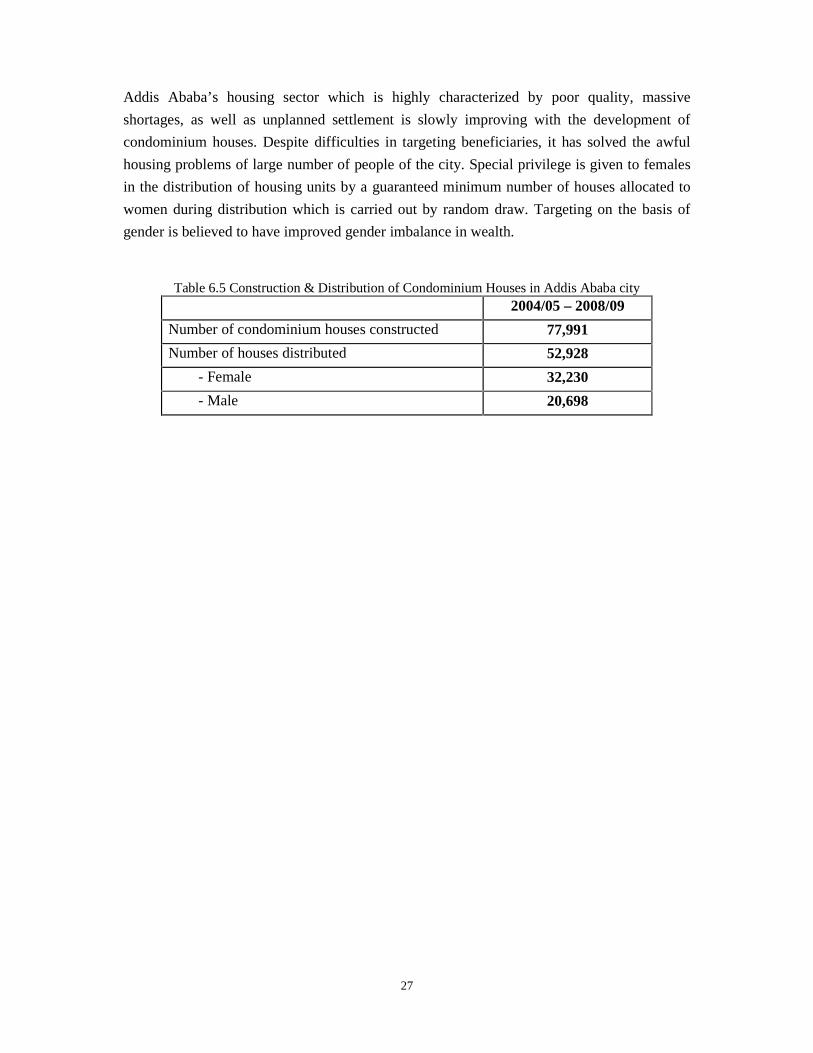
Addis Ababa’s housing sector which is highly characterized by poor quality, massive
shortages, as well as unplanned settlement is slowly improving with the development of
condominium houses. Despite difficulties in targeting beneficiaries, it has solved the awful
housing problems of large number of people of the city. Special privilege is given to females
in the distribution of housing units by a guaranteed minimum number of houses allocated to
women during distribution which is carried out by random draw. Targeting on the basis of
gender is believed to have improved gender imbalance in wealth.
Table 6.5 Construction & Distribution of Condominium Houses in Addis Ababa city 2004/05 – 2008/09
Number of condominium houses constructed 77,991
Number of houses distributed 52,928
- Female 32,230
- Male 20,698
28
VII. Findings and Challenges A number of findings and lessons have emerged from this study. First revenue collection in
real terms is not in line with the city’s trend in level of economic activity. There is little
knowledge on the city’s revenue potential and efforts to reform and improve tax collection are
lagging. Strengthening the revenue collection in the city should be given focus and priority.
In terms of spending priorities, a consistently more than 70% of the resources were spent on
road construction and housing development. The share of poverty sectors (excluding housing
development) has declined from 41% in 2003/04 to 29% in 2008/09. Targeting is not
exercised on pro-poor expenditures except in limited instances in the provision of health
service. Among the pro-poor sectors, priority in terms of spending was awfully low on public
health. The share of spending on public health was less than one third of other regions’
average. Such low spending in public health is the basis for weak public health service
delivery in the city which has shown little improvement in the five years since 2004/05.
There is a major capacity problem in the budget preparation at city level. This is especially
reflected by the inability to realistically project the city’s revenue which is usually subject to
the ambitions of BoFED officials and the cabinet. While the revenue potential of Addis Ababa
is undoubtedly high and could even be greater than the originally budgeted revenues of the
city administration for 2004/05- 2008/09, the objective conditions in the tax administration
and the actions that are necessary to be taken are usually missed in revenue budgeting. This
problem is clearly visible continuously in the city’s low revenue outturns compared to
original budgets in most of the revenue sources.
Low revenue outturns, on the other hand, are the grounds for the high expenditure deviation
from the budget. In the mid and late periods of a fiscal year, as the actual revenue out-turns
become apparent, it is a common practice in BoFED to select only limited projects that
dreadfully need to be implemented. With limited financial resources, disbursement requests of
budgeted ordinary projects, which are planned to start operation at later periods of the fiscal
year are usually turn down by BoFED. In the worst cases, even ongoing projects are
interrupted and transferred to the next budget year for implementation. This situation
frustrates project implementing bodies and has created confusion and uncertainty in the
planning and budgeting process at lower levels of the administration.
29
References:
Abdulkader Redwan (2010) Analysis of the Medium Term Expenditure Framework Application in Addis Ababa City Administration, M.A. thesis, Addis Ababa.
Abebe Alebachew and Getnet Alemu (2010) Public Finance Review: the Amhara
Regional Report, Addis Ababa.
BoFED (2009) Addis Ababa City Administration Medium Term Expenditure Framework from 2009/10 to 2011/12, Addis Ababa.
BoFED (2008) Addis Ababa City Administration: Gross Domestic Product Estimates,
Addis Ababa. BoFED (2008) Addis Ababa City Administration Strategic Planning Management from
2008/9 to 2012/13, Addis Ababa. BOFED (2009), Urban Development Indicators of Addis Ababa, Addis Ababa. CSA (2008) Population and Housing Census, Addis Ababa. Data from different sector bureaus of Addis Ababa city, 2010. Federal Negarit Gazeta (2003) The Addis Ababa City government Revised Charter
Proclamation (P. No. 361/2003), Addis Ababa. MOFED (2010) General Government Fiscal Data.
30
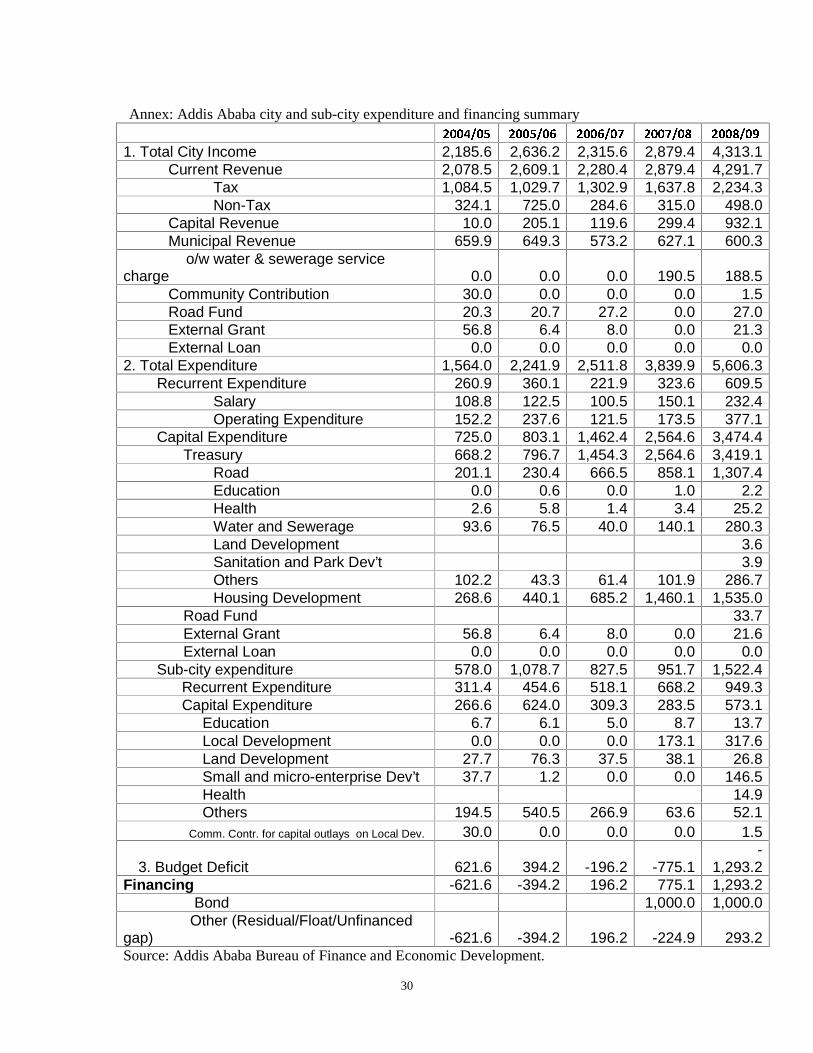
Annex: Addis Ababa city and sub-city expenditure and financing summary
1. Total City Income 2,185.6 2,636.2 2,315.6 2,879.4 4,313.1Current Revenue 2,078.5 2,609.1 2,280.4 2,879.4 4,291.7
Tax 1,084.5 1,029.7 1,302.9 1,637.8 2,234.3Non-Tax 324.1 725.0 284.6 315.0 498.0
Capital Revenue 10.0 205.1 119.6 299.4 932.1Municipal Revenue 659.9 649.3 573.2 627.1 600.3
o/w water & sewerage service charge 0.0 0.0 0.0 190.5 188.5
Community Contribution 30.0 0.0 0.0 0.0 1.5Road Fund 20.3 20.7 27.2 0.0 27.0External Grant 56.8 6.4 8.0 0.0 21.3External Loan 0.0 0.0 0.0 0.0 0.0
2. Total Expenditure 1,564.0 2,241.9 2,511.8 3,839.9 5,606.3Recurrent Expenditure 260.9 360.1 221.9 323.6 609.5
Salary 108.8 122.5 100.5 150.1 232.4Operating Expenditure 152.2 237.6 121.5 173.5 377.1
Capital Expenditure 725.0 803.1 1,462.4 2,564.6 3,474.4Treasury 668.2 796.7 1,454.3 2,564.6 3,419.1
Road 201.1 230.4 666.5 858.1 1,307.4Education 0.0 0.6 0.0 1.0 2.2Health 2.6 5.8 1.4 3.4 25.2Water and Sewerage 93.6 76.5 40.0 140.1 280.3Land Development 3.6Sanitation and Park Dev’t 3.9Others 102.2 43.3 61.4 101.9 286.7Housing Development 268.6 440.1 685.2 1,460.1 1,535.0
Road Fund 33.7External Grant 56.8 6.4 8.0 0.0 21.6External Loan 0.0 0.0 0.0 0.0 0.0
Sub-city expenditure 578.0 1,078.7 827.5 951.7 1,522.4Recurrent Expenditure 311.4 454.6 518.1 668.2 949.3Capital Expenditure 266.6 624.0 309.3 283.5 573.1
Education 6.7 6.1 5.0 8.7 13.7Local Development 0.0 0.0 0.0 173.1 317.6Land Development 27.7 76.3 37.5 38.1 26.8Small and micro-enterprise Dev’t 37.7 1.2 0.0 0.0 146.5Health 14.9Others 194.5 540.5 266.9 63.6 52.1
Comm. Contr. for capital outlays on Local Dev. 30.0 0.0 0.0 0.0 1.5
3. Budget Deficit 621.6 394.2 -196.2 -775.1-
1,293.2Financing -621.6 -394.2 196.2 775.1 1,293.2
Bond 1,000.0 1,000.0Other (Residual/Float/Unfinanced
gap) -621.6 -394.2 196.2 -224.9 293.2Source: Addis Ababa Bureau of Finance and Economic Development.
31
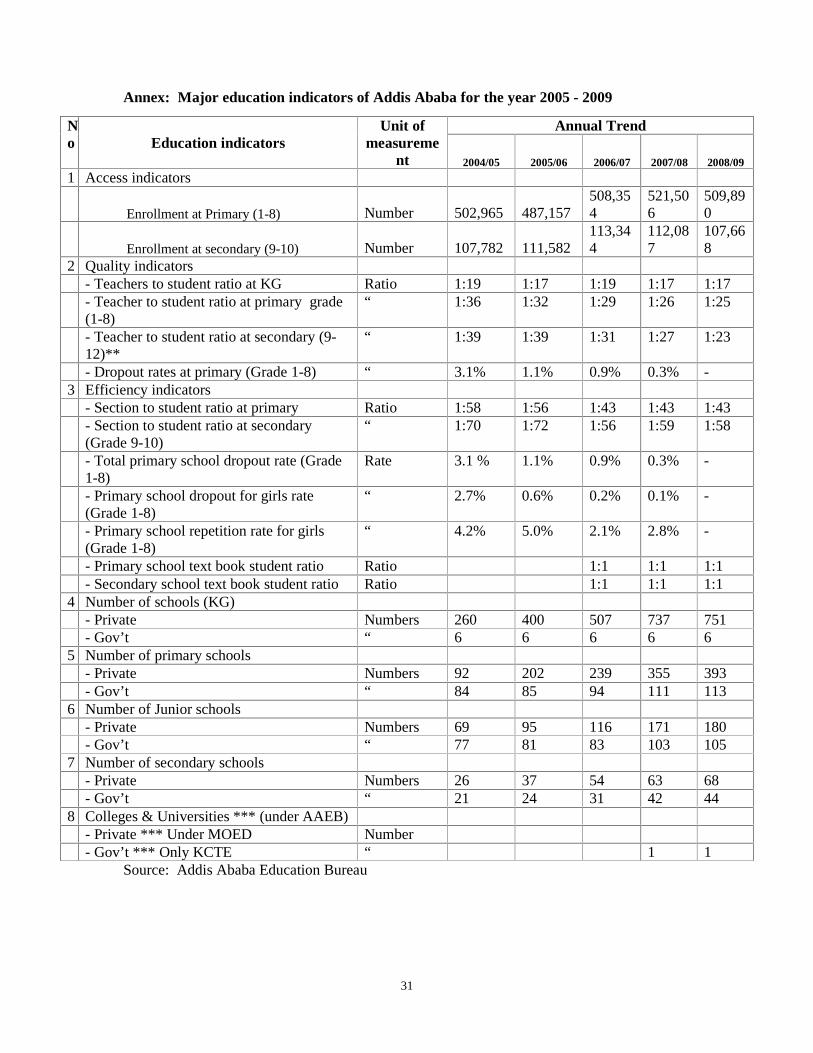
Annex: Major education indicators of Addis Ababa for the year 2005 - 2009
Source: Addis Ababa Education Bureau
Annual Trend No Education indicators
Unit of measureme
nt 2004/05 2005/06 2006/07 2007/08 2008/09
1 Access indicators
Enrollment at Primary (1-8) Number 502,965 487,157 508,354
521,506
509,890
Enrollment at secondary (9-10) Number 107,782 111,582 113,344
112,087
107,668
2 Quality indicators - Teachers to student ratio at KG Ratio 1:19 1:17 1:19 1:17 1:17 - Teacher to student ratio at primary grade (1-8)
“ 1:36 1:32 1:29 1:26 1:25
- Teacher to student ratio at secondary (9-12)**
“ 1:39 1:39 1:31 1:27 1:23
- Dropout rates at primary (Grade 1-8) “ 3.1% 1.1% 0.9% 0.3% - 3 Efficiency indicators
- Section to student ratio at primary Ratio 1:58 1:56 1:43 1:43 1:43 - Section to student ratio at secondary (Grade 9-10)
“ 1:70 1:72 1:56 1:59 1:58
- Total primary school dropout rate (Grade 1-8)
Rate 3.1 % 1.1% 0.9% 0.3% -
- Primary school dropout for girls rate (Grade 1-8)
“ 2.7% 0.6% 0.2% 0.1% -
- Primary school repetition rate for girls (Grade 1-8)
“ 4.2% 5.0% 2.1% 2.8% -
- Primary school text book student ratio Ratio 1:1 1:1 1:1 - Secondary school text book student ratio Ratio 1:1 1:1 1:1
4 Number of schools (KG) - Private Numbers 260 400 507 737 751 - Gov’t “ 6 6 6 6 6
5 Number of primary schools - Private Numbers 92 202 239 355 393 - Gov’t “ 84 85 94 111 113
6 Number of Junior schools - Private Numbers 69 95 116 171 180 - Gov’t “ 77 81 83 103 105
7 Number of secondary schools - Private Numbers 26 37 54 63 68 - Gov’t “ 21 24 31 42 44
8 Colleges & Universities *** (under AAEB) - Private *** Under MOED Number - Gov’t *** Only KCTE “ 1 1
32
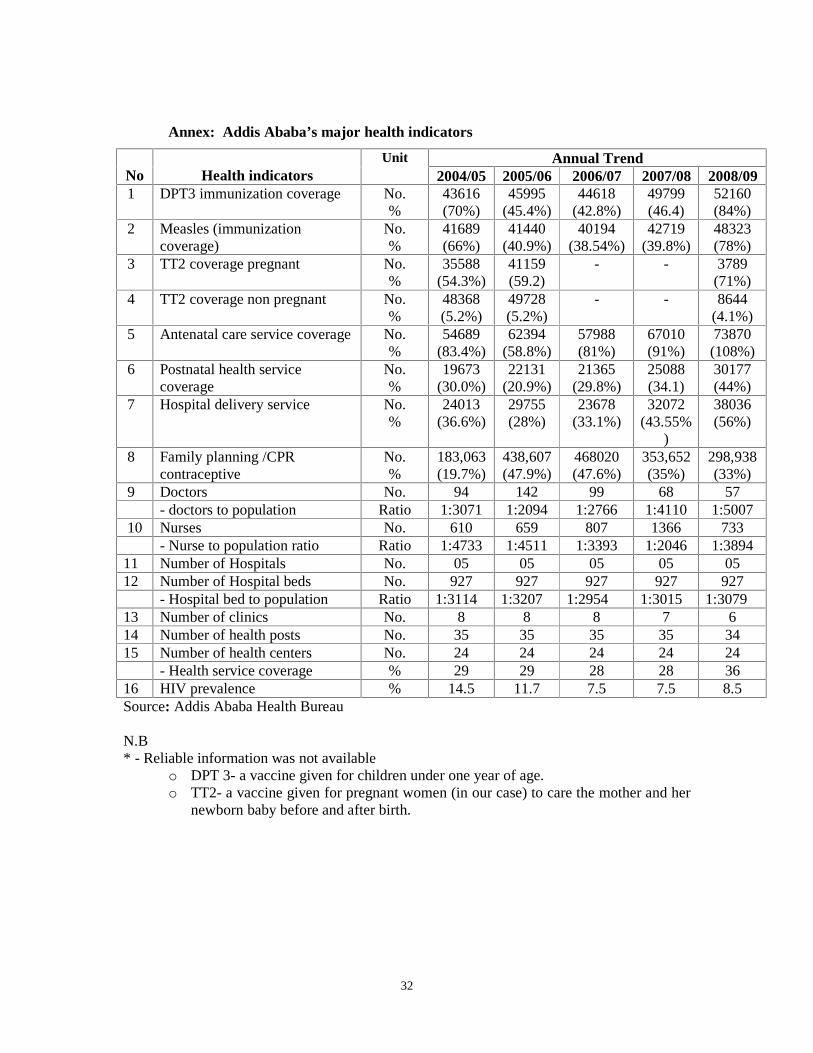
Annex: Addis Ababa’s major health indicators
Annual Trend No
Health indicators
Unit 2004/05 2005/06 2006/07 2007/08 2008/09
1 DPT3 immunization coverage No. %
43616 (70%)
45995 (45.4%)
44618 (42.8%)
49799 (46.4)
52160 (84%)
2 Measles (immunization coverage)
No. %
41689 (66%)
41440 (40.9%)
40194 (38.54%)
42719 (39.8%)
48323 (78%)
3 TT2 coverage pregnant No. %
35588 (54.3%)
41159 (59.2)
- - 3789(71%)
4 TT2 coverage non pregnant No. %
48368 (5.2%)
49728 (5.2%)
- - 8644(4.1%)
5 Antenatal care service coverage No. %
54689 (83.4%)
62394 (58.8%)
57988 (81%)
67010 (91%)
73870 (108%)
6 Postnatal health service coverage
No. %
19673 (30.0%)
22131 (20.9%)
21365 (29.8%)
25088 (34.1)
30177 (44%)
7 Hospital delivery service No. %
24013 (36.6%)
29755 (28%)
23678 (33.1%)
32072 (43.55%
)
38036 (56%)
8 Family planning /CPR contraceptive
No. %
183,063 (19.7%)
438,607 (47.9%)
468020 (47.6%)
353,652 (35%)
298,938 (33%)
9 Doctors No. 94 142 99 68 57 - doctors to population Ratio 1:3071 1:2094 1:2766 1:4110 1:5007
10 Nurses No. 610 659 807 1366 733 - Nurse to population ratio Ratio 1:4733 1:4511 1:3393 1:2046 1:3894
11 Number of Hospitals No. 05 05 05 05 05 12 Number of Hospital beds No. 927 927 927 927 927
- Hospital bed to population Ratio 1:3114 1:3207 1:2954 1:3015 1:3079 13 Number of clinics No. 8 8 8 7 6 14 Number of health posts No. 35 35 35 35 34 15 Number of health centers No. 24 24 24 24 24
- Health service coverage % 29 29 28 28 36 16 HIV prevalence % 14.5 11.7 7.5 7.5 8.5 Source: Addis Ababa Health Bureau
N.B * - Reliable information was not available
o DPT 3- a vaccine given for children under one year of age. o TT2- a vaccine given for pregnant women (in our case) to care the mother and her
newborn baby before and after birth.

33