Embed Size (px)
Citation preview

U.S. DEPARTMENT OF COMMERCE
National Technical Infonnation ServiceI AD-A026 468
APPLIED POLAROGRAPHY FOR ANALYSIS OF ORDNANCE
PART 1. DETERMINATION AND MONITORING FOR
1,2-PROPYLENEGLYCOLDINITRATE IN EFFL.UENT
WATER BY SINGLE-SWEEP POLAROGRAPHY
I NAVAL WEAPONS CENTER
1 JUNE 1976

THIS DOCUMENT IS BESTQUALITY AVAILABLE. THE COPY
FURNISHED TO DTIC CONTAINED
A SIGNIFICANT NUMBER OF
PAGES WHICH DO 'NOT
REPRODUCE LEGIBLY.

NWC TP5860
_ Applied Polarography for Analysis0of Ordnance Materials.
Part 1. Determination and Monitoring of- - l,2-Propyleneglycoldinitrate in Effluent
Water by Single-Sweep Polarography
byGid C. Wtiuck D DC
vmWt 3. Boe. fill 6 16Tm and Eiakwftn Donmt LL.Aj
JUNE 1976 C
Aepeom for gbrc fumm tiOut~on uinimim
N-VC Vkapons CenterCHINA LAKE. CAL FOANIA W- -P
NATIONAL TECHHiCALINFORMATION SERVICE
bS. DEPARTMENT Of COWNRS"tINFIU.. VA. Wo1

Naval Weapons CenterAN ACTmVTY CF -EF NiA/AL MATERIaAL CONANMANDR. G Freeman. IIl, RAdm., USN .Ommander
G. L. HolliViwonh ........................................... Technical Director
FOREWORDThe work described in this report is part of a continuing rele*rch
project entitled "Applied Polarography for Analysis of Ordnance Hateri-als." This wotk is supported by the Naval Sea Systems Command, Code0332, under Task Area Number SF57572301 and represents a final reporton Phase I of the work covering the period fiscal years 1975 and 1976.
Phase I of the work is divided into two final reports under theabove general title. Part I is "Determination and Monitoring of 1,2-Propyleneglycoldinitrate n Effluent Water by Single-Sweep Polarogrephy"and Part 2 is "An Inexpensive Solid-State Field Polarograph With Digitaland Analog Output.'"
This report has been reviewed for technical accuracy by Dr. ArnoldT. Nielsen, Robert L. Fowler, and Gordon R. Doyel.
Released by Under authority ofHUGH V. HUNTER, Head G. L. HOLLINGSWORTHReseach - -...- , TechnicaZ Director10 Hay 97 . -,
WNllication 5860, Part 1
Published by . . . . . . . . . . . . . Technical Information DepartsentCollation ......... . . .. . . . ... . Cover, 1leavesFirst printing. ....... 175 unnmbered copies
. - -- - -q4- -= =
UNCLASSIFIEDSIECURITY CLASSIFICATION OF THIS PAGE (Me~n Doi* Entor,*
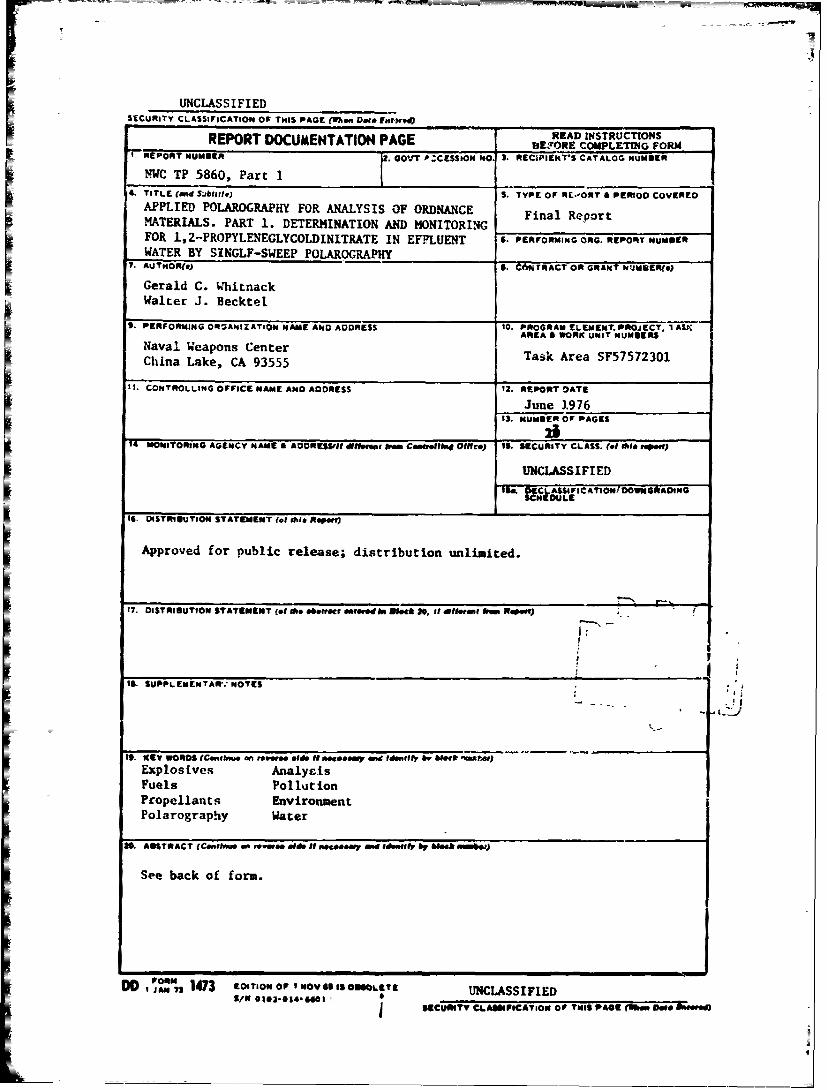
REPORT DOCUMENTATION PAGE BFR OPEIGFR-REPORT. GOVTE PZCZSSION k0. 3. RECUPICITrS CATALOG NUMBER
ORDANC FTna 586, Prt
4. TITLE (and Sibtitlej S. TYPE OF RC.'OXT & PERIOD COVERED
WATER BY SINGL F-SWEEP POLAROGRAPHY7. AUTNORfe) .C-TAE nUA
Gerald C. WhitnackWalter J. Becktel.
S. PERFORMING Oq3ANIZATION NAME AND ADDRESS 10 PROGRAM LEMENT. PROJECT. I All'.
AREA II WORK UNIT NUMBERS
Naval Weapons Center Task Area SF57572301China Lake, CA 93555
11. CONTROLLING OFFICE NAME AND ADDRESS 13. REPORT DATE
June 1976
13. NUMBER OF PAGES
14 MNITORI]MG AGENicy NAME Il ADDREWVII 41Eflas barn C01060EIMg OlliC.)14 IS.ECURITY CLASS. (of ad& "Ponf)
UNCLASSIFIEDIS& OECLASSIFICATIOWI DOWNGRADING
SCNEOIJLE
10. DISTRIUTION STATEMENT for ibi x~paw;)
Approved for public release; distribution unlimited.
I7. DISTRIBUTION STATEMENT for e sbefteci *MOaeM toav 1101"," Iftbrn 1Au01 *VR MPw
18- SUPPLEMENTAR; NOTES
IS- KEY WORDS (CakeAIua On POmee ef*M it XftSw~ 4119 IihmmIF~ OWet W*~r
Explosives Analysis
Fuels Pollution=Propellants Environment
Polarography Water
20& A9STR ACT (CorttfmU OF 1000080 Old* 81 ROCOernv A" IUIfr &F IaA ink~
See back of form.
IDDOR" 1473 901O F NVIISOOIT UNCLASSIFIED
j SCCUY CLASSFICATION Of T141S PAGE (k. 370e X"~a

.tu MtYCLASSICATIO Off"IS _ lPAfGls. A
)Applied !Pc Zowahz aaze ofrOrdnance MAter als. Part De. t00 ratn andM" ni t-rin of 1, 2-PropI , -Lne~ oiinitrate iniEffluent Water by Si'ngle--S--aep PoIarogrqaS4_--j, byGerald C. Whitnack and Walter J. BeckteZ, ChinaLake, Calif., Naval Weapons Center, June 1976.20 pp. (NWC TP 5860, Part -, publicationUNCLASSIFIED.)
(U) A new rapid, specific, and uniquepolarographic method of analysis for 1,2-propyleneglycoldinitrate (PGDN) in effluentwater is described. A portable and inexpensivedigital polarograph and monitoring system, builtat NW/C, are presented for the field analysis ofPUON in an t'fluenr water obtained from a Navycarbon co-am cleanup process to rer-ove theexplos-ie irom Ott- Ae wastewatt:r. Dataobtained by the NWC-developed method of analydsand field equipment ccupare favorably with dataobtained by a vapor-phase chromacographic methodon the same samples of effluent water. Part 2of this report des:ribes in detail the digitalpol-:ograph, circuitry, and operational charac-
teristics of the complete polarographic monitor-ing system.
I
IrNCIUSSI PLEDSwau.*y CLAentree ot Of faw 80ma a
INC TP 5860, Parr 1
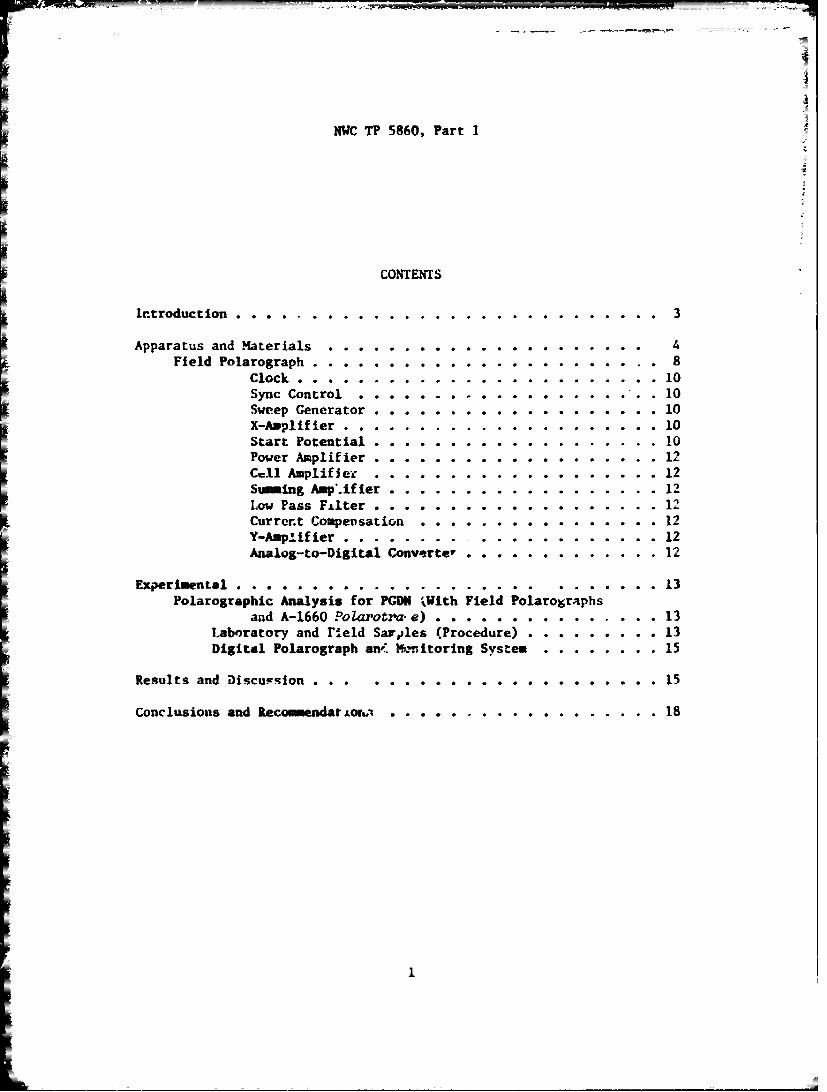
CONTENTS
Introduction . . .......................... 3
Apparatus and Materials ..... ............... 4Field Polarograph ............ ... .. 8
Clock . . .................. 10Sync Control . . . 10Sweep Generator .......... .. .10
X-A plifier ...... ....... . . . 10Start Potential ............... 10Power Amplifier ................... ... 12Cell Amplifier. ................ .... 12Summing Amp.f lter ..... .................. .12Law Pass Fiter ......... ................... 12
Current Compensation ...................... 12
Y-Amp frer .t.... .......... ........ 12Analos-to-Digital Converte- .. .. .. .. .. . .. .12
Experimental ...................................... 13Polarographic Analysis for PGDN 1 ith Field Polarographs
and A-1660 Poaraotrz e) ....... .............. 13Laboratory and rield Sarples (Procedure) ........... ... 13Digital Polarograph an/, Kanitoring System . . ...... 15
Results and Discu-sion. . . ... ... .. . .......... 15
Conclusions and Recommendarioru. ............. ... .18
ri1
NWC TP 5860, Part 1
ACKNOWLEDGENT
The authors gratefully acknowledge the assistance of personnel atthe Naval Torpedo Station, Keyport, Washington, f ,r furnishing theeffluent water, and the Naval Ordnance Station, Indian Head, Maryland,for supplying the pure PGDN used in this study.
We appreciate the support of this work by the Naval Sea SystemsCommand.
2

NWC TP 5860, Part 1
INTRODUCTION
The manufacture, storage, an? disposal of ammunition, propellants,fuels, and other ordnance material have resulted in the release of manytoxic organic and inorganic substances to the environment. At present,the Navy cannot rely on standard methods of analysis for many of itsordnance compounds of concern in pollution control, as either no methodexists or the reliability )f a method has not been established forenvironmental samples at the part-per-billion level needed !n this work.
The technical objective of this research program is to apply modernpolarography and related electrochemical techniques to the analysis ofordnance-related materials where reliable analytical methods are lacking.The work initially has been directed toward the analysis of explosives t-
- Naval Ordnance Laboratory. VtLTR-IOF Aof=rs & Erpiozuei in.t-Seawter, by J. C. Hoffsosmer and J. M. Rosen. White Oak, Md., NOL,August 1971. 13 pp. (.fLTR 71-151, publication UNCLASSIFIED.)
D. J. Glover and J. C. Hoffsomer. "Thin-Layer Chromat graphicAnalysis of HMM. in Water," BuLoer-n of E zirra-s 'r- tion ardToio-cZas, Vol. 10, No. 5 (1973), pp. 302-04.
J. C. qloffsomer. "Quantitative Analysis of Nitro Compounds inthe Micro- to Picogram Range by a Combination of Thin-Layer and VaporPhase Chromatography with the Nickel-63 Electron Capture Detector," '.
k'cratc r ., Vol. 51 (1970), pp. 243-51.G. C. Whitnack. "Detersination of Trinitrotoiuene in Warhead
Exudates by Linear Sweep Polarography," Ani:. Ch., Vol. 35 (1963), pp.97G-73.
Picatinny Arsenal. ApplicabziPit o- Erc- Ste-troa-ry ito-
t:noue- M n 'tcM na A c-ri.I.mtoglycerin Icn r and i. Tetianirrcmet mne i A-r, by C. S. Freer.Dover, N.J., July and March 1974. (Tech. Rapt. 4667 and 4668, publica-tions UNCLASSIFIED.)
J. S. Hetan. "Application of the Cathode-Ray Polarograph to theAnalysis of Explosives," AAtfare Palro&Z-o., f'oc et. .nrCo.7., 2n,Caribrid;., Vol. 2 (1960), pp. 640-46.
J. S. Hetman. "Simultaneous Polarograpi.ic Determination ofPentaerythritoltetranitrate and Cyclotrimethylenetrinit amine," Anal.Chi., Vol. 32 (1960), pp. 1699-701.
J. S. Hetman. "Polarography of Explosives," 3. 4maZ. Chx-m., Vol.264 (1973), pp. 159-64.
G. C. Whitnack, "Single-Sweep Polarographic Techniques Useful inHicropollution Studies of Ground and Surface Waters," ia.. Ciham., Vol.47 (1975). pp. 618-21.
3
NWC TP 5860, Part 1
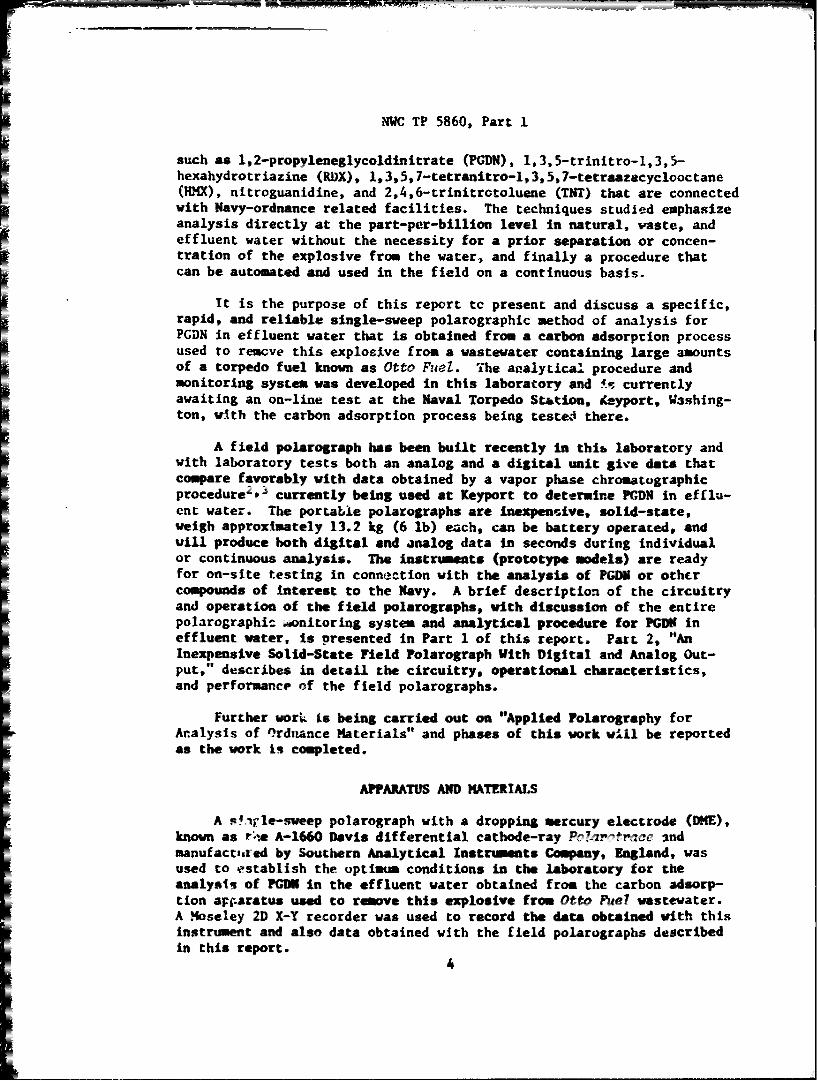
such as 1,2-propyleneglycoldinitrate (PGDN), 1,3,5-trinitro-l,3,5-hexahydrotriazine (RDX), 1,3,5, 7-tetranitro-l, 3,5, 7-tetraazacyclooctane(HMX), nitroguanidine, and 2,4,6-trinitrotoluene (TNT) that are connectedwith Navy-ordnance related facilities. The techniques studied emphasizeanalysis directly at the part-per-billion lev&l in natural, waste, andeffluent water without the necessity for a prior separation or concen-tration of the explosive from the water, and finally a procedure thatcan be automated and used in the field on a continuous basis.
It is the purpose of this report to present and discuss a specific,rapid, and reliable single-sweep polarographic method of analysis forPGDN in effluent water that is obtained from a carbon adsorption processused to remove this explosive from a wastewater containing large amountsof a torpedo fuel known as Otto Fuel. The aaalytica. procedure andmonitoring system was developed in this laboratory and !-s currentlyawaiting an on-line test at the Naval Torpedo Station, Keyport, Washing-ton, with the carbon adsorption process being teste- there.
A field polarograph has been built recently in this laboratory andwith laboratory tests both an analog and a digital unit give data thatcompare favorably with data obtained by a vapor phase chromatographicprocedure, J currently being used at Keyport to determine PM in efflu-ent water. The portable polarographs are Inexpensive, solid-state,weigh approximately 13.2 kg (6 lb) each, can be battery operated, andwill produce both digital and analog data in seconds during individualor continuous analysis. The instruments (prototype models) are readyfor on-site testing in connection witb the analysis of ?GDN or othercompounds of interest to the Navy. A brief description of the circuitryand operation of the field polarographs, with discussion of the entirepolarographit mitoring system and analytical procedure for NDM ineffluent water, is presented in Part 1 of this report. Part 2, "AnInexpensive Solid-State Field Polarograph With Digital and Analog Out-put," describes in detail the circuitry, operational characteristics,and performance of the field polarographs.
Further worL is being carried out on "Applied Polarography forAnalysis of Ordnance Materials" and phases of this work w'il be reportedas the work is completed.
APPARATUS AND MATERIALS
A s!agle-sweep polarograph with a dropping mercury electrode (DME),known as rte A-1660 Davis differential cathode-ray Potoarct 3ndmanufactured by Southern Analytical Instruments Company, England, wasused to establish the optimm conditions in the laboratory for theanalysis of PCDU in the effluent water obtained from the carbon adsorp-tion ar.aratus used to remove this explosive from Otto PFa7 wastewater.A Moseley 2D X-Y recorder was used to record the data obtained with thisinstrument and also data obtained with the field polarographs describedin this report.

NWC TP 5860, Part 1
The complete digital polarographic monitoring system for field orlaboratory use is shown in Figure 1. The digital polarograph (digitaland/or X-Y data) is shown at the left with a IME constant temperaturestand and small volume cell with a stainless steel cylinder (right) forcontrolling the solution temperature in the large quartz cell shown inthe foreground. The DOE is inserted into the effluent water sarplecontained in the cell which has been previously placed inside the con-stant temperature device. Three solid (carbon-type) electrodes areshown in this figure (left) as potential replacements for the DHE in thefield, where use of mercury might be prohibitive. The use of thesesolid electrodes with the system described is the subject of currentresearch in this laboratory.
Figure 2 shows the analog field polarograph (X-Y or strip chartrecorded data) with polarographic cell, constant temperature device, andcarrying case. This instrument has several controls on the outsidepanel to allow greater versatility in establishing the optimuM condi-tions for the analysis of different pollutants in aqueous media. In thedigital polarograph the analytical parameters are preset inside the caseto perform a certain analysis. This ensures that no external knobs areturned which might alter the output data during field analysis.
The polarographic measurements were made at 25C + 0. 10C on 2 alof water placed in a 5-mi capacity quartz cell for most of the labora-tory studies. The field polarographic cell holds larger volumes ofwater and when used with the field polarographs about 15 al of effluentwater is retained in the cell during a measurement of the concentrationof explosive. A small staialess steel constant temperature device wasbuilt to keep the temperature of the effluent water in the cell to 30"C± 0.2C in the field.
The DWE used in this work had drop times of 7 seconds in distilledwarer on open circuit and m - 5 to 7 mg per drop of mercury. Redistilledmercury was used as an anode and for the WME. The current peak poten-tials are referred to a mercury pool or to a saturated calosel electrodeas reference. Since the electroactive specie concentrations measuredin this work are extremely low (l0-6 to 10-8 ), the currents are verysmall and the value of the internal resistance (iA) correction is there-fore negligible, pt Measurements were made with a Beckman expanded-scale pH meter.
The PGDN ta',At in this study was obtained from the Naval OrdnanceStation. Indih i Ks.d, Maryland, and was especially purified at thatStation to a 1ev4i of 99Z or better. The polarograms obtained with thismaterial were bit~ proportional to explosive concentration over a range
of 5 X 10- o 10- g/ml. Standard solutions of the explosive wereprepared in spt&-.tzoqtlity acetone, obtained from Matheson, Coleman and---kil. These td=ltikms were prepared in the 10-"- to 1r 5 -g/ml range
AM then microaliqiotn (0.01 to O.05 ml) were added directly to the%rater sample ir. t62t= polarographic cell for analysis.
5

NWC 1? 5860, Part 1
USUU
C
Ca
A
_ CC.S.r 0
S.
C.
____ __ C
-4C
-9
_______ N
C,'.4h.
____________________ __ t
a-
6

WC TP 5860, Part 1
_______ a
0a..
~.0
0
_____ ___ 0
U
____ I.
__ _ -
I

NWC TP 5860, Part 1
The effluent water used in this work was obtained from the Naval:3rpedo Station. It was representative of Otto Fuel wastewater that hadpassed through several columns of activated carbon to remove the explo-
sive PGDN. The wastewater was a mixture of fresh and seawater contami-nated with Otto Fuel.
Water obtained from the charcoal cleanup process contained enoughionic conductivity to serve as an excellent electrolyte for single-sweeppolarography. The pH of this water was 6 to 8. No interference fromions such as Cu2+, Pb2+, and Cd2+ were observed with this effluent;
thus, the region of voltage where the PGDN gives a polarographic wave(-0.30 to -0.80 V versus Hg pool) is free of interference from the ionsthat are most commonly found in this region in natural, waste, andseawater. Th2 limit of detection of these ions, with the polarographictechnique described in this report, is 20 parts-per-billion and wouldindicate that the effluent water used in this study was free of Cu^+
Pb + , and Cd2+ to the 20 parts-per-billion level. If metal ions of thistype are encountered in a concentration above 20 parts-per-billion inthe effluent water, they may be removed from interfering in the analysisof PGDN by the addition of a part-per-million solution of ethylenedia-minetetraacetic acid (EDTA).
If the pH and/or ionic content of an effluent water are found tovary zonsiderably, then a buffer near a pH of 7 and of constant ionicstrength should be added to the a..iquot of effluent water before apolarographic measurement is made. Thi ensures that the peak potentialand total current for PGDN, or other organic material of interest in thevoltage range of sweep, do not change with the samples of effluent waterbeing analyzed.
FIELD POLAROGRAPH
A circuit diagram of the field polarograph is shown in Figure 3.A detailed description of the circuitry, operational characteristics,performance, etc. of the polarographic field un't is given in Part 2of this report.
Originally, the field polazograph was to be designed after theA-1660 Davis Polarotrace using digital circuitry. However, it soonbecame apparent that in order to perpetuate the timing sequence producedby the A-1660 electron tube version an analog unit would have to bebuilt, and the output converted to a digital word. The field unit con-nects directly to the A-1661A DME stand (Figure 1) and the electricalrequirements to operate the stand are designed to be the same as thoseof the t,,be model. Adjustments are provided within the field unit tofacilitate setting the scaling of these plots. Integrated circuitry isincorporated throughout the design with a minimum of discrete components.The unit is completely self-contained and is very compact. Most of theweight is attributed to the self-contained power supplies. A battery
8

NWC TP 5860, Part 1
,-0-7
Ir
IT
"t *; N -*
Hit- te w
it'
2 CIO
czi
0
4-4
r _
It a9 6

NWC TP 5860, Part 1
pack can be connected externally, making the polarograph truly a fieldunit.
A block diagram of the field polarograph is shown in Figure 4. Adescription of the components in each block and discussion of theirfunctional operation in the integrated circuitry of the instrumentfollows.
Clock. The master clock, running at a metcstable state, is designedto control the synchronization and timing of the DME, sweep circuitry,
timing of the potential across the cell, sampling selection, end thetiming of the analog-to-digital conversion. The circuit consists of apulse generator with the capability of a variable pulse width and delay.
Sync Control. The time interval controlling the formation of the
mercury drop and its removal is the responsibility of the sync controlcircuit. This stage takes the metastable clock pulses and delays andshapes them, so that the drop of mercury is at a maximum size just priorto and during the sampling, Immediately following the sampling, thedrop of mercury is removed from a capillary tube by the actuation of a
solenoid. Since the master clock controls this circuit as well as thepotential across the cell, sampling is assured of being taken at pre-
cisely the correct time.
Sweep Generator. The ourpose of the sweep generator is to produce
a sweep potential to be - .ed directly to the cell, and at the sametime produce a driving sl for the "x" amplifier. The sweep gLnera-
tor produces a linear ramp irectly in concert with that of the clocktiming pulses, which assur -at the cell readings are taken at the
correct time.
X-Amplifier. In order to record and visually see the results ofDME polarography, it is necessary to produce a drive signal in the x-ordinate. The signal to the x-amplifier is taken directly fruL. the
sweep generator and amplified by the action of a linear amplifier. Itis then taken to an external output from which it can be connected to a
piece of peripheral equipment. A provision has been incorporated where-
by this signal may be varied making it possible to control the length of
the linear sweep. This is sometimes desirable when one wishes ti expandor reduce the wavefront recording.
Start Potential. This circuit consists of a differential amplifier
constructed to algebraically add a DC potential to the sweep signal.This potential is used to determine or identify the unknown substance in
solution, and because of this it must be accurately controlled and moni-
tored. In conjunction with this circuit is an analog meter used tomonitor the DC potential placed across the cell prior to and duringpolarographic readings. Start potentials may be either positive or
negative and are selected as such by the operator.
10

NWC IT 5860, Part 1
0
-,o-
4-,* i
00
4c-
u4 0
0.
0
I%
NWC TP 5860, Part 1
Power Amplifier. Prior to this circuit there has been no amplifi-cation of sweep or start potential ot sufficient magnitude to drive asignal across the cell without some loss or distortion. In order toprevent this situation, a power amplifier is inserted at this point.The circuit features a low standby current, yet contains a high currentdrive capability with excellent linearity.
Cell Amplifier. The main purpose of the cell amplifier is to con-verL Lhe current sig--,Is from the cell into a voltage and at the sametime amplify these signals up to a point where rhey can be furtherprocessed. Twelve positions of current gain are readily accessible forselection by an external dial. Another desirable attribute of this cir-cuit is that it has an extremely high input impedance - a necesaryquality to keep from loading the cell, resulting in erroneous readings.Since cell currents dealt with in this circuit are in many cases in thenanoampere region, care in selection of components associated with thiscurrent is essential.
Summing Amplifier. Voltage signals from the r.ell amplifier contain,in addition to signal information, a slope due to the sweep amplifier.In order to minimize this slope, these signals are summed algebraicallywith negative slope signals from the offset amplifier.
Low Pass Filter. When detecting very low level signals, the gainof the cell current amplifier is increased. This increase in amplitudealso increases unwanted random noise. In order to remove or greatlyattenuate this noise and ncrease the signal-to-noise ratio, an activefilter is incorporated. Signals not occurring within the time domainof the sampling period are attenuated to such a degree they cannot beseen at the output.
Cu'rent Compensation. Occasionally, there is a signal jump fromzero to some positive potential due to an electrical characteristic ofthe cell and the intense gain of the current amplifier. In order tominimize and compensate for this, a current compensating network isused. This circuit is externally controlled and compensation is madeby simply adjusting a potentiometer.
Y7-mplifier. The final ordinate to be displayed on the externalequipment is the vertical information, comprised of the analog signalsproduced and amplified from the cell. Until now the signal informationhas been of a low level amplitude. It is now necessary to magnify thisto such an extent that it may be recorded and displayed as useful infor-mation. To accomplish this task a high gain voltage amplifier is employed.Another useful part of this circuit is a y-positioning unit.
Analog-to-Digital Converter. Actually, this part of the fieldpolaroeraph consists of two circuits: a sequencer and a modular analog-to-digital converter, with a connection to the outside to facilitate in
12

NWC TP 5860, Pert 1
the external storage of digital information. Information is takendirectly from the y-amplifier and fed simultaneously to the analogoutput as well as the analog-to-digital converter. The sampling rate isdetermined by a sequencing circuit which is set to run at 10 samples/second. However, there is also a switch that can be actuated so thatthe converter will run at an external rate compatible with a piece ofperipheral equipment. Each analog voltage is converted to a 12-bitdigital word at an accuracy of * 1/2 least significant bit. Polaro-graphic sama.les can be run with or without this 'nit. In the laboratoryit might find an additional use as a mean3 of viewving Lhe output of thepolarograph on a multichannel analyzer, or storage of the digital infor-mation on magnetic tape for future reference.
EXPERIMNMTAL
POLAROGRAPHIC ANALYSIS FOR PGDI (WITH FIELD POLAROGRAPHSAND A-1660 POLAROTRACE)
Laboratory and Field Samples (Procedure)
A 2-ml or larger aliquot of a natural or effluent water sample isplaced in a 5-al or 15-al capacity quartz cell to which a small volumeof mercury has been added as the anode; the DHE, serving as the cathode,is then lowered into the water sample in the cell, which is placed inthe constant temperature device and brought to constant temperature. Thesolution in the cell is now flushed with oxygen-free nitrogen for 3 to 4minutes to remove all the interfering dissolved oxygen from the water.The start potential of the single-sweep polarograph is set at -0.53 Vversus Hg pool and after several sweeps a polarogram is recorded withthe X-Y recorder. A typical polarogram for PGDN in effluent water isshown in Figure 5, curve &. A microaliquot of standard PIM solution isthen added to the cell solution and the procedure is repeated. This isknown as the standard addition technique and a simple calculation of thePGDIN concentration in the sample cat. be made from a ratio of the tworecorded polarogram waveheights. The waveheight for the sample may alsobe referred to a standard curve of waveheight versus PGDN concentrationpreviously prepared from fresh PGDM solution. The standard curve shouldbe checked frequently if this method is used n the calculation.
In the field a glass cell of the type shown in Figure 1 is placedinside a stainless steel cylinder that controls the temperature of thecell solution to + 0.2C during the polarographic analysis. The cellwas designed for individual or continuous analysis so that the mercurybuildup in the cell will be automatically removed when the mercury levelreaches the top of the center tube. The cell can be used for about 120hours of continuous operation before the amount of mercury collectedfrom the DME will reach the level to drain. The cell volume is about15 ml total capacity and with the DWE positioned precisely in the centerof the cell there is always enough solution in the cell to cover the DME
13

)Iwc rP 580 part
LU 44
C-3S
0."
C.
Is0m0o Oka0 - S
0CJ.coUu 04
cs- 40rA
'-S 0CcS c .
cr. 02s0mom
cr.UI~
Us 'a CD_ 0
LU too
144

NW TP 5860, Part 1
during the ana.l ig. Since the polarograph measures concentration, thecell volume is not critical in the analysis; bowever, sufficient timemust be allowed for complete replacemenr of the aualyzed solution inthe cell with new solution before each s, ':i is mae.
Digital Polaroaraph and .nitorin,o-:
If the digital polarograph (Figuz- b u "sed for the analysis,a digital count is recorded in the easy v .w window of the instrumentevery 28 seconds after the analyticl prc -dure above has been followedthrough the nitrogen flush stage and 0 .-' -nument has been turned onwith the start potential agr-n set at VC.. v. The window setting forthe digital polarograph recording I3 sh A Figure 5, curve B. Thus,it can be seen that the instrument recori , a number for the largestcurrent in the voltage range where the complete polkrogram for PGDN isseen. The peak potential for PGDN cccurs at -0.75 V. This is wellwithin the window setting for the analysis of a low concentration ofPGDN such as present in the effluent water from the carbon absorptionprocess. A digital count change of about 100 with the polarographrepresents about 20 parts-per-billion change in P'rfM concentration inthe effluent water. A preselectel nmer, representing a criticalconcentration of PGDN, is set into2 the concentration select window onthe polarograph and an alarm buzilt into the instrument will be set 3ffit the cuncentration (digital number) exceeds thit number by one digit.For exale, if a concentration of 100 parts-per-billfm is unacceptablein the effluent water, then a number of 750 (representing that concen-tration and previously determined in standard addition experiments) isdialed in. The alarm will n:. sound aL long as the concentration ofPGDN in the effluent water remains less than 100 parts-per-billion, butit will sound as soon as the dialed-in number (750) is exceeded by onedigit (751) in the digitel maber showing in the easy view window of thepolarograph. The digital number repeats every 28 seconds and a plantoperator cav push a reset button aL any rime to obtain a new reading toverify the concentration of PGDN in the effluent stream. This processcan be repeated as many times as necessary to confirm water purity inPGDN.
RESULTS AND DISCUSSION
The polarographic analytical procedures, field polaro raphs, andcomplete monitoring system deve.oped in this laboratory have been usedsuccessfully at Naval Weapons Center (MSC) to determine and movitorPGMN in effluent water of the type discussed in this report. The lowerlimit of detection is 20 parts-per-billLon and concentrations as low as50 parts-per-billion of the eiplosive can be monitored and dete--.inedw thin t 5 to 102 of the true amount present in the water. An individualanalysis for PGD can be performed on a 2-ol aliquot of effluent waterwithin 5 minutes and during continuous operation a concentration reading
15

NIC TP 5860, Part 1
can be obtained every 28 seconds with the digital polarograph and every7 secuads with the analvg polarograph.
Data obtained for PGDN concentration in typical effluent water fromta carbon adsorption process, with the digital polarograph and monitoringsytsem described in this repo;.:, are shown in Table 1. The data comparefavorably with data obtained by both the thin-layer and vapor-phasechromatographic methods. 2 . A range from 0.10 to 1000 ppm PCDN could bemeasured satisfactorily with the polarographic monitoring system. Sam-ples containing over 150 ppm FGDN needed to be diluted before analysis.Either KCl or NaCI (0.1 N) solution could be conveniently used for thisdilution. Well defined polarcgraus were observed in all cases for ana-lytical purposes.
TABLE 1. Polarographic Analysis of Effluent andWastewater for PGDN (Data Obtained
with Field Polarograph).
Sample pH FGD, pp.
Effluent No. 1 7.50 0.12Effluent No. 2 8.05 0.37Effluent No. 3 6.35 0.35Coluim No. 1 6.90 2.06Column No. 2 7.10 1.91Colum No. IA 8.40 1.54Feed, pretreated 6.50 167.00Feed, original wastewater 6.20 1062.00
Table 2 shows typical analog and digital data obtained on the ;amesama e of effluent water with the digital field polarograph operatingwith the auxiliary monitoring equipment. A digital court change of 100repe-,sents a PFDN concentration chan.e in the effluent water of 20parts-per-billion. The X-¥ recorder showed only a 1.0 division changeon graph paper (10 X 10 to 1/2 Inch) for this change in PGDN concentra-tion. Thus, the digitally recorded data reflect more sensitivity to aslight change in PGDN concentration in the effluent water obtained fromthe carbon cleanup colums.
Standard additions of a pure PCDN solution to 2.-l aliquots of theeffluent water showed that thit explosive gives well defined polarogramsdirectly in this media, with waveheights that are pLoportional to con-centration over the range of 10 -6 to 10 - 9 g/ul. A polarogram of thistype can be recorded every 7 seconds with the field polarographs. Thedigital version records an average current taken from four successive7-second mercury drops from the DME, and a digital count, representing
16

INC TP 5860, Part 1
the total current reached at the peak potential within the voltagewindow setting of the instrument, is seen in the easy view window ofthe polarograph every 28 seconds. The current-voltage relationship canalso be monitored with an oscilloscope.
TABLE 2. PGDN in Effluent Water (Analog andDigital Polarographic Data).
X-Y Digital PGDN concS,Recordera countb ppm
8.0 1.205 0.19
9.0 1.31? 0.2110.0 1.407 0.2412.0 1.628 0.29
a Graph paper divisions 10 X 10 tc 1/2 incb.O Average of six counts (cell current s 11).Determined by standard addition technique.
A two-electrode system of DHE versus Hg pool was used in most ofthis analytical work where small currents are being measured, as thepotential of the Hg pool (reference electrode) remained relativelyconstant over the entire sall applied potential range used for theanalysis of FMW in the type of effluent water obtained from the carbonabsorption process. A three-electrode system should be used if poten-tial changes might occur in the reference electrode during the analysis.Most commercially available polarographs make use of the three-electrodesystem, where the potential applied to the polarographic cell is auto-matically controlled on a continuous basis to compensate for the effectsof electrolyte resistance. The resistance of the carbon adsorptioneffluent water (electrolyte) was found to be relatively constant and didnot seriously affect the analytical results when a two-electrode systemwas used. A saturated calomel electrode could conveniently be used asthe referc.nce electrode with a DlE and Hg pool in a three-electrode sys-tem, for the analysis on a continuous basis in the field where uncer-tainties and/or changes in the quality of the effluent water couldaffect the analytical data.
State-of-the-art mthods sometimes make it possible to eliminateconcentrating a sample. This appears to be true in the case of the car-bon adsorption column effluent when the concer-tration of the explosivepollutant is still large enough to determine it directly in the m-diawithout interference from other contaminants that have been removed bythe carbon.
17

MIC TP 5860, Part 1
CONCLUSIONS AND RECOMENATIONS
A simple, rapid, and unique single-sweep polarographic analysiswith new field instrumentation for specifically monitoring the explosivePGDN in effluent water has been developed in this laboratory. Theanalytical technique and equipment are described in this report and areapplicable to both laboratory and field use for the analysis of manyother organic and inorganic pollutants in natural and effluent water.It is suggested that the polarographic procedure and instrumentationdeveloped for the analysis of NUNN be extended to other amenable com-pounds of Navy interest such as 35, RDX, TNT and derivatives, nitro-guanidine and tetranitromethane.
A series of tests designed to show the reliability of the analyti-cal procedure and complete monitoring system under operating conditionsat tast sites is needed. These tests should show if the present moni-toring system concept is well suited to in situ measurement.
Since no Environmental Protection Agency- or American Society for
Testing and Materials-approved metbods of analysis exist for explosivesand many other organic pollutants found in water in the environmuent,the polarographic procedures described in this report should be investi-Igated by the Navy as potent ally approved methods, particularly withregard to legal environmental problems the Navy may have with ordnance-related facilities.
iI


![[Shinobi] Bleach 468](https://img.pdfslide.us/doc/110x75/568bd7501a28ab20349f41f6/shinobi-bleach-468.jpg)