Embed Size (px)
Citation preview
AD-A 29 007 EVALUATION OF PRECISION APPROACH PATH INDICATOR (PAPI 1/(U) FEDERAL AVIATION ADMINISTRATION TECHNICAL CENTERATLANTIC CITY NJ B CASTLE APR 83 DOT/FAA/CT-82/153
UNCLASSIFIED DOT/FAA/RD-82/85 F/G 1/4 NLlllllmmlllllluumIIIuIIIIIIIIIIIIIIIIIIIIIIIIIIIIIIIIIIIIIIIIIIIIIIIIIIEEEIhEIIIIIZE EENiEEE
a 1g
MICROCOPY RESOLUTION TEST CHART
NATIONAL BURMA OF STANDARDS- I963-A
r7 li .
6O/AC-213 oDOT/FMIRD-82/85 Evaluaion ofPrecision
Approach Path Indicator (PAPI)
Bret Castle
Pmepared By
FMA Technical CenterAtlantic City Airport, N.J. 08405
April 1953Final Report
This document is available to the U.S. publicthrough the National Technical InformationService, Springfield, Virginia 22161.
CD JUN 7
-jUSDWCff fwnsparatonIn A
Washingto.C. 20590
83 06 06 U4 3
NOTICE
This document is diseminated under the sponsorship ofthe Department of Transportation in the interest ofinformation exchange. The United States Cover nwentassumes no liability for the contents or use thereof.
The United Staces Government does not endorse productsIor manufacturers. Trade or manufacturer's nms appearherein solely because they are considered essential tothe object of this report.
A~,.. .. I
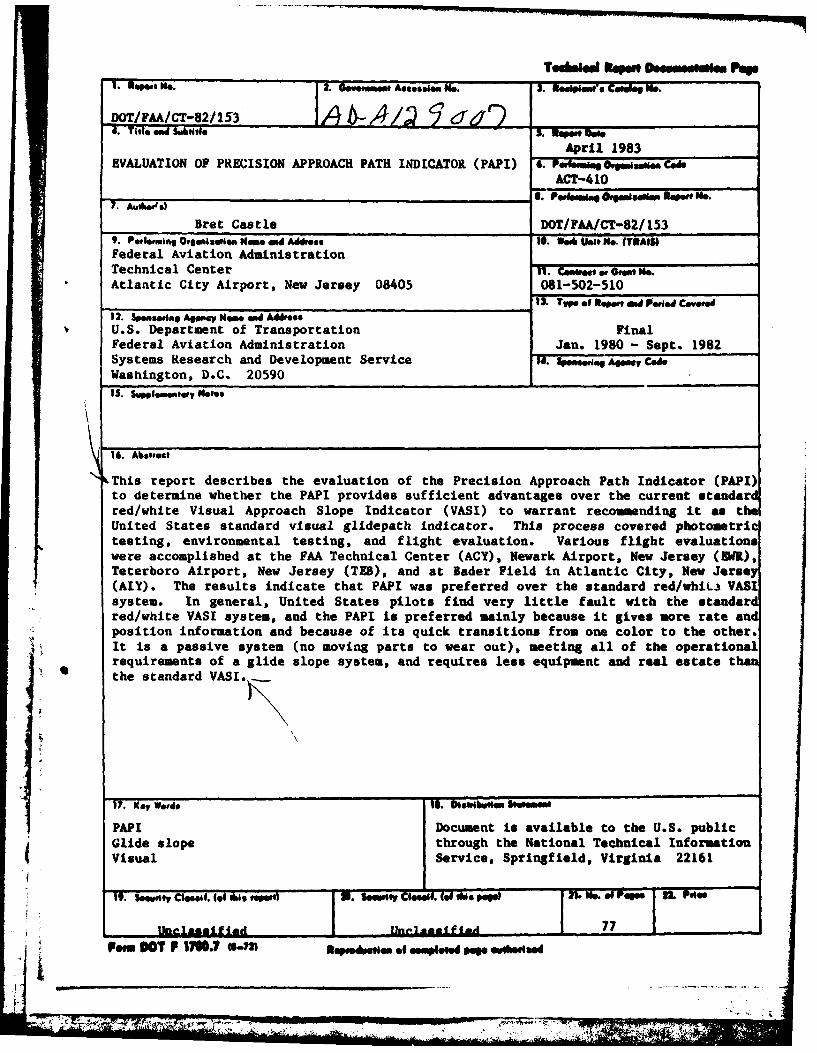
DOT/FAA/CT-82/153 __A________________
4Ttle end Subdtio. W5. -3.. 0
EVALUATION OF PRECISION APPROACH PATH INDICATOR (PAPI) 1. Pesm~~~au.CdACT-410
7._ _ _ _ _ _ _ _ _ _ _ _ _ _ _ _ _ _ _ _ _ __ _ _ _ _ _ .Pbmu riuI bri b
Bret Castle DOT/FAAICT-82/ 1539P..h~ift Oegmmiaeein New* sa Add,.. WS. *44 Uibt, M. (TRAAS)
Federal Aviation AdministrationTechnical Center .1- WGe eAtlantic City Airport, New Jersey 08405 081-502-510
13. Type of Rst died Peci.d COWW"12. Smoevin~g ftw Home and Ad&***.U.S. Department of Transportation FinalFederal Aviation Administration Jan. 1980 - Sept. 1982Systems Research and Development Service 1d. Sp...hqAommy Cool.Washington, D.C. 205901S. S"aPlmntery Holes
kThis report describes the evaluation of the Precision Approach Path Indicator (PAPI)to determine whether the PAPI provides sufficient advantages over the current standardred/white Visual Approach Slope Indicator (VASI) to warrant recommending it as theUnited States standard visual glidepath indicator. This process covered photomtrictesting, environmental testing, and flight evaluation. Various flight evaluationilwere accomplished at the FMA Technical Center (ACY), Newark Airport, New Jersey (MI),Teterboro Airport, New Jersey (TUS), and at Bader Field in Atlantic City, New Jersey(AIY). The results indicate that PAPI wan preferred over the standard red/whiL3 VASIsystem. In general, United States pilots find very little fault with the standardred/white VASI system, and the PAPI is preferred mainly because it gives more rate andposition information and because of its quick transitions from one color to the other.It is a passive system (no moving parts to wear out), meeting all of the operationalrequirements of a glide slope system, and requires less equipment and real estate thathe standard VASI.)
17. Key Words S laorb~Wr steseamm@
PAPI Document is available to the U.S. publicGlide slope through the National Technical InforioationVisual Service, Springfield, Virginia 22161
19. W..., Ws..f fe Aew~e) U.5mS~CG..*l. (of Ws. jeg01 of. Fewi P
Utlassif ied fl~ nlfaI 77 I
Slii OT F*70.e-MnpmsA..Go ef ew..plmdodo
9j 1 .. . ]" ' s K. kll
t III.II
Hill i11 I I
1 1 ,1 ! Iiii.' II I
111|111111| II
1 11."" .1"- "' ---""
i 2l3 r'3 met lil&i lPltlt l rtl311 rt l lS l3l ' -
I li I 1i A IS O v i
1i Iilli i1! iil II,,,, t
- 11 l UP 11,111111
m l -
!IiI .ta
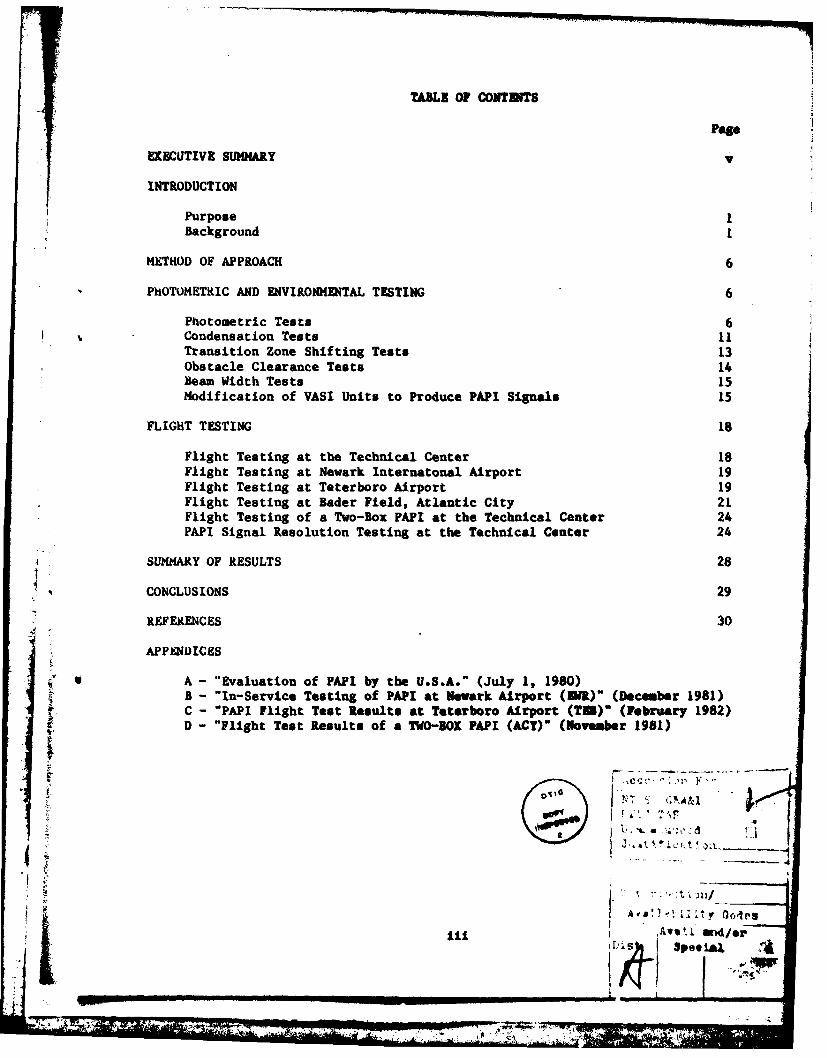
TABLE OF CONTETS
Page
EXECUTIVE SUMMARY v
INTRODUCTION
Purpose 1Background I
METHOD OF APPROACH 6
PhOTOMETRIC AND ENVIRONM(ENTAL TESTING 6
Photometric Tests 6Condensation Tests 11Transition Zone Shifting Tests 13Obstacle Clearance Tests 14Beam Width Tests 15Modification of VASI Units to Produce PAPI Signals 15
FLIGHT TESTING 18
Flight Testing at the Technical Center 18Flight Testing at Newark Internatonal Airport 19Flight Testing at Teterboro Airport 19Flight Testing at Bader Field, Atlantic City 21Flight Testing of a Two-Box PAPI at the Technical Center 24PAPI Signal Resolution Testing at the Technical Center 24
SUIMARY OF RESULTS 28
CONCLUSIONS 29
REFERENCES 30
APP0DICES
A - "Evaluation of PAPI by the U.S.A." (July 1, 1980)B - "In-Service Testing of PAPI at Newark Airport (51)" (Decmber 1981)C - "PAPI Flight Test Results at Teterboro Airport (TEN)" (February 1982)D - "Flight Test Results of a TWO-BOX PAPI (ACT)" (November 1981)
I
* ' ~ : " ' Y , u
p1 1 1 j and/o
I"'
, I d .. .' . ..:-- , .s' ,- - ~ ra a s- I --,],,. t LU k, :d .
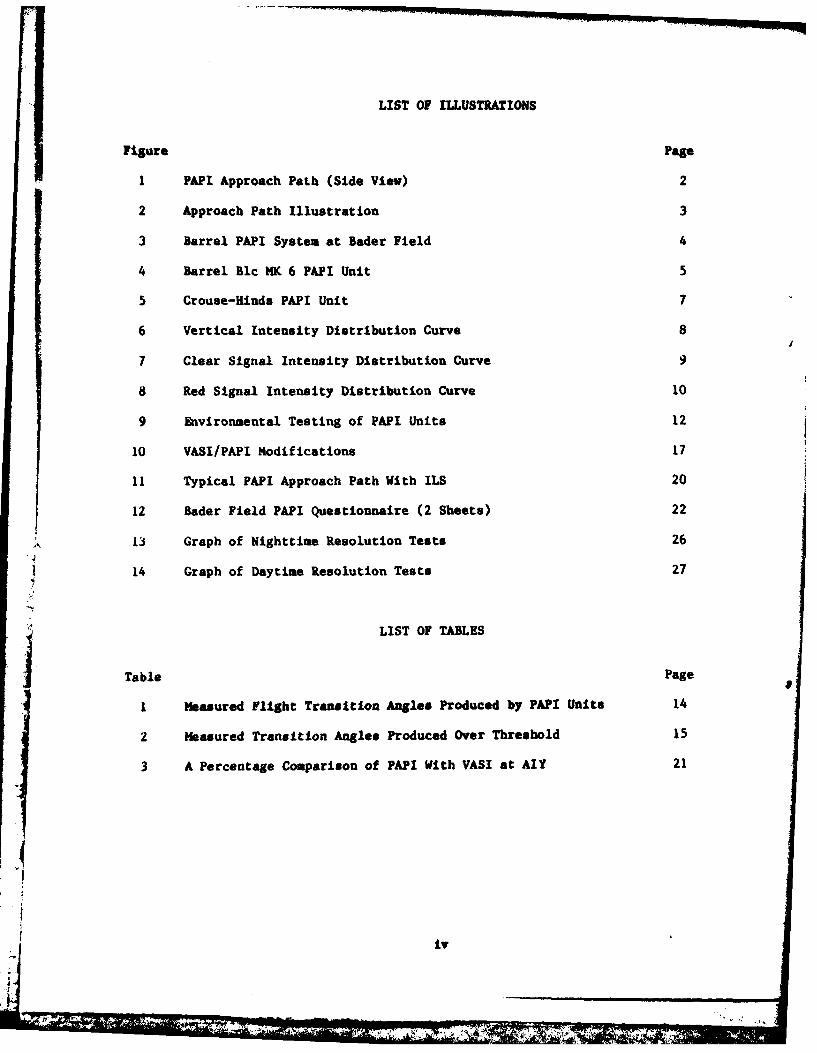
LIST OF ILLUSTRATIONS
Figure Page
I PAPI Approach Path (Side View) 2
2 Approach Path Illustration 3
3 Barrel PAPI System at Bader Field 4
4 Barrel Blc MK 6 PAPI Unit 5
5 Crouse-Kinds PAPI Unit 7
6 Vertical Intensity Distribution Curve 8
7 Clear Signal Intensity Distribution Curve 9
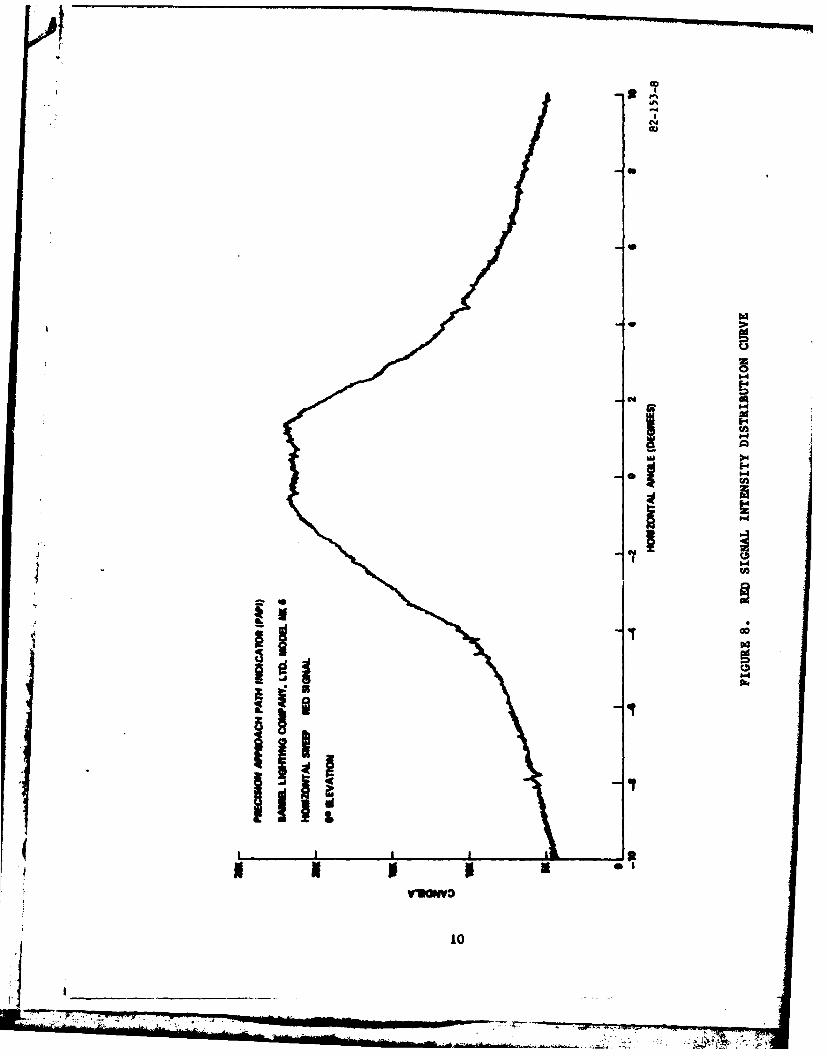
8 Red Signal Intensity Distribution Curve 10
9 Environmental Testing of PAPI Units 12
10 VASI/PAPI Modifications 17
11 Typical PAPI Approach Path With ILS 20
12 Bader Field PAPI Questionnaire (2 Sheets) 22
13 Graph of Nighttime Resolution Tests 26
14 Graph of Daytime Resolution Tests 27
LIST OF TABLES
1 Table Page
1 Measured Flight Trmnition Angles Produced by PAPI Units 14
2 Measured Transition Angles Produced Over Threshold 15
3 A Percentage Comparison of PAPI With VASI at AIY 21
i Lv
i f-'
EXECUTIVE SWMI Y
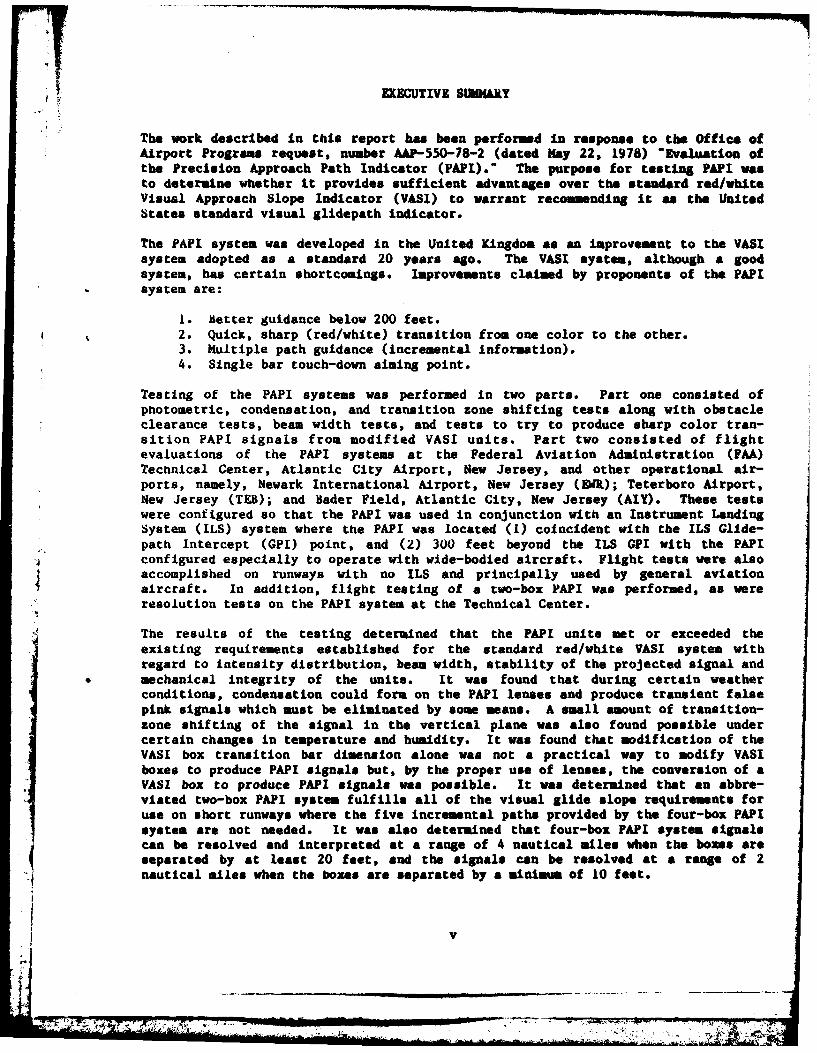
The work described in this report has been performed in response to the Office ofAirport Programs request, number AAP-550-78-2 (dated May 22, 1978) "Evaluation ofthe Precision Approach Path Indicator (PAPI)." The purpose for testing PAPI wasto determine whether it provides sufficient advantages over the standard red/whiteVisual Approach Slope Indicator (VASI) to warrant recommending it as the UnitedStates standard visual glidepath indicator.
The PAPI system was developed in the United Kingdom as an improvement to the VAStsystem adopted as a standard 20 years ago. The VASI system, although a goodsystem, has certain shortcomings. Improvements claimed by proponents of the PAPIsystem are:
1. Better guidance below 200 feet.2. Quick, sharp (red/white) transition from one color to the other.3. Multiple path guidance (incremental information).4. Single bar touch-down aiming point.
Testing of the PAPI systems was performed in two parts. Part one consisted ofphotometric, condensation, and transition zone shifting tests along with obstacleclearance tests, beam width tests, and tests to try to produce sharp color tran-sition PAPI signals from modified VASI units. Part two consisted of flightevaluations of the PAPI systems at the Federal Aviation Administration (FAA)Technical Center, Atlantic City Airport, New Jersey, and other operational air-ports, namely, Newark International Airport, New Jersey (EWl); Teterboro Airport,New Jersey (TEB); and Bader Field, Atlantic City, New Jersey (AIY). These testswere configured so that the PAPI was used in conjunction with an Instrument LandingSystem (ILS) system where the PAPI was located (1) coincident with the ILS Glide-path Intercept (GPI) point, and (2) 300 feet beyond the ILS GPI with the PAPI
-configured especially to operate with wide-bodied aircraft. Flight tests were alsoaccomplished on runways with no ILS and principally used by general aviationaircraft. In addition, flight testing of a two-box PAPI was performed, as wereresolution tests on the PAPI system at the Technical Center.
The results of the testing determined that the PAPI units met or exceeded theexisting requirements established for the standard red/white VASI system withregard to Intensity distribution, beam width, stability of the projected signal andmechanical integrity of the units. It was found that during certain weatherconditions, condensation could form on the PAPI lenses and produce transient falsepink signals which must be eliminated by some means. A small amount of transition-zone shifting of the signal in the vertical plane was also found possible undercertain changes in temperature and humidity. It was found that modification of theVASI box transition bar dimension alone was not a practical way to modify VASIboxes to produce PAPI signals but, by the proper use of lenses, the conversion of aVASI box to produce PAPI signals was possible. It was determined that an abbre-viated two-box PAPI system fulfills all of the visual glide slope requirements foruse on short runways where the five incremental paths provided by the four-box PAPIsystem are not needed. It was also determined that four-box PAPI system signalscan be resolved and interpreted at a range of 4 nautical miles when the boxes areseparated by at least 20 feet, and the signals can be resolved at a range of 2nautical miles when the boxes are separated by a miniuma of 10 feet.
v
, n I I l- - -i I . .. . .f . ... .. . .. ....
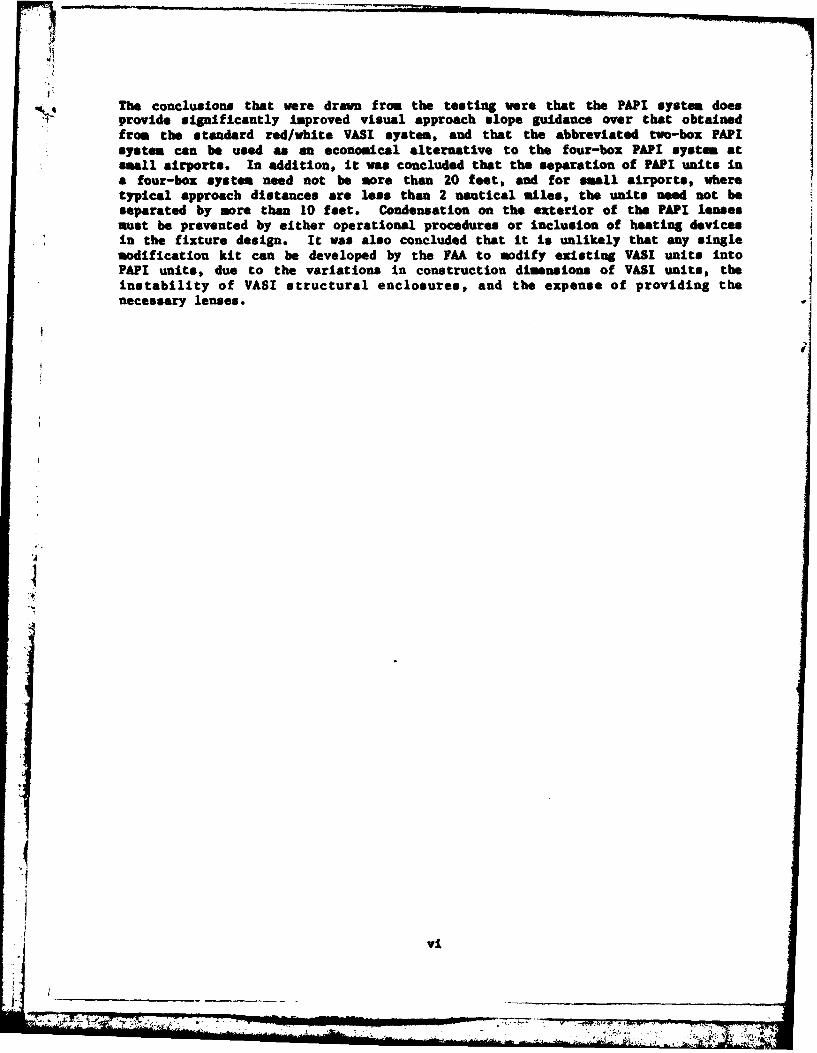
"0 The conclusions that vere drawn from the testing were that the PAPI system doesprovide significantly improved visual approach slope guidance over that obtainedfrom the standard red/white VASI system, and that the abbreviated two-box PAPIsystem can be used as an economical alternative to the four-box PAP! system atsmall airports. In addition, it was concluded that the separation of PAP! units ina four-box system need not be more than 20 feet, and for small airports, wheretypical approach distances are less than 2 nautical miles, the units need not beseparated by more than 10 feet. Condensation on the exterior of the PAP! lensesmust be prevented by either operational procedures or inclusion of heating devicesin the fixture design. It was also concluded that it is unlikely that any singlemodification kit can be developed by the FAA to modify existing VASI units intoPAPI units, due to the variations in construction dimensions of VAST units, theinstability of VASI structural enclosures, and the expense of providing thenecessary lenses.
vi
I~
INTRODUCTION
PURPOSE.
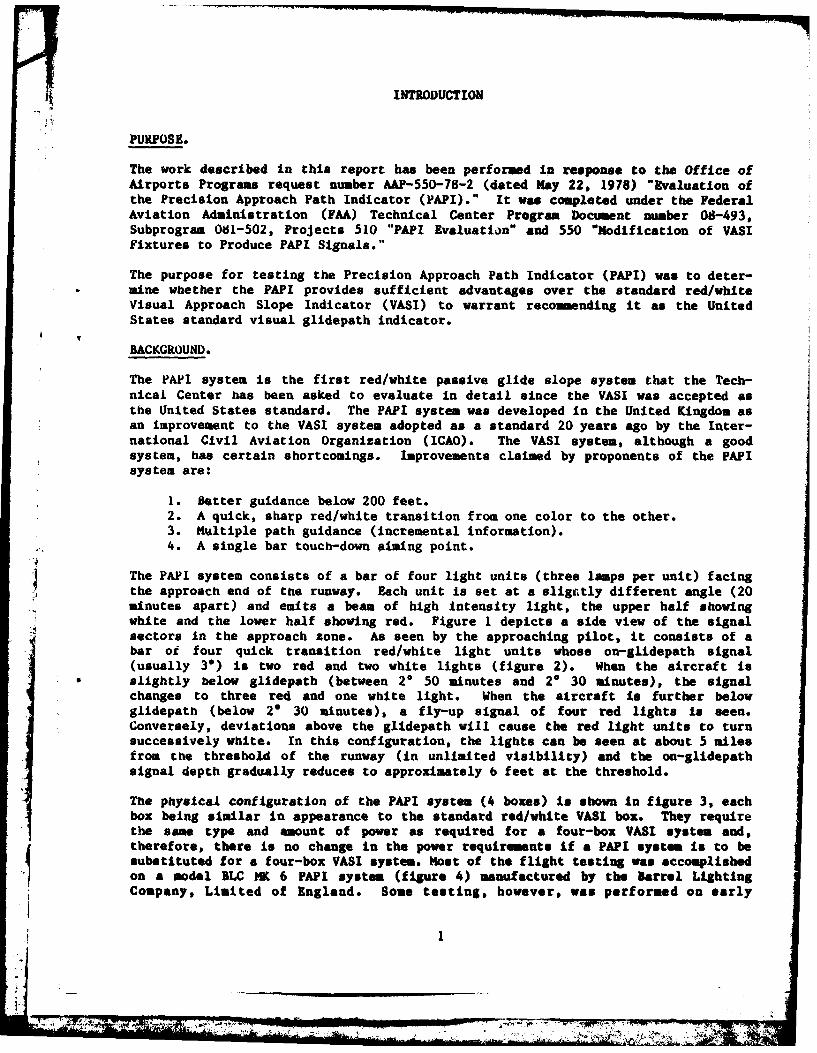
The work described in this report has been performed in response to the Office ofAirports Programs request number AAP-550-78-2 (dated Nay 22, 1978) "Evaluation ofthe Precision Approach Path Indicator (PAPI)." It was completed under the FederalAviation Administration (FAA) Technical Center Program Document number 08-493,Subprogram 081-502, Projects 510 "PAPI Evaluation" and 550 "Modification of VASIFixtures to Produce PAPI Signals."
The purpose for testing the Precision Approach Path Indicator (PAPI) was to deter-mine whether the PAPI provides sufficient advantages over the standard red/whiteVisual Approach Slope Indicator (VASI) to warrant recommending it as the UnitedStates standard visual glidepath indicator.
BACKGROUND.
The PAII system is the first red/white passive glide slope system that the Tech-nical Center has been asked to evaluate in detail since the VASI was accepted asthe United States standard. The PAPI system was developed in the United Kingdom asan improvement to the VASI system adopted as a standard 20 years ago by the Inter-national Civil Aviation Organization (ICAO). The VASI system, although a goodsystem, has certain shortcomings. Improvements claimed by proponents of the PAPIsystem are:
1. Better guidance below 200 feet.2. A quick, sharp red/white transition from one color to the other.3. Multiple path guidance (incremental information).4. A single bar touch-down aiming point.
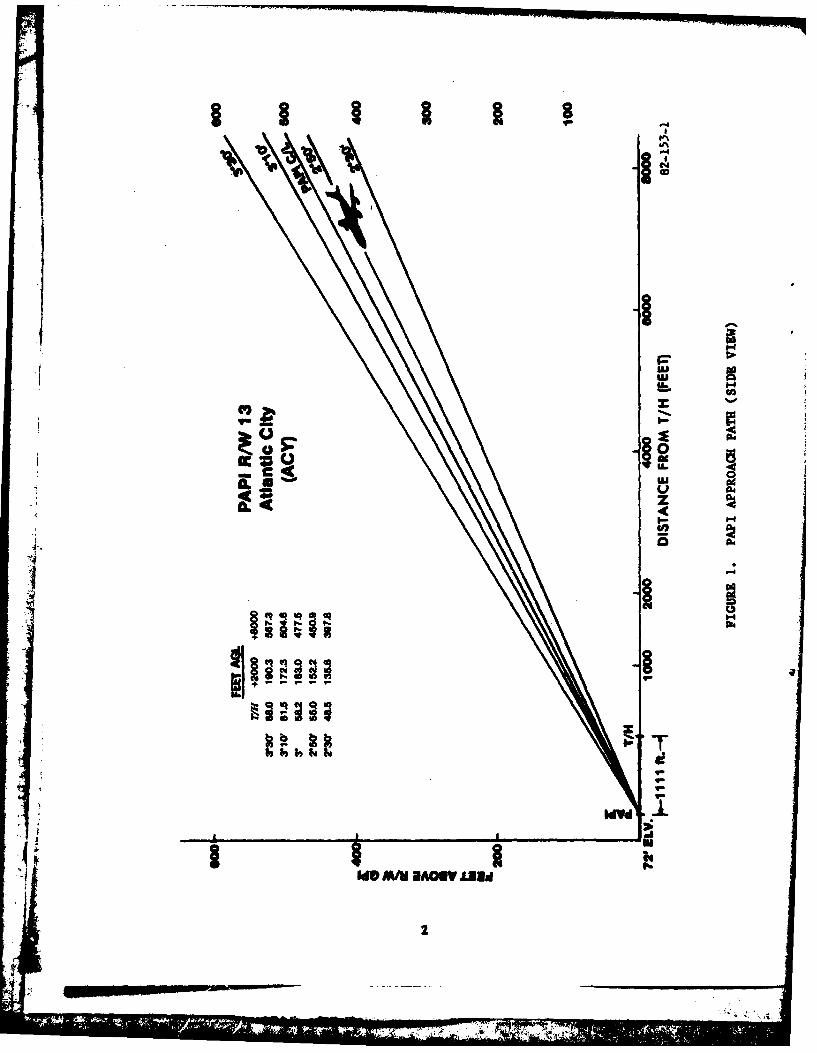
The PAPI system consists of a bar of four light units (three lamps per unit) facing-J the approach end of the runway. Each unit is set at a sligktly different angle (20
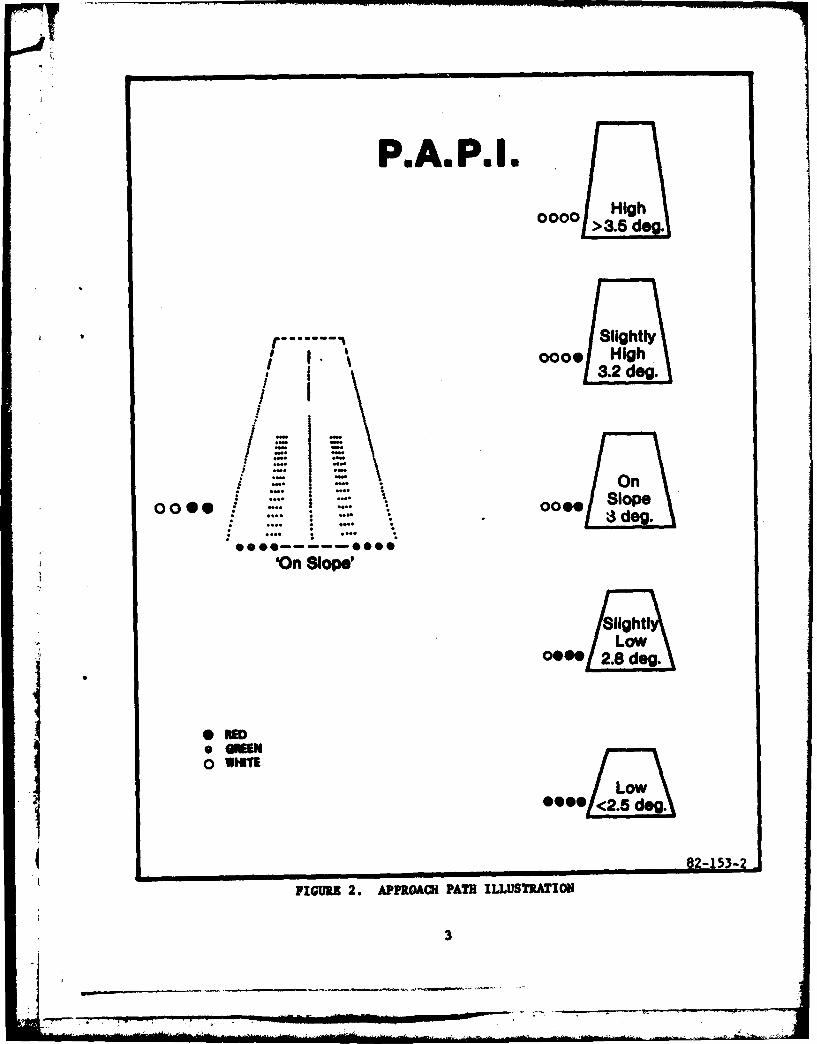
minutes apart) and emits a beam of high intensity light, the upper half showingwhite and the lower half showing red. Figure 1 depicts a side view of the signalsectors in the approach zone. As seen by the approaching pilot, it consists of abar or four quick transition red/white light units whose on-glidepath signal(usually 3*) is two red and two white lights (figure 2). When the aircraft isslightly below glidepath (between 2* 50 minutes and 2° 30 minutes), the signalchanges to three red and one white light. When the aircraft Is further belowglidepath (below 2° 30 minutes), a fly-up signal of four red lights is seen.Conversely, deviations above the glidepath will cause the red light units to turnsuccessively white. In this configuration, the lights can be seen at about 5 milesfrom the threshold of the runway (in unlimited visibility) and the on-glidepathsignal depth gradually reduces to approximately 6 feet at the threshold.
The physical configuration of the PAPI system (4 boxes) is shown in figure 3, eachbox being similar in appearance to the standard red/white VASI box. They requirethe same type and amount of power as required for a four-box VASI system and,therefore, there is no change in the power requirements if a PAPI system is to besubstituted for a four-box VASI system. Most of the flight testing was accomplishedon a model BLC HK 6 PAPI system (figure 4) manufactured by the Barrel LightingCompany, Limited of England. Some testing, however, was performed on early
!1
- --. 2
44 6= U
we m AOGVIslw
0?, 7
i0 I
HIgh
>3.5 dog.
I. SlightlyI I- t oooe High
3.2 dog.On/ I
000 .O0000
I
0 "-
00. : I: .... .. deu,
*oo... ... *oodog~'On Slope'
o amO WHWI
Low000dog.
82-15-2
FIGUR 2. APPROAI PATH ILLUSTRATION
:' I I - ;--- ' -' . .. " = ' '" .. .: . .. -3
A
-.
'-4h4
hi
'C
j-4
U)
U)
'-4
1En
p'-4Em.
(I
3
'I
4
______
"1~~~
1.4
t-4
sad
ipIII0
versions of PAPI units built by ADB of Belgium and by Crouse-Ninds, Syracuse, New
York (figure 5).
NWEOP OF APPROACH
Testing of the PAPI system was performed in two parts. Part one consisted ofphotometric, signal configuration, and environmental testing covering thefollowing:
1. Photometric tests.2. Condensation tests.3. Transition zone shifting tests.4. Obstacle clearance tests.5. Beam width tests.6. Modification of VASI units to produce PAPI signals (sharp
color transition).
Part two consisted of flight evaluation of PAPI systems at the FAA TechnicalCenter, Atlantic City Airport, New Jersey and at other operational airports asfollows:
1. Flight testing with the PAPI located coincident with the ILSGlidepath Intercept (GPI) point at the Technical Center (ACY).
2. Flight testing with the PAPI located 300 feet beyond the 11.5
GPI at Newark International Airport, New Jersey (dR).
3. Flight testing at Teterboro Airport, New Jersey (TO) (no ILS).
4. Flight testing at Bader Field, New Jersey (AIY) (no I1.5).
5. Flight testing of a Two-Box PAPI at ACY.
b. PAPI signal resolution testing at ACY.
PHOTOMETRIC AND INVOIIINTAL TESTING (PART I)
PHOTOETRIC TESTS.
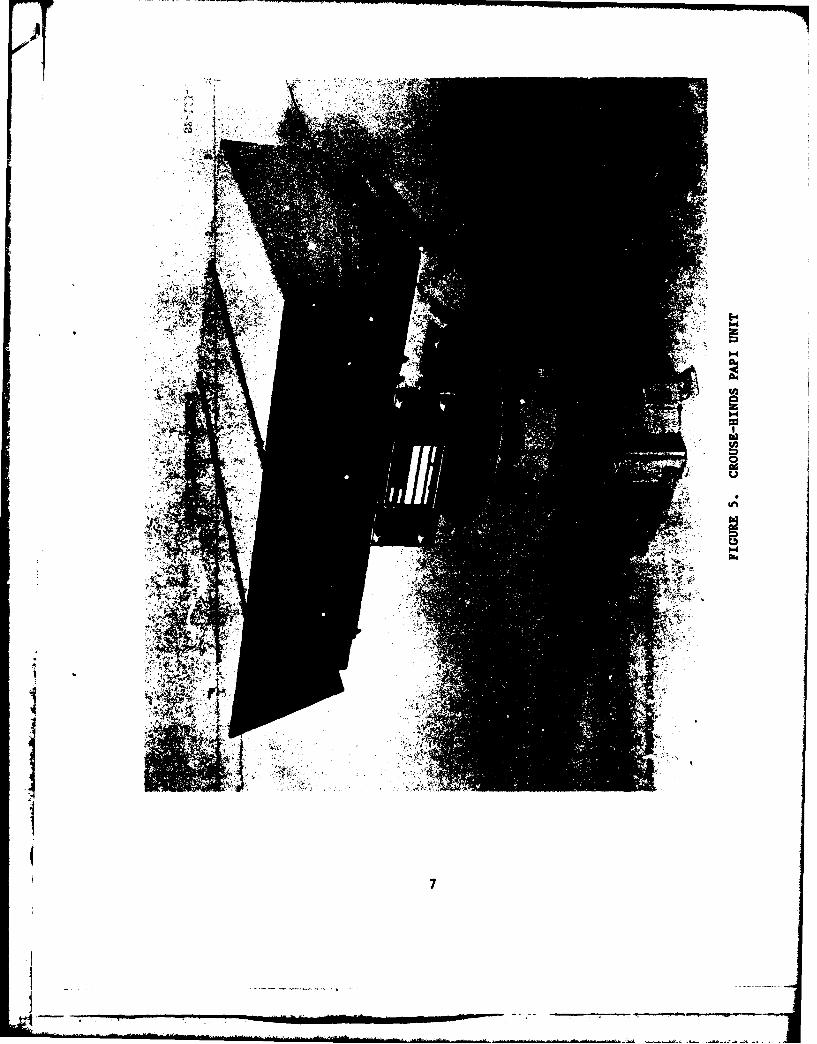
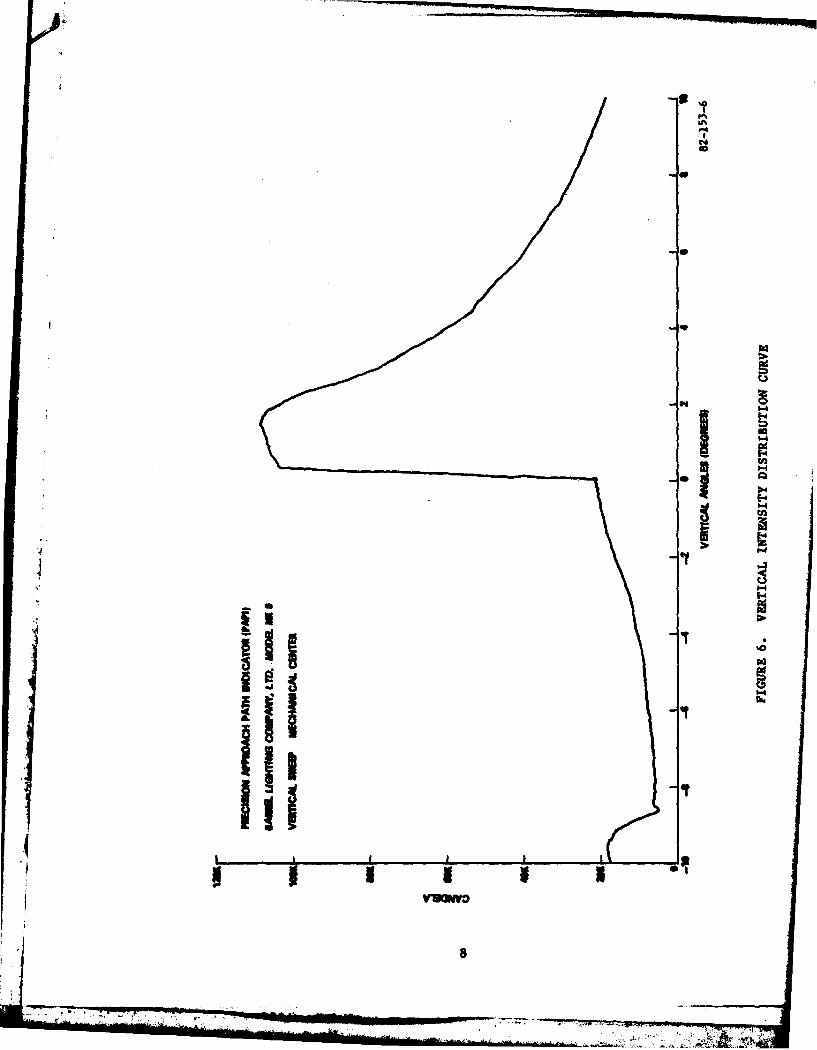
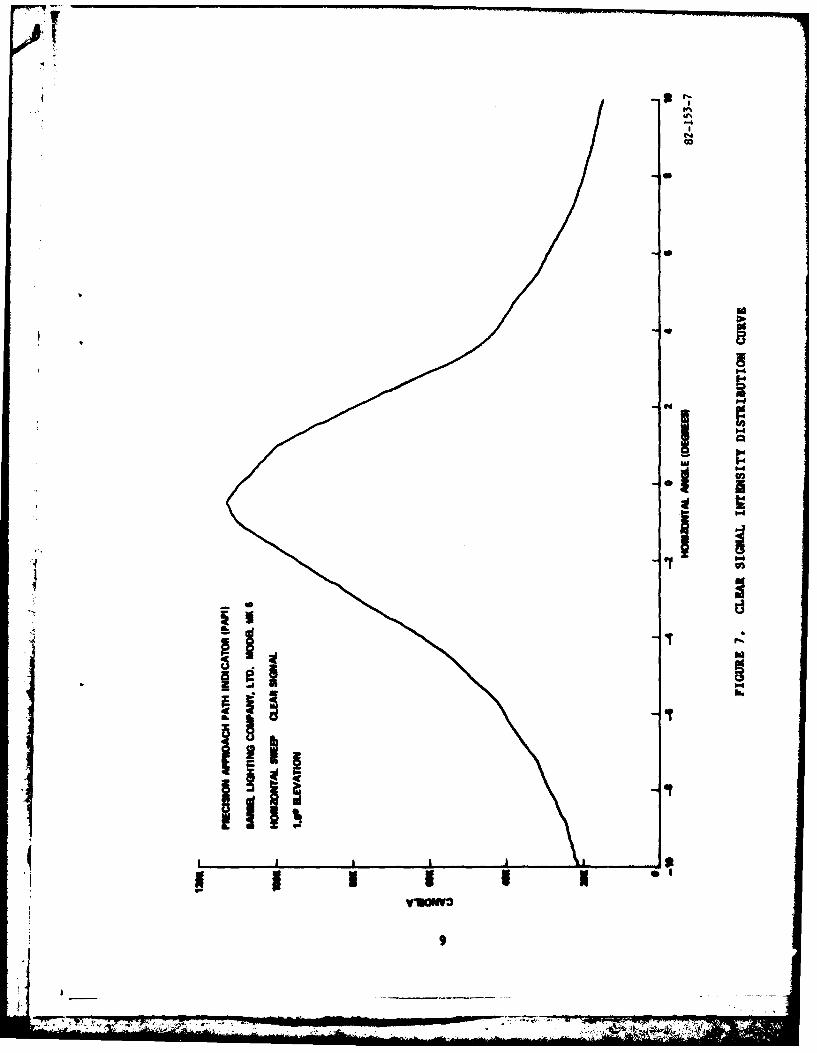
Photometric measurements were made on the Barrel Lighting Co. PAPI fixture, Thelamps are standard 30 volt, 200 watt, Z00PAR locomotive Iamps. Horizontal andvertical intensity distribution easurents were obtained for the units. Figure 6
shows the vertical beam distribution of both the red and the white signals of onePAPI unit when measured from minus 10 degrees to a plus 10-degree elevation. Italso displays the quick transition (approximately 3 minutes of arc) from one colorto the other. Figures 7 and 8 show the horizontal intensity distribution of thewhite and red signals, respectively, taken at peak beam intensity. The peakintensity of the white signal, occurring at 1.5° elevation, was 112,000 condelasand the peak intensity of the red signal, occurring at 0* elevation, was 22,000candelas. Transmittance tests were made on the red filters of the Barrel unit, and
6
(7F7
C.'0
0
.4 0'-4
1 '.4
Ii'-4
- 1511 1C4
Iii It
p 1 ru,!a N
-------
0-4
0-
41
v Now*
ID
-4.
040
'-4
'-4
O-4
to6-
this was found to be 21 1/4 percent in the cold condition which mats acceptable
standards.
COIDOSATIOU TISTS.
Because the PAPI systems use lenses to improve the signals, and since these lensesare usually exposed to the weather, particular attention ms paid to the possibil-Ity of condensation forming to obscure the correct signal. The weather conditionswere monitored carefully for high humidity periods that would create this problemand field observations made accordingly. During the early work on PAPI systems, itwas determined that the Belgian ADI PAPt units tended to form condensation upon theexposed frontal surfaces of the lenses during high humidity conditions while thesystem was deenergized. Upon energixation, diffusion and mixing of the projectedcolors created a broad "pink" signal which could not be easily interpreted.Correct color signals were restored within 15 minutes after turning the PAPl uniton as the heat from the lamps dissipated the accumulated moisture.
In order to test this atmospheric moisture condition on the PhPI units, man-madefog or condensation was created by soaking the units in a temperature chamber atlow temperatures (30* F) and then immediately subjecting them to normal roomtemperatures that were at least 30" P higher and more humid. This created conden-sation on the units, similar to that observed when a bathroom mirror fop up aftera shower. The following four condensation tests were performed to determine theoperational conditions under which condensation, with resultant signal deteriora-tion, would or would not occur.
For the initial test, both the British Barrel Lighting Company Limlted HK 6 and theBelgian ADB units were installed in the walk-in temperature/humidity chamber(figure 9) in such a ianner that their signals could be seen through the glassviewing port. After the units were cold soaked at 30 ° F for 2 hours with the lampsdeenergized, the chamber door was opened and warm humid air was allowed to enterthe chamber. The exterior lens surfaces of both PAPI units were almost immediatelycovered with condensation, resulting in a uniform distortion of the projectedsignal that was perceived as a pink overall signal. The units were energized at6.6 amperes intensity at this time. The ADB unit displayed a deeper pink hue sinceIts red filters are normally a deeper red hue than those of the Barrel unit. Theinteriors of the boxes were then checked and virtually no internal condensation wasfound. Within 1/2 hour, the lenses of both units were clear of any condensationand normal signal presentations were evident.
The second test was conducted In the same manner, except that the heaters in theBarrel unit were energized during the cold soak preparation. No heaters wereprovided with the ADS unit. After soaking the units at 30 F for 2 hours with thelamps off, the chamber door was again opened to the warm air (72' F) and 61 percentrelative humidity. Condensation again immediately formed on the glass front ofboth units and the sm signal anomolies were observed for a period of approx-Imately 1/2 hour. The Barrel unit heater did not appear to have any significantremedial effect under these extreme temperature differential conditions.
For the third test, the units were again soaked for 2 hours at 30" F, with theheaters energized in the Barrel unit and, this time, with the lamps of both unitsoperating on step 5 (6.6 amperes) intensity during the cold soak preparation.After the door of the chamber was opened to the warm (746 F) temperature (61percent relative humidity), it was observed that no condensation formed on thefrontal lens surfaces of either unit.
0:711
I'Ii. ..
iI
IFIGURE 9. ENVIRONMENTAL TESTING OF PAIl UNITS
12
IiI ____________________________________________________
1~~ __
For the fourth test, the above conditions were repeated with the only change beingthat the intensity of the lamps was set at step 3 (4.1 amperes). After opening thedoor to the room atmosphere, temperature 71* F and relative humidity of 56 percent,small amounts of condensation formed on the center lens of the Barrel unit and onthe dADB plexiglas shield. Condensation cleared within 10 minutes and normal signalpresentations were restored.
From the above tests, it can be seen that, even under these extreme conditions,leaving the units energized for 30 minutes before use will serve to dissipate anyformation of condensation due to temperature and humidity changes.
During the period of October through December 1981, freezing and near freezingweather, with attendant fog and high humidity conditions, occurred at the TechnicalCenter. Observations as to the effects of such naturally occurring conditions uponsignal projections from field installed PAPI systems were made and recorded on boththe Barrel and Crouse-Hinds manufactured lighting fixtures. The PAPI units werenumbered consecutively so that number I was the inboard unit and number 4 was theoutboard unit.
Typically, the official weather report at 0800 hours was overcast, temperature 35,due point 35, light drizzle and fog. Both Barrel and Crouse-Hinds units, in-stalled to serve runway 4, were monitored with units 1 and 2 continuously operatingand units 3 and 4 deenergized. Correct colors and signals were observed on units 1and 2. Units 3 and 4 had droplets of water on the inside of the lenses and aboutL/2 inch of snow on the lower portion of the outside of the lenses. Number 3 was
then energized to step 5 (6.6 amperes) and it was observed that the projectedsignal color was a pinkish white through all vertical angles. This pink signal, asviewed by a pilot, could have been interpreted to be white, giving a false 'flydown' signal. A dangerous condition. Step 5 intensity operation for approximately4 minutes with the Crouse-Hinds units and approximately 10 minutes with theBarrel units (no heaters) dissipated the condensation from the lenses and restoredthe proper signal presentation. Number 4 units were then energized to step 5intensity and the same results were noted.
During many non-operational periods, ice was found on the sides of the PAPI unitswith no ice formed on the lenses, or functional portion of PAPI. The design of theunits, with the lenses recessed under an overhang, served to keep the lensesclear.
This freezing condensation problem is recognized by the manufacturers and theBarrel units have heaters installed close to the lenses in an attempt to preventthis condition. The Crouse-Hinds units are extremely compact and the heat from thelamps develops quickly to eliminate this condition within a few minutes afterenergization. Because this problem can be expected to occur with any PAPr unit,specifications should be written to include means for preventing such an occurance.
TRANSITION ZONE SHIFTING TESTS.
In order to check for possible transition zone shifting in the vertical plane, dueto changes in temperature and/or humidity, tests under varying environmentalconditions were performed.
One of each of the Barrel and the ADB PAPI units were placed In the temperature/humidity chamber (figure 9) in such a manner that their light signals were pro-jected through the viewing port with the red/white transition zone clearly
13
displayed 24 feet fram the units. Lines were marked on a wall at the preciselocation of the transition zone for each unit. Both units, with lamps deeergized,were then heat soaked for 24 hours at 131 ° F and 95 percent humidity. After thesoaking, the unite were energized and the position of the transition zone noted.The ADD unit transition zone had not shifted at all, although the zone was slightlylees well defined. The Barrel unit transition zone had shifted upward 3/16 of aninch with the zone just as distinct as before the soaking. The lamps were left ONfor 1/2 hour and then turned OFF for 1/2 hour. They were then turned back ON andit was found that the transition zones had not shifted. The units were thendeenergized and left OFF for 24 hours at a normal room temperature and humidity..After this 24-hour period, the light transition zones were again checked and it wasfound that the Barrel unit transition zone had returned to its original position.The ADB unit transition zone displayed no evident shifting during the entire testprocedure.
From the above test, it can be seen that the Barrel system, under high temperatureand humidity conditions, may exhibit a transition zone shift of approximately 2 1/4minutes of arc upward. This is equivalent to 7.81 inches upward at a distance of1000 feet from the unit, or 6.51 feet upward at a range of 2 miles. This transi-tion zone shifting, even with such extreme temperature and humidity changes, isnot of sufficient magnitude to be considered an operational problem.
OBSTACLE CLEARANCE TESTS.
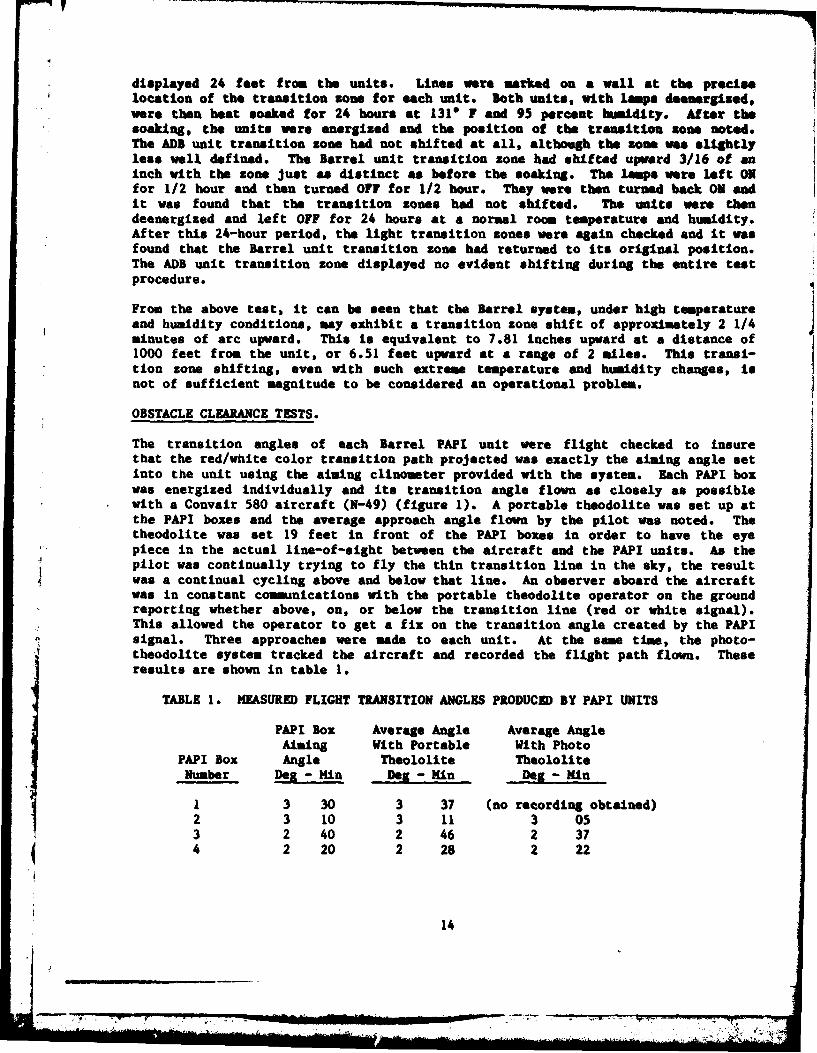
The transition angles of each Barrel PAPI unit were flight checked to insurethat the red/white color transition path projected was exactly the aiming angle setinto the unit using the aiming clinometer provided with the system. Each PAPI boxwas energized individually and its transition angle flown as closely as possiblewith a Convair 580 aircraft (N-49) (figure 1). A portable theodolite was set up atthe PAPI boxes and the average approach angle flown by the pilot was noted. Thetheodolite was set 19 feet in front of the PAPI boxes in order to have the eyepiece in the actual line-of-sight between the aircraft and the PAPI units. As thepilot was continually trying to fly the thin transition line in the sky, the resultwas a continual cycling above and below that line. An observer aboard the aircraftwas in constant communications with the portable theodolite operator on the groundreporting whether above, on, or below the transition line (red or white signal).This allowed the operator to get a fix on the transition angle created by the PAPIsignal. Three approaches were made to each unit. At the same time, the photo-theodolite system tracked the aircraft and recorded the flight path flown. Theseresults are shown in table 1.
TABLE 1. MEASURED FLIGHT TRANSITION ANGLES PRODUCED BY PAPI UNITS
PAPI Box Average Angle Average AngleAiming With Portable With Photo
PAPI Box Angle Theololite TheololiteNumber D min De - Kin Des - in
1 3 30 3 37 (no recording obtained)2 3 10 3 11 3 053 2 40 2 46 2 374 2 20 2 28 2 22
14
II I Imom-,
As shown above, the differences in the recorded angles and the clinometer setaiming angles was never more than 8 minutes of arc.
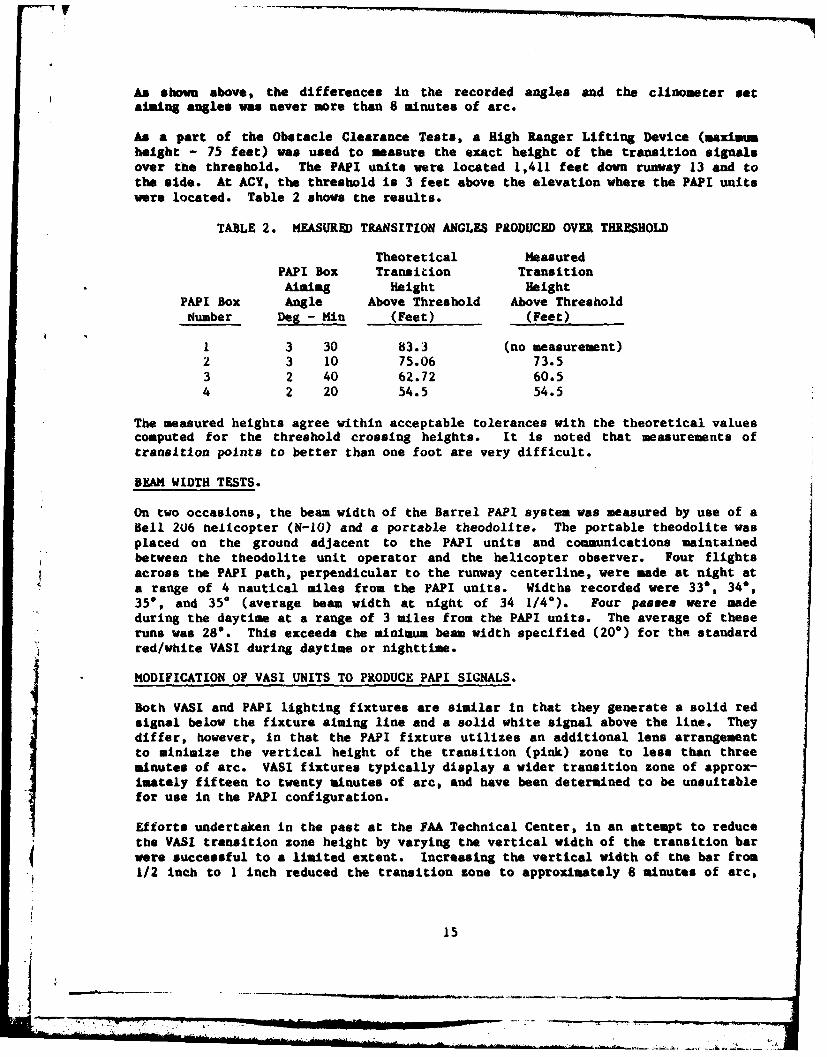
As a part of the Obstacle Clearance Tests, a High Ranger Lifting Device (maximumheight - 75 feet) was used to measure the exact height of the transition signalsover the threshold. The PAPI units were located 1,411 feet down runway 13 and tothe side. At ACY, the threshold is 3 feet above the elevation where the PAPI unitswere located. Table 2 shows the results.
TABLE 2. MEASURED TRANSITION ANGLES PRODUCED OVER THRESHOLD
Theoretical MeasuredPAPI Box Transition TransitionAiming Height Height
PAPI Box Angle Above Threshold Above ThresholdNumber Deg - Min (Feet) (Feet)
1 3 30 83.3 (no measurement)2 3 10 75.06 73.53 2 40 62.72 60.54 2 20 54.5 54.5
The measured heights agree within acceptable tolerances with the theoretical valuescomputed for the threshold crossing heights. It is noted that measurements oftransition points to better than one foot are very difficult.
BEAM WIDTH TESTS.
On two occasions, the beam width of the Barrel PAPI system was measured by use of aBell 206 helicopter (N-1O) and a portable theodolite. The portable theodolite wasplaced on the ground adjacent to the PAPI units and communications maintainedbetween the theodolite unit operator and the helicopter observer. Four flightsacross the PAPI path, perpendicular to the runway centerline, were made at night ata range of 4 nautical miles from the PAPI units. Widths recorded were 330, 340,35, and 35* (average beam width at night of 34 1/4*). Four passes were madeduring the daytime at a range of 3 miles from the PAPI units. The average of theseruns was 28. This exceeds the minimum beam width specified (20*) for the standard
N' red/white VASI during daytime or nighttime.
MODIFICATION OF VASI UNITS TO PRODUCE PAPI SIGNALS.
Both VASI and PAPI lighting fixtures are similar in that they generate a solid redsignal below the fixture aiming line and a solid white signal above the line. Theydiffer, however, in that the PAPI fixture utilizes an additional lens arrangementto minimize the vertical height of the transition (pink) zone to less than threeminutes of arc. VASI fixtures typically display a wider transition zone of approx-imately fifteen to twenty minutes of arc, and have been determined to be unsuitablefor use in the PAPI configuration.
Efforts undertaken in the past at the FAA Technical Center, in an attempt to reducethe VASI transition zone height by varying the vertical width of the transition bar
Iwere successful to a limited extent. Increasing the vertical width of the bar from1/2 inch to I inch reduced the transition zone to approximately 8 minutes of arc,
15
with an attendent but yet acceptable reduction of signal intensity within thetransition zone. Attempts under this project effort to further increase the widthof the transition bar beyond I inch, however, resulted in much greater transitionzone signal attenuation, to the extent that a resultant weak signal was perceived,from a distance, to be no signal at all. Substitution of unfluted clear and redfilters, to narrow the emitted beam spread and increase signal intensity, did notprovide sufficient enhancement of the weak transition zone display to render ituseable, and narrowed the system horizontal coverage to the point of being insuffi-cient for operational use. These results demonstrated that the VASI fixturescannot, through modification of the transition bar width alone, be rendered suit-able for use in the PAPI configuration.
Considerable work was then performed in an attempt to modify standard red/whiteVASI boxes with installed lenses to produce the quick transition of signals. Twomanufacturer's types of VASI units, General Electric and Sylvania, were availablefor experimentation, and the first modification attempts were performed on theGeneral Electric VASI boxes.
Three types of projection lenses were considered for use. They were:
Type I: Glass plano-convex spherical lensesType II: Plastic flat circular-zoned lensesType III: Glass or plastic cylindrical lenses
Among the three types of lenses, type III lenses were considered because they wouldhave been compatible with the spread lenses usually found in existing VASI boxesand would have given the same width to height ratio with the required intensitypattern. However, costs of such lenses (approximately 500 each) was considerednot cost beneficial for a VAST to PAPI modification and therefore were eliminatedfrom further consideration.
Several diameters and focal lengths of both types I and II lenses were used. EachAhas its own advantages and disadvantages which can be ascertained by a study of
each manufacturer's lenses. The type I 6-inch diameter lens was chosen as the bestcompromise between cost and weight versus maximum utilization of the light comingfrom the 8-inch diameter lamps and filters used in VAST boxes.
Twelve type I lenses, with nominal 6-inch diameter and 17-inch focal lengths, weremounted securely in split-ring holders with hose clamps around the rings to assurestability when mounted in the VASI boxes.
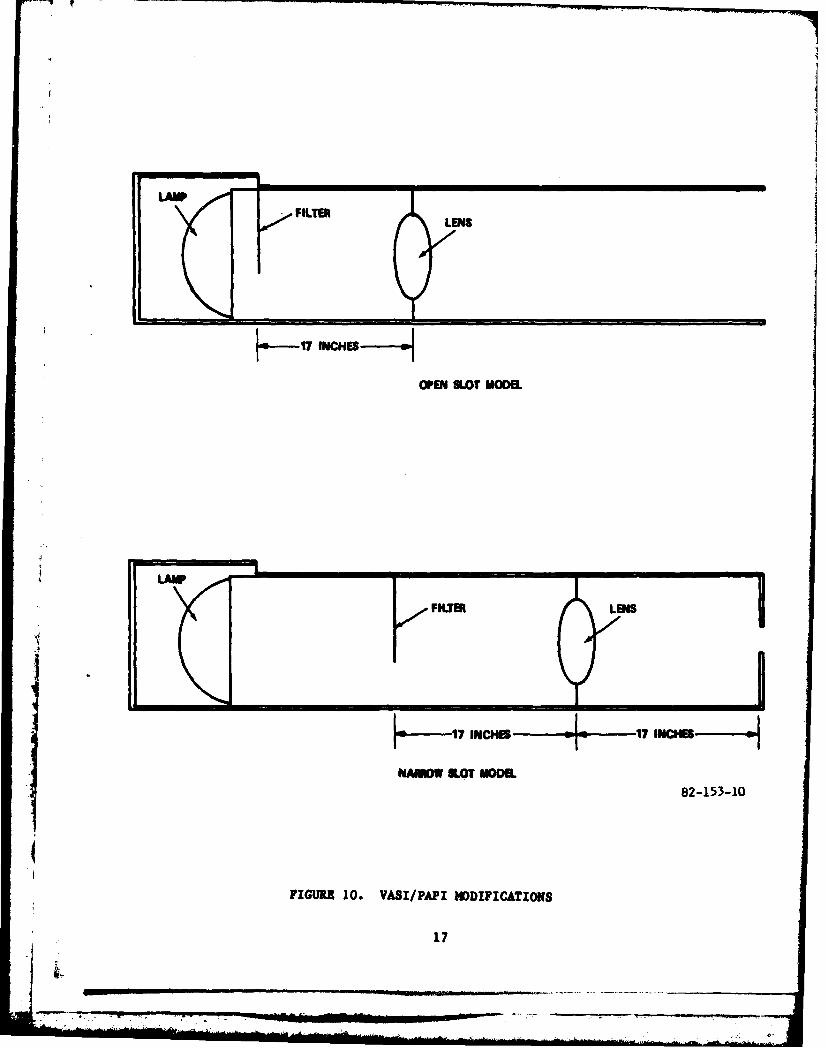
Two types of modifications were then devised, each suited to a unique lens mountingposition (figure 10). Sylvania VASI boxes were used in these experiments, witheach modification designated as either the "open slot" model or the "narrow slot"model.
The "open slot" model mounting arrangement of the optical components includedunfluted red filters in their normal mounting positions, with the 6-inch lensesmounted at the focal length, 17 inches forward of the red filters. The normal2-inch slotted front face of the VASI box was completely removed, leaving the frontof the box open.
The "narrow slot" model design required that the 6-inch lenses be moved forward sothat the focal length plane was coincident with the normal 2-inch slot on the frontof tre box to insure maximum signal emission through the 2-inch slot. The lens,
16
" NI-' "-. I W
LAW7
LA - FILTER LENS
OPEN SLOT MODEL
LAWE
1INCHES 17 INCHE
NAMOW IOT MOOEL82-153-10
FIGUUZ 10. VASI/PAPI MODIFICATIONS
17
therefore, vas located 17 inches in back of the 2-inch slot with the red filter 17inches to the rear of the lens, as shown in figure 10.
Prototypes of the above two models were then installed on runway 13 at the Tech-
nical Center, side by side, and flight checked for proper signals. Pilot opinion-indicated that both modified units displayed a signal closely approximating that ofcommercially available PAPI systems, and it was decided to fabricate a full four-box PAPI system from the design that was easiest to make and least costly. Theopen slot" model was chosen as the most practical design.
Four Sylvania boxes were modified with the addition of 17-inch focal length, 6-inchdiameter, fire-polished glass lenses (type I) in each box located at the focallength distance from the flat glass red filters. The red filters were left intheir original positions. The front face material at the slot end of the boxes wasremoved allowing the signal to be properly beamed through the open end of the VASTbox. The added lenses were mounted in a metal frame which blocked any stray lightand added considerable strength to the VASI boxes.
The modified units were mounted in a PAPI configuration on the left side of runway13, with the Crouse-Hinds PAPI units mounted on the right side for comparison. Nostandard means of setting the angles of the VASI/PAPI boxes was provided for inthese experiments and the aiming angles of the units were set by use of a portabletheodolite. It should be noted that this modification kit was installed inSylvania VASI units, and that VASI units of different manufacture would probablyrequire unique modification techniques.
Subsequent flight testing verified that the modified units functioned as wellas the Crouse-Hinds PAPI units by providing the typical PAPI quick transitioncharacteristics. Mathematical calculations indicated that the horizontal beamwidth of the modified VASI units would be, in theory, only slightly narrower thanthat of a standard PAPI system; flight tests confirmed this calculation.
FLIGHT TESTING (PART I)
FLIGHT TESTING AT THE TECHNICAL CENTER.
An informal interim report entitled "Evaluation of PAPI by the U.S.A." sent to Air-i ports Standards (AAS-200) on 7-1-80 (appendix A), describes in detail the PAPI
system flight testing conducted at the Technical Center before 7-1-80.
To summarize this report, the PAPI system was installed on the right hand side ofrunway 13, adjacent to the Glidepath Intercept (GPI) point, 1,111 feet down fromthe runway threshold, and 108 tracked approaches were made by FAA test pilots whileusing the PAPI system. The usable height, accuracy, compatibility with the ILS,pilot acceptance and other related issues are discussed in appendix A. The con-clusions of 12 test pilots flying an Aero-Commander, a Gulfstream G-159, a Convair
580 and a Convair 880 were that 58 percent preferred PAPI, 42 percent thought PAPIand VASI were about the same and none preferred VASI over PAPI. Tracking of theaircraft was accomplished by a phototheodolite system.
18
'11
I
During the flight testing at the Technical Center, pilots were instructed to dis-regard ILS glide slope indications and to derive vertical approach slope guidancefrom the PAPI visual presentation only. In fact, during October 1980, 32 specialflights were made with the ILS system in the aircraft turned off during the
approach phase of flight. No significant differences were noted in the resultsof this portion of the flight testing as compared to tests where the ILS avionicswas operated.
FLIGHT TESTING AT NNEARK INTERNATIONAL AIRPORT, NJ (WR).
An interim report, DOT/FAA/RD-81/95, dated December 1981 (appendix B) details theevaluation of PAPI when located to take into account the large eye to ILS antennaseparation associated with wide-bodied aircraft. Four months of inservice testingwas accomplished at Newark (EWR) (runway 4R) where pilots of wide-bodied aircraft
compared the PAPI to the standard red/white VASI system.
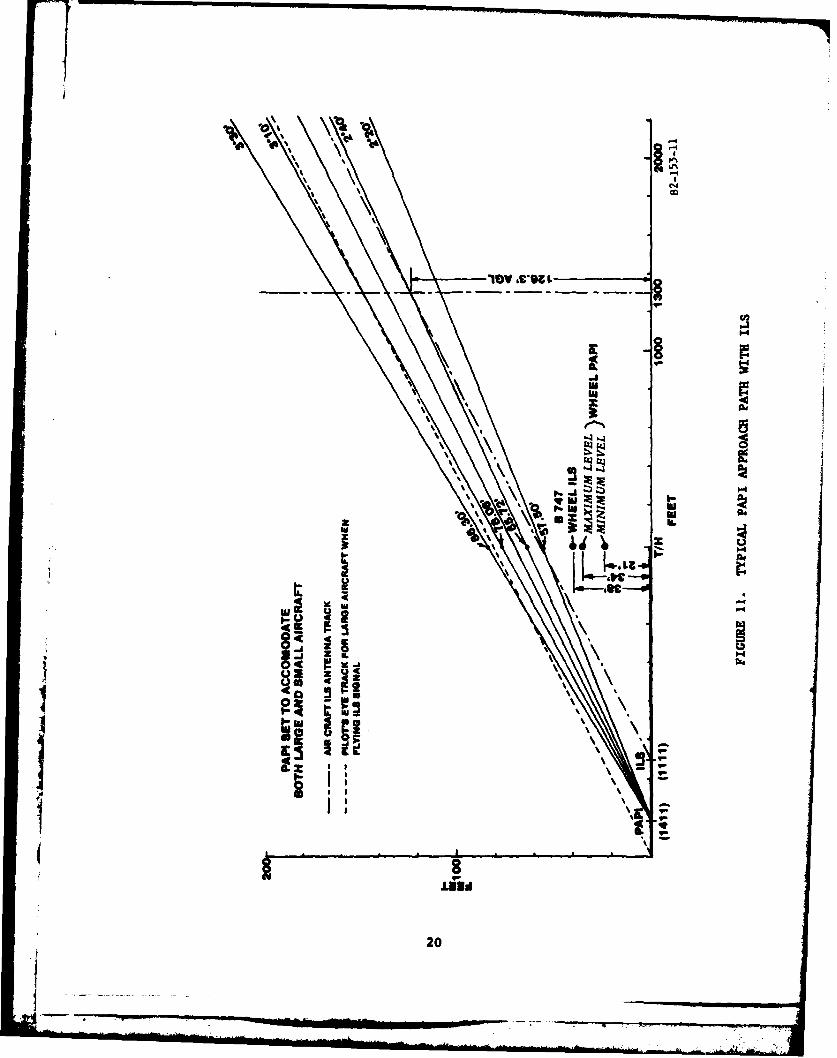
Special attention was given to the use of a PAPI system with large aircraft with an
operating ILS system (figure 11). The on-course PAPI signal (two red and twowhite) was compatible with the ILS glide slope indications for all aircraft (large
and small) from as far out as the lights could be seen (about 5 miles) to a
point approximately 1300 feet from the threshold. At this point, pilots of wide
bodied aircraft, following the ILS, saw three white and one red light due to thelarge eye-to-antenna separation. Pilots of small aircraft saw three red and one
white at this point, due to small eye-to-antenna separation. All aircraft there-fore could use the PAPI without special interpretation to a point 1300 feet fromthe threshold, still on the ILS glide slope, with an "on-course" indication. This
is diagrammed ii figure 11. The United States presently does not recommend that avisual glide slte be used in conjunction with an ILS system (Handbook 6850.2).Under these condi ions at ZI, 61 percent of the pilots flying wide-bodied aircraft
(with large eye-to-antenna separation, and landing with an ILS system) pr.-Ctrred
PAPI over the VASI system. An additional 28 percent of the pilots felt that thePAPI and VASI systems were equally effective. The rest of the pilots (11 percent)
preferred the VASI system.
FLIGHT TESTING AT TETERBORO AIRPORT, NJ (TEB).
In order to obtain opinions from the General Aviation segment of the aviation
community, a 3-month inservice test of PAPI war conducted at Teterboro Airport.A data report was issued in February 1982 detailing the test results at Teterboro
Airport and is included as appendix C to this report.
Although a great deal of interest in the PAPI was evidenced, only 17 completedquestionnaires (out of approximately 300 distributed) were returned for analysis.Because of this, additional inservice testing, to obtain General Aviation user
input, was later conducted at another airport (see Flight Testing at Bader Airport,
Atlantic City, New Jersey, in this report). In order to maintain conformity the
same questionnaire format was used for all flight testing of the PAPI system.
At least 75 percent of the pilots that completed questionnaires were corporate orbusiness pilots, and responses covered both daytime and nighttime approaches.
The results, summarized, indicated that 88 percent of the pilots felt the PAPI
system to be superior to the VASI in overall effectiveness. The remaining 12
percent of the pilots felt that the PAPI was at least equal to the VASI in overalleffectiveness, and superior in some respects.
19
___ __ __ __
0~ ~ \
444
, L . I,
I R
tt
Jana4
20 ,o
i
J I~d
.. .. ... " i ' i n I i I | i I k .I ...*\ . I .i
FLIGHT TESTING AT BADER FIELD, ATLANTIC CITY, NJ (AIY).
In order to expand the Input from General Aviation pilots, 3 months of inserviceflight testing was performed at Bader Field (AIY). The PAPI system was installed375 feet from the threshold; on the left hand side of runway 11. The BarrelLighting Co. Ltd. PAPI units used at AIY were the same as those used in theprevious flight testing at other airports. The inboard unit was located 50 feetfrom the edge of the runway with a lateral separation of 33 feet between adjacentunits (figure 3). The Questionnaires (same ones used at 511, TED, and AIY), andApproach Path Illustrations (figure 2) were furnished by the Atlantic City AirportAdministrator.
During the testing period, construction work on the airport required that, attimes, the 2950-foot runway be shortened to 2350 feet. The PAPI system was not inoperation whenever the runway threshold was so displaced. As requested by many ofthe local pilots, and concurred with by Eastern Region personnel, the PAPI on-course signal was set at 4 degrees, due to the existance of a relatively shortrunway, predominantly small aircraft landing at steep angles, and obstacles in theapproach zone. The unit aiming angles were separated by 20 minutes of arc startingat 4* 30 minutes for the high angle. Thus, the low transitions were set at 40 10minutes, 3* 50 minutes, and 3° 30 minutes.
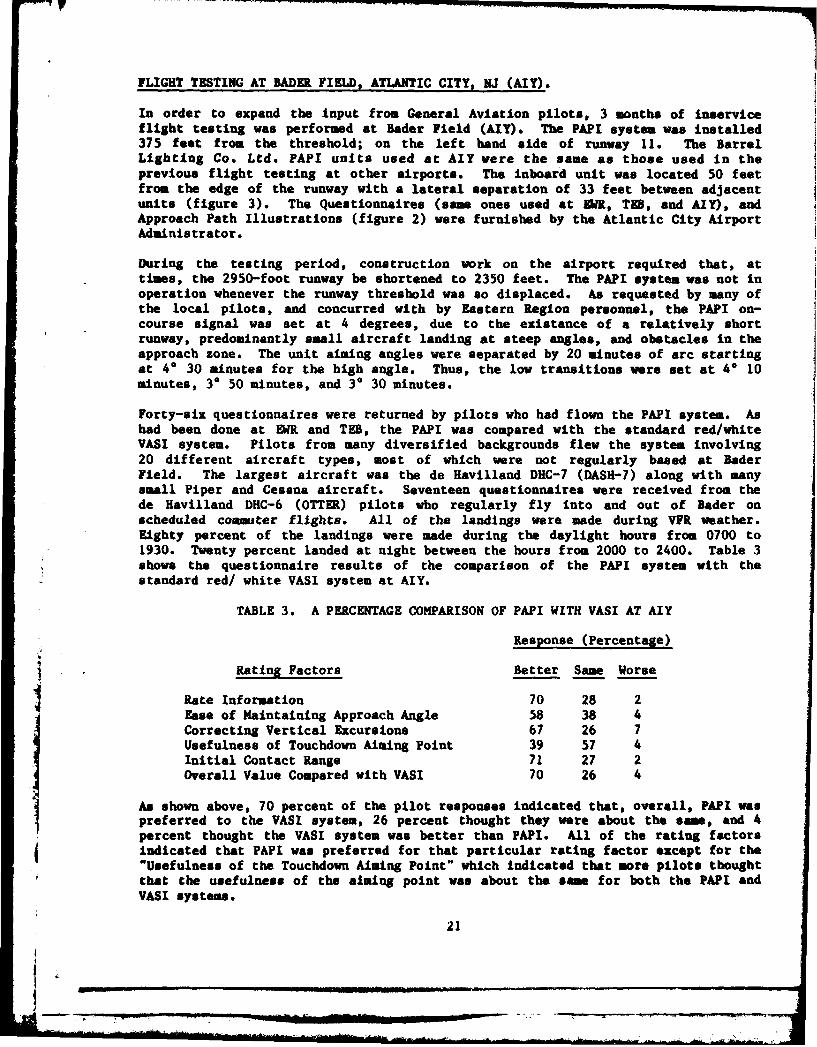
Forty-six questionnaires were returned by pilots who had flown the PAPI system. Ashad been done at EWR and TEB, the PAPI was compared with the standard red/whiteVASI system. Pilots from many diversified backgrounds flew the system involving20 different aircraft types, most of which were not regularly based at BaderField. The largest aircraft was the de Havilland DHC-7 (DASH-7) along with manysmall Piper and Cessna aircraft. Seventeen questionnaires were received from thede Havilland DHC-6 (OTTER) pilots who regularly fly into and out of Bader onscheduled commuter flights. All of the landings were made during VFR weather.Eighty percent of the landings were made during the daylight hours from 0700 to1930. Twenty percent landed at night between the hours from 2000 to 2400. Table 3shows the questionnaire results of the comparison of the PAPI system with thestandard red/ white VASI system at AIY.
TABLE 3. A PERCENTAGE COMPARISON OF PAPI WITH VASI AT AIY
Response (Percentage)
Rating Factors Better Same Worse
Rate Information 70 28 2Ease of Maintaining Approach Angle 58 38 4Correcting Vertical Excursions 67 26 7Usefulness of Touchdown Aiming Point 39 57 4Initial Contact Range 71 27 2Overall Value Compared with VASI 70 26 4
As shown above, 70 percent of the pilot responses indicated that, overall, PAPI waspreferred to the VASI system, 26 percent thought they were about the se, and 4percent thought the VASI system was better than PAPI. All of the rating factorsindicated that PAPI was preferred for that particular rating factor except for the"Usefulness of the Touchdown Aiming Point" which Indicated that more pilots thoughtthat the usefulness of the aiming point was about the same for both the PAPI andVASI systems.
21
I
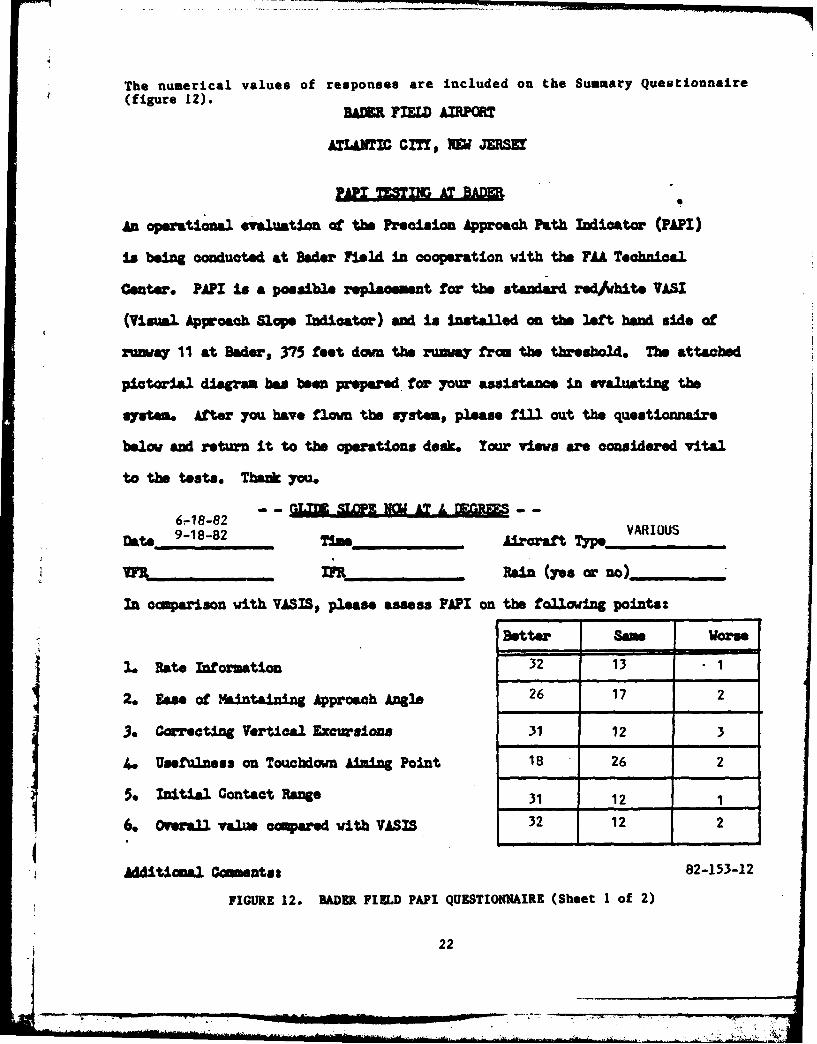
The numerical values of responses are included on the Summary Questionnaire(figure 12).
BAD F1EP AIRPOT
AAT CMT, MW jamS
PAP! TSTI3M AT BADER
An oeainlevaluation of the Precision Approach Path Indicator (PAPI)
Is being conducted at Bader Feld in cooperation with the FAA Technical
Center. PAPI is a posmsile eWaeent for the standard redAthite VASZ
(Visual Approach Slope Indicator) and is installed an the left hand side of
ruway 11 at Bader, 375 feet down the ruway frma the threshold. The attached
pictorial diagram has been prepared for your assistsne in evaluating the
sygtem. After you have flown the system, please fill out the questionnaire
below and eturn it to the operations desk. Your views are considered vital
to the tests. Thank you.
.. G - E NH ALT . _6-18-82 VARIOUS
hate 9-18-82 ___,_,__._ Aircraft Type - R
(M Rain (yes o no)
In comparison with VASIS, please assess PAP! on the following points:
Better Same worse
. Rate Information 32 13 1
2. Ease of Maintaining Approach Angle 26 17 2
3. Correcting Vertical Excursions 31 12 3
A. Usefulness on Touchown Am ing Point 18 26 2
5. Initial Contact Range 31 12 1
6. OWerll v&ae compared with VASIS 32 12 2
Aditinal Conmentst 82-153-12
FIGURE 12. BADZR FIELD PAPI QUESTIONNAIRE (Sheet I of 2)
22
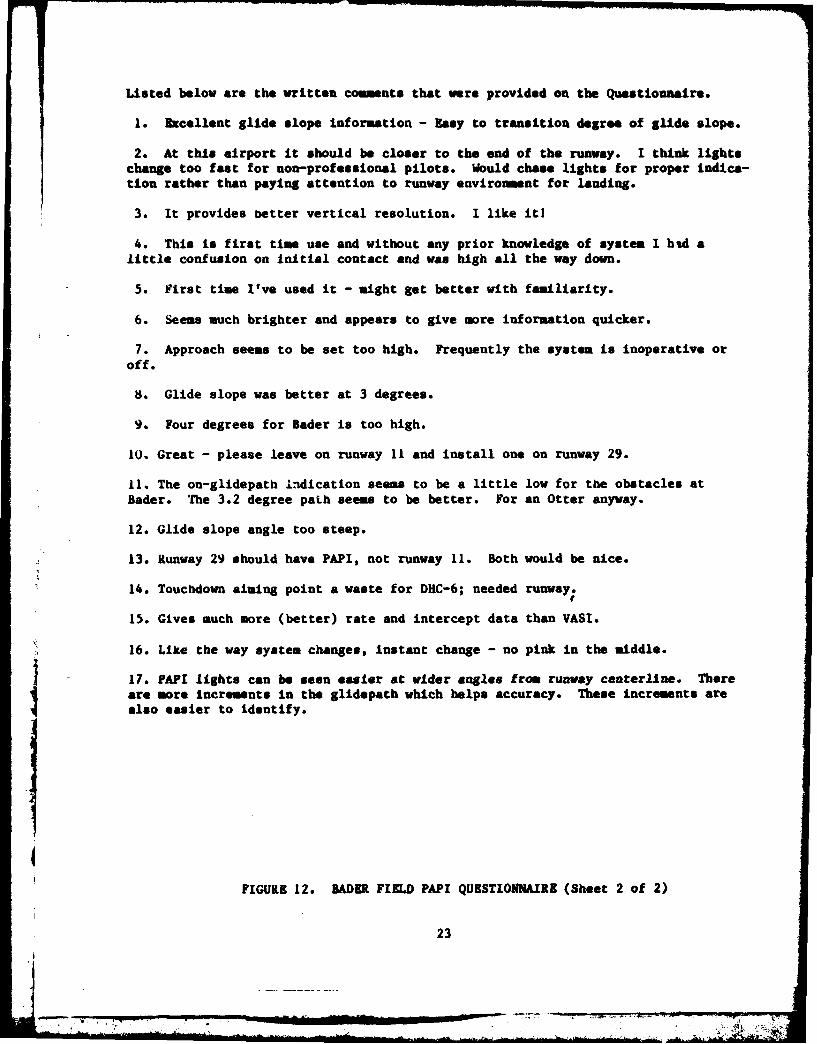
Listed below are the written comments that were provided on the Questionnaire.
1. Excellent glide slope information - Easy to transition degree of glide slope.
2. At this airport it should be closer to the end of the runway. I think lightschange too fast for non-professional pilots. Would chase lights for proper indica-tion rather than paying attention to runway environment for landing.
3. It provides better vertical resolution. I like itl
4. This is first time use and without any prior knowledge of system I hid alittle confusion on initial contact and was high all the way down.
5. First time I've used it - might get better with familiarity.
6. Seems much brighter and appears to give more information quicker.
7. Approach seems to be set too high. Frequently the system is inoperative oroff.
8. Glide slope was better at 3 degrees.
9. Four degrees for Bader is too high.
10. Great - please leave on runway 11 and install one on runway 29.
11. The on-glidepath Indication seems to be a little low for the obstacles atBader. The 3.2 degree paLh seems to be better. For an Otter anyway.
12. Glide slope angle too steep.
13. Runway 29 should have PAPI, not runway 11. Both would be nice.
14. Touchdown aiming point a waste for DHC-6; needed runway;
15. Gives much more (better) rate and intercept data than VASI.
16. Like the way system changes, instant change - no pink in the middle.
I 17. PAPI lights can be seen easier at wider angles from runway centerline. Thereare more increments in the glidepath which helps accuracy. These increments arealso easier to identify.
FIGURE 12. BADER FIELD PAPI QUESTIONNAIRE (Sheet 2 of 2)
23
FLIGHT TESTING OF A TWO-BOX PAP[ AT TE TEBCNICAL CUTER (ACY).
A discussion concerning the testing of a two-box PAPI system is given in a datareport entitled "Flight Test Results of a Two-Box PAPI Tested at the FAA TechnicalCenter" dated November 1981; reference Appendix D. The purpose of these tets wasto determine whether a two-box PAPI system could be used where the five incrementalpaths provided by the full four-box PAPI system may not be necessary. Such usagewould be at smaller airports where smaller general aviation aircraft constitute thegreater proportion of traffic.
In summary, a Crouse-Hinds PAPI system was set up in a two-box configuration onrunway 4 at the Technical Center and forty-five approaches were made whilo usingthe system by Technical Center test pilots. Flights were tracked with the BAIRRadar Tracking System. The BAIR Radar Tracking system is located in an area suchthat it is impossible to track flights below 50 feet during the approach to runway4. Therefore, portions of the radar track below 50 feet were disregarded.
Generally, the test pilots that flew the system were quite enthusiastic about tiletwo-box PAPI for general aviation use and thought that it served the purposeadequately without the need for the five paths that are provided with the four-boxsystem. Most of the responses to the questionnaire were favorable with regard tothe two-box PAPI except for the question comparing the two-box PAPI with the two-box VASI wherein the pilots thought they were about equal. Some pilots remarkedthat, aside from the range of the two-box PAPI system, all of the glide pathinformation that was necessary for all airports is provided by the two-box PAPIsystem.
Subsequently, the two-box system was temporarily put in service on runway 31and pilots from the Air National Guard, flying F-106 fighter/interceptor aircraft,were asked to provide comments. These pilots completed eleven questionnaires andexpressed the added opinions that, for them, the approach path should be at 2.5,and that the present red/white VASt system, with its shades of colors, was usefulfor their purposes. They generally felt that the PAPI system gave the minimumguidance required but not much more. At least half of the military pilotsindicated that the two-box VASI system should be continued in service.
It should be noted that the optimum glidepath of approach angle for high perform-ance fighter aircraft, such as the F-106 mentioned above, is well below the threedegree angle normally used by comsercial and general aviation aircraft. Several ofthe Air National Guard pilots participating in the two-box PAPI evaluation com-mented that they felt "uncomfortable" with the higher approach. path angle used forthe evaluation, and would have preferred a system adjusted for a 2- or 2 1/2 degreeapproach path.
PAPI SIGNAL RESOLUTION TESTING AT THE TECHNICAL CENTER.
Additional flight testing was conducted to determine whether PAPI signals could bereadily seen and resolved with individual PAPI units installed closer together thanspecified by the British (minimum spacing of 33 feet). Four Barrel PAPI units were
(installed at the Technical Center in the configuration shown below.
24
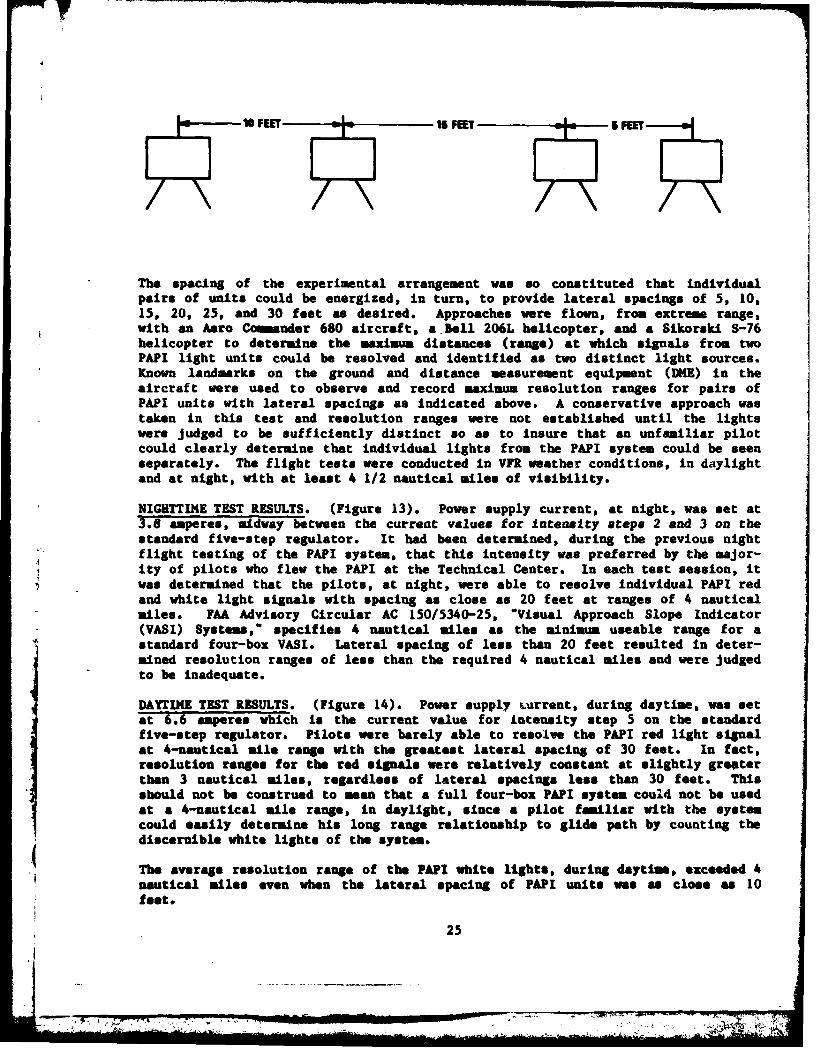
~ 7 I0 FEET 15 FMI5FE
The spacing of the experimental arrangement was so constituted that individualpairs of units could be energized, In turn, to provide lateral spacings of 5, 10,15, 20, 25, and 30 feet as desired. Approaches were flown, from extreme range,with an Aero, Commander 680 aircraft, a.Bell 206L helicopter, and a Sikoriki S-76helicopter to determine the maximum distances; (range) at which signals from twoPAPI light units could be resolved and Identified as two distinct light sources.Known landmarks on the ground and distance measurement equipment ONE) in theaircraft were used to observe and record maximum resolution ranges for pairs ofPAPI units with lateral spacings as Indicated above. A conservative approach wastaken In this test and resolution ranges mere not established until the lightswere judged to be sufficiently distinct so as to insure that an unfamiliar pilotcould clearly determine that individual lights from the PAPI system could be seenseparately. The flight tests were conducted in Vfi weather conditions, in daylightand at night, with at least 4 1/2 nautical miles of visibility.
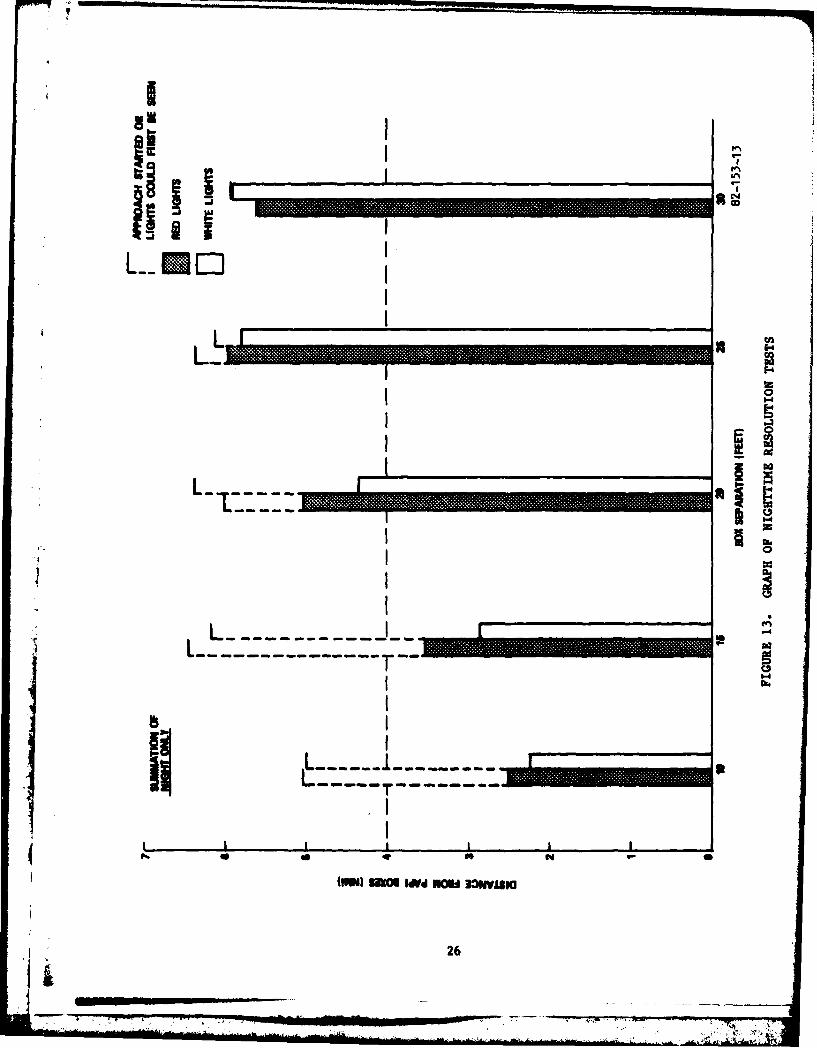
NIGHTTsIE TEST RESULTS. (Figure 13). Power supply current, at night, was set at3 amperes, midway between the current values for Intensity steps 2 and 3 on thestandard five-step regulator. It had been determined, during the previous nightflight testing of the PAP system, that this Intensity was preferred by the major-ity of pilots who flew the PAPe at the Technical Center. In each test session, itwas determined that the pilots, at night, were able to resolve individual PAP! redand white light signals with spacing as close as 20 feet at ranges of 4 nauticalmiles. FAA Advisory Circular AC 150/5340-25, "Visual Approach Slope Indicator(VASI) System, specifies 4 nautical miles as the minimum useable range for astandard four-box VASI. Lateral spacing of less than 20 feet resulted in deter-mined resolution ranges of less than the required 4 nautical miles and were judgedto be inadequate.
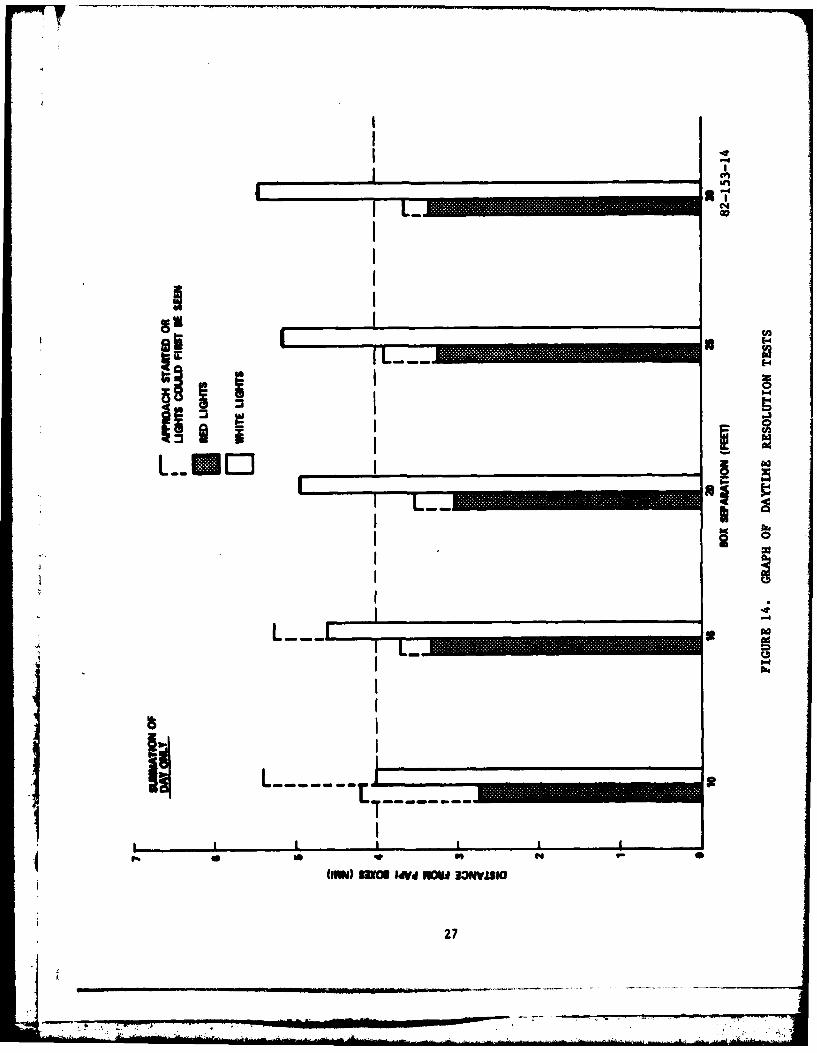
DAYTIHE TEST RESULTS. (Figure 14). Power supply rsgrrent, during daytime, was setat 6.6 amperes which is the current value for intensity step 5 on the standardfive-step regulator. Pilots were barely able to resolve the PAP! red light signalat 4-nautical mile range with the greatest lateral spacing of 30 feet. In fact,resolution ranges for the red signals mere relatively constant at slightly greaterthan 3 nautical miles, regardless of lateral spacings le than 30 feet. Thisshould not be construed to mean that a full four-box PAPi system could not be usedat a 4-nautical ile range, In daylight, since a pilot familiar with the systemcould easily determine his long range relationship to glide path by counting thediscernible white lights of the system.
The average resolution range of the PAP! white lights, during daytime, exceeded 4nautical miles even when the lateral spacing of PAP! units was as close an 10feet.
25
L r
A CA
- -- -----
Iii I I
two) m= MV WN 3"'.4
AlL a-c
C14
941~
$a() -d~ - M3l"i
27
It follows from the above determinations, with regard to both night and dayconditions, that lateral spacing of PAPI units installed at smaller GeneralAviation airports could be reduced to as little as 10 feet and still provideadequate guidance within ranges of 2 to 3 miles from the runway threshold.
Spacing of at least 20 feet between PAPI units should be maintained for systemsinstalled at larger airports where a minimum visual approach guidance range of 4nautical miles Is required.
SUMMARY OF RESULTS
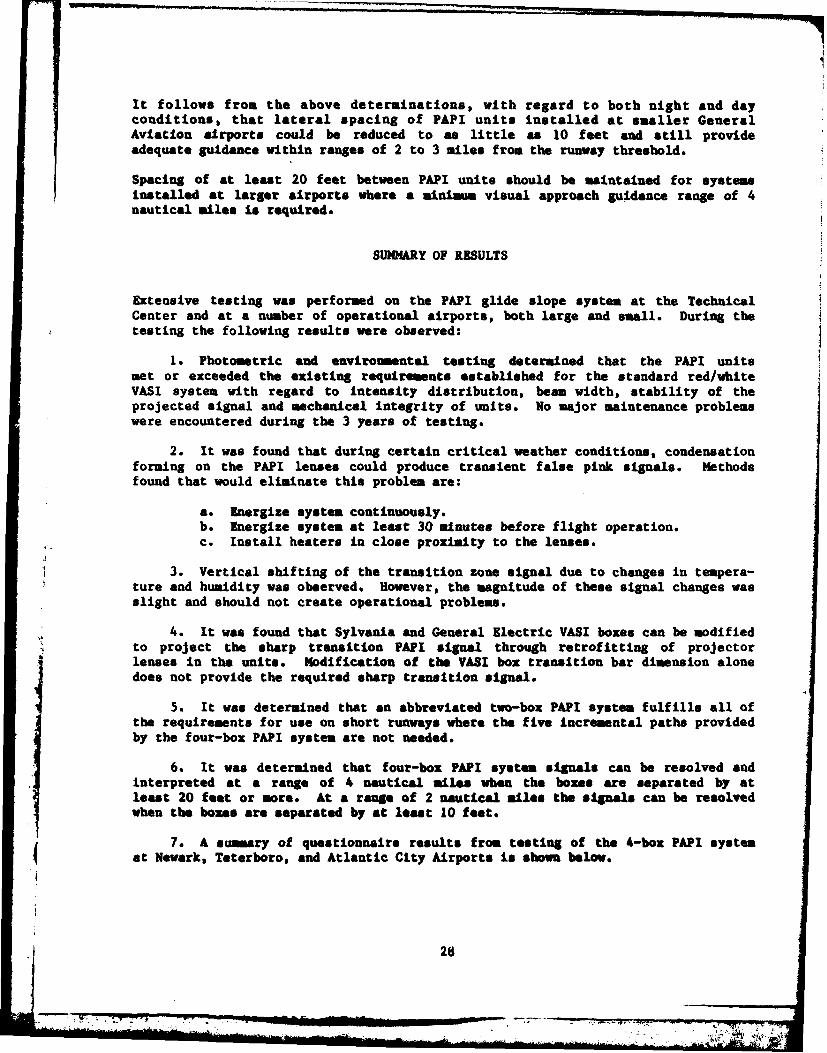
Extensive testing was performed on the PAPI glide slope system at the TechnicalCenter and at a number of operational airports, both large and small. During thetesting the following results were observed:
1. Photometric and environmental testing determined that the PAPI unitsmet or exceeded the existing requirements established for the standard red/whiteVASI system with regard to intensity distribution, beam width, stability of theprojected signal and mechanical integrity of units. No major maintenance problemswere encountered during the 3 years of testing.
2. It was found that during certain critical weather conditions, condensationforming on the PAPI lenses could produce transient false pink signals. Methodsfound that would eliminate this problem are:
a. Energize system continuously.b. Energize system at least 30 minutes before flight operation.c. Install heaters in close proximity to the lenses.
3. Vertical shifting of the transition zone signal due to changes in tempera-ture and humidity was observed. However, the magnitude of these signal changes wasslight and should not create operational problems.
4. It was found that Sylvania and General Electric VASI boxes can be modifiedto project the sharp transition PAPI signal through retrofitting of projectorlenses in the units. Modification of the VAST box transition bar dimension alonedoes not provide the required sharp transition signal.
5. It was determined that an abbreviated two-box PAPI system fulfills all ofthe requirements for use on short runways where the five incremental paths providedby the four-box PAPI system are not needed.
6. It was determined that four-box PAPI system signals can be resolved andinterpreted at a range of 4 nautical miles when the boxes are separated by atleast 20 feet or more. At a range of 2 nautical miles the signals can be resolvedwhen the boxes are separated by at least 10 feet.
7. A summary of questionnaire results from testing of the 4-box PAPI systemat Newark, Teterboro, and Atlantic City Airports is shown below.
28
+,.MIAMI " W ,.W,., "+.T -:- : : +," .I , . , i .. ,". Zt: +.+ +
RESPONSE (PuICITAGZ)
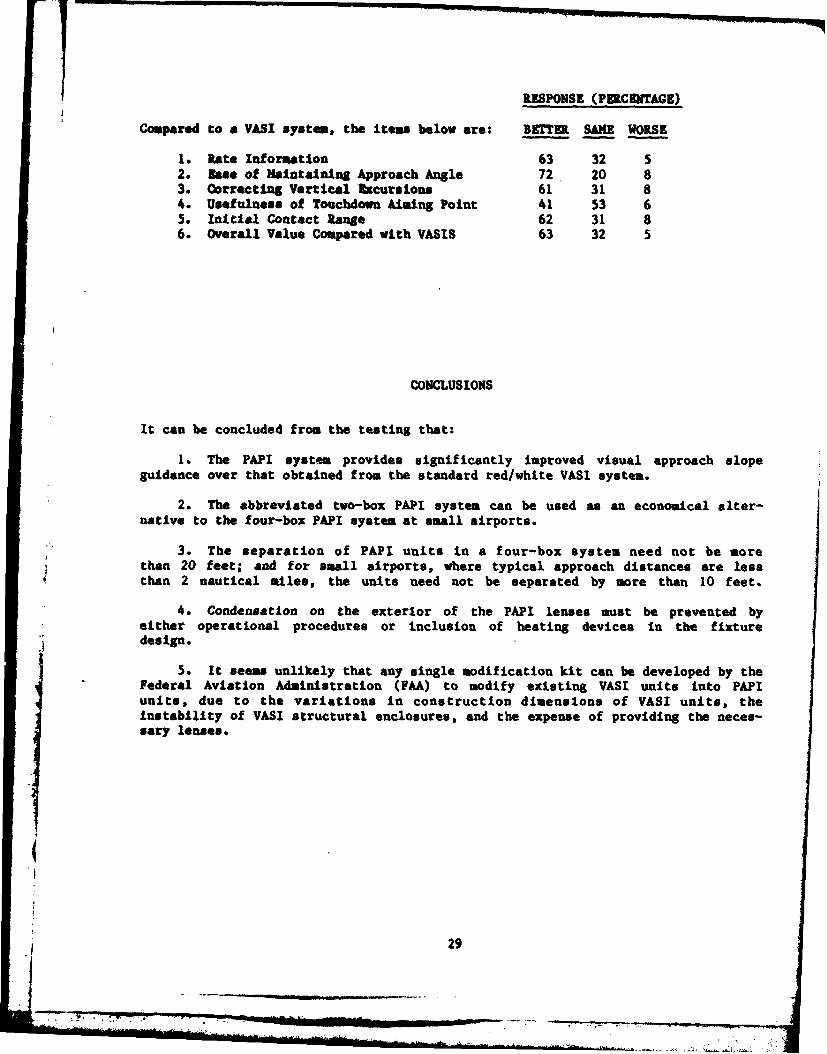
Compared to a VASI system, the items below are: BETTER SAKE WORSE
1. Rate Information 63 32 52. Bee of Maintaining Approach Angle 72 20 83. Correcting Vertical kcursions 61 31 84. Usefulness of Touchdown Aiming Point 41 53 65. Initial Contact Range 62 31 86. Overall Value Compared with VASIS 63 32 5
CONCLUSIONS
It can be concluded from the testing that:
1. The PAPI system provides significantly improved visual approach slopeguidance over that obtained from the standard red/white VASI system.
2. The abbreviated two-box PAPI system can be used as an economical alter-native to the four-box PAPI system at small airports.
3. The separation of PAPI units in a four-box system need not be morethan 20 feet; and for small airports, where typical approach distances are lessthan 2 nautical miles, the units need not be separated by more than 10 feet.
4. Condensation on the exterior of the PAPI lenses must be prevented byeither operational procedures or inclusion of heating devices in the fixturedesign.
5. It seems unlikely that any single modification kit can be developed by theFederal Aviation Administration (FAA) to modify existing VASI units into PAPIunits, due to the variations in construction dimensions of VASI units, theinstability of VASI structural enclosures, and the expense of providing the neces-sary lenses.
2
l 29
1. Jones, P. H., Precision Approach Path Indicator (PAPI) Environmental Tests,Report Number MA-78-67-LR, DOTIFAA, NAFEC, October 1978.
2. Paprocki, T. H., Quick Response Evaluation of Precision Approach Path Indica-tor (PAPI), Report Number NA-77-36-LR, DOT/FM, MANIC, July 1977.
3. Gates, R. F., Paprocki, T. H., VASIS Signal Transition Zone and Color ModifI-cations, Report Number FAA-ARD-72-91, DOTIFAA, NAFEC, September 1972.
4. Advisory Circular Number 150/5340-25, Visual Approach Slope Indicator (VASI)Systems, DOT/FAA dated September 24, 1976.
5. Advisory Circular Number 150/5345-28C, Specification For L-851 Visual Approach
Slope Indicator and Accessories, DOT/FAA dated March 23, 1977.
6. Handbook 6850.2, Visual Guidance Lighting Systems, DOT/FAA Change 7, datedMarch 18, 1974.
30
i i t ' - II -- I II I ________
APPENDIX A
"EVALUATION OF PAPI BY THE U.S.A"
(July 1, 1980)
EVALUATION OF PAPI BY THE U.S.A.
Evaluation of the Precision Approach Path Indicator (PAPI)
System in the United States is being conducted by the Federal
Aviation Administration at the FAA Technical Center, Atlantic City,
New Jersey. The evaluation effort includes experimental tests
at the Technical Center (Phase I) and, possibly, "In-Service"
testing at some Air Carrier Airport within the continental
United States.
Flight testing of the standard United Kingdom proposed PAPI
configuration has been completed using Aero-Commander, Gulfstream
G-159, Convair 580 and Convair 880 type aircraft. FAA Test Pilots
accomplished a total of 108 approaches to the PAPI installed as
a single bar right-side only system at a point adjacent to the
main instrument runway touchdown point and at a distance of
1111 feet (339 meters) from the runway threshold. The inboard
lighting fixture was situated 50 feet (15 meters) outboard of
the right edge of the 300 foot (91 meter) wide runway, with the
remaining three lighting fixtures located on 33 foot (10 meter)
centers outboard of the innermost fixture. Lighting fixtures
used were the BLC Mk 6 P.A.P.I. units as manufactured by
Barrel Lighting Company Limited, of England. Standard FAA
specification constant current regulators provided 6.6 Ampere
(Intensity step 5) circuit current for daylight operation of
the PAPI and 4.1 Ampere (Intensity step 3) circuit current for
night operations. The PAPI fixtures are adjusted to provide. an
l"on-course" signal (RED/RED/WHITE/WHITE) at 3.00, with a
standard 20 minute difference between fixture aiming angles.
A-I
po -
2
Fixture spacing and location was kept constant during all
test flights. Previously accomplishe6 testing, using Belgian
made two-lamp PAPI fixtures, had established the 33 foot (10 meter)
spacing between fixtures as optimum for visual separation of the
individual fixture light sources. Additional tests, using a
300 foot (91 meter) system displacement further down from runway
threshold and widening of the angle between center fixtures to
30 minutes, will be conducted in time to have results available
for the next ICAO Visual Aids Panel meeting. This modification
has been suggested by the United Kingdom representative as approp-
riate for better suiting the system to wide-bodied jet use.
Usable Height
Pilot responses to the post-flight questionnaire indicated
that they were able to obtain useful guidance from the PAPI
system to the point at which the aircraft passed over the runway
threshold, or to a height of approximately 54 feet (16 meters).
Accuracy of PAPI System
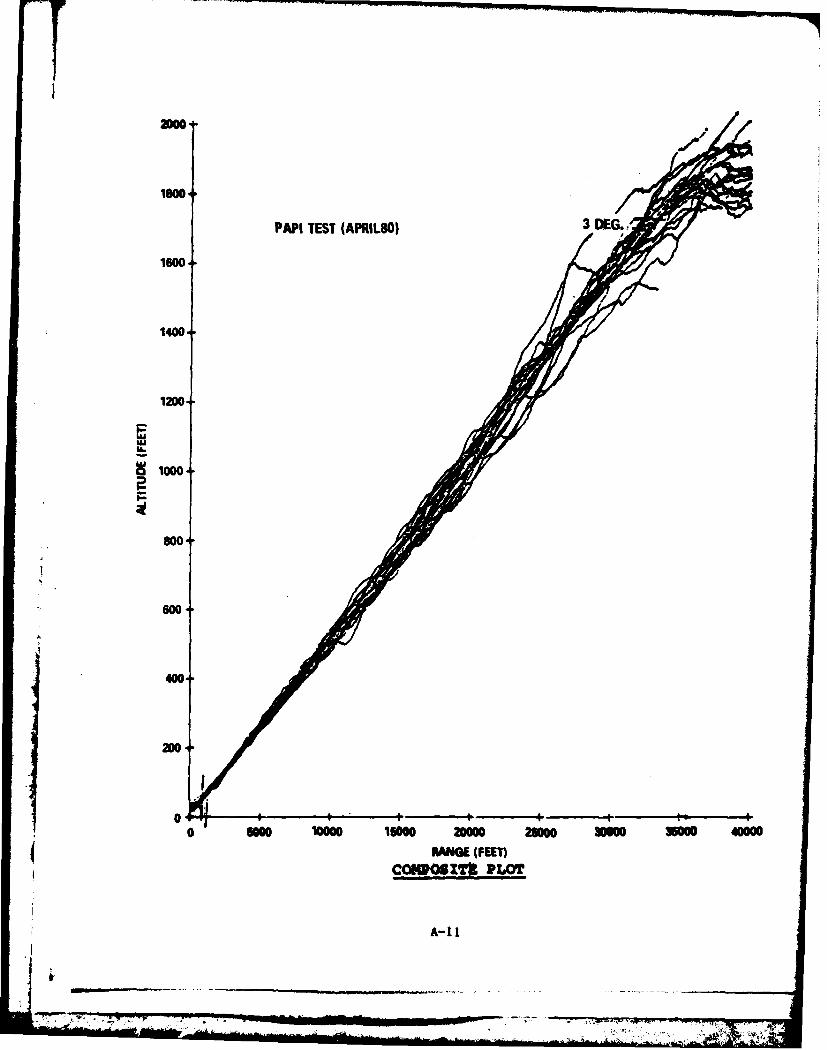
The accuracy of the PAPI System was determined by 72 Photo-
theodolite tracked approaches. Data was computer reduced and
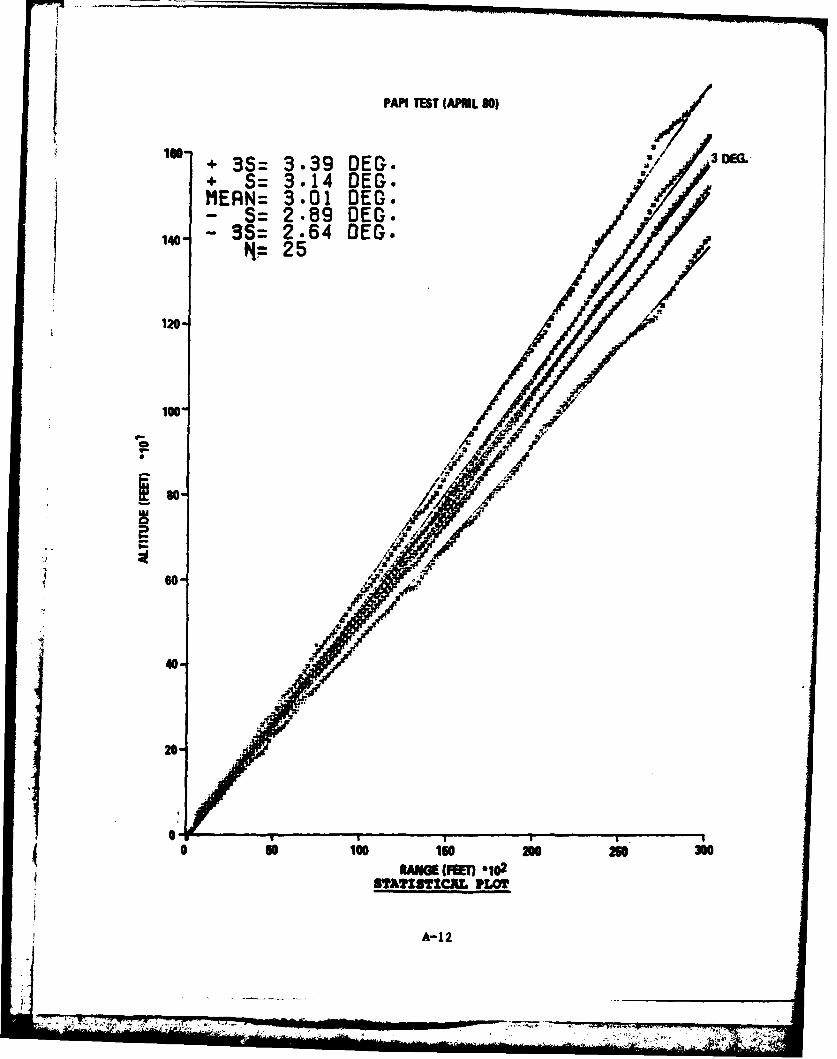
analyzed to give a composite plot of raw data and a statistical
plot. The statistical analysis was made of the segments of the
approaches when the pilots were flying "on-course." At each
200 feat segment of range, the mean, + 10(standard deviation)
and + 3,'values were calculated for all approaches and plotted.
A linear regression line was drawn through each set'of points.
Lines representing the + 10deviation indicate that 68.26 percent
of all aircraft flying the PAPI would remain within this
A-2
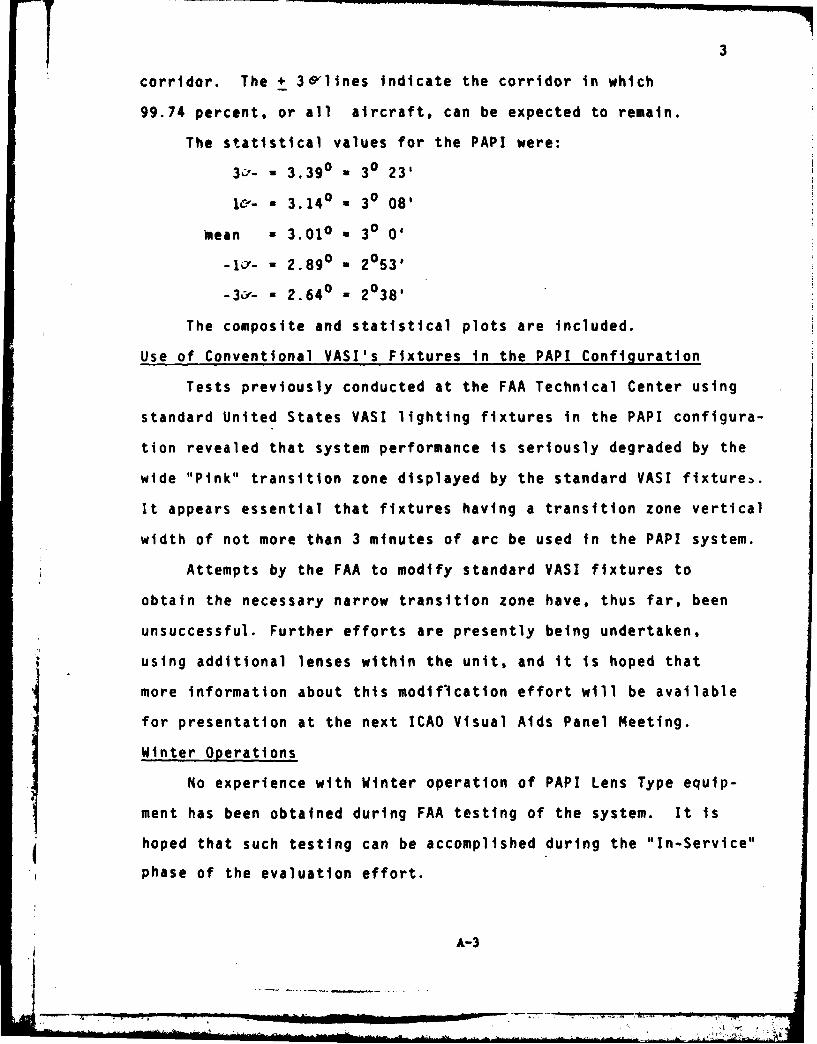
3
corridor. The + 3&lines Indicate the corridor in which
99.74 percent, or all aircraft, can be expected to remain.
The statistical values for the PAPI were:
3:r- - 3.390 - 30 23'
I&- - 3.140 a 30 081
mean - 3.010 - 30 0,
Icy- - 2.890 a 2053
3&- - 2.640 - 2038 '
The composite and statistical plots are included.
Use of Conventional VASI's Fixtures in the PAPI Configuration
Tests previously conducted at the FAA Technical Center using
standard United States VASI lighting fixtures in the PAPI configura-
tion revealed that system performance is seriously degraded by the
wide "Pink" transition zone displayed by the standard VASI fixtureb.
It appears essential that fixtures having a transition zone vertical
width of not more than 3 minutes of arc be used in the PAPI system.
Attempts by the FAA to modify standard VASI fixtures to
obtain the necessary narrow transition zone have, thus far, been
unsuccessful. Further efforts are presently being undertaken,
using additional lenses within the unit, and it is hoped that4 more information about this modifIcation effort will be available
for presentation at the next ICAO Visual Aids Panel Meeting.
Winter Operations
No experience with Winter operation of PAPI Lens Type equip-
ment has been obtained during FAA testing of the system. It is
hoped that such testing can be accomplished during the "In-Service"
phase of the evaluation effort.
A-3
4
Previous testing at the FAA Technical Center, using Belgian
made PAPI units, revealed a tendency for moisture to condense upon
the exposed frontal surfaces of the lenses during periods of
rain or high humidity while the system was deenergized. Upon
energization of the system, the water droplets caused diffusion
of the projected light signals, with the result that a pure "pink"
signal was perceived for a short period of time subsequent to
startup. The heat generated within the lenses was sufficient to
restore proper signal appearance after approximately 15 minutes
of on-time. This projection of an improper signal, although of
only short duration, must be considered as a problem area for the
PAP!.
Single Side Acceptability
The United States has, for a number of years, specified a
"single-side only" 4 unit VASI system as the National Standard.
Arguments based on the benefit of roll guidance that may be
provided by a double-sided VASI system have not been substantiated
by user pilot opinion in the United States, since numerous other
visual cues available to the pilot appear sufficient for providing
such information. It seems reasonable that the single-sided
PAPI system would provide adequate visual approach path guidance
without the additional cost and siting difficulties attendant
to installation of the double-sided system.
Compatibility with Instrument Landing System (ILS)
While the two-bar PAPI system-will provide compatibility with
the ILS for both conventional and wide-bodied aircraft, the
A-4
5
multiplicity of signals attendant to use of such a system appears
to introduce a distinct potential for pilot confusion. For this
reason the two-bar system has not been tested by the FAA, and it
is hoped that further evaluation of configuration modifications,
as proposed by the United Kingdom, will result in a solution to
this problem without the necessity of providing more than one
PAPI bar. We hope that further information concerning this
aspect of the PAPI testing will be available in time for presenta-
tion at the next ICAO Visual Aids Panel meeting.
PILOT ACCEPTANCE AND PREFERENCE
The following results are based on over 100 approaches con-
ducted by 12 Test Pilots at the Federal Aviation Technical Center,
Atlantic City, New Jersey. The overall acceptance of the PAPI
system was favorable.Pilots were able to obtain continual guidance
throughout the approach and were able to acquire the PAPI at a
range of 6.5 nmi (10.5 km.) daytime and 10+ nmi (16 km.) nighttime.
Course dimensions were sufficient to permit comfortable conformance
to the desired flight path. With minimum pilot briefing, there
was no difficulty interpreting the PAPT signals. When pilots were
asked to rate PAPI in comparison to VASI, 58 percent favored PAPI,
42 percent said they were about the same, and no one favored the
VASI. Of the 42 percent who thought PAPI and VASI were about the
same, many gave favorable comments.
Typical Pilot comments were: (1) "Easy to fly;,, (2) "However,
this system does seem to give a more precise path;" (3) "I'm
impressed and like it very much;" (4) "Very easy to fly;" (5) "Both
(excellent." A summary of the questionnaire is included.
A-5
III "Now
-Precision Approach Path Indicator
PAPI
Pilot Briefing
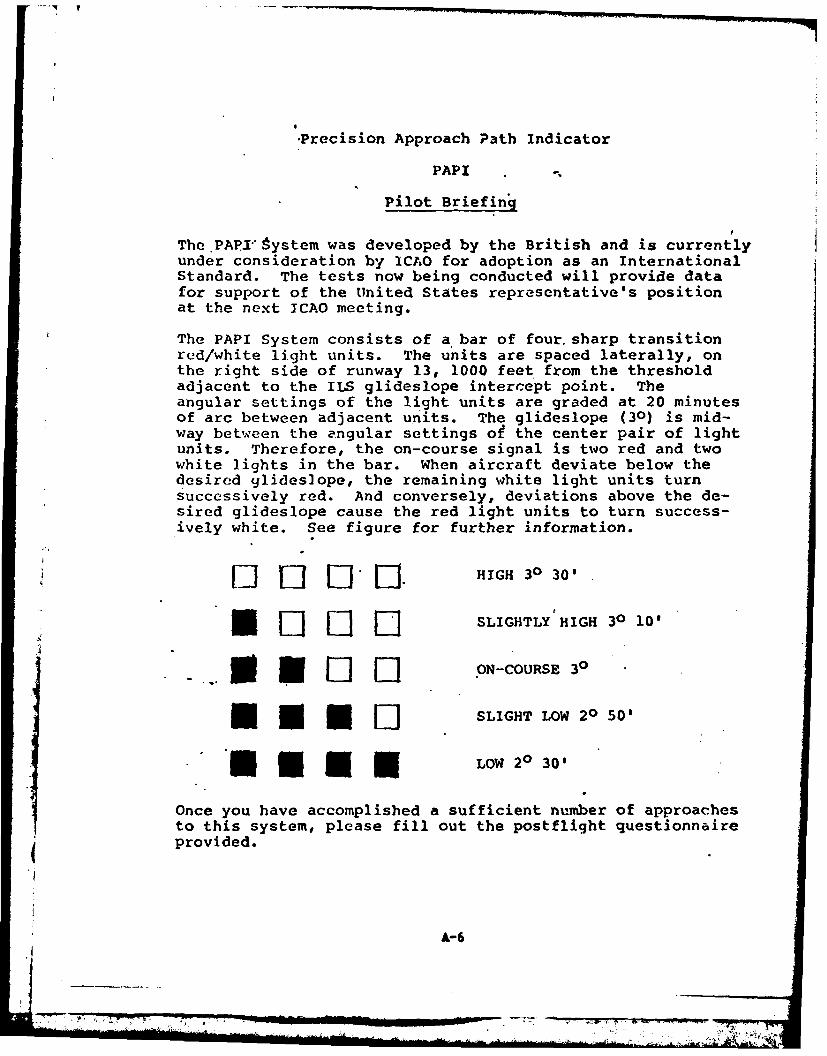
The.PAPJI-'ystem was developed by the British and is currentlyunder consideration by ICAO for adoption as an InternationalStandard. The tests now being conducted will provide datafor support of the United States representative's positionat the next ICAO meeting.
The PAPI System consists of a bar of four sharp transitionred/white light units. The units are spaced laterally, onthe right side of runway 13, 1000 feet from the thresholdadjacent to the ILS glideslope intercept point. Theangular settings of the light units are graded at 20 minutesof arc between adjacent units. The glideslope (30) is mid-way between the angular settings o the center pair of lightunits. Therefore, the on-course signal is two red and twowhite lights in the bar. When aircraft deviate below thedesired glideslope, the remaining white light units turnsuccessively red. And conversely, deviations above the de-sired glideslope cause the red light units to turn success-ively white. See figure for further information.
[] [il [ " LI. HIGH 30 30'
*LJLJLJSLIGHTLY HIGH 30 10'
ON-COURSE 30
E M E DSLIGHT LOW 20 501'O m a LOW 20 30'
Once you have accomplished a sufficient number of approachesto this system, please fill out the postflight questionnaireprovided.
A-6
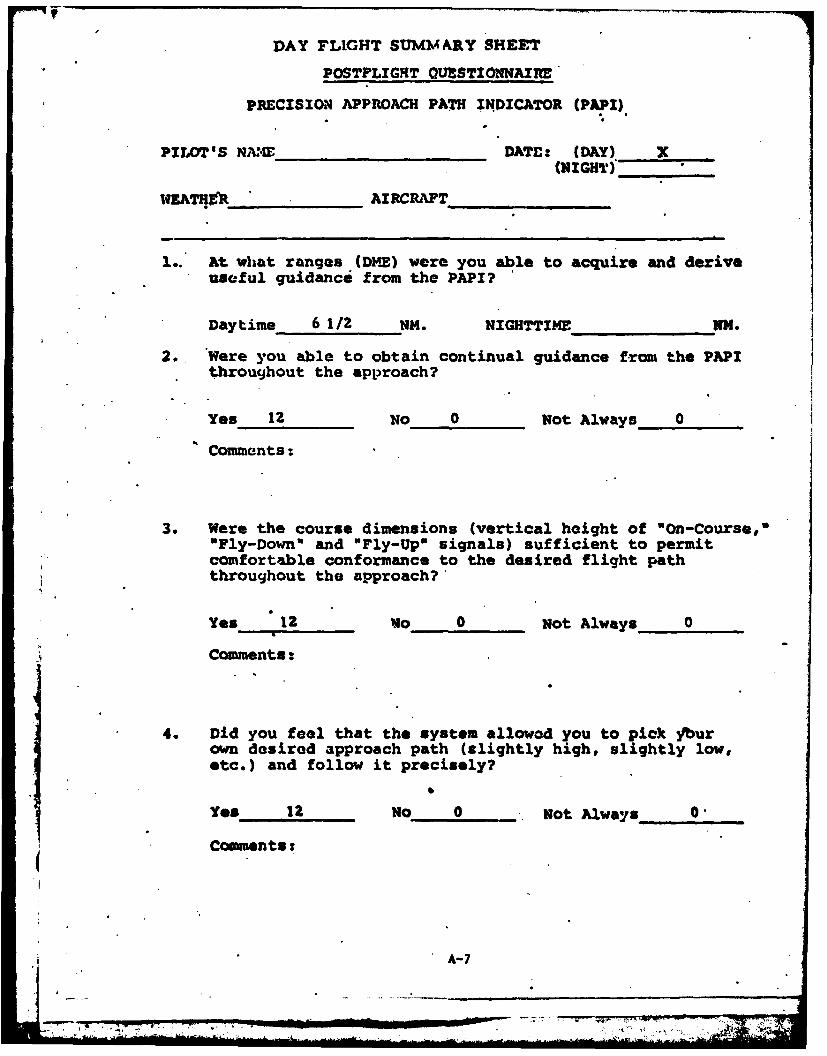
DAY FLIGHT SUMM ARY SHEET
POSTPLIGHT 0.LSTONNAIR
PRECISION APPROACH PATH INDICATOR (PAP!)
PILO' 'S N.X EDATE: (DAY) X(NIGHT)'-
EATHRq _ _, AIRCMAFT
1.. At what ranges (DME) were you able to acquire and deriveuseful guidance from the PAPI?
Daytime 6 1/2 NM. NIGHTTIME NM.
2. Were you able to obtain continual guidance from the PAPIthroughout the approach?
Yes 12 No 0 Not Always 0
Comments:
3. Were the course dimensions (vertical height of "On-Course,""Fly-Down" and "Fly-Up" signals) sufficient to permitcomfortable conformance to the desired flight paththroughout the approach?
Yes 12 No 0 Not Always 0
Comments:
4. Did you feel that the system allowed you to pick Yburown desired approach path (slightly high, slightly low,etc.) and follow it precisely?
Yes 12 No 0 Not Always 0.
Co ments:
A-7
- '4-.
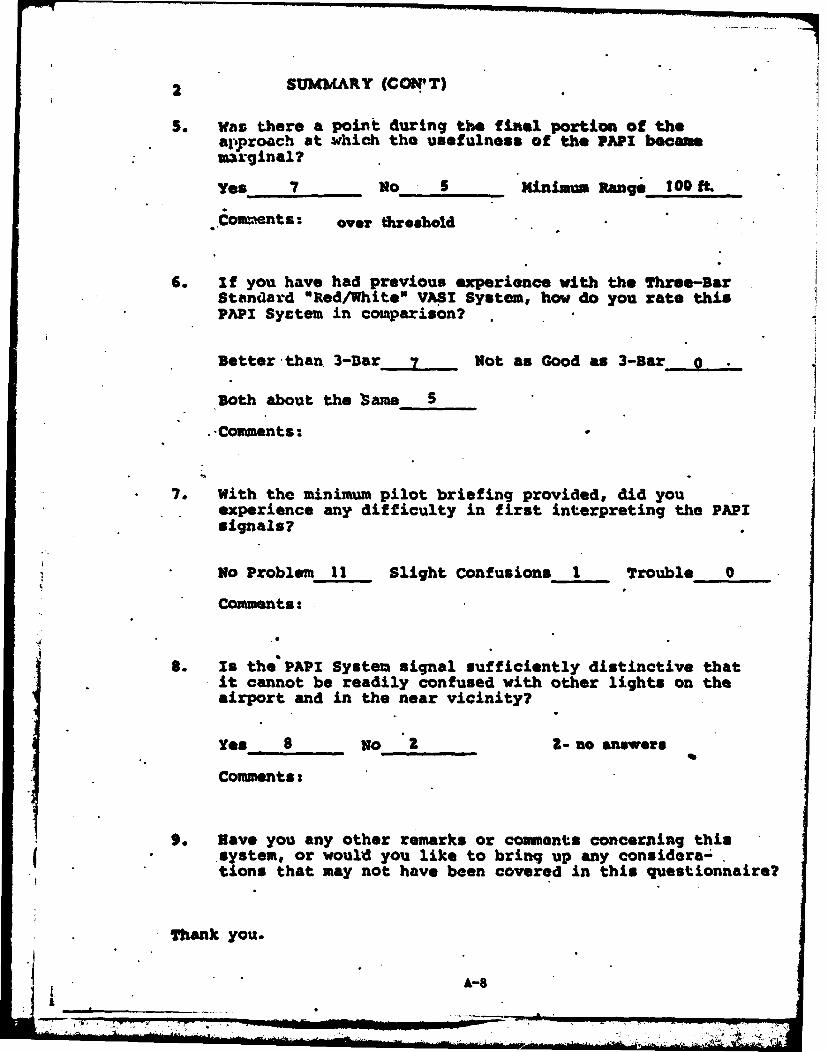
2 SUMMARY (COW'T)
S. Was there a point during the fial portion of theapproach at which the usefulness of the PAPI becamemarginal?
Yes 7 No S Minimum Range 100 ft
Comments: over threshold
6. If you have had previous experience with the Three-BarStandard "Red/White" VASI System# how do you rate thisPAPI Syetem in comparison? .
Better than 3-Bar 7 Not as Good as 3-Bar-, Q,
Both about the 'ame 5
.-Comments:
7. With the minimum pilot briefing provided, did youexperience any difficulty in first interpreting the PAPIsignals?
No Problem 11 Slight Confusions, Trouble- 0
Comments:
8. Is the PAP! System signal sufficiently distinctive thatit cannot be readily confused with other lights on theairport and in the near vicinity?
Yes 8 No 2 2- no answers
Comments:
9. Have you any other remarks or comnents concerning thisi system, or would you like to brinq up any considera-
* tions that may not have been covered in this questionnaire?
Thank you.
A-8
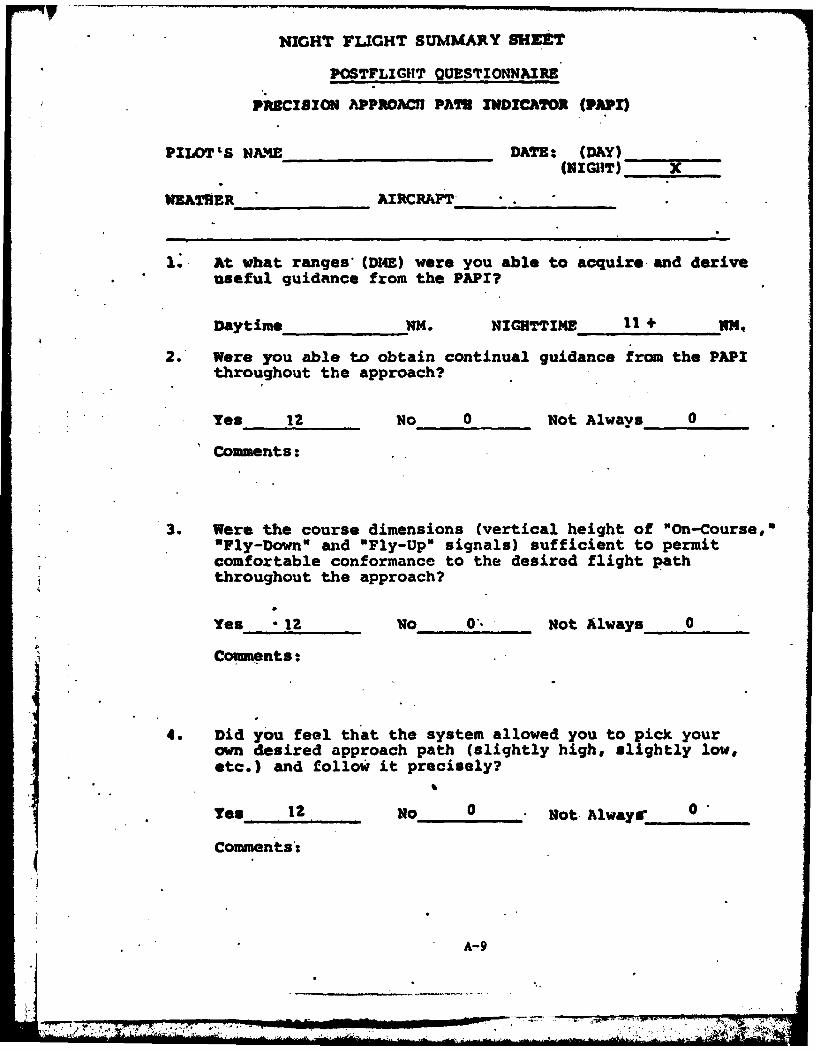
MIGHT FLIGHT SUMMARY SHEET
POSTFLIGHT QUESTIONNAIRE
PRECISION APPROACh PATH INDICATOR (PAPI)
PILOTILS NAE DATE: (DAY)(NIGHT) X
WEATNER AIRCRAF T
I. At what ranges (DZ4E) were you able to acquire and deriveuseful guidance from the PAPI?
Daytime NM. NIGHTTIME +1 NM,
2. Were you able to obtain continual guidance from the PAPIthroughout the approach?
Yes 12 NO 0 Not Always 0
Comments:
3. Were the course dimensions (vertical height of "On-Course,"'Fly-Down" and "Fly-Up" signals) sufficient to permitcomfortable conformance to the desired flight paththroughout the approach?
Yes 12 No 01. Not Always 0
CoWmunts:
4. Did you feel that the system allowed you to pick yourown desired approach path (slightly high, slightly low,etc.) and follow it precisely?
ye 1z No 0 Not Alwayv 0
( Comments:
A-9
| 7' . .. . . • ... . . .,'. .. . . ... .....- ' " }, ? " ," : i' 1A *
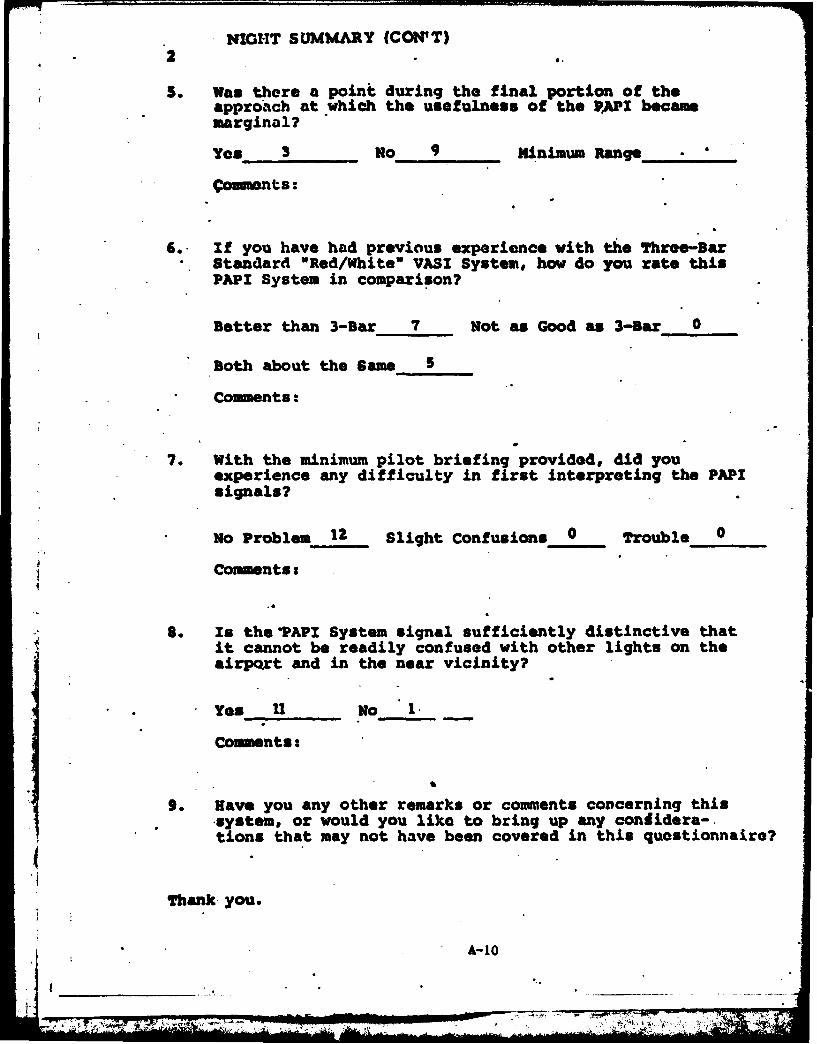
2 NIGHT SUMMARY (COWT)
5. Was there a point during the final portion of theapproach at which the usefulness of the PAP! becamemarginal?
yes. No3 9 Minimum Range_____
Commnts:
6.- If you have had previous experience with the Three-BarStandard NRed/White" VASI System, how do you rate this
* PAP System in comparison?
Better than 3-Bar 7 Not as Good as 3-Bar 0
both about the Game
Coments:
*7. With the minimum pilot briefing provided,, did youexperience any difficulty in first interpreting the PAP!signals?
No Problem 12 Slight Confusions__0 Trouble 0
Comments:
S. Is the PAPI System signal sufficiently distinctive thatit cannot be readily confused with other lights on theairport and in the near vicinity?
* Yes iiNo 1
Comments:
9. Have you any other remarks or comments concerning this-system, or would you like to bring up any condidera-.tions that may not have been covered in this questionnaire?
Thank-you.
A-10
0" o_ _._._._._._
1800
PAPI TEST (APRIL80) 3 DEG,.
1400-
12D0
800-
00 sm 10000 15000 2m00 2300 3M 3-0 -m
PANGE (FEET)comas X"t PLOT
A-1lI
- POMP""
PAPI TEST (APRIL 80)
3//
+ 3S= 3 .39 DEG. 3 DEG
+ S= 3.14 DEG.MERN= 3.01 DEG.-S= 2.89 DEG.- 3S= 2.64 DEG. 9F
o-
40 7
120- "
0o 100 lio no0 no 3;0
3?AflmYCAtL Pun~
A-1 2
--.-. , a"
-0- "Sj..'--
APPENDIX B
"IN-SERVICE TESTING OF PAPI AT NEWARK AIRPORT (EWR)"
(December 1, 1980)
47
b8put b. DOT/FAA/RD-81/95DOT/FAA/CT81/79
IN-SERVICE TESTING OF THEPRECISION APPROACH PATH INDICATOR (PAPI)
AT NEWARK INTERNATIONAL AIRPORT, NEW JERSEY
Bret B. Castle
FEDERAL AVIATION ADMINISTRATION TECHNICAL CENTERAtlaim City AirpfL. Now Jweruy 66
,06 T ILI
INTERIM REPORT
DECEMBER 101
Document is available to the U.S. public throughthe National Technical Information Service.
Springfield, Virginia 22161.
1. S. 11PARTUNN OF TIANSPSUTATIONFEKUL AVIADI11 AIUTI
laskhlte 3. C. YIN
-7--74.
Techlicel Uqest Decummeatatl Pae
N-SERVICE TESTING 0F THI PEECISIOU APPROACIR PATH sbr91
NDICATOIL (PPIl) AT MI'ARK INTERNATIONAL AIRPORT. ~d
Adw 5 Bre B. CstleDOT/PMAICT-81 /79
ederal Aviton Adiistration
tiantic City Airport, New Jersey 08405 081-502-51013. Ty,. .9 R.p.* -4, P.,..d C....d
12. Sp--... L, ,N.....JAM..J.S. Department of Transportation Interim ReportFederal Aviation Administration Dec. 8, 1980 to April 8, 19815ystems Research and Development Service 14. Sp '. A9g... C.d.
Washington, D.C. 20590
MS S"P9I'V N.M.I
NHAFEC" referenced in this report is now known as the FAA Technical Center.
16. Ab..,
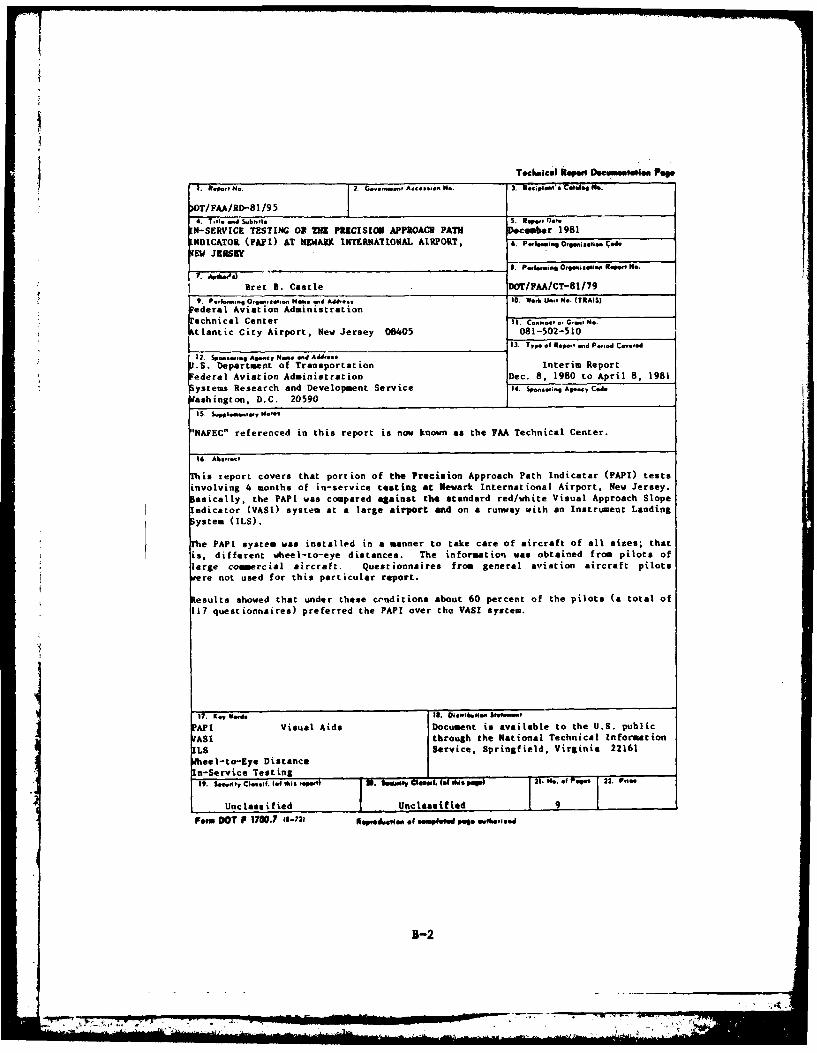
is report covers that portion of the Precision Approach Path Indicatar (PAPI) teats
involving 4 months of in-service testing at Newark International Airport, New Jersey.asically, the PAPI was compared against the standard red/white Visual Approach Slope
Indicator (VASI) system at a large airport and on a runway with an Instrument Landing
he PAPI system was installe'd in a manner to take care of aircraft of all sizes; thatis, different wheel-to-eye distancea. The information was obtained from pilots oflarge commercial aircraft. Questionnaires from general aviation aircraft pilotsere not used for this particular report.
Results showed that under these co'nditions about 60 percent of the pilots (a total of117 questionnairesi) preferred the PAPI over the VASl system.
IK*y 5.,d. Is. oifmbw~i 5.eAPI Visual Aide Document is available to the U.S. public
ASI through the National Technical Information
ILS Service, Springfield, Virginia 22161
Weel-to-Eye DistanceIn-Service Testing19. 1...ety C16..f. (of this ..wof . l a. (o IN& *so 21. Me. .9 .s 22. P,4"
Unclassified Unclassified -9
Fes. DOT F 1700.7 (1-M *.opfeAwfe of comple pose 5.0."'1 sed
B-2
TABLE OF CONTENTS
Page
INTRODUCTION
Purpose
DIS~CUSSIONI
GeneralI IEquipment I
RE SULTS I
Test ISumma ry 3
APPENDIX
B-3
& ___________MEOW_
LIST OF TABLES
Table Page
I Percentage of Types of Aircraft 2
2 A Percentage Comparison of PAPI with VASt 2
B-4
4
.71 7-7t . .
A ll.'
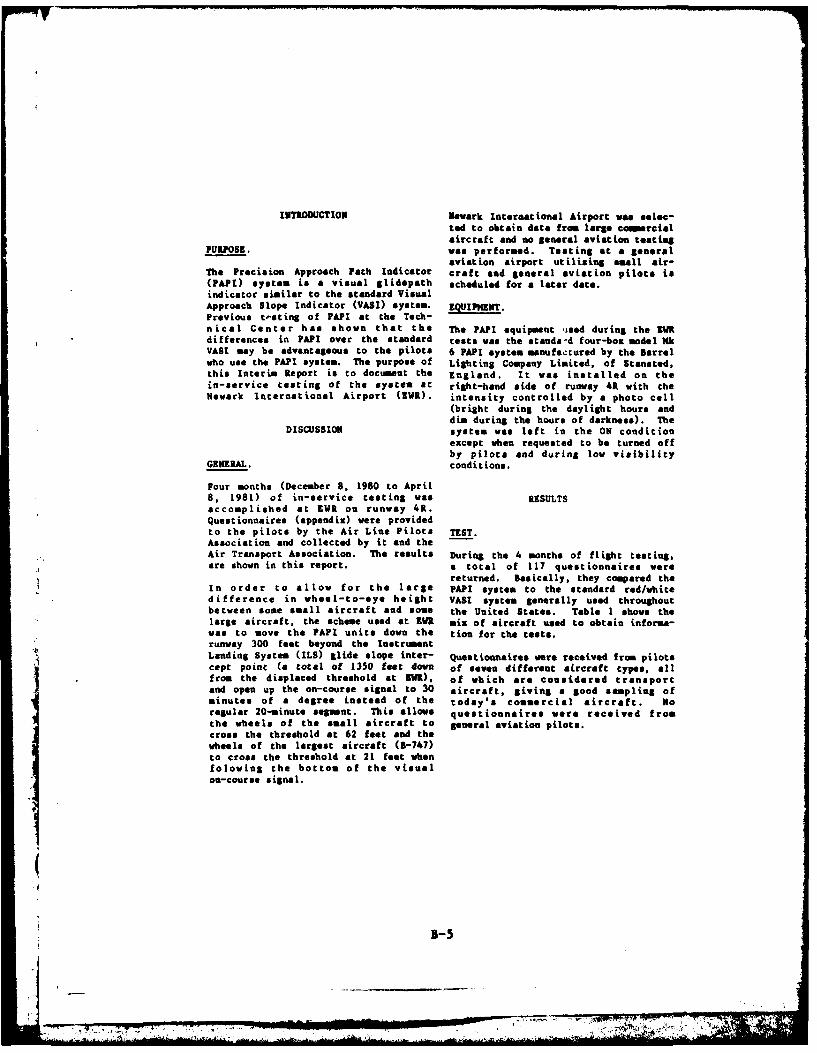
INTRODUCTION Newark international Airport was selec-ted to obtain data from large commercialaircraft and so general aviation testing
PURPOSE. was performed. Testing at a general
aviation airport utilizing small air-The Precision Approach Path Indicator craft and general aviation pilots is(PAPI) system is a visual glidapath scheduled for a later date.indicator similar to the standard VisualApproach Slope Indicator (VASI) system. EQUIPMENT.Previous tat ing of PAPI at the Tech-nical Center has shown that the The PAPI equipment used during the ZWRdifferences in PAPI over the standard tests was the standa-d four-box model 1kVASI may be advantageous to the pilots 6 PAPI system manufactured by the Barrelwho use the PAPI system. The purpose of Lighting Company Limited, of Stansted,this Interim Report is to document the England. It was installed on thein-service testing of the system at right-hand side of runway 41 with theNewark International Airport (Mi). intensity controlled by a photo cell
(bright during the daylight hours and
din during the hours of darkness). TheDISCUSSION system vas left in the ON condition
except when requested to be turned offby pilots and during low visibility
GENERAL. conditions.
Four months (December 8, 1980 to April8, 1981) of in-service testing was RESULTS
accomplished at EWR on runway 4R.Questionnaires (appendix) were providedto the pilots by the Air Line Pilots TEST.
Association and collected by it and theAir Transport Association. The results During the 4 months of flight testing,are shown in this report, a total of 117 questionnaires were
returned. Basically, they compared theIn order to allow for the large PAPI system to the standard red/whitedifference in wheel-to-eye height VASI system generally used throughoutbetween some small aircraft and some the United States. Table I shows thelarge aircraft, the scheme used at tWLt mix of aircraft used to obtain informs-was to move the PAPI units down the tion for the tests.runway 300 feet beyond the InstrumentLanding System (ILS) glide slope inter- Questionnaires were received from pilotscept point (a total of 1350 feet down of seven different aircraft types, allfrom the displaced threshold at till), of which are considered transport
and open up the on-course signal to 30 aircraft, giving a good sampling ofminutes of a degree instead of the today's commercial aircraft. No
regular 20-minute segment. This allows questionnaires were received from
the wheels of the small aircraft to general aviation pilots.cross the threshold at 62 feet and thewheels of the largest aircraft (1-747)to cross the threshold at 21 feet whenfolowing the bottom of the visualon-course signal.
7
, B-s
"t -"- : ... . :, . . ,. . ,., . " ' • , , :°•. . . ,-; ;-;. " ',' : ,% - -, '
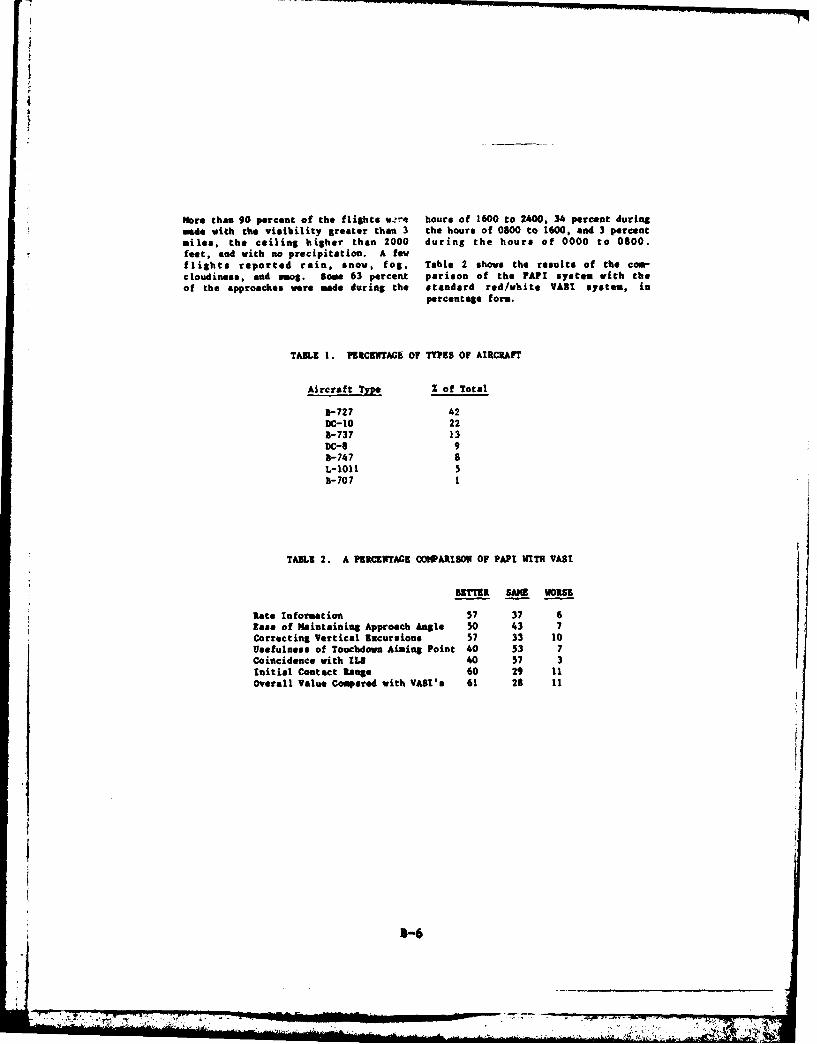
more than 90 percent of the flights 9-4r hours of 1600 to 2400, 34 percent duringmade with the visibility greeter than 3 the hours of 0500 to 1600, and 3 percentmiles. the ceiling higher than 2000 during the hours of 0000 to 0500.feet, and with no precipitation. A fewflights reported rain, snow, fog, Table 2 shows the results of the comn-cloudiness, and smog. sow 63 percent parison of the PAP! system with theof the approaches were made during the standard red/white VABI system, in
percentage form.
TABLE 1. PV.RCZNTAGZ OF TYPES OF AIRCRAFT
Aircraft Type 2 of Total
3-727 42DC-10 223-737 13DC-S 91-747 aL-1011 53-707 1
TABLE 2. A PERCENTAGE COMPARISON OF PAPI WITH VASI
BETTER SAME WORSE
Rate Information 57 37 6Ease of Maintaining Approach Angle s0 43 7Correcting Vertical Excursions 57 33 10Usefulness of Touchdown Aiming Point 40 53 7Coincidence with ILl 40 57 3Initial Contact Range 60 29 11Overall Value Compared with VAST's 61 26 it
3-6
............-
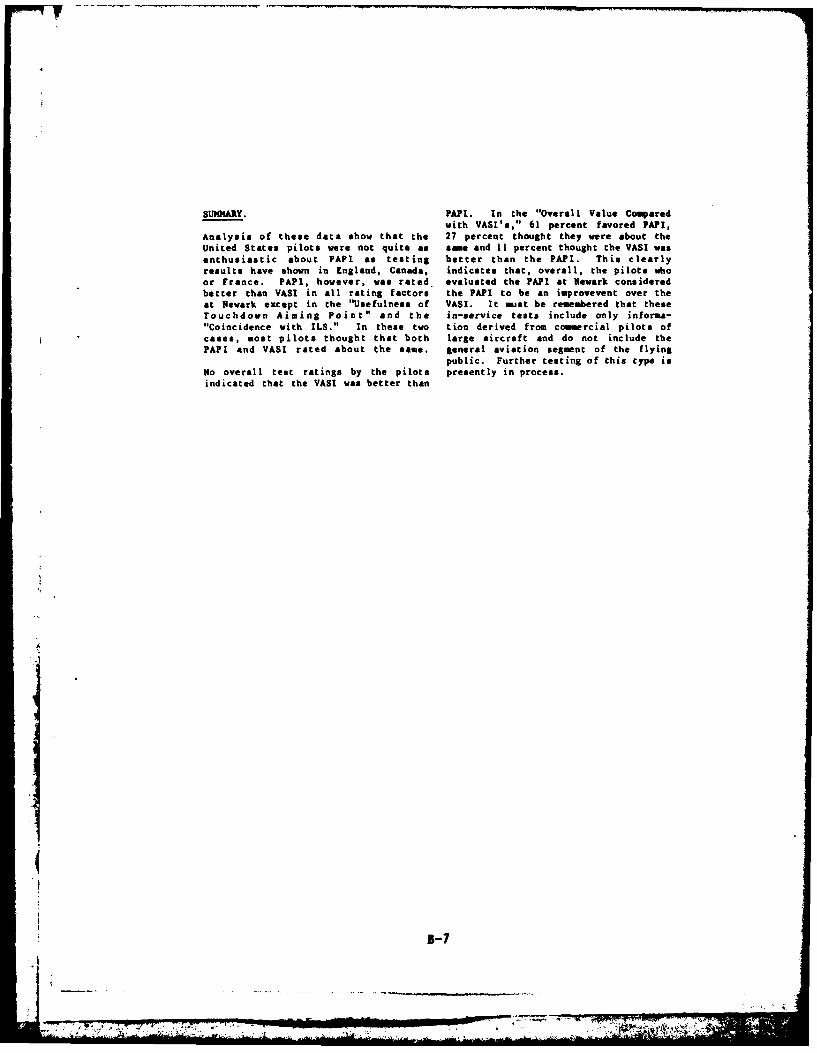
SUMOtARY. PAP!. In the "Overall Value Comparedwith VASI's," 61 percent favored PAPI,
Analysis of these data show that the 27 percent thought they were about theUnited States pilots were not quite as same and 11 percent thought the VASI wasenthusiastic about PAPI as testing better than the PAPI. This clearlyresults have shown in England, Canada, indicates that, overall, the pilots whoor France. PAPI, however, was rated evaluated the PAPI at Newark consideredbetter than VASI in all rating factors the PAPI to be an improvevent over theat Newark except in the "Usefulness of VASI. It must be remembered that theseTouchdown Aiming Point" and the in-service tests include only informa-"Coincidence with ILS." In these two tion derived from commercial pilots ofcases, most pilots thought that both large aircraft and do not include thePAPI and VASI rated about the same. general aviation segment of the flying
public. Further testing of this type isNo overall test ratings by the pilots presently in process.indicated that the VASI was better than
B-7
"-i .. . ... . ... .. . ... ....__ _
.... . . ... . . . + . +. . . .. . ..
APPENDIX
QUESTIOW' IRE3 AND SAMPLE COMMENTS
Titurs, A-1 is a a~u matt.o of the results of thequestionnaires recc.!",:d from the 3117 pilots whoflow the system at Newark. It also containssamples of the majority of comments received fromthe pilot.
Po wl
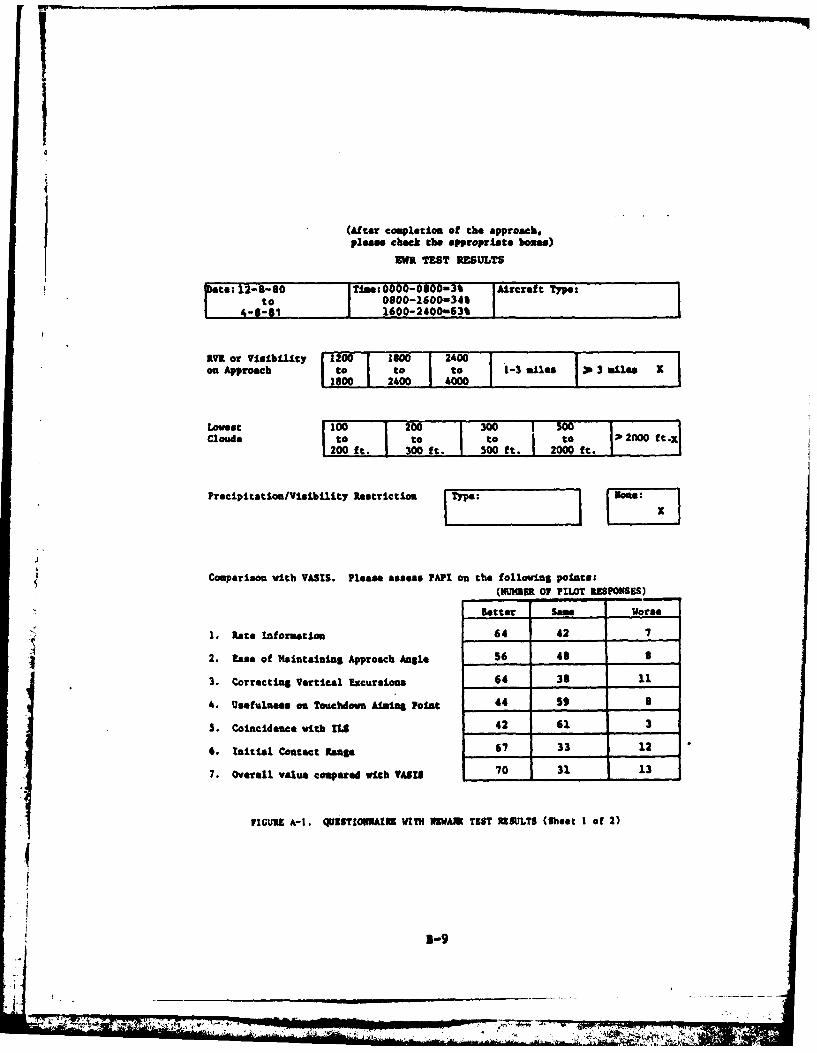
(After completion of the approach.Please check the appropriate boxe")
XKR TEST RESULTS
te; 12-S-SO :000~0m00 Aircraft Type:
LYE or Visibility 120 ISM00 2400on Approach to to to 1-3 l"ee ~ 3fail"
17800 2400 4000o
Lowest I100 200 1 0 00
I200 ft. I 300ft 5 00 ft. 2Q 2000
Preipiaton/isbiltyRestriction [ype: iiiiii:
Comparison with VASIS. Please asesas PAPI on the following points:(MUNER 0F PILOT RESPONSES)
Better Same Worse
1. Rate Information 64 42 7
2. Ease of Maintainn Approach Angle 56 48 ______
3. Correcting Vertical Excursions 64 33 11
4. Usaefulness on Touchdown Lining Point ______ 59____
S. Coincidence with IL 42 61 3
6. Initial Contact Range 67 33 12
7. Overall value compared with VASEIS 70 31 -13
FIGURE A-1. QUZ$TtOIUNAtU WITH IEWAN TEST RESULTS (Meet I of 2)
1-9
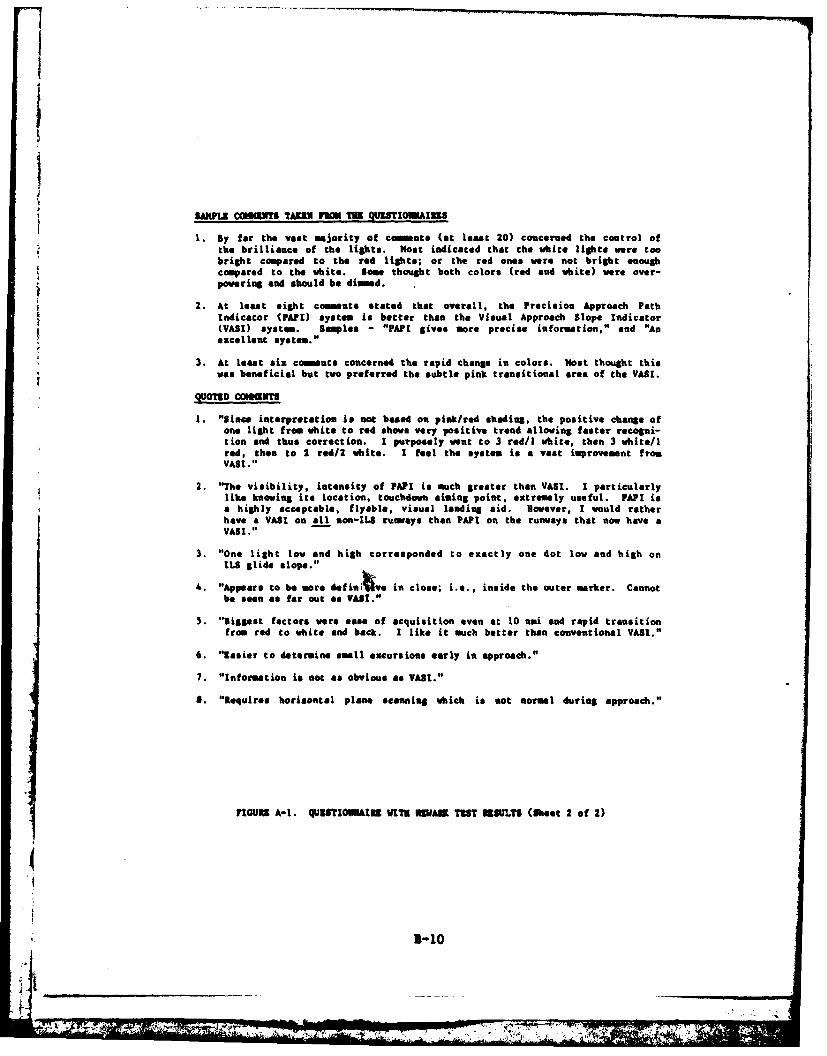
II
SAKPL COM rTM T UG TiU (3UJSTOUAIMS
I. By for the vast majority of comments (at least 20) concerned the control ofthe brilliance of the lights. Moat indicated Chat the white lights vere toobright compared to the red lishts; or the red ones were not bright enoughcompared to the white. Sow thought both colors (red and white) were over-powering and should be dined.
2. At leat eight comments stated that overall, the Precision Approach Path
Indicator (PAPI) system is better than the Visual Approach Slope Indicator(VAST) system. Samples - "PAPI gives more precise information," and "Anexcellent system."
3. At least six coments concerned the rapid change in colors. Most thought thisvas beneficial but tvo preferred the subtle pink transitional ares of the VAST.
QUOTED COWMTS
1. "Since interpretation is not based on pink/red shading, the positive chanse ofone light from white to red shows very positive trend allowing faster recogni-tion and thus correction. I purposely went to 3 red/i white, then 3 white/lred, then to 2 red/2 white. I feel the system is a vast improvement fromVAST."
2. "The visibility, intensity of FAPI is much greater than VAST. I particularlylike knowing its location, touchdown aiming poiftt, extremely useful. PAPI isa highly acceptable, flyable, visual landing aid. However, I would ratherhave a VAST on all non-ILS runways than PAPI on the runways that now have aVAST."
3. "One light low and high corresponded to exactly one dot low and high on1LS glide slope."
4. "Appears to be more defini~Lve in close; i.e., inside the outer marker. Cannotbe seen as far out as VASI."
S. "Biggest factors were ease of acquisition even at 10 ni and rapid transition
from red to white and back. I like it such better than conventional VAST."
6. "Easier to determine small excursions early in approach."
7. "Information is not as obvious as VAST."
S. "lequires horizontal plane scanning which is not normal during approach."
FIGURZ A-I. QU96TESAIRB WETH NEWARK TST MSULTI ($eet 2 of 2)
5-10
d.
4, -J-lO
APPENDIX C
"PAPI FLIGHT TEST RESULTS AT TETERBORO AIRPORT (TnB)"
(February 1982)

DATA REPORT
PRECISION APPROACH PATH INDICATOR (PAPI)FLIGHT TEST RESULTS AT TETERBORO, N.J. (TEB) AIRPORT
FEBRUARY 1982
DEPARTMENT OF TRANSPORTATIONFederal Aviation Administration
FAA Technical CenterAirport Technology Division
Atlantic City Airport, NJ 08405
C-I
*
|z II ' "S
PRECISION APPROACH PATH INDICATOR (PAPI)FLIGHT TEST RESULTS AT TETERBORO, N.J. (TEB) AIRPORT
PURPOSE.As a part of the overall evaluation of the Precision Approach
Path Indicator (PAPI) system, 3 months of inservice testing wasaccomplished at Teterboro during October, November, and Decemberof 1981. This was done specifically to obtain the assessment ofgeneral aviation pilots concerning the PAPI system.
DISCUSSION.
Previous evaluation of the PAPI system has been performed at theFederal Aviation Administration (FAA) Technical Center and atNewark International Aieport where an evaluation by user pilotswas obtained. At Newark, the PAPI system was installed to allowfor different eye-to-wheel distances of all aircraft includinglarge wide-bodied aircraft such as the B-747. It was installedon an Instrument Landing System (ILS) runway (runway 4R) where itcould be checked against the ILS system. As it turned out, noquestionnaires were obtained (at Newark) from general aviationpilots, and it was decided to make a concerted effort to get thereaction of general aviation pilots by moving the PAPI system toTEB where almost all of the air traffic is either business orprivate aircraft. The "FAA Air Traffic Activity" report for 1979documents the fact that TEB has more general aviation traffic thanany airport in the local States of New Jersey, Pennsylvania,Delaware, and Maryland; and runway 19 is one of the busiest onthat airport. It was therefore decided to install the PAPI systemon the non-ILS runway 19 at TEB.
TEST PROCEDURES.
The same Barrel Lighting Co. Ltd. units used at Newark were installed-0 at TEB on runway 19 in place of the standard red/white Visual
Approach Slope Indicator (VASI) system at that location.
The PAPI system was located on the left-hand side of the runway,813 feet down from the threshold in the same configuration as usedat Newark. The inboard unit was located 50 feet from the edge ofthe runway, and each of the other three were located 33 feet out-ward from the previous unit as shown in fiqure 1. Eastern Regionpersonnel helped install the system on cement pads at the properlocations. The angles of the units were set so that each path was20 minutes of an arc deep starting at a high angle of 3030'. Thethree transitions to the next lower paths were set at 3010', 2050,and 2030. on the low side. This provided the on-course signal(two red and two white) at 3 degrees; with the above-course (threewhite and one red) sign&. at 3 1/3 degrees, and the fly-down(four white) signal at any approach angle above 3h degrees.Conversely, the below-course (three red and one white) signal wasat 2 2/3 degrees and the fly-up (four red) signal was any approachangle below 2 degrees.
C-2
*IN
........ ........ 7
The Aircraft Owners and Pilots Association (AOPA) furnished thequestionnaires for the pilots along with a letter of explanation(see figures 2 and 3). They also collected the questionnaires asthey were received. TEB has six Fixed Base Operators (FBO's) onthe airport, and a display (see figure 4) concerning PAPI was setup at each FBO for distribution of the questionnaires. AOPA alsodistributed questionnaires to their local members via the U.S.mail.
TEST RESULTS.
Three months of inservice testing was accomplished betweenSeptember 21 and December 21, 1981. Over 300 questionnaires weredistributed and picked up at TEB, which gave us an indication thata lot of interest was being shown in the PAPI. However, we receiveda total of only 17 questionnaires from pilots who flew the PAPI atTEB. The reasons for this must include the fact that the prevail-ing winds at that time of the year turned .out to be in the wrongdirection for use of runway 19. Normally, runway 19 is used about-30 percent of the time; however, the record shows that duringOctober, runway 19 was used 17 percent of the time; duringNovember it was used 8 percent of the time; and during December itwas used 8 percent of the time. Other geasons could include alack of pilot interest, and the fact that the PATCO Controllersstrike was on and the Controllers were extremely busy and couldnot spend time telling pilots about PAPI.
A summary of the data results is included as appendix A to thisreport. No conclusions are included in this data report, andfurthez testing is planned for more general aviation pilot comments.
II
I!
t-3
* 7
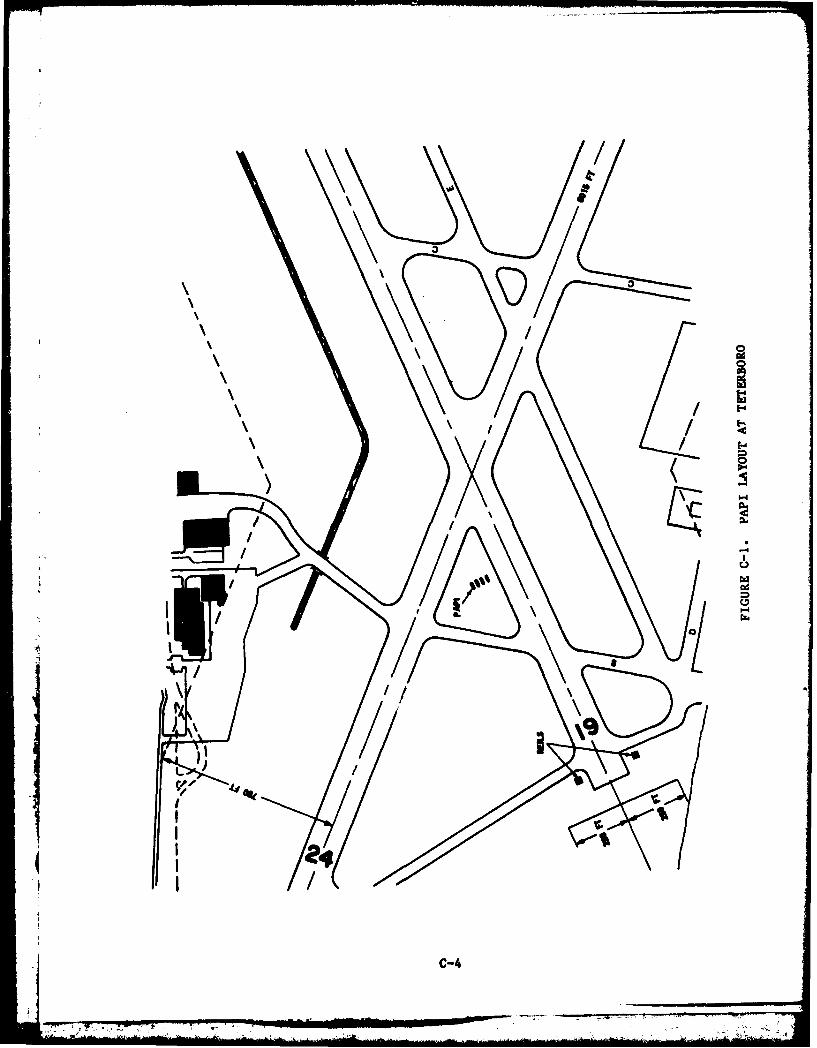
C-44
"Ono"
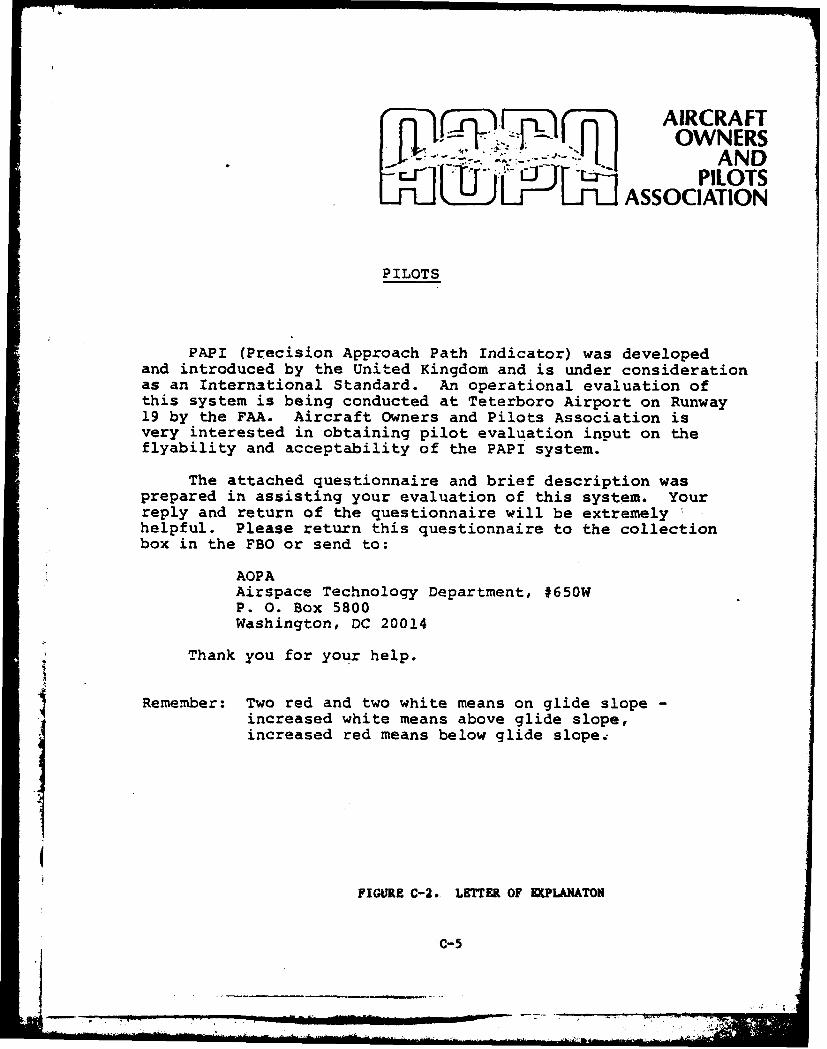
AIRCRAFTOWNERS
• -- ""- ANDPILOTS
ASSOCIATION
PILOTS
PAPI (Precision Approach Path Indicator) was developedand introduced by the United Kingdom and is under considerationas an International Standard. An operational evaluation ofthis system is being conducted at Teterboro Airport on Runway19 by the FAA. Aircraft Owners and Pilots Association isvery interested in obtaining pilot evaluation input on theflyability and acceptability of the PAPI system.
The attached questionnaire and brief description wasprepared in assisting your evaluation of this system. Yourreply and return of the questionnaire will be extremelyhelpful. Please return this questionnaire to the collectionbox in the FBO or send to:
AOPAAirspace Technology Department, #650WP. 0. Box 5800Washington, DC 20014
Thank you for your help.
Remember: Two red and two white means on glide slopeincreased white means above glide slope,increased red means below glide slope.
I
FIGURE C-2. LETTER OF EXPLAMATON
C-5
-.. , a l . . . . . ' ' '' .. " : -
:: "
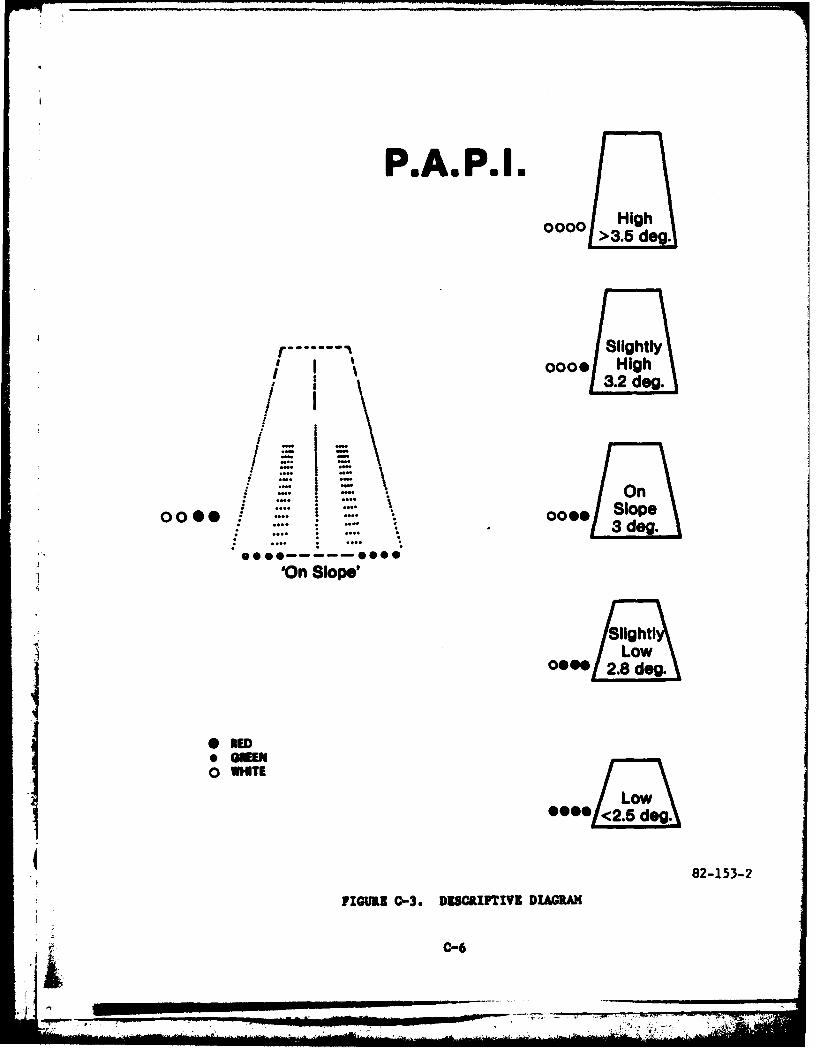
P.A.P.I.
0000 High>3.5 dog.
r Slightly/ Iooo* High
3.2 dog.
/On000:: 0000* Slope
3 dog.
......-- .***'On Slope'
Low
eg
000/.1 dog.
* Q oUEN0 V MT EL
o
82-153-2
.IG. •C•-3. DIS SIPTIVI DAGRAM
C-6
4, -
ee
- - - - - - - - - - - - -- - - - - - - - - - - - - -
EVER HEARD"OF
Fn 0
TRY IT ONU.~ ~at
And AnswerOur OQuestionnaire
FIGURE C-4. PAP! DISPLAY
C-7
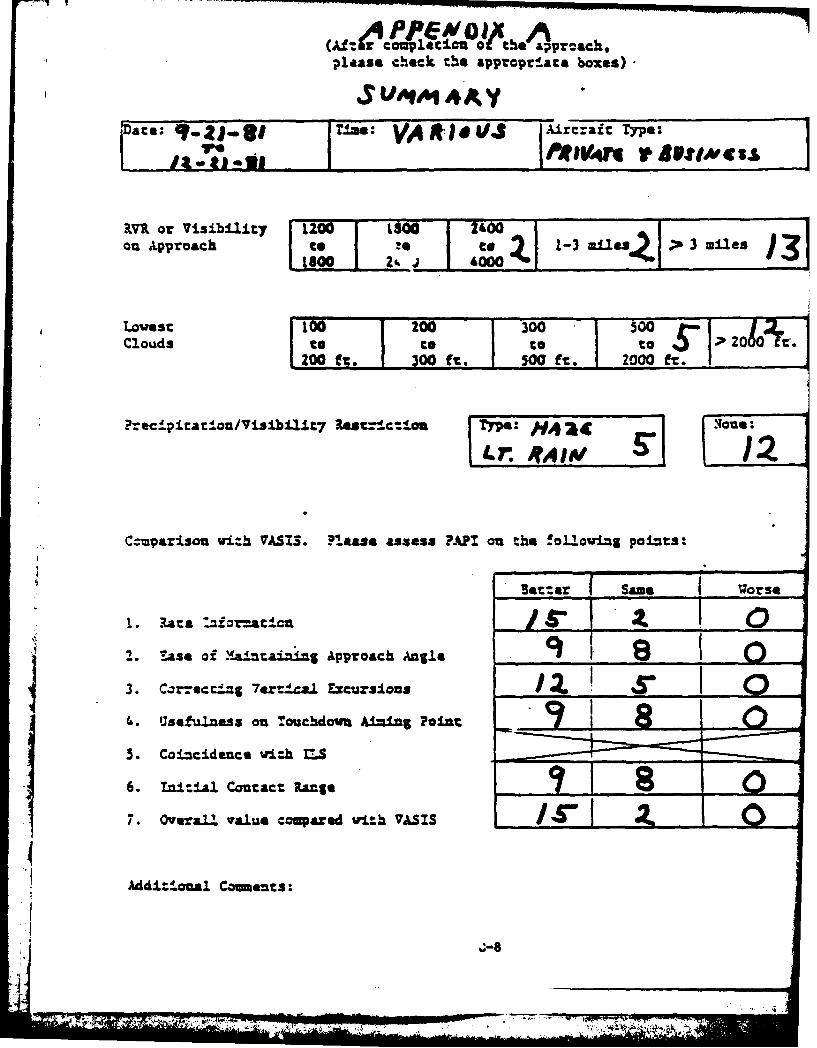
please check the appropriate boxes).
Mate: n" VA DI, / Aircraic Type:
.RV or Visibility 1100 I SO " 2400ou Approach [ " / I t, o 1-3 -.les 3miles'3
1800 &00 3
Lowest 100 200 300 5-001Clouds to t. to to 20SO .
200 f.. 00 fr.. 500 ft. 200.
P.-ecitrar'on/Visibi1.t7 Ras:c=c:co Type: H4 24 a
RAIW
Czmarlson w,.h VASIS. Piaase assess P.AP! o the !o01lowing poi ts:
3e:zar | Same Worse
.. Ua:mfo,-at i. 0A2. Ease of .± .tai zug Approach Angle _ _ 0
3. Crectz.;g 7errt.csl ExcursionsI Ida. Usefulness on Touchdown Aiming Point
5. Coincidence with r-S______
6. IniziaJ. Contact Range _____
7. Overall value coupared withP~ VASISIS
Addi:ioual Coments:
. .. o .,, ,8+-. ,, .
APPENDIX D
"FLIGHT TEST RESULTS OF A NWO-BOX PAPI (ACY)"
(November 1981)
DATA REPORT
FLIGHT TEST RESULTS OF A TWO-BOX PAPITESTED AT THE FAA TECHNICAL CENTER
NOVEMBER 1981
DEPARTMENT OF TRANSPORTATIONFederal Avtatton Administration
FAA Technical CenterAir port Technology DivisionAt1antic City, NJ 08201
D-1
71771j
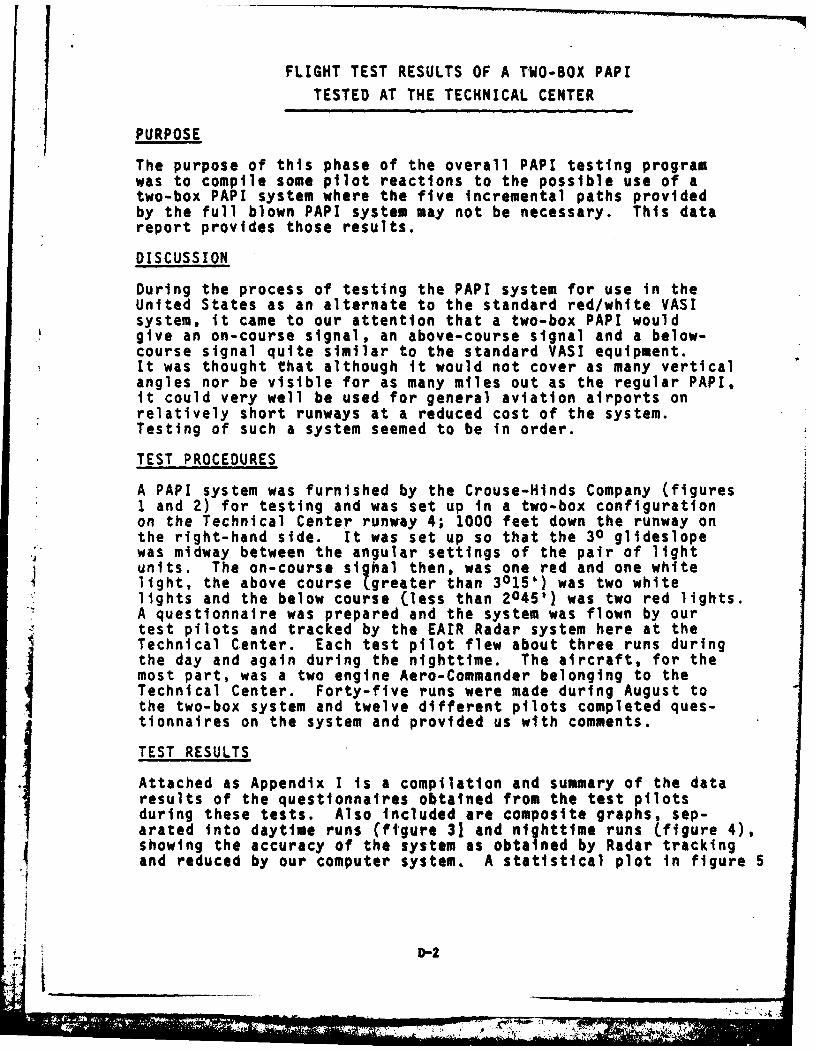
FLIGHT TEST RESULTS OF A TWO-BOX PAPI
TESTED AT THE TECHNICAL CENTER
PURPOSE
The purpose of this phase of the overall PAPI testing programwas to compile some pilot reactions to the possible use of atwo-box PAP! system where the five incremental paths providedby the full blown PAPI system may not be necessary. This datareport provides those results.
DISCUSSION
During the process of testing the PAPI system for use in theUnited States as an alternate to the standard red/white VASIsystem, it came to our attention that a two-box PAPI wouldgive an on-course signal, an above-course signal and a below-course signal quite similar to the standard VASI equipment.It was thought that although it would not cover as many verticalangles nor be visible for as many miles out as the regular PAPI.it could very well be used for general aviation airports onrelatively short runways at a reduced cost of the system.Testing of such a system seemed to be in order.
TEST PROCEDURES
A PAPI system was furnished by the Crouse-Hinds Company (figures1 and 2) for testing and was set up in a two-box configurationon the Technical Center runway 4; 1000 feet down the runway onthe right-hand side. It was set up so that the 30 glideslopewas midway between the angular settings of the pair of lightunits. The on-course si hal then, was one red and one whitelight, the above course (greater than 30151 ) was two whitelights and the below course (less than 2045t) was two red lights.A questionnaire was prepared and the system was flown by ourtest pilots and tracked by the EAIR Radar system here at theTechnical Center. Each test pilot flew about three runs duringthe day and again during the nighttime. The aircraft, for themost part, was a two engine Aero-Commander belonging to theTechnical Center. Forty-five runs were made during August tothe two-box system and twelve different pilots completed ques-tionnaires on the system and provided us with comments.
TEST RESULTS
Attached as Appendix I is a compilation and summary of the dataresults of the questionnaires obtained from the test pilotsduring these tests. Also tncluded are composite graphs, sep-arated into daytime runs (figure 31 and nighttime runs (figure 4),showing the accuracy of the system as obtained by Radar trackingand reduced by our computer system. A statistical plot in figure 5
D-2
7* ii
-w ".. . .. . . . . . ...... III.... . .-.-- . .--
I p- ---
2
provides a graph that is broken down into 200 foot segments4 of range. Bach range segment, when drumn together# provides
a linear regression line. Lines representing the + 3'-deviation indicate that 99.74 percent of all aircraft flyingthe PAPI. would remain within this corridor. The data obtainedis offered without ccment for this data report. Furthertesting of this type is planned and will be included in the
final report of PAPI.
D-3
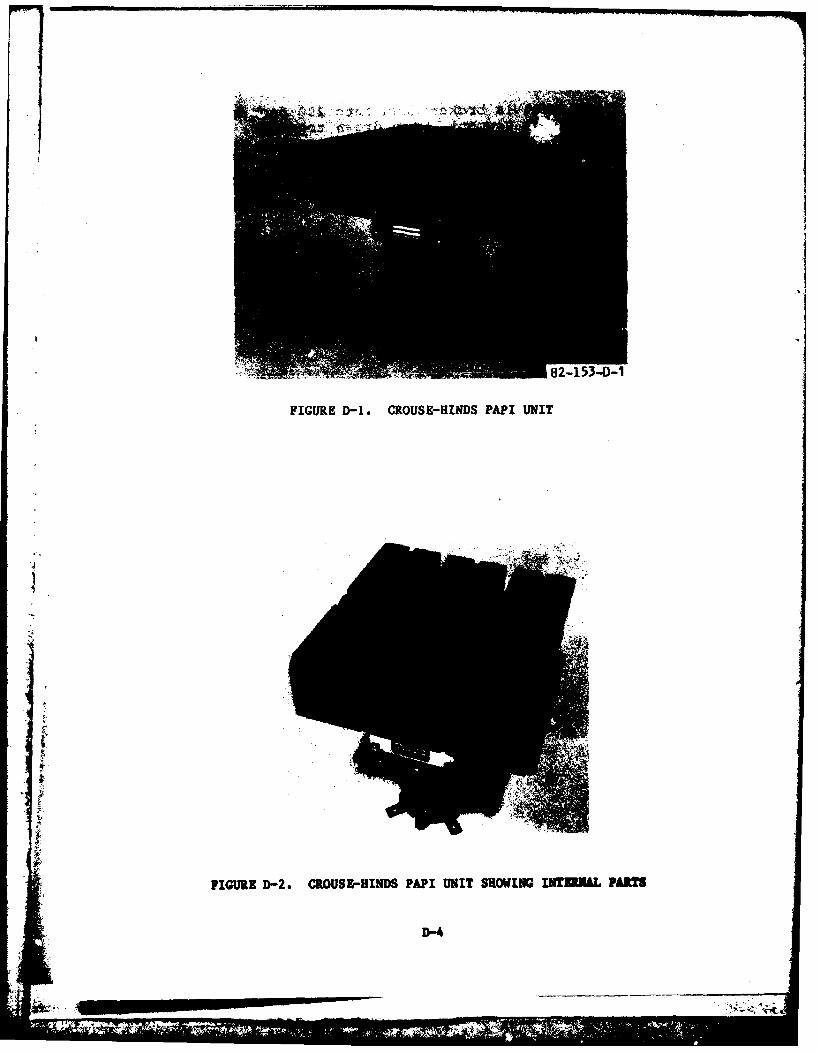
FIGURE D-1. C ROUSE-HINDS PAPI UNIT
FIGURE D-2.* CROUSE-HINDS PAPI UNIT SHOWING IIITEA PARTS
D-4
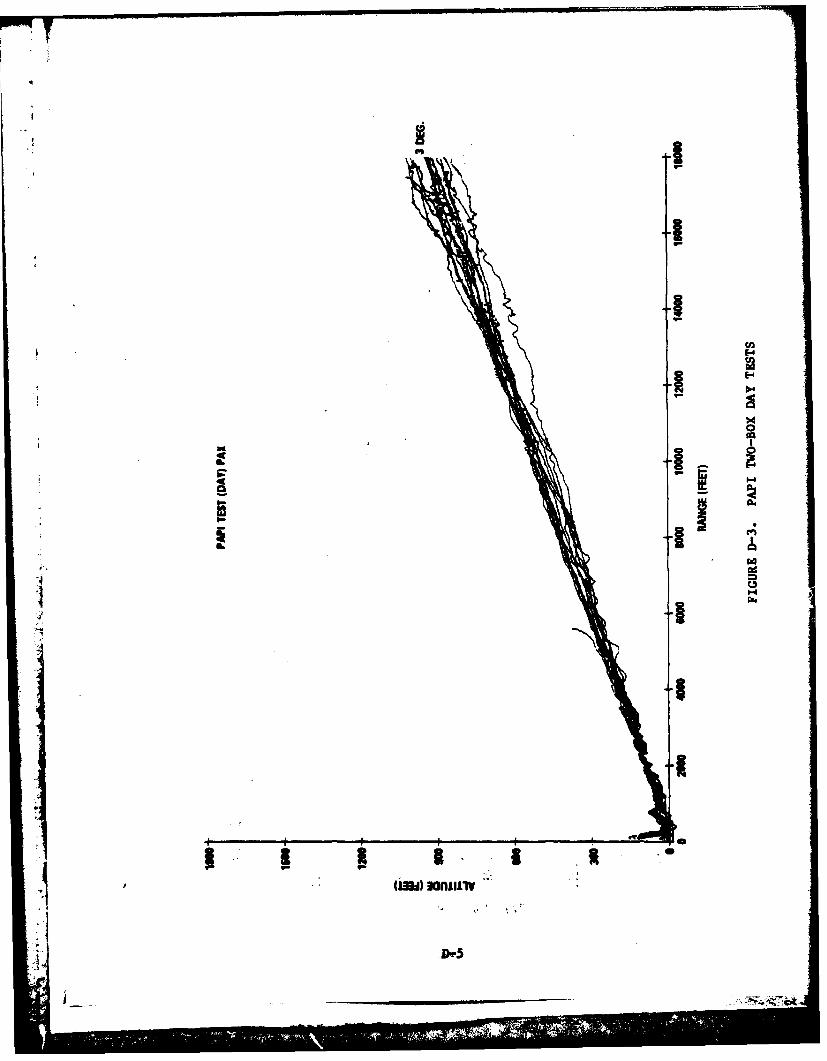
U *-4p,
0
oftC
tam 32-li
mole ,
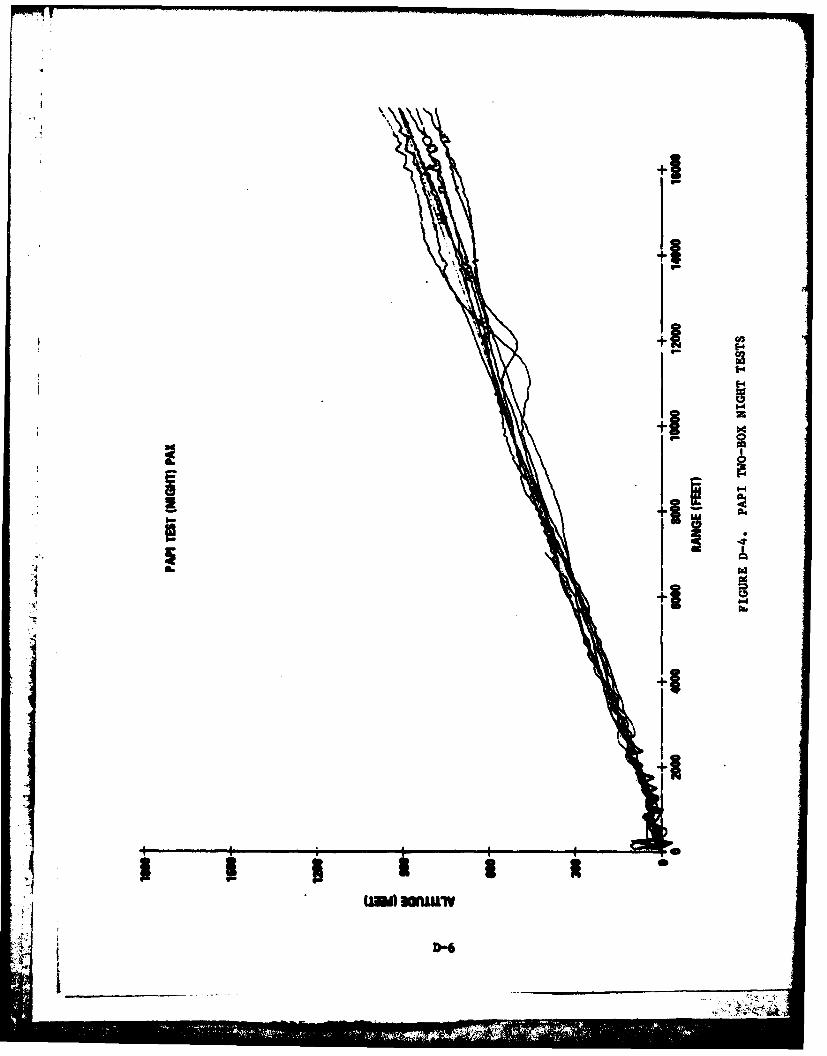
\ \
~1
±1
±1
±1 =
I
0. +1 Ibe
~1
~1
* 3 0 0
p - S
urn) NflLSL1V
I
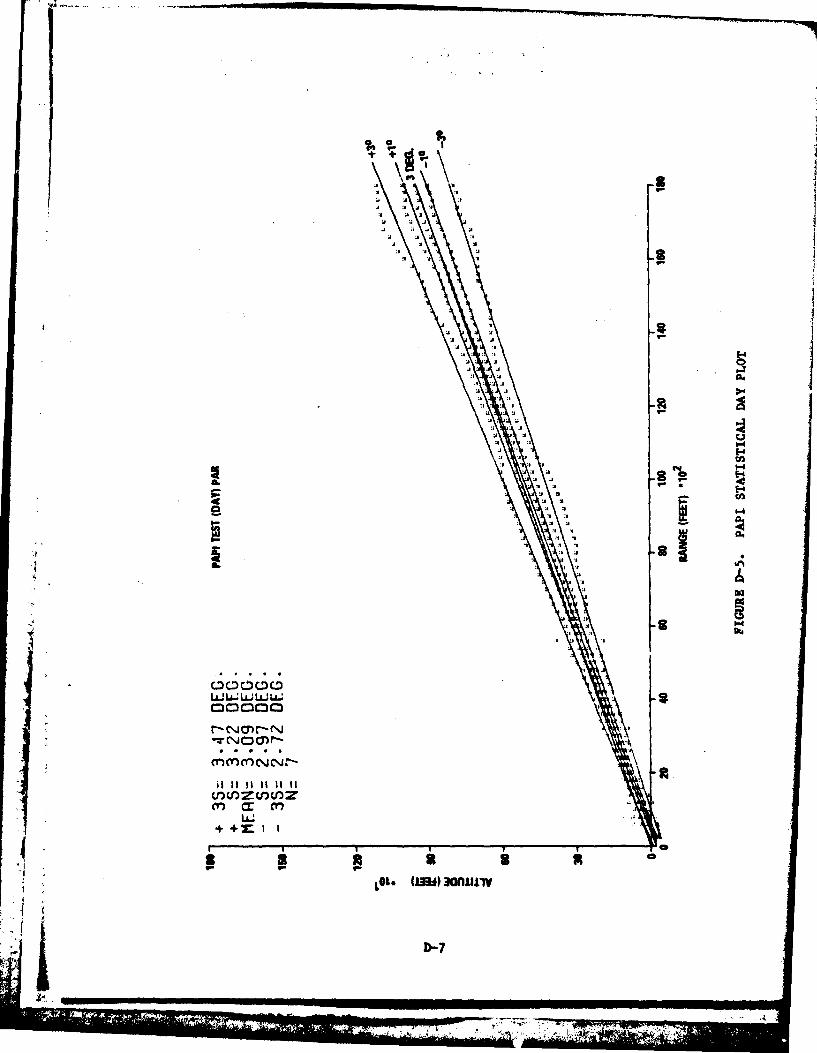
.1.
A-
.4 CI-iCDC
04 4-4
D-74
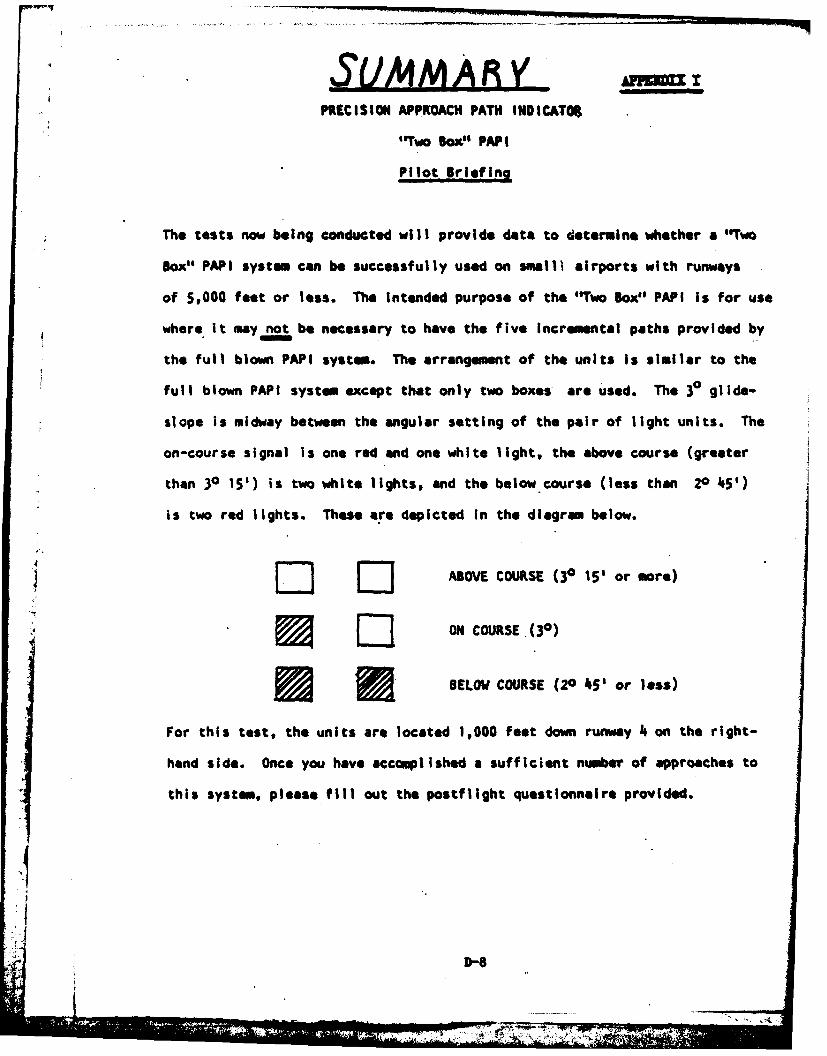
PRECISION APPROACH PATH INDICAT09
"Two Box" PAPI
Pilot Briefing
The tests now being conducted will provide data to determine whether a "Two
Box" PAPI system can be successfully used on smalli airports with runways
of 5,000 feet or less. The intended purpose of the "Two Box" PAPI is for use
where it may not be necessary to have the five incremental paths provided by
the full blown PAPI system. The arrangement of the units is similar to the
full blown PAPI system except that only two boxes are used. The 30 glide-
slope is midway between the angular setting of the pair of light units. The
on-course signal Is one red and one white light, the above course (greater
then 30 15') is two white lights, and the below course (less than 20 45')
Is two red lights. These are depicted in the diagram below.
D ~ ABOVE COURSE (30 15' or more)
~ D ON COURSE (30)
~ BELOW COURSE (20 45' or less)
For this test, the units are located 1,000 feet down runway 4 on the right-
hand side. Once you have accomplished a sufficient number of approaches to
this system, please fill out the postflight questionnaire provided.
*1J
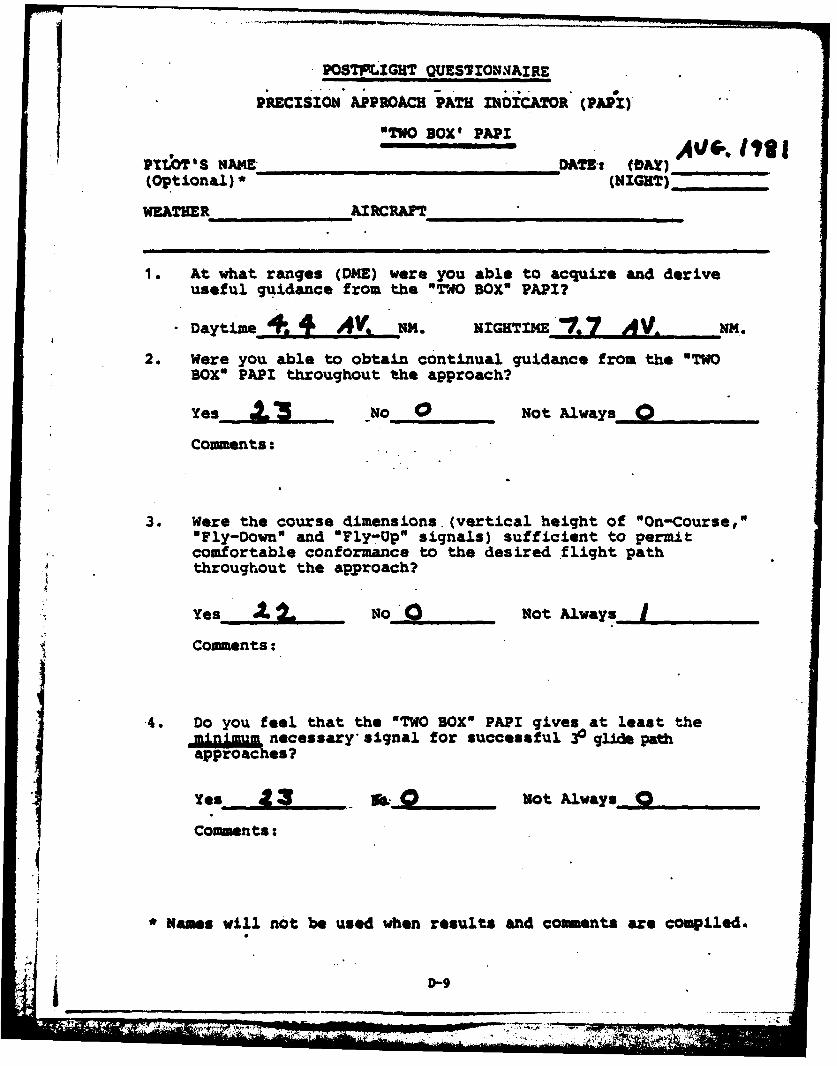
.POSTMLZGHT QUESTIONNIAIRE
PRECISION APPROACH PATH INDICATOR (PAPI)
"TWO BOX' PAPI Ao. #, lt IPm[T S NARE- DATE-: (IDAY)_.(Optional) * (NIGHT)_,
WEATHER AIRCRAFT
1. At what ranges (DME) were you able to acquire and deriveuseful guidance from the "TIWO BOX" PAP!?
Daytime+.~ 4 A V. Nx. NiG.HTIM~ AV 1*..
2. Were you able to obtain continual guidance from the "TWOBOX* PAP! throughout the approach?
YesN -o 0 Not Always 0
Comments:
3. Were the course dimensions. (vertical height of "On-Course,""Fly-Down" and "Fly-Up" signals) sufficient to permitcomfortable conformance to the desired flight paththroughout the approach?
Yes . No0 Not Alays
Comments:.
.4. Do you feel that the 'TWO BOX* PAPI gives at least thenecessary* signal for successful 3P gLdde pathapoces?
Yes 3 . Not Always0
Comments:
4
* Names will not be used when results and couments are compiled.
D-9
I| 11 I . .. .+++- - ++++++ +'- ? l'.
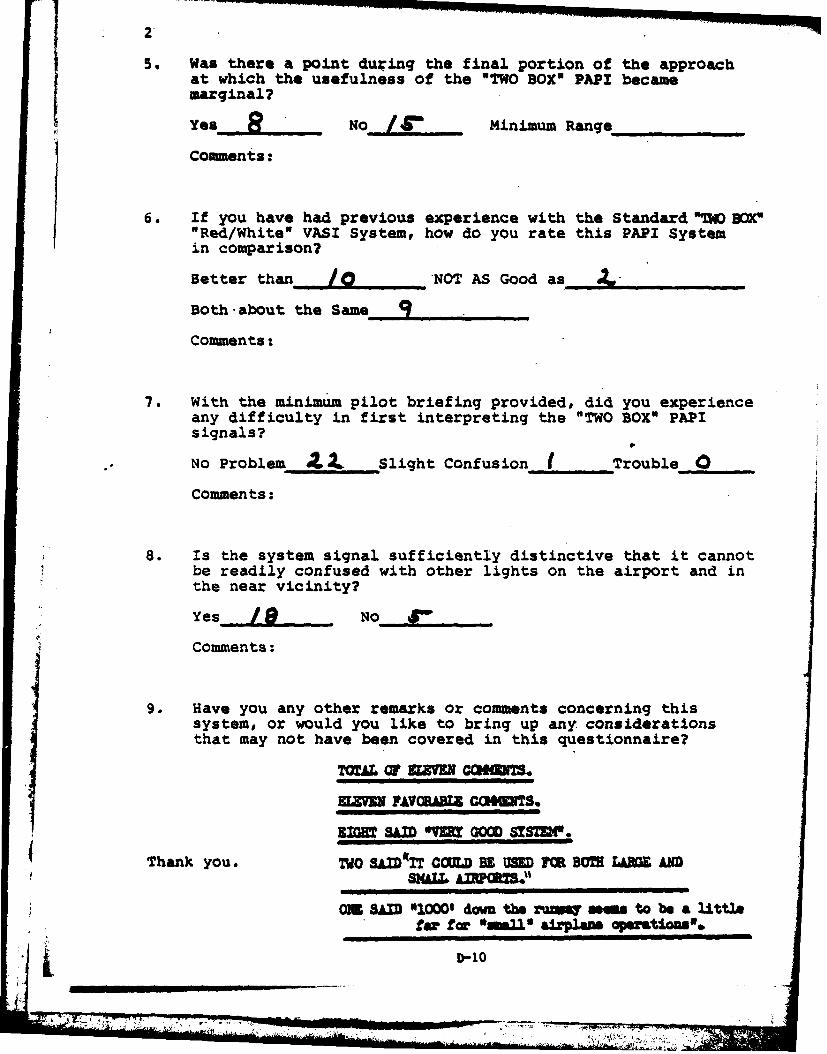
5. Was there a point during the final portion of the approachat which the usefulness of the "TWO BOX" PAPI becamemarginal?
ysNMinimum Range_______
Comments:
6. If you have had previous experience with the Standard "IM BoX""Red/White" VASI System, how do you rate this PAPI Systemin comparison?
Better than n 'NOT AS Good as A______
Both-about the Same 9
Comments:
7. With the minimum pilot briefing provided, did you experienceany difficulty in first interpreting the "TWO BOX" PAPIsignals?No Problem 22. Slight Confusion I Trouble 0
Comments:
8. Is the system signal sufficiently distinctive that it cannotbe readily confused with other lights on the airport and inthe near vicinity?
Yes No
Comments:
9. Have you any other remarks or comments concerning thissystem, or would you like to bring up any considerationsthat may not have been covered in this questionnaire?
TOTAL 07 SLEWN CQIUS.
ELEVN FAVCRADLZ COOIKUTSo
Thank you. TWO SAIDiIT COULD BE USED BOMD LANE ANDSML AWUHS."
K01 BAID '10001 down the rtaq s to be a littlefar fo toao -4rpla opwations'
I-10