Embed Size (px)
Citation preview
Illinois Biodiversity Basics 19Illinois Department of Natural Resources, Chicago Wilderness, World Wildlife Fund
Did you know that a single tree in a rain forest can behome to more than 1,000 different kinds of insects? Orthat a coral reef can support as many as 3,000 varietiesof fish and other organisms? Or that the deep oceanfloor may be home to more than 10,000 species of livingthings? The sheer number of organisms living on earthis extraordinary. So far, scientists have identified about1.7 million species worldwide, but there are actuallymany more. Estimates range from 3 million to morethan 100 million.
Activity 1-2Sizing Up Species
AT A GLANCEClassify organisms using a classification flow chart, play ateam game to find out how many species may exist withindifferent groups of organisms, and make a graph to illustratethe relative abundance of living things.
OBJECTIVESUse a classification flow chart to classify organisms. Name themajor groups of organisms and the relative number of speciesidentified worldwide and statewide in each group. Constructbar graphs that compare the number of species, both world-wide and statewide, in different groups of organisms.
SUBJECTSmathematics
SKILLSorganizing (classifying, estimating, graphing), analyzing(calculating), interpreting (relating)
LINKS TO ILLINOIS BIODIVERSITY BASICSCONCEPTUAL FRAMEWORK
species diversity; species
VOCABULARYabdomen, antennae, appendages, arthropod, bacteria,biosphere, cephalothorax, class, classification, evolution,family, fungi, genus, kingdom, order, organism, phylum,species, taxonomy
TIMEtwo class periods
MATERIALSPart I—copies of “Arthropod Pictures” and “Arthropod I.D.Chart” for each student; (optional: scissors and glue)
Part II—for each group, a stack of 100 sheets of paper, a ruler,a set of number cards; signs for organism groups; markers;tape or glue; (optional: calculator)
Part III—graph paper (four sheets per student or group); rulers;colored pencils
CORRELATION TO ILLINOIS LEARNING STANDARDSmathematics 6.C.2a, 6.C.3a, 6.D.2, 6.D.3, 10.A.2a, 10.A.3a
This activity will help your students understand howscientists classify organisms and how many specieshave been identified within various groups. They’lldiscover, for example, that there are nearly 950,000different species of insects compared to about 4,000mammal species. And there are still vast numbers ofinsects that are waiting to be identified—even thoughabout 7,000 new insect species are described everyyear! Did you know that the state of Illinois has about17,000 native insects species, but only about 60 speciesof mammals? And that there are approximately 2,500species of plants in Illinois? The state of Illinois hasmore than 54,000 species of organisms. New species arestill being discovered in Illinois. For example, in 1999,three spider species were discovered in Lake County.Much work remains to be done in identification ofinvertebrates and microscopic species.
Part I introduces students to the biological classificationsystem by guiding them through the identification ofselected orders within the Phylum Arthropoda. In PartII, students work in teams to estimate the total numberof species and the number of species in various organ-ism groups. In Part III, students learn if their estimationswere correct and then create graphs that illustrate whichorganism groups contain the most species that have beenidentified to date.
20 Illinois Biodiversity BasicsIllinois Department of Natural Resources, Chicago Wilderness, World Wildlife Fund
BEFORE YOU BEGIN! PART I
Make a copy of the “Arthropod Pictures” and the“Arthropod I.D. Chart” for each student. Depending onyour students’ choices, you may also need scissors andglue.
WHAT TO DO! PART I1. Introduce classification.
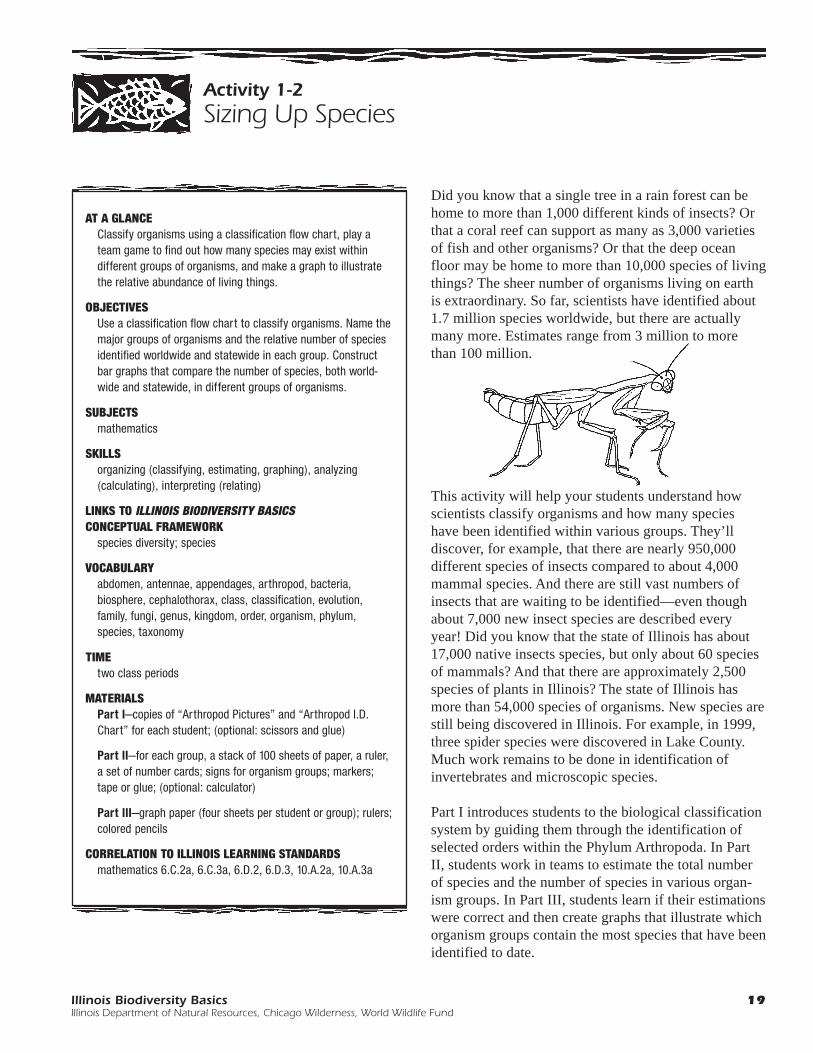
Begin by explaining to your students that scientistsclassify living things into various groups. Thesystem they use classifies organisms into ever moreclosely related groups and gives scientists from allover the world a common way to refer to particularorganisms. To give the students a sense of how thisclassification system works, use the followinginformation to compare the classification of a housecat with a dog (see “Classification Chart”). Thestudents should notice that the cat and the dog sharemany classification groupings. Cats and dogs are inthe same kingdom, phylum, class and order, butthey belong to different families. You might also askthe students to name other species that would be inthe same family as a house cat (lynx, bobcat, lion,tiger, puma and other cats) as well as other speciesthat would be in the same family as a dog (wolf,fox, coyote, jackal and so on). You can also have thestudents name nonmammal chordates (animals witha backbone like fishes, amphibians, reptiles andbirds) or noncat and nondog carnivores (bears,raccoons, weasels, mongooses and so on).
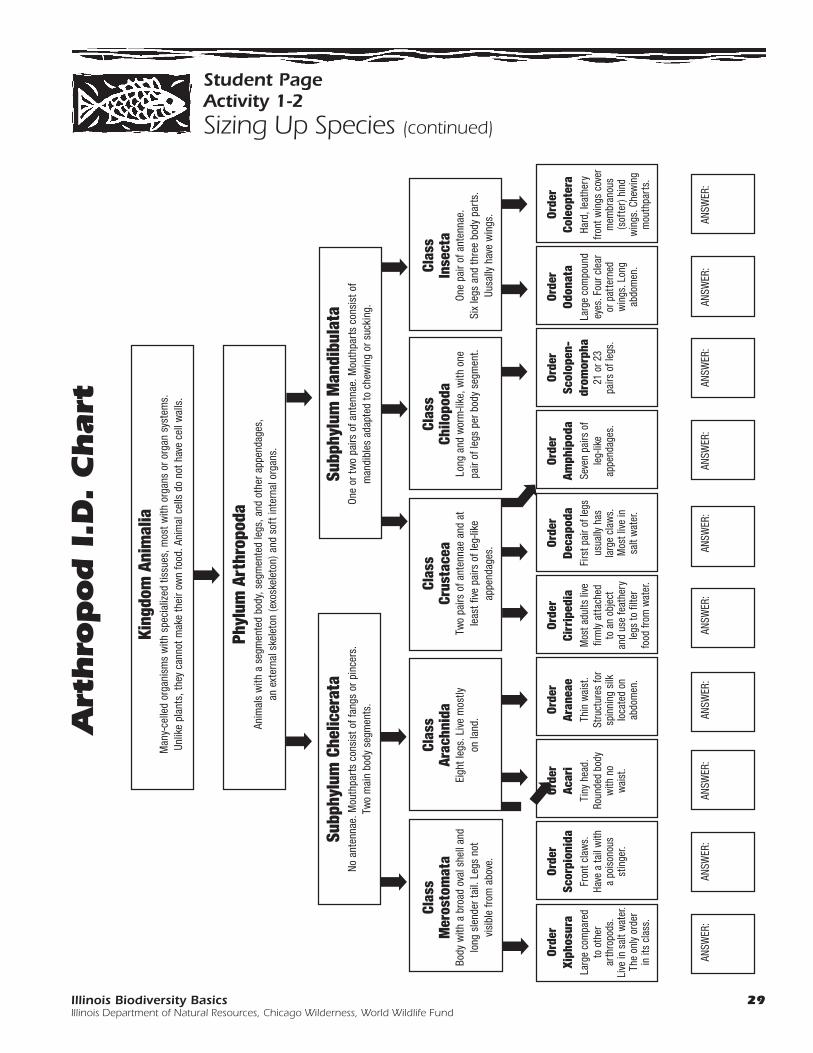
2. Use the “Arthropod I.D. Chart” to introduce theprocess of classifying organisms.Hand out a copy of the “Arthropod Pictures.”(Please note that this is a simplified chart and thatall classes and orders in the Phylum Arthropoda arenot represented.) Start by writing the names of thefive kingdoms on the board or overhead (see page30). Ask your students if they can describe some ofthe characteristics of organisms that would beclassified in each kingdom. Ask them if they canname which kingdom includes humans. Then askthem which kingdom they think the organismsincluded in the “Arthropod Pictures” belong to(Animalia). Ask them to look carefully at thedrawings and try to determine what characteristicsall these organisms share. Students may notice thatall the organisms pictured have jointed legs, anten-nae and other appendages. They may also know thatall the organisms have a hard outer shell (exoskel-eton). These common characteristics help organizethem into a group, or phylum, within the KingdomAnimalia called Arthropoda. Arthropoda means“jointed feet.”
Hand out the “Arthropod I.D. Chart” and explainthat the organisms in the Phylum Arthropoda canthen be classified into different subgroups includingsubphyla and classes, which share more specificcharacteristics. For example, arthropods that aremembers of the class Insecta have six legs and abody that is divided into three major parts—head,thorax and abdomen. Scientists use keys such as thisto identify unknown organisms and relate them toother more familiar species. Write the followingvocabulary definitions on the board to help yourstudents when using the chart.
appendageany body part that extends outward from the mainbody, or trunk, of an animal, such as a leg, claw orantenna
antenna (singular), antennae (plural)sensory appendage located on the head orcephalothorax of some arthropods
Activity 1-2Sizing Up Species (continued)
Classification Chart
House Cat DogKingdom: Animalia AnimaliaPhylum: Chordata ChordataClass: Mammalia MammaliaOrder: Carnivora CarnivoraFamily: Felidae CanidaeGenus: Felis CanisSpecies: Felis catus Canis familiaris
Illinois Biodiversity Basics 21Illinois Department of Natural Resources, Chicago Wilderness, World Wildlife Fund
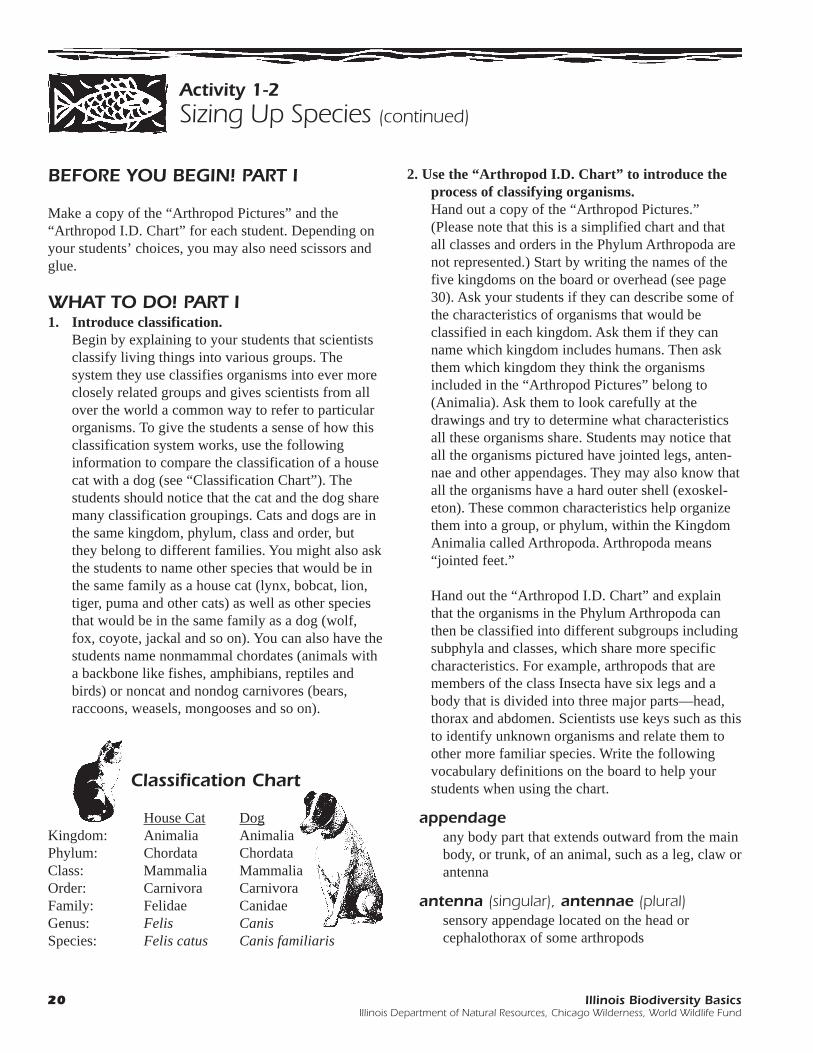
Naming ThingsThe work of classifying organisms is done by scientistscalled taxonomists. Taxonomists divide organisms into ahierarchical series of more and more specific groupings.The most general division of life is into five kingdoms: Mon-era, Protista, Fungi, Plantae and Animalia. (See page 30for a description of each kingdom.) Within each kingdom,there are groups of increasing specificity, each one con-taining fewer species of increasingly close evolutionary re-lationships to each other. These groups are phylum, class,order, family, genus and species (see page 22). This hier-archy enables taxonomists to group organisms based ontheir characteristics and evolutionary relationships. Spe-cies in any given order are more closely related to eachother than to species in any other order; species in anygiven family are more closely related to each other than tospecies in any other family; and so on.
What’s in a Name?Most organisms have more than one common name. Forexample, what some people call a woodchuck might becalled a groundhog by other people. And a tree might becalled downy serviceberry, shadbush or downy Juneberry,all for the same species. Or a bird might be called a housesparrow or an English sparrow, depending on who is talk-ing about it. Common names can be very confusing! Tax-onomists use Latin words to give scientific names to or-ganisms. Not only does this clear up the confusion overcommon names in any one language, but it also allowsscientists who speak different languages to clearly identifyany particular organism or group of organisms.
When scientists refer to a particular organism by its scien-tific name, they are using a combination of the genus (plu-ral: genera) and species (singular and plural) to which theorganism belongs. For example, a coyote is referred to asCanis latrans (Canis is the genus name and latrans is thespecies name). The gray wolf, a closely related species, isCanis lupus. The genus and species names are alwaysitalicized or underlined. The genus name is capitalized, butthe species name is not.
Sorting Out TaxonomyKeeping Relationships StraightFiguring out just where an organism belongs—how it shouldbe classified—is not always easy. Scientists look for struc-tural and genetic similarities among organisms that theyclassify together. But differences and similarities amongliving things are not always clear cut. Taxonomists some-times disagree about where organisms should be classi-fied, how genera should be arranged within families, andso on. As new information becomes available, taxonomistsoften revise where an organism is placed within the classi-fication system. For example, giant pandas, which sharesome characteristics with raccoons and some with bears,have long been classified, along with red pandas, in theirown group. However, recent genetic analysis has confirmedthat giant pandas are actually true bears, and taxonomistsare revising the species’ classification based on those find-ings.
Defining a SpeciesA species is a population of organisms that interbreedsand produces fertile offspring in nature.For example, the red fox and the grayfox are different species becausethey coexist in many areas, butthey do not interbreed.
Taxonomy organizes organismsin increasing levels of specific-ity. A gray squirrel, for example,would be classified like this:
Kingdom: Animalia (animals)Phylum: Chordata (animals with backbones)Class: Mammalia (mammals)Order: Rodentia (rodents)Family: Sciuridae (squirrels and chipmunks)Genus: Sciurus (squirrels)Species: carolinensis
To refer to a gray squirrel, scientists call the animal by itsscientific name: Sciurus carolinensis.
22 Illinois Biodiversity BasicsIllinois Department of Natural Resources, Chicago Wilderness, World Wildlife Fund
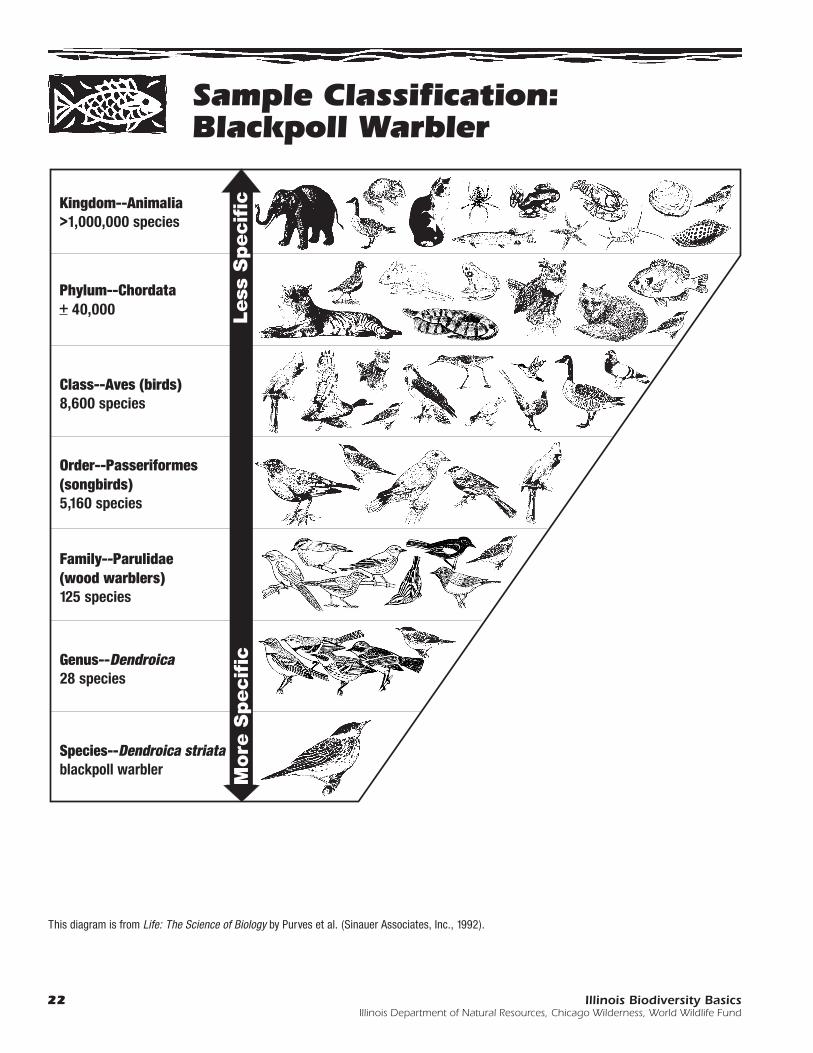
Sample Classification:Blackpoll Warbler
This diagram is from Life: The Science of Biology by Purves et al. (Sinauer Associates, Inc., 1992).
Illinois Biodiversity Basics 23Illinois Department of Natural Resources, Chicago Wilderness, World Wildlife Fund
Activity 1-2Sizing Up Species (continued)
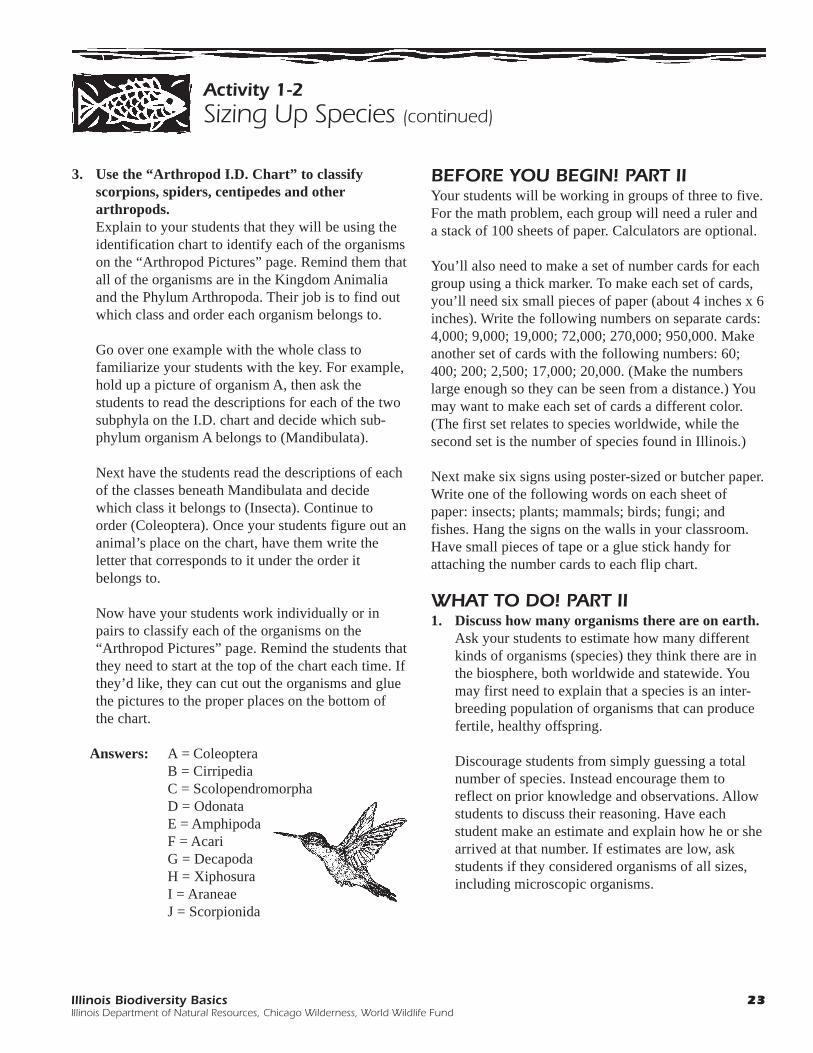
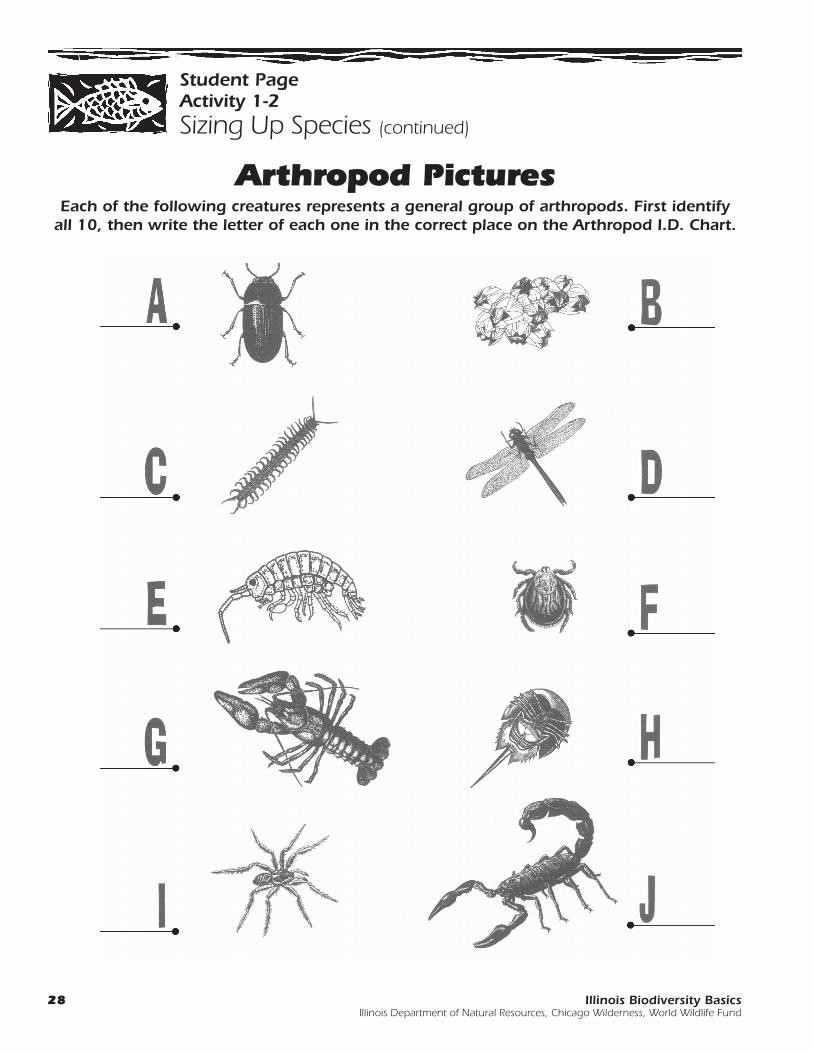
3. Use the “Arthropod I.D. Chart” to classifyscorpions, spiders, centipedes and otherarthropods.Explain to your students that they will be using theidentification chart to identify each of the organismson the “Arthropod Pictures” page. Remind them thatall of the organisms are in the Kingdom Animaliaand the Phylum Arthropoda. Their job is to find outwhich class and order each organism belongs to.
Go over one example with the whole class tofamiliarize your students with the key. For example,hold up a picture of organism A, then ask thestudents to read the descriptions for each of the twosubphyla on the I.D. chart and decide which sub-phylum organism A belongs to (Mandibulata).
Next have the students read the descriptions of eachof the classes beneath Mandibulata and decidewhich class it belongs to (Insecta). Continue toorder (Coleoptera). Once your students figure out ananimal’s place on the chart, have them write theletter that corresponds to it under the order itbelongs to.
Now have your students work individually or inpairs to classify each of the organisms on the“Arthropod Pictures” page. Remind the students thatthey need to start at the top of the chart each time. Ifthey’d like, they can cut out the organisms and gluethe pictures to the proper places on the bottom ofthe chart.
Answers: A = ColeopteraB = CirripediaC = ScolopendromorphaD = OdonataE = AmphipodaF = AcariG = DecapodaH = XiphosuraI = AraneaeJ = Scorpionida
BEFORE YOU BEGIN! PART IIYour students will be working in groups of three to five.For the math problem, each group will need a ruler anda stack of 100 sheets of paper. Calculators are optional.
You’ll also need to make a set of number cards for eachgroup using a thick marker. To make each set of cards,you’ll need six small pieces of paper (about 4 inches x 6inches). Write the following numbers on separate cards:4,000; 9,000; 19,000; 72,000; 270,000; 950,000. Makeanother set of cards with the following numbers: 60;400; 200; 2,500; 17,000; 20,000. (Make the numberslarge enough so they can be seen from a distance.) Youmay want to make each set of cards a different color.(The first set relates to species worldwide, while thesecond set is the number of species found in Illinois.)
Next make six signs using poster-sized or butcher paper.Write one of the following words on each sheet ofpaper: insects; plants; mammals; birds; fungi; andfishes. Hang the signs on the walls in your classroom.Have small pieces of tape or a glue stick handy forattaching the number cards to each flip chart.
WHAT TO DO! PART II1. Discuss how many organisms there are on earth.
Ask your students to estimate how many differentkinds of organisms (species) they think there are inthe biosphere, both worldwide and statewide. Youmay first need to explain that a species is an inter-breeding population of organisms that can producefertile, healthy offspring.
Discourage students from simply guessing a totalnumber of species. Instead encourage them toreflect on prior knowledge and observations. Allowstudents to discuss their reasoning. Have eachstudent make an estimate and explain how he or shearrived at that number. If estimates are low, askstudents if they considered organisms of all sizes,including microscopic organisms.
24 Illinois Biodiversity BasicsIllinois Department of Natural Resources, Chicago Wilderness, World Wildlife Fund
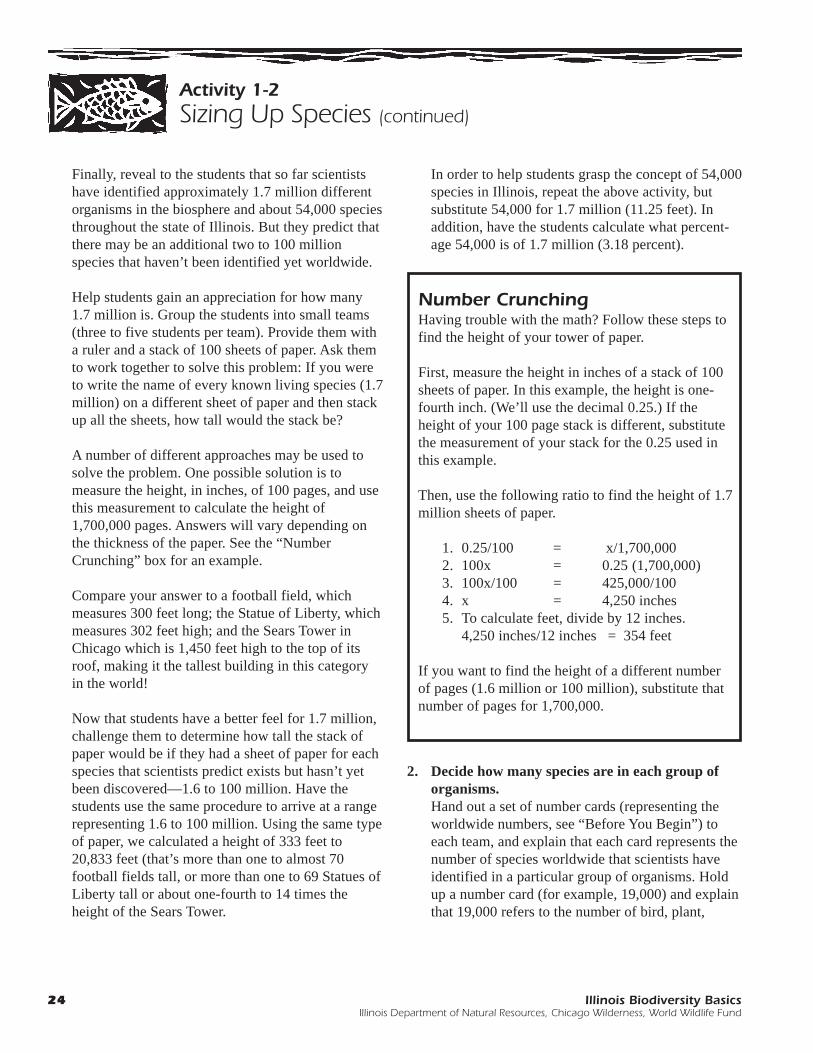
In order to help students grasp the concept of 54,000species in Illinois, repeat the above activity, butsubstitute 54,000 for 1.7 million (11.25 feet). Inaddition, have the students calculate what percent-age 54,000 is of 1.7 million (3.18 percent).
Activity 1-2Sizing Up Species (continued)
Finally, reveal to the students that so far scientistshave identified approximately 1.7 million differentorganisms in the biosphere and about 54,000 speciesthroughout the state of Illinois. But they predict thatthere may be an additional two to 100 millionspecies that haven’t been identified yet worldwide.
Help students gain an appreciation for how many1.7 million is. Group the students into small teams(three to five students per team). Provide them witha ruler and a stack of 100 sheets of paper. Ask themto work together to solve this problem: If you wereto write the name of every known living species (1.7million) on a different sheet of paper and then stackup all the sheets, how tall would the stack be?
A number of different approaches may be used tosolve the problem. One possible solution is tomeasure the height, in inches, of 100 pages, and usethis measurement to calculate the height of1,700,000 pages. Answers will vary depending onthe thickness of the paper. See the “NumberCrunching” box for an example.
Compare your answer to a football field, whichmeasures 300 feet long; the Statue of Liberty, whichmeasures 302 feet high; and the Sears Tower inChicago which is 1,450 feet high to the top of itsroof, making it the tallest building in this categoryin the world!
Now that students have a better feel for 1.7 million,challenge them to determine how tall the stack ofpaper would be if they had a sheet of paper for eachspecies that scientists predict exists but hasn’t yetbeen discovered—1.6 to 100 million. Have thestudents use the same procedure to arrive at a rangerepresenting 1.6 to 100 million. Using the same typeof paper, we calculated a height of 333 feet to20,833 feet (that’s more than one to almost 70football fields tall, or more than one to 69 Statues ofLiberty tall or about one-fourth to 14 times theheight of the Sears Tower.
Number CrunchingHaving trouble with the math? Follow these steps tofind the height of your tower of paper.
First, measure the height in inches of a stack of 100sheets of paper. In this example, the height is one-fourth inch. (We’ll use the decimal 0.25.) If theheight of your 100 page stack is different, substitutethe measurement of your stack for the 0.25 used inthis example.
Then, use the following ratio to find the height of 1.7million sheets of paper.
1. 0.25/100 = x/1,700,0002. 100x = 0.25 (1,700,000)3. 100x/100 = 425,000/1004. x = 4,250 inches5. To calculate feet, divide by 12 inches.
4,250 inches/12 inches = 354 feet
If you want to find the height of a different numberof pages (1.6 million or 100 million), substitute thatnumber of pages for 1,700,000.
2. Decide how many species are in each group oforganisms.Hand out a set of number cards (representing theworldwide numbers, see “Before You Begin”) toeach team, and explain that each card represents thenumber of species worldwide that scientists haveidentified in a particular group of organisms. Holdup a number card (for example, 19,000) and explainthat 19,000 refers to the number of bird, plant,
Illinois Biodiversity Basics 25Illinois Department of Natural Resources, Chicago Wilderness, World Wildlife Fund
Activity 1-2Sizing Up Species (continued)
mammal, insect, fish or fungi species that scientistshave identified. (Remind your students that thisnumber is not the number of individuals but thenumber of species—there may be millions orbillions of individuals.) Now explain that each teamhas to work together to decide which group oforganisms listed on the signs posted around theroom this number refers to. Once their decisionshave been made, the teams should tape their numbercards on or below the appropriate signs on the wall.Teams should record their choices so they willremember them. Leave the cards on the signs.Repeat the process for the set of Illinois cards.
3. Discuss the students’ decision-making process.Ask your students to share the methods they usedfor making decisions. Did they guess or reason?Many teams may start with what they believe are
the groups with the highest and lowest number ofspecies. Some may start with the number they aremost certain about and then use a process of elimi-nation. Other teams may base their guesses onexperience and observation.
4. Reveal the actual numbers.Go to each sign and tell your students the correctanswers. Then have your students discuss theirreactions. Did any of the answers surprise them?
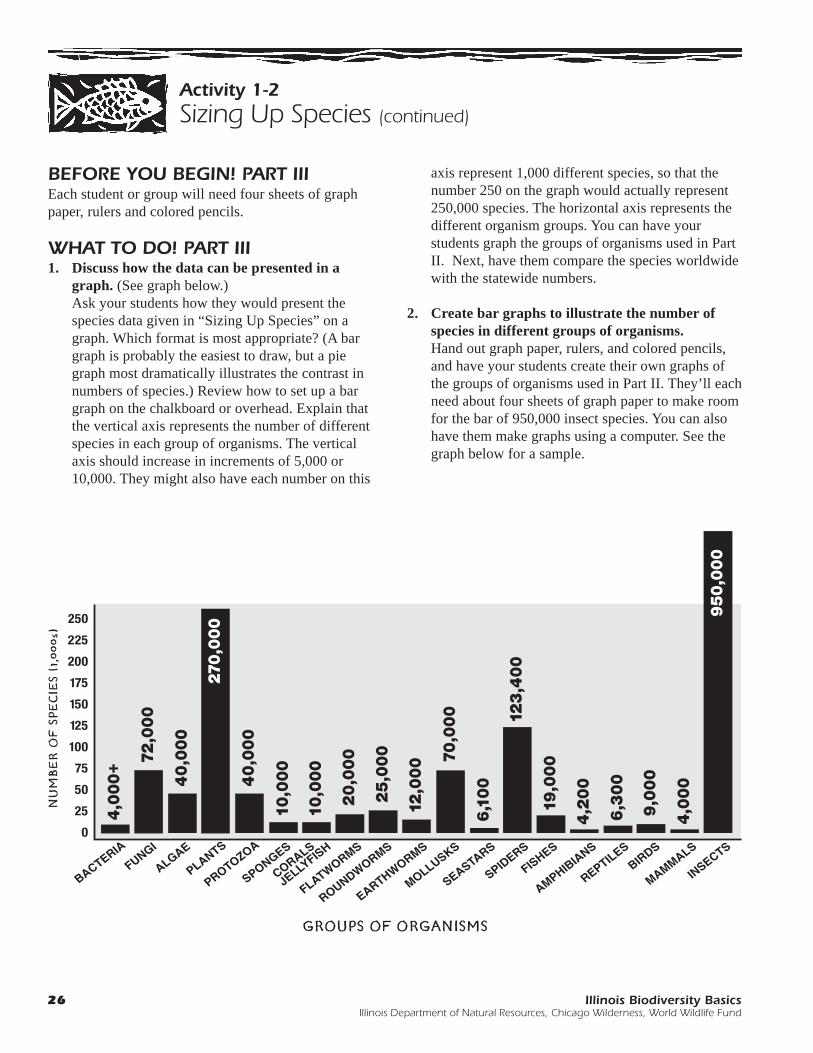
WORLDWIDE: STATEWIDE:Insects ............950,000 Insects ........... 17,000Plants .............270,000 Plants ............ 2,500Fungi ..............72,000 Fungi ............ 20,000Fish ................19,000 Fishes............ 200Birds...............9,000 Birds ............. 400Mammals ....... 4,000 Mammals ...... 60
26 Illinois Biodiversity BasicsIllinois Department of Natural Resources, Chicago Wilderness, World Wildlife Fund
BEFORE YOU BEGIN! PART IIIEach student or group will need four sheets of graphpaper, rulers and colored pencils.
WHAT TO DO! PART III1. Discuss how the data can be presented in a
graph. (See graph below.)Ask your students how they would present thespecies data given in “Sizing Up Species” on agraph. Which format is most appropriate? (A bargraph is probably the easiest to draw, but a piegraph most dramatically illustrates the contrast innumbers of species.) Review how to set up a bargraph on the chalkboard or overhead. Explain thatthe vertical axis represents the number of differentspecies in each group of organisms. The verticalaxis should increase in increments of 5,000 or10,000. They might also have each number on this
Activity 1-2Sizing Up Species (continued)
GROUPS OF ORGANISMS
axis represent 1,000 different species, so that thenumber 250 on the graph would actually represent250,000 species. The horizontal axis represents thedifferent organism groups. You can have yourstudents graph the groups of organisms used in PartII. Next, have them compare the species worldwidewith the statewide numbers.
2. Create bar graphs to illustrate the number ofspecies in different groups of organisms.Hand out graph paper, rulers, and colored pencils,and have your students create their own graphs ofthe groups of organisms used in Part II. They’ll eachneed about four sheets of graph paper to make roomfor the bar of 950,000 insect species. You can alsohave them make graphs using a computer. See thegraph below for a sample.
NU
MBER O
F S
PECIE
S (
1,000s)
Illinois Biodiversity Basics 27Illinois Department of Natural Resources, Chicago Wilderness, World Wildlife Fund
Activity 1-2Sizing Up Species (continued)
WRAPPING IT UPAssessment1. Use both the classification activity and the graphing
activity as bases for assessment. Have the studentswrite an explanation of how the "Arthropod I. D.Chart" works. On the graph, have the students writethe educated guesses the class discussed and howthe data on the graph either do or do not supporteach guess.
2. Select 10 organisms from one of the Biodiversity ofIllinois CD-ROMs. Print the information sheet foreach organism and discuss the classification infor-mation. Give a set of these sheets to each student.Have the students develop their own identificationchart for the organisms.
3. Have students make a collage that includes thedifferent classifications of species or have studentschoose a classification, such as mammals, and makea collage of just that classification.
4. Write a short magazine article that discusses theamazing diversity of life on earth. Include illustra-tions and captions.
Portfolio1. Graphs can be part of the portfolio. The collage
could also be added to the portfolio.
Extensions1. Survey the species diversity of your school grounds
or a nearby park or reserve. Your students don’tneed to identify the species by name; they just needto be able to tell that one species is different fromanother. Afterward, find out if the ratios of speciesin different organism groups are similar to the ratiosillustrated on the graphs your students made.
2. Have students research a class (or order) of organ-isms within the Phylum Chordata. Tell them to findout what characteristics the animals within the classshare, examples of species within the class, and theapproximate number of species that have beenidentified to date. Have each student write a para-
graph to summarize that information. Then pool thedata for the group and have each student create abar graph (on graph paper or using a computerprogram) that illustrates the relative numbers ofspecies in each group. (Note: Separate the classesand orders when creating the bar graphs.)
Here are some suggested classes: Osteichthyes(bony fishes); Amphibia; Reptilia; Aves (birds);Mammalia. Here are some suggested orders: withinthe Class Reptilia, Testudines (turtles), Squamata(snakes, lizards); within the Class Mammalia,Insectivora (moles, shrews), Rodentia (rats, mice),Carnivora (cats, dogs, weasels, raccoons), Artiodac-tyla (even-toed ungulates such as deer, camels,hippos).
ResourcesIllinois Department of Natural Resources. 1999.
Biodiversity of Illinois, volume I: aquatic habitats.
Illinois Department of Natural Resources, Spring-
field, Illinois. CD-ROM.
Illinois Department of Natural Resources. 2000.
Biodiversity of Illinois, volume II: woodland
habitats. Illinois Department of Natural Resources,
Springfield, Illinois. CD-ROM.
Illinois Department of Natural Resources. 2001.
Biodiversity of Illinois, volume III: prairie and edge
habitats. Illinois Department of Natural Resources,
Springfield, Illinois. CD-ROM.
May, R. M. 1992. How many species inhabit the earth?”
Scientific American (267): 42-48.
Wilson, E. O. 1987. The little things that run the world.
Conservation Biology 1(4): 344-346.
Wilson, E. O. 1988. Biodiversity. National Academy
Press, Washington D.C., 538 pp.
World Wildlife Fund. 1994. WOW!—A biodiversity
primer. Quad/Graphics, Pewaukee, Wisconsin.
67 pp.
28 Illinois Biodiversity BasicsIllinois Department of Natural Resources, Chicago Wilderness, World Wildlife Fund
Student PageActivity 1-2Sizing Up Species (continued)
Each of the following creatures represents a general group of arthropods. First identifyall 10, then write the letter of each one in the correct place on the Arthropod I.D. Chart.
Arthropod Pictures
Illinois Biodiversity Basics 29Illinois Department of Natural Resources, Chicago Wilderness, World Wildlife Fund
Art
hro
pod I
.D. Chart
Student PageActivity 1-2Sizing Up Species (continued)
King
dom
Ani
mal
iaM
any-
celle
d or
gani
sms
with
spe
cial
ized
tiss
ues,
mos
t with
org
ans
or o
rgan
sys
tem
s.Un
like
plan
ts, t
hey
cann
ot m
ake
thei
r ow
n fo
od. A
nim
al c
ells
do
not h
ave
cell
wal
ls.
Phyl
um A
rthr
opod
aAn
imal
s w
ith a
seg
men
ted
body
, seg
men
ted
legs
, and
oth
er a
ppen
dage
s,an
ext
erna
l ske
leto
n (e
xosk
elet
on) a
nd s
oft i
nter
nal o
rgan
s.
Subp
hylu
m C
helic
erat
aSu
bphy
lum
Man
dibu
lata
No a
nten
nae.
Mou
thpa
rts
cons
ist o
f fan
gs o
r pin
cers
.On
e or
two
pairs
of a
nten
nae.
Mou
thpa
rts
cons
ist o
fTw
o m
ain
body
seg
men
ts.
man
dibl
es a
dapt
ed to
che
win
g or
suc
king
.
Clas
sCl
ass
Clas
sCl
ass
Clas
sM
eros
tom
ata
Arac
hnid
aCr
usta
cea
Chilo
poda
Inse
cta
Body
with
a b
road
ova
l she
ll an
dEi
ght l
egs.
Liv
e m
ostly
Two
pairs
of a
nten
nae
and
atLo
ng a
nd w
orm
-like
, with
one
One
pair
of a
nten
nae.
long
sle
nder
tail.
Leg
s no
ton
land
.le
ast f
ive
pairs
of l
eg-li
kepa
ir of
legs
per
bod
y se
gmen
t.Si
x le
gs a
nd th
ree
body
par
ts.
visi
ble
from
abo
ve.
appe
ndag
es.
Uusa
lly h
ave
win
gs.
Orde
rOr
der
Orde
rOr
der
Orde
rOr
der
Orde
rOr
der
Orde
rOr
der
Xiph
osur
aSc
orpi
onid
aAc
ari
Aran
eae
Cirr
iped
iaDe
capo
daAm
phip
oda
Scol
open
-Od
onat
aCo
leop
tera
Larg
e co
mpa
red
Fron
t cla
ws.
Tiny
hea
d.Th
in w
aist
.M
ost a
dults
live
Firs
t pai
r of l
egs
Seve
n pa
irs o
fdr
omor
pha
Larg
e co
mpo
und
Hard
, lea
ther
yto
oth
erHa
ve a
tail
with
Roun
ded
body
Stru
ctur
es fo
rfir
mly
atta
ched
usua
lly h
asle
g-lik
e21
or 2
3ey
es. F
our c
lear
front
win
gs c
over
arth
ropo
ds.
a po
ison
ous
with
no
spin
ning
silk
to a
n ob
ject
larg
e cl
aws.
appe
ndag
es.
pairs
of l
egs.
or p
atte
rned
mem
bran
ous
Live
in s
alt w
ater
.st
inge
r.w
aist
.lo
cate
d on
and
use
feat
hery
Mos
t liv
e in
win
gs. L
ong
(sof
ter)
hind
The
only
orde
rab
dom
en.
legs
to fi
lter
salt
wat
er.
abdo
men
.w
ings
. Che
win
gin
its
clas
s.fo
od fr
om w
ater
.m
outh
part
s.
ANSW
ER:
ANSW
ER:
ANSW
ER:
ANSW
ER:
ANSW
ER:
ANSW
ER:
ANSW
ER:
ANSW
ER:
ANSW
ER:
ANSW
ER:
➡
➡
➡
➡
➡
➡
➡
➡
➡
➡
➡
➡
➡➡
➡
➡
➡
➡
30 Illinois Biodiversity BasicsIllinois Department of Natural Resources, Chicago Wilderness, World Wildlife Fund
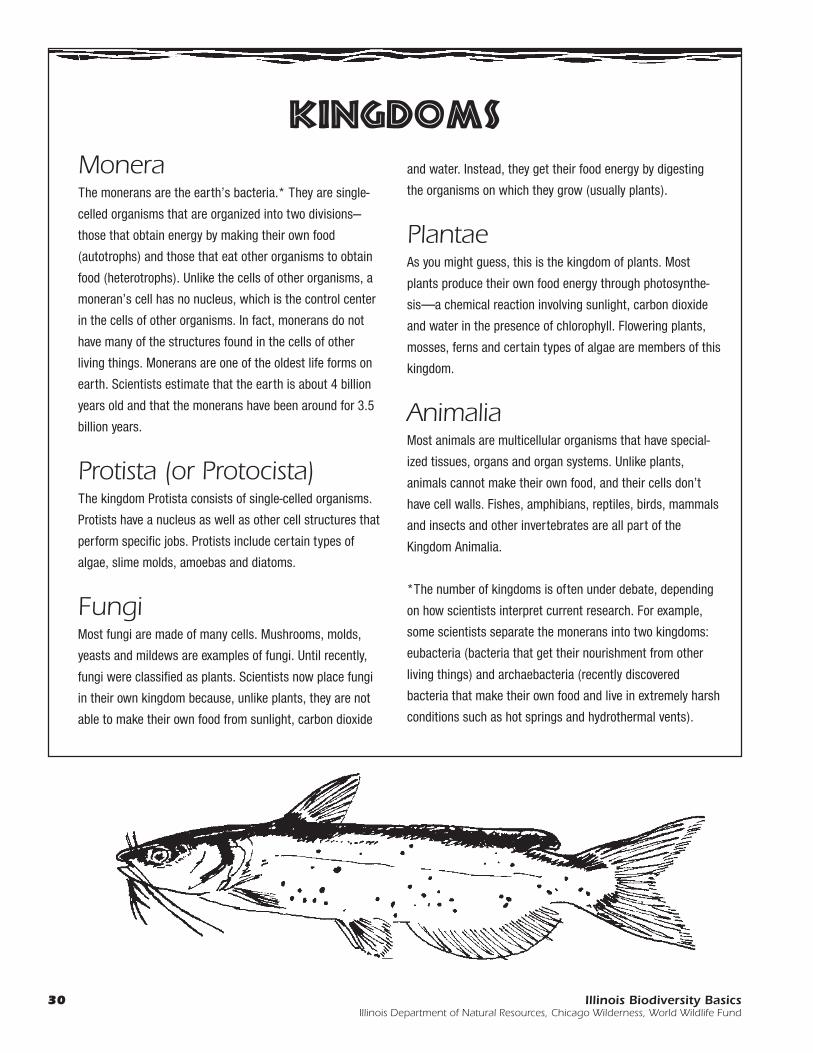
Kingdoms
MoneraThe monerans are the earth’s bacteria.* They are single-
celled organisms that are organized into two divisions—
those that obtain energy by making their own food
(autotrophs) and those that eat other organisms to obtain
food (heterotrophs). Unlike the cells of other organisms, a
moneran’s cell has no nucleus, which is the control center
in the cells of other organisms. In fact, monerans do not
have many of the structures found in the cells of other
living things. Monerans are one of the oldest life forms on
earth. Scientists estimate that the earth is about 4 billion
years old and that the monerans have been around for 3.5
billion years.
Protista (or Protocista)The kingdom Protista consists of single-celled organisms.
Protists have a nucleus as well as other cell structures that
perform specific jobs. Protists include certain types of
algae, slime molds, amoebas and diatoms.
FungiMost fungi are made of many cells. Mushrooms, molds,
yeasts and mildews are examples of fungi. Until recently,
fungi were classified as plants. Scientists now place fungi
in their own kingdom because, unlike plants, they are not
able to make their own food from sunlight, carbon dioxide
and water. Instead, they get their food energy by digesting
the organisms on which they grow (usually plants).
PlantaeAs you might guess, this is the kingdom of plants. Most
plants produce their own food energy through photosynthe-
sis—a chemical reaction involving sunlight, carbon dioxide
and water in the presence of chlorophyll. Flowering plants,
mosses, ferns and certain types of algae are members of this
kingdom.
AnimaliaMost animals are multicellular organisms that have special-
ized tissues, organs and organ systems. Unlike plants,
animals cannot make their own food, and their cells don’t
have cell walls. Fishes, amphibians, reptiles, birds, mammals
and insects and other invertebrates are all part of the
Kingdom Animalia.
*The number of kingdoms is often under debate, depending
on how scientists interpret current research. For example,
some scientists separate the monerans into two kingdoms:
eubacteria (bacteria that get their nourishment from other
living things) and archaebacteria (recently discovered
bacteria that make their own food and live in extremely harsh
conditions such as hot springs and hydrothermal vents).