Embed Size (px)
Citation preview

ACKNOWLEDGEMENTSThis joint A Better City / City of Boston survey would not be possible without generous fund-ing support from the Energy Foundation via the Bloomberg Philanthropies American Cities Cli-mate Challenge.
SURVEY TEAM
• Marissa Rivera, Transportation Management Association Operations Manager
• Allison Simmons, Ease Consult• Scott Mullen, Transportation Demand Man-
agement Director• Christine Yi, Transportation Management As-
sociation Marketing and Program Coordinator
A Better City is a diverse group of business lead-ers united around a common goal—to enhance Boston and the region’s economic health, com-petitiveness, vibrancy, sustainability and quality of life. By amplifying the voice of the business community through collaboration and consensus across a broad range of stakeholders, A Better City develops solutions and influences policy in three critical areas central to the Boston region’s economic competitiveness and growth: transpor-tation and infrastructure, land use and develop-ment, and energy and environment.
TABLE OF CONTENTSIntroduction
Survey Structure and Distribution
Key Takeaways
Demographics
1. Age 2. Race/ Ethnicity 3. Gender 4. Employment and Industry 5. Children, Education, and Income 6. Geographic Distribution 7. Vehicle Ownership
Telework
Anticipated Return Modes
Focus on Cycling
Drive Alone Behavior Change
Caution Regarding Transit
Conclusion
2
2
3
4
4
4
5
5
6
7
8
9
10
12
13
14
15
1
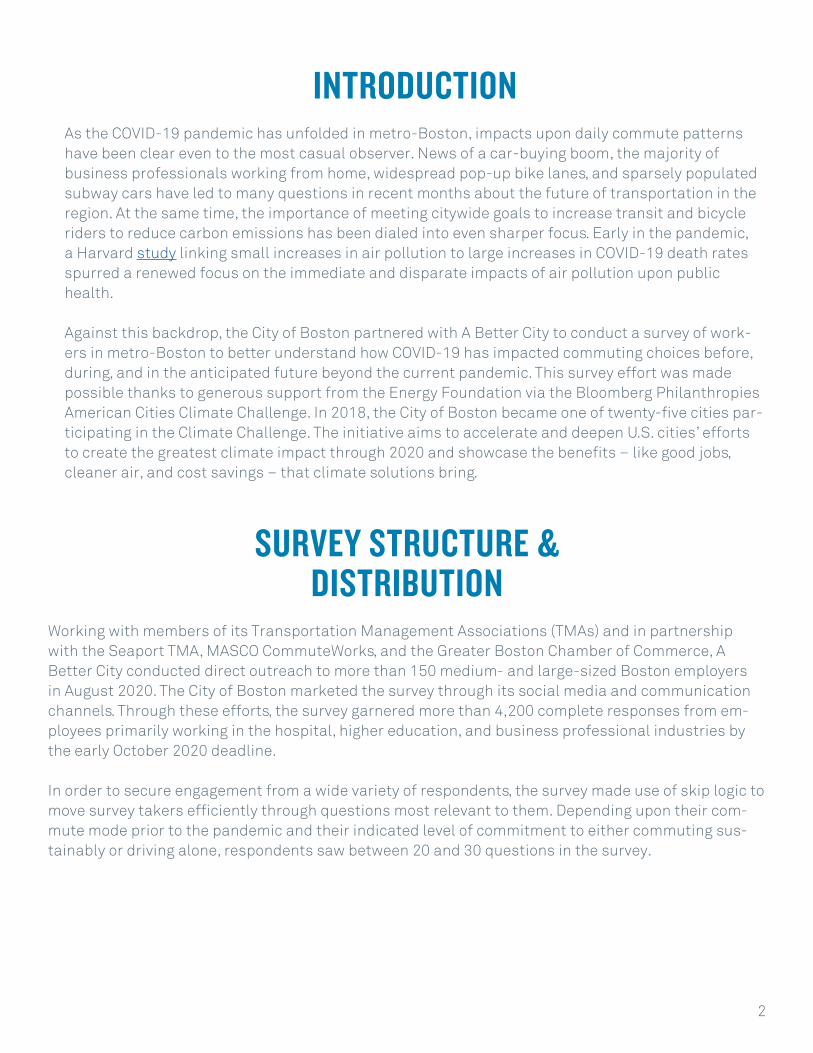
INTRODUCTION As the COVID-19 pandemic has unfolded in metro-Boston, impacts upon daily commute patterns have been clear even to the most casual observer. News of a car-buying boom, the majority of business professionals working from home, widespread pop-up bike lanes, and sparsely populated subway cars have led to many questions in recent months about the future of transportation in the region. At the same time, the importance of meeting citywide goals to increase transit and bicycle riders to reduce carbon emissions has been dialed into even sharper focus. Early in the pandemic, a Harvard study linking small increases in air pollution to large increases in COVID-19 death rates spurred a renewed focus on the immediate and disparate impacts of air pollution upon public health.
Against this backdrop, the City of Boston partnered with A Better City to conduct a survey of work-ers in metro-Boston to better understand how COVID-19 has impacted commuting choices before, during, and in the anticipated future beyond the current pandemic. This survey effort was made possible thanks to generous support from the Energy Foundation via the Bloomberg Philanthropies American Cities Climate Challenge. In 2018, the City of Boston became one of twenty-five cities par-ticipating in the Climate Challenge. The initiative aims to accelerate and deepen U.S. cities’ efforts to create the greatest climate impact through 2020 and showcase the benefits – like good jobs, cleaner air, and cost savings – that climate solutions bring.
SURVEY STRUCTURE & DISTRIBUTION
Working with members of its Transportation Management Associations (TMAs) and in partnership with the Seaport TMA, MASCO CommuteWorks, and the Greater Boston Chamber of Commerce, A Better City conducted direct outreach to more than 150 medium- and large-sized Boston employers in August 2020. The City of Boston marketed the survey through its social media and communication channels. Through these efforts, the survey garnered more than 4,200 complete responses from em-ployees primarily working in the hospital, higher education, and business professional industries by the early October 2020 deadline.
In order to secure engagement from a wide variety of respondents, the survey made use of skip logic to move survey takers efficiently through questions most relevant to them. Depending upon their com-mute mode prior to the pandemic and their indicated level of commitment to either commuting sus-tainably or driving alone, respondents saw between 20 and 30 questions in the survey.
2
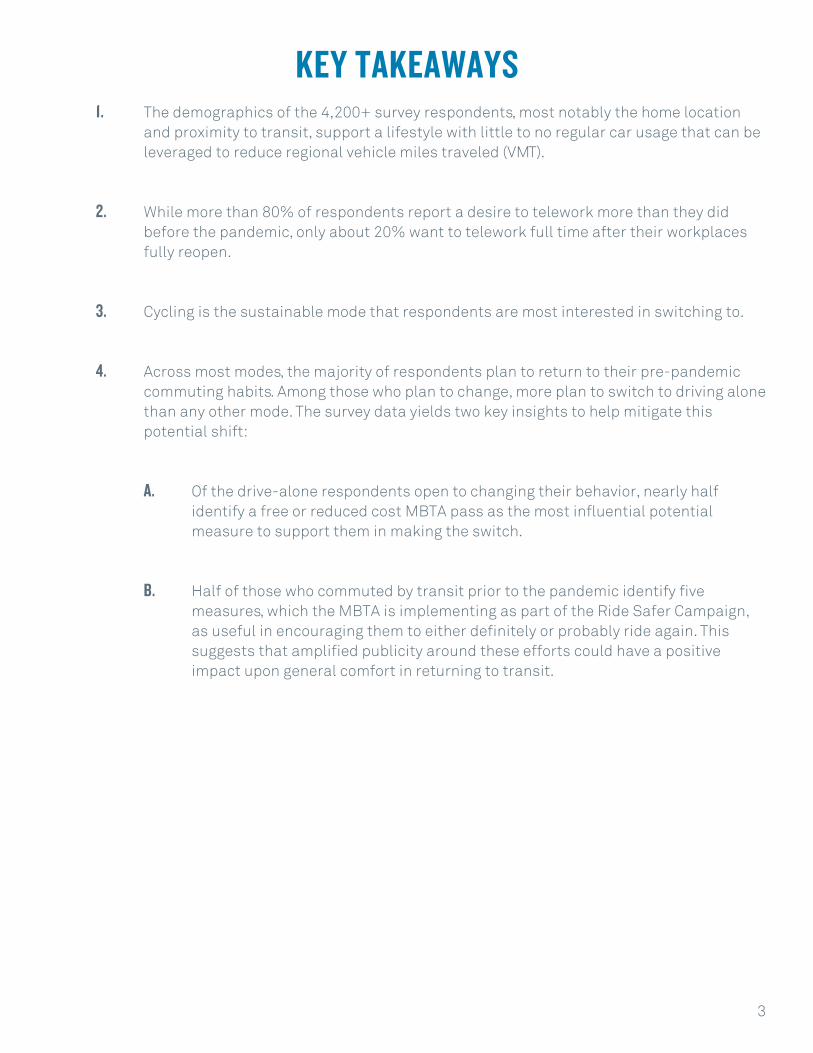
KEY TAKEAWAYS 1. The demographics of the 4,200+ survey respondents, most notably the home location and proximity to transit, support a lifestyle with little to no regular car usage that can be leveraged to reduce regional vehicle miles traveled (VMT).
2. While more than 80% of respondents report a desire to telework more than they did before the pandemic, only about 20% want to telework full time after their workplaces fully reopen.
3. Cycling is the sustainable mode that respondents are most interested in switching to. 4. Across most modes, the majority of respondents plan to return to their pre-pandemic commuting habits. Among those who plan to change, more plan to switch to driving alone than any other mode. The survey data yields two key insights to help mitigate this potential shift:
A. Of the drive-alone respondents open to changing their behavior, nearly half identify a free or reduced cost MBTA pass as the most influential potential measure to support them in making the switch.
B. Half of those who commuted by transit prior to the pandemic identify five measures, which the MBTA is implementing as part of the Ride Safer Campaign, as useful in encouraging them to either definitely or probably ride again. This suggests that amplified publicity around these efforts could have a positive impact upon general comfort in returning to transit.
3

DEMOGRAPHICSThe majority of respondents work in the health care and education fields, are high wage earners, do not have children under the age of 18, and identify as female.
1. AGE
Across the total pool of respondents, we see robust representation across age groups:
FIGURE 1: AGE DISTRIBUTION OF SURVEY RESPONDENTS
2. RACE/ETHNICITY
In line with the racial makeup of metro-Boston, the pool of survey respondents is majority white, with 75% of respondents identifying as white/Caucasian. Of the other 25% of respondents, 8% prefer not to identify their race/ethnicity, 8% identify as Asian or Pacific Islander, 6% identify as Hispanic/Latino, and 5% identify as African-American/Black.
FIGURE 2: RACE/ETHNICITY DISTRIBUTION OF SURVEY RESPONDENTS
4
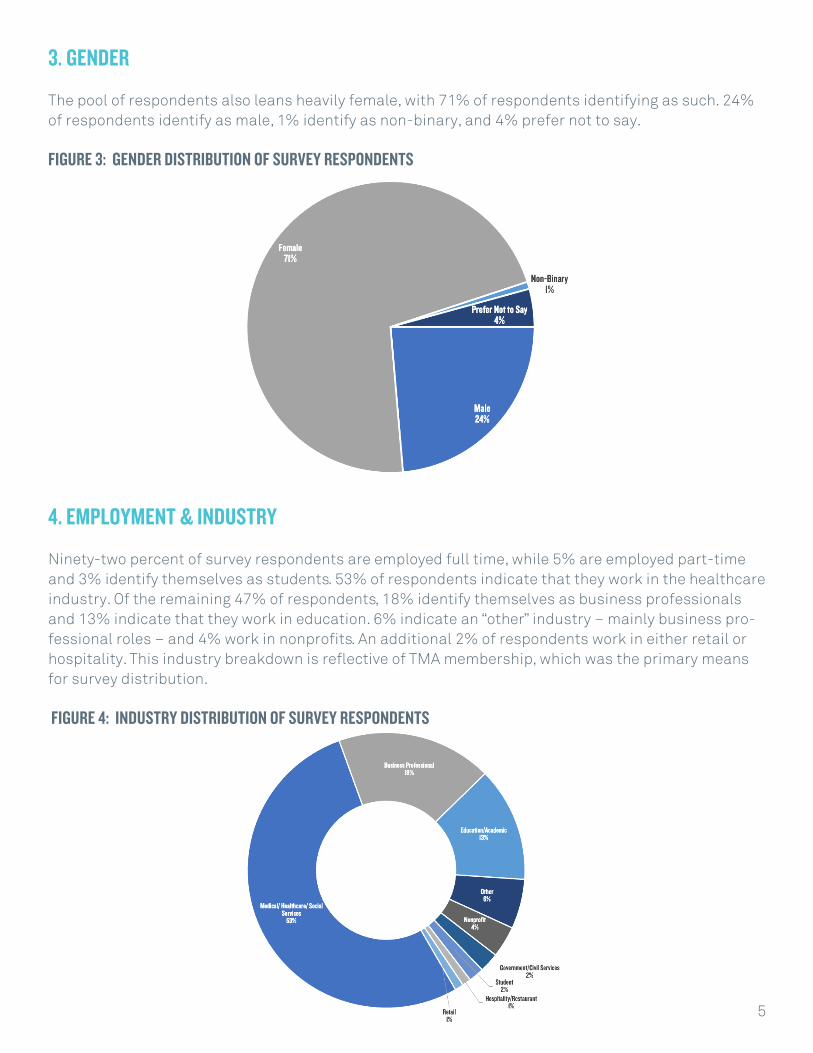
3. GENDER
The pool of respondents also leans heavily female, with 71% of respondents identifying as such. 24% of respondents identify as male, 1% identify as non-binary, and 4% prefer not to say.
FIGURE 3: GENDER DISTRIBUTION OF SURVEY RESPONDENTS
4. EMPLOYMENT & INDUSTRY
Ninety-two percent of survey respondents are employed full time, while 5% are employed part-time and 3% identify themselves as students. 53% of respondents indicate that they work in the healthcare industry. Of the remaining 47% of respondents, 18% identify themselves as business professionals and 13% indicate that they work in education. 6% indicate an “other” industry – mainly business pro-fessional roles – and 4% work in nonprofits. An additional 2% of respondents work in either retail or hospitality. This industry breakdown is reflective of TMA membership, which was the primary means for survey distribution.
FIGURE 4: INDUSTRY DISTRIBUTION OF SURVEY RESPONDENTS
5
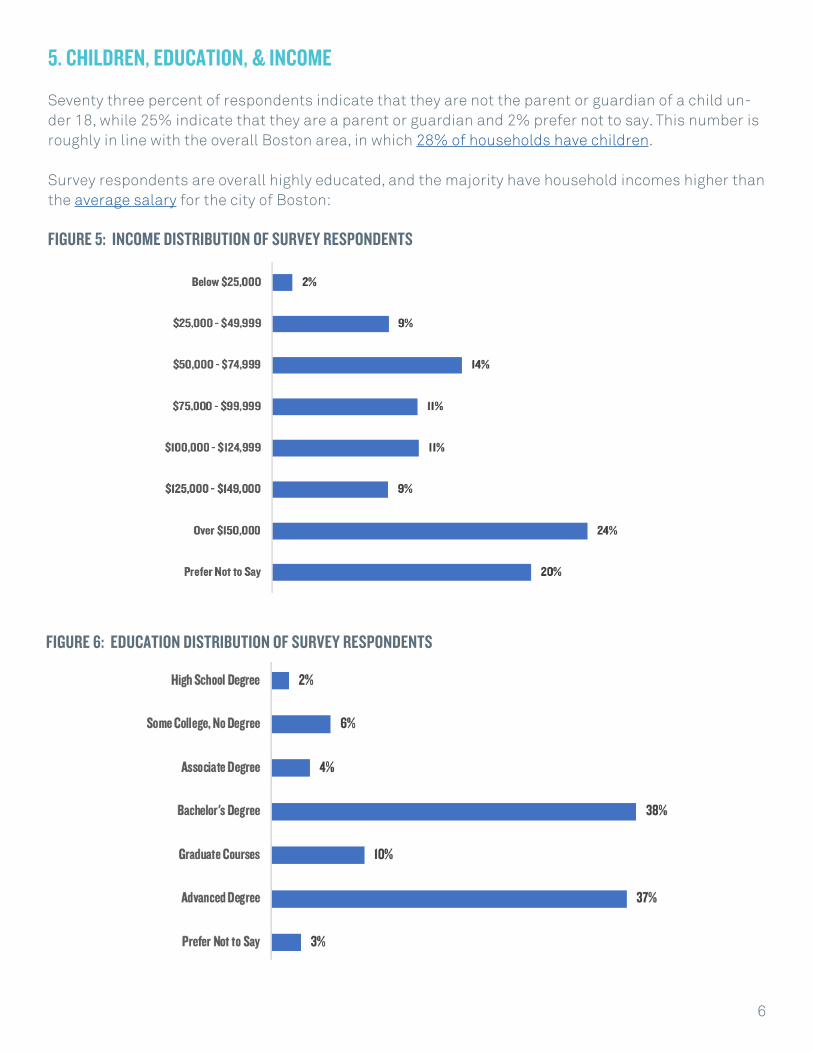
5. CHILDREN, EDUCATION, & INCOME
Seventy three percent of respondents indicate that they are not the parent or guardian of a child un-der 18, while 25% indicate that they are a parent or guardian and 2% prefer not to say. This number is roughly in line with the overall Boston area, in which 28% of households have children.
Survey respondents are overall highly educated, and the majority have household incomes higher than the average salary for the city of Boston:
FIGURE 5: INCOME DISTRIBUTION OF SURVEY RESPONDENTS
FIGURE 6: EDUCATION DISTRIBUTION OF SURVEY RESPONDENTS
6
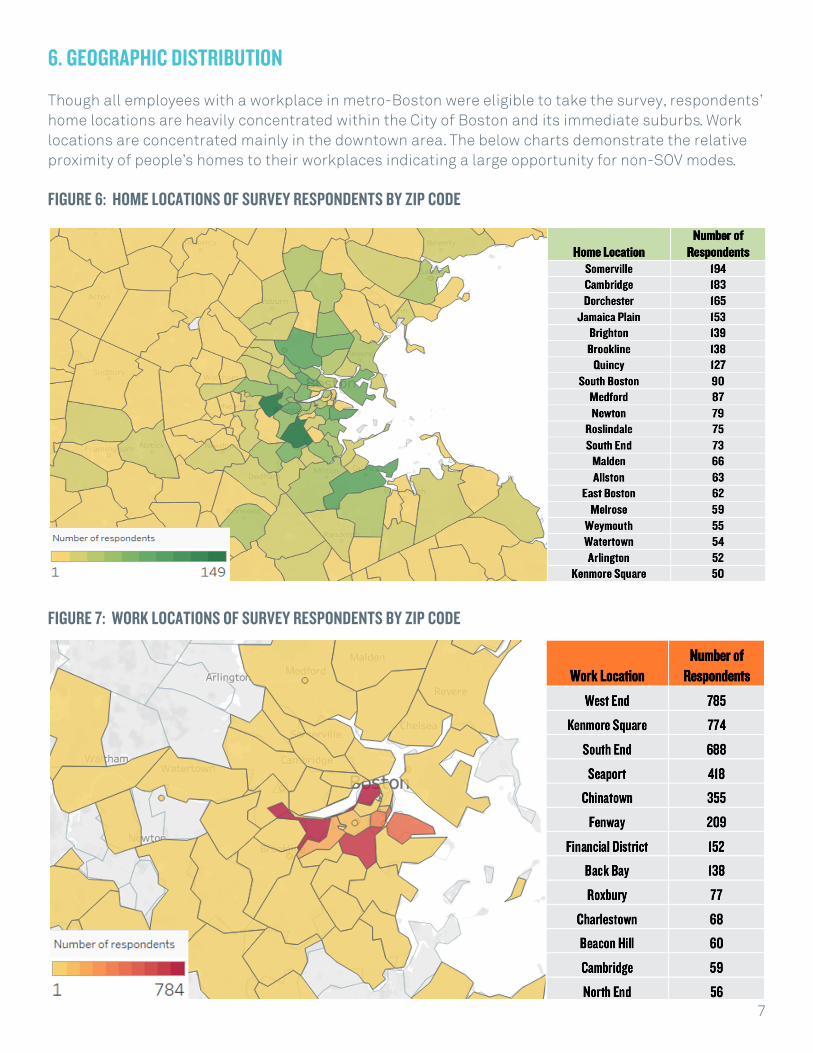
6. GEOGRAPHIC DISTRIBUTION
Though all employees with a workplace in metro-Boston were eligible to take the survey, respondents’ home locations are heavily concentrated within the City of Boston and its immediate suburbs. Work locations are concentrated mainly in the downtown area. The below charts demonstrate the relative proximity of people’s homes to their workplaces indicating a large opportunity for non-SOV modes.
FIGURE 6: HOME LOCATIONS OF SURVEY RESPONDENTS BY ZIP CODE
FIGURE 7: WORK LOCATIONS OF SURVEY RESPONDENTS BY ZIP CODE
7
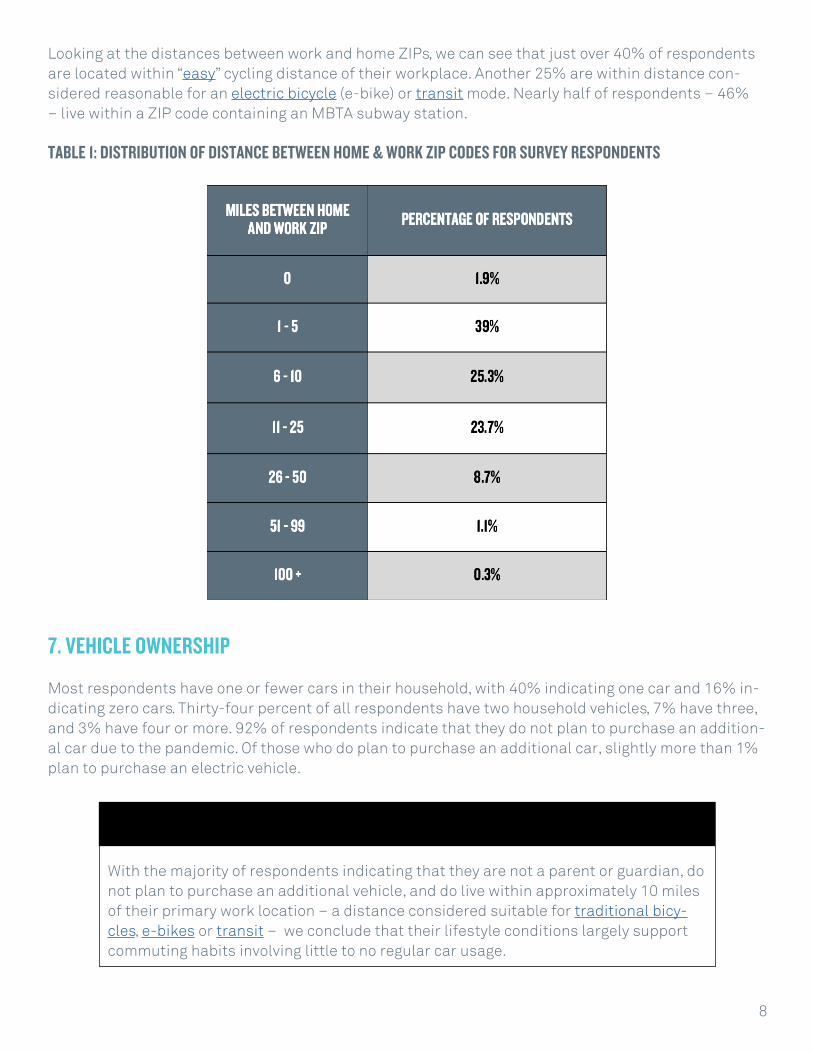
Looking at the distances between work and home ZIPs, we can see that just over 40% of respondents are located within “easy” cycling distance of their workplace. Another 25% are within distance con-sidered reasonable for an electric bicycle (e-bike) or transit mode. Nearly half of respondents – 46% – live within a ZIP code containing an MBTA subway station.
TABLE 1: DISTRIBUTION OF DISTANCE BETWEEN HOME & WORK ZIP CODES FOR SURVEY RESPONDENTS
7. VEHICLE OWNERSHIP
Most respondents have one or fewer cars in their household, with 40% indicating one car and 16% in-dicating zero cars. Thirty-four percent of all respondents have two household vehicles, 7% have three, and 3% have four or more. 92% of respondents indicate that they do not plan to purchase an addition-al car due to the pandemic. Of those who do plan to purchase an additional car, slightly more than 1% plan to purchase an electric vehicle.
KEY TAKEAWAYWith the majority of respondents indicating that they are not a parent or guardian, do not plan to purchase an additional vehicle, and do live within approximately 10 miles of their primary work location – a distance considered suitable for traditional bicy-cles, e-bikes or transit – we conclude that their lifestyle conditions largely support commuting habits involving little to no regular car usage.
8

TELEWORKPrior to the pandemic, more than half of respondents never teleworked. An additional 31% teleworked once per month to a few times per month, with only 7% teleworking every day.
During the pandemic, 60% of survey respondents indicate that they have teleworked every day. 17% have teleworked a few times per week and only 15% of respondents have not teleworked at all during the pandemic.
FIGURE 8: TELEWORK FREQUENCY OF SURVEY RESPONDENTS
9
KEY TAKEAWAYDespite now having widespread experience with telework, only 21% of respondents state that they would like to telework every day after their workplaces fully reopen. 47% would prefer a few times per week, while 16% believe they would most benefit from teleworking a few times per month. 9% would like to never telework.
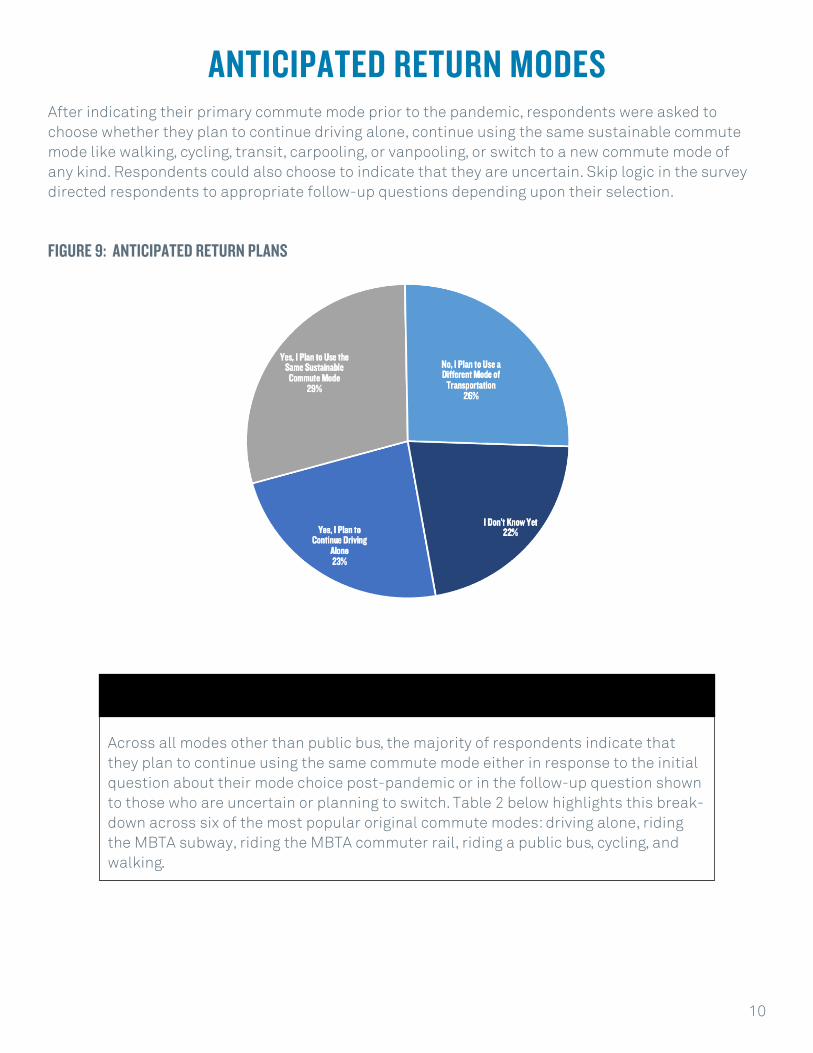
ANTICIPATED RETURN MODESAfter indicating their primary commute mode prior to the pandemic, respondents were asked to choose whether they plan to continue driving alone, continue using the same sustainable commute mode like walking, cycling, transit, carpooling, or vanpooling, or switch to a new commute mode of any kind. Respondents could also choose to indicate that they are uncertain. Skip logic in the survey directed respondents to appropriate follow-up questions depending upon their selection.
FIGURE 9: ANTICIPATED RETURN PLANS
10
KEY TAKEAWAYAcross all modes other than public bus, the majority of respondents indicate that they plan to continue using the same commute mode either in response to the initial question about their mode choice post-pandemic or in the follow-up question shown to those who are uncertain or planning to switch. Table 2 below highlights this break-down across six of the most popular original commute modes: driving alone, riding the MBTA subway, riding the MBTA commuter rail, riding a public bus, cycling, and walking.
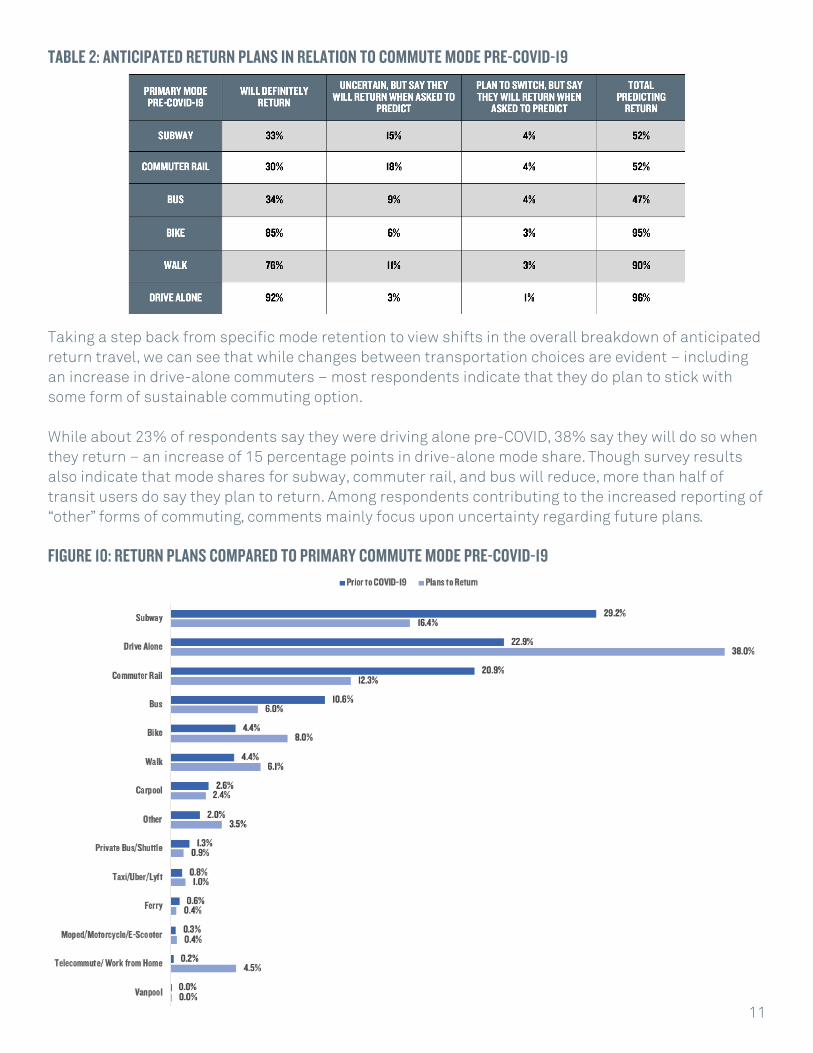
TABLE 2: ANTICIPATED RETURN PLANS IN RELATION TO COMMUTE MODE PRE-COVID-19
Taking a step back from specific mode retention to view shifts in the overall breakdown of anticipated return travel, we can see that while changes between transportation choices are evident – including an increase in drive-alone commuters – most respondents indicate that they do plan to stick with some form of sustainable commuting option.
While about 23% of respondents say they were driving alone pre-COVID, 38% say they will do so when they return – an increase of 15 percentage points in drive-alone mode share. Though survey results also indicate that mode shares for subway, commuter rail, and bus will reduce, more than half of transit users do say they plan to return. Among respondents contributing to the increased reporting of “other” forms of commuting, comments mainly focus upon uncertainty regarding future plans.
FIGURE 10: RETURN PLANS COMPARED TO PRIMARY COMMUTE MODE PRE-COVID-19
11
FOCUS ON CYCLING
Though many respondents state that cycling is either not an option for their commute or that they do not think any support measures could make them comfortable riding a bike, just over 10% of all survey respondents (about a quarter of the subset of respondents who indicate openness to changing their commute mode) do think that certain changes could help make them comfortable bike commuting.
Among this group,
Of the respondents who live in Boston and identify these types of additional bike infrastructure as key for supporting their increased comfort in cycling, over half identified Brighton, Jamaica Plain, South Boston, or Dorchester as their home neighborhood. These neighborhoods align well with several of the projects included in Boston’s Better Bike Lanes effort.
Thirty-one percent of respondents open to trying out bike commuting believe that lockers, showers, and changing facilities at their workplaces would help them make the switch. Per the City’s Bike Park-ing Guidelines released in January 2020, these accommodations should now be standard in any new large development.
12
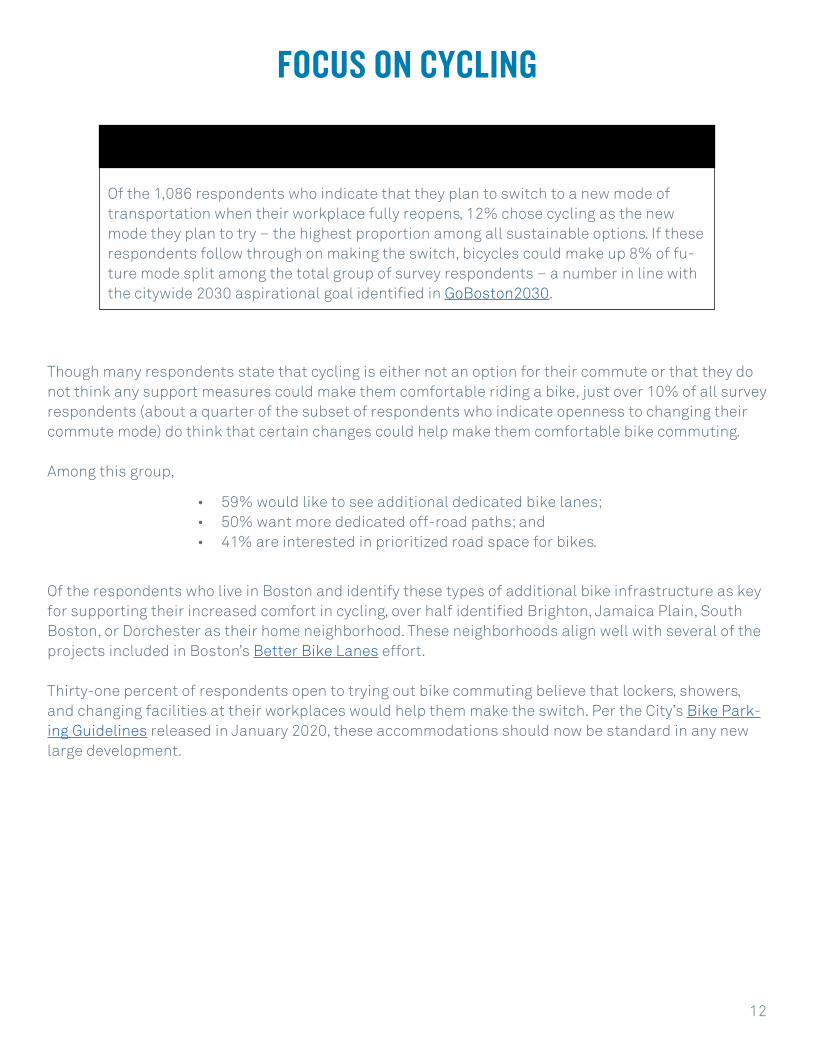
KEY TAKEAWAYOf the 1,086 respondents who indicate that they plan to switch to a new mode of transportation when their workplace fully reopens, 12% chose cycling as the new mode they plan to try – the highest proportion among all sustainable options. If these respondents follow through on making the switch, bicycles could make up 8% of fu-ture mode split among the total group of survey respondents – a number in line with the citywide 2030 aspirational goal identified in GoBoston2030.
• 59% would like to see additional dedicated bike lanes; • 50% want more dedicated off-road paths; and • 41% are interested in prioritized road space for bikes.
DRIVE ALONE BEHAVIOR CHANGEThough 15% of all survey respondents indicate that they plan to switch from sustainable commuting to driving alone when their workplaces fully reopen, there are a number of mitigating factors respon-dents identify as possible to support them in driving alone less. The majority of those planning to make the switch indicate that their primary motivation is safety, suggesting that some amount of this be-havior change could be impermanent in a post-vaccine future.
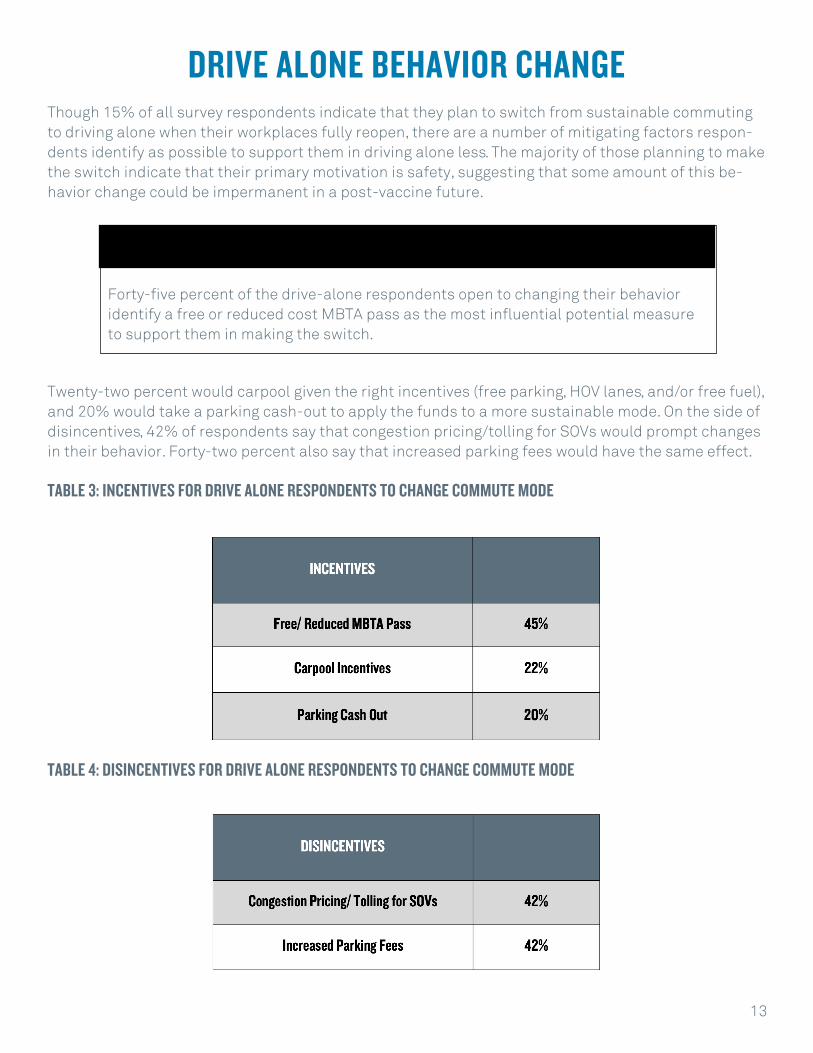
Twenty-two percent would carpool given the right incentives (free parking, HOV lanes, and/or free fuel), and 20% would take a parking cash-out to apply the funds to a more sustainable mode. On the side of disincentives, 42% of respondents say that congestion pricing/tolling for SOVs would prompt changes in their behavior. Forty-two percent also say that increased parking fees would have the same effect.
TABLE 3: INCENTIVES FOR DRIVE ALONE RESPONDENTS TO CHANGE COMMUTE MODE
TABLE 4: DISINCENTIVES FOR DRIVE ALONE RESPONDENTS TO CHANGE COMMUTE MODE
13
KEY TAKEAWAYForty-five percent of the drive-alone respondents open to changing their behavior identify a free or reduced cost MBTA pass as the most influential potential measure to support them in making the switch.

CAUTION REGARDING TRANSIT Of the 2,551 respondents who primarily commuted by public transit prior to the pandemic, two thirds are either unsure of their future commute mode or planning to switch. Among this group, 89% are either uncomfortable or unsure whether they’d be comfortable riding transit over the next few months. For these riders, more than half identified enforcement of mask wearing, upgraded ventilation, limiting the number of passengers in vehicles, and running additional vehicles to allow for social distancing as the top choices for actions that could increase their comfort on transit.
FIGURE 11: PRECAUTIONS TO INCREASE COMFORT ON TRANSIT
14

Of those who plan to return to their workplaces by driving alone, 38% commuted primarily by transit prior to the pandemic. Among that group, close to half say that they would return to transit if they were sure it was safe. Another third say they would be either somewhat or very likely to return given the right incentives.
CONCLUSIONThough these results show that 14% of metro-Boston employees surveyed do plan to shift away from transit and toward SOVs, nearly 62% percent of respondents would like to continue to commute sus-tainably when their workplaces fully reopen. Roughly 66% of respondents are within cycling distance of their workplace by either bike or e-bike, and 12% are open to try bicycle commuting in the near fu-ture. The top three options that may help those unsure about riding to give cycling a try were all relat-ed to better bicycling infrastructure:
This suggests the City has real power to influence modeshift to cycling by expanding programs like Healthy Streets and continuing to build out a safe cycling network.
Among respondents who plan to switch to driving alone, their primary motivation is safety. When safe-ty concerns have been addressed, financial incentives and disincentives such as reduced cost MBTA passes, discounted parking for carpools, and increased parking fees for SOVs can encourage them to make the switch back.
• 59% bike lanes;• 50% off-road paths; and • 41% prioritized road space.
15
KEY TAKEAWAYAs part of the Ride Safer Campaign, 7/10 of these interventions have been imple-mented, affecting some or all MBTA routes. This suggests greater PR and awareness efforts around these initiative might yield positive ridership results.

WHAT THIS MEANS FOR CITY POLICY
The survey of office, university, and hospital employees point to steps the City of Boston can take over the coming months to make choosing sustainable modes convenient. An increase in drive-alone rates will only exacerbate pre-pandemic congestion levels, increasing air pollution, and emissions. Here are steps the City is taking for a healthier and more equitable Boston:
• Building more dedicated bike lanes and prioritizing road space for bicycles goes a long way in convincing commuters to bike to work. In response to the pandemic and through the Healthy Streets program, the Boston Transportation Department has already installed over seven miles of protected bike lanes and is committed to making biking in Boston safe and convenient.
• The City of Boston is working with the MBTA to inform riders of the steps the T is taking to ensure compliance with wearing masks, the frequent sanitization of all subway cars and buses, and other precautions ensuring safety.
• Finally, the City will work with large employers to commit to programs that pro-vide financial incentives for transit and bike share to encourage their employ-ees not to drive upon return to the workplace.