Embed Size (px)
Citation preview
Satisfaction with life and local area among people who work in the Cambridge area Results from the Cambridge Ahead Quality of Life Survey
Bryn Garrod, Catherine Saunders, Marco Hafner, Christian van Stolk
In October 2014, the Local Government Association (LGA) People and Places Board commissioned RAND Europe to prepare nine case studies of places where LGA knew a pooled approach was being used. The objective was to describe the development of different initiatives and to comment on what appeared to be the enablers and barriers to progress. LGA also asked RAND Europe to make recommendations for what a ‘public sector reform deal’ – a series of ‘asks’ of government and ‘offers’ from places – might look like, based on the evidence from the nine initiatives.
The specific initiatives examined were put forward by the local authorities involved in the project, and cover different services including health and social care, skills and vocational training, regeneration, economic growth, troubled families and the management of public assets. In the time available, RAND Europe was not able to carry out full evaluations of the initiatives, and was asked not to place undue burden on participating bodies. This, and limitations on the availability of quantitative and financial data where projects were at any early stage, restricted our analysis of impact.
To undertake the project, RAND Europe gathered evidence from a number of sources. The team conducted a review of the relevant literature on community budgets, pooling and public service reform prior to the next phase of the research. After examining documents relating to each case study, the team conducted interviews with key representatives involved in the initiatives. The interviews took place between mid-November 2014 and early January 2015. A workshop with representatives from all nine places and the LGA was held in January 2015 to discuss emerging findings. This evidence base has enabled us to draw conclusions on general lessons about the factors that appear to be influencing collaborative working, but not comment in detail on the effectiveness of individual initiatives.
We would like to thank Laura Caton and Piali DasGupta of the Local Government Association for facilitating the project, and all those staff in different agencies who agreed to be interviewed or attended our workshop.
For more information on this publication, visit www.rand.org/t/rr1123
Published by the RAND Corporation, Santa Monica, Calif., and Cambridge, UK
© Copyright 2015 RAND Corporation
R® is a registered trademark.
RAND Europe is an independent, not-for-profit policy research organisation that aims to improve policy and decisionmaking in the public interest through research and analysis. RAND’s publications do not necessarily reflect the opinions of its research clients and sponsors.
Limited Print and Electronic Distribution RightsThis document and trademark(s) contained herein are protected by law. This representation of RAND intellectual property is provided for noncommercial use only. Unauthorized posting of this publication online is prohibited. Permission is given to duplicate this document for personal use only, as long as it is unaltered and complete. Permission is required from RAND to reproduce, or reuse in another form, any of its research documents for commercial use. For information on reprint and linking permissions, please visit www.rand.org/pubs/permissions.html.
Support RANDMake a tax-deductible charitable contribution at
www.rand.org/giving/contribute
www.rand.orgwww.randeurope.org
Preface
Cambridge Ahead is an organisation of large local employers in the Cambridge area including Anglia Ruskin University, AstraZeneca, ARM, Brookgate, Bidwells, Birketts LLP, Cambridge University Hospitals (Addenbrooke’s), Jagex, Marshall, Mills & Reeve, MedImmune, Ridgeons and the University of Cambridge, among others (for a full list, see Appendix A). At the heart of Cambridge Ahead’s interests is a concern with recruiting and retaining a talented workforce in the light of increasing competition from London (only a 45-minute train ride away) and further afield, both nationally and internationally. With a total revenue of £13 billion in real terms Cambridge is a world-class economic powerhouse that punches far above its weight, but this is only sustainable if the city’s quality of life measures up to that found in competing towns and cities. In simple terms: if house prices in Cambridge match London’s but the city lacks adequate road-transport systems and entertainment facilities, and has poorly funded education services, then why not just work and live in London or elsewhere?
This report is based on analysis of a quality-of-life survey of employees of Cambridge Ahead companies, conducted by RAND Europe. The survey asked respondents about their overall quality of life, and the quality and their use of local services across a range of areas including health and transport, collecting information about perceptions of quality of life, as well as about some of the factors underlying these perceptions.
By gathering and sharing this information, Cambridge Ahead and other interested parties – the three councils, the Greater Cambridge Greater Peterborough Local Enterprise Partnership (GCGP LEP), the chamber of commerce and other business-led organisations and stakeholders – will be better positioned to understand the issues presented, to prioritise where necessary, and to act upon them in joint consultation where appropriate.
This report hopes to contribute to the wider debate on quality of life in the Cambridge area and is aimed at policymakers and wider stakeholders involved in related discussions.
For further information, please contact:
Dr Christian van Stolk
RAND Europe
Tel: +44 (0) 1223 353329
iii

Table of Contents
Preface ........................................................................................................................ iii Table of Contents ......................................................................................................... v Tables ........................................................................................................................ vii Figures ....................................................................................................................... viii Summary ..................................................................................................................... xi Acknowledgements .................................................................................................... xiii CHAPTER 1 Introduction ..................................................................................... 1
1.1 Context ............................................................................................... 1 1.2 What we did ........................................................................................ 1 1.3 The importance of understanding quality of life .................................. 3 1.4 Structure of this report ......................................................................... 4
CHAPTER 2 Local services and issues in the Cambridge area ................................. 5 2.1 What local services and issues are most in need of improvement? ......... 5 2.2 Analysis of individual local services and issues ...................................... 6 2.3 Conclusion ........................................................................................ 16
CHAPTER 3 Drivers of life and local area satisfaction .......................................... 17 3.1 Why do local services matter?............................................................. 17 3.2 Where do our respondents live? ......................................................... 18 3.3 Is the Cambridge area different from other areas? ............................... 21 3.4 Variation across the Cambridge area .................................................. 22 3.5 Drivers of satisfaction ........................................................................ 25 3.6 Conclusion ........................................................................................ 27
CHAPTER 4 Further areas for examination.......................................................... 28 References ................................................................................................................. 31 Appendix A: Organisations in the sample .................................................................. 33 Appendix B: Methods ................................................................................................ 36
Sampling ......................................................................................................... 36 Satisfaction measures ....................................................................................... 36 Demographic characteristics ............................................................................ 36 Analysis .......................................................................................................... 37 Strengths and limitations of this research ......................................................... 38
Appendix C: Cambridge Ahead Quality of Life Survey .............................................. 41 Appendix D: Survey questions measuring local area and life satisfaction, personal factors,
and satisfaction with local services ................................................................... 56 Appendix E: Location of respondents ........................................................................ 58 Appendix F: Drivers analysis coefficients, confidence intervals and p-values ............... 63
v

RAND Europe
Appendix G: Variation in satisfaction with local services across different personal characteristics ................................................................................................... 65
vi
Tables
Table 1. Drivers selected for each area of interest. ........................................................... 18
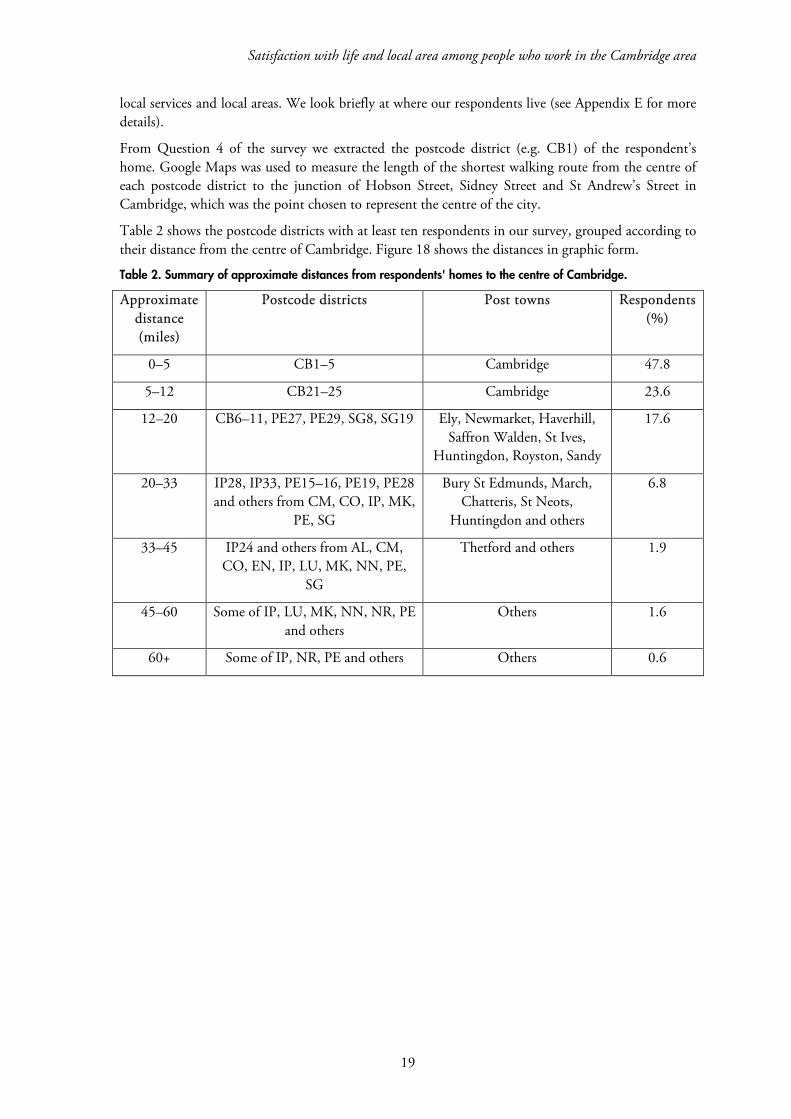
Table 2. Summary of approximate distances from respondents' homes to the centre of Cambridge. .................................................................................................. 19
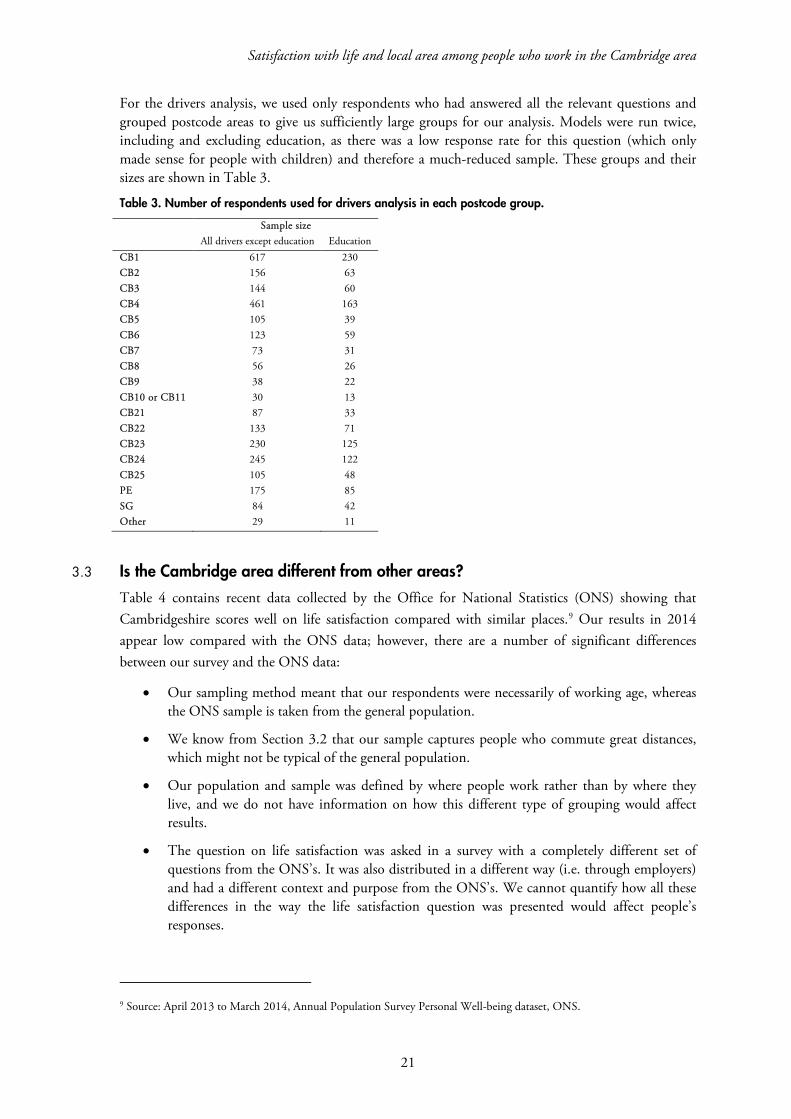
Table 3. Number of respondents used for drivers analysis in each postcode group........... 21
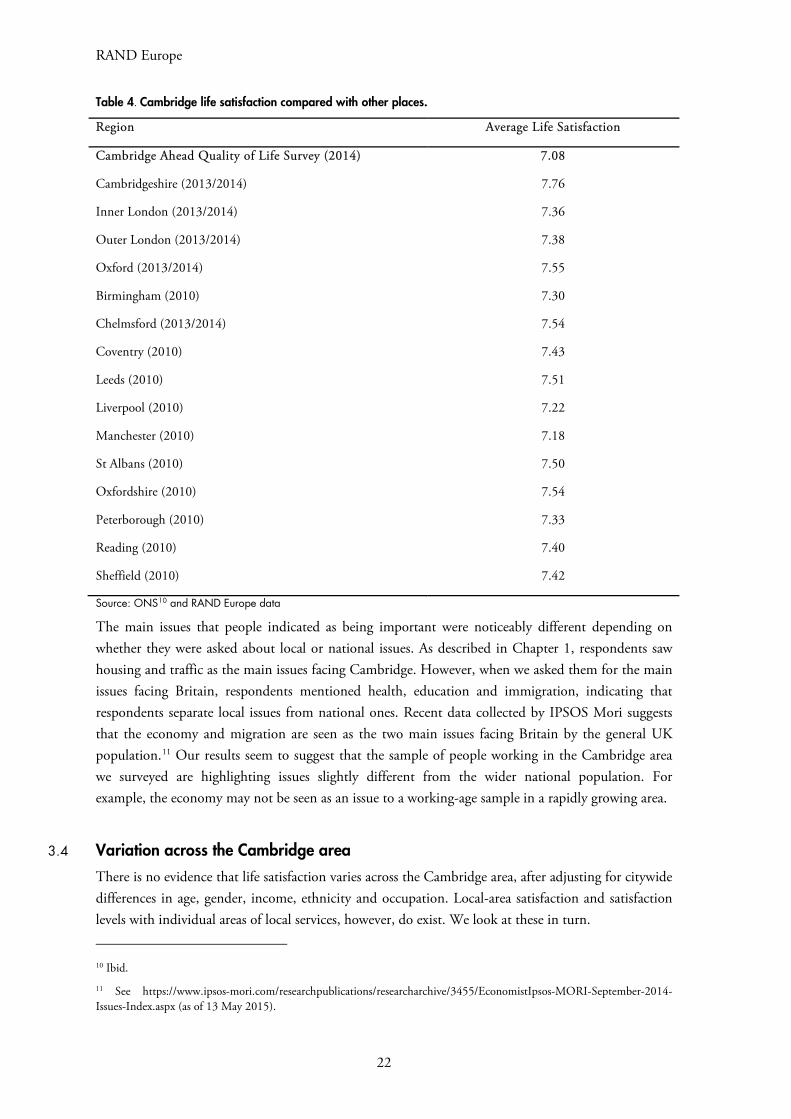
Table 4. Cambridge life satisfaction compared with other places. ................................... 22
Table 5. Variation in local service satisfaction by postcode area. ...................................... 24
Table 6. Standardised coefficients of drivers of local-area satisfaction, including and excluding education. .................................................................................................... 26
Table 7. Standardised coefficients of high-level drivers of life satisfaction, including and excluding education. .................................................................................... 26
Table 8. Standardised coefficients of local services as drivers of life satisfaction, including and excluding education. .................................................................................... 27
Table 9. Number of respondents used for drivers analysis in each organisation. .............. 33
Table 10. Local-area and life satisfaction, personal factors, and satisfaction with local services. .................................................................................................................... 56
Table 11. Standardised coefficients of drivers of local area satisfaction, with confidence intervals and p-values, including and excluding education. ........................... 63
Table 12. Standardised coefficients of high-level drivers of life satisfaction, with confidence intervals and p-values, including and excluding education. ........................... 63
Table 13. Standardised coefficients of local services as drivers of life satisfaction, with confidence intervals and p-values, including and excluding education. ......... 64
Table 14. Variation in satisfaction with local services across different personal characteristics. .................................................................................................................... 65
vii
Figures
Figure 1. Improving local services to improve quality of life .............................................. 2
Figure 2. Which of these do you think is the most important issue facing Britain/your local area today? ...................................................................................................... 5
Figure 3. Satisfaction with local services on a scale of 1 to 5............................................... 6
Figure 4. Percentage of people agreeing that they struggle or struggled to get onto the property ladder in each age group ................................................................................. 6
Figure 5. Satisfaction with housing affordability by socio-demographic and employment characteristics. ................................................................................................ 7
Figure 6. Percentage of people dissatisfied with traffic congestion during weekday travel. .. 8
Figure 7. Satisfaction with level of traffic by socio-demographic and employment characteristics. ................................................................................................ 9
Figure 8. Percentage of people agreeing and disagreeing that they feel they belong to their neighbourhood, by income ............................................................................. 9
Figure 9. Feeling of belonging by socio-demographic and employment characteristics. .... 10
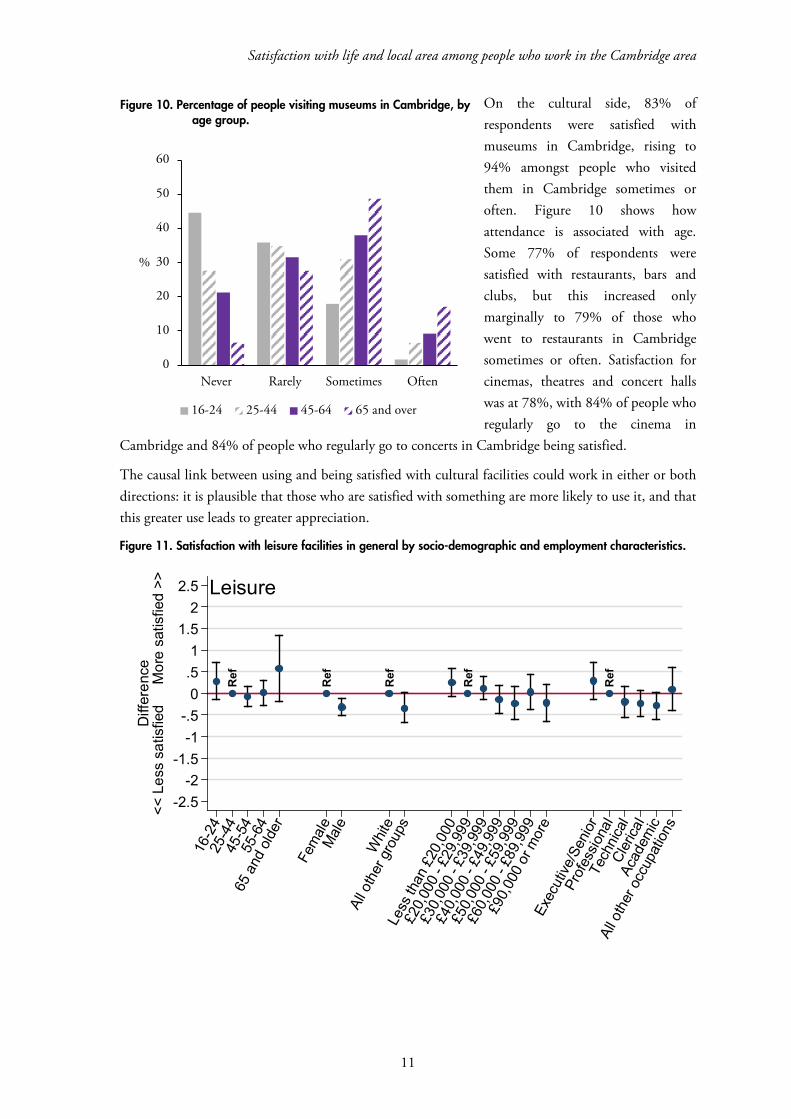
Figure 10. Percentage of people visiting museums in Cambridge, by age group ............... 11
Figure 11. Satisfaction with leisure facilities in general by socio-demographic and employment characteristics. .............................................................................................. 11
Figure 12. Percentage of people satisfied with access to adult training and education, by gender ..................................................................................................................... 12
Figure 13. Satisfaction with getting children into quality schools by socio-demographic and employment characteristics. .......................................................................... 13
Figure 14. Percentage of people satisfied with different health services, by age ................. 14
Figure 15. Satisfaction with local GPs by socio-demographic and employment characteristics. ..................................................................................................................... 14
Figure 16. Percentage of people satisfied with employment opportunities, by age ............ 15
Figure 17. Satisfaction with employment opportunities by socio-demographic and employment characteristics. .......................................................................... 16
Figure 18. Summary of approximate distances from respondents' homes to Cambridge. . 20
Figure 19. Differences in local-area satisfaction (measured on a 0–10 scale) by postcode of residence compared with people living in CB1; unadjusted, after adjustment for individual respondent characteristics (socio-demographic and employment) and
viii

Satisfaction with life and local area among people who work in the Cambridge area
after additionally adjusting for satisfaction with local services (transport, housing, neighbourhood, employment, education, health and leisure) ....................... 25
Figure 20. Respondents by age group. ............................................................................. 37
Figure 21. Respondents by income group. ...................................................................... 37
Figure 22. Postcode districts for the CB postcode area and surrounding postcode areas. . 59
Figure 23. Location of respondents’ homes in Cambridge and its immediate surroundings.60
Figure 24. Location of respondents’ homes in and around Cambridgeshire. .................... 61
Figure 25. Distribution of approximate distances from respondents' homes to Cambridge.62
ix

Summary
In light of the continuing economic success of the Cambridge area,1 Cambridge Ahead, an organisation of large employers in the Cambridge area,2 set up a quality-of-life project to answer the following questions:
• Is living in the Cambridge area an attractive proposition? • What does the answer to the first question mean for developing the Cambridge area not only
as a place to work but also as somewhere to live?
The rationale behind the project is the realisation that the Cambridge area needs to maintain its competitive edge, both nationally and internationally, by promoting economic growth and attracting business to the area. Quality of life is seen as a key factor in ensuring that Cambridge continues to attract employers and employees.
The project recognised that ‘quality of life’ means different things to different people and aimed to identify and develop new initiatives for all demographic groups, in collaboration with other programmes, government-led or otherwise. Cambridge Ahead identified areas of interest that the survey should analyse, including housing, transport, leisure, education, health, employment, and safety and security.
This report is an analysis of a survey of employees of the Cambridge Ahead organisation conducted by RAND Europe in 2014. At the request of Cambridge Ahead, some additional companies were also invited to participate, as well as the local authorities administering the Cambridge area. The survey explored respondents’ experiences of local services, and their satisfaction with the local area and with their lives overall. The major findings were as follows.
Housing and traffic are the areas of most concern Across the Cambridge area, housing and traffic congestion were identified as the issues with which respondents are most dissatisfied, and where improvement is most acutely needed. Young people are the most likely to find housing unaffordable, while older groups are more concerned about traffic.
Respondents are satisfied with other local services and amenities Respondents are generally satisfied with all other local services and amenities – community, leisure, education and health – and with employment opportunities.
Satisfaction with local services and amenities varies across demographic groups Women, ‘white’ respondents and wealthier respondents are more likely to feel that they belong to their community. Women and white respondents are more satisfied with various aspects of education,
1 For a description of what we mean by the ‘Cambridge area’, see footnote 3 on page 1.
2 For information about the membership of Cambridge Ahead, see footnote 4 on page 1. We give a full list of members in Appendix A.
xi
RAND Europe
but these findings were not particularly affected by income. Older people are more satisfied than younger people with GPs and hospitals, but less satisfied with mental health services. Younger and older people are more satisfied with employment opportunities than respondents in the middle age-groups.
People who work in Cambridge live across a wide area More than half the respondents live outside the CB1–CB5 postcode districts (corresponding to a likely commute of more than five miles), and more than a quarter live outside the CB1–CB5 and CB21–CB25 postcodes (a likely commute of more than 12 miles). More than one in ten respondents commutes over 20 miles to work in Cambridge. When assessing quality of life for people who work in the Cambridge area, we should therefore be looking at a large region centred on the city of Cambridge but including the whole of Cambridgeshire and beyond.
There are noticeable differences between people living inside and outside the city Housing is perceived as most unaffordable by respondents living in the centre of Cambridge, but concerns about traffic are lower among these residents. In areas where commutes to the centre of Cambridge are longer there is a higher satisfaction with housing affordability, but a lower satisfaction with traffic. The sense of belonging to the community is lower in the centre of Cambridge, but satisfaction with leisure facilities is higher.
Satisfaction with different areas is associated with satisfaction with local services and amenities Levels of satisfaction with local services and living conditions (including housing, road congestion, community, leisure, education and health services) vary by postcode, but satisfaction with employment opportunities remains more constant. Respondents in different postcodes also show different levels of overall satisfaction with their local area, with the postcodes with the most satisfied respondents tending to have residents who are more satisfied with their local services and amenities.
Satisfaction with leisure, education and health facilities shows a significant relationship to local-area satisfaction Individual respondents’ sense of belonging appears to be strongly related to their satisfaction with their area. In addition, we see significant relationships between leisure, education and health facilities and satisfaction with the local area. While respondents may consider housing and traffic to be the most significant issues, these factors may be less significant in explaining local-area satisfaction.
The results suggest a significant relationship between local-area satisfaction and life satisfaction We find that, after accounting for individual socio-demographic and employment factors, a person’s satisfaction with his or her local area is the strongest driver of reported life satisfaction. Mental and physical health and work–life balance are also positively associated with life satisfaction.
Making the Cambridge area a better place to live requires a rounded approach Our research found interesting interdependencies between satisfaction with local services, satisfaction with the local area, and life satisfaction. It also suggests ways of increasing satisfaction with local services and overall life satisfaction and provides a more nuanced insight into what is important for Cambridge residents. Understanding areas where overall satisfaction is lowest and what drives individual well-being are two complementary strands which policymakers can take forward to improve residents’ quality of life.
xii
Acknowledgements
The authors would like to thank the quality assurance reviewers for this work at RAND Europe, Hans Pung and Sunil Patil. We would also like to thank our sponsors, Jane Paterson-Todd, Ian Mather and board members at Cambridge Ahead, who provided useful comments on this report. We also want to thank Barbara Janta at RAND Europe for her assistance in managing the survey. Isaac Lim provided valuable research support. The views presented in this report are the authors’. Any remaining errors are our own.
xiii

CHAPTER 1 Introduction
1.1 Context
Cambridge Ahead is an organisation of large employers in the Cambridge area who will play a role in shaping the future of the city and its surrounding area.3 These include Anglia Ruskin University, AstraZeneca, ARM, Brookgate, Bidwells, Birketts LLP, Cambridge University Hospitals (Addenbrooke’s), Jagex, Marshall, Mills & Reeve, MedImmune, Ridgeons and the University of Cambridge, among others.4
To improve its understanding of what the typical employee of a Cambridge-area business feels about his or her current quality of life, Cambridge Ahead embarked on a survey of its membership base, targeted at the working population of the Cambridge area. The ultimate goal of this project is to work with other organisations, government-led or otherwise, to find ways of improving the quality of life for all employees and make Cambridge a competitive location able to both attract and retain talent.
Local policymakers, such as those on Cambridge City Council, South Cambridgeshire District Council and Cambridgeshire County Council, are interested in improving life for local residents. However, only certain things are within their control, primarily local services. Essentially, their best means of enhancing quality of life is to improve those local services that need improving, which has a positive effect on the local area as a whole and, ultimately, the quality of life for the people who live in it.
1.2 What we did
RAND Europe designed and deployed the survey and subsequently analysed the survey data as part of its membership contribution to Cambridge Ahead. This report sets out the analysis of the survey.
We distributed the internet-based survey to all members of Cambridge Ahead and some other organisations that were invited to participate by the leadership of Cambridge Ahead. Cambridge
3 This report focuses on the Cambridge area. Cambridge Ahead considers the Cambridge area to be ‘Cambridge and the sub-region with no absolute region being drawn […] the region includes those areas that have an immediate and direct impact on the economic and social heart of Cambridge’ (see http://www.cambridgeahead.co.uk/about-us/faqs/, accessed 13 May 2015). An indication of this area is shown at the ‘projects area map’ page (see http://www.cambridgeahead.co.uk/our-projects/cambridge-ahead-map/, accessed 13 May 2015).
4 Cambridge Ahead does not have strict rules on membership, but encourages ‘large-scale organisations and enterprises in the city region’ to become members (see http://www.cambridgeahead.co.uk/membership/become-a-member/, accessed 13 May 2015). In practice, as of May 2015 these organisations are based in Cambridge. We give a full list of members in Appendix A.
1
RAND Europe
Ahead contacts from each organisation were contacted by email and asked to circulate the survey link to all employees. Three follow-up reminder emails were sent at weekly intervals. Data collection was carried out during six weeks from June to July 2014. Two organisations decided to launch the survey later in August; for them, the survey ran over a two-week period going into September.
In total, 27 employers and three councils (Cambridge City Council, South Cambridgeshire District Council and Cambridgeshire County Council) in the Cambridge area participated. We had 4,882 responses overall.
It is difficult to calculate a response rate as we had no direct control over the distribution of the survey. However, we did have some indicative information on the number of employees in each of the participating organisations. As a result, we estimate that close to 15 per cent of the working population of the companies surveyed participated. This is an average and some companies had a higher participation rate, with the highest being around 80 per cent. We also provided organisations with more than ten respondents with reports comparing their results with those of all respondents. 5
The survey consisted of 49 questions and took about 15–20 minutes to complete. Participation was voluntary and we did not offer any incentive to participants. Appendix B offers more information on sampling and how the survey was run.
The survey asked respondents questions on:
• Personal characteristics (age, gender, income, ethnicity, occupation)• Experience of local services/issues across seven areas (housing, transport, education, health
services, community and crime, leisure, and employment)• Local area and life satisfaction.
For the full survey, see Appendix C.
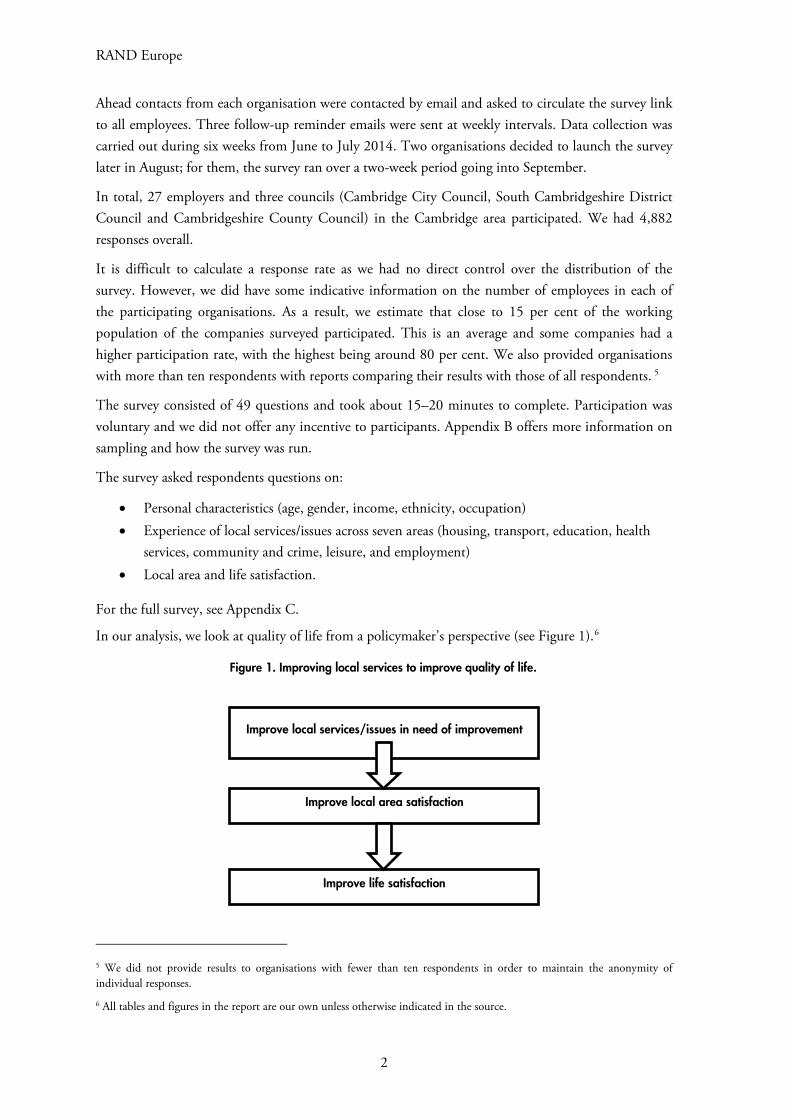
In our analysis, we look at quality of life from a policymaker’s perspective (see Figure 1).6
5 We did not provide results to organisations with fewer than ten respondents in order to maintain the anonymity of individual responses.
6 All tables and figures in the report are our own unless otherwise indicated in the source.
Improve local services/issues in need of improvement
Improve local area satisfaction
Improve life satisfaction
Figure 1. Improving local services to improve quality of life.
2
Satisfaction with life and local area among people who work in the Cambridge area
We begin by asking which local services residents see as being most in need of improvement. Next, we examine the contribution of each of them to local-area satisfaction. Finally, we find out the extent to which local-area satisfaction affects life satisfaction, as well as identifying other significant factors. We also look at the variation of local-area satisfaction between areas, and examine how much of this can be explained by variation in the quality of local services.
As such, this report answers the following questions:
• Which local services are people most and least satisfied with, and who is more/less satisfied?
• Do socio-demographic/employment factors or satisfaction with local services explain variations in local-area satisfaction across Cambridge?
• What are the drivers of local-area and life satisfaction among Cambridge Ahead survey respondents?
We use different statistical methods to analyse the questions above. These include univariate and multivariate models, which are explained in more detail in Appendix B.
1.3 The importance of understanding quality of life
Quality of life as a concept has become subsumed into a larger discussion about well-being in society (Huppert et al. 2005). One of the reasons for measuring local well-being is to better understand the needs of local areas (Steuer & Marks 2008). Local government can play a direct role in improving local-area well-being by increasing employment opportunities, fostering a greater sense of community cohesion and regenerating the local environment, helping to improve standards of local health and ensuring that all residents can reach their potential and have a good life (HM Government 2010). Some recent reviews suggest that local government should take a more universal and holistic approach to improving well-being rather than focusing on specific target and at-risk groups (Aked et al. 2010; Marmot et al. 2010). Improving well-being is then seen as a catalyst for wider economic outcomes such as reduced healthcare utilisation, more social capital or social cohesion, increased employment, and higher productivity at work.
In recent years, analysis of societal progress has moved on, looking at measures of subjective well-being (Stiglitz et al. 2010) as well as examining purely monetary measures. Measures of subjective well-being often focus on a wide range of parameters such as happiness and personal functioning as well as local-area and life satisfaction (Aked et al. 2008). Asking survey respondents to rate their own life satisfaction is a recognised approach (Layard 2010).
In our survey, we focus mostly on life satisfaction and local-area satisfaction as proxies of quality of life and local well-being. Our hypothesis is that local policymakers can affect the local environment in a number of ways which can improve local quality of life.
In this way, the report is timely given that local policymakers in Cambridge have recently achieved more flexibility in setting local priorities through the Greater Cambridge City Deal.7 Elsewhere,
7 https://www.gov.uk/government/uploads/system/uploads/attachment_data/file/321722/Greater_Cambridge_City_Deal_Document.pdf (as of 13 May 2015).
3
RAND Europe
Manchester has achieved significant freedom from central government in setting its own course in certain areas.8
In terms of local population, we look only at the working population. Employers have a clear interest in improving local quality of life. This potentially helps them attract the best and brightest to the Cambridge area and is also important in having engaged and productive staff. In addition, improving employee well-being has the potential to make a significant contribution to societal well-being, the economy and public finances, as well as reducing levels of disease and illness (Black & Frost 2011; Dolan et al. 2008; Waddell & Burton 2006).
Achieving such outcomes requires effective partnership models between employers and local decision-makers. Some reviews suggest that these models of partnership are often in place but are not exploited fully, which means that local needs are often not properly understood by policymakers and more comprehensive approaches not taken (Aked et al. 2010)
1.4 Structure of this report In Chapter 2, we look at satisfaction with individual services and issues: which aspects of the local area are people most happy with, and how do opinions vary between different groups?
In Chapter 1, we look at the drivers of local-area satisfaction, i.e. local services and issues whose improvement is most associated with increases in local-area satisfaction. We examine geographical variation in local-area satisfaction and assess how much of the variation can be attributed to socio-demographic and employment characteristics, and how much to differences in local services and other issues. We also look at the drivers of life satisfaction.
In Chapter 4, we summarise our main conclusions and recommendations arising from this analysis.
8 http://www.bbc.com/news/uk-england-manchester-31615218 (as of 13 May 2015).
4
CHAPTER 2 Local services and issues in the Cambridge area
In this chapter we look in more detail at satisfaction with local services and other local issues. To do this, we first establish which services were seen as most in need of improvement and then look in more detail at seven areas: housing, traffic, community, leisure, education, health and employment. In these areas, we examine which personal characteristics (age, gender, income, ethnicity, occupation) play a role in determining satisfaction levels. Measures of satisfaction are derived from specific questions from the survey (see Appendix D).
2.1 What local services and issues are most in need of improvement?
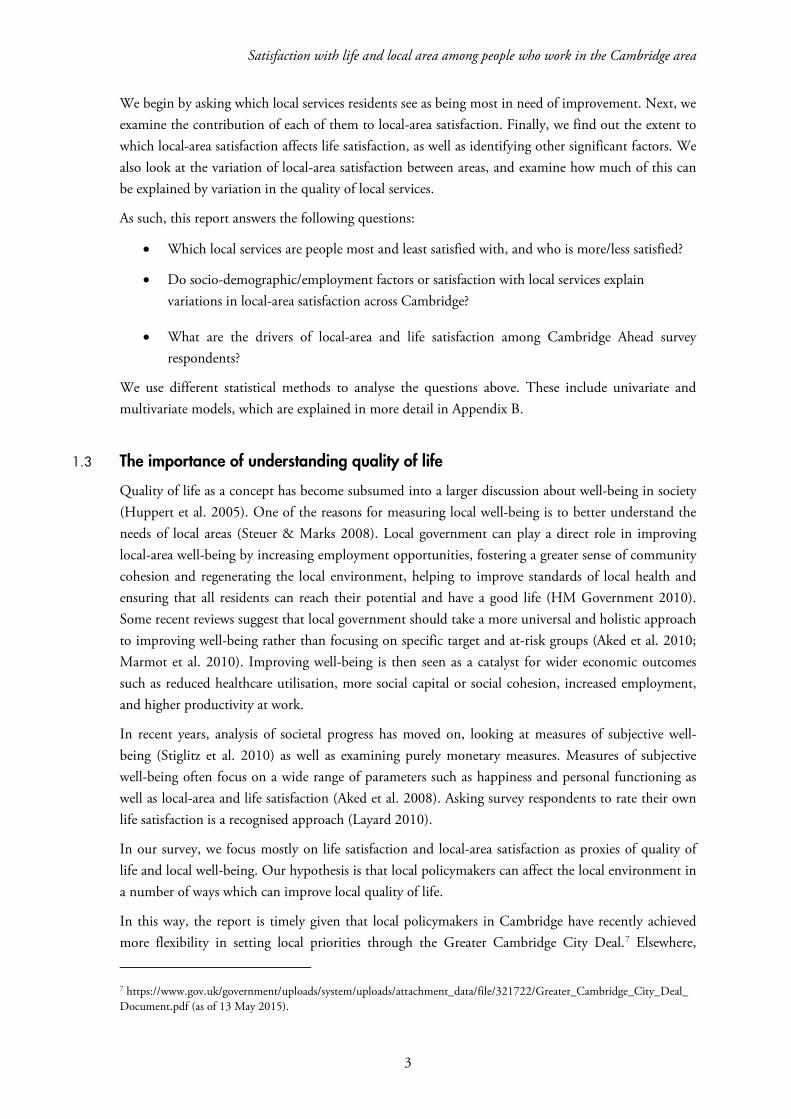
Two of the questions on the quality of life survey asked: ‘Which of these do you think is the most important issue facing Britain/your local area today?’ The results are shown in Figure 2.
Figure 2. Which of these do you think is the most important issue facing Britain/your local area today?
In both cases around 8% of respondents selected ‘other’ and mentioned housing, and even more might have selected it if housing had been given as an explicit option. In the local context, this puts it just behind health. We conclude that road congestion is considered to be by far the most important issue for Cambridge, which is particularly striking considering how much less of an issue it is considered in Britain in general. Education, health and housing are considered the next most important local issues. It is noticeable that these issues relate to the provision of public services such as roads, schools and hospitals, while housing development is also heavily influenced by public bodies.
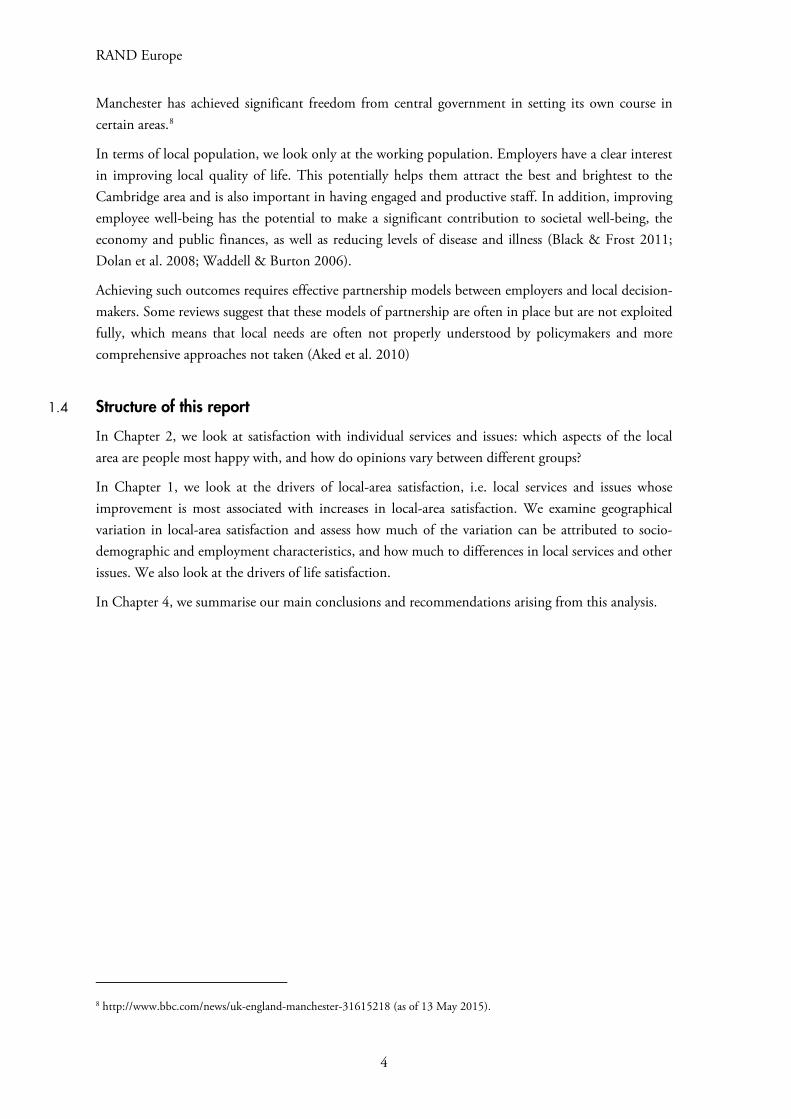
In different questions, we asked for satisfaction with various aspects of life in Cambridge. Figure 3 shows some of the results (the questions and response options are given in Appendix D).
Road CongestionEducation
HealthImmigration
PovertyCrime/Law and order
Climate ChangeOther 17%
3%5%6%7%
9%10%
42%
Mostimportantissue facingyour localarea today
15%10%
5%14%
19%20%
15%2%
Mostimportantissue facingBritaintoday
5
RAND Europe
Figure 3. Satisfaction with local services on a scale of 1 to 5.
It is clear that housing affordability and traffic levels are the two areas with which people are least satisfied, with road congestion already seen as the biggest local issue and housing in among the chasing pack.
2.2 Analysis of individual local services and issues
We now look in more detail at the results for each area covered by the survey, examining them in order of ‘least satisfied’ to ‘most satisfied’ (Figure 3).
2.2.1 Housing The average score for housing affordability shows that opinion on this is lower than for any other area; 76% of respondents disagreed with the statement that ‘Housing in my neighbourhood is affordable’. All questions in this area revealed dissatisfaction with housing, although there were fewest concerns about the availability of private rental accommodation. Younger people were generally less satisfied than older people.
Unsurprisingly, concerns about affordability are related to availability: 55% agreed that they struggle or struggled to get onto the property ladder and 52% disagreed that there is enough social housing. The effect of age on the first of these is particularly striking, with 78% of respondents aged 16–24 struggling or having struggled to get onto the property ladder compared to only 30% of those aged 65 and over. The private rental market shows a slightly different picture, with 43% disagreeing that there is enough privately rented housing, a lower number than for the other two sectors, although views are still negative overall as only 28% agreed
3.973.69
3.613.603.59
1.931.91
1 2 3 4 5
Employment opportunitiesLocal GPs
Quality of schoolsLeisure facilities in general
Belonging to neighbourhoodLevel of traffic
Housing affordability
Figure 4. Percentage of people agreeing that they struggle or struggled to get onto the property ladder in each age group.
0
10
20
30
40
50
60
70
80
90
16-24 25-44 45-64 65 and over
%
6
Satisfaction with life and local area among people who work in the Cambridge area
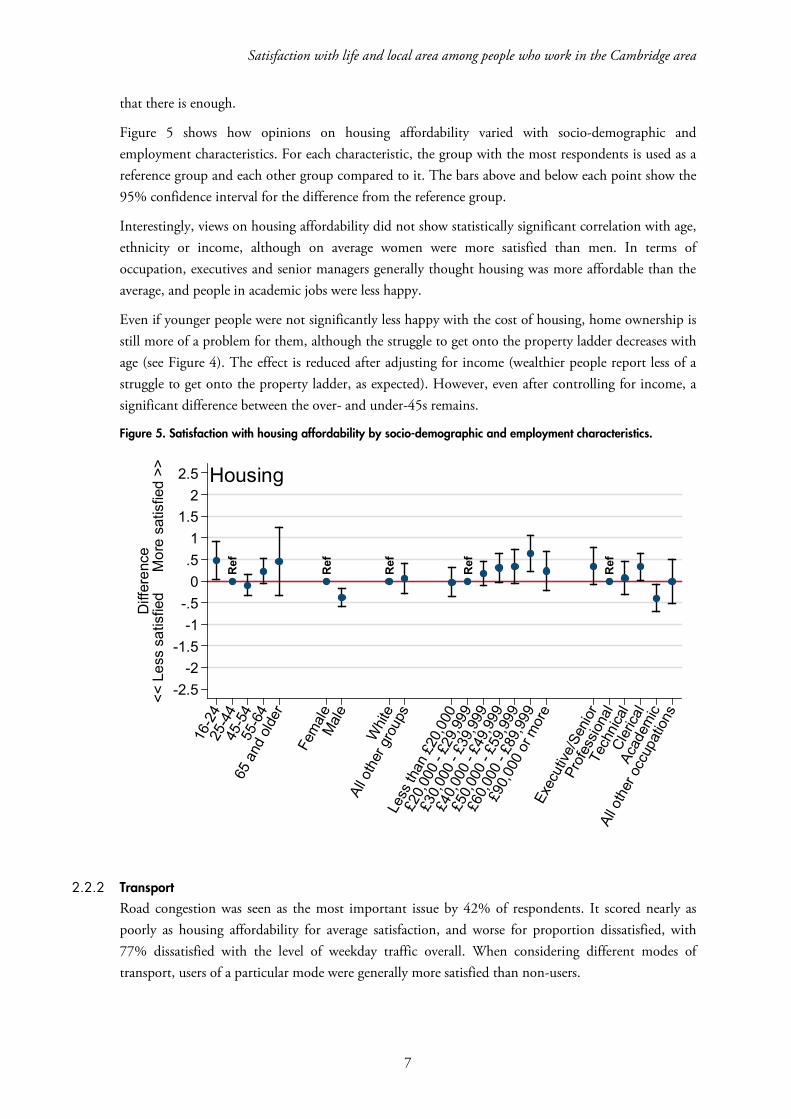
that there is enough.
Figure 5 shows how opinions on housing affordability varied with socio-demographic and employment characteristics. For each characteristic, the group with the most respondents is used as a reference group and each other group compared to it. The bars above and below each point show the 95% confidence interval for the difference from the reference group.
Interestingly, views on housing affordability did not show statistically significant correlation with age, ethnicity or income, although on average women were more satisfied than men. In terms of occupation, executives and senior managers generally thought housing was more affordable than the average, and people in academic jobs were less happy.
Even if younger people were not significantly less happy with the cost of housing, home ownership is still more of a problem for them, although the struggle to get onto the property ladder decreases with age (see Figure 4). The effect is reduced after adjusting for income (wealthier people report less of a struggle to get onto the property ladder, as expected). However, even after controlling for income, a significant difference between the over- and under-45s remains.
Figure 5. Satisfaction with housing affordability by socio-demographic and employment characteristics.
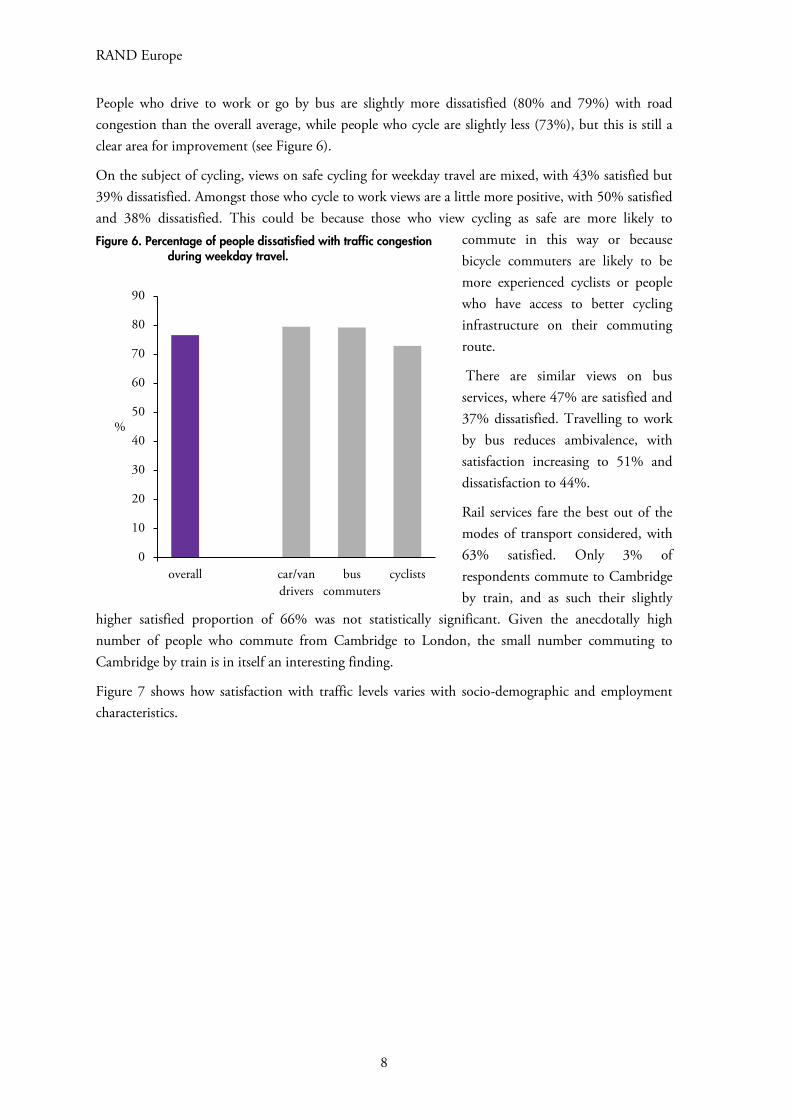
2.2.2 Transport Road congestion was seen as the most important issue by 42% of respondents. It scored nearly as poorly as housing affordability for average satisfaction, and worse for proportion dissatisfied, with 77% dissatisfied with the level of weekday traffic overall. When considering different modes of transport, users of a particular mode were generally more satisfied than non-users.
Ref
Ref
Ref
Ref
Ref
-2.5-2
-1.5-1
-.50
.51
1.52
2.5
Diff
eren
ce<<
Les
s sa
tisfie
d
Mor
e sa
tisfie
d >>
16-2
425
-44
45-5
455
-64
65 a
nd o
lder
Fem
ale
Mal
e
Whit
e
All o
ther
gro
ups
Less
than
£20
,000
£20,
000
- £29
,999
£30,
000
- £39
,999
£40,
000
- £49
,999
£50,
000
- £59
,999
£60,
000
- £89
,999
£90,
000
or m
ore
Exec
utive
/Sen
ior
Prof
essio
nal
Tech
nica
lCl
erica
lAc
adem
ic
All o
ther
occ
upat
ions
Housing
7
RAND Europe
People who drive to work or go by bus are slightly more dissatisfied (80% and 79%) with road congestion than the overall average, while people who cycle are slightly less (73%), but this is still a clear area for improvement (see Figure 6).
On the subject of cycling, views on safe cycling for weekday travel are mixed, with 43% satisfied but 39% dissatisfied. Amongst those who cycle to work views are a little more positive, with 50% satisfied and 38% dissatisfied. This could be because those who view cycling as safe are more likely to
commute in this way or because bicycle commuters are likely to be more experienced cyclists or people who have access to better cycling infrastructure on their commuting route.
There are similar views on bus services, where 47% are satisfied and 37% dissatisfied. Travelling to work by bus reduces ambivalence, with satisfaction increasing to 51% and dissatisfaction to 44%.
Rail services fare the best out of the modes of transport considered, with 63% satisfied. Only 3% of respondents commute to Cambridge by train, and as such their slightly
higher satisfied proportion of 66% was not statistically significant. Given the anecdotally high number of people who commute from Cambridge to London, the small number commuting to Cambridge by train is in itself an interesting finding.
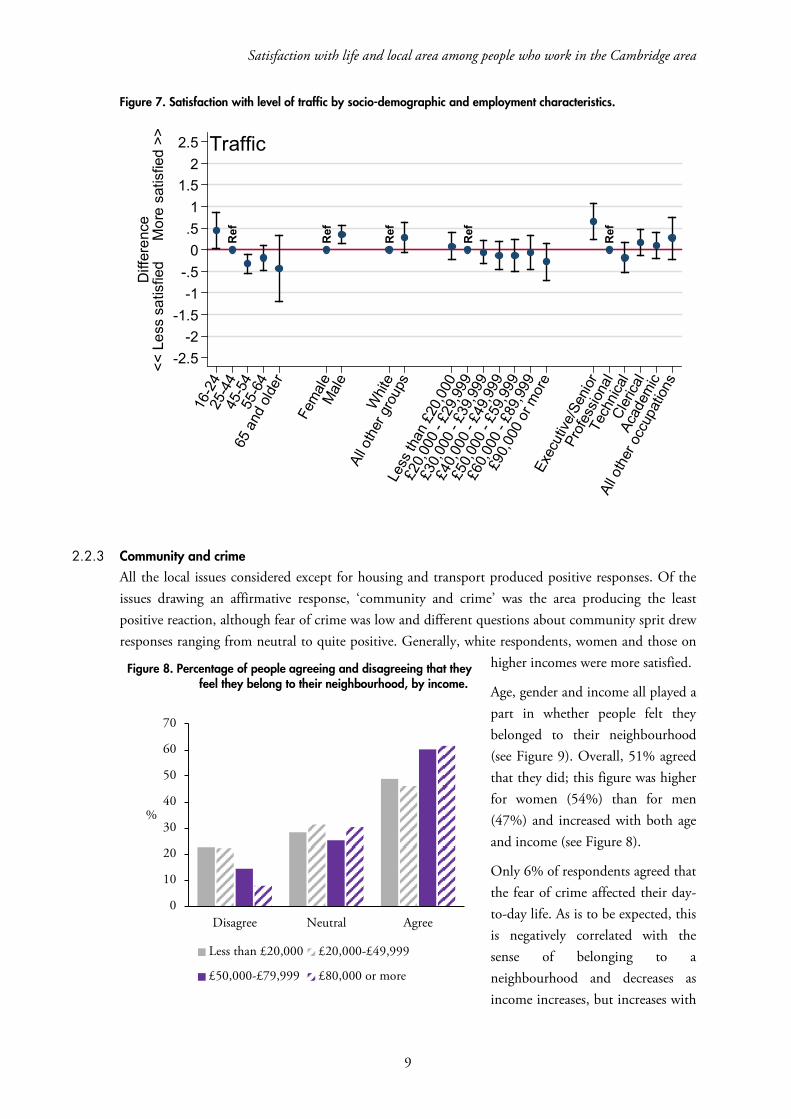
Figure 7 shows how satisfaction with traffic levels varies with socio-demographic and employment characteristics.
0
10
20
30
40
50
60
70
80
90
overall car/vandrivers
buscommuters
cyclists
%
Figure 6. Percentage of people dissatisfied with traffic congestion during weekday travel.
8
Satisfaction with life and local area among people who work in the Cambridge area
Figure 7. Satisfaction with level of traffic by socio-demographic and employment characteristics.
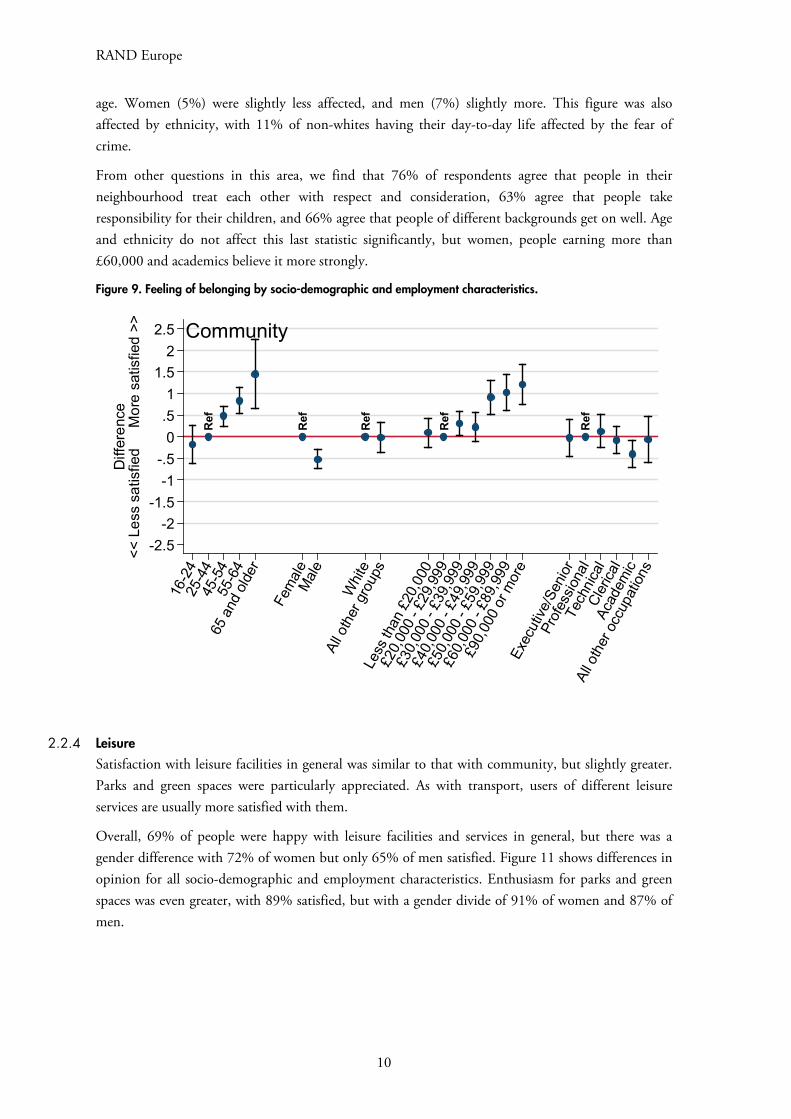
2.2.3 Community and crime All the local issues considered except for housing and transport produced positive responses. Of the issues drawing an affirmative response, ‘community and crime’ was the area producing the least positive reaction, although fear of crime was low and different questions about community sprit drew responses ranging from neutral to quite positive. Generally, white respondents, women and those on
higher incomes were more satisfied.
Age, gender and income all played a part in whether people felt they belonged to their neighbourhood (see Figure 9). Overall, 51% agreed that they did; this figure was higher for women (54%) than for men (47%) and increased with both age and income (see Figure 8).
Only 6% of respondents agreed that the fear of crime affected their day-to-day life. As is to be expected, this is negatively correlated with the sense of belonging to a neighbourhood and decreases as income increases, but increases with
Ref
Ref
Ref
Ref
Ref
-2.5-2
-1.5-1
-.50
.51
1.52
2.5D
iffer
ence
<< L
ess
satis
fied
M
ore
satis
fied
>>
16-2
425
-44
45-5
455
-64
65 a
nd o
lder
Fem
ale
Mal
e
Whit
e
All o
ther
gro
ups
Less
than
£20
,000
£20,
000
- £29
,999
£30,
000
- £39
,999
£40,
000
- £49
,999
£50,
000
- £59
,999
£60,
000
- £89
,999
£90,
000
or m
ore
Exec
utive
/Sen
ior
Prof
essio
nal
Tech
nica
lCl
erica
lAc
adem
ic
All o
ther
occ
upat
ions
Traffic
0
10
20
30
40
50
60
70
Disagree Neutral Agree
%
Less than £20,000 £20,000-£49,999
£50,000-£79,999 £80,000 or more
Figure 8. Percentage of people agreeing and disagreeing that they feel they belong to their neighbourhood, by income.
9
RAND Europe
age. Women (5%) were slightly less affected, and men (7%) slightly more. This figure was also affected by ethnicity, with 11% of non-whites having their day-to-day life affected by the fear of crime.
From other questions in this area, we find that 76% of respondents agree that people in their neighbourhood treat each other with respect and consideration, 63% agree that people take responsibility for their children, and 66% agree that people of different backgrounds get on well. Age and ethnicity do not affect this last statistic significantly, but women, people earning more than £60,000 and academics believe it more strongly.
Figure 9. Feeling of belonging by socio-demographic and employment characteristics.
2.2.4 Leisure Satisfaction with leisure facilities in general was similar to that with community, but slightly greater. Parks and green spaces were particularly appreciated. As with transport, users of different leisure services are usually more satisfied with them.
Overall, 69% of people were happy with leisure facilities and services in general, but there was a gender difference with 72% of women but only 65% of men satisfied. Figure 11 shows differences in opinion for all socio-demographic and employment characteristics. Enthusiasm for parks and green spaces was even greater, with 89% satisfied, but with a gender divide of 91% of women and 87% of men.
Ref
Ref
Ref
Ref
Ref
-2.5-2
-1.5-1
-.50
.51
1.52
2.5
Diff
eren
ce<<
Les
s sa
tisfie
d
Mor
e sa
tisfie
d >>
16-2
425
-44
45-5
455
-64
65 a
nd o
lder
Fem
ale
Mal
e
Whit
e
All o
ther
gro
ups
Less
than
£20
,000
£20,
000
- £29
,999
£30,
000
- £39
,999
£40,
000
- £49
,999
£50,
000
- £59
,999
£60,
000
- £89
,999
£90,
000
or m
ore
Exec
utive
/Sen
ior
Prof
essio
nal
Tech
nica
lCl
erica
lAc
adem
ic
All o
ther
occ
upat
ions
Community
10
Satisfaction with life and local area among people who work in the Cambridge area
On the cultural side, 83% of respondents were satisfied with museums in Cambridge, rising to 94% amongst people who visited them in Cambridge sometimes or often. Figure 10 shows how attendance is associated with age. Some 77% of respondents were satisfied with restaurants, bars and clubs, but this increased only marginally to 79% of those who went to restaurants in Cambridge sometimes or often. Satisfaction for cinemas, theatres and concert halls was at 78%, with 84% of people whoregularly go to the cinema in
Cambridge and 84% of people who regularly go to concerts in Cambridge being satisfied.
The causal link between using and being satisfied with cultural facilities could work in either or both directions: it is plausible that those who are satisfied with something are more likely to use it, and that this greater use leads to greater appreciation.
Figure 11. Satisfaction with leisure facilities in general by socio-demographic and employment characteristics.
Ref
Ref
Ref
Ref
Ref
-2.5-2
-1.5-1
-.50
.51
1.52
2.5
Diff
eren
ce<<
Les
s sa
tisfie
d
Mor
e sa
tisfie
d >>
16-2
425
-44
45-5
455
-64
65 a
nd o
lder
Fem
ale
Mal
e
Whit
e
All o
ther
gro
ups
Less
than
£20
,000
£20,
000
- £29
,999
£30,
000
- £39
,999
£40,
000
- £49
,999
£50,
000
- £59
,999
£60,
000
- £89
,999
£90,
000
or m
ore
Exec
utive
/Sen
ior
Prof
essio
nal
Tech
nica
lCl
erica
lAc
adem
ic
All o
ther
occ
upat
ions
Leisure
0
10
20
30
40
50
60
Never Rarely Sometimes Often
%
16-24 25-44 45-64 65 and over
Figure 10. Percentage of people visiting museums in Cambridge, by age group.
11
RAND Europe
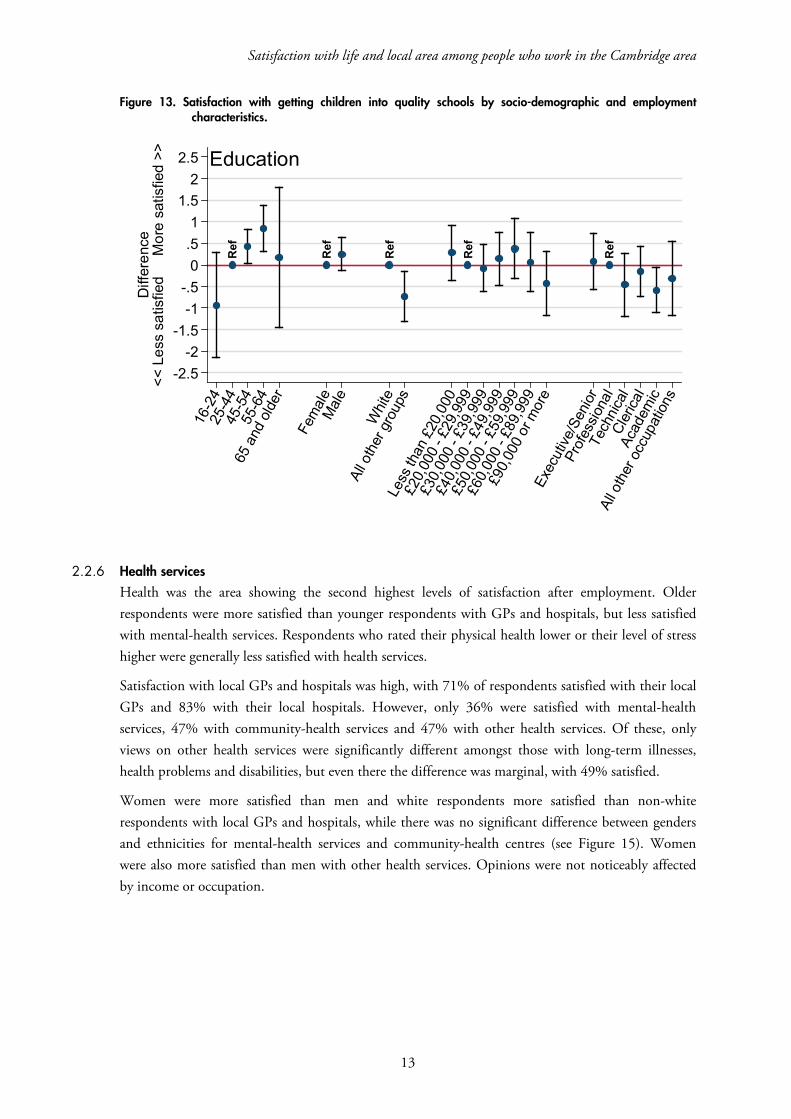
2.2.5 Education Satisfaction with schools was very similar to but slightly higher than that for community and leisure facilities. Women and white respondents were more satisfied with various aspects of education, but these findings were not particularly affected by income. Respondents were more satisfied with the quality of childcare than its affordability.
A total of 63% of respondents were satisfied with the availability of places for their children in quality schools in their local area. Interestingly, the level of satisfaction was not significantly affected by occupation or income, although satisfaction increased with age and non-whites (57%) were less satisfied than whites (64%) (see Figure 13). Satisfaction with secondary schools specifically was marginally lower than schools in general, at 62%. As with schools in general, satisfaction increased with age; the ethnic divide was also greater, with only 47% of non-whites satisfied compared with 63% of whites.
Childcare showed quite a difference of opinions concerning its quality and affordability, with 55% satisfied with its quality but only 34% satisfied with its affordability. As with satisfaction with schools, white respondents were more satisfied than non-white respondents (57% versus 49% for quality; 35% versus 32% for affordability), but income did not have a significant effect. Unlike satisfaction with schools these findings were not significantly affected by the age of respondents, although they were by occupation and gender, with men and academics less satisfied with both quality and affordability.
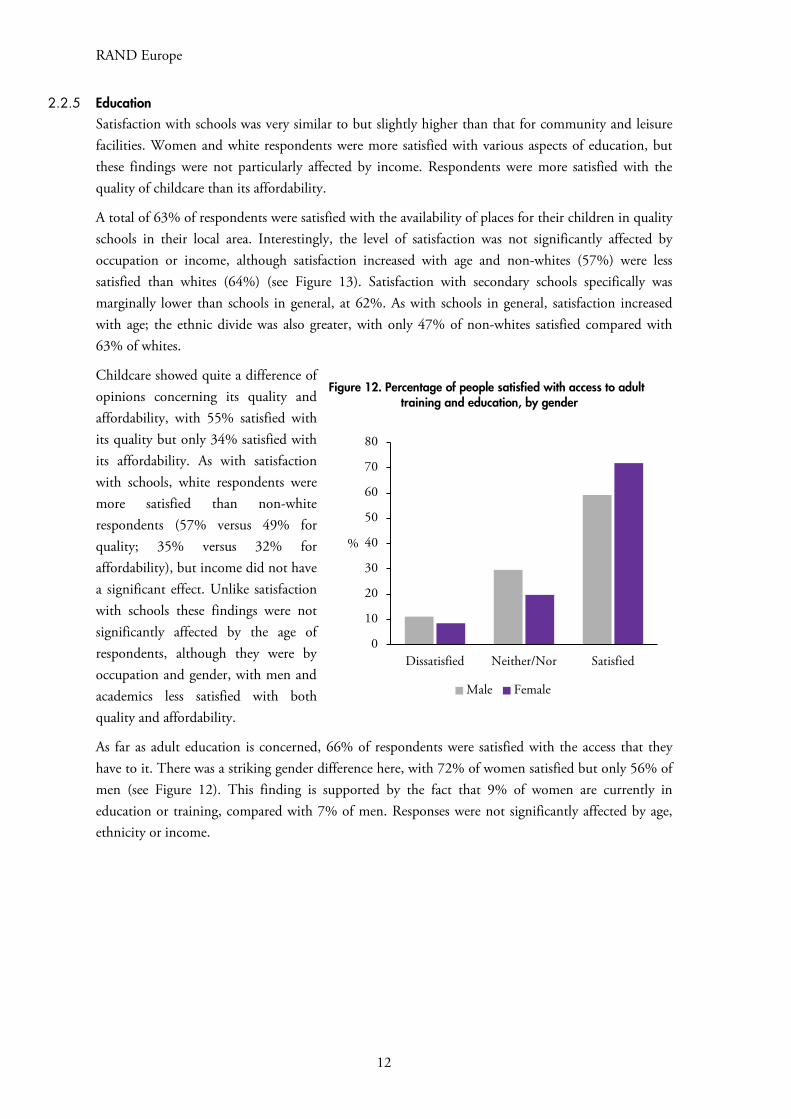
As far as adult education is concerned, 66% of respondents were satisfied with the access that they have to it. There was a striking gender difference here, with 72% of women satisfied but only 56% of men (see Figure 12). This finding is supported by the fact that 9% of women are currently in education or training, compared with 7% of men. Responses were not significantly affected by age, ethnicity or income.
0
10
20
30
40
50
60
70
80
Dissatisfied Neither/Nor Satisfied
%
Male Female
Figure 12. Percentage of people satisfied with access to adult training and education, by gender
12
Satisfaction with life and local area among people who work in the Cambridge area
Figure 13. Satisfaction with getting children into quality schools by socio-demographic and employment characteristics.
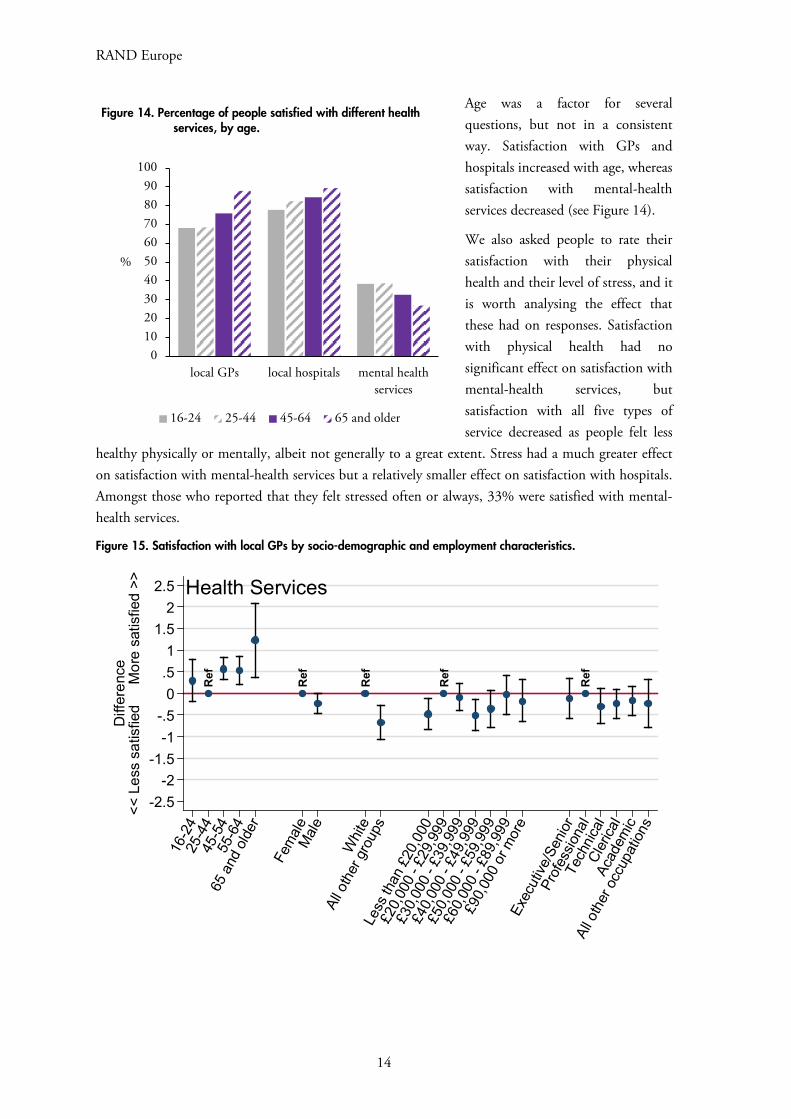
2.2.6 Health services Health was the area showing the second highest levels of satisfaction after employment. Older respondents were more satisfied than younger respondents with GPs and hospitals, but less satisfied with mental-health services. Respondents who rated their physical health lower or their level of stress higher were generally less satisfied with health services.
Satisfaction with local GPs and hospitals was high, with 71% of respondents satisfied with their local GPs and 83% with their local hospitals. However, only 36% were satisfied with mental-health services, 47% with community-health services and 47% with other health services. Of these, only views on other health services were significantly different amongst those with long-term illnesses, health problems and disabilities, but even there the difference was marginal, with 49% satisfied.
Women were more satisfied than men and white respondents more satisfied than non-white respondents with local GPs and hospitals, while there was no significant difference between genders and ethnicities for mental-health services and community-health centres (see Figure 15). Women were also more satisfied than men with other health services. Opinions were not noticeably affected by income or occupation.
Ref
Ref
Ref
Ref
Ref
-2.5-2
-1.5-1
-.50
.51
1.52
2.5D
iffer
ence
<< L
ess
satis
fied
M
ore
satis
fied
>>
16-2
425
-44
45-5
455
-64
65 a
nd o
lder
Fem
ale
Mal
e
Whit
e
All o
ther
gro
ups
Less
than
£20
,000
£20,
000
- £29
,999
£30,
000
- £39
,999
£40,
000
- £49
,999
£50,
000
- £59
,999
£60,
000
- £89
,999
£90,
000
or m
ore
Exec
utive
/Sen
ior
Prof
essio
nal
Tech
nica
lCl
erica
lAc
adem
ic
All o
ther
occ
upat
ions
Education
13
RAND Europe
Age was a factor for several questions, but not in a consistent way. Satisfaction with GPs and hospitals increased with age, whereas satisfaction with mental-health services decreased (see Figure 14).
We also asked people to rate their satisfaction with their physical health and their level of stress, and it is worth analysing the effect that these had on responses. Satisfaction with physical health had no significant effect on satisfaction with mental-health services, but satisfaction with all five types of service decreased as people felt less
healthy physically or mentally, albeit not generally to a great extent. Stress had a much greater effect on satisfaction with mental-health services but a relatively smaller effect on satisfaction with hospitals. Amongst those who reported that they felt stressed often or always, 33% were satisfied with mental-health services.
Figure 15. Satisfaction with local GPs by socio-demographic and employment characteristics.
Ref
Ref
Ref
Ref
Ref
-2.5-2
-1.5-1
-.50
.51
1.52
2.5
Diff
eren
ce<<
Les
s sa
tisfie
d
Mor
e sa
tisfie
d >>
16-2
425
-44
45-5
455
-64
65 a
nd o
lder
Fem
ale
Mal
e
Whit
e
All o
ther
gro
ups
Less
than
£20
,000
£20,
000
- £29
,999
£30,
000
- £39
,999
£40,
000
- £49
,999
£50,
000
- £59
,999
£60,
000
- £89
,999
£90,
000
or m
ore
Exec
utive
/Sen
ior
Prof
essio
nal
Tech
nica
lCl
erica
lAc
adem
ic
All o
ther
occ
upat
ions
Health Services
0102030405060708090
100
local GPs local hospitals mental healthservices
%
16-24 25-44 45-64 65 and older
Figure 14. Percentage of people satisfied with different health services, by age.
14
Satisfaction with life and local area among people who work in the Cambridge area
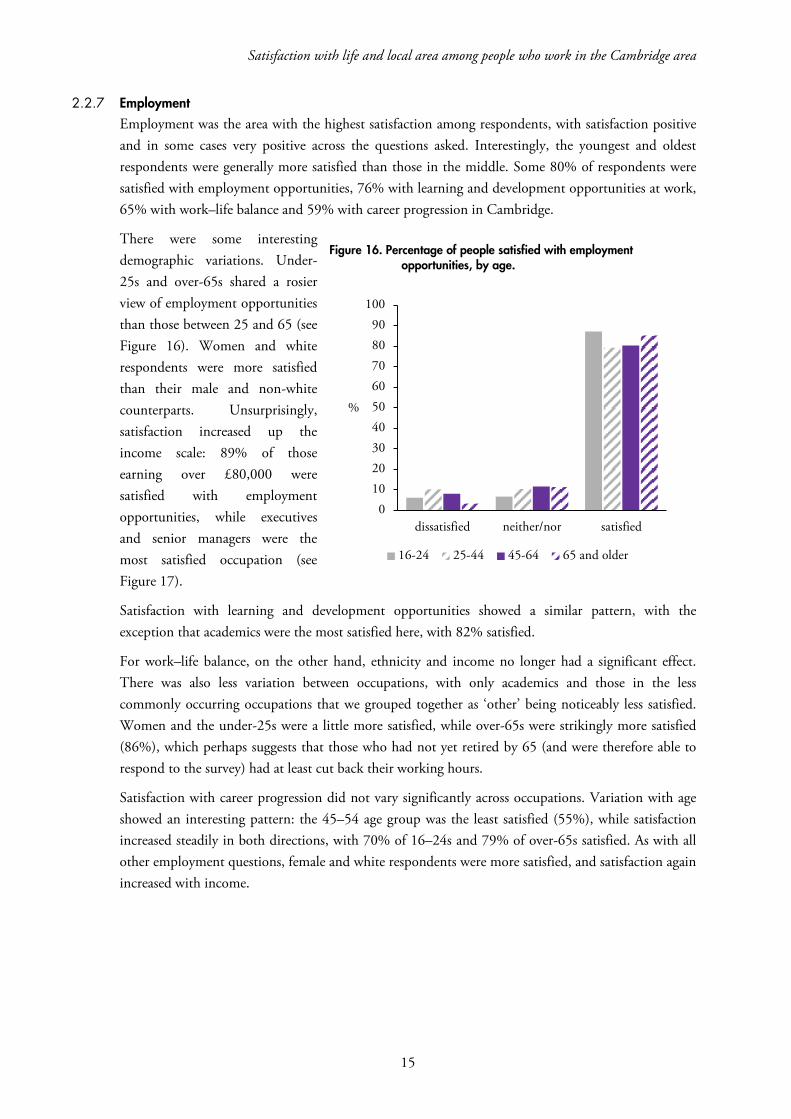
2.2.7 Employment Employment was the area with the highest satisfaction among respondents, with satisfaction positive and in some cases very positive across the questions asked. Interestingly, the youngest and oldest respondents were generally more satisfied than those in the middle. Some 80% of respondents were satisfied with employment opportunities, 76% with learning and development opportunities at work, 65% with work–life balance and 59% with career progression in Cambridge.
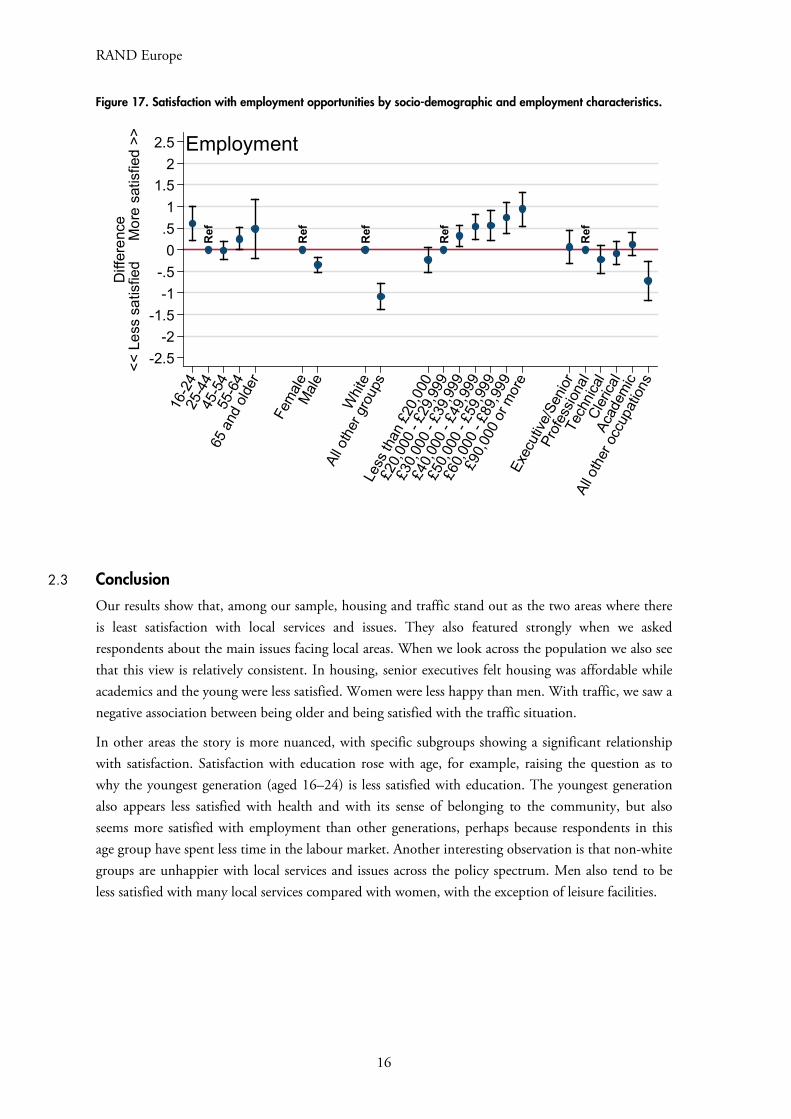
There were some interesting demographic variations. Under-25s and over-65s shared a rosier view of employment opportunities than those between 25 and 65 (see Figure 16). Women and white respondents were more satisfied than their male and non-white counterparts. Unsurprisingly, satisfaction increased up the income scale: 89% of those earning over £80,000 were satisfied with employment opportunities, while executives and senior managers were the most satisfied occupation (see Figure 17).
Satisfaction with learning and development opportunities showed a similar pattern, with the exception that academics were the most satisfied here, with 82% satisfied.
For work–life balance, on the other hand, ethnicity and income no longer had a significant effect. There was also less variation between occupations, with only academics and those in the less commonly occurring occupations that we grouped together as ‘other’ being noticeably less satisfied. Women and the under-25s were a little more satisfied, while over-65s were strikingly more satisfied (86%), which perhaps suggests that those who had not yet retired by 65 (and were therefore able to respond to the survey) had at least cut back their working hours.
Satisfaction with career progression did not vary significantly across occupations. Variation with age showed an interesting pattern: the 45–54 age group was the least satisfied (55%), while satisfaction increased steadily in both directions, with 70% of 16–24s and 79% of over-65s satisfied. As with all other employment questions, female and white respondents were more satisfied, and satisfaction again increased with income.
0102030405060708090
100
dissatisfied neither/nor satisfied
%
16-24 25-44 45-64 65 and older
Figure 16. Percentage of people satisfied with employment opportunities, by age.
15
RAND Europe
Figure 17. Satisfaction with employment opportunities by socio-demographic and employment characteristics.
2.3 Conclusion
Our results show that, among our sample, housing and traffic stand out as the two areas where there is least satisfaction with local services and issues. They also featured strongly when we asked respondents about the main issues facing local areas. When we look across the population we also see that this view is relatively consistent. In housing, senior executives felt housing was affordable while academics and the young were less satisfied. Women were less happy than men. With traffic, we saw a negative association between being older and being satisfied with the traffic situation.
In other areas the story is more nuanced, with specific subgroups showing a significant relationship with satisfaction. Satisfaction with education rose with age, for example, raising the question as to why the youngest generation (aged 16–24) is less satisfied with education. The youngest generation also appears less satisfied with health and with its sense of belonging to the community, but also seems more satisfied with employment than other generations, perhaps because respondents in this age group have spent less time in the labour market. Another interesting observation is that non-white groups are unhappier with local services and issues across the policy spectrum. Men also tend to be less satisfied with many local services compared with women, with the exception of leisure facilities.
Ref
Ref
Ref
Ref
Ref
-2.5-2
-1.5-1
-.50
.51
1.52
2.5
Diff
eren
ce<<
Les
s sa
tisfie
d
Mor
e sa
tisfie
d >>
16-2
425
-44
45-5
455
-64
65 a
nd o
lder
Fem
ale
Mal
e
Whit
e
All o
ther
gro
ups
Less
than
£20
,000
£20,
000
- £29
,999
£30,
000
- £39
,999
£40,
000
- £49
,999
£50,
000
- £59
,999
£60,
000
- £89
,999
£90,
000
or m
ore
Exec
utive
/Sen
ior
Prof
essio
nal
Tech
nica
lCl
erica
lAc
adem
ic
All o
ther
occ
upat
ions
Employment
16
CHAPTER 3 Drivers of life and local area satisfaction
3.1 Why do local services matter?
In Section 1.3 we explained how quality of life – and specifically life satisfaction as a proxy measure – is becoming of increasing interest to policymakers. As illustrated in Figure 1, one way that policymakers might seek to improve local quality of life is through the provision of better public services, which makes people more satisfied with their local area and ultimately improves their life satisfaction.
In Chapter 1 we looked at individual local services and issues and identified those which our survey respondents considered most in need of improvement. Policymakers will naturally work to improve these. However, we need to test our claim that there is a pathway from improved local services to greater local-area satisfaction and then on to improved quality of life. We also wish to identify which local services have the greatest effect on overall local-area satisfaction, and to compare the size of the effect of local-area satisfaction on life satisfaction with the sizes of the effects of other factors. Finally, we also test for the possibility that some aspects of life which we have identified as local issues have little effect on people’s perceptions of their local area, but do affect their overall life satisfaction.
We took two analytic approaches, using multivariable regression (see Appendix B):
1. We explored variation in satisfaction with local services across Cambridge, based on postcode area, and asked whether geographic variation in local-area satisfaction could be explained either by variations in the demographics of the populations living across Cambridge, or by variations in satisfaction with local services.
2. We performed two ‘drivers’ analyses, exploring the strongest drivers of local-area and life satisfaction among survey respondents. This analysis seeks to examine what determines satisfaction in the Cambridgeshire area at the individual level by looking at the size of the change in satisfaction typically associated with a given change in the driver.
For each of the main areas of interest identified by Cambridge Ahead and in the survey (housing, transport, community and crime, leisure, education, health services and employment), we chose the question that, in our judgement, best encapsulated people’s overall views in that area. We also confirmed that this choice of question had a response rate comparably high to the highest response rate for questions in that area. These questions are summarised in Table 1 and shown in full in Appendix D; we call these our ‘drivers of local-area satisfaction’.
17
RAND Europe
Table 1. Drivers selected for each area of interest.
Area of interest Selected driver
Housing Housing affordability
Transport Level of traffic
Community and crime Belonging to neighbourhood
Leisure Leisure facilities in general
Education Quality of schools
Health services Local GPs
Employment Employment opportunities
Our detailed methods are described in Appendix B; however, there is one point about the drivers analysis worth highlighting here. Each of the driver questions was measured on a five-point scale, either from ‘strongly agree’ to ‘strongly disagree’ or from ‘very satisfied’ to ‘very dissatisfied’. In order to compare the drivers, we standardised the responses to each question so that the mean (average) response was 0 and the standard deviation was 1. This means that when there is a wider range of responses then this range is ‘shrunk’ before analysis, and the opposite for a narrower range. This might appear counter-intuitive at first sight: if there are a wider range of views on a subject then this standardisation means that the driver in question might be identified as having a greater effect purely because a change of one standard deviation is a greater change. However, we can explain why the standardisation is necessary by way of a simple example. Suppose we had a question asking respondents to agree or disagree with a statement about how good a place Cambridge is to live in. The statement could be ‘All things considered, Cambridge is a nice place to live’ or it could be ‘Cambridge is a fantastic place to live’. If the population is generally satisfied with Cambridge as a place to live, then the first statement would not lead to much difference of opinion; most people would strongly agree, and some might merely agree. However, the second statement would divide opinion much more; some will still strongly agree, but the less enthusiastic might even disagree on the basis that the statement goes too far. Opinions of Cambridge have not changed, but the wording of the question leads to a greater divergence of responses. This is why we standardise, in order to put all questions on a comparable footing. In fact, we found that all driver questions had similar standard deviations, so the standardised variables still give results that can be interpreted according to our original intuition without too much inaccuracy, and there are no undesirable distortions.
3.2 Where do our respondents live?
The survey was sent to people who work in Cambridge, some of whom commute significant distances. Many of the survey questions asked about where respondents live, and it is therefore important to understand where this is. The geographical diversity of our respondents, and the fact that they will have experienced genuinely different local services, is useful for our drivers analysis. This means that our drivers analysis does not just look at how different opinions of the same local services relate to different opinions of the same local area, but is also affected by real variation in the quality of
18
Satisfaction with life and local area among people who work in the Cambridge area
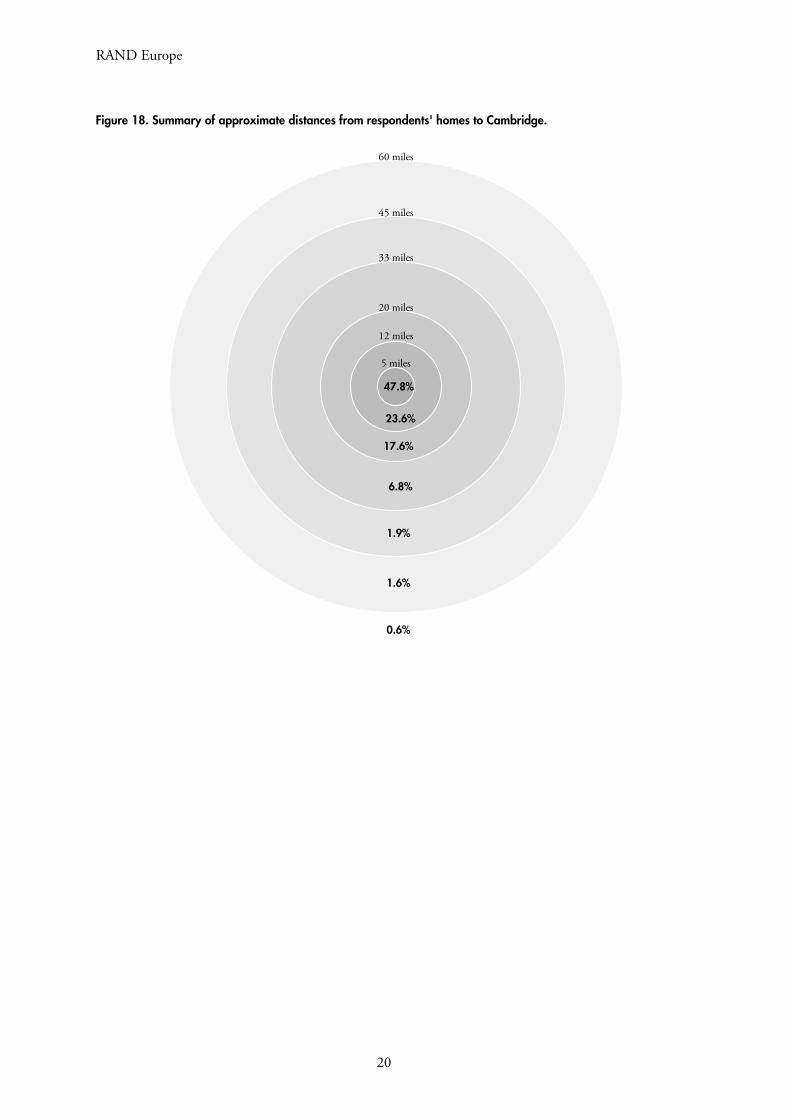
local services and local areas. We look briefly at where our respondents live (see Appendix E for more details).
From Question 4 of the survey we extracted the postcode district (e.g. CB1) of the respondent’s home. Google Maps was used to measure the length of the shortest walking route from the centre of each postcode district to the junction of Hobson Street, Sidney Street and St Andrew’s Street in Cambridge, which was the point chosen to represent the centre of the city.
Table 2 shows the postcode districts with at least ten respondents in our survey, grouped according to their distance from the centre of Cambridge. Figure 18 shows the distances in graphic form.
Table 2. Summary of approximate distances from respondents' homes to the centre of Cambridge.
Approximate distance (miles)
Postcode districts Post towns Respondents (%)
0–5 CB1–5 Cambridge 47.8
5–12 CB21–25 Cambridge 23.6
12–20 CB6–11, PE27, PE29, SG8, SG19 Ely, Newmarket, Haverhill, Saffron Walden, St Ives,
Huntingdon, Royston, Sandy
17.6
20–33 IP28, IP33, PE15–16, PE19, PE28 and others from CM, CO, IP, MK,
PE, SG
Bury St Edmunds, March, Chatteris, St Neots,
Huntingdon and others
6.8
33–45 IP24 and others from AL, CM, CO, EN, IP, LU, MK, NN, PE,
SG
Thetford and others 1.9
45–60 Some of IP, LU, MK, NN, NR, PE and others
Others 1.6
60+ Some of IP, NR, PE and others Others 0.6
19
RAND Europe
47.8%
23.6%
17.6%
6.8%
1.9%
1.6%
0.6%
60 miles
5 miles
12 miles
20 miles
33 miles
45 miles
Figure 18. Summary of approximate distances from respondents' homes to Cambridge.
20
Satisfaction with life and local area among people who work in the Cambridge area
For the drivers analysis, we used only respondents who had answered all the relevant questions and grouped postcode areas to give us sufficiently large groups for our analysis. Models were run twice, including and excluding education, as there was a low response rate for this question (which only made sense for people with children) and therefore a much-reduced sample. These groups and their sizes are shown in Table 3.
Table 3. Number of respondents used for drivers analysis in each postcode group.
Sample size All drivers except education Education CB1 617 230 CB2 156 63 CB3 144 60 CB4 461 163 CB5 105 39 CB6 123 59 CB7 73 31 CB8 56 26 CB9 38 22 CB10 or CB11 30 13 CB21 87 33 CB22 133 71 CB23 230 125 CB24 245 122 CB25 105 48 PE 175 85 SG 84 42 Other 29 11
3.3 Is the Cambridge area different from other areas?
Table 4 contains recent data collected by the Office for National Statistics (ONS) showing that Cambridgeshire scores well on life satisfaction compared with similar places.9 Our results in 2014 appear low compared with the ONS data; however, there are a number of significant differences between our survey and the ONS data:
• Our sampling method meant that our respondents were necessarily of working age, whereas the ONS sample is taken from the general population.
• We know from Section 3.2 that our sample captures people who commute great distances, which might not be typical of the general population.
• Our population and sample was defined by where people work rather than by where they live, and we do not have information on how this different type of grouping would affect results.
• The question on life satisfaction was asked in a survey with a completely different set of questions from the ONS’s. It was also distributed in a different way (i.e. through employers) and had a different context and purpose from the ONS’s. We cannot quantify how all these differences in the way the life satisfaction question was presented would affect people’s responses.
9 Source: April 2013 to March 2014, Annual Population Survey Personal Well-being dataset, ONS.
21
RAND Europe
Table 4. Cambridge life satisfaction compared with other places.
Region Average Life Satisfaction
Cambridge Ahead Quality of Life Survey (2014) 7.08
Cambridgeshire (2013/2014) 7.76
Inner London (2013/2014) 7.36
Outer London (2013/2014) 7.38
Oxford (2013/2014) 7.55
Birmingham (2010) 7.30
Chelmsford (2013/2014) 7.54
Coventry (2010) 7.43
Leeds (2010) 7.51
Liverpool (2010) 7.22
Manchester (2010) 7.18
St Albans (2010) 7.50
Oxfordshire (2010) 7.54
Peterborough (2010) 7.33
Reading (2010) 7.40
Sheffield (2010) 7.42
Source: ONS10 and RAND Europe data
The main issues that people indicated as being important were noticeably different depending on whether they were asked about local or national issues. As described in Chapter 1, respondents saw housing and traffic as the main issues facing Cambridge. However, when we asked them for the main issues facing Britain, respondents mentioned health, education and immigration, indicating that respondents separate local issues from national ones. Recent data collected by IPSOS Mori suggests that the economy and migration are seen as the two main issues facing Britain by the general UK population.11 Our results seem to suggest that the sample of people working in the Cambridge area we surveyed are highlighting issues slightly different from the wider national population. For example, the economy may not be seen as an issue to a working-age sample in a rapidly growing area.
3.4 Variation across the Cambridge area
There is no evidence that life satisfaction varies across the Cambridge area, after adjusting for citywide differences in age, gender, income, ethnicity and occupation. Local-area satisfaction and satisfaction levels with individual areas of local services, however, do exist. We look at these in turn.
10 Ibid.
11 See https://www.ipsos-mori.com/researchpublications/researcharchive/3455/EconomistIpsos-MORI-September-2014-Issues-Index.aspx (as of 13 May 2015).
22
Satisfaction with life and local area among people who work in the Cambridge area
3.4.1 Variation in drivers There is statistically significant variation in satisfaction with all areas of local services within Cambridge, except for employment opportunities. Results are presented in Table 5.
These results give us some interesting findings about differences of opinion between local areas. In the centre of Cambridge (CB1–CB5) housing is perceived as most unaffordable, but concerns about traffic are lower. In areas where commutes to the centre of Cambridge are longer, satisfaction with housing affordability is higher, but satisfaction with traffic is lower. A sense of belonging to a community is lower in the centre of Cambridge, but satisfaction with leisure facilities is higher.
Other areas show pockets of dissatisfaction with services, which are harder to explain. Certain postcodes show less satisfaction with health services, for instance, while questions about leisure also revealed groups of dissatisfied respondents. It is difficult to understand what is driving dissatisfaction, however, without understanding what services are offered where, and the quality of those services.
23
Table 5. Variation in local service satisfaction by postcode area.
Approxim
ate distance
Employment opportunities
Local GPs
Leisure facilities In general
Housing affordability
Level of traffic
Quality of schools
Belonging to neighbourhood
Difference (95% CI) Joint
p-value Difference (95% CI)
Joint p-value
Difference (95% CI) Joint
p-value Difference (95% CI)
Joint p-value
Difference (95% CI) Joint
p-value Difference (95% CI)
Joint p-value
Difference (95% CI) Joint
p-value
0-5 miles
CB1 Reference
0.79
Reference
<0.0001
Reference
0.0001
Reference
<0.0001
Reference
0.0007
Reference
<0.0001
Reference
<0.0001
CB2 0.23 (-0.16 to 0.61) 0.08 (-0.39 to 0.56) -0.47 (-0.89 to -0.04) 0.04 (-0.38 to 0.45) -0.37 (-0.79 to 0.05) 1.00 (0.19 to 1.80) -0.07 (-0.51 to 0.37) CB3 -0.01 (-0.41 to 0.39) 0.66 (0.16 to 1.16) -0.47 (-0.91 to -0.02) -0.14 (-0.57 to 0.30) -0.23 (-0.67 to 0.22) 1.27 (0.44 to 2.10) 0.39 (-0.07 to 0.85) CB4 -0.07 (-0.34 to 0.20) 0.00 (-0.33 to 0.33) -0.06 (-0.36 to 0.24) 0.35 (0.06 to 0.64) -0.09 (-0.38 to 0.21) 0.45 (-0.13 to 1.03) -0.19 (-0.49 to 0.12) CB5 -0.06 (-0.51 to 0.40) -0.51 (-1.08 to 0.05) -0.38 (-0.88 to 0.13) 0.15 (-0.34 to 0.64) -0.34 (-0.84 to 0.16) 0.05 (-0.95 to 1.04) -0.47 (-0.99 to 0.05)
5-12 miles
CB21 -0.22 (-0.71 to 0.28) 0.51 (-0.10 to 1.12) -0.21 (-0.76 to 0.34) 0.80 (0.27 to 1.33) -0.56 (-1.10 to -0.02) 1.93 (0.87 to 2.99) 0.95 (0.39 to 1.52) CB22 0.00 (-0.41 to 0.41) 0.35 (-0.15 to 0.86) -0.30 (-0.76 to 0.16) 0.36 (-0.08 to 0.80) -0.25 (-0.70 to 0.20) 1.21 (0.44 to 1.99) 0.60 (0.13 to 1.07) CB23 0.02 (-0.32 to 0.35) -0.71 (-1.12 to -0.29) -0.74 (-1.11 to -0.37) 1.72 (1.37 to 2.08) -0.95 (-1.32 to -0.59) 1.81 (1.17 to 2.45) 0.43 (0.05 to 0.82) CB24 0.21 (-0.12 to 0.54) 0.17 (-0.24 to 0.57) -0.09 (-0.45 to 0.28) 1.24 (0.88 to 1.59) -0.26 (-0.62 to 0.10) 1.85 (1.20 to 2.49) 1.02 (0.64 to 1.40) CB25 0.34 (-0.11 to 0.80) -0.05 (-0.62 to 0.52) -0.54 (-1.05 to -0.03) 1.23 (0.74 to 1.72) -0.46 (-0.97 to 0.04) 1.52 (0.61 to 2.43) 0.91 (0.39 to 1.44)
12-20+ miles
CB6 0.22 (-0.20 to 0.65) -0.94 (-1.47 to -0.41) -0.97 (-1.45 to -0.50) 2.61 (2.15 to 3.07) -0.67 (-1.14 to -0.20) 0.40 (-0.44 to 1.24) 0.52 (0.03 to 1.01) CB7 0.03 (-0.50 to 0.56) -0.75 (-1.41 to -0.09) -0.67 (-1.26 to -0.07) 2.36 (1.79 to 2.93) -0.75 (-1.34 to -0.17) -0.41 (-1.50 to 0.68) 0.38 (-0.23 to 0.99) CB8 -0.18 (-0.78 to 0.42) -0.49 (-1.24 to 0.25) -0.28 (-0.95 to 0.38) 2.15 (1.51 to 2.80) -0.10 (-0.76 to 0.56) -0.54 (-1.72 to 0.64) 0.69 (0.00 to 1.38) CB9 -0.36 (-1.08 to 0.37) -1.97 (-2.87 to -1.08) -0.23 (-1.03 to 0.58) 2.89 (2.11 to 3.66) -0.45 (-1.25 to 0.34) 1.20 (-0.09 to 2.48) 0.76 (-0.07 to 1.58) CB10 or CB11 -0.03 (-0.83 to 0.77) -0.11 (-1.10 to 0.88) 0.60 (-0.29 to 1.50) 0.99 (0.12 to 1.85) 0.16 (-0.72 to 1.04) 1.85 (0.24 to 3.47) 1.94 (1.02 to 2.86) PE 0.01 (-0.37 to 0.39) -0.01 (-0.48 to 0.46) 0.25 (-0.17 to 0.67) 2.58 (2.17 to 2.98) -0.66 (-1.08 to -0.25) 1.10 (0.36 to 1.83) 0.64 (0.21 to 1.08) SG 0.14 (-0.37 to 0.65) -0.48 (-1.11 to 0.14) -0.07 (-0.64 to 0.49) 1.44 (0.90 to 1.99) -0.40 (-0.96 to 0.16) 1.23 (0.27 to 2.19) 0.56 (-0.03 to 1.14)
20+ miles
Other -0.52 (-1.34 to 0.30) -0.68 (-1.70 to 0.33) -0.17 (-1.08 to 0.75) 2.27 (1.39 to 3.16) -0.49 (-1.39 to 0.42) -0.02 (-1.78 to 1.74) 1.05 (0.10 to 1.99)
Key (only applied where there is evidence of variation in satisfaction between areas)
Least satisfied postcode areas Middle postcode areas Most satisfied postcode areas
24
Satisfaction with life and local area among people who work in the Cambridge area
3.4.2 Variations in local-area satisfaction The demographic characteristics of survey respondents (age, gender, income, ethnicity and occupation) do not explain variations in local satisfaction across the Cambridge area, but these variations can be explained by taking into account satisfaction with local services (see Figure 19). We found that there are variations in local-area satisfaction by postcode and that individual demographic characteristics only explain a small amount; however, we also found that, after adjusting for satisfaction with services, variations in satisfaction between areas are substantially reduced.
This would suggest that satisfaction with local services plays a role in explaining local-area satisfaction overall.
Figure 19. Differences in local-area satisfaction (measured on a 0–10 scale) by postcode of residence compared with people living in CB1; unadjusted, after adjustment for individual respondent characteristics (socio-demographic and employment) and after additionally adjusting for satisfaction with local services (transport, housing, neighbourhood, employment, education, health and leisure)
3.5 Drivers of satisfaction
Our results at the postcode level suggest that satisfaction with local service provision is an important driver of local-area satisfaction. We now seek to understand what generally drives life and local-area satisfaction in the Cambridgeshire area. To that end we run a similar regression model as for the postcode area analysis but at the individual respondent level.
-1
-0.5
0
0.5
1
1.5
Diff
eren
ce
CB
5
CB
4
CB
9
CB
1
CB
7
Oth
er
CB
23
CB
8
CB
2
CB
6
SG
CB
3
PE
CB
22
CB
24
CB
25
CB
21
CB
10/C
B11
unadjustedadjusted for age, gender, ethnicity, income and occupationadditionally adjusted for satisfaction with local services
25
RAND Europe
3.5.1 Drivers of local-area satisfaction After taking into account varying effects for age, gender, income, ethnicity and occupation, we compared standardised coefficients for different drivers. Table 6 shows the coefficients calculated for each of the drivers. 12
Table 6. Standardised coefficients of drivers of local-area satisfaction, including and excluding education.
Coefficient
Driver of local-area satisfaction Excluding education
Including education
Belonging to neighbourhood 0.387 0.347 Leisure facilities in general 0.167 0.129 Quality of schools – 0.099 Local GPs 0.099 0.091 Level of traffic 0.065 0.082 Employment opportunities 0.057 0.071 Housing affordability 0.021 -0.012
It is interesting that the coefficients for the drivers other than education are similar for both samples. This suggests that all the other drivers have the same associations relative to each other for both groups; one group simply has the extra driver of education to insert into the list.
For both groups, belonging to the neighbourhood, as we would have expected, has comfortably the highest coefficient in determining local-area satisfaction, whereas housing affordability does not have a statistically significant effect. The other drivers have more similar coefficients, in decreasing order: general leisure facilities, schools, general practitioners (GPs), traffic, and employment opportunities. The 95% confidence intervals (see Table 11 in Appendix F) overlap to the extent that this order should not be assumed, except in the analysis excluding education, where satisfaction with general leisure facilities does seem to rank above the others.
3.5.2 Drivers of life satisfaction
Local area in comparison with other factors Table 7 shows the coefficients for local-area satisfaction, work–life balance and physical and mental health as drivers of life satisfaction.
Table 7. Standardised coefficients of high-level drivers of life satisfaction, including and excluding education.
Coefficient
Driver of life satisfaction Excluding education
Including education
Local area 0.396 0.406 Physical health 0.220 0.197 Work–life balance 0.178 0.195 Stress -0.173 -0.163
12 We give 95% confidence intervals and p-values for the coefficients shown in Table 6, Table 7 and Table 8 in Appendix F.
26
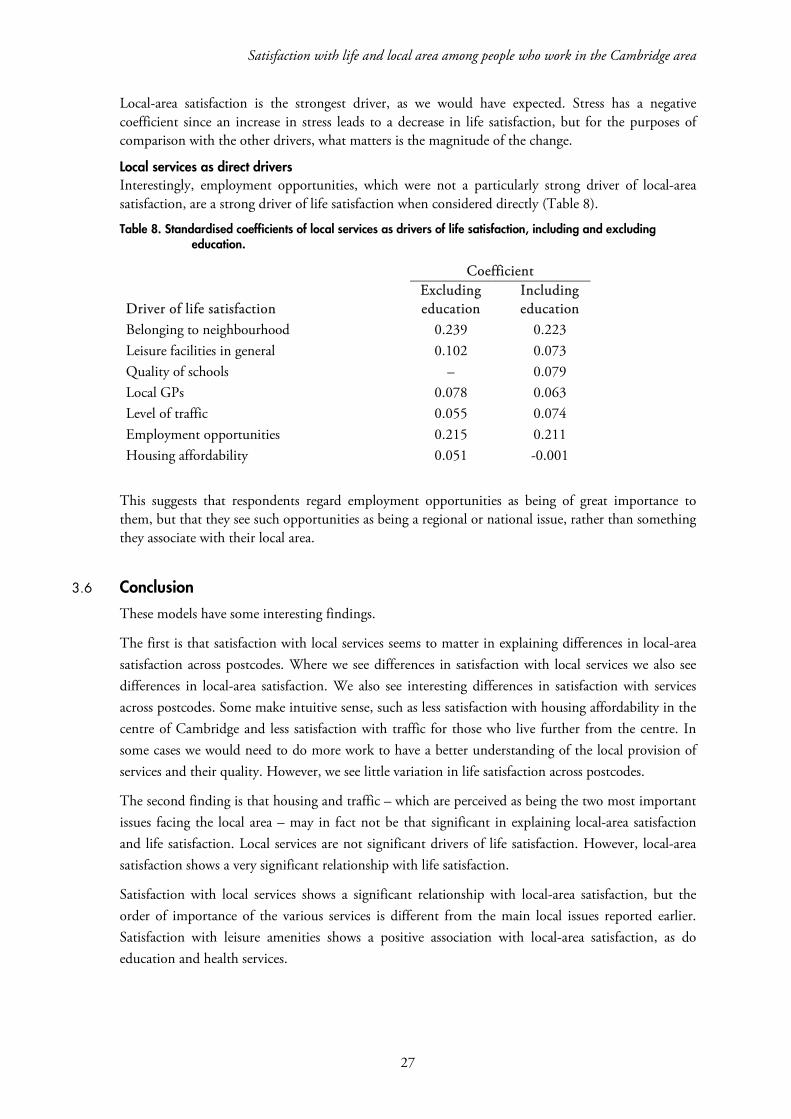
Satisfaction with life and local area among people who work in the Cambridge area
Local-area satisfaction is the strongest driver, as we would have expected. Stress has a negative coefficient since an increase in stress leads to a decrease in life satisfaction, but for the purposes of comparison with the other drivers, what matters is the magnitude of the change.
Local services as direct drivers Interestingly, employment opportunities, which were not a particularly strong driver of local-area satisfaction, are a strong driver of life satisfaction when considered directly (Table 8).
Table 8. Standardised coefficients of local services as drivers of life satisfaction, including and excluding education.
Coefficient
Driver of life satisfaction Excluding education
Including education
Belonging to neighbourhood 0.239 0.223 Leisure facilities in general 0.102 0.073 Quality of schools – 0.079 Local GPs 0.078 0.063 Level of traffic 0.055 0.074 Employment opportunities 0.215 0.211 Housing affordability 0.051 -0.001
This suggests that respondents regard employment opportunities as being of great importance to them, but that they see such opportunities as being a regional or national issue, rather than something they associate with their local area.
3.6 Conclusion
These models have some interesting findings.
The first is that satisfaction with local services seems to matter in explaining differences in local-area satisfaction across postcodes. Where we see differences in satisfaction with local services we also see differences in local-area satisfaction. We also see interesting differences in satisfaction with services across postcodes. Some make intuitive sense, such as less satisfaction with housing affordability in the centre of Cambridge and less satisfaction with traffic for those who live further from the centre. In some cases we would need to do more work to have a better understanding of the local provision of services and their quality. However, we see little variation in life satisfaction across postcodes.
The second finding is that housing and traffic – which are perceived as being the two most important issues facing the local area – may in fact not be that significant in explaining local-area satisfaction and life satisfaction. Local services are not significant drivers of life satisfaction. However, local-area satisfaction shows a very significant relationship with life satisfaction.
Satisfaction with local services shows a significant relationship with local-area satisfaction, but the order of importance of the various services is different from the main local issues reported earlier. Satisfaction with leisure amenities shows a positive association with local-area satisfaction, as do education and health services.
27
CHAPTER 4 Further areas for examination
In this discussion, we aim to answer two questions:
• What can we extrapolate from these results? • What do these findings mean for policymakers?
What can we extrapolate from these results? The answer to this question depends on where we are trying to extrapolate to. There is no reason that our sample should represent the general population of Cambridge, for example. Firstly, it comprises an exclusively working-age population, and secondly it is limited to people working in the Cambridge area,13 who do not necessarily live in, or even near to, Cambridge (in fact, more than half the sample lives outside Cambridge, as described in Section 3.2).
However, our sample may be representative of the target population of interest to Cambridge Ahead, namely people who work for companies based in the Cambridge area. Our estimated response rate is not dissimilar to other (general population) surveys. The number of participants, the relative participation across groups and the approach we have taken in the analysis give us confidence that our results are meaningful.
What do these findings mean for policymakers? Our first observation is that different approaches to understanding the quality of life in the Cambridge area give slightly different results. Does this mean that policymakers may need to decide which outcomes to focus on?
If policymakers are interested in improving overall life satisfaction in the Cambridge area, they could look at well-being issues such as mental and physical health and try to understand psychosocial risks (e.g. by working with employers on health and well-being in the workplace). A more holistic approach to well-being has been proposed before (for example in Aked et al. 2010). In addition, perhaps not surprisingly, local-area satisfaction has a particularly significant relationship with overall life satisfaction. This suggests that improving local-area satisfaction is associated with improving life satisfaction.
If policymakers are interested in resolving the issues of most concern to the working-age population as reported by our survey sample, then they should look at housing and traffic, where we found agreement across survey respondents of different ages, occupations, and so on. If policymakers are interested in improving local-area satisfaction, then a slightly different set of priorities emerge from
13 See footnote 3.
28
Satisfaction with life and local area among people who work in the Cambridge area
the analysis, with leisure facilities, school and health appearing more important. What is interesting is that local-area satisfaction across postcodes is related to satisfaction with local services. We also see interesting differences in satisfaction with services across postcodes.
However, choosing between these outcomes may be a false choice. Ultimately, we see quite strong interdependencies between the outcomes of interest. Our results may hint at a strategic approach that looks both at the quality of, and satisfaction with, local service delivery and overall life satisfaction in a local area.
Firstly, our results suggest that improving satisfaction with local services helps improve local-area satisfaction in general. We know this is a significant result across postcodes. So, the challenge could be to work across administrative boundaries to address specific issues that exist for different population groups. This will ultimately also mean addressing dissatisfaction with the main issues identified as facing the area: housing and traffic.
Secondly, local policymakers tackling life satisfaction more generally may want to look at overall well-being and to understand the drivers which affect it. These may extend beyond the immediate policy levers of local decision-makers, which may suggest new ways of working in partnership with the health services, employers and indeed wider stakeholders such as the third sector.
29

References
Aked, J., N. Marks, C. Cordon & S. Thompson. 2008. Five Ways to Wellbeing: The Evidence. London: nef. As of 15 May 2015: http://www.neweconomics.org/publications/entry/five-ways-to-well-being-the-evidence
Aked, J., J. Michaelson & N. Steuer. 2010. The Role of Local Government in Promoting Well-Being. London: Local Government Improvement and Development. As of 13 May 2015: http://www.local.gov.uk/c/document_library/get_file?uuid=bcd27d1b-8feb-41e5-a1ce-48f9e70ccc3b&groupId=10180
Black, C. D. & D. Frost. 2011. Health At Work – An Independent Review of Sickness Absence. London: The Stationery Office.
Dolan, P., T. Peasgood & M. White. 2008. ‘Do We Really Know What Makes Us Happy? A Review of the Economic Literature on the Factors Associated with Subjective Well-Being.’ Journal of Economic Psychology 29(1): 94–122.
Dolan, P. & R. Metcalfe. 2012. ‘Measuring Subjective Wellbeing: Recommendations on Measures for Use by National Governments.’ Journal of Social Policy 41(2): 409–427.
HM Government. 2010. New Horizons – Confident Communities, Brighter Futures: A Framework for Developing Well-Being. London: Department of Health.
Huppert, F. A., N. Baylis & B. Keverne. 2005. The Science of Well-being. Oxford: Oxford University Press.
Krosnick, J. A. & S. Presser. 2010. 'Question and Questionnaire Design.' Handbook of Survey Research 2: 263–314.
Layard, R. 2010. 'Measuring Subjective Well-Being.' Science 327(5965): 534–535.
Marmot, M., J. Allen, P. Goldblatt, T. Boyce, D. McNeish, M. Grady & I. Geddes. 2010. Fair Society, Healthy Lives: A Strategic Review of Health Inequalities in England Post-2010. London: The Marmot Review. As of 15 May 2015: http://www.ucl.ac.uk/gheg/marmotreview
Mueller, K., M. C. Voelkle & K. Hattrup. 2011. ‘On the Relationship Between Job Satisfaction and Non-Response in Employee Attitude Aurveys: A Longitudinal Field Study.’ Journal of Occupational and Organizational Psychology 84(4):780–98.
Steuer, N. & N. Marks. 2008. Local Wellbeing: Can We Measure It? London: nef.
Stiglitz, J. E., A. Sen & J.-P. Fitoussi. 2010. Report by the Commission on the Measurement of Economic Performance and Social Progress. Paris: Commission on the Measurement of Economic Performance and Social Progress.
31

RAND Europe
Waddell, G. & A. K. Burton. 2006. Is Work Good for Your Health and Well-Being? London: The Stationery Office.
32
Appendix A: Organisations in the sample
The survey was originally sent to employees of member organisations of Cambridge Ahead who were willing to participate, John Lewis, and the three local councils: Cambridge City Council, South Cambridgeshire District Council and Cambridgeshire County Council.
The breakdown of respondents by organisation is shown in Table 9.
Table 9. Number of respondents used for drivers analysis in each organisation.
Organisation Number of
employees14
Sample size
All drivers except
education
Education
Anglia Ruskin University 2,300 133 51
ARM 1,000 288 107
AstraZeneca not provided15 * *
Barclays Bank 40 * *
Bard Pharmaceuticals not provided16 33 20
Bidwells 236 37 12
Birketts LLP 56 12 *
Brookgate 10 * *
Cambridge Ahead * * *
Cambridge City Council 773 126 61
Cambridge Consultants 440 148 70
Cambridge University Hospitals (Addenbrooke’s) 8,384 197 94
Cambridgeshire County Council 5,500 22 *
Deloitte 220 47 18
Domino 450 59 31
14 These figures were provided by the organisation contacts who distributed the survey. We have not verified them and do not know how many of the employees were sent the survey. They should be treated with great caution.
15 The combined total for AstraZeneca and MedImmune was 60.
16 The combined total for Mundipharma, Napp Pharmaceuticals and Bard Pharmaceuticals was 1,116.
33
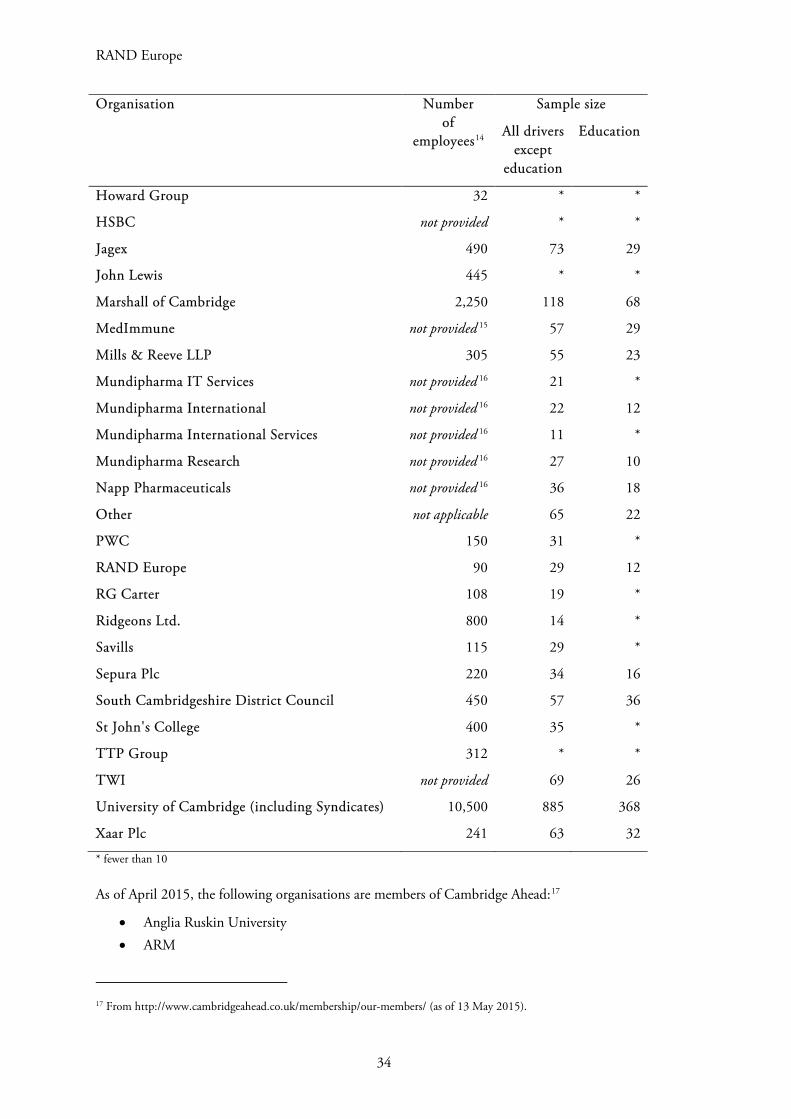
RAND Europe
Organisation Number of
employees14
Sample size
All drivers except
education
Education
Howard Group 32 * *
HSBC not provided * *
Jagex 490 73 29
John Lewis 445 * *
Marshall of Cambridge 2,250 118 68
MedImmune not provided 15 57 29
Mills & Reeve LLP 305 55 23
Mundipharma IT Services not provided 16 21 *
Mundipharma International not provided 16 22 12
Mundipharma International Services not provided 16 11 *
Mundipharma Research not provided 16 27 10
Napp Pharmaceuticals not provided 16 36 18
Other not applicable 65 22
PWC 150 31 *
RAND Europe 90 29 12
RG Carter 108 19 *
Ridgeons Ltd. 800 14 *
Savills 115 29 *
Sepura Plc 220 34 16
South Cambridgeshire District Council 450 57 36
St John's College 400 35 *
TTP Group 312 * *
TWI not provided 69 26
University of Cambridge (including Syndicates) 10,500 885 368
Xaar Plc 241 63 32
* fewer than 10 As of April 2015, the following organisations are members of Cambridge Ahead:17
• Anglia Ruskin University • ARM
17 From http://www.cambridgeahead.co.uk/membership/our-members/ (as of 13 May 2015).
34
Satisfaction with life and local area among people who work in the Cambridge area
• AstraZeneca • Barclays • Bidwells • Birketts • Brookgate • Cambridge Consultants • Cambridge University Hospitals (Addenbrooke’s) • RG Carter • Deloitte • Domino Printing Sciences • Gonville Hotel • Grosvenor • Hill Partnerships • Howard Group • HSBC • Jagex • Jesus College • Marshall of Cambridge • Mills & Reeve • Mundipharma International • Pace Investments • Pigeon Investment Management • PricewaterhouseCoopers • RAND Europe • Red Gate Software • Ridgeons • Savills • St John’s College • Trinity College • TTP Group • TWI • University of Cambridge (including Syndicates) • Xaar
35
Appendix B: Methods
Sampling
Employees from 32 Cambridge Ahead members plus three councils (Cambridge City Council, South Cambridgeshire District Council and Cambridgeshire County Council) were invited to respond to the survey. HR directors or Cambridge Ahead contacts from each organisation were contacted by email and asked to circulate the survey link to all employees. Three follow-up reminder emails were sent at weekly intervals. Data collection was carried out during six weeks from June to July 2014, and for two organisations during two weeks in August and September 2014.
Satisfaction measures
Full question wording and response options for all measures of satisfaction are included in Appendix D (in addition to the full survey in Appendix C). Briefly, subjective 0–10 scales of local-area and life satisfaction can be used in evaluation, informing policy design and measuring progress (Dolan & Metcalfe 2012); further satisfaction with physical health, mental well-being and work represent separate domains within the measurement of subjective well-being. Satisfaction with local services was measured using five-point Likert-like scales. One survey question was selected a priori per area (employment, health services, leisure, transport, education, housing, community) with selection primarily on the basis of questions most broadly relevant across groups. Respondents were additionally asked to identify the most important issue facing their local area.
Demographic characteristics
Respondents were asked to report their age, (16–24, 25–44, 45–54, 55–64, and 65+), gender, ethnicity (based on the ONS2011 five-group classification; white, mixed, Asian or Asian British, black or black British, and other), income in £10,000 bands up to >£90,000, and occupation (academic, chemical/warehouse/production operator, clerical and administrative support, executive or senior manager, labourer, precision production and crafts worker, professional, sales, service occupation and technical support). Responses were grouped for analysis for:
• All non-white ethnic groups • Income groups under £20,000 • Income groups from £60,000 to £79,999 • Income groups over £80,000 and
36
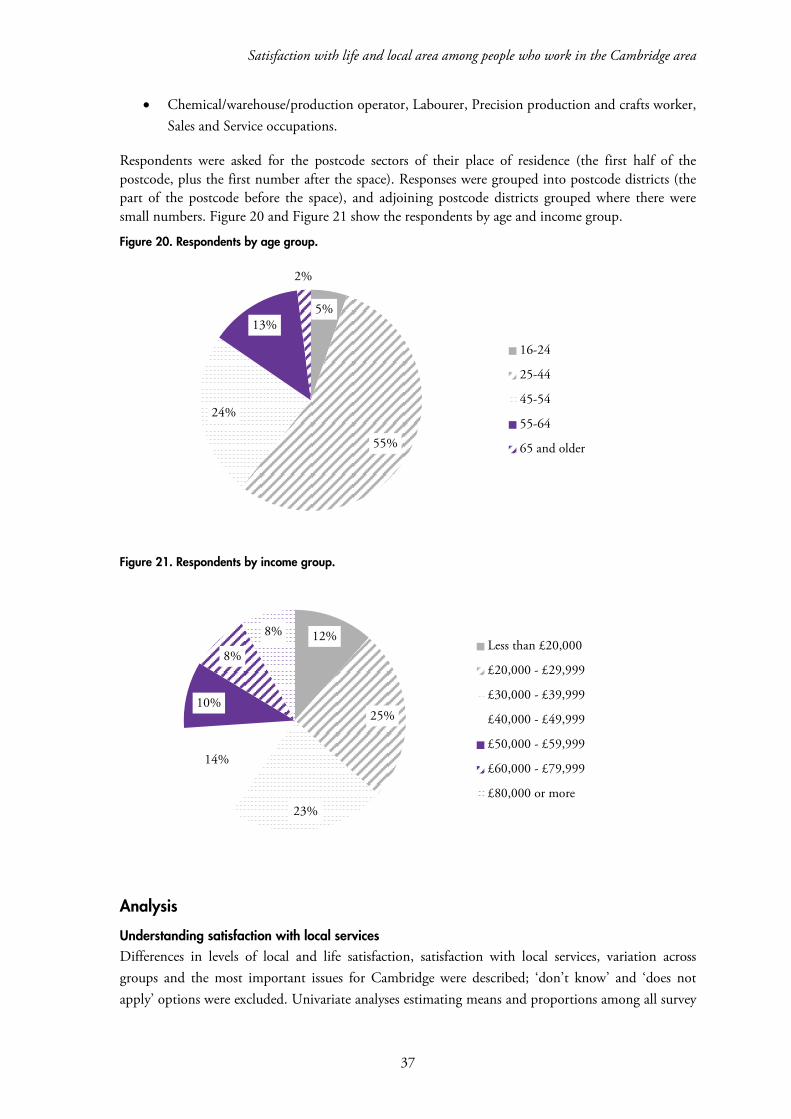
Satisfaction with life and local area among people who work in the Cambridge area
• Chemical/warehouse/production operator, Labourer, Precision production and crafts worker, Sales and Service occupations.
Respondents were asked for the postcode sectors of their place of residence (the first half of the postcode, plus the first number after the space). Responses were grouped into postcode districts (the part of the postcode before the space), and adjoining postcode districts grouped where there were small numbers. Figure 20 and Figure 21 show the respondents by age and income group.
Figure 20. Respondents by age group.
Figure 21. Respondents by income group.
Analysis
Understanding satisfaction with local services Differences in levels of local and life satisfaction, satisfaction with local services, variation across groups and the most important issues for Cambridge were described; ‘don’t know’ and ‘does not apply’ options were excluded. Univariate analyses estimating means and proportions among all survey
5%
55%
24%
13%
2%
16-24
25-44
45-54
55-64
65 and older
12%
25%
23%
14%
10%
8%
8%Less than £20,000
£20,000 - £29,999
£30,000 - £39,999
£40,000 - £49,999
£50,000 - £59,999
£60,000 - £79,999
£80,000 or more
37
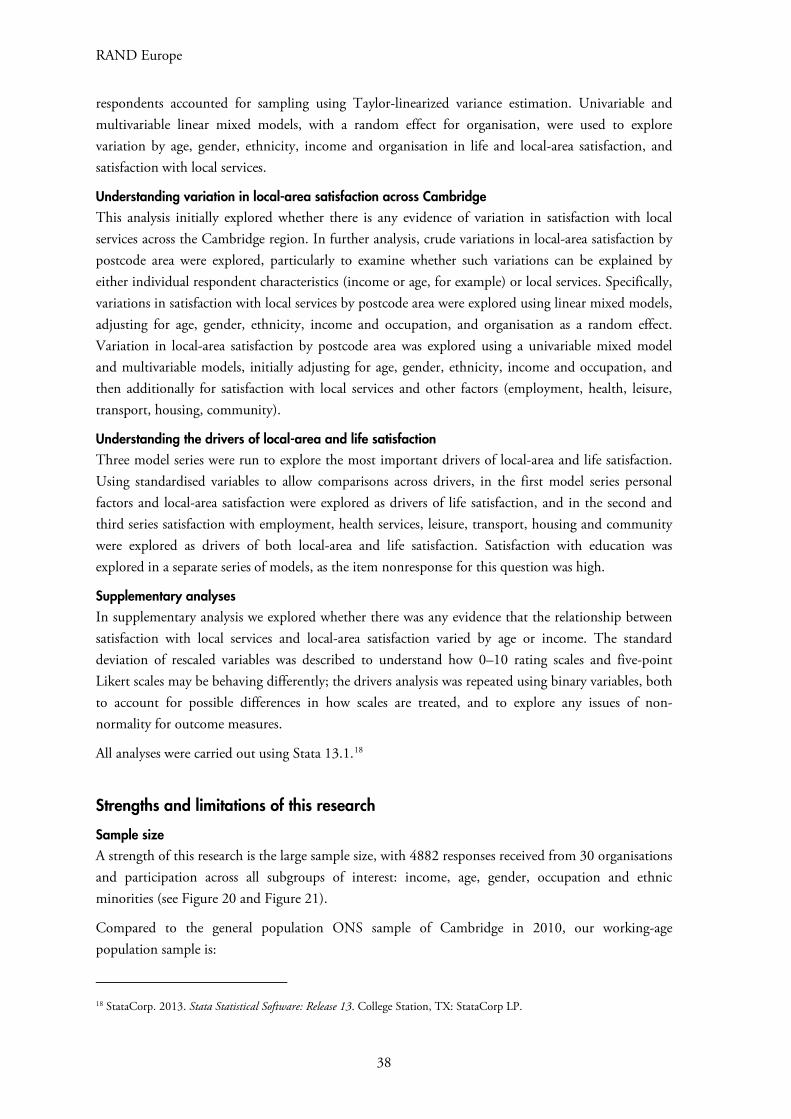
RAND Europe
respondents accounted for sampling using Taylor-linearized variance estimation. Univariable and multivariable linear mixed models, with a random effect for organisation, were used to explore variation by age, gender, ethnicity, income and organisation in life and local-area satisfaction, and satisfaction with local services.
Understanding variation in local-area satisfaction across Cambridge This analysis initially explored whether there is any evidence of variation in satisfaction with local services across the Cambridge region. In further analysis, crude variations in local-area satisfaction by postcode area were explored, particularly to examine whether such variations can be explained by either individual respondent characteristics (income or age, for example) or local services. Specifically, variations in satisfaction with local services by postcode area were explored using linear mixed models, adjusting for age, gender, ethnicity, income and occupation, and organisation as a random effect. Variation in local-area satisfaction by postcode area was explored using a univariable mixed model and multivariable models, initially adjusting for age, gender, ethnicity, income and occupation, and then additionally for satisfaction with local services and other factors (employment, health, leisure, transport, housing, community).
Understanding the drivers of local-area and life satisfaction Three model series were run to explore the most important drivers of local-area and life satisfaction. Using standardised variables to allow comparisons across drivers, in the first model series personal factors and local-area satisfaction were explored as drivers of life satisfaction, and in the second and third series satisfaction with employment, health services, leisure, transport, housing and community were explored as drivers of both local-area and life satisfaction. Satisfaction with education was explored in a separate series of models, as the item nonresponse for this question was high.
Supplementary analyses In supplementary analysis we explored whether there was any evidence that the relationship between satisfaction with local services and local-area satisfaction varied by age or income. The standard deviation of rescaled variables was described to understand how 0–10 rating scales and five-point Likert scales may be behaving differently; the drivers analysis was repeated using binary variables, both to account for possible differences in how scales are treated, and to explore any issues of non-normality for outcome measures.
All analyses were carried out using Stata 13.1.18
Strengths and limitations of this research
Sample size A strength of this research is the large sample size, with 4882 responses received from 30 organisations and participation across all subgroups of interest: income, age, gender, occupation and ethnic minorities (see Figure 20 and Figure 21).
Compared to the general population ONS sample of Cambridge in 2010, our working-age population sample is:
18 StataCorp. 2013. Stata Statistical Software: Release 13. College Station, TX: StataCorp LP.
38
Satisfaction with life and local area among people who work in the Cambridge area
• wealthier, with an average salary £45,831 compared to the ONS average income of £33,820;
• better qualified, with 76.5% having a degree or higher compared to the ONS figure of 29.8%; and
• more satisfied with their health, with 82.9% satisfied compared to the ONS’s 58.7%.19
Sampling and nonresponse – under-represented groups Sampling employees of Cambridge Ahead member organisations means that survey respondents are clearly unrepresentative of the population of Cambridge as a whole. Over-65s and under-18s are under-represented, and the unemployed not at all. Professional and academic employees are over-represented and ‘blue-collar’ jobs under-represented. It is more relevant to ask how representative the sample is of Cambridge’s working population. Even here, Cambridge Ahead members are likely to be larger organisations, meaning that employees of small- and medium-sized enterprises are again under-represented.
Nonresponse among employees at participating organisations is a second concern. Response rates varied between 5% and 60% across organisations, which may have been affected by characteristics of participating organisations, or organisational factors, such as staff access to email. In workplace surveys, people with higher job satisfaction are more likely to respond (Mueller et al. 2011); it is possible that levels of satisfaction, particularly with employment, are over-estimated.
Nonetheless, responses were received from all age and income groups, and from people living in all areas of Cambridge. Although the proportions of responding individuals may not represent the workforce in Cambridge as a whole, most groups are represented. The multivariate analyses presented here account for both the sampling and the under-representation of certain groups at the analysis stage; findings are robust to the sampling strategy taken. Our finding that there was no evidence that drivers varied by age or income provides additional support.
Although absolute estimates of satisfaction among survey respondents may be an over- or under- estimation, comparisons between groups findings are consistent with other areas and our description of the predictors and variation in satisfaction are robust to the methodological approach taken.
Question response tendencies Using the ordinal scales of ‘strongly agree’ to ‘strongly disagree’ and ‘very satisfied’ to ‘very dissatisfied’ as interval scales has some methodological limitations. Our analysis assumes that the difference between ‘strongly Agree’ and ‘agree’ is the same as the difference between ‘neutral’ and ‘disagree’, for example. This approach could result in over-estimation of the importance of drivers where the average opinion was neutral and so the differences were between people with positive and negative opinions rather than degrees of positivity or negativity. Both outcomes and drivers were converted to binary indicators, with eight and above the positive category for satisfaction on a ten-point scale and ‘agree’ or ‘fairly satisfied’ and above the positive category for the five-point scale. Sensitivity analyses after conversion gave consistent results with the original analysis and we expect the bias associated with this limitation to be low.
19 Data is derived from the British Household Panel which is conducted by the ONS.
39
RAND Europe
The same binary-coding sensitivity-analysis approach allowed exploration of whether drivers for life satisfaction, local-area satisfaction and physical health satisfaction have coefficients that were higher than those for stress and work–life balance as a result of being measured on a ten-point rather than a five-point scale (making them more informative measures); again, findings were consistent with the main analysis.
Question ordering across the survey A limitation of cross-sectional survey research is that all measures are collected at the same time and question ordering within the survey has the potential to influence responses (Krosnick & Presser 2010). In this survey, questions about local facilities and life satisfaction were presented concurrently and in this order. It is possible that the early appearance of questions about the local area could influence reporting in the later question about life satisfaction. We acknowledge this potential but unquantified effect; it is possible local-area satisfaction as a driver of life satisfaction is over-estimated, although findings are consistent across all analyses presented, and we do not expect any bias to be large.
Driver selection There may be some drivers that we have missed entirely, but this seems unlikely. Anecdotally, we have captured the areas that people talk about, and the questions we used were broad enough to capture a sense of people’s feelings. Issues are also consistent with those identified in free-text survey responses.
The limitations of self-rated satisfaction as subjective measures of well-being should also be acknowledged. For example, time spent travelling affects productivity, the quality of GPs affects health, and the quality of education has a future effect on the work force, all of which are of interest. In the context of this survey, however, we have identified those drivers most closely linked to overall satisfaction.
40
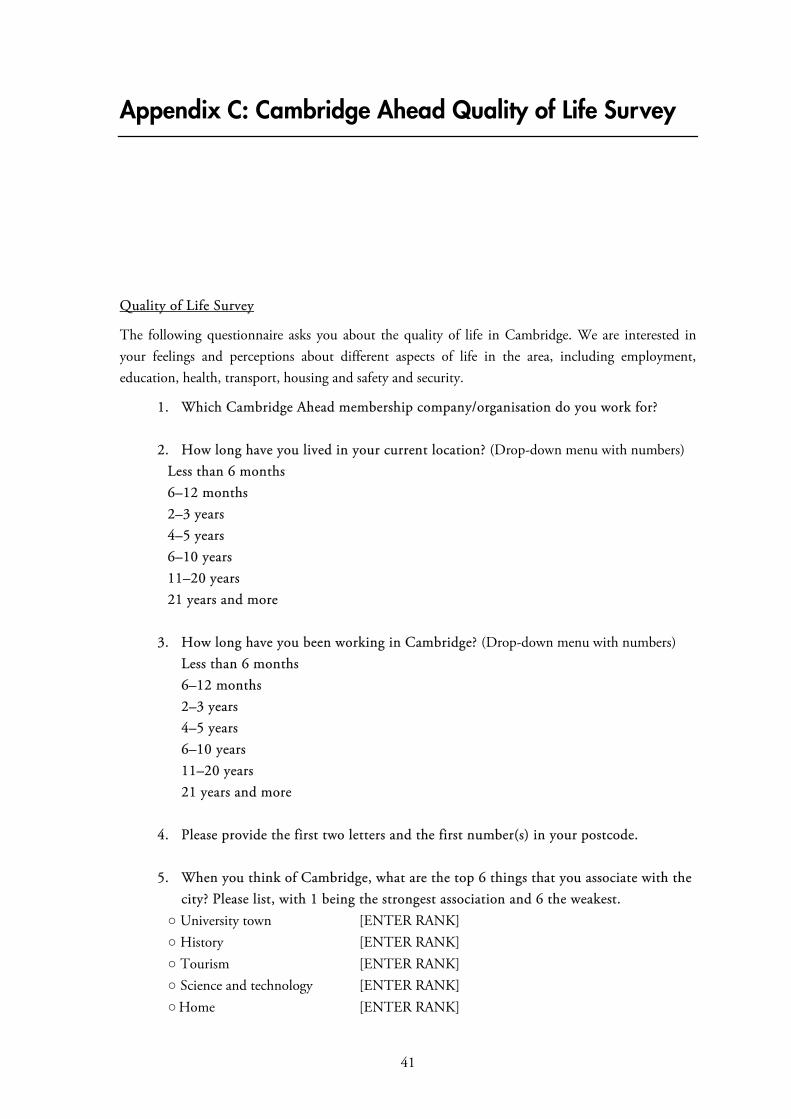
Appendix C: Cambridge Ahead Quality of Life Survey
Quality of Life Survey
The following questionnaire asks you about the quality of life in Cambridge. We are interested in your feelings and perceptions about different aspects of life in the area, including employment, education, health, transport, housing and safety and security.
1. Which Cambridge Ahead membership company/organisation do you work for?
2. How long have you lived in your current location? (Drop-down menu with numbers) Less than 6 months 6–12 months 2–3 years 4–5 years 6–10 years 11–20 years 21 years and more
3. How long have you been working in Cambridge? (Drop-down menu with numbers) Less than 6 months 6–12 months 2–3 years 4–5 years 6–10 years 11–20 years 21 years and more
4. Please provide the first two letters and the first number(s) in your postcode.
5. When you think of Cambridge, what are the top 6 things that you associate with the
city? Please list, with 1 being the strongest association and 6 the weakest. ○ University town [ENTER RANK] ○ History [ENTER RANK] ○ Tourism [ENTER RANK] ○ Science and technology [ENTER RANK] ○ Home [ENTER RANK]
41
RAND Europe
○ Family [ENTER RANK]
6. I currently feel that Cambridge…… ○1 …..is too big ○2 …..is too small ○3 …..is the right size for me
Satisfaction with the provision of services in Cambridge
The following questions ask you about your satisfaction with the provision of services in Cambridge in different areas such as education, culture and sports, employment, health and well-being, safety and security, transport and housing.
If you do not use a service, the topic of the statement or question is not relevant to you, or you have no relevant knowledge about the topic we ask about, could you please answer ‘does not apply’.
Education
7. How satisfied are you with the following:
Very
satisfied
Fairly satisfied
Neither/Nor
Fairly dissatisfied
Very dissatisfied
Does not
apply
Access to adult training and education in your local area
○1 ○2 ○3 ○4 ○5 ○6
Getting a place for your children in quality schools in your local area
○1 ○2 ○3 ○4 ○5 ○6
Quality of secondary schools in your local area
○1 ○2 ○3 ○4 ○5 ○6
Quality of childcare facilities and pre-school play groups for children
○1 ○2 ○3 ○4 ○5 ○6
42
Satisfaction with life and local area among people who work in the Cambridge area
Access to affordable childcare facilities and pre-school play groups for children
○1 ○2 ○3 ○4 ○5 ○6
Culture and Sports
8. How satisfied are you with the quality of following services:
Very
satisfied
Fairly satisfied
Neither/Nor Fairly dissatisfied
Very dissatisfied
Does not
apply
Leisure facilities/services in general
○1 ○2 ○3 ○4 ○5 ○6
Leisure facilities/services for teenagers
○1 ○2 ○3 ○4 ○5 ○6
Children’s playgrounds and play areas
○1 ○2 ○3 ○4 ○5 ○6
Parks and green spaces ○1 ○2 ○3 ○4 ○5 ○6
Libraries ○1 ○2 ○3 ○4 ○5 ○6
Museums and Galleries
○1 ○2 ○3 ○4 ○5 ○6
Cinemas, theatres and Concert Halls
○1 ○2 ○3 ○4 ○5 ○6
Restaurants, bars, clubs
○1 ○2 ○3 ○4 ○5 ○6
9. How satisfied are you with access to the following sports facilities:
43
RAND Europe
Very
satisfied
Fairly satisfied
Neither/Nor Fairly dissatisfied
Very dissatisfied
Does not
apply
Grass sports pitches (e.g. football, rugby, cricket)
○1 ○2 ○3 ○4 ○5 ○6
Cycling facilities (e.g. BMX track, velodrome, cycling lanes)
○1 ○2 ○3 ○4 ○5 ○6
Public swimming pool
○1 ○2 ○3 ○4 ○5 ○6
Climbing wall ○1 ○2 ○3 ○4 ○5 ○6
Sports clubs ○1 ○2 ○3 ○4 ○5 ○6
Racquet sporting facilities
○1 ○2 ○3 ○4 ○5 ○6
Other (please specify) Use Likert scale
Employment
10. How satisfied are you with the following:
Very
satisfied
Fairly satisfied
Neither/Nor Fairly dissatisfied
Very dissatisfied
Does not
apply
Employment opportunities in the Cambridge area
○1 ○2 ○3 ○4 ○5 ○6
Learning and development opportunities in my work
○1 ○2 ○3 ○4 ○5 ○6
44
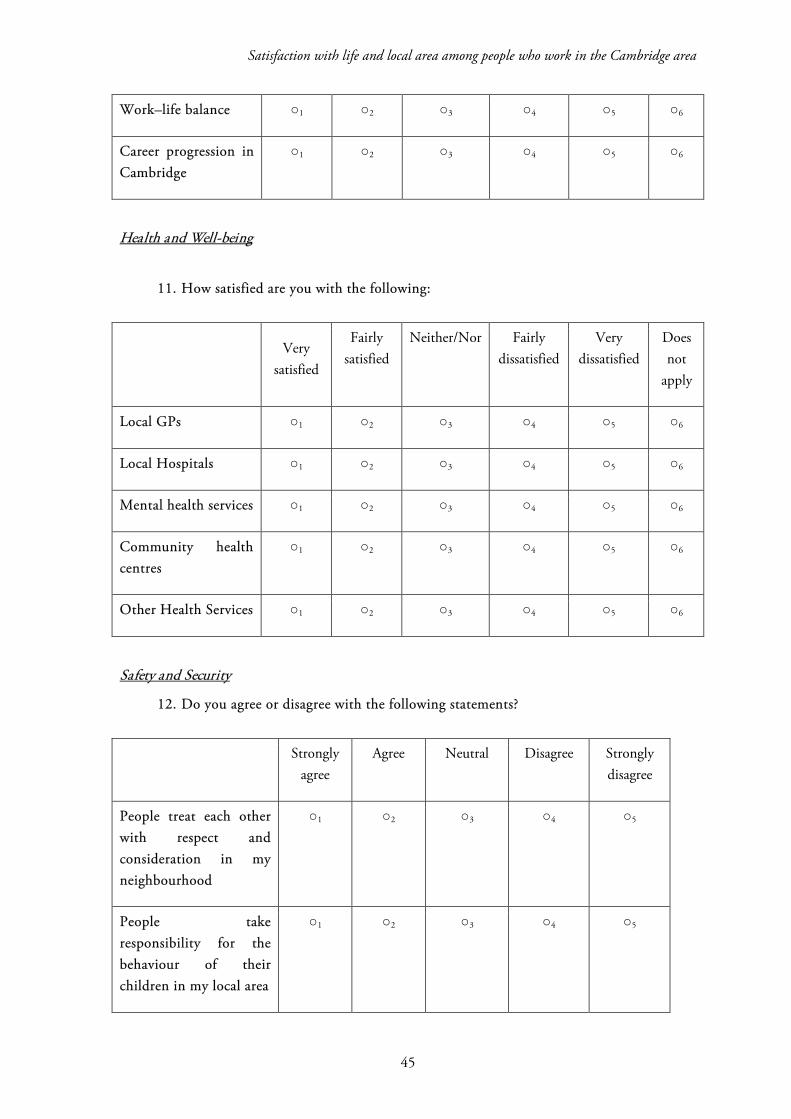
Satisfaction with life and local area among people who work in the Cambridge area
Work–life balance ○1 ○2 ○3 ○4 ○5 ○6
Career progression in Cambridge
○1 ○2 ○3 ○4 ○5 ○6
Health and Well-being
11. How satisfied are you with the following:
Very
satisfied
Fairly satisfied
Neither/Nor
Fairly dissatisfied
Very dissatisfied
Does not
apply
Local GPs ○1 ○2 ○3 ○4 ○5 ○6
Local Hospitals ○1 ○2 ○3 ○4 ○5 ○6
Mental health services ○1 ○2 ○3 ○4 ○5 ○6
Community health centres
○1 ○2 ○3 ○4 ○5 ○6
Other Health Services ○1 ○2 ○3 ○4 ○5 ○6
Safety and Security
12. Do you agree or disagree with the following statements?
Strongly
agree Agree Neutral Disagree Strongly
disagree
People treat each other with respect and consideration in my neighbourhood
○1 ○2 ○3 ○4 ○5
People take responsibility for the behaviour of their children in my local area
○1 ○2 ○3 ○4 ○5
45
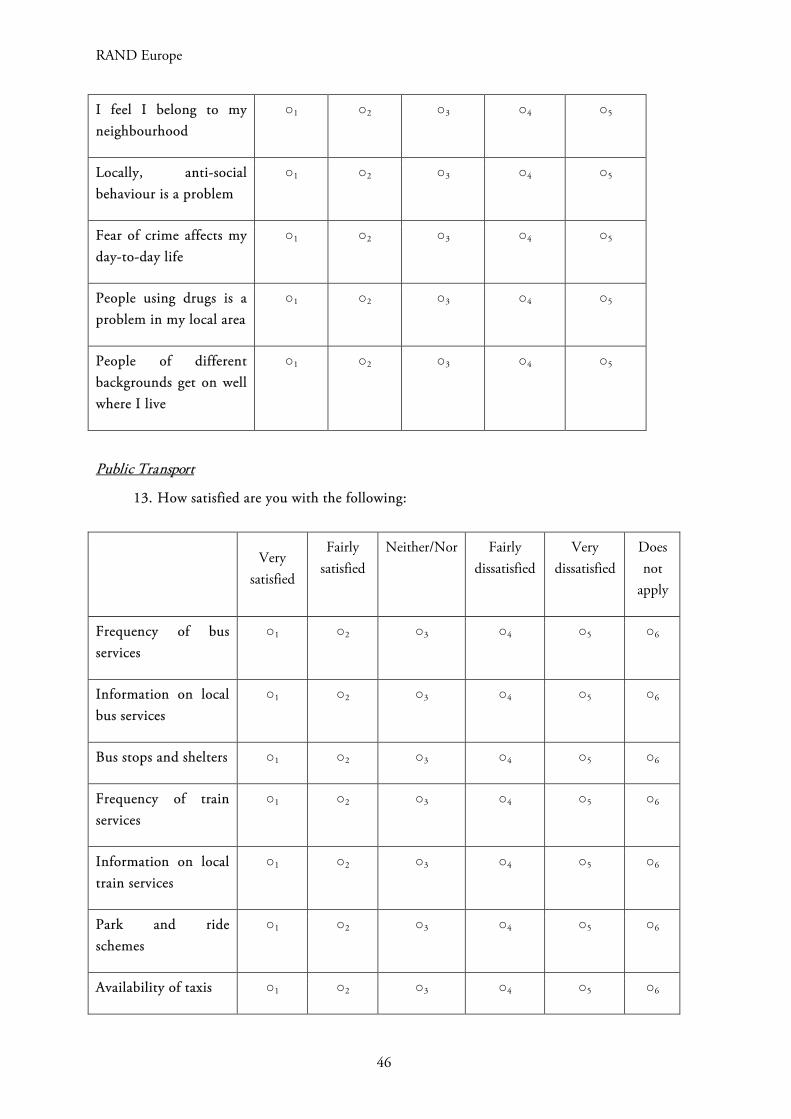
RAND Europe
I feel I belong to my neighbourhood
○1 ○2 ○3 ○4 ○5
Locally, anti-social behaviour is a problem
○1 ○2 ○3 ○4 ○5
Fear of crime affects my day-to-day life
○1 ○2 ○3 ○4 ○5
People using drugs is a problem in my local area
○1 ○2 ○3 ○4 ○5
People of different backgrounds get on well where I live
○1 ○2 ○3 ○4 ○5
Public Transport
13. How satisfied are you with the following:
Very
satisfied
Fairly satisfied
Neither/Nor Fairly dissatisfied
Very dissatisfied
Does not
apply
Frequency of bus services
○1 ○2 ○3 ○4 ○5 ○6
Information on local bus services
○1 ○2 ○3 ○4 ○5 ○6
Bus stops and shelters ○1 ○2 ○3 ○4 ○5 ○6
Frequency of train services
○1 ○2 ○3 ○4 ○5 ○6
Information on local train services
○1 ○2 ○3 ○4 ○5 ○6
Park and ride schemes
○1 ○2 ○3 ○4 ○5 ○6
Availability of taxis ○1 ○2 ○3 ○4 ○5 ○6
46
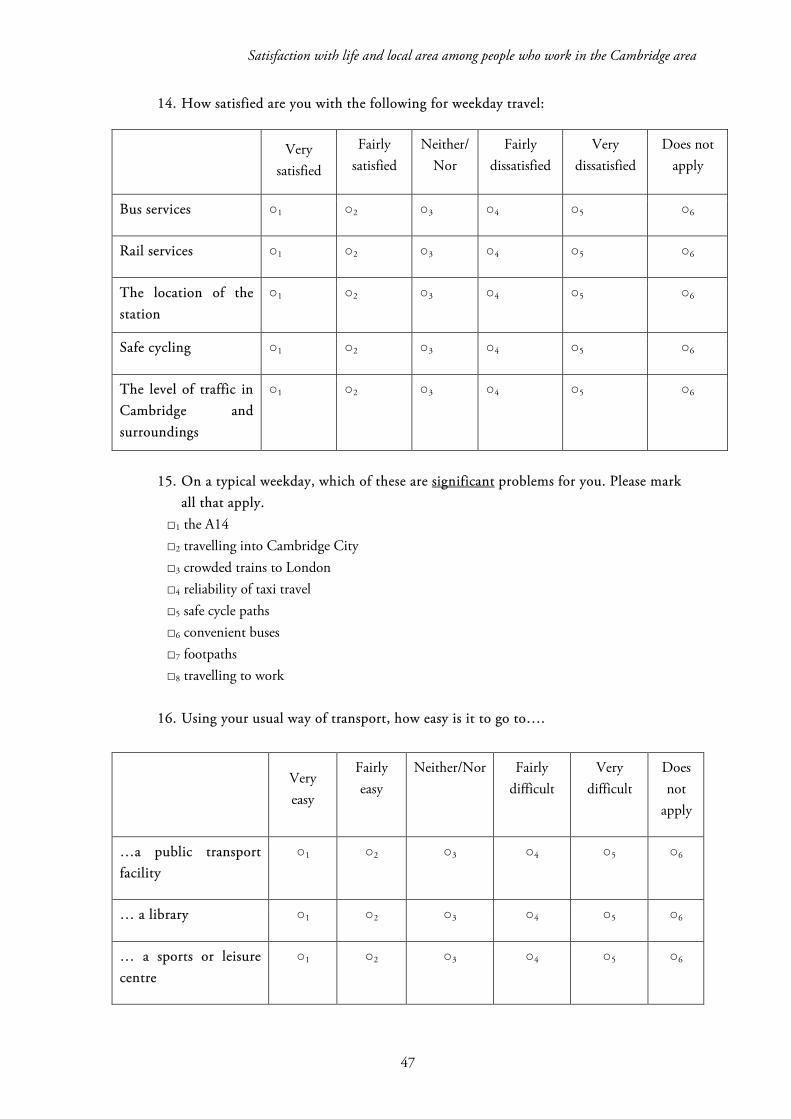
Satisfaction with life and local area among people who work in the Cambridge area
14. How satisfied are you with the following for weekday travel:
Very
satisfied
Fairly satisfied
Neither/Nor
Fairly dissatisfied
Very dissatisfied
Does not apply
Bus services ○1 ○2 ○3 ○4 ○5 ○6
Rail services ○1 ○2 ○3 ○4 ○5 ○6
The location of the station
○1 ○2 ○3 ○4 ○5 ○6
Safe cycling ○1 ○2 ○3 ○4 ○5 ○6
The level of traffic in Cambridge and surroundings
○1 ○2 ○3 ○4 ○5 ○6
15. On a typical weekday, which of these are significant problems for you. Please mark
all that apply. □1 the A14 □2 travelling into Cambridge City □3 crowded trains to London □4 reliability of taxi travel □5 safe cycle paths □6 convenient buses □7 footpaths
□8 travelling to work
16. Using your usual way of transport, how easy is it to go to….
Very easy
Fairly easy
Neither/Nor Fairly difficult
Very difficult
Does not
apply
…a public transport facility
○1 ○2 ○3 ○4 ○5 ○6
… a library ○1 ○2 ○3 ○4 ○5 ○6
… a sports or leisure centre
○1 ○2 ○3 ○4 ○5 ○6
47
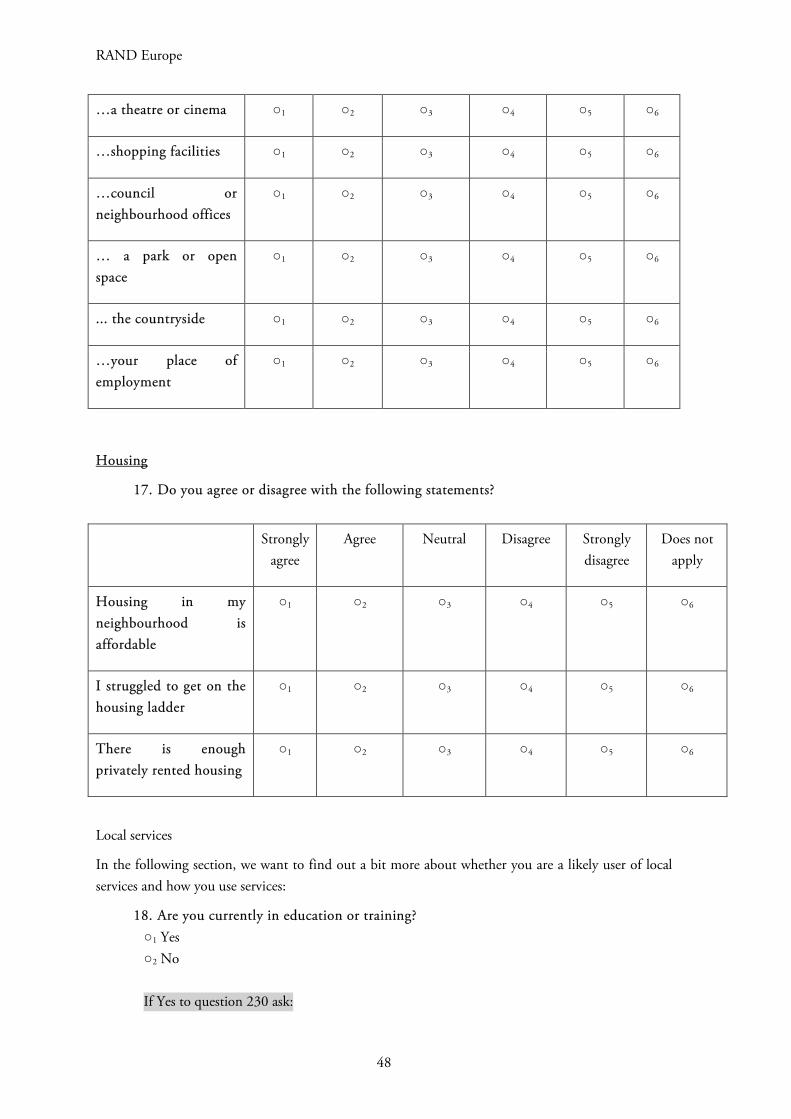
RAND Europe
…a theatre or cinema ○1 ○2 ○3 ○4 ○5 ○6
…shopping facilities ○1 ○2 ○3 ○4 ○5 ○6
…council or neighbourhood offices
○1 ○2 ○3 ○4 ○5 ○6
… a park or open space
○1 ○2 ○3 ○4 ○5 ○6
... the countryside ○1 ○2 ○3 ○4 ○5 ○6
…your place of employment
○1 ○2 ○3 ○4 ○5 ○6
Housing
17. Do you agree or disagree with the following statements?
Strongly
agree Agree Neutral Disagree Strongly
disagree Does not
apply
Housing in my neighbourhood is affordable
○1 ○2 ○3 ○4 ○5 ○6
I struggled to get on the housing ladder
○1 ○2 ○3 ○4 ○5 ○6
There is enough privately rented housing
○1 ○2 ○3 ○4 ○5 ○6
Local services
In the following section, we want to find out a bit more about whether you are a likely user of local services and how you use services:
18. Are you currently in education or training? ○1 Yes ○2 No If Yes to question 230 ask:
48
Satisfaction with life and local area among people who work in the Cambridge area
30a: What is the purpose of the education activity? ○1 Training or education provided by your employer ○2 Training or education paid by yourself
19. Have you and a family member actively participated in any arts/creative activities in the last 12 months (please mark all that apply)?
○1 Dance ○2 Drama/Theatre ○3 Art/Design/Crafts ○4 Play a musical instrument/Sing ○5 Shooting, editing film or video ○6 Spoken word/Creative Writing ○7 Other
○8 None
20. In the last 12 months, how often did you visit any of the following in Cambridge:
Never Rarely Sometimes Often Does
not apply
Theatre ○1 ○2 ○3 ○4 ○6
Museum ○1 ○2 ○3 ○4 ○6
Concerts ○1 ○2 ○3 ○4 ○6
Sporting events (e.g. football, rugby, cricket)
○1 ○2 ○3 ○4 ○6
Cinema ○1 ○2 ○3 ○4 ○6
Restaurants ○1 ○2 ○3 ○4 ○6
21. In the last 12 months, how often do you visit any of the following outside
Cambridge (e.g. in London):
Never Rarely Sometimes
Often Does
not apply
49
RAND Europe
Theatre ○1 ○2 ○3 ○4 ○6
Museum ○1 ○2 ○3 ○4 ○6
Concerts ○1 ○2 ○3 ○4 ○6
Sport events (e.g. football, rugby, cricket)
○1 ○2 ○3 ○4 ○6
Cinema ○1 ○2 ○3 ○4 ○6
Restaurants ○1 ○2 ○3 ○4 ○6
22. Do you have any long-term illness, health problem or disability which limits your
daily activities or work you can do? ○1 Yes ○2 No
23. Overall, how satisfied are you with your physical health nowadays? ○1 0 (not at all satisfied) ○2 1, 2, 3, 4, 5, 6, 7, 8, 9 ○3 10 (completely satisfied)
24. During the last month, how often did you generally feel stressed?
○1 Never ○2 Rarely ○3 Sometimes ○4 Often ○5 Always
25. Does anyone in your household currently smoke? Please mark all that apply.
○1 Yes, I smoke ○2 No ○3 Yes, another household member smokes ○4 Don’t know
26. Have you been a victim of crime in the last 12 months? ○1 Yes ○2 No
50

Satisfaction with life and local area among people who work in the Cambridge area
If Yes to question 42 ask: 24a Did you report this crime to the police? ○1 Yes ○2 No
27. On a typical mid-week day, what is your main transport to work? Please mark all
that apply. □1 Car/van – as driver □2 Car/van – as passenger □3 Motorcycle/moped/scooter □4 Taxi/minicab □5 Bicycle □6 Bus (including coach/private bus) □7 Train □8 Walk □8 Other Vehicles (please specify) □9 not applicable
28. What is the average journey time of your commute to work? Please enter in minutes [enter mins]
29. What is the average cost of your commute to work (e.g. fare, parking, or fuel costs)? Please enter the average monthly cost.
[enter costs] Your home
30. Including yourself, how many people live in your main place of residence?
31. Is your home……. □1 Owned by you, your partner or family □2 Rented from a housing association/trust □3 Rented from a private landlord □4 Residential care home/nursing home □5 Sheltered accommodation □6 Rented from the council □7 Shared ownership □8 Other (please specify)
32. What is the type of your home? □1 flat
51

RAND Europe
□2 terraced house □3 semi-detached house □4 detached house
33. What is the size of your home (number of bedrooms)? [Enter number of bedrooms]
34. What were the reasons for choosing the area where you live (please mark all that
apply)? □1 Price □2 Transport Facilities □3 School quality □4 Amenity of Neighbourhood □5 Share with relatives or friends □6 Ease of work commute □7 Other (please specify)
In this section, we want to learn some more about you.
35. What is your age? ○1 16–24 ○2 25–44 ○3 45–54 ○4 55–64 ○5 65–74 ○6 75 and older
36. What is your gender? ○1 Male ○2 Female
37. What is your ethnic origin? ○1 White (British/Irish/Any other White background) ○2 Mixed (White and Black Caribbean/White and Black African/White and Asian/Any other mixed background) ○3 Asian/Asian British (Indian/Pakistani/Bangladeshi/Any other Asian background) ○4 Black/Black British (Caribbean/African/Any other Black background) ○5 Other ethnic background
38. What is the highest level of education you have received? ○1 No formal education or primary education incomplete ○2 Primary education
52
Satisfaction with life and local area among people who work in the Cambridge area
○3 First cycle of secondary education (up to 16 years old, i.e. GCSE/O level) ○4 Second cycle of secondary education (up to 18 years old, i.e. A level or equivalent or vocational course of a similar level) ○5 Post-secondary education but not university level (e.g. vocational qualification) ○6 Undergraduate university-level education, including Bachelors and other equivalent degrees ○7 Postgraduate university-level education, including MSc and other equivalent degrees ○8 PHD or equivalent postgraduate advanced-level research qualification
39. Are you currently employed? ○1 Yes ○2 No
40. Are you self-employed? ○1 Yes ○2 No
41. Please choose the category that best describes your main job. If none of the categories fits you exactly, please respond with the closest category to your experience.
○1 Executive, or senior manager (e.g. CEO, sales VP, plant manager) ○2 Professional (e.g. engineer, accountant, systems analyst) ○3 Technical support (e.g. lab technician, legal assistant, computer programmer) ○4 Sales (e.g. sales representative, stockbroker, retail sales) ○5 Clerical and administrative support (e.g. secretary, billing clerk, office supervisor) ○6 Service occupation (e.g. security officer, food service worker, janitor) ○7 Precision production and crafts worker (e.g. mechanic, carpenter, machinist) ○8 Chemical/warehouse/production operator (e.g. shift supervisors and hourly employees) ○9 Labourer (e.g. truck driver, construction worker)
42. What is your individual annual income, before taxes? ○1 Less than £10,000 ○2 £10,000–£19,999 ○3 £20,000–£29,999 ○4 £30,000–£39,999 ○5 £40,000–£49,999 ○6 £50,000–£59,999 ○7 £60,000–£69,999 ○8 £70,000–£79,999 ○9 £80,000–£89,999 ○10 £90,000 or more
43. How many dependent children (under the age of 18) do you have?
53

RAND Europe
44. Are you providing unpaid care by looking after an ill, frail or disabled family
member, friend or partner? ○1 Yes ○2 No
In a final section, we ask for your general outlook on life in Britain and in your local area.
45. Which of these do you think is the most important issue facing Britain today?
□1 Health □2 Crime/Law and order □3 Education □4 Poverty □5 Immigration □6 Road Congestion □7 Climate Change □8 Other (please specify)
46. Which of these do you think is the most important issue facing your local area
today?
□1 Health □2 Crime/Law and order □3 Education □4 Poverty □5 Immigration □6 Road Congestion □7 Climate Change □8 Other (please specify)
47. Overall, how satisfied are you with your life nowadays? ○1 0 (not at all satisfied) ○2 1, 2, 3, 4, 5, 6, 7, 8, 9 ○3 10 (completely satisfied)
48. Overall, how satisfied are you with your local area as a place to live?
○1 0 (not at all satisfied) ○2 1, 2, 3, 4, 5, 6, 7, 8, 9 ○3 10 (completely satisfied)
49. Does the area offer you a good quality of life compared with other places in which you have lived? (Yes/No)
54

Satisfaction with life and local area among people who work in the Cambridge area
Thank you for completing the survey.
Our study team will gather and analyse the results and will feed back the results through your organisation champion.
55
Appendix D: Survey questions measuring local area and life satisfaction, personal factors, and satisfaction with local services
Table 10. Local-area and life satisfaction, personal factors, and satisfaction with local services.
Question [response options]
N Mean (95%CI)
[0 to 10 scale] Overall
Local area satisfaction Overall, how satisfied are you with your local area as a place to live? [0–10 scale]
3903 7.22 (7.11–7.32)
Life satisfaction Overall, how satisfied are you with your life nowadays? [0–10 scale]
3900 7.08 (7.00–7.17)
Personal
Physical health Overall, how satisfied are you with your physical health nowadays? [0–10 scale]
3949 7.25 (7.11–7.39)
Work–life balance How satisfied are you with the following: Work-life balance [Very satisfied | Fairly satisfied | Neither/Nor | Fairly dissatisfied | Very dissatisfied | Does not apply]
4267 6.42 (6.23–6.61)
Mental health During the last month, how often did you generally feel stressed? [Never | Rarely | Sometimes | Often | Always]
3958 5.38 (5.25–5.50)
Local services
Employment How satisfied are you with the following: Employment opportunities in the Cambridge area [Very satisfied | Fairly satisfied | Neither/Nor | Fairly dissatisfied | Very dissatisfied | Does not apply]
4152 7.42 (7.25–7.59)
Health services How satisfied are you with the following: 3855 6.81 (6.51–7.10)
56
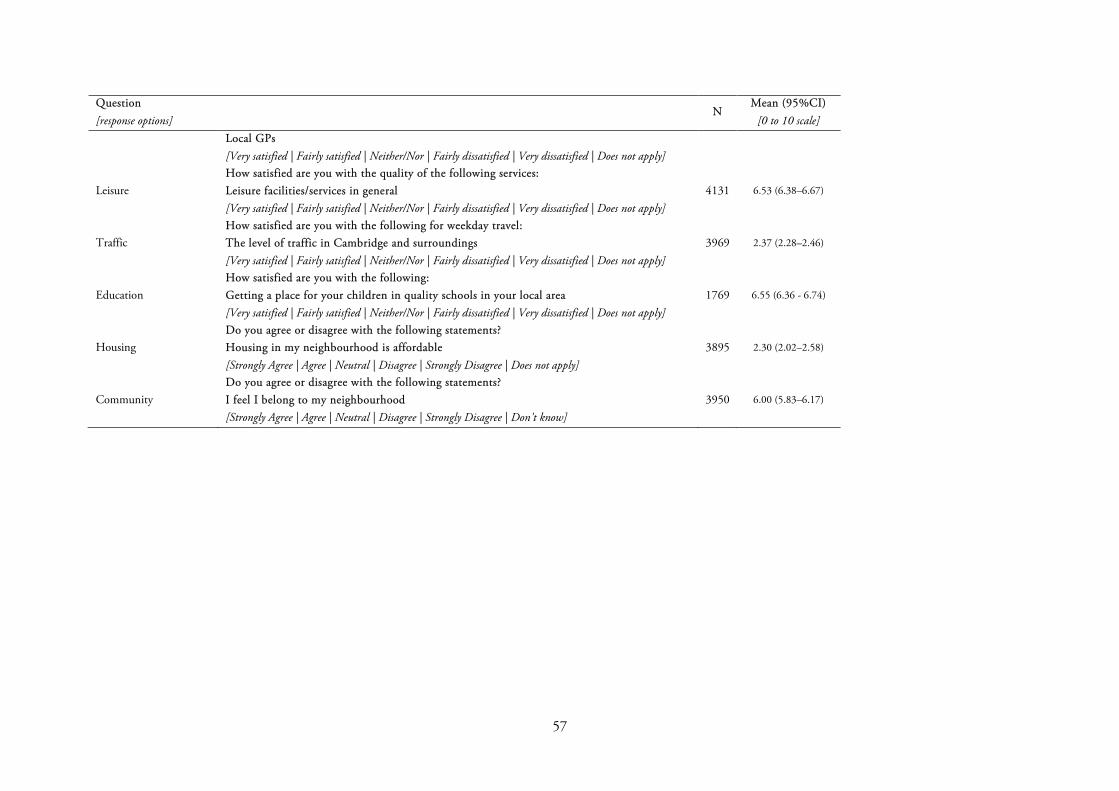
Question [response options]
N Mean (95%CI)
[0 to 10 scale] Local GPs [Very satisfied | Fairly satisfied | Neither/Nor | Fairly dissatisfied | Very dissatisfied | Does not apply]
Leisure How satisfied are you with the quality of the following services: Leisure facilities/services in general [Very satisfied | Fairly satisfied | Neither/Nor | Fairly dissatisfied | Very dissatisfied | Does not apply]
4131 6.53 (6.38–6.67)
Traffic How satisfied are you with the following for weekday travel: The level of traffic in Cambridge and surroundings [Very satisfied | Fairly satisfied | Neither/Nor | Fairly dissatisfied | Very dissatisfied | Does not apply]
3969 2.37 (2.28–2.46)
Education How satisfied are you with the following: Getting a place for your children in quality schools in your local area [Very satisfied | Fairly satisfied | Neither/Nor | Fairly dissatisfied | Very dissatisfied | Does not apply]
1769 6.55 (6.36 - 6.74)
Housing Do you agree or disagree with the following statements? Housing in my neighbourhood is affordable [Strongly Agree | Agree | Neutral | Disagree | Strongly Disagree | Does not apply]
3895 2.30 (2.02–2.58)
Community Do you agree or disagree with the following statements? I feel I belong to my neighbourhood [Strongly Agree | Agree | Neutral | Disagree | Strongly Disagree | Don't know]
3950 6.00 (5.83–6.17)
57
Appendix E: Location of respondents
In this appendix, we illustrate the approximate distance from respondents’ homes to the centre of Cambridge in a number of different ways. The methodology for calculating this distance is as follows:
• From Question 4 of the survey, we extracted the postcode district (e.g. CB1) of the respondent’s home.
• We used Google Maps to calculate the length of the shortest walking route from the centre of that postcode district to the junction of Hobson Street, Sidney Street and St Andrew’s Street in Cambridge.
Figure 22 shows the image that we use in this appendix, for licensing reasons. Figure 23 shows the breakdown of where respondents live within Cambridge and its immediate surroundings. Figure 24 does the same for the CB postcode area and its immediate neighbours; CB1–CB5 are aggregated for reasons of space. Figure 25 shows the cumulative distribution function for the approximate distance of respondents’ homes to Cambridge, with postcode districts with at least ten respondents indicated.
58
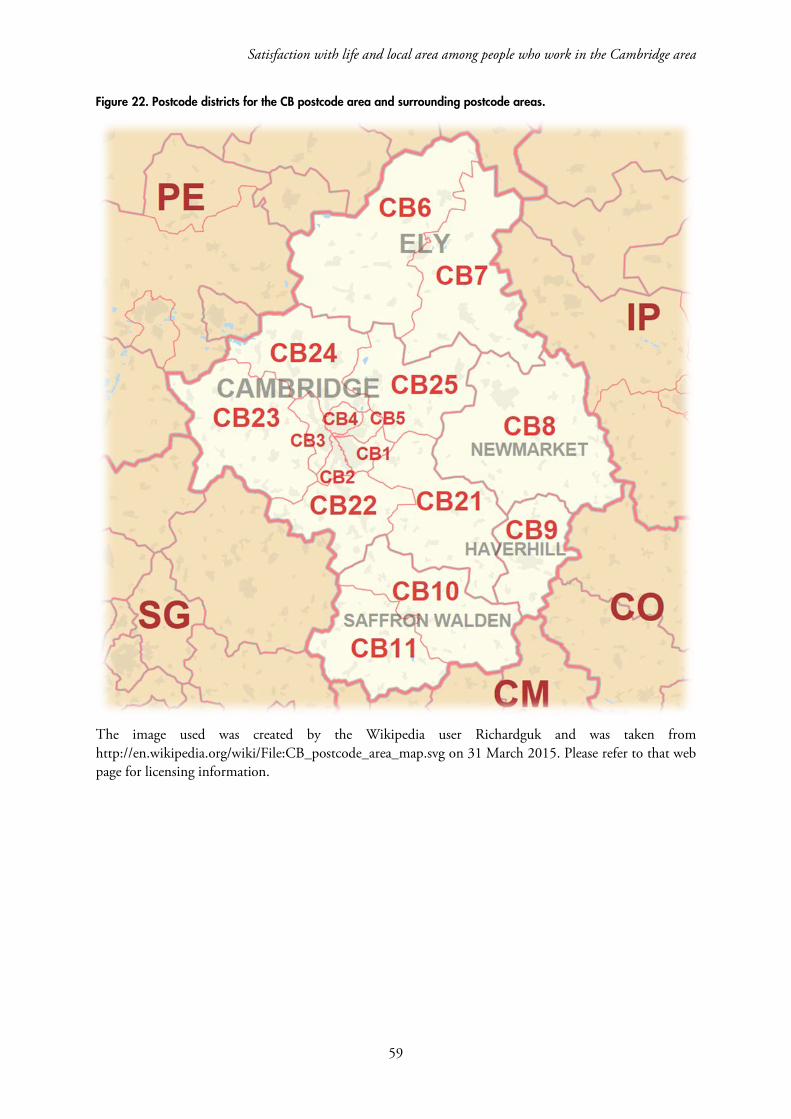
Satisfaction with life and local area among people who work in the Cambridge area
Figure 22. Postcode districts for the CB postcode area and surrounding postcode areas.
The image used was created by the Wikipedia user Richardguk and was taken from http://en.wikipedia.org/wiki/File:CB_postcode_area_map.svg on 31 March 2015. Please refer to that web page for licensing information.
59
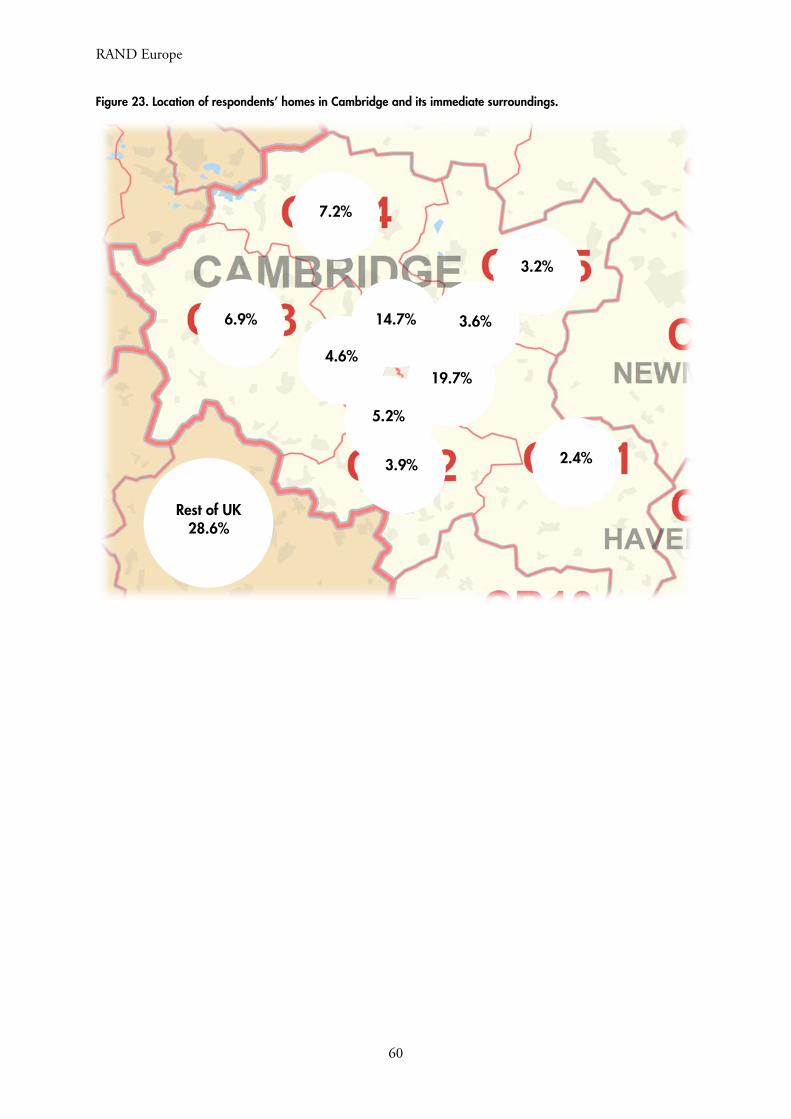
RAND Europe
Figure 23. Location of respondents’ homes in Cambridge and its immediate surroundings.
19.7%
5.2%
4.6%
14.7% 3.6%
7.2%
6.9%
3.2%
2.4% 3.9%
Rest of UK 28.6%
60
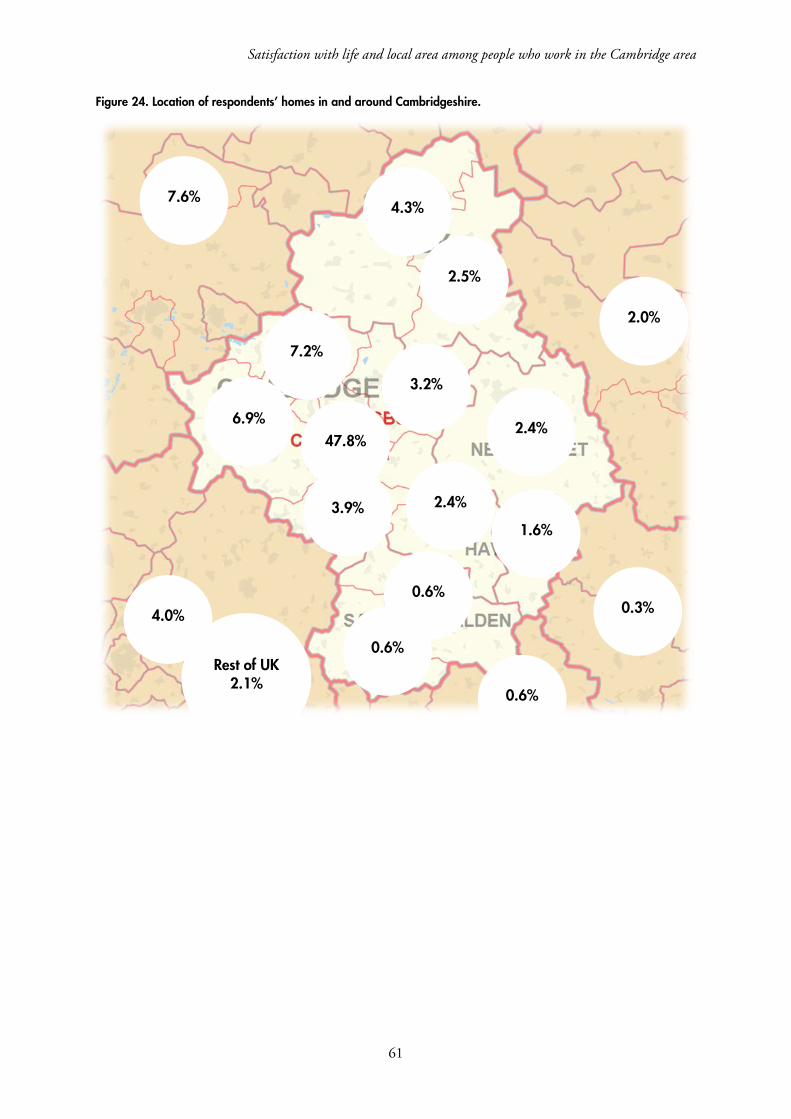
Satisfaction with life and local area among people who work in the Cambridge area
Figure 24. Location of respondents’ homes in and around Cambridgeshire.
7.2%
6.9%
3.2%
2.4% 3.9%
4.3%
2.5%
2.4%
1.6%
0.6%
0.6%
7.6%
2.0%
0.3%
0.6%
4.0%
47.8%
Rest of UK 2.1%
61
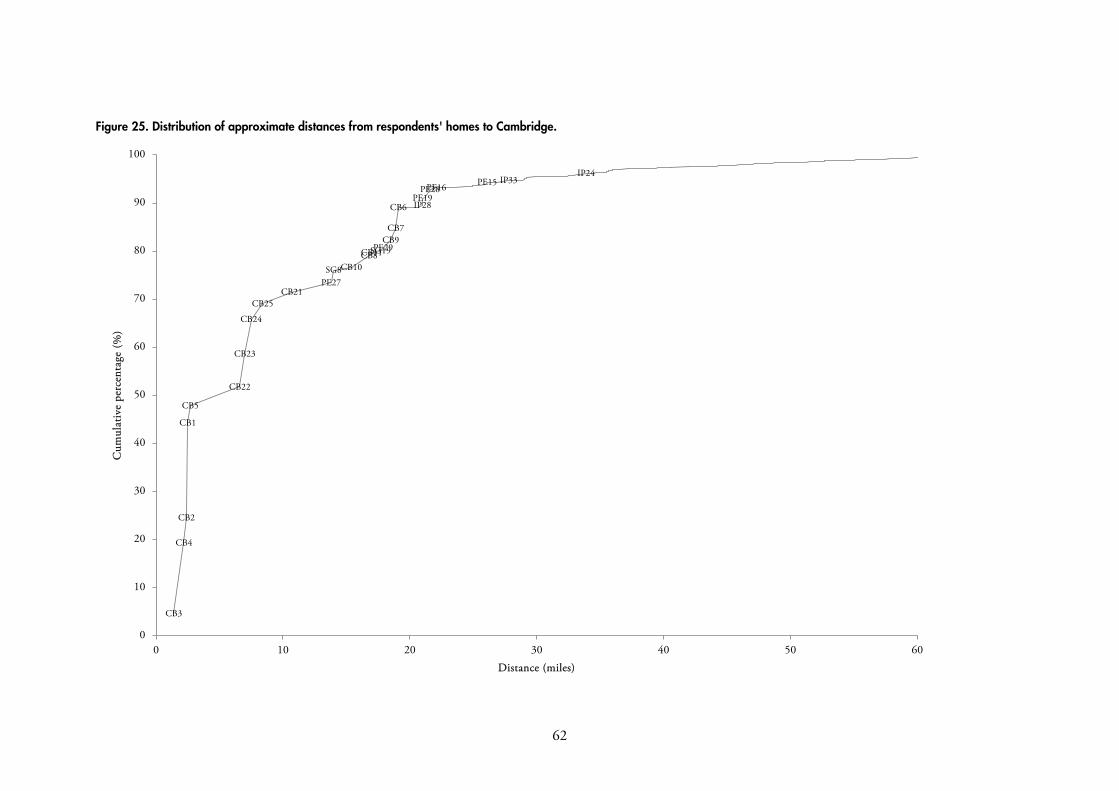
Figure 25. Distribution of approximate distances from respondents' homes to Cambridge.
CB3
CB4
CB2
CB1
CB5
CB22
CB23
CB24
CB25CB21
PE27SG8CB10
CB8CB11SG19PE29CB9
CB7
CB6 IP28PE19
PE28PE16 PE15 IP33IP24
0
10
20
30
40
50
60
70
80
90
100
0 10 20 30 40 50 60
Cum
ulat
ive
perc
enta
ge (
%)
Distance (miles)
62
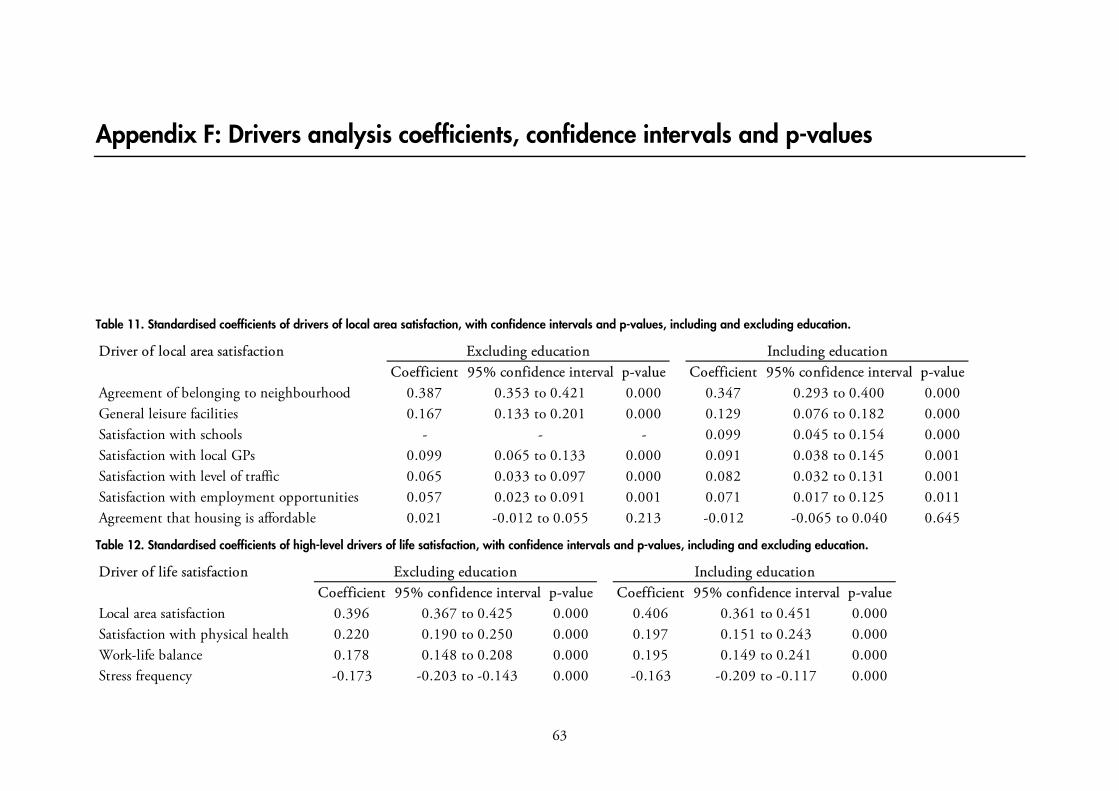
Appendix F: Drivers analysis coefficients, confidence intervals and p-values
Table 11. Standardised coefficients of drivers of local area satisfaction, with confidence intervals and p-values, including and excluding education.
Table 12. Standardised coefficients of high-level drivers of life satisfaction, with confidence intervals and p-values, including and excluding education.
Driver of local area satisfactionCoefficient 95% confidence interval p-value Coefficient 95% confidence interval p-value
Agreement of belonging to neighbourhood 0.387 0.353 to 0.421 0.000 0.347 0.293 to 0.400 0.000General leisure facilities 0.167 0.133 to 0.201 0.000 0.129 0.076 to 0.182 0.000Satisfaction with schools - - - 0.099 0.045 to 0.154 0.000Satisfaction with local GPs 0.099 0.065 to 0.133 0.000 0.091 0.038 to 0.145 0.001Satisfaction with level of traffic 0.065 0.033 to 0.097 0.000 0.082 0.032 to 0.131 0.001Satisfaction with employment opportunities 0.057 0.023 to 0.091 0.001 0.071 0.017 to 0.125 0.011Agreement that housing is affordable 0.021 -0.012 to 0.055 0.213 -0.012 -0.065 to 0.040 0.645
Including educationExcluding education
Driver of life satisfactionCoefficient 95% confidence interval p-value Coefficient 95% confidence interval p-value
Local area satisfaction 0.396 0.367 to 0.425 0.000 0.406 0.361 to 0.451 0.000Satisfaction with physical health 0.220 0.190 to 0.250 0.000 0.197 0.151 to 0.243 0.000Work-life balance 0.178 0.148 to 0.208 0.000 0.195 0.149 to 0.241 0.000Stress frequency -0.173 -0.203 to -0.143 0.000 -0.163 -0.209 to -0.117 0.000
Including educationExcluding education
63
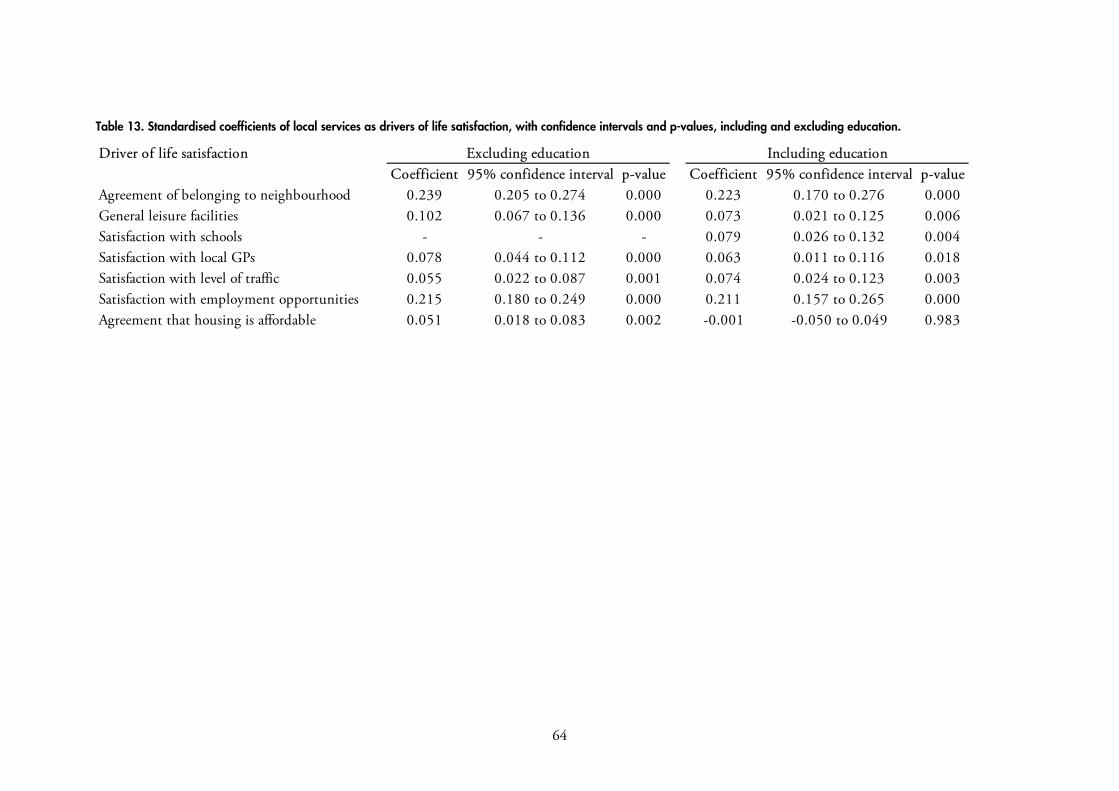
Table 13. Standardised coefficients of local services as drivers of life satisfaction, with confidence intervals and p-values, including and excluding education.
Driver of life satisfactionCoefficient 95% confidence interval p-value Coefficient 95% confidence interval p-value
Agreement of belonging to neighbourhood 0.239 0.205 to 0.274 0.000 0.223 0.170 to 0.276 0.000General leisure facilities 0.102 0.067 to 0.136 0.000 0.073 0.021 to 0.125 0.006Satisfaction with schools - - - 0.079 0.026 to 0.132 0.004Satisfaction with local GPs 0.078 0.044 to 0.112 0.000 0.063 0.011 to 0.116 0.018Satisfaction with level of traffic 0.055 0.022 to 0.087 0.001 0.074 0.024 to 0.123 0.003Satisfaction with employment opportunities 0.215 0.180 to 0.249 0.000 0.211 0.157 to 0.265 0.000Agreement that housing is affordable 0.051 0.018 to 0.083 0.002 -0.001 -0.050 to 0.049 0.983
Excluding education Including education
64
Appendix G: Variation in satisfaction with local services across different personal characteristics
Table 14. Variation in satisfaction with local services across different personal characteristics.
Employment Health services Leisure Traffic Education Housing Community
Coefficient (95% CI) p-value
Coefficient (95% CI) p-value
Coefficient (95% CI)
p-value
Coefficient (95% CI)
p-value
Coefficient (95% CI) p-value
Coefficient (95% CI)
p-value
Coefficient (95% CI) p-value
Age
16-24 0.60 (0.22 to 0.99)
0.005
0.29 (-0.19 to 0.77)
<0.0001
0.28 (-0.14 to 0.71)
0.33
0.45 (0.02 to 0.87)
0.0052
-0.93 (-2.15 to 0.29)
0.0061
0.47 (0.03 to 0.91)
0.054
-0.18 (-0.63 to 0.26)
<0.0001
25-44 reference reference reference reference reference reference reference
45-54 -0.01 (-0.22 to 0.19) 0.56 (0.31 to 0.82) -0.08 (-0.31 to
0.15) -0.33 (-0.56 to -
0.10) 0.43 (0.04 to 0.81)
-0.10 (-0.33 to 0.14)
0.48 (0.24 to 0.71)
55-64 0.25 (0.00 to 0.51) 0.53 (0.21 to 0.86) 0.01 (-0.28 to 0.30) -0.19 (-0.48 to
0.10) 0.84 (0.31 to 1.38) 0.22 (-0.07 to 0.52) 0.83 (0.53 to 1.13)
65 and older 0.48 (-0.20 to 1.16) 1.23 (0.38 to 2.09) 0.57 (-0.19 to 1.34) -0.44 (-1.19 to
0.32) 0.17 (-1.44 to
1.78) 0.45 (-0.34 to 1.23) 1.45 (0.66 to 2.25)
Gender Female reference
0.0002 reference
0.040 reference
0.0021 reference
0.0006 reference
0.19 reference
0.0004 reference
<0.0001 Male -0.35 (-0.54 to -0.17)
-0.24 (-0.46 to -0.01)
-0.32 (-0.52 to -0.12)
0.35 (0.15 to 0.56) 0.25 (-0.13 to
0.63) -0.38 (-0.59 to -
0.17) -0.52 (-0.73 to -0.30)
65
Employment Health services Leisure Traffic Education Housing Community
Coefficient (95% CI) p-value
Coefficient (95% CI) p-value
Coefficient (95% CI)
p-value
Coefficient (95% CI)
p-value
Coefficient (95% CI) p-value
Coefficient (95% CI)
p-value
Coefficient (95% CI) p-value
Ethnicity White reference
<0.0001 reference
0.0005 reference
0.056 reference
0.10 reference
0.012 reference
0.75 reference
0.93 All other groups -1.08 (-1.39 to -0.77)
-0.68 (-1.06 to -0.29)
-0.34 (-0.68 to 0.01)
0.28 (-0.06 to 0.62) -0.74 (-1.31 to
-0.16) 0.06 (-0.29 to 0.41) -0.02 (-0.37 to 0.34)
Income
Less than £20,000 -0.24 (-0.53 to 0.05)
<0.0001
-0.48 (-0.84 to -0.11)
0.017
0.25 (-0.08 to 0.58)
0.21
0.08 (-0.24 to 0.40)
0.86
0.28 (-0.36 to 0.91)
0.40
-0.03 (-0.37 to 0.30)
0.10
0.09 (-0.25 to 0.43)
<0.0001
£20,000–£29,999 reference reference reference reference reference reference reference
£30,000–£39,999 0.32 (0.08 to 0.57) -0.09 (-0.39 to 0.22) 0.12 (-0.15 to 0.39) -0.06 (-0.33 to
0.21) -0.08 (-0.63 to
0.47) 0.17 (-0.11 to 0.45) 0.31 (0.03 to 0.59)
£40,000–£49,999 0.53 (0.23 to 0.82) -0.51 (-0.87 to
-0.14) -0.14 (-0.47 to
0.18) -0.14 (-0.46 to
0.18) 0.14 (-0.49 to
0.76) 0.30 (-0.03 to 0.64) 0.22 (-0.12 to 0.56)
£50,000–£59,999 0.56 (0.22 to 0.90) -0.36 (-0.78 to 0.07) -0.23 (-0.61 to
0.15) -0.13 (-0.50 to
0.25) 0.37 (-0.31 to
1.06) 0.34 (-0.05 to 0.73) 0.92 (0.52 to 1.31)
£60,000–£89,999 0.74 (0.38 to 1.09) -0.03 (-0.48 to 0.41) 0.03 (-0.37 to 0.43) -0.06 (-0.45 to
0.34) 0.06 (-0.63 to
0.74) 0.64 (0.23 to 1.05) 1.03 (0.61 to 1.44)
£90,000 or more 0.94 (0.55 to 1.33) -0.18 (-0.66 to 0.31) -0.22 (-0.65 to
0.21) -0.28 (-0.71 to
0.15) -0.43 (-1.17 to
0.31) 0.23 (-0.22 to 0.68) 1.21 (0.76 to 1.66)
Occupation Executive or senior
manager 0.06 (-0.31 to 0.44)
0.015
-0.12 (-0.58 to 0.35)
0.61
0.29 (-0.13 to 0.71)
0.13
0.66 (0.25 to 1.07)
0.019
0.08 (-0.58 to 0.73)
0.29
0.34 (-0.09 to 0.77)
0.0012
-0.03 (-0.46 to 0.41)
0.14
Professional reference reference reference reference reference reference reference
Technical support -0.23 (-0.55 to 0.09) -0.30 (-0.70 to 0.10) -0.20 (-0.56 to
0.16) -0.19 (-0.54 to
0.17) -0.46 (-1.19 to
0.27) 0.07 (-0.30 to 0.44) 0.13 (-0.24 to 0.51)
Clerical and administrative support
-0.09 (-0.35 to 0.18) -0.24 (-0.58 to 0.09) -0.23 (-0.53 to
0.07) 0.17 (-0.13 to 0.46)
-0.15 (-0.73 to 0.43)
0.33 (0.02 to 0.63) -0.08 (-0.39 to 0.23)
Academic 0.13 (-0.14 to 0.41) -0.17 (-0.51 to 0.17) -0.29 (-0.59 to
0.01) 0.09 (-0.21 to 0.39)
-0.59 (-1.11 to -0.06)
-0.40 (-0.71 to -0.08)
-0.40 (-0.72 to -0.09)
All other occupations -0.72 (-1.17 to -0.27) -0.23 (-0.79 to 0.33) 0.09 (-0.41 to 0.60) 0.27 (-0.23 to 0.76) -0.32 (-1.17 to
0.53) -0.01 (-0.53 to
0.50) -0.07 (-0.59 to 0.44)
66


![Paper Class XI[Nurture(X-XI)]](https://img.pdfslide.us/doc/110x75/55cf93c3550346f57b9e4fc8/paper-class-xinurturex-xi.jpg)