Embed Size (px)
Citation preview
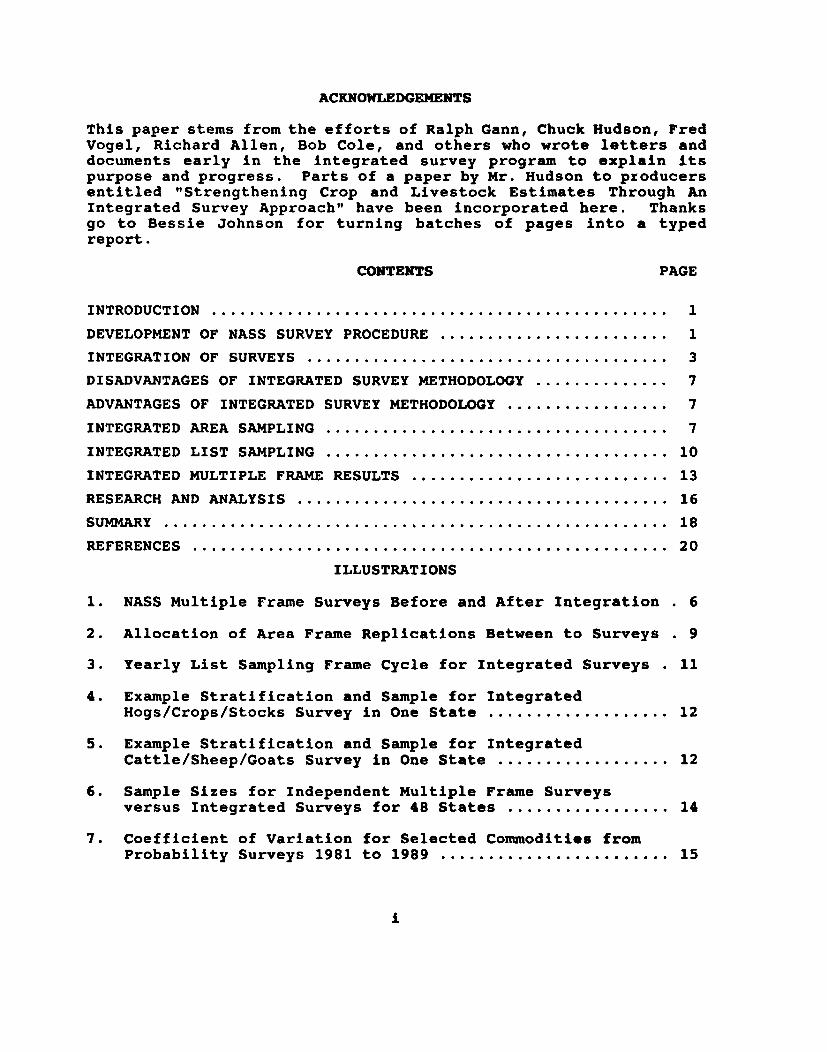
ACKNOWLEDGEMENTS
This paper stems from the efforts of Ralph Gann, Chuck Hudson, FredVogel, Richard Allen, Bob Cole, and others who wrote letters anddocuments early in the integrated survey program to explain itspurpose and progress. Parts of a paper by Mr. Hudson to pZ"oducersentitled "Strengthening Crop and Livestock Estimates Through AnIntegrated Survey Approach" have been incorporated here. Thanksgo to Bessie Johnson for turning batches of pages into a typedreport.
CONTENTS PAGE
INTRODUCTION .
DEVELOPMENT OF NASS SURVEY PROCEDURE .INTEGRATION OF SURVEYS .DISADVANTAGES OF INTEGRATED SURVEY METHODOLOGy .ADVANTAGES OF INTEGRATED SURVEY METHODOLOGy .......•.........INTEGRATED AREA SAMPLING .INTEGRATED LIST SAMPLING .INTEGRATED MULTIPLE FRAME RESULTS .RESEARCH AND ANAL YS IS .SUJ.n.f.ARY ...•••••••••••••.•••...••••••••••••••..••••••••••••••
REFERENCESILLUSTRATIONS
113
777
1013161820
1. NASS Multiple Frame Surveys Before and After Integration. 6
2. Allocation of Area Frame Replications Between to Surveys. 93. Yearly List Sampling Frame Cycle for Integrated Surveys. 11
4. Example Stratification and Sample for IntegratedHogs/Crops/Stocks Survey in One State ......•.........•.. 12
5. Example Stratification and Sample for IntegratedCattle/Sheep/Goats Survey in One State 12
6. Sample Sizes for Independent Multiple Frame Surveysversus Integrated Surveys for 48 States ...........•••... 14
7. Coefficient of Variation for Selected Commodities fromProbability Surveys 1981 to 1989 ..••............•••...•. 15
i
INTEGRATED AGRICULTURAL SURVEYSby R. R. Bosecker
INTRODUCTION: This paper has been prepared to describe theintegration of agricultural surveys by the National AgriculturalStatistics Service (NASS).
The purposes of integrating independent surveys were to:
1) provide the agricultural conununity wi th statistically reliablecrop and livestock statistics based on uniform probabilitysurvey sampling methodology, and
2) reduce the number of individual producer contacts byconsolidating major commodity surveys.
The concept to accomplish these objectives was known as theIntegrated Survey Program. To fully illustrate the importance ofthis survey and sampling program, this report presents a backgroundof survey methodology used by NASS, discusses advantages anddisadvantages of integration, and then describes the key featuresof the integrated surveys.
DEVELOPMENT OF NASS SURVEY PROCEDURES: Estimates of harvestedacreage and production for most field crops and annual livestockinventories have been provided since 1866. Large-scale non-probability mail surveys were employed from that beginning duringthe Lincoln Administration as a satisfactory means of obtainingagricultural data. These large non-probability mail surveys workedwell as a means of obtaining agricultural data when U.S.agricul ture was less specialized than it is today. Since mostneighboring farms grew the same crops and frequently had similarlivestock and poultry inventories as well, characteristics ofrespondent and nonrespondent farms were not greatly different.
From these large mail surveys, each State developed a list ofreporting farmers representing all areas across the State toprovide month to month dairy and egg production. These were knownas Monthly Farm Report Panels. The monthly panel surveys and largenon-probability annual mail surveys were the backbone ofagricultural estimating methods during the first half of the 20thcentury.
During the 19'0' sand 1950' s, as farms became larger and morespecialized, non-probability mail survey techniques became less
1
reliable, particularly for livestock, poultry, and other specialtycommodities. Respondent and nonrespondent farms were likely to begreatly different. It became apparent that improved methodologyinvolving scientific probability sampling procedures were needed.Iowa State College, now Iowa State University, began developmentin 1943 of a land area based sampling frame known as the "MasterSample of Agriculture" (see King and Jensen, 1945). This effortwas funded by a cooperative agreement between Iowa State, the U.S.Department of Agriculture and the U.S. Bureau of the Ce~sus.
The Master Sample was used extensively in the late 1940's and early1950's for probability surveys but not as the basis for a recurringstatis1;ical program due to lack of funds. In 1954, with theappropriation of funds for methods research and development, a mid-year area frame survey of planted acres and livestock inventorycalled the June Enumerative Survey was begun on a pilot basis in10 states (703 sample segments in 100 counties). Research on anend-of-year December Enumerative Survey, primarily for livestockdata, began in 1955 using a subsample of land parcels from the Junesurvey.Area Frame Sampling provided true probability estimates and theability to calculate sampling errors for the first time. It waspossible to select sample units with a known probability ofselection. The concept of area-frame sampling is simple. The landarea to be surveyed is divided into small units called segments,with unique and identifiable boundaries that can be delineated onaerial photographs or maps. These segments encompass the totalland area of each State as well as the U.S. A random selectionprocedure is used so all areas of agriculture are represented andthe sample properly estimates for the populations of interest.
In 1965, the June and December enumerative surveys had beenextended to all 48 conterminous states. The area sample consistedof about 17,000 segments and included all or parts of 70,000 farms.Most of the country still relied upon the Master Sample frame forsample segments, but new frames had been constructed for westernand northeastern states. These new area frames had utilizedstratification based on land-use categories according to intensityof cultivation or urbanization. Visual interpretation of aerialphotography, provided the means to stratify according to land-use.Reduction of 10 to 25 percent in sampling variance were affordedby the new frames. The program to update area frames was madecontinuous.It did not take long during the research phase of area framesampling to realize that a few large livestock operations coulddistort survey results by their presence or absence in the sample.Their presence contributed greatly to the sample variance as wellas the survey expansion. Therefore, a list of these "extremeoperators" was developed independently of the area work. A listsample could then be selected, and the livestock data for extreme
2
operators removed from area samples. This approach was thebeginning of multiple (dual) frame sampling for agriculturalsurveys. Theoretical foundations for the NASS estimates from twooverlapping sampling frames were provided by Hartley (1962) andCochran (1964).
In 1969, four states began a continuous series of multiple framesurveys utilizing extensive lists stratified by size for hog andcattle estimates. By 1974, multiple frame surveys were conductedin 14 states to provide hog estimates and in 28 states for cattleestimates. Multiple frame surveys using these extensive listframes provided significantly lower sampling errors than surveysusing only small lists of extreme operators.
Various lists of farm operators were compiled and maintained withinState Statistical Offices during the 1970 IS. Mul tiple framesurveys for rice (1977) and farm grain stocks (1979) were added tothose for hogs and cattle. In 1979, work began to develop acomprehensive national list frame system that would standardizethe maintenance of names and associated size data for fa~s andranches throughout the U.S. By 1981, a national list had beenconsolidated in one computer system. Maintaining the list frameremained the responsibility of individual State offices. Samplingof the list frame for national multiple frame surveys becamecentralized in headquarters.Multiple frame sampling has some distinct advantages for NASS,particularly for livestock, specialty crops, and economic data suchas agricultural labor. These items are poorly correlated with landarea and are inefficiently estimated by the area frame sample. Inmultiple frame sampling, most of the data for the population ofinterest can be collected more efficiently through the list frameby mail or telephone. Also, it is usually possible to develop andincorporate historic information for units in the list frame forstratification and sampling purposes. The area frame portion ofthe survey provides an estimate for incompleteness in the list.In this way, the two frames can be used to complement each otherand provide a valid estimate for all operations. An excellentpresentation and discussion of the various estimators employed byNASS are given in "Review of the Multiple and Area FrameEstimators" by Nealon, 1984.
Since implementation of the multiple frame concept, revisions tocattle estimates at the national level have never been over 1percent and revisions to semi-annual hog estimates at the U.S.level have been over 2 percent only 3 times since 1971.
III'l'EGRATIOIfOF SURVEYS: In 1983, a long-range study entitled"Framework for the Future" was completed. This study stronglystated that the first building block for all future activities ofNASS must be a defined set of statistical standards and that the
3
agency should develop and operate its statistical program underthese guidelines. It further sta~ed that once the standards weredefined, the policy should be to organize sll survey, estimation,and publication efforts to most efficiently meet these standards.Since multiple frame sampling provided standards for evaluatingindividual survey estimates, the study called for expanding thistype of measurable statistical standard to all agriculturalestimates in an integrated survey program.
The "Framework" report reconunended "the integrated surveyprogram will involve the development of a large 'omnibus' surveythat will provide baseline estimates and a basis for subsamplingfor subsequent surveys. This is an extension of the developmentalwork that has been going on for the past twenty-five years with theuse of the area frame and the development of the list frame system.The integration of area and list frames leads to furtherdevelopment of a statistical program based on multiple framesampling."
Experimentation wi th the integrated survey program approach startedin three States in 1984 (Arizona, Illinois and Tennessee). The"omnibus" crop and livestock survey approach was replaced with areplicated sample for two reasons. First, livestock studies hadshown that bringing in new replicates in each survey periodmoderated possible survey biases from multiple contacts of the samesample. Also, the omnibus survey approach would require muchlarger sample sizes than needed for mid-year estimates which wouldincrease cost.
In 1985, the Integrated Survey Program was expanded into 27 majorhog, cattle, crop, and grain stocks States. The final expansionphase to an operational program in all States was undertaken inDecember 1986. Although the area frame had provided national levelindications of crop acreage, the integrated survey was the firstto provide national estimates of crop production.
Estimates for many conunodities were now provided by a limitednumber of integrated multiple frame surveys. Commodi ties wer:egrouped for sampling and data collection based on shared referencedates.
Common reference dates for crop and livestock estimates wereessential to integrate the surveys. A special task forcerepresenting all areas of NASS activity was cc>nvened to develop anaction plan for consolidating survey reference dates (July 1985).Data users need to have specific points of reference upon whichthey can base their analyses. In some cases it was necessary tomodify the dates for a data series in order to integrate surveys.In other cases it was impossible to integrate because the referencedates could not be changed. A summary of changes made to integratesurveys follows:

1. Ouarterly Hogs and Pi9s - Reference dates remained March 1,June 1, September 1, and December 1 but data collection waschanged from being centered around the first day of thereference month to a two week period following the first ofthe month. The multiple frame hog and pig survey becameintegrated with questions on crops and grain storage.
2. Ouarterlv Grain Stocks - Grain stocks surveys were changedfrom January 1, April 1, and October 1 to coincide with hogdates in order to integrate these separate surveys. Thischange was made possible by a change in the marketing year forcorn from starting October 1 to starting September 1.
3. June Acreage Survey - This non-probability mail survey forplanted acreage was replaced by including crops in theintegrated probability survey with a June 1 reference date.
4. June Enumerative Survey - June 1 area frame survey to definethe nonoverlap domain for the integrated surveys wascontinued. In addition, separate area frame estimatescontinue to be generated for acres planted to individual cropsand for June 1 inventories of hogs and cattle. Datacollection takes place during the first half of June. Datacollection had begun about May 23 for completion by June 10.
5. December Enumerative Survey - Independent area frame surveyin December was abolished with the implementation of theintegrated quarterly survey.
6. Mid-vear and End-of-year Cattle Inventory Independentmultiple frame surveys were replaced with integrated surveysincluding sheep and goats. Reference dates wer~ kept atJanuary 1 and July 1, based on user preferences.
7. Sheep and Goat Inventories - These surveys were integratedwith the January cattle survey.
8. Monthly Crop Reports - These previously independent monthlysurveys are currently being changed from non-probability panelsurveys to subsamples of the quarterly integrated survey.
9. Acreage Intentions - Independent cropping intention survey wasintegrated into the March 1 quarterly survey.
A schematic representation of the NASS integration of surveys isshown in Illustration 1. This illustration also shows a one-yearsurvey cycle beginning with a new list sample and area frame basesurvey in June. Survey activities are fully described in acontinuously updated "Supervising and Editing Manual" (3]. Thisinstruction manual is utilized by NASS statisticians to promoteconsistency in survey procedures across 45 State StatisticalOffices throughout the United States.
5
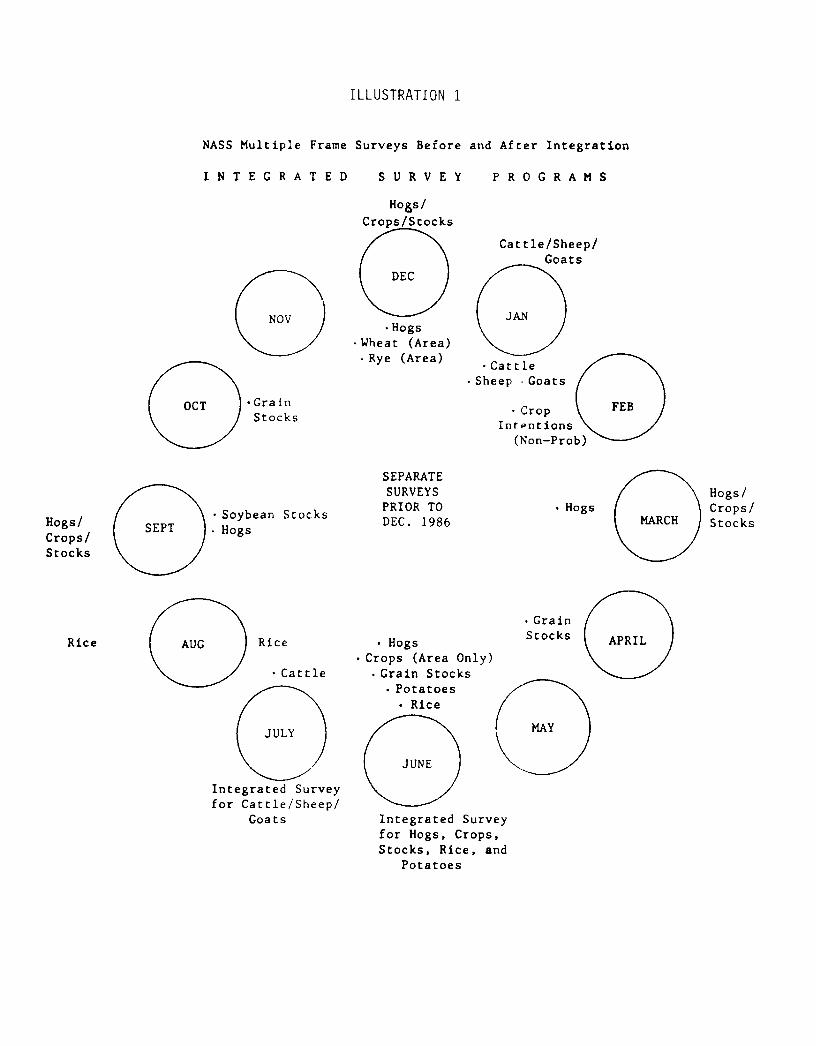
ILLUSTRATION 1
NASS Multiple Frame Surveys Before and After Integration
I N T E G RAT E D SUR V E Y PRO G RAM S
-GrainStocks
Hogs/Crops/Stocks
.Hogs.Wheat (Area)
.Rye (Area)
Cattle/Sheep!Goats
.Cattle.Sheep. Goats
.CropIntpntions
(Non-Prob)
Hogs/Crops/Stocks
.Soybean Stocks
. Hogs
SEPARATESURVEYS
PRIOR TODEC. 1986
• HogsHogs/Crops/Stocks
MAY
.GrainStocks
Integrated Surveyfor Hogs. Crops.Stocks. Rice, and
Potatoes
- Hogs.Crops (Area Only)
.Grain Stocks. Potatoes
- Rice
. Cattle
Rice
Integrated Surveyfor Cattle/Sheep/
Goats
Rice
_;,;,,,;. United States~W/Department of.~ Agriculture
NationalAgriculturalStatisticsSenti ce
Research andApplicationDivision
NASS Research ReportNumber 558-89-05
June 1989
INTEGRATEDAGRICUL TURALSURVEYS
R. Bosecker
•
DISADVANTAGES OF INTEGRATED SURVEY METHODOLOGY: As new andimproved techniques and procedural changes were implemented, sometrade-offs and sacrifices of old ways were inevitable.Disadvantages were as follows:
o Stratification ,nd sCli'p~~ngfor multiple purposes were Jnorecomplex than for separate surveys for each commodity.
o Ouestionnaires used for quarterly surveys were more leng~hzthan previous forms for individual commodities.
o Chana~ i~ refe~.Pkc"~At~~ for grain stocks estimates may haveaffected historic data bases compiled by data users.~
o Later release of hog ipyentorip-~ and pig crop estimates (nomore than 10 days) was necessary.
ADVANTAGES OF INTEGRATED SURVEY METHODOLOGY: The Integrated SurveyProgram offered several advantages which were importantimprovements to survey methodology. Some of the more importantadvantages were as follows:
o Smaller ~e.t~'!.l....".'!"~..e.!JL....!J.~!:e(.le_~s.~os..:Jwas necessary withIntegrated surveys, while maintiliiTng comparable samplingerrors, and extending probability multiple frame estimationto 48 states.
o Fewer survey ~gn~'~~J. i.e., less respondent burden, for manyprOducers without separate surveys by commodity.
o All data were ~llecte~ on or ,iteE tlJ~J\I~.A:U • .J:&.D.cal.9l!.i::.!.I.elimTii'atingthe need for respondents to forecast events beforethey to occurred (e.g., hog farrowings, calves born, deaths,etc. ).
o Nearly every operation sampled has Dositive data to re~ort tQ~some item on the integrated questionnaire .
•••o
o Estimates for crop production ~pd g~~~q,i~gP-~lwere p'rovid!~~ the same res~ondents rather than from independent surveysas before Inte'gr'1tlon":-
INTEGRATED AREA SAMPLIlfG: National area frame estimates, withextreme operator list samples, were continued in June and December
7
every year since the 1960's. Area probability indications wereused in conjunction with multiple frame estimates. The Decemberarea frame survey was then discontinued as an independent surveyafter December 1986. The contribution from this survey was judgedinconsistent with the cost. The June area frame survey continuedto provide area frame mid-year estimates to complement the multipleframe indication. It supports a full one-year cycle of multipleframe surveys by providing a sample of those operators notrepresented by the list frame.
The area frame sample remains the foundation of multiple frameprobability surveys whether or not they are integrated. Somesurvey efficiencies were achieved for area nonoverlap samplingunder the integrated survey procedure. Independent multiple framesurveys necessitated separate nonoverlap domains for eachcommodity. Currently, one common subset of area frame operatorscomprise the nonoverlap domain for all crop, hog, and grain stockmultiple frame estimates. A different nonoverlap domain is definedfor the cattle, sheep, and goats integrated survey.
In addition, the NASS agricultural economic surveys that encompassan annual Farm Cost and Returns and Cost of Production Survey aswell as the quarterly Agricultural Labor Surveys are supported byone common nonoverlap domain.
Prior to 1985, independent list samples were selected for eachcommodity included in several Cost of Production surveys andseparately for a Farm Production Expenditure Survey. This waschanged so one list population of farmers and ranchers provided forthe combined needs of these annual surveys through one commonsample. These were the first NASS surveys to be integrated. Theintegrated survey was renamed the Farm Costs and Returns Survey(FCRS). Quarterly Agricultural Labor Surveys share the same listpopulation, hence the same area nonoverlap domain, as the FCRS butstratification and sample selection are independent of the annualsurvey.
Some independent multiple frame surveys 'that have not beenintegrated remain. Examples of these include surveys foraquaculture and chickens. Nonoverlap domains continue to beindividually defined for these surveys. Each tract operator in theJune area frame base survey is evaluated against the listpopulations for the above five surveys (3 integrated and 2independent) and coded as overlap or nonoverlap for each surveyprogram. This is far fewer nonoverlap domains to manage than wouldbe necessary had NASS continued to conduct independent surveys.
Nonoverlap domain estimates for all multiple frame surveysfollowing the June survey are based on a "frozen domain" concept(Bosecker,1984). The probabilities of selection for each farm andranch operator appearing in the June area frame base survey areknown. These established probabilities are frozen for nonoverlap
8
operators throughout the following year and combined with thereciprocals of any subsampling fractions that are applicable. Thenonoverlap status of an operator cannot change during the surveyyear since the list frame, as it was sampled, is held constant.However, the occurrence of new farm operators after the base surveyis possible so substitution rules have been incorporated to permitthese operators to also have a chance of selection.
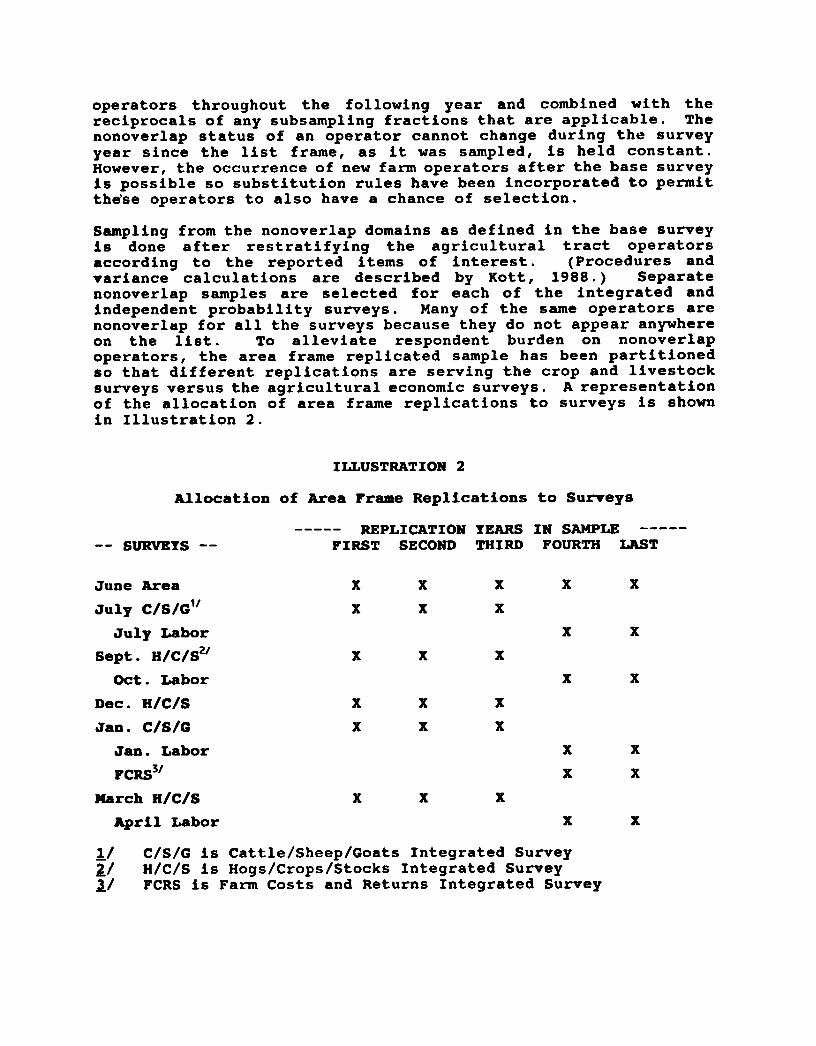
Sampling from the nonoverlap domains as defined in the base surveyis done after restratifying the agricultural tract operatorsaccording to the reported items of interest. (Procedures andvariance calculations are described by Kott, 1988.) Separatenonoverlap samples are selected for each of the integrated andindependent probability surveys. Many of the same operators arenonoverlap for all the surveys because they do not appear anywhereon the list. To alleviate respondent burden on nonoverlapoperators, the area frame replicated sample has been partitionedso that different replications are serving the crop and livestocksurveys versus the agricultural economic surveys. A representationof the allocation of area frame replications to surveys is shownin Illustration 2.
ILLUSTRATIOR 2
Allocation of Area Frame Replications to Surveys
-- SURVEYS----- REPLICATIOR YEARS IR SAMPLE -----
FIRST SECORD THIRD FOURTH LAST
June Area X X X X
July C/Sla1l X X X
July Labor X
Sept. H/C/S2/ X X X
Oct. Labor X
Dec. Hlcls X X X
Jan. c/sla X X X
Jan. Labor X
FCRS3/ X
March Hlcls X X X
April Labor X
11 c/s/G is Cattle/Sheep/Goats Integrated Survey2.1 R/e/S is Hogs/Crops/Stocks Integrated Survey1/ FCRS is Farm Costs and Returns Integrated Survey
X
X
X
X
X
X
INTEGRATED LIST SAMPLING: The existence of a nationalsampling frame system, providing simultaneous access toclassification data items associated with each record,integrated sampling possible for NASS.
listmanymade
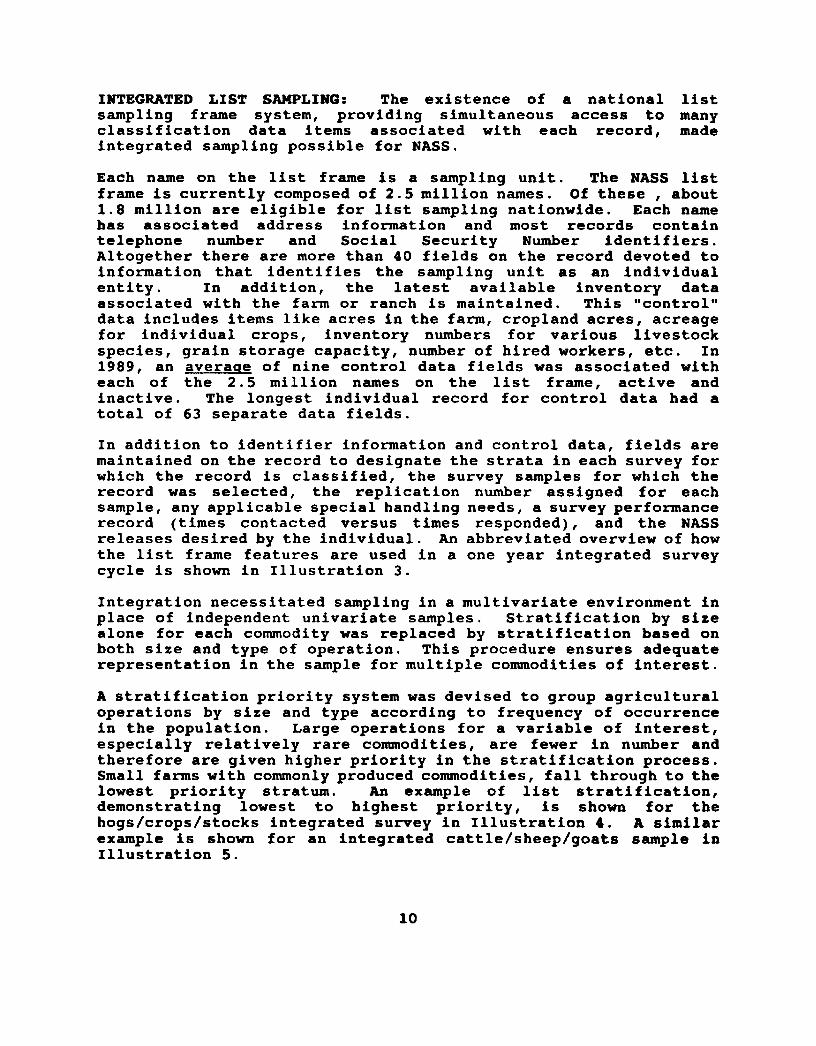
Each name on the list frame is a sampling unit. The NASS listframe is currently composed of 2.5 million names. Of these, about1.8 million are eligible for list sampling nationwide. Each namebas associated address information and most records containtelephone number and Social Security Number identifiers.Altogether there are more than 40 fields on the record devoted toinformation that identifies the sampling unit as an individualentity. In addition, the latest available inventory dataassociated with the farm or ranch is maintained. This "control"data includes items like acres in the farm, cropland acres, acreagefor individual crops, inventory numbers for various livestockspecies, grain storage capacity, number of hired workers, etc. In1989, an averaqe of nine control data fields was associated witheach of the 2.5 million names on the list frame, active andinactive. The longest individual record for control data had atotal of 63 separate data fields.In addition to identifier information and control data, fields aremaintained on the record to designate the strata in each survey forwhich the record is classified, the survey samples for which therecord was selected, the replication number assigned for eachsample, any applicable special handling needs, a survey performancerecord (times contacted versus times responded), and the NASSreleases desired by the individual. An abbreviated overview of howthe list frame features are used in a one year integrated surveycycle is shown in Illustration 3.
Integration necessitated sampling in a multivariate environment inplace of independent univariate samples. St.ratification by sizealone for each commodity was replaced by stratification based onboth size and type of operation. This procedure ensures adequaterepresentation in the sample for multiple commodities of interest.
A stratification priority system was devised to group agriculturaloperations by size and type according to frequency of occurrencein the population. Large operations for a variable of interest,especially relatively rare commodities, are fewer in number andtherefore are given higher priority in the stratification process.Small farms with commonly produced commodities, fall through to thelowest priority stratum. An example of list stratification,demonstrating lowest to highest priority, is shown for thehogs/crops/stocks integrated survey in Illustration 4. A similarexample is shown for an integrated cattle/sheep/goats sample inIllustration 5.
10
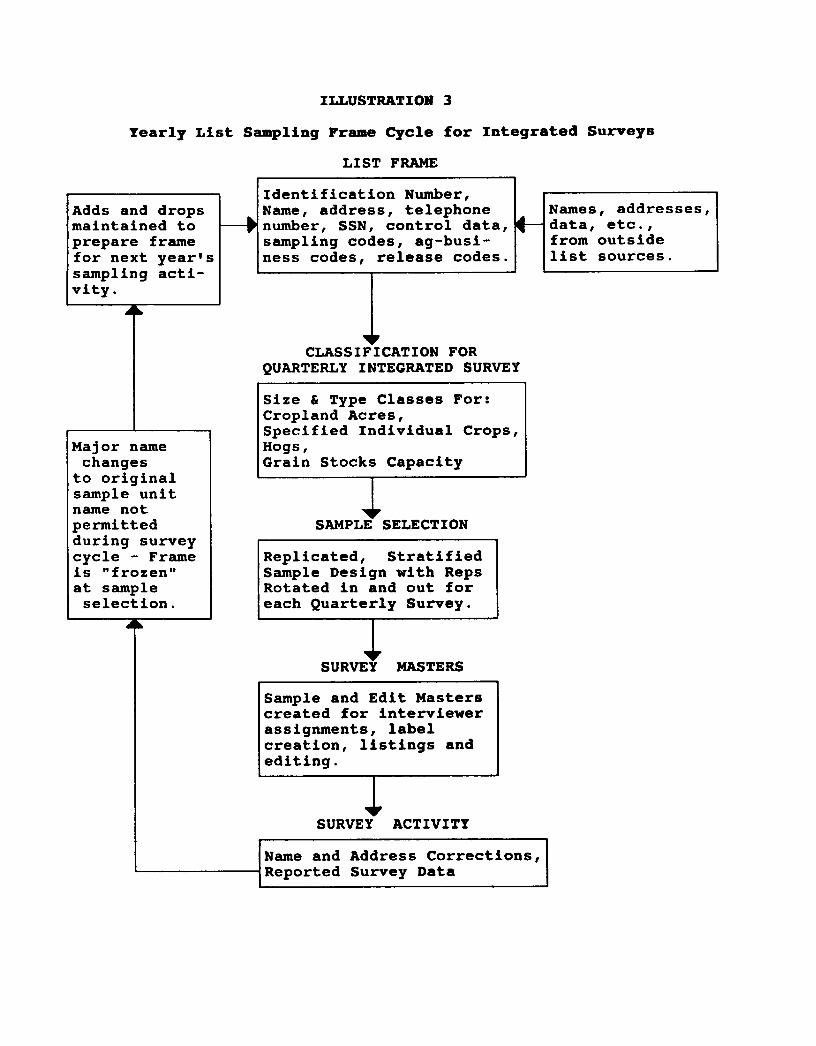
ILLUSTRATION 3
Yearly List Sampling Frame Cycle for Integrated SurveysLIST FRAME
Adds and dropsmaintained toprepare framefor next year'ssampling acti-vity .
..iI"
Identification Number,~ Name, address, telephoneF number, SSN, control data,
sampling codes, ag-busi-ness codes, release codes.
.III Names, addresses,
.- data, etc.,from outsidelist sources.
Major namechanges
to originalsample unitname notpermittedduring surveycycle - Frameis "frozen"at sample
selection..III,.
"'III"CLASSIFICATION FOR
QUARTERLY INTEGRATED SURVEY
Size & Type Classes For:Cropland Acres,Specified Individual Crops,Hogs,Grain Stocks Capacity
....• ~SAMPLE SELECTION
Replicated, StratifiedSample Design with RepsRotated in and out foreach Quarterly Survey .
"IIll~
SURVEY MASTERS
Sample and Edit Masterscreated for interviewerassignments, labelcreation, listings andediting.
"'III1rSURVEY ACTIVITY
Name and Address Corrections,Reported Survey Data
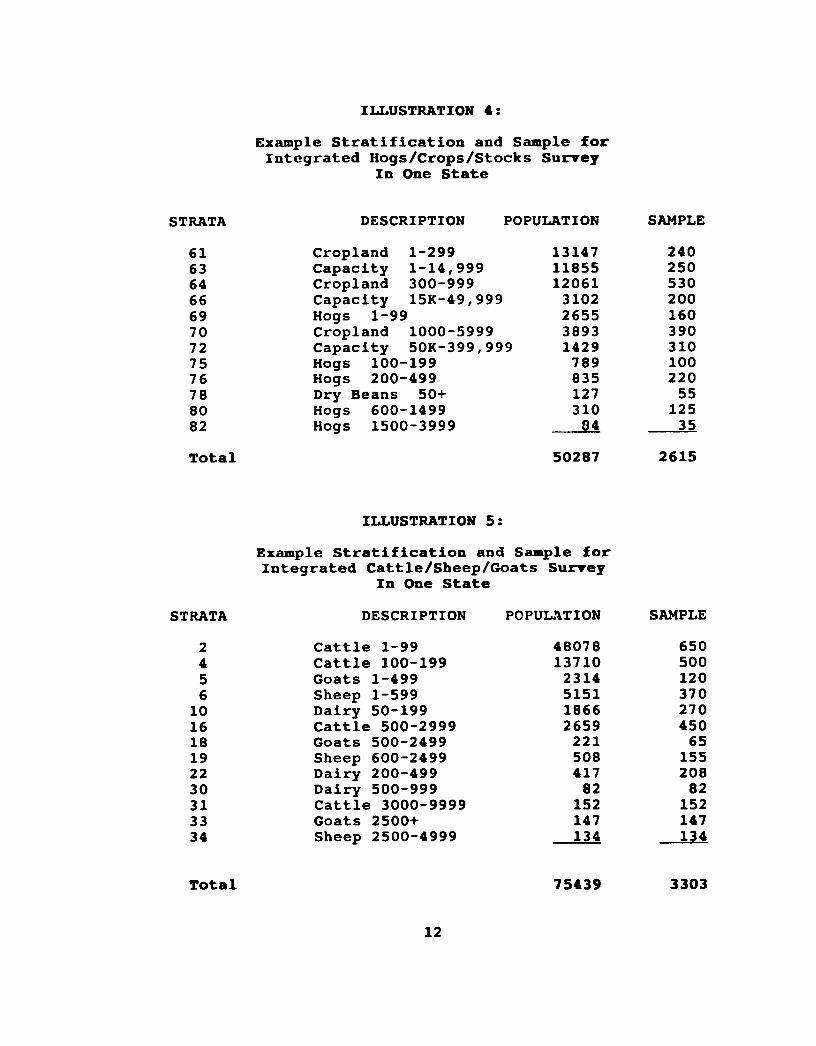
ILLUSTRATION t:
Example Stratification and Sample forIntegrated Hogs/Crops/Stocks Survey
In One State
STRATA DESCRIPTION POPULATION SAMPLE
616364666970727576788082
Total
Cropland 1-299Capacity 1-14,999Cropland 300-999Capacity 15K-49,999Hogs 1-99Cropland 1000-5999Capacity 50K-399,999Hogs 100-199Hogs 200-499Dry Beans 50+Hogs 600-1499Hogs 1500-3999
131471185512061
3102265538931429
789835127310
94
50287
240250530200160390310100220
5512535
2615
ILLUSTRATION 5:
Example Stratification and Sample forIntegrated Cattle/Sheep/Goats Survey
In One State
STRATA DESCRIPTION POPU!u'\TION SAMPLE
2 Cattle 1-99 48078 6504 Cattle 100-199 13710 5005 Goats 1-499 2314 1206 Sheep 1-599 5151 370
10 Dairy 50-199 1866 27016 Cattle 500-2999 2659 45018 Goats 500-2499 221 6519 Sheep 600-2499 508 15522 Dairy 200-499 417 20830 Dairy 500-999 82 8231 Cattle 3000-9999 152 15233 Goats 2500+ 147 14734 Sheep 2500-4999 134 134
Total 75t39 3303
12
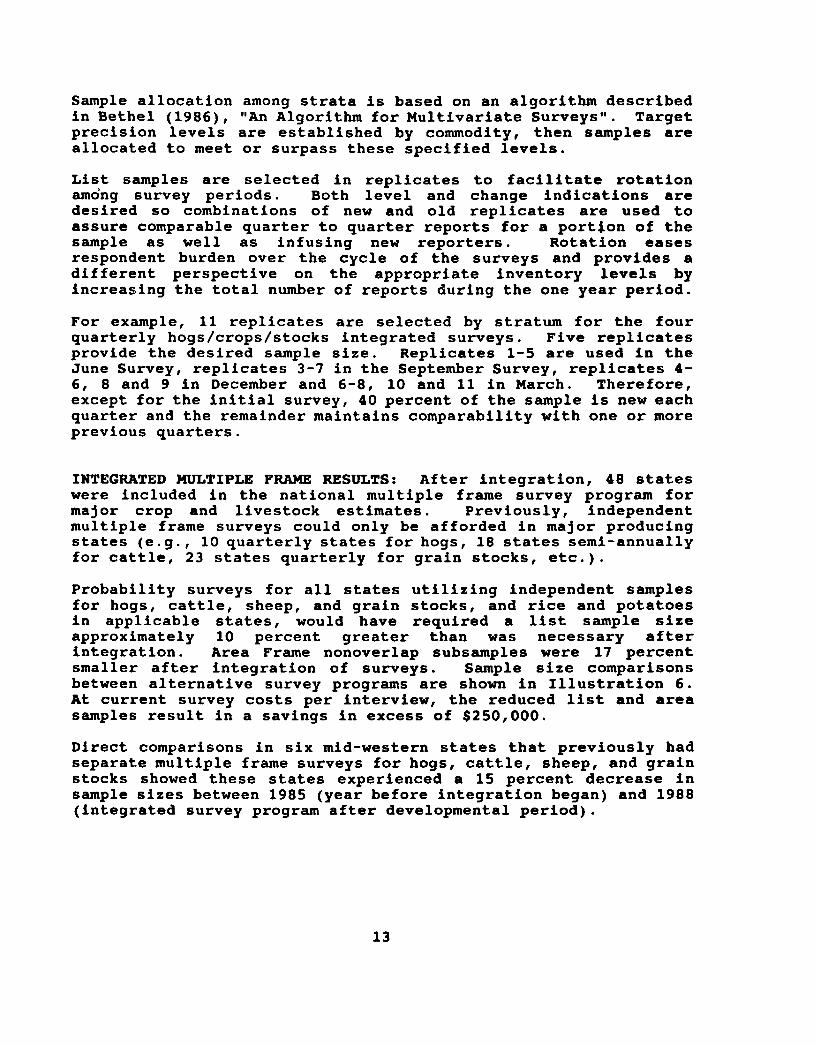
Sample allocation among strata is based on an algorithm describedin Bethel (1986), "An Algorithm for Multivariate Surveys". Targetprecision levels are established by commodity, then samples areallocated to meet or surpass these specified levels.
List samples are selected in replicates to facilitate rotationamong survey periods. Both level and change indications aredesired so combinations of new and old replicates are used toassure comparable quarter to quarter reports for a portion of thesample as well as infusing new reporters. Rotation easesrespondent burden over the cycle of the surveys and provides adifferent perspective on the appropriate inventory levels byincreasing the total number of reports during the one year period.
For example, 11 replicates are selected by stratum for the fourquarterly hogs/crops/stocks integrated surveys. Five replicatesprovide the desired sample size. Replicates 1-5 are used in theJune Survey, replicates 3-7 in the September Survey, replicates t-6, 8 and 9 in December and 6-8, 10 and 11 in March. Therefore,except for the initial survey, to percent of the sample is new eachquarter and the remainder maintains comparability with one or moreprevious quarters.
INTEGRATED MULTIPLE FRAME RESULTS: After integration, t8 stateswere included in the national multiple frame survey program formajor crop and livestock estimates. Previously, independentmultiple frame surveys could only be afforded in major producingstates (e.g., 10 quarterly states for hogs, 18 states semi-annuallyfor cattle, 23 states quarterly for grain stocks, etc.).
Probability surveys for all states utilizing independent samplesfor hogs, cattle, sheep, and grain stocks, and rice and potatoesin applicable states, would have required a list sample sizeapproximately 10 percent greater than was necessary afterintegration. Area Frame nonoverlap subsamples were 17 percentsmaller after integration of surveys. Sample size comparisonsbetween alternative survey programs are shown in Illustration 6.At current survey costs per interview, the reduced list and areasamples result in a savings in excess of $250,000.
Direct comparisons in six mid-western states that previously hadseparate multiple frame surveys for hogs, cattle, sheep, and grainstocks showed these states experienced a 15 percent decrease insample sizes between 1985 (year before integration began) and 1988(integrated survey program after developmental period).
13
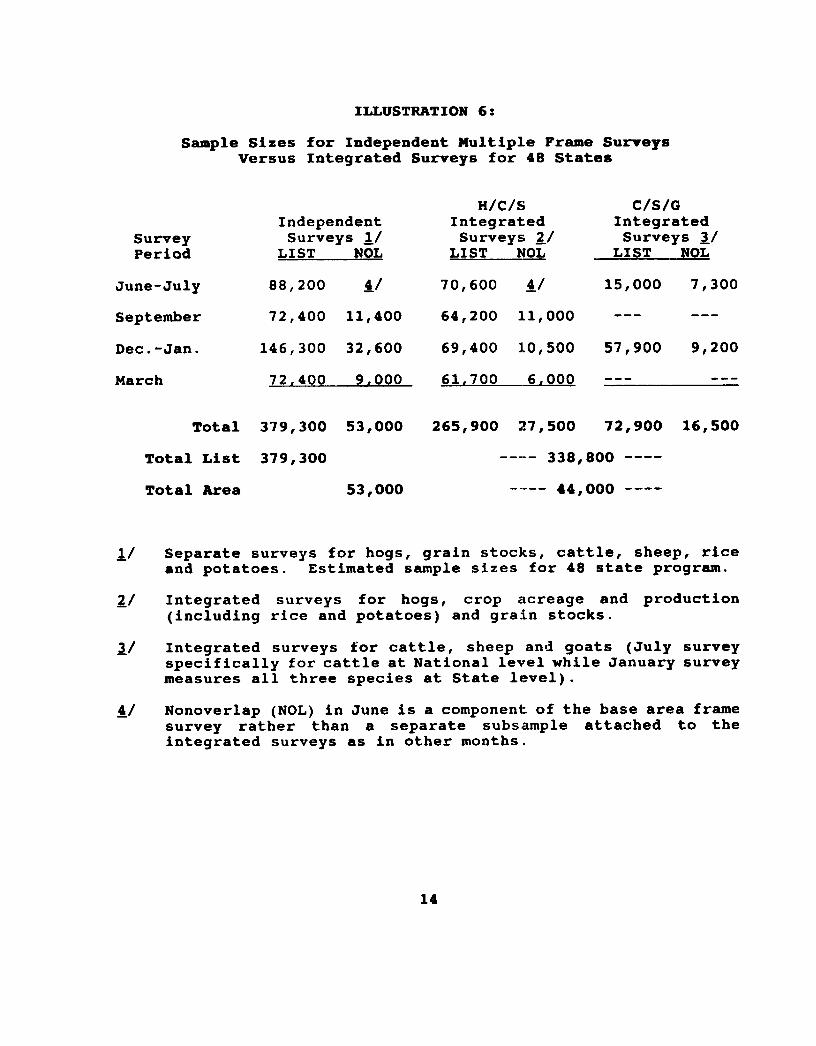
ILLUSTRATION 6:
Sample Sizes for Independent Multiple Frame SUrYeysVersus Integrated Surveys for 4B States
a/c/s C/S/GIndependent Integrated Integrated
Survey Surveys 11 Surveys £1 Surveys 11Period LIST NOL LIST NOL LIST NOL
June-July B8,200 il 70,600 il 15,000 7,300
September 72,400 11,400 64,200 11,000
Dec.-Jan. 146,300 32,600 69,400 10,500 57,900 9,200
March 72,400 9,000 61.700 6,000
Total 379,300 53,000 265,900 27,500 72,900 16,500
Total List 379,300
Total Area 53,000
----- 33B, BOO
----- 44,000
11 Separate surveys for hogs, grain stocks, cattle, sheep, riceand potatoes. Estimated sample sizes for 48 state program.
£1 Integrated surveys for hogs, crop acreage and production(including rice and potatoes) and grain stocks.
11 Integrated surveys for cattle, sheep and goats (July surveyspecifically for cattle at National level while January surveymeasures all three species at State level).
il Nonoverlap (NOL) in June is a component of the base area framesurvey rather than a separate subsample attached to theintegrated surveys as in other months.
14
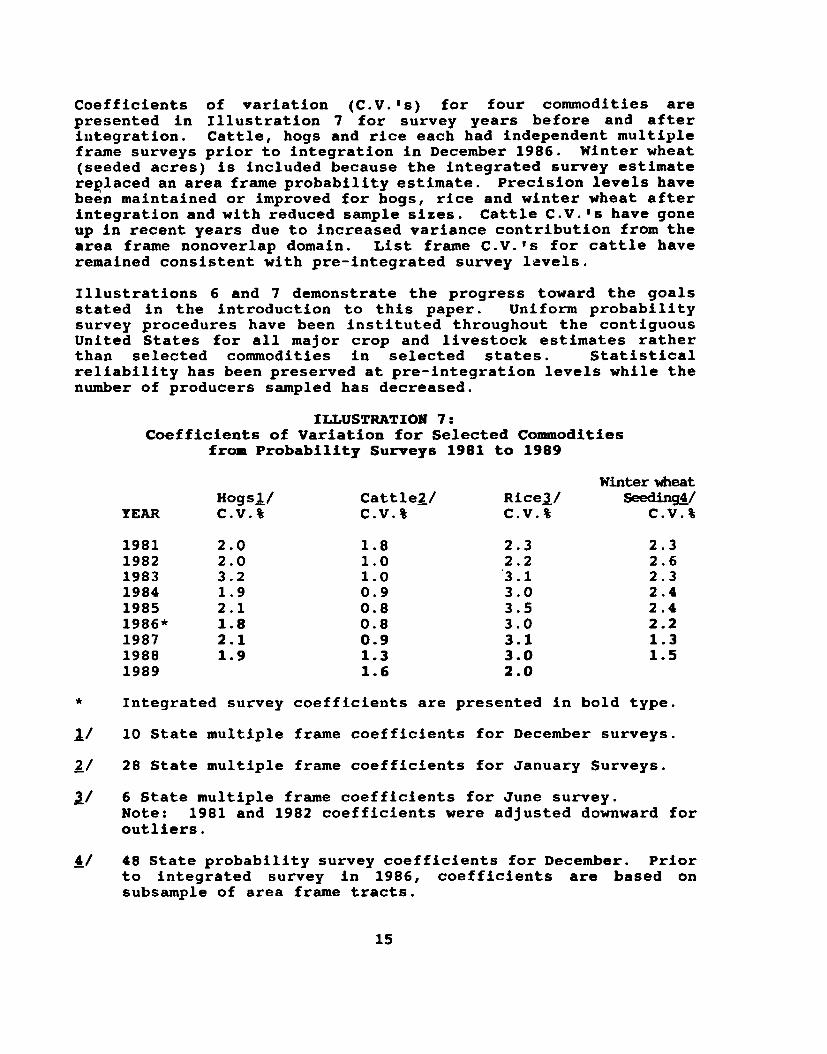
Coefficients of variation (C.V.'S) for four commodities arepresented in Illustration 7 for survey years before and afteriutegration. Cattle, hogs and rice each had independent multipleframe surveys prior to integration in December 1986. winter wheat(seeded acres) is included because the integrated survey estimatere1.»lacedan area frame probability estimate. precision levels havebeen maintained or improved for bogs, rice and winter wbeat afterintegration and wi tb reduced sample sizes. Cattle C.V. 's have goneup in recent years due to increased variance contribution from thearea frame nonoverlap domain. List frame C.V.'s for cattle haveremained consistent witb pre-integrated survey l~vels.
Illustrations 6 and 7 demonstrate tbe progress toward the goalsstated in the introduction to this paper. Uniform probabilitysurvey procedures have been instituted throughout the contiguousUnited States for all major crop and livestock estimates ratherthan selected commodities in selected states. Statisticalreliability has been preserved at pre-integration levels while thenumber of producers sampled has decreased.
ILLUSTRATION 7:Coefficients of Variation for Selected Commodities
fram Probability Surveys 1981 to 1989
*.!I
1.1
Winter wheatHogs.!1 Cattle1.1 RiceJ./ Seeding!1
YEAR C.V.% C.V.% C.V.% C.V.%
1981 2.0 1.8 2.3 2.31982 2.0 1.0 2.2 2.61983 3.2 1.0 3.1 2.31984 1.9 0.9 3.0 2.41985 2.1 0.8 3.5 2.41986* 1.8 0.8 3.0 2.21987 2.1 0.9 3.1 1.31988 1.9 1.3 3.0 1.51989 1.6 2.0
Integrated survey coefficients are presented in bold type.
10 State multiple frame coefficients for December surveys.
28 State multiple frame coefficients for January Surveys.
11 6 State multiple frame coefficients for June survey.Note: 1981 and 1982 coefficients were adjusted downward foroutliers.
!I 48 State probability survey coefficients for December. Priorto integrated survey in 1986, coefficients are based onsubsample of area frame tracts.
15
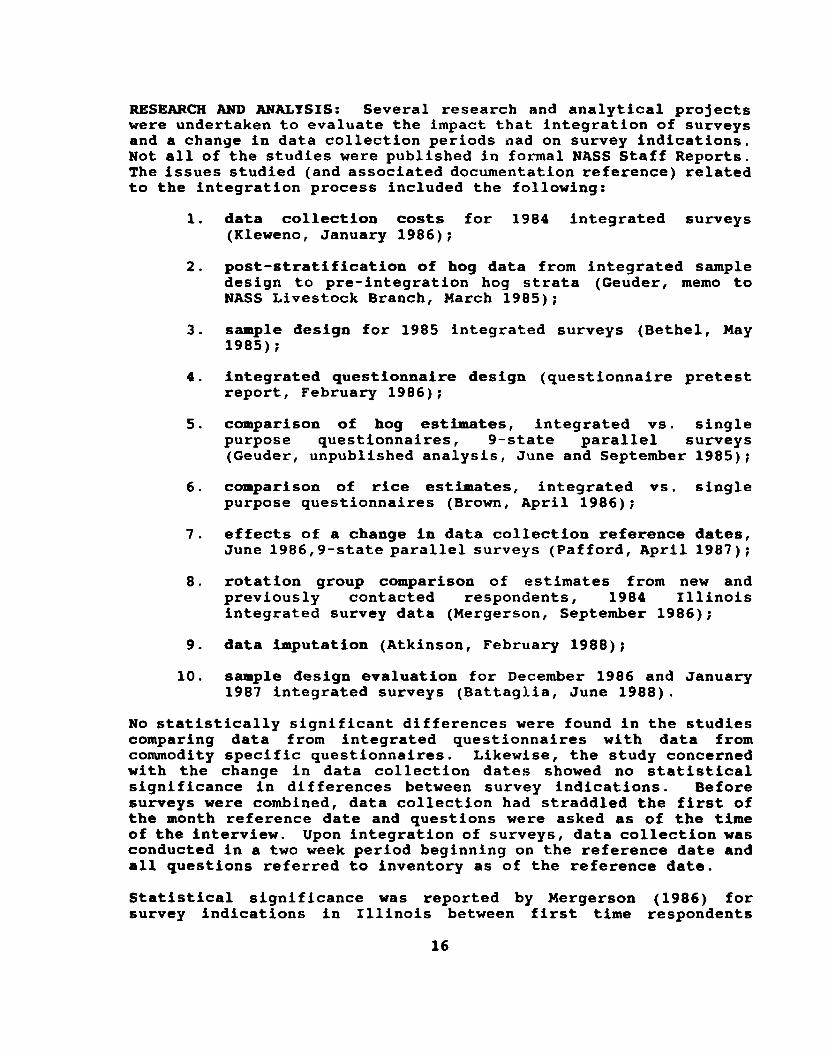
RESEARCH AND ANALYSIS: Several research and analytical projectswere undertaken to evaluate the impact that integration of surveysand a change in data collection periods nad on survey indications.Not all of the studies were published in fOl~al NASS Staff Reports.The issues studied (and associated documentation reference) relatedto the integration process included the following:
1. data collection costs for 1984 integrated surveys(Kleweno, January 1986);
2. post-stratification of hog data from integrated sampledesign to pre-integration hog strata (Geuder, memo toNASS Livestock Branch, March 1985);
3. sample design for 1985 integrated surveys (Bethel, May1985);
4. integrated questionnaire design (questionnaire pretestreport, February 1986);
5. comparison of hog estimates, integrated vs. singlepurpose questionnaires, 9-state parallel surveys(Geuder, unpublished analysis, June and September 1985);
6. comparison of rice estimates, integrated vs. singlepurpose questionnaires (Brown, April 1986);
7. effects of a change in data collection reference dates,June 1986, 9-state parallel surveys (Pafford, April 1987);
8. rotation group comparison of estimates from new andpreviously contacted respondents, 1984 Illinoisintegrated survey data (Mergerson, September 1986);
9. data iJDputation (Atkinson, February 1988);
10. sample design evaluation for December 1986 and January1987 integrated surveys (Battaglia, June 1988).
No statistically significant differences were found in the studiescomparing data from integrated questionnaires with data fromcommodity specific questionnaires. Likewise, the study concernedwith the change in data collection dates showed no statisticalsignificance in differences between survey indications. Beforesurveys were combined, data collection had straddled the first ofthe month reference date and questions were asked as of the timeof the interview. Upon integration of surveys, data collection wasconducted in a two week period beginning on the reference date andall questions referred to inventory as of the reference date.
Statistical significance was reported by Mergersonsurvey indications in Illinois between first time
16
(1986) forrespondents
(rotated in replications) and previously contacted respondents(retained replications). New replications produced higherestimates than did those retained from a previous survey.Replicated sampling with rotation between quarters, to reducerespondent burden, had been a long standing feature of theindependent multiple frame surveys. The integrated programcontinued sample rotation. Since estimates of change betweensurvey periods are produced from replicates retained in the sample,further study is needed on the potential impact of the observedrotation group effect.
Prior to integration the NASS procedure for handling missing datawas a reweighting process. Original selection probabilities wereadjusted by stratum to compensate for missing reports. No recordby record imputation program existed. When a single commodity hadbeen stratified by size and the entire questionnaire related tothat commodity, the implicit assumption that nonrespondent datawere similar to respondent data by stratum was acceptable. Also,there was very little item imputation needed because the entirequestionnaire was either complete or missing.
With the advent of integration, strata based on a priorityarrangement among several variables no longer provided the samehomogeneity by size for individual commodities. Differences fora given commodity within a stratum could be greater betweenrespondents and nonrespondents than before. Moreover, somesections of the integrated questionnaire might be complete whileothers were incomplete. The only other experience for NASS indealing with questionnaires containing different sections forseveral commodities was in the area frame. Manual imputation wasrequired for missing data in those questionnaires.
A new automated system was developed to handle missing data forintegrated questionnaires (Atkinson, 1988). Partially completedquestionnaires were likely to occur more often given an integratedquestionnaire consisting of separate sections devoted to variouscommodities. Computer imputation provided a practical andconsistent solution relative to the following alternatives: (a)loss of valid data in partially completed questionnaires, (b)separate summaries by commodity section with differing expansionfactors, or (c) manual imputation. The existence of the imputationprogram also permitted an evaluation of the impact of missingreports on survey indications without assuming nonrespondent meanswere the same as respondent means for each stratum. Imputationcould be based on supplementary information for each commodity.This became more important after integration because strata werebased on individual, dominating variables that mayor may not bewell correlated with all other variables in the questionnaire.
Sample design analysis is a continuous process. Early work byBethel (May 1985 Staff Report) on the integrated survey designevaluated alternative stratification based on simultaneous use of
17
two or three variables to define some of the strata. The goal wasto reduce the number of strata originally used in the three teststates. Reduced numbers of strata have since been implemented butwithout multiple variables in any given stratum. The mostcomprehensive analysis to date is included in the report byBattaglia (1988). Target precision levels were identified by stateand evaluations of both the list and area frame components werepresented to achieve the desired multiple frame precision. Anupdate to this report based on data for more years under anintegrated sample design is being prepared.
Further research is planned for the integrated survey program inthe areas of alternative estimators and quality assurance.Reinterview studies have been conducted to identify sources ofnonsampling error. Differences in estimates for crop acreagebetween the area frame survey and the integrated multiple framesurvey in June are being investigated. Incorporation of integratedsurvey data into the NASS county estimates program is also of primeinterest. Much work remains to be done to get maximum benefit fromthe integration of agricultural surveys.
SUMMARY: Integration of crop and livestock surveys in the NationalAgricultural Statistics Service (NASS) was initiated in 1984beginning with three states (Arizona, Illinois and Tennessee).All 48 conterminous states had been incorporated into the presentsample design and survey reference dates beginning with the June1988 survey. The intervening developmental years were necessaryfor evaluating the impact of integration and changes in referencedates on survey estimates. A change in the reference date for mid-year cattle estimates was cancelled after a brief trial period.
Major benefits derived from integration include cost efficiencies,respondent burden reduction, and improved analytical capabilities.Forty-eight states were incorporated into mul tiple frameprobability sampling methodology through the integrated program.Individual surveys by commodity would not have been cost effectiveand individual producers may have been contacted repeatedly for asuccession of commodity specific surveys. Questionnaires that aremore comprehensive concerning the characteristics of a farmoperation provide opportunity to increase knowledge about thestructure of agriculture.
On the other hand, integration has increased the complexity ofsampling and lengthened questionnaires. Stratification usingseveral variables to serve multiple survey requirements ischallenging but has been proven successful. Longer questionnairesare judged to be less burdensome on respondents than severalindependent contacts. In addition, respondents are more likely tofeel they have made a contribution by supplying positive data forsome items on the questionnaire rather than reporting no data fora questionnaire devoted to a specific commodity.
18
The integrated survey program is now a integral part of NASSmethodology. Those data needs that fit the established referencedates and can be met by incorporating the target population intothe integrated sampling scheme will likely become additions to theex~sting integrated survey vehicle. Limitations to furtherintegration will be avoidance of overlong questionnaires and theprevention of sample degradation for existing program needs due toincompatible special requirements. Analysis continues in order toachieve maximum effectiveness through integration.
19
REFERENCES:
1. Agricultural Surveys Supervising and Editing Manual.
2. Atkinson, A. D., tiThe Scope and Effect of Imputation inQuarterly Agricultural Surveys," Staff Report, February 1988.
3. Battaglia, R. J., "Methodology to Evaluate Sample I?esigns ofthe Quarterly Agricultural Survey," Staff Report, June 1988.
4. Bethel, J., "An Algorithm for Multivariate Surveys," StaffR~port, January 1986.
5. , "Sample Design for the 1985 ISP/JES,"Staff Report, May 1985.
6. Bosecker, R. R., "List Dominant and Frozen Domain procedures,"Staff Report, July 1984.
7. Brown, L. E., "Comparison of Rice Survey Indications BetweenRice Multiple Frame and ISP Surveys," Staff Report, April1986.
8 . Cochran, R. S., "Multiple Frame SamplE!Surveys," Proceedingsof the Social Science Section of the American StatisticalAssociation Meeting, Chicago, Illinois, 1964.
9. Data Collection Branch, "Summary Report: Bridge PretestSurvey - December 1, 1985," Staff Report, February 1986.
10. "Framework for the Future," Statisti::::al Reporting Service,Special Task Force Report, March 1983.
11. Hartley, H. 0., "Multiple Fame Surveys," Proceedings of theSocial Science Section of the American Statistical AssociationMeeting Minneapolis, Minnesota, 1962.
12. King, A. J. and R. J. Jensen, "The Master Sample Agriculture,"Reprint in Journal of the American Statistical Association,Vol. 40: pp. 38-56, 1945.
13. Kleweno, D. G., "Data Collection Costs for the 1984 IntegratedSurvey Program," Staff Report, January 1986.
14. Kott, P. S., "Estimating the Nonoverlap Variance Component forMultiple Frame Agricultural Surveys," NASSStaff Report, May1988.
15. Mergerson, J. W., "Integrated Survey Program: RotationEffects Analysis Sununaries, Illinois 1~~S4-1985,II Staff Report,September 1986.
20

16. Nealon, J. P., "Review of the Multiple and Area FrameEstimators," Staff Report, March 1984.
17. Pafford, B., "Changing Survey Reference Dates: An Analysisof the June 1986 Bridge Survey," Staff Report, April 1987.
18. "Survey Reference Dates Report," Statistical ReportingService, Special Task Force Report, July 1985.
21